
Project title: Managing water, nitrogen and calcium...
48
© 2012 Agriculture and Horticulture Development Board. All rights reserved. i Project title: Managing water, nitrogen and calcium inputs to optimise flavour and shelf-life in soil-less strawberry production Project number: SF 107 Project leader: Dr Mark A. Else, East Malling Research Report: Final Report May 2012 Previous reports: Annual Report 2010 Key staff: Dr Mark A. Else Dr Phillippa Dodds Mrs June Taylor Miss Claire Hopson Mrs Abigail Dalton Location of project: East Malling Research, East Malling, Kent Project co-ordinator: Mr John Atwood, ADAS Date project commenced: 1 April 2009 Date completion due: 31 March 2012 Keywords: Ammonium, calcium, diffuse pollution, ‘Elsanta’, fertigation, flavour, irrigation scheduling, nitrate, nutrition, shelf-life, ‘Sonata’, strawberry, substrate culture, water use efficiency
Transcript of Project title: Managing water, nitrogen and calcium...

© 2012 Agriculture and Horticulture Development Board. All rights reserved. i
Project title: Managing water, nitrogen and calcium inputs to optimise flavour and shelf-life in soil-less strawberry production
Project number: SF 107 Project leader: Dr Mark A. Else, East Malling Research Report: Final Report May 2012 Previous reports: Annual Report 2010 Key staff: Dr Mark A. Else Dr Phillippa Dodds
Mrs June Taylor Miss Claire Hopson Mrs Abigail Dalton
Location of project: East Malling Research, East Malling, Kent Project co-ordinator: Mr John Atwood, ADAS Date project commenced: 1 April 2009 Date completion due: 31 March 2012 Keywords: Ammonium, calcium, diffuse pollution, ‘Elsanta’,
fertigation, flavour, irrigation scheduling, nitrate, nutrition, shelf-life, ‘Sonata’, strawberry, substrate culture, water use efficiency

© 2012 Agriculture and Horticulture Development Board. All rights reserved. ii
DISCLAIMER AHDB, operating through its HDC division seeks to ensure that the information contained
within this document is accurate at the time of printing. No warranty is given in respect
thereof and, to the maximum extent permitted by law the Agriculture and Horticulture
Development Board accepts no liability for loss, damage or injury howsoever caused
(including that caused by negligence) or suffered directly or indirectly in relation to
information and opinions contained in or omitted from this document.
Copyright, Agriculture and Horticulture Development Board 2012. All rights reserved.
No part of this publication may be reproduced in any material form (including by photocopy
or storage in any medium by electronic means) or any copy or adaptation stored, published
or distributed (by physical, electronic or other means) without the prior permission in writing
of the Agriculture and Horticulture Development Board, other than by reproduction in an
unmodified form for the sole purpose of use as an information resource when the
Agriculture and Horticulture Development Board or HDC is clearly acknowledged as the
source, or in accordance with the provisions of the Copyright, Designs and Patents Act
1988. All rights reserved.
AHDB (logo) is a registered trademark of the Agriculture and Horticulture Development
Board.
HDC is a registered trademark of the Agriculture and Horticulture Development Board, for
use by its HDC division.
All other trademarks, logos and brand names contained in this publication are the
trademarks of their respective holders. No rights are granted without the prior written
permission of the relevant owners.
The results and conclusions in this report are based on an investigation conducted over a
one-year period. The conditions under which the experiments were carried out and the
results have been reported in detail and with accuracy. However, because of the biological
nature of the work it must be borne in mind that different circumstances and conditions
could produce different results. Therefore, care must be taken with interpretation of the
results, especially if they are used as the basis for commercial product recommendations

© 2012 Agriculture and Horticulture Development Board. All rights reserved. iii
AUTHENTICATION We declare that this work was done under our supervision according to the procedures described herein and that the report represents a true and accurate record of the results obtained. Dr Mark A. Else Senior Research Leader East Malling Research Signature ............................................................ Date ............................................ Report authorised by: Dr Christopher J. Atkinson Programme Leader, Resource Efficiency for Crop Production East Malling Research
30 May 2012 Signature ............................................................ Date ............................................

© 2012 Agriculture and Horticulture Development Board. All rights reserved. iv
Contents Page
Grower summary .......................................................................................................... 1 Headline ........................................................................................................................ 1
Background and expected deliverables ......................................................................... 1
Summary of the project and main conclusions .............................................................. 3
Financial benefits ........................................................................................................... 9
Actions points for growers ............................................................................................ 10
Science Section ......................................................................................................... 11 Introduction .................................................................................................................. 11
Materials and methods ................................................................................................ 14
Results ......................................................................................................................... 22
Discussion .................................................................................................................... 35
Main conclusions .......................................................................................................... 40
Knowledge exchange and technology transfer ............................................................. 42
References ................................................................................................................... 43
Acknowledgements ...................................................................................................... 44

© 2012 Agriculture and Horticulture Development Board. All rights reserved. 1
GROWER SUMMARY
Headline
In substrate grown strawberries, water savings of between 15% and 45% were delivered
using a new irrigation scheduling strategy without reducing Class 1 yields.
Background and expected deliverables
The project aims to provide the potential to increase water use efficiency and nutrient
use efficiency in UK substrate-grown strawberry production by 40% thereby saving
water, reducing the impact of soft fruit production on groundwater quality and improving
fruit quality and shelf-life.
Irrigation of substrate-grown strawberries is essential to ensure the yields and quality
demanded by retailers and consumers. Many growers apply sufficient irrigation to
achieve 10-20% run-off to avoid dry spots within the substrate bags and to reduce the
accumulation of salts. However, Defra, the Environment Agency (EA) and the soft fruit
industry are becoming increasingly concerned about the future availability of abstracted
water for trickle irrigation. Current abstraction rates in the major strawberry-growing
regions are unsustainable and growers must now comply with legislation designed to
safeguard these resources (The Water Act 2003).
Figure GS1. Reducing inputs of valuable resources such as water and fertilisers must be achieved without reducing yields and quality of Class 1 fruit
At the time of writing (May 2012), the south east is officially under drought and other
major soft fruit growing regions were at high risk of drought in 2012 (Figure GS2) until

© 2012 Agriculture and Horticulture Development Board. All rights reserved. 2
above-average rainfall in April alleviated the problem in some production areas.
Figure GS2. Assessment of drought risk across England and Wales for 2012. Source: the
Environment Agency.
Nevertheless, ‘blue water’ availability will become increasingly limited, especially in the
summer months and mains water will be more expensive; the use of mains water to
irrigate horticultural crops is likely to be restricted in heavily populated areas as pressure
on finite supplies intensifies. There is also increasing concern over the contribution of
substrate soft fruit production to ground water pollution, and the EA recently
commissioned ADAS to carry out a study to determine the impact of substrate production
on ground water quality in the south east. Clearly, new soft fruit production systems are
needed that use resources such as water and fertilsers more efficienctly. Recent
research at EMR and elsewhere has provided major opportunities to improve water and
nutrient use efficiencies while continuing to deliver high yields of fruit that meet consumer
demand for sweet berries with good flavour and shelf-life.
Improved irrigation scheduling techniques and deficit irrigation techniques such as
Regulated Deficit Irrigation (RDI) offer the potential to deliver large water savings while
maintaining or improving crop quality. The aim of irrigation scheduling is to match
demand with supply during changeable weather conditions. Deficit irrigation techniques
such as RDI replace only a percentage of the water the plant loses via transpiration. This
saves water and can prevent excessive shoot growth without reducing yields of Class 1
fruit. The smaller, less dense canopy can reduce disease pressure and helps to improve
light capture by the plant because there is less self-shading of the leaves. Better light
© 2012 Agriculture and Horticulture Development Board. All rights reserved. 3
penetration and interception will also help to increase fruit quality including flavour
volatile production and bioactive content. The reduction in vegetative growth also
provides opportunities to reduce fertiliser inputs without affecting berry flavour. For
growers using mains water, there is the potential to reduce annual water costs by up to
40% and significant reductions in fertiliser inputs are also likely.
There are two aims to this project:
1. To improve water and nutrient use efficiencies in substrate-grown strawberry
production
2. To improve flavour and shelf-life potential by manipulating nitrogen and calcium
nutrition
Expected deliverables from this work will include:
• Improved fruit firmness, flavour and shelf-life potential
• Reduced production costs per tonne Class 1 fruit
• Reduced water and fertiliser usage by up to 40%
• Reduced environmental impact
• Improved sustainability
Summary of the project and main conclusions
Developing an irrigation scheduling technique that matches demand with supply
In the first two years of the project, an irrigation scheduling technique that matches
demand with supply and so minimises or eliminates run-off was developed using
irrigation set points based on volumetric substrate moisture contents (VSMC). The
irrigation scheduling regime was imposed on 60-day and mainseason ‘Elsanta’ and
‘Sonata’ plants grown in 0.5-m peat bags (Figure GS3). Irrigation was supplied to
Commercial Control plants to achieve an average run-off of 20% over the season. In
2009 with 60-day crops, water and fertiliser savings of up to 45% were achieved,
compared to the Commercial Control treatment, without reducing yields of Class 1 fruit.
Overall, marketable yields were low due to the effect of the x10 strength potassium
bicarbonate spray applied in error.
Despite the reduced nutrient input under the irrigation scheduling regime, foliar
concentrations of N, P, K, Mg, Mn, Fe, Zn, B and S were within satisfactory ranges in
each cultivar under each irrigation regime although concentrations of Ca and Cu were

© 2012 Agriculture and Horticulture Development Board. All rights reserved. 4
just below satisfactory values by the end of the cropping season.
Figure GS3. The main season ‘Elsanta’ plants used in the 2010 experiments to determine the
effects of irrigation scheduling and RDI on water and nutrient use efficiencies and fruit quality.
Photo taken on 9 May 2010.
In 2010, although run-off was eliminated and water and fertiliser savings of 50% were
achieved using the irrigation scheduling technique, main season ‘Elsanta’ and ‘Sonata’
Class 1 yields were reduced by 27% and by 13%, respectively, compared to the
Commercial Control regime. This was due to a reduction in fruit size rather than fruit
number and presumably resulted from temporary limitations in substrate water
availability under high evaporative demands. Therefore, the lower VSMC irrigation set
points were raised for the 2011 irrigation scheduling experiments (see below).
In 2011, scheduling irrigation to match demand with supply so that run-off was minimised
or eliminated resulted in water savings of up to 42% and 45% for ‘Elsanta’ and ‘Sonata’,
respectively, compared to the Commercial Control treatments where run-off averaged
20% over the season (Table GS1).
Table GS1. Total volumes of irrigation water applied per plant (L) for 60-day ‘Elsanta’ and ‘Sonata’ under the irrigation and NO3-N:NH4-N regimes and the associated percent run-off averaged over the season. Treatment Volume of water applied (L) Average run off (%) ‘Elsanta’ ‘Sonata’ ‘Elsanta’ ‘Sonata’ CC 31.2 42.7 22.4 19.3 Scheduled 26.5 24.3 4.4 0.0 20% NH4-N 22.3 33.4 5.6 0.2 30% NH4-N 18.0 23.6 0.2 4.6
Water productivity (WP) values were also calculated for each irrigation regime and for
each cultivar (Table GS2). The volume of water applied was first recorded from Day 0
(27 July 2011) and so the WP values do not include water that was used to wet up the
substrate bags, water that was applied via overhead irrigation during establishment or

© 2012 Agriculture and Horticulture Development Board. All rights reserved. 5
the water that was applied during the first three weeks of plant development before the
irrigation regimes were imposed. Nevertheless, the WP values indicate the potential of
using irrigation scheduling to reduce the volume of water used to produce 1 kg of Class 1
fruit. Typical grower WP values are not yet known for substrate-grown strawberries but
will be calculated from data gathered at two grower sites during 2012 in SF 136. Table GS2. Water productivity values associated with irrigation and NO3-N:NH4-N regimes for 60-day ‘Elsanta’ and ‘Sonata’.
Cultivar Water productivity (L per kg class 1 fruit) CC Scheduled 20% NH4-N 30% NH4-N ‘Elsanta’ 48.6 38.0 42.6 36.3 ‘Sonata’ 78.4 49.4 69.2 51.3
Since plants were fertigated at each irrigation event, the total amounts of the macro and
micro nutrients applied to each bag were reduced in proportion to the irrigation volume.
Consequently, fertiliser savings of between 15% and 45% were achieved using the
irrigation scheduling regimes to reduce or eliminate run-off. Despite these reduced
inputs, leaf nutrient concentrations remained within satisfactory ranges in ‘Elsanta’
throughout cropping. However, Ca concentrations were reduced in leaves of ‘Sonata’ by
the end of cropping although fruit firmness and shelf-life potential was not affected.
The new approach to irrigation scheduling developed in SF 107 has potential to further
improve the economic and environmental sustainability of substrate soft fruit production
in the UK. Managing the volume of run-off throughout fruit development under
changeable evaporative demands in crops of different ages is challenging for
commercial growers. Manually collecting and measuring run-off volumes in each block
of substrate crop in time to inform irrigation decisions can be time consuming and an
automated system that enabled irrigators to react quickly to differing evaporative
demands would help to deliver significant water and fertiliser savings. The system
developed in this project enables data on water inputs and outputs to be accessed
remotely (Figure GS4) so that the percent run-off after each irrigation event can be
calculated.
© 2012 Agriculture and Horticulture Development Board. All rights reserved. 6
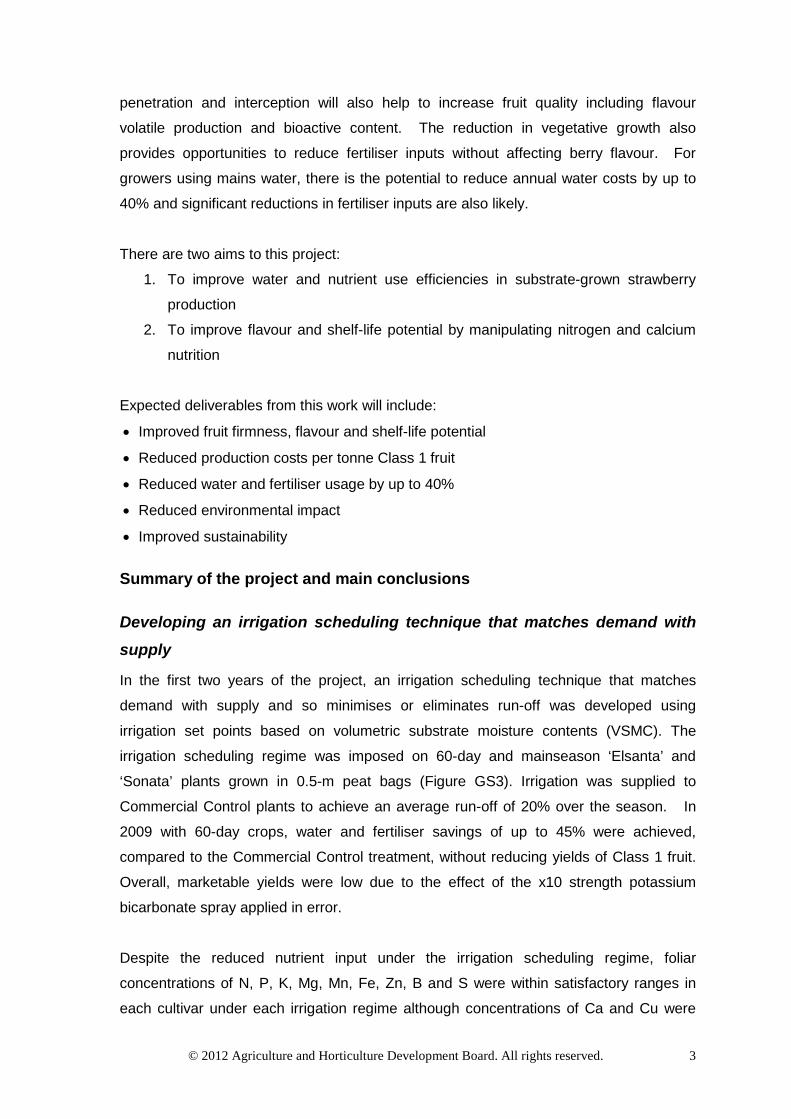
Figure GS4. Rain gauges and data loggers with telemetry are being used to record water input
and output volumes in grower trials in SF 136.
This information can then be used to highlight times of the day when run-off is excessive
and the duration of these events can then be adjusted to reduce water and fertiliser
losses. Continuous monitoring of VSMC also ensures that water availability does not
become limiting once run-off has been reduced. The potential build-up of salts can also
be monitored using EC probes and managed by flushing through with acidified water or
dilute calcium nitrate solutions if needed. During these experiments, equipment from
several different manufacturers has been used to develop an automated irrigation
system that enables precise control of run-off. For commercial exploitation, these
systems need to be integrated into a single controller unit. We are currently identifying
the necessary components of this system in Project SF 136.
Testing the potential of RDI regimes to deliver water savings and improved fruit quality
Previous Defra-funded work at EMR had shown that an RDI regime that replaced only
80% of the water lost by evapotranspiration could deliver significant water savings and
improved aspects of fruit quality in substrate-grown strawberry. These strategic
experiments were carried out on main season crops in 6 L containers and it was
important to test the effectiveness of RDI using commercial planting densities where the
available substrate volume per plant is considerably less. RDI was imposed on 60-day
and main season ‘Elsanta’ and ‘Sonata’ plants in 2009 and 2010, respectively, grown in
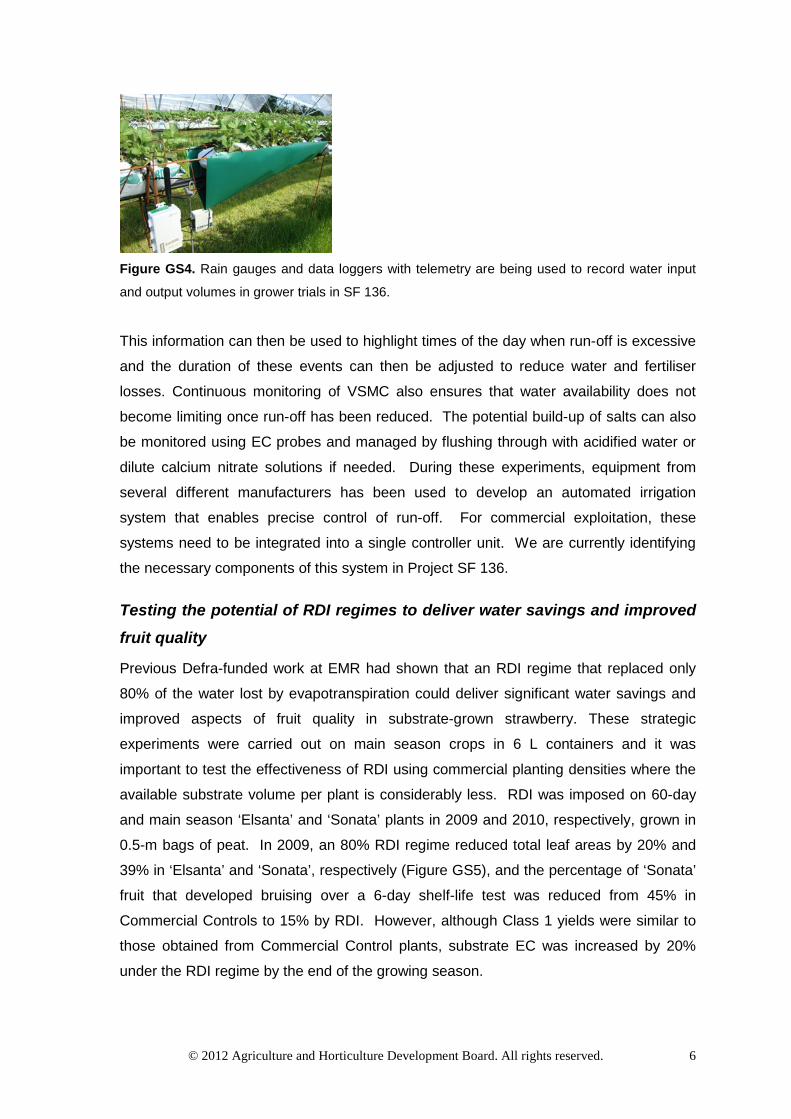
0.5-m bags of peat. In 2009, an 80% RDI regime reduced total leaf areas by 20% and
39% in ‘Elsanta’ and ‘Sonata’, respectively (Figure GS5), and the percentage of ‘Sonata’
fruit that developed bruising over a 6-day shelf-life test was reduced from 45% in
Commercial Controls to 15% by RDI. However, although Class 1 yields were similar to
those obtained from Commercial Control plants, substrate EC was increased by 20%
under the RDI regime by the end of the growing season.

© 2012 Agriculture and Horticulture Development Board. All rights reserved. 7
Lam
ina
area
(cm
2 )
0
400
800
1200
1600Run-off ETp 100%RDI 80%
Date of measurement
14/07/09 21/07/09 28/07/09 05/08/09 01/10/09
Figure GS5. Effect of the irrigation regimes on estimated total canopy area of ‘Sonata’
In 2010, RDI regimes were imposed on mainseason ‘Elsanta’ and ‘Sonata’ plants and
physiological responses to substrate drying such as lowered stomatal conductances,
transpiration rates, leaf growth and photosynthetic rates were detected. Total canopy
areas were reduced by up to 58% and 62% in RDI-treated ‘Elsanta’ and ‘Sonata’,
respectively. However, Class 1 yields were also significantly reduced in RDI-treated
plants compared to Commercial Control values (449 g vs 231 g). Although we have
shown in strategic experiments that RDI has the potential to deliver significant water and
fertiliser savings in substrates, as well as improvements in fruit quality, the technique
would be difficult to implement in commercial substrate strawberry production.
Maintaining the substrate within the target upper and lower VSMC set points under high
evaporative demand would be challenging due to the limited substrate volumes (3-4 L
per plant) and growing in coir would further increase the risk of shoot water deficits and
associated reductions in Class 1 yields and quality. However, we have shown in SF 83
that RDI can be used very successfully in soil-grown crops to deliver water savings and
improved fruit quality.
Manipulating N nutrition
The aim of this work was to test the potential to manipulate ammonium-N (N-NH4) and
nitrate-N (N-NO3) ratios to try to improve berry firmness and shelf-life potential,
particularly in cultivars such as ’Sonata’ where berries can be soft and vulnerable to
bruising. In our experiment, changing the percentage of ammonium-N from 10% to
either 20% or 30% did not significantly affect plant physiology or fruit quality. No
consistent effects of altering NO3-N: NH4-N ratios on foliar nutrient concentrations were
detected and so it was not necessary to increase Ca concentrations in the fertiliser feed
mixes. In the 60-day crop in 2011, the different NO3-N:NH4-N regimes were applied for

© 2012 Agriculture and Horticulture Development Board. All rights reserved. 8
only six weeks but during that time, no significant treatment differences were observed.
In previous work, higher ratios of NO3-N:NH4-N have been needed to elicit physiological
responses (e.g. 50%:50%, 25%:75%) but during the preparation of the original proposal,
industry representatives felt that ratios greater than 70%:30% would limit fruit yields and
quality. Work in other cropping systems has shown that a 70%:30% NO3-N:NH4-N ratio
did not affect physiology under normal conditions but helped to improve tolerance to high
salinity stress via altered plant hormone signalling. More work is needed to determine the
potential of manipulating N nutrition in this way to improve not only aspects of fruit quality
and flavour, but also tolerance to high salinities and the build-up of ‘ballast’ ions (e.g.
Na+, Cl-) in substrates.
It should be noted that throughout this project, Class 1 yields have been lower than
anticipated due to issues associated with powdery mildew. However, the approaches
developed in SF 107 have also been trialled in other Defra-funded work at EMR with
mainseason substrate-grown ‘Elsanta’ crops and significant savings in water and
fertilisers have been achieved whilst maintaining good commercial yields of high quality
fruit.
Main Conclusions
• Irrigation scheduling and deficit irrigation regimes were imposed on 60-day and main
season ‘Elsanta’ and ‘Sonata’ plants.
• A new irrigation scheduling strategy has been developed for substrate-grown
strawberries that reduces or eliminates run-off. In this strategy, irrigation inputs
and outputs are monitored continuously using rain gauges and data loggers with
telemetry. This information is used to adjust the timing and frequency of irrigation
so that run-off is eliminated and demand is matched with supply. VSMC and EC
are also measured continuously to ensure that irrigation is scheduled effectively
and substrate EC levels are controlled adequately once run-off has been
eliminated.
• Water savings of between 15% and 45% were delivered without reducing Class 1
yields using the new irrigation scheduling strategy. Since nutrients were added at
each irrigation event, fertiliser savings of up to 45% have also been achieved
• The lower fertiliser inputs under the irrigation scheduling regime resulted in reduced
leaf concentrations of Ca in ‘Sonata’ but fruit quality was not affected.
• An RDI regime was developed that limited excessive canopy growth and improved
berry shelf-life potential in 60-day crops. However, Class 1 yields were reduced

© 2012 Agriculture and Horticulture Development Board. All rights reserved. 9
by 17% in the mainseason crops, due to temporary losses of shoot turgor at high
evaporative demands when substrate water availability was limited.
• RDI would be difficult to implement in some commercial substrate production systems
where the accuracy and consistency of water delivery may not be sufficient to
maintain VSMCs between upper and lower set points. Under these
circumstances, the risk of shoot water deficits and associated reductions in Class
1 yields and quality would be high.
• An automated system has been developed that triggers irrigation automatically once
the VSMC has fallen to a pre-determined lower set point. By adjusting the
frequency and duration of irrigation events, the volume of run-off can be fine-
tuned during different stages of crop development. The system is currently being
tested in commercial grower trials in SF 136.
• Altering the contribution of NH4-N from 10% to either 20% or 30% did not alter plant
physiology or aspects of fruit quality in either ‘Elsanta’ or ‘Sonata’. Further
strategic work is needed to identify the NO3-N:NH4-N ratio that affects plant
physiology and fruit quality attributes. The potential of altering N nutrition to
improve tolerance to salinity stress in substrate soft fruit production should also
be investigated.
• Fertiliser savings of between £448 and £2,025 per ha per annum could be achieved
by scheduling irrigation so that run-off was minimised or eliminated.
• New fertigation regimes need to be developed to optimise plant nutrition under water-
saving irrigation strategies.
Financial benefits
The project aims to improve the economic sustainability of soil-less strawberry
production by improving both water and nutrient use efficiencies. In our experiments,
water and nutrients were delivered to the substrate around each plant by using four
dripper stakes per 0.5-m bag to ensure an even distribution, to prevent dry spots from
developing and minimise the likelihood of run-off. However, in commercial production
with 1-m bags, costs associated with doubling the number of dripper spikes to eight per
bag may be prohibitive. These extra costs must be set against the water and fertiliser
savings (see below) to decide whether this approach would be financially viable. The
approach being used in both commercial trials in SF 136 is to use five 1.2 L per hour
drippers per 1-m substrate bag. Some growers are beginning to switch to this system
instead of using a 6 L per hour dripper with four irrigation spikes per 1-m bag since water
would still be supplied to the majority of the substrate should individual drippers become
blocked; these could then be readily and inexpensively replaced. Clearly, the economics

© 2012 Agriculture and Horticulture Development Board. All rights reserved. 10
of this approach are feasible for commercial production systems.
The reduction in fertiliser use of between 15% and 45% could be expected to deliver
significant cost savings to growers. The Rural Business Research (RBR) 2008/2009
Farm Business Survey for Horticulture Production in England reported average annual
fertiliser costs (across all specialist glass businesses including soft fruit) of £3,250-
£4,500/ha. On this basis, a 15% reduction in fertiliser used could, on average, save
£488-£675/ha while a 45 % reduction in fertiliser used could save £1,464-£2,025/ha. The
RBR 2008/2009 survey reported average annual water costs (across all specialist glass
businesses including soft fruit) of £530-£630. This confirms that, generally speaking, the
savings in expenditure on water do not justify expenditure on irrigation scheduling tools.
Growers using mains water would expect to pay significantly more for water and there
may then be a significant financial benefit to using less water. However, the reduction in
energy use through pumping less water could be significant. If a grower could save at
least £600/ha in fertiliser from the use of an irrigation scheduling tool, then a cost of at
least £300/ha/annum for that scheduling tool would seem reasonable. A more complete
cost benefit analysis will be carried out using data from the grower trials at New Farm
Produce Ltd and S.H. Chesson Partnership and included in the 2013 Final Report for SF
136.
Action points for growers
• Employ an irrigation consultant to ensure that current and new irrigation systems
are designed correctly to achieve accurate and precise delivery of water and
fertilisers.
• Monitor run-off at different times throughout the day to establish which irrigation
events can be reduced to save water and fertilisers.
• Consider using vapour pressure deficits (VPD) to help inform irrigation decisions.
• Use substrate moisture and EC probes to help inform irrigation decisions.
• Current industry ‘standard’, ‘best’ and ‘better’ practice must be first be established
before the water and nutrient use efficiencies delivered in this project can be
assessed in a commercial context. It would be helpful if substrate strawberry
growers would fill out and return a questionnaire on water and fertiliser use
efficiencies. Please contact Scott Raffle or Andrew Tinsley at HDC for a copy of
the questionnaire.
© 2012 Agriculture and Horticulture Development Board. All rights reserved. 11
SCIENCE SECTION
Introduction
All soft fruit produced in England and Wales is reliant on irrigation to ensure that quality
at market date matches the specifications demanded by retailers and consumers1.
Although the majority of production is currently field-grown, the number of growers
switching to soil-less production is increasing as they strive to reduce the labour costs
associated with picking and avoid issues associated with soil sterilisation. Current
recommendations for substrate growers are to irrigate to achieve a 10-20% run-off2 or to
apply 500-700 ml per plant per day3. This approach is used to ensure that the substrate
is wetted thoroughly so that there are no dry patches within the bag and to reduce the
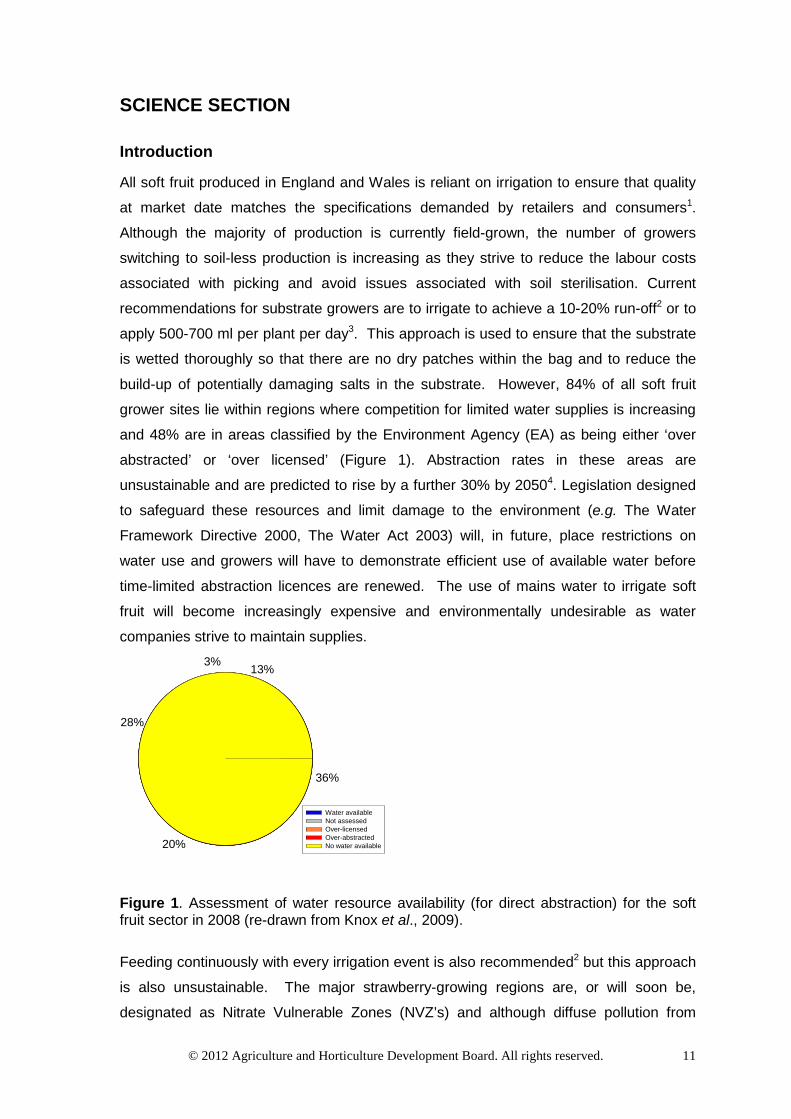
build-up of potentially damaging salts in the substrate. However, 84% of all soft fruit
grower sites lie within regions where competition for limited water supplies is increasing
and 48% are in areas classified by the Environment Agency (EA) as being either ‘over
abstracted’ or ‘over licensed’ (Figure 1). Abstraction rates in these areas are
unsustainable and are predicted to rise by a further 30% by 20504. Legislation designed
to safeguard these resources and limit damage to the environment (e.g. The Water
Framework Directive 2000, The Water Act 2003) will, in future, place restrictions on
water use and growers will have to demonstrate efficient use of available water before
time-limited abstraction licences are renewed. The use of mains water to irrigate soft
fruit will become increasingly expensive and environmentally undesirable as water
companies strive to maintain supplies.
Water availableNot assessedOver-licensedOver-abstractedNo water available
28%
20%
36%
13%3%
Figure 1. Assessment of water resource availability (for direct abstraction) for the soft fruit sector in 2008 (re-drawn from Knox et al., 2009).
Feeding continuously with every irrigation event is also recommended2 but this approach
is also unsustainable. The major strawberry-growing regions are, or will soon be,
designated as Nitrate Vulnerable Zones (NVZ’s) and although diffuse pollution from

© 2012 Agriculture and Horticulture Development Board. All rights reserved. 12
strawberry production is perceived as being low5, the EA is becoming increasingly
concerned about the environmental impact of substrate production, especially in the
south east. In future growers will have to limit their inputs to comply with legislation (The
Nitrates Directive Action Programme). There is also a financial driver to reduce inputs;
fertiliser prices have doubled in recent years and costs of production could be
significantly reduced by using fertilisers more efficiently.
In addition to facilitating compliance with legislation, new irrigation guidelines that
improve water and nutrient use efficiency could also be expected to improve the
consistency of supply of high quality, healthy fruit with good shelf-life and a reduced
susceptibility to bruising. One aim of this HDC-funded project is to develop an irrigation
scheduling regime that avoids the excessive use of water (and fertiliser) associated with
current regimes. It has already been shown in pot experiments that if an irrigation
scheduling regime is used that matches plant demand with supply, water savings of up
to 40% can be achieved compared to current recommendations, without affecting yield
or quality of Class 1 fruit6,7. However, it will be important to manage the scheduling
regime carefully to ensure that the reduced irrigation volume does not lead to a build-up
of salts within the substrate bag.
Effective irrigation scheduling can be achieved using several different approaches, either
alone or in combination. Adjusting the duration and frequency of irrigation events to
maintain substrate or soil moisture contents within pre-determined thresholds is a very
effective scheduling tool that has delivered significant water savings, good commercial
yields and improvements in berry quality in work at EMR on strawberry6,7. The sudden
and sustained increase in water demand that often occurs during cropping can easily be
accounted for using this approach; the upper and lower irrigation set points remain the
same but the rate of soil or substrate drying is increased. The relatively low cost of
substrate moisture probes combined with improved and cost-effective telemetry options
now makes remote access of ‘real-time’ substrate moisture contents economically viable
for commercial growers.
Further water savings can be delivered when deficit irrigation is used. Regulated Deficit
Irrigation (RDI) involves applying less irrigation water than the plant requires, so that
some roots are gradually exposed to drying substrate (Figure 2). These roots produce
chemical signals that are transported to the shoots, where they invoke a number of
physiological responses that limit water loss from the canopy. Canopy areas can be
reduced by up to 40% without affecting yields of Class 1 fruit. Fruit quality attributes

© 2012 Agriculture and Horticulture Development Board. All rights reserved. 13
including soluble solids content (SSC [BRIX]), ascorbic acid (vitamin C) concentration
and flavour volatile production can also be improved in deficit-grown plants6,7,8. However,
deficit irrigation must be applied carefully as both fruit size and quality can be
compromised if the extent of substrate drying is not controlled with sufficient precision9.
Again, the effect of the RDI regime on substrate electrical conductivity (EC) and the
consequences for plant growth, Class 1 yields and fruit quality needs to be determined.
Figure 2. A) When irrigation is scheduled to achieve ‘run-off’, the substrate is wetted fully and all
roots are able to supply water and nutrients to sustain shoot growth and fruit development. B)
Under an RDI regime, gradual substrate drying occurs which triggers the production of root-
sourced chemical signals that restrict transpirational water loss and limit leaf growth. These root-
sourced signals may also impact on fruit quality
An irrigation scheduling regime that eliminated run-off and an RDI regime where only
80% of daily ETp was replaced were imposed on 60-day cv.‘Elsanta’ and ‘Sonata’ plants
in a polytunnel experiment at EMR in 2009. The effects of these treatments on canopy
development, Class 1 yields, fruit flavour components and shelf-life potential were
compared with those of an irrigation regime that resulted in between 10 and 20% run-off.
The experiment was repeated on main season cv. ‘Elsanta’ and ‘Sonata’ crops in 2010.

© 2012 Agriculture and Horticulture Development Board. All rights reserved. 14
In the third year of the project (2011), the ratios of nitrogen supplied from two different
chemical forms, nitrate and ammonium, were manipulated to test the effects on berry
size, firmness, soluble solids content (SSC) and shelf-life potential. In soil-less culture,
NO3-N is supplied mainly as potassium nitrate, calcium nitrate and nitric acid.
Ammonium nitrate is also used to provide NH4-N during fruit development, but is often
eliminated two weeks before picking as it can lead to unacceptable softening and
subsequent poor shelf-life. Fruit albinism may also be induced with ammonium nitrate if
silicon concentrations in irrigation water or substrate are high10,11. Excessive nitrogen
application can also induce albinism12 and reduces fruit size, SSC, flavour and firmness.
High nitrogen inputs can also stimulate lush vegetative growth, which often exacerbates
pest and disease problems. The effects of reducing nitrogen inputs on the regulation of
plant and fruit physiology by hormonal signalling have been investigated in Defra–funded
work at EMR7.
Different proportions of NH4-N and NO3-N in the feed solution can be obtained by using a
mixture of compounds such as calcium nitrate and ammonium sulphate. Because
ammonium nitrate provides both forms of nitrogen, it cannot be used to alter the
proportions of NH4-N and NO3-N. Very recent research10,11 suggests that manipulating
the ratio of NH4-N to NO3-N can increase berry size and, therefore, yields of marketable
fruit as well as improving firmness and SSC. Fruit numbers also increased with the
proportion of NH4-N in hydroponically-grown strawberry13. However, high ratios of NH4-N
to NO3-N can limit photosynthesis and fruit quality, as well as reducing calcium uptake.
The supply of potassium and calcium must be managed carefully to optimise berry
flavour and firmness14. In other crops, mixed nitrate/ammonium fertilization can partially
alleviate the negative effects of salinity on growth, compared to all-nitrate or all-
ammonium fertilization15.
Materials and Methods
Plant material
Bare-rooted grade A+ plants of cultivars ‘Elsanta’ and ‘Sonata’ were obtained from
Hargreaves’ Plants Ltd on 13 June 2011 and stored at 2°C until needed. A total of 176
0.5 m-long peat bags containing a 0.5 kg m-3 base fertiliser (NPK 15:10:20) and a wetting
agent were positioned on a newly refurbished table top system in a polytunnel at EMR.
All bags were wetted thoroughly prior to planting. Irrigation water was delivered to each
bag via one 4 L h-1 pressure compensated emitter fitted with a four-way dripper ‘spider’

© 2012 Agriculture and Horticulture Development Board. All rights reserved. 15
to distribute water evenly throughout the bag. On 29 June 2011 each substrate bag was
planted with four plants of either cv. ‘Elsanta’ or ‘Sonata’; there were 88 bags for each
cultivar. Overhead irrigation was applied several times per day to ensure that the crowns
were kept moist and that the substrate was thoroughly wetted during the two-week
establishment period. Throughout the experiment all plants received the standard EMR
pest and disease spray programme (but see below).
Experimental design
Two experiments were carried out in 2011, one on each of the two cultivars. Each
experiment was an extended Latin square design consisting of ten blocks and four
treatments. Rows 1 and 6 served as guard rows (Figure 3). In the commercial control
(CC) treatment, sufficient irrigation was applied to achieve an average of between 10-
20% run-off throughout the season using an ammonium nitrogen: nitrate ratio of 1:10, i.e.
10% N supplied via ammonium. In the second treatment, 10% N was supplied via
ammonium (10% NH4-N) but irrigation was scheduled to match demand with supply (see
below) so that run-off was minimised or eliminated. Twenty percent or 30% of N was
supplied via ammonium in treatments 3 (20% NH4-N) and 4 (30% NH4-N), respectively,
and irrigation was again scheduled to minimise or eliminate run-off.

© 2012 Agriculture and Horticulture Development Board. All rights reserved. 16
F E D C B A
1
G G G G G G
1Elsanta
CC10% NH4-N20% NH4-N
2G G G G G G
220% NH4-N
Sonata3
G G G G G G
3 CC10% NH4-N20% NH4-N20% NH4-N
4
G G
4ELSANTA
BLOCK 1 G - Guard plants
5
G G
5
6G
BLOCK 2
G6
7
G G
7
BLOCK 3
8
G G
8
9G
BLOCK 4
G9
10
G G
10
BLOCK 5
11
G G
11
12G
BLOCK 6
G12
13
G G
13
BLOCK 7
14
G G
14
15G
BLOCK 8
G15
16
G G
16
BLOCK 9
17
G G
17
18G
BLOCK 10
G18
19
G G
19SONA
TABLOCK
1
20
G G
20
21G
BLOCK 2
G21
22
G G
22
BLOCK 3
23
G G
23
24G
BLOCK 4
G24
25
G G
25
BLOCK 5
26
G G
26
27G
BLOCK 6
G27
28
G G
28
BLOCK 7
29
G G
29
30G
BLOCK 8
G30
31
G G
31
BLOCK 9
32
G G
32
33G
BLOCK 10
G33
34
G G
34
G G G G35
G G
35
G G G G36
G G
36
G G G G
G G G G Figure 3. Plot plan showing the experimental design. Rows 1 and 6 were designated as guard
rows and all measurements were made on 60-day cv. ‘Elsanta’ or ‘Sonata plants in rows 2 to 5.
Each 0.5 m peat bag contained four’ plants.

© 2012 Agriculture and Horticulture Development Board. All rights reserved. 17
Irrigation application and scheduling
Separate irrigation lines were used for each cultivar and for each treatment so that
irrigation could be scheduled and applied to optimise water and nutrient use efficiencies
in each treatment. During establishment, the timing and duration of irrigation events was
controlled using two Galcon DC-4S units (supplied by City Irrigation Ltd, Bromley, UK)
connected to a manifold housing eight DC-4S ¾” valves. Water was sourced from the
mains supply to ensure a consistent supply (both in terms of quantity and quality)
throughout the experiment. A water meter was connected to each irrigation line and
measured the total volumes of water used in each treatment during different stages of
crop development. Dripper outputs were tested prior to the experiment to ensure an
accuracy of within 10%; outputs were then tested regularly throughout the experiment.
Irrigation was pulsed throughout the day to help minimise run-off.
On 14 July 2011 SM200 substrate moisture probes (Delta-T Devices Ltd, Cambridge,
UK) were inserted into the middle of a substrate bag, adjacent to a dripper and a plant, in
each of the eight treatments. SM200 probes were connected to eight GP1 data loggers
wired into the Galcon irrigation timers. The GP1 loggers were then programmed to
trigger irrigation events when the substrate moisture content fell in each treatment bag to
a pre-determined set point or to achieve the desired level of run-off. The frequency of
irrigation events was determined by the rate of substrate drying in response to changes
in evaporative demand throughout the day. In the commercial control (CC) treatments,
the duration of irrigation events was adjusted to ensure that sufficient water was added
to achieve the correct volumes of run-off. In the 10%, 20% and 30% NH4-N treatments,
the number and duration of irrigation events was adjusted to ensure that the volumetric
substrate moisture content (VSMC) was maintained between upper and lower set points
whilst minimising or eliminating run-off.
The accuracy with which the GP1/SM200 automatic irrigation scheduling system
matched demand for water with supply was continually monitored. This was achieved by
carrying out gravimetric measurements of substrate bag water loss over 24 h to obtain
crop-coefficient values that could be used in conjunction with estimates of daily potential
evapo-transpiration (ETP) to estimate the volume of water lost from the substrate bags
over each 24 h period. ETP values were obtained using an SKTS 500/PRT EvapoSensor
and SEM 550 EvapoMeter (Skye Instruments Limited, Llandrindod Wells, Powys, UK).
The EvapoSensor was positioned amongst the experimental plants and maintained at
canopy height. The frequency and duration of irrigation events was then adjusted to

© 2012 Agriculture and Horticulture Development Board. All rights reserved. 18
ensure that irrigation was being applied to match demand with supply in the 10%, 20%
and 30% NH4-N treatments.
Following a period of establishment, irrigation scheduling regimes were first applied on
28 July 2011 when the plants were at 50% full bloom. In each treatment, run-off was
channelled from three separate substrate bags into ECRN-50 rain gauges (Figure 4A)
connected to Decagon EM50G data loggers with telemetry (Decagon Devices, USA).
Volumes of irrigation applied at each event were also recorded by ECRN-50 rain gauges
(Figure 4B). The percentage of irrigation applied that was lost via run-off was calculated
each day and the irrigation set points on the GP1 data loggers were adjusted
accordingly.
A) B)
Figure 4. Rain gauges were used to record A) volumes of run-off and B) dripper outputs
automatically throughout the season. Photos taken on 9 May 2011, the experiment shown was
carried out as part of WU0110.
Volumetric substrate moisture content and electrical conductivity
Changes in volumetric substrate moisture content (VSMC) were logged continuously
using Decagon 10HS probes and EM50G data loggers. Substrate electrical conductivity
(EC) and temperature was also logged continuously using Decagon 5TE probes.
Manual measurements of VSMC and substrate EC at several positions within each
substrate bag were also made with a Delta-T Devices ‘WET’ sensor.
Adjusting NO3-N to NH4-N ratios
Fertigation regimes were formulated by Mr Michael Daly (The Agrology House, Lincs.,
UK) after mineral analysis of the mains water used for the experiment. Straight fertilisers
were used to achieve 10%, 20% and 30% of the total nitrogen applied in the form of NH4-
N. In order to achieve this it was necessary in the 30% NH4-N recipes to add calcium
chloride in order to keep the calcium constant in each treatment. Total nitrogen was kept
the same in all treatments, as were P, K, Ca, Mg and trace elements (Table 1). Calcium

© 2012 Agriculture and Horticulture Development Board. All rights reserved. 19
recipes were given from a target of 150 mg/L Ca during the vegetative stage to 125 mg/l
Ca during the fruiting stage.
Table 1. Nutritional composition of the vegetative and fruiting feeds for each treatment diluted 1:100 (including background water and nitric acid).
Nutrient Concentration in diluted feed (mg L-1) Vegetative Fruiting All treatments CC 10%
NH4-N 20%
NH4-N 30%
NH4-N Total N 129 150 150 150 150 NO3-N 125 135 135 120 105 NH4-N 4 15 15 30 45 P 33 46 46 46 46 K 205 250 250 250 250 Ca 151 150 150 150 150 Mg 27 33 33 33 33 Cl 0.21 34 34 34 34 B 0.14 0.22 0.22 0.22 0.22 Cu 1.38 0.11 0.11 0.11 0.11 Fe 0.60 1.80 1.80 1.80 1.80 Mn 0.03 0.75 0.75 0.75 0.75 Mo 0.66 0.50 0.50 0.50 0.50 Zn 0.56 0.56 0.56 0.56 0.56 EC (mS cm-1) 1.74 2.01 2.01 2.25 2.42
From two weeks after planting until the small green fruit stage, a vegetative feed was
used in both cultivars and all treatments. Plants were fertigated from two stock tanks,
one containing ‘Hortipray’ calcium nitrate (19% Ca, 14.5% NO3-N, 1.0% NH4-N) and a
second containing ‘Solufeed’ (6-11-37 + 4 Mg0 + trace elements) and ‘Hortipray’
magnesium sulphate (9.6 % Mg). Nitric acid (60%) was added to each tank to reduce
the bicarbonate concentration of the water to around 50 mg L-1 for buffering purposes.
Dosatrons were used to dilute the stock solutions 1:100 and to adjust the feed EC levels
throughout the experiments. The target pH range of the solution applied to the plants
was 5.8 - 6.2. At the small green fruit stage, a fruiting feed was used for the cv ‘Elsanta’
and cv ‘Sonata’ CC treatments; this was first applied on 4 August 2011. The fruiting feed
was applied throughout cropping and for three weeks after cropping had finished to ‘build
up’ the crowns for the next season. EC and pH of the diluted feed solution were
measured daily at the drippers, together with the EC of any run-off.
For the 10%, 20% and 30% NH4-N treatments, the composition of the fruiting feed was
adjusted to deliver the necessary contributions of N from NO3 and NH4 (Table 1). Since
plants were fertigated at every irrigation event, the total amount of fertiliser supplied to
the different treatments depended on the duration of each irrigation event which was

© 2012 Agriculture and Horticulture Development Board. All rights reserved. 20
adjusted to deliver the appropriate volume of water.
Leaf tissue and substrate nutrient status
Leaf and substrate samples were taken from each of the eight treatments for nutrient
analysis at the middle (18 August 2011) and towards the end (9 September 2011) of
cropping to determine whether the different NH4-N regimes affected plant mineral uptake
and the accumulation of ions in the substrate.
Measurement of physiological responses
All routine measurements were carried out on one plant in each of eight replicate bags
per treatment in rows 2-5 (see Figure 4). Tables in rows 1 and 6 were used as guard
plants to avoid any edge effects at the sides of the polytunnel. Midday xylem leaf water
potential (ψL) was measured weekly; for each plant, one young, fully-expanded, trifoliate
leaf was excised using a sharp blade and sealed in to a plastic bag containing a sheet of
damp tissue paper. Within 30 s of excision, ψL was determined with a Skye SKPM 1400
pressure bomb (Skye Instruments Ltd, UK). Stomatal conductance (gs) of one young,
fully-expanded leaf per experimental plant was measured twice-weekly with a steady-
state porometer (Leaf porometer SC-1, Decagon Devices Ltd.). Rates of photosynthesis
of fully expanded leaves were measured using a portable infra-red gas analyser (CIRAS-
1, PP-systems) with an additional light source powered by a car battery on five
occasions during fruit development and cropping.
Leaf extension was determined by measuring the length of the middle trifoliate leaf blade
of young expanding leaves twice-weekly until maturity; new expanding leaves were then
labelled and measured. In total, leaf extension of three expanding leaves was measured
throughout the season.
Changes in primary, secondary and tertiary fruit volume were measured twice weekly
during development to determine whether the different irrigation and fertigation regimes
affected the rate of fruit expansion. The diameter of labelled fruit was measured twice at
diametrically opposed positions on the shoulder and combined with length
measurements to estimate fruit volume; for this purpose, fruit were assumed to be
conical.
Fruit harvesting, grading and sampling for quality analyses
Ripe fruit were harvested and recorded from one plant in each of eight bags per
treatment in rows two to five (see Figure 4). Ripe fruit were first harvested on 11 August

© 2012 Agriculture and Horticulture Development Board. All rights reserved. 21
2011 and were collected twice weekly until 19 September 2011. All ripe fruit were
harvested and graded into four size categories: 35 mm+, 25-35 mm, 22-25 mm and
waste (small, diseased, or mis-shapen fruit). The former two classes constitute
commercial Class 1 fruit, with Class 2 fruit being 22-25 mm. The fresh weight of fruit in
each size class was recorded at each harvest using a portable balance (ScoutPro 4000,
Ohaus UK Ltd, UK). Berry firmness of one primary or secondary fruit was measured at
two diametrically opposed points using a hand-held penetrometer (HPE II, Bureiss
Prüfgerätebau, GmbH) fitted with a 0.5 cm2 anvil. Berry SSC was measured with a
digital refractometer (Palett 100, Atago & Co. Ltd, Tokyo, Japan).
Shelf-life tests
Shelf-life tests were undertaken for secondary/tertiary fruit harvested on 2 September
2011. For each treatment and for each cultivar, 12 ripe strawberries were harvested and
placed in a punnet. All punnets were stored at 5 ºC for seven days. Weight loss from
each punnet was measured daily and the number of fruit with visible bruises and rots
were recorded on each of the seven days.
Calculation of water productivity and nutrient use efficiency
The total volume of water applied during the experiment from 14 July until 19 September
2011 was calculated for each cultivar and for each irrigation regime. The volume of
irrigation water (L) used to produce a standard mass of class 1 fruit (1 kg) was also
calculated. This is an estimate of water productivity (WP) and a lower value implies a
more productive use of water.
Nutrient inputs were calculated by multiplying the total amount of each nutrient applied
per litre of irrigation water supplied throughout the experiment by the concentrations of
individual nutrients in the diluted feed solution.
Statistical analyses
Statistical analyses were carried out using GenStat 11th Edition (VSN International Ltd.).
To determine whether differences between cultivars were statistically significant, analysis
of variance (ANOVA) tests were carried out and least significant difference (LSD) values
for p<0.05 were calculated.
Additional experiment in 2011
Due to the issues associated with powdery mildew throughout this project (see below),
an additional experiment was carried out in Spring 2011. Although the experiment was
© 2012 Agriculture and Horticulture Development Board. All rights reserved. 22
primarily designed to test the potential of a novel irrigation strategy developed at EMR
(Transient Deficit Irrigation – TDI) to improve water use efficiency and fruit quality in
substrate strawberry production (Defra Project WU0110), additional treatments were
included to provide information about the potential of using RDI to improve water use
efficiency and fruit quality. A Commercial Control (CC) treatment was included where
irrigation was applied to achieve an average of 10% run-off throughout the season and
the irrigation scheduling regime that was used in SF 107 experiments in 2011 was also
imposed.
Results
It should be noted that throughout this project, Class 1 yields were lower than anticipated
due to issues associated with powdery mildew. The subsequent reduction in
transpirational leaf area of infected plants would have reduced water use and slowed the
rate of substrate drying; therefore, the volumes of water applied over the season would
be lower than in disease-free plants. However, since plants in all treatments were
infected similarly, the relative differences between treatments in terms of water use
reported below would not have been affected. The approaches developed in SF 107
have also been trialled in Defra-funded work at EMR with mildew-free main season
substrate-grown cv. ‘Elsanta’ crops and significant savings in water and fertilisers have
been achieved whilst maintaining good commercial yields of high quality fruit.
2011
Complete data sets for all parameters listed in the Materials and Methods section were
collected for both cultivars ‘Elsanta’ and ‘Sonata’ under each of the four treatments. In
most cases, there were no statistically significant differences in the measured
parameters between the different fertigation regimes for each cultivar. For the sake of
brevity, not all results are shown for each cultivar.
Irrigation volumes and percent run-off
For each cultivar and for each treatment, irrigation volumes applied at each irrigation
event over the season were recorded automatically using ECRN-50 rain gauges. The
sum of the daily irrigation volumes applied to the CC and 10% NH4-N regimes for
‘Elsanta’ are presented in Figure 5 (A and B), together with estimates of daily ETP. The
total volumes of water applied to each cultivar in each treatment are presented in Table
2. Compared to CC values, water savings of 15 to 42% were achieved over the season
in cv. ‘Elsanta’ and of 22 to 45% in cv. ‘Sonata’ when irrigation was scheduled to match
demand with supply. Consequently, run-off from the substrate bags was either greatly
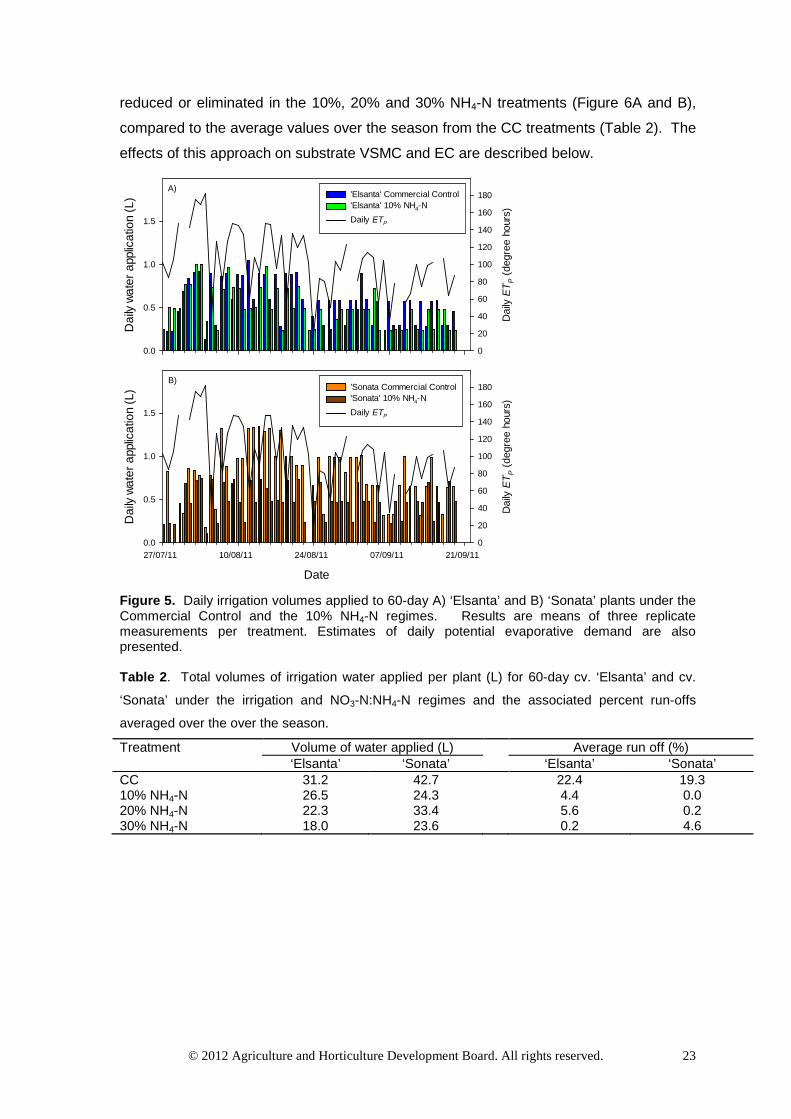
© 2012 Agriculture and Horticulture Development Board. All rights reserved. 23
reduced or eliminated in the 10%, 20% and 30% NH4-N treatments (Figure 6A and B),
compared to the average values over the season from the CC treatments (Table 2). The
effects of this approach on substrate VSMC and EC are described below.
Dai
ly wa
ter a
pplic
atio
n (L
)
0.0
0.5
1.0
1.5
Dai
ly E
T P (d
egre
e ho
urs)
0
20
40
60
80
100
120
140
160
180'Elsanta' Commercial Control'Elsanta' 10% NH4-NDaily ETP
Date
27/07/11 10/08/11 24/08/11 07/09/11 21/09/11
Dai
ly wa
ter a
pplic
atio
n (L
)
0.0
0.5
1.0
1.5
Dai
ly E
T P (d
egre
e ho
urs)
0
20
40
60
80
100
120
140
160
180'Sonata Commercial Control'Sonata' 10% NH4-N Daily ETP
A)
B)
Figure 5. Daily irrigation volumes applied to 60-day A) ‘Elsanta’ and B) ‘Sonata’ plants under the Commercial Control and the 10% NH4-N regimes. Results are means of three replicate measurements per treatment. Estimates of daily potential evaporative demand are also presented. Table 2. Total volumes of irrigation water applied per plant (L) for 60-day cv. ‘Elsanta’ and cv.
‘Sonata’ under the irrigation and NO3-N:NH4-N regimes and the associated percent run-offs
averaged over the over the season. Treatment Volume of water applied (L) Average run off (%) ‘Elsanta’ ‘Sonata’ ‘Elsanta’ ‘Sonata’ CC 31.2 42.7 22.4 19.3 10% NH4-N 26.5 24.3 4.4 0.0 20% NH4-N 22.3 33.4 5.6 0.2 30% NH4-N 18.0 23.6 0.2 4.6
© 2012 Agriculture and Horticulture Development Board. All rights reserved. 24
Per
cent
run-
off
0
20
40
60
80
Dai
ly E
T P (d
egre
e ho
urs)
0
20
40
60
80
100
120
140
160
180'Elsanta' Commercial Control'Elsanta' 10% NH4-NDaily ETP
Date
27/07/11 10/08/11 24/08/11 07/09/11 21/09/11
Per
cent
run-
off
0
20
40
60
80
Dai
ly E
T P (d
egre
e ho
urs)
0
20
40
60
80
100
120
140
160
180'Sonata' Commercial Control'Sonata' 10% NH4-NDaily ETP
A)
B)
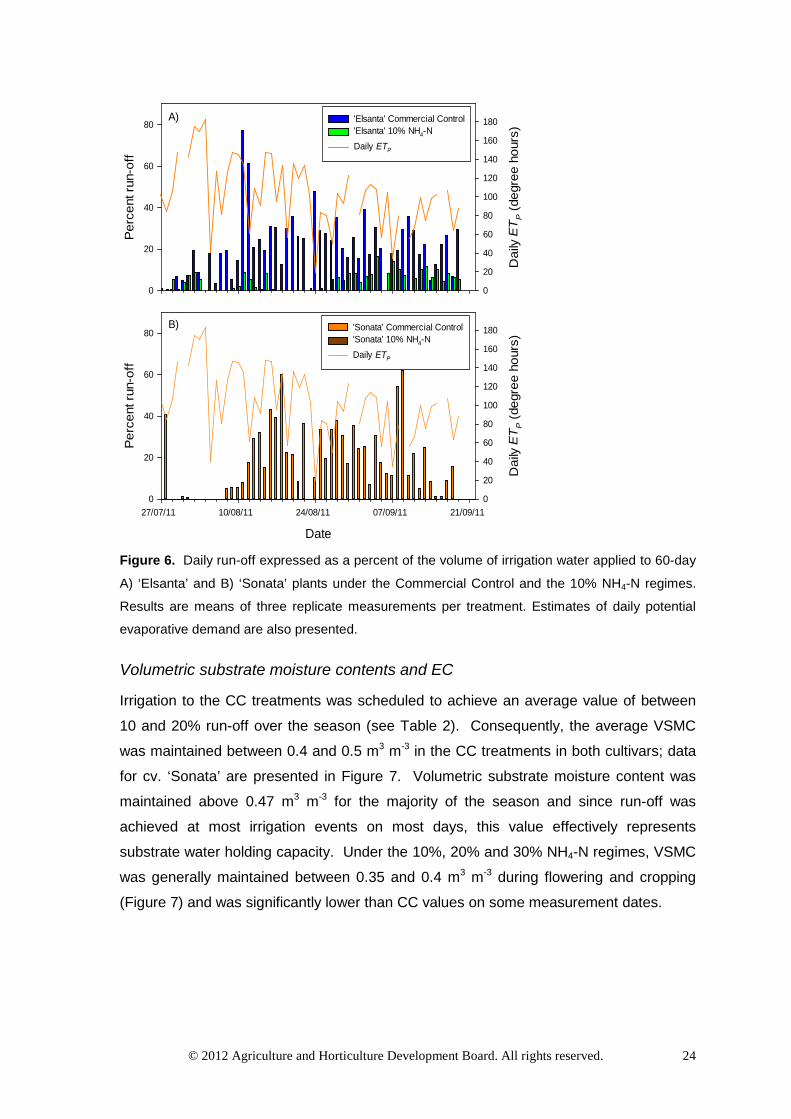
Figure 6. Daily run-off expressed as a percent of the volume of irrigation water applied to 60-day
A) ‘Elsanta’ and B) ‘Sonata’ plants under the Commercial Control and the 10% NH4-N regimes.
Results are means of three replicate measurements per treatment. Estimates of daily potential
evaporative demand are also presented.
Volumetric substrate moisture contents and EC
Irrigation to the CC treatments was scheduled to achieve an average value of between
10 and 20% run-off over the season (see Table 2). Consequently, the average VSMC
was maintained between 0.4 and 0.5 m3 m-3 in the CC treatments in both cultivars; data
for cv. ‘Sonata’ are presented in Figure 7. Volumetric substrate moisture content was
maintained above 0.47 m3 m-3 for the majority of the season and since run-off was
achieved at most irrigation events on most days, this value effectively represents
substrate water holding capacity. Under the 10%, 20% and 30% NH4-N regimes, VSMC
was generally maintained between 0.35 and 0.4 m3 m-3 during flowering and cropping
(Figure 7) and was significantly lower than CC values on some measurement dates.

© 2012 Agriculture and Horticulture Development Board. All rights reserved. 25
** * * *
Date
01/08/11 08/08/11 15/08/11 22/08/11 29/08/11 05/09/11 12/09/11 19/09/11 Volu
met
ric s
oil m
oist
ure
cont
ent (
m3 m
-3)
0.00.2
0.3
0.4
0.5
0.6
10% NH4-N 20% NH4-N 30% NH4-NCC
** * * *
Figure 7. Changes in volumetric soil moisture content (m3 m-3) in peat bags containing 60-day
‘Sonata’ plants under the different irrigation and NO3-N:NH4-N regimes. Results are means of
eight replicate measurements per treatment. Vertical bars are LSD values at p<0.05, asterisks
indicate statistically significant differences.
A) ‘Elsanta’ CC
B) ‘Elsanta’ 10% NH4-N
VSM
C (m
3m
-3)
Irrig
atio
n ev
ents
VSM
C (m
3m
-3)
Irrig
atio
n ev
ents
Date
Figure 8. Changes in volumetric substrate moisture content measured continuously using Delta-T SM200 probes over a 10 day period in the middle of cropping in A) the Commercial Control and B) the 10% NH4-N regimes in 60-day cv. ‘Elsanta’ plants. The number of irrigation events per day is also presented.

© 2012 Agriculture and Horticulture Development Board. All rights reserved. 26
Continuous measurements of VSMC were also made using Delta-T Devices GP1 data
loggers and SM200 probes and outputs from the water meters were also recorded (1
event = 1 L). Examples of these data sets are presented in Figure 8 for the cv. ‘Elsanta’
CC and 10% NH4-N treatments during a 10 day period in the middle of cropping. In the
cv. ‘Elsanta’ CC treatment, the irrigation set point was 0.65 m3 m-3 and either one, two
orthree 5 min-long irrigation events were triggered depending on daily evaporative
demand. During this 10 day period, a total of 8.47 L of water was applied to each cv.
‘Elsanta’ CC bag and run-off averaged 29%. In the cv. ‘Elsanta’ 10% NH4-N treatment,
the irrigation set point was 0.485 m3 m-3 and one, two, three or four 3 min-long irrigation
events were triggered depending on daily evaporative demand. For example, on 18
August 2011, daily ETP was low (56.9) and so plant water use was relatively low (8 g h-1),
consequently the rate of substrate drying was slow and one irrigation event was
triggered. Conversely, on 15 August 2011, daily ETP was high (146.7) resulting in high
transpiration rates (17.5 g h-1) and so the substrate dried more rapidly and four irrigation
events were triggered. A total of 6.58 L of water was applied to each cv. ‘Elsanta’ 10%
NH4-N bag and run-off averaged 1.5% over the 10-day period between 12 and 22 August
2011.
Substrate EC varied from 0.5 to 1.75 mS cm-1 over the season and values were similar in
the different treatments, despite the much reduced run-off in the 10%, 20% and 30%
NH4-N treatments, data from the CC and 10% NH4-N regimes are shown for each
cultivar in Figure 9. The increased substrate EC after 22 August 2011 was presumably
due to the application of chemical sprays to try to control the mildew infection. Manual
measurements made with the WET sensor at multiple points within representative bags
confirmed that water and nutrients were being distributed evenly in each treatment and
for each cultivar (data not shown).

© 2012 Agriculture and Horticulture Development Board. All rights reserved. 27
Date
08/08/11 15/08/11 22/08/11 29/08/11 05/09/11 12/09/11 19/09/11
Subs
trate
EC
(mS
cm-1
)
0.0
0.5
1.0
1.5
2.0
2.5'Elsanta' Commercial Control'Elsanta' 10% NH4-N
'Sonata' Commercial Control'Sonata' 10% NH4-N
Figure 9. Changes in substrate EC (mS cm1) in peat bags containing 60-day cv. ‘Sonata’ plants
under the Commercial Control and 10% NH4-N regimes. Results are means of eight replicate
measurements per treatment.
Plant physiological responses
Leaf elongation in cv. ‘Elsanta’ was similar in each of the four treatments during the
beginning and end of cropping but was significantly slowed in the 10%, 20% and 30%
NH4-N treatments in the middle of cropping, compared to the CC value (Figure 10). Leaf
elongation rates were similar in cv. ‘Sonata’ throughout cropping and no statistical
differences were noted between the different irrigation and fertigation regimes (data not
shown). No statistically significant treatment effects on gs were detected for cv. ‘Sonata’
on 15 measurements dates throughout cropping and on only one occasion was gs
reduced significantly by the 20% NH4-N treatment in cv. ‘Elsanta’ (data not shown). This
occurred on 15 August 2011 and coincided temporally with the slowed leaf extension
mentioned above. No significant treatment effects on midday ψL were detected for either
cultivar on six measurement dates and rates of photosynthesis were also similar in each
cultivar, irrespective of the irrigation and fertigation regimes applied (Figure 11A and B).
Overall, these results indicate that NO3-N to NH4-N ratios between 10% and 30% did not
affect plant physiology in either cultivar under the CC and the water-saving irrigation
regimes.

© 2012 Agriculture and Horticulture Development Board. All rights reserved. 28
Date
25/07/11 08/08/11 22/08/11 05/09/11 19/09/11
Cum
mul
ativ
e le
af g
rowt
h (m
m)
0
20
40
60
80
** * *
Figure 10. Cummulative leaf growth measured on expanding leaves of 60-day ‘Elsanta’ plants
under the different irrigation and NO3-N:NH4-N regimes. Results are means of eight replicate
measurements per treatment. Vertical bars are LSD values at p<0.05, asterisks indicate
statistically significant differences
Phot
osyn
thes
is (
mol
m-2
s-1) ii
0
5
10
15
03/08/11 17/08/11 24/08/11 07/09/11 14/08/11
30% NH4-NCC 10% NH4-N
A)
20% NH4-N
Date
0
5
10
15
10% NH4-N 20% NH4-N 30% NH4-NCC
B)
Figure 11. The effects of the irrigation and NO3-N:NH4-N regimes on rates of photosynthesis in
60-day A) ‘Elsanta’ and B) ‘Sonata’ plants. Results are means of eight replicate measurements
per treatment, vertical bars are LSD values at p<0.05.
Foliar and substrate nutrient analysis
Leaf and coir samples were analysed for macro- and micro-nutrients at the middle and
towards the end of cropping. On 18 August 2011, two weeks after the 10%, 20% and
30% NH4-N regimes were applied, most macro and micro nutrients were within the
normal ranges in leaf samples from cv. ‘Elsanta’ (Tables 3); the exceptions were N and S

© 2012 Agriculture and Horticulture Development Board. All rights reserved. 29
which were above their respective satisfactory ranges in all treatments. In cv. ‘Sonata’,
N and S were also above satisfactory values and Ca was just below satisfactory values
in all treatments (Table 4). Leaf Fe concentration was excessively high in the cv.
‘Sonata’ 30% NH4-N regime.
Table 3. Foliar mineral analysis for 60-day ‘Elsanta’ leaf samples collected on 18 August 2011 in
the middle of cropping. Values in italics or bold are over or under, respectively, satisfactory
values given in HDC Factsheet 06/07. Nutrient Units Foliar mineral concentrations CC 10%
NH4-N 20%
NH4-N 30%
NH4-N N (%) 4.0 3.9 4.1 4.0 P (%) 0.5 0.4 0.4 0.4 K (%) 2.5 2.2 2.1 2.2 Mg (%) 0.4 0.5 0.5 0.4 Ca (%) 1.3 1.34 1.21 1.1 Mn (mg kg-1) 207 216 204 190 Cu (mg kg-1) 6.1 5.3 4.9 4.7 Fe (mg kg-1) 172.2 176.2 140.2 128.2 Zn (mg kg-1) 29.2 27.6 25.6 27.6 B (mg kg-1) 45.5 43.8 40.0 42.0 S (%) (%) 0.3 0.3 0.3 0.3 N:S ratio - 14.3:1 14.6:1 15.1:1 15.7:1
Table 4. Foliar mineral analysis for 60-day ‘Sonata’ leaf samples collected on 18 August 2011 in
the middle of cropping. Values in italics or bold are over or under, respectively, satisfactory
values given in HDC Factsheet 06/07. Nutrient Units Foliar mineral concentrations CC 10%
NH4-N 20%
NH4-N 30%
NH4-N N (%) 3.9 3.8 4.1 3.9 P (%) 0.5 0.5 0.4 0.5 K (%) 2.1 2.1 1.9 2.0 Mg (%) 0.3 0.3 0.4 0.3 Ca (%) 0.8 0.8 1.0 0.9 Mn (mg kg-1) 135 126 149 138 Cu (mg kg-1) 4.3 4.3 3.9 4.7 Fe (mg kg-1) 157.0 111.5 122.6 1317.4 Zn (mg kg-1) 29.6 28.8 25.5 29.8 B (mg kg-1) 28.1 24.5 29.8 23.8 S (%) (%) 0.3 0.3 0.3 0.3 N:S ratio - 15.7:1 14.7:1 15.9:1 15.3:1
At the end of cropping, macro and micro nutrients were at similar levels to those
measured previously in cv. ‘Elsanta’ although N concentrations were lower and Cu
concentrations had fallen slightly below the satisfactory value (Table 5). In cv. ‘Sonata’,
N concentrations were within the satisfactory range, with the exception of the CC
treatment where it was still higher (Table 6). Leaf Ca concentrations remained below the

© 2012 Agriculture and Horticulture Development Board. All rights reserved. 30
satisfactory range, however, this was unlikely to be due to the increasing proportion of
NH4-N since values were also low in the 10% NH4-N treatment which received the same
fertigation regime as the CC. This effect was more likely due to the reduced Ca inputs
resulting from the water-saving irrigation scheduling regime used in the 10%, 20% and
30% NH4-N treatments (see Table 9). However, the reduced Ca input did not affect
‘Sonata’ fruit firmness or shelf-life potential (see below).
Table 5. Foliar mineral analysis for 60-day ‘Elsanta’ leaf samples collected on 19 September
2011 at the end of cropping. Values in italics or bold are over or under, respectively, satisfactory
values given in HDC Factsheet 06/07 Nutrient Units Foliar mineral concentrations CC 10%
NH4-N 20%
NH4-N 30%
NH4-N N (%) 3.6 3.7 3.8 3.9 P (%) 0.5 0.4 0.5 0.5 K (%) 2.2 1.7 1.9 2.0 Mg (%) 0.46 0.4 0.5 0.5 Ca (%) 1.3 1.4 1.5 1.4 Mn (mg kg-1) 190 194 222 219 Cu (mg kg-1) 5.0 4.1 4.5 4.2 Fe (mg kg-1) 133.2 647.1 200.4 147.9 Zn (mg kg-1) 25.9 23.2 26.0 26.1 B (mg kg-1) 54.8 42.0 47.6 49.3 S (%) (%) 0.2 0.3 0.2 0.3 N:S ratio - 15.1:1 14.4:1 15.8:1 15.1:1
Table 6. Foliar mineral analysis for 60-day ‘Sonata’ leaf samples collected on 19 September 2011 at the end of cropping. Values in italics or bold are over or under, respectively, satisfactory values given in HDC Factsheet 06/07.
Nutrient Units Foliar mineral concentrations CC 10%
NH4-N 20%
NH4-N 30%
NH4-N N (%) 3.8 3.5 3.5 3.5 P (%) 0.5 0.5 0.5 0.5 K (%) 2.0 1.8 1.7 1.7 Mg (%) 0.32 0.3 0.3 0.3 Ca (%) 0.9 0.7 0.7 0.6 Mn (mg kg-1) 131 118 114 120 Cu (mg kg-1) 4.4 4.1 3.6 3.7 Fe (mg kg-1) 101.4 146.9 132.5 89.0 Zn (mg kg-1) 25.9 30.1 28.0 32.7 B (mg kg-1) 30.9 27.8 26.6 23.6 S (%) (%) 0.3 0.2 0.2 0.2 N:S ratio - 14.2:1 15.0:1 15.1:1 13.2:1
© 2012 Agriculture and Horticulture Development Board. All rights reserved. 31
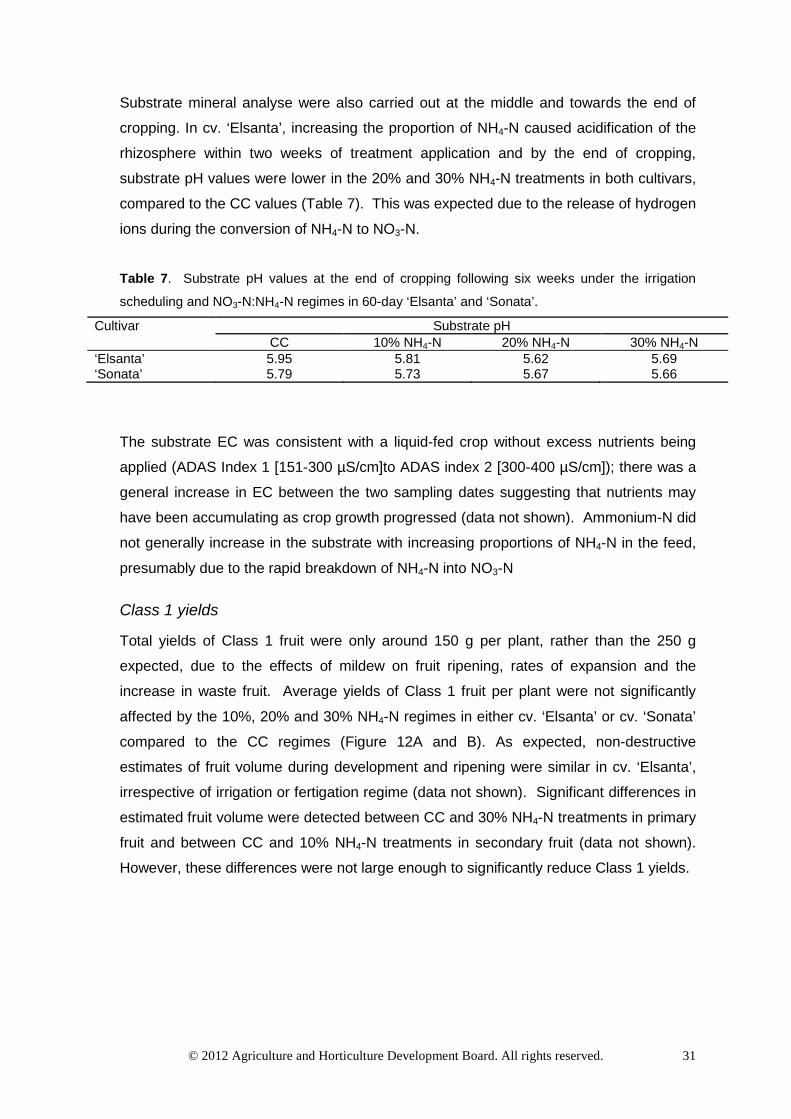
Substrate mineral analyse were also carried out at the middle and towards the end of
cropping. In cv. ‘Elsanta’, increasing the proportion of NH4-N caused acidification of the
rhizosphere within two weeks of treatment application and by the end of cropping,
substrate pH values were lower in the 20% and 30% NH4-N treatments in both cultivars,
compared to the CC values (Table 7). This was expected due to the release of hydrogen
ions during the conversion of NH4-N to NO3-N.
Table 7. Substrate pH values at the end of cropping following six weeks under the irrigation
scheduling and NO3-N:NH4-N regimes in 60-day ‘Elsanta’ and ‘Sonata’. Cultivar Substrate pH CC 10% NH4-N 20% NH4-N 30% NH4-N ‘Elsanta’ 5.95 5.81 5.62 5.69 ‘Sonata’ 5.79 5.73 5.67 5.66
The substrate EC was consistent with a liquid-fed crop without excess nutrients being
applied (ADAS Index 1 [151-300 µS/cm]to ADAS index 2 [300-400 µS/cm]); there was a
general increase in EC between the two sampling dates suggesting that nutrients may
have been accumulating as crop growth progressed (data not shown). Ammonium-N did
not generally increase in the substrate with increasing proportions of NH4-N in the feed,
presumably due to the rapid breakdown of NH4-N into NO3-N
Class 1 yields
Total yields of Class 1 fruit were only around 150 g per plant, rather than the 250 g
expected, due to the effects of mildew on fruit ripening, rates of expansion and the
increase in waste fruit. Average yields of Class 1 fruit per plant were not significantly
affected by the 10%, 20% and 30% NH4-N regimes in either cv. ‘Elsanta’ or cv. ‘Sonata’
compared to the CC regimes (Figure 12A and B). As expected, non-destructive
estimates of fruit volume during development and ripening were similar in cv. ‘Elsanta’,
irrespective of irrigation or fertigation regime (data not shown). Significant differences in
estimated fruit volume were detected between CC and 30% NH4-N treatments in primary
fruit and between CC and 10% NH4-N treatments in secondary fruit (data not shown).
However, these differences were not large enough to significantly reduce Class 1 yields.

© 2012 Agriculture and Horticulture Development Board. All rights reserved. 32
A) 'Elsanta' Class 1
Frui
t fre
sh w
eigh
t (g)
0
50
100
150
200
0
50
100
150
200
B) 'Elsanta' Class 2 and waste
10% NH4-N
20% NH4-N 30% NH4-N
CC
0
50
100
150
0
50
100
150
C) 'Sonata' Class 1 D) 'Sonata' Class 2 and waste
10% NH4-N 20%NH4-N30% NH4-N
CC
Irrigation or NO3-N:NH4-N regime
Figure 12. The effects of the irrigation and NO3-N:NH4-N regimes on yields in 60-day A) ‘Elsanta’ and B) ‘Sonata’ plants. Results are means of eight replicate plants per treatment, vertical bars are LSD values at p<0.05.
Fruit quality and shelf-life potential
Berry firmness was unaffected in either cultivar by the irrigation and fertigation regimes
(Figure 13) and no treatment effect on berry SSC was detected (Figure 14), although
SSC were higher in tertiary fruit.
Berr
y fir
mne
ss (N
)
0
1
2
3
4
5
18/0811 24/08/11 02/08/11
30% NH4-NCC 10% NH4-N 20% NH4-N
Date
0
1
2
3
4
5
10% NH4-N 20% NH4-N 30% NH4-NCC
A)
B)
Figure 13. The effects of the irrigation and NO3-N:NH4-N regimes on berry firmness in 60-day A)
‘Elsanta’ and B) ‘Sonata’. Results are means of eight replicate plants per treatment, vertical bars
are LSD values at p<0.05.

© 2012 Agriculture and Horticulture Development Board. All rights reserved. 33
Due to the low numbers of suitable Class 1 fruit, only two shelf-life assessments were
carried out in 2011. Rates of water loss from cv. ‘Elsanta’ berries harvested from the
20% and 30% NH4-N regimes were slowed compared to CC values in the second shelf-
life test; no significant treatment effects were detected in the first shelf-life test (data not
shown). Berry susceptibility to bruising and the development of rots were similar,
irrespective of irrigation or fertigation regime, in both shelf-life tests (data not shown). No
significant treatment effects were detected in either shelf-life test with cv. ‘Sonata’ (data
not shown).
Solu
ble
solid
s co
nten
t (%
BRIX
)
0
2
4
6
8
10
12
0
5
10
15
18/0811 24/08/11 02/08/11
Date
30% NH4-NCC 10% NH4-N 20% NH4-N
10% NH4-N 20% NH4-N 30% NH4-NCC
A)
B)
Figure 14. The effects of the irrigation and NO3-N:NH4-N regimes on soluble solids content
(BRIX) in 60-day A) ‘Elsanta’ and B) ‘Sonata’. Results are means of eight replicate plants per
treatment, vertical bars are LSD values at p<0.05.
Water and fertiliser use
The volume of irrigation applied to each plant under each of the three irrigation regimes
is presented in Table 2. Scheduling irrigation to match demand with supply so that run-
off was minimised or eliminated resulted in water savings of up to 42% and 45% for cv.
‘Elsanta’ and cv. ‘Sonata’ respectively, compared to the CC treatments where run-off
averaged 20% over the season.
Water productivity values were also calculated for each irrigation regime and for each
cultivar (Table 8). The volume of water applied was first recorded from Day 0 (27 July
2011) and so the WP values do not include water that was used to wet up the substrate

© 2012 Agriculture and Horticulture Development Board. All rights reserved. 34
bags, water that was applied via overhead irrigation or the water that was applied during
the first three weeks of plant development before the irrigation regimes were imposed.
Consequently, the calculated WP values are artificially low although the low yields of
class 1 fruit will have offset this to some extent. Nevertheless, the WP values indicate
the potential of using irrigation scheduling to reduce the volume of water used to produce
1 kg of class 1 fruit. Typical grower WP values are not yet known for substrate-grown
strawberries but will be measured on two grower sites during 2012 in HDC project SF
136. Table 8. Water productivity values associated with irrigation and NO3-N:NH4-N regimes for 60-
day cv. ‘Elsanta’ and cv. ‘Sonata’ Cultivar Water productivity (L per kg class 1 fruit) CC 10% NH4-N 20% NH4-N 30% NH4-N ‘Elsanta’ 48.6 38.0 42.6 36.3 ‘Sonata’ 78.4 49.4 69.2 51.3
Since plants were fertigated at each irrigation event, the total amounts of the macro- and
micro-nutrients applied to each bag were reduced in proportion to the irrigation volume.
Consequently, fertiliser savings of between 15% and 45% were achieved using the
irrigation scheduling regimes to reduce or eliminate run-off. The total amounts of N, P,
K, Ca and Mg applied during the season to cv. ‘Elsanta’ and cv. ‘Sonata’ plants under
the CC regime are presented in Table 9. Under water-saving irrigation regimes, feed
recipes will have to be modified to compensate for the reduced inputs.
Table 9. Total mass of macro nutrients applied via fertigation per plant for 60-day cv. ‘Elsanta’
and cv. ‘Sonata’ under the different irrigation and NO3:NH4 regimes Element Total mass of nutrient applied per plant (g) ‘Elsanta’ ‘Sonata’ CC 10%
NH4-N 20%
NH4-N 30%
NH4-N CC 10%
NH4-N 20%
NH4-N 30%
NH4-N Total N 4.7 4.0 3.3 2.7 6.4 3.7 5.0 3.5 NO3 - N 4.2 3.6 2.7 1.9 5.8 3.3 4.0 2.5 NH4 - N 0.5 0.4 0.7 0.8 0.6 0.4 1.0 1.1 P 1.4 1.2 1.0 0.8 2.0 1.1 1.5 1.1 K 7.8 6.6 5.6 4.5 10.7 6.1 8.4 5.9 Ca 4.7 4.0 3.3 2.7 6.4 3.7 5.0 3.5 Mg 1.0 0.9 0.7 0.6 1.4 0.8 1.1 0.8
Additional experiment in 2011
Water and fertiliser savings of 6%, 33% and 9% were delivered by the irrigation
scheduling, RDI and TDI treatments, respectively. Class 1 yields per plant were similar
in main season plants under the Commercial Control, the irrigation scheduling and the
TDI regimes (~512 g per plant). However, yields of Class 1 fruit were reduced by 19% in
RDI-treated plants, due to a reduction in fruit size rather than fruit number. Berry organic

© 2012 Agriculture and Horticulture Development Board. All rights reserved. 35
acid, glucose and fructose concentrations and the sugar:acid ratio were significantly
increased by the irrigation scheduling and TDI regimes, compared to CC values and
although SSC values were generally higher, the differences were not statistically
significant (data not shown). The percentage of berries developing rots during shelf-life
tests was also reduced by the irrigation scheduling, RDI and TDI treatments (data not
shown).
Discussion
Experiments in 2009 and 2010
In the first two years of the project, irrigation scheduling and RDI regimes were imposed
on 60-day and main season cv. ‘Elsanta’ and cv. ‘Sonata’ plants. An irrigation
scheduling regime that matches demand with supply and so minimises or eliminates run-
off was developed using irrigation set points based on volumetric substrate moisture
contents (VSMC). In 2009 with 60-day crops, water and fertiliser savings of up to 45%
were achieved without reducing yields of Class 1 fruit, although total yields were low due
to the effect of the x10 strength potassium bicarbonate spray applied in error.
Despite the reduced nutrient inputs, foliar concentrations of N, P, K, Mg, Mn, Fe, Zn, B
and S were within satisfactory ranges in each cultivar under each irrigation regime
,although concentrations of Ca and Cu were just below satisfactory values by the end of
the cropping season. RDI reduced total leaf areas by 20% and 39% in cv. ‘Elsanta’ and
cv. ‘Sonata’, respectively, and the percentage of cv. ‘Sonata’ fruit that developed bruising
over a 6-day shelf-life test was reduced from 45% in Commercial Controls to 15% by
RDI. However, substrate EC was increased by 20% under the RDI regime by the end of
the growing season.
In 2010, RDI regimes were imposed successfully on main season cv. ‘Elsanta’ and cv.
‘Sonata’ plants and physiological responses to substrate drying such as lowered
stomatal conductances, transpiration rates, leaf growth and photosynthetic rates were
detected. Total canopy areas were reduced by up to 58% and 62% in RDI-treated cv.
‘Elsanta’ and cv. ‘Sonata’, respectively. However, Class 1 yields were also significantly
reduced in RDI-treated plants compared to CC values (449 g vs 231 g). Although these
strategic experiments have shown that RDI has the potential to deliver significant water
and fertiliser savings, as well as improvements in fruit quality, the technique would be
difficult to implement in commercial production. Maintaining the substrate within the
target upper and lower VSMC thresholds under high evaporative demand would be

© 2012 Agriculture and Horticulture Development Board. All rights reserved. 36
challenging due to the limited substrate volumes (3-4 L per plant) and this would
increase the risk of shoot water deficits and associated reductions in Class 1 yields and
quality.
Although run-off was eliminated and water and fertiliser savings of 50% were achieved
by implementing the irrigation scheduling technique, main season cv. ‘Elsanta’ and cv.
‘Sonata’ Class 1 yields were reduced by 27% and by 13%, respectively, compared to the
Commercial Control regime. This was due to a reduction in fruit size rather than fruit
number, and presumably resulted from temporary limitations in substrate water
availability under high evaporative demands. Therefore, the VSMC irrigation set points
were adjusted for the 2011 experiments (see below).
Developing approaches to help improve irrigation scheduling
The new irrigation scheduling regime that has been developed in SF107 (and WU0110)
has great potential to further improve the economic and environmental sustainability of
substrate soft fruit production in the UK. Managing the volume of run-off throughout the
fruit development under changeable evaporative demands in crops of different ages is
challenging for commercial growers. Manually collecting and measuring run-off volumes
in each block of substrate crop in time to inform irrigation decisions can be time
consuming and an automated system that enabled irrigators to react quickly to differing
evaporative demands would help to deliver significant water and fertiliser savings. The
system developed in this project enables data on water inputs and outputs to be
accessed remotely so that the percent run-off after each irrigation event can be
calculated. This information can then be used to highlight times of the day when run-off
is excessive and the duration of these events can then be adjusted to reduce water and
fertiliser losses.
Feed regimes may need to be adjusted in some cultivars to account for the reduced
input of fertilisers when irrigation is scheduled to match demand with supply. Continuous
monitoring of VSMC also ensures that water availability does not become limiting once
run-off volumes have been reduced. The potential build-up of salts under these water-
and fertiliser-saving strategies can also be monitored using EC probes, and managed by
flushing through with acidified water or dilute calcium nitrate solutions if needed. During
these scientific trials equipment from three different manufactures has been used to build
an automated irrigation system that enables precise control of run-off. For commercial
exploitation these systems need to be integrated into a single controller unit. The
necessary components of this system are currently being identified in a new follow-on

© 2012 Agriculture and Horticulture Development Board. All rights reserved. 37
HDC project (SF 136).
Scheduling irrigation based on estimates of evaporative demand can be a very effective
way of irrigation scheduling and much of EMR’s work over the last twelve years has
been developed using this approach. If ETP is calculated for the previous 24 h period, as
was done here, and irrigation is applied to replace the estimated volume of water lost
during that time, significant variations in VSMC can result if ETP is very different on
successive days. For example, if a cloudy day (low ETP) is followed by a very hot and
sunny day (high ETP), the volume of water applied to replace that lost on the cloudy day
will be insufficient to match demand on the sunny day and VSMC will fall temporarily until
the next day. The converse is also true in that significant run-off may result on a cloudy
day where the ETP on the previous day has been very high. These issues can be largely
overcome if daily irrigation events are scheduled to replace the water estimated to have
been lost since the last irrigation event. This, albeit time-consuming, approach was done
in our earlier strategic Defra-funded work (HH3609TX) and allows precise control over
irrigation scheduling. The potential to use measurements of VPD to deliver volumes of
irrigation using a commercial rig that matches demand throughout the day will be tested
in the trial at New Farm Produce Ltd in HDC project SF 136.
Manipulating N nutrition
The aim of this work was to test the potential of manipulating ammonium-N (N-NH4) and
nitrate-N (N-NO3) ratios to try to improve berry firmness and shelf-life potential,
particularly in cultivars such as ‘Sonata’ where berries can be soft and vulnerable to
bruising. In this experiment, changing the percentage of ammonium-N from 10% to
either 20% or 30% did not significantly affect plant physiology or fruit quality. In previous
work10,11, higher ratios of NO3-N:NH4-N have been needed to elicit physiological
responses (e.g. 50%:50%, 25%:75%) but during the preparation of the original proposal,
industry representatives felt that ratios greater than 70%:30% would limit fruit yields and
quality. In the 60-day crop in 2011, the different NO3-N:NH4-N regimes were applied for
only six weeks but during that time, no significant treatment differences were observed.
More work is needed to determine the potential of manipulating N nutrition in this way to
improve aspects of fruit quality and flavour.
Increasing the NO3-N:NH4-N ratio has also been shown to improve tolerance to high
salinities in hydroponically-grown tomato15. Interestingly, a NO3-N:NH4-N ratio of 70:30
(as used in HDC project SF 107) did not affect growth and other parameters under
control conditions but improved shoot and root biomass and maintained leaf
© 2012 Agriculture and Horticulture Development Board. All rights reserved. 38
photosystem II (PSII) efficiency under high salinity. These changes were induced via
effects on plant hormone status in response to high salinity.
The impact of substrate soft fruit production on ‘blue water’ quality
The proportion of soft fruit growers moving from soil to substrate production is increasing
rapidly and current industry practice is to irrigate to between 10 and 20% run-off to
prevent the accumulation of potentially damaging salts (e.g. Na+, Cl-) within the
substrate. Since many growers add fertiliser at each irrigation event, this practice results
in large losses of both water and fertilisers and, in fact, exacerbates the build-up of salts
within the substrate. Some water bodies are failing to achieve the environmental
objectives of the Water Framework Directive. Diffuse water pollution is now a bigger
threat to water quality than point source pollution. The EA is concerned about the effects
of substrate-grown soft fruit production on groundwater quality in the south east and
have recently commissioned ADAS to help identify current issues and promote ‘best
practice’. Defra- and HDC-funded research at EMR has demonstrated the potential to
deliver water and fertiliser savings of 45%, compared to current industry practice, without
reducing Class 1 yields and aspects of fruit quality have been improved. EMR’s work
has been highlighted by ADAS as part of the promotion of best practice (Robert Irving,
personal communication). Nevertheless, there is a risk that grower concerns over
perceived problems associated with adequate uptake of essential nutrients and
increased EC in both soils and substrates (due to the accumulation of ‘ballast ions’ e.g.
Na+, Cl-, SO4++) will limit industry uptake of the new water-and fertiliser saving
techniques. Research to identify the critical concentrations of ‘ballast ions’ that limit yield
and quality will enable fertigation to be targeted more precisely and help growers gain
confidence in reducing water and fertiliser inputs.
Benchmarking grower water use efficiency
It is important to be able to relate the volumes of water used to obtain 1 kg of marketable
fruit (the WP value) in these scientific experiments to those achieved by growers under
commercial conditions. This sort of information is vital to establish baseline water use in
the UK soft fruit industry and to identify areas where a relatively minor change of practice
could lead to rapid and significant improvements in water use efficiency. However,
experience has shown that it is very difficult to glean this information from a sufficient
number of growers. Data of this sort will be collected from our two growers partners in
HDC project SF 136 for substrate-grown cv. ‘Elsanta’ and an irrigation questionnaire
designed for substrate soft fruit growers will be prepared. Gathering and collating
information more widely from the UK soft fruit industry on water and fertiliser use

© 2012 Agriculture and Horticulture Development Board. All rights reserved. 39
efficiencies could form the basis of a separate HDC Concept Note; this possibility will be
discussed with the HDC Soft Fruit Research Manager and the HDC Soft Fruit Panel
Chairman.
Cost benefit analysis
In these experiments water and nutrients were delivered to the substrate around each
plant by using four dripper stakes per 0.5-m bag to ensure an even distribution, prevent
dry spots from developing and minimise the likelihood of run-off. However, in
commercial production with 1-m bags, costs associated with doubling the number of
dripper spikes to eight per bag may be prohibitive. These extra costs must be set against
the water and fertiliser savings (see below) to decide whether this approach would be
financially viable. The approach being used in both commercial trials in HDC project SF
136 is to use five 1.2 L per hour drippers per 1-m substrate bag. Some growers are
beginning to switch to this system instead of using a 6 L per hour dripper with four
irrigation spikes per 1-m bag since water would still be supplied to the majority of the
substrate should individual drippers become blocked; these could then be readily and
inexpensively replaced. Clearly, the economics of this approach are justifiable for
commercial production systems.
The reduction in fertiliser use of between 15% and 45% could be expected to deliver
significant cost savings to growers. The Rural Business Research (RBR) 2008/2009
Farm Business Survey for Horticulture Production in England reported average annual
fertiliser costs (across all specialist glass businesses including soft fruit) of £3,250-
£4,500/ha. On this basis, a 15% reduction in fertiliser used could, on average, save
£488-£675/ha while a 45% reduction in fertiliser used could save £1,464-£2,025/ha. The
RBR 2008/2009 survey reported average annual water costs (across all specialist glass
businesses including soft fruit) of £530-£630. This confirms that, generally speaking, the
savings in expenditure on water do not justify expenditure on irrigation scheduling tools.
Growers using mains water would be expected to pay significantly more for water and
there may then be a significant financial benefit to using less water.
However, the reduction in energy use through pumping less water could be significant. If
a grower could save at least £600/ha in fertiliser from the use of an irrigation scheduling
tool, then a cost of at least £300/ha/annum for that scheduling tool would seem
reasonable. A full cost benefit analysis will be carried out using data from the grower
trials at New Farm Produce Ltd and S.H. Chesson Partnership in HDC project SF 136.

© 2012 Agriculture and Horticulture Development Board. All rights reserved. 40
Further research
One aim of this project SF 107 was to try to improve berry firmness and shelf-life
potential by manipulating ammonium-N (N-NH4) and nitrate-N (N-NO3) ratios. Although
this strategy could help to improve fruit quality for those growers who prefer to continue
with ‘insurance irrigation’, berry quality could best be improved by judicious irrigation
scheduling. This work has developed a new irrigation strategy that has successfully
eliminated run-off, delivered water and fertiliser savings of up to 45%, compared to
Commercial Controls.
The irrigation/fertigation strategy now needs to be tested in commercial grower trials to
help ensure relevance to the industry and to take account of differences in water quality
and background EC. This work is being carried out in a newly commissioned HDC
project, SF 136 at two grower sites, SH Chesson Partnership and New Farm Produce
Ltd. The irrigation scheduling approach is readily transferable to raspberry and blueberry
crops, where improvements in water and fertiliser use efficiencies are also needed. A
Concept Note that addresses these issues will be prepared for consideration by the HFC
Soft Fruit Panel in 2012.
Concerns over perceived problems associated with increased EC could limit substrate
growers’ uptake of the new water- and fertiliser-saving techniques being developed in
Defra- and HDC-funded work at EMR. New strategic research is needed to identify
substrate EC values above which fruit yields and quality are reduced and to identify
opportunities to improve fruit quality. Manipulating NO3-N:NH4-N ratios has been
reported to improve tolerance to salinity stress. An outline proposal for strategic R&D
that addresses these issues has been discussed with Defra and the HDC with a view to
submission of a full proposal to Defra in 2012.
Main Conclusions
• Irrigation scheduling and deficit irrigation regimes were imposed successfully on
60-day and main season cv. ‘Elsanta’ and cv. ‘Sonata’ plants
• A new irrigation scheduling strategy has been developed for substrate-grown
strawberries that enables demand to be matched with supply. In this strategy,
irrigation inputs and outputs are monitored continuously using rain gauges and
data loggers with telemetry. This information is used to adjust the timing and
frequency of irrigation so that run-off is eliminated and demand is matched with
supply. Volumetric substrate moisture content and EC are also measured

© 2012 Agriculture and Horticulture Development Board. All rights reserved. 41
continuously to ensure that irrigation is scheduled effectively and substrate EC
levels are controlled adequately once run-off has been eliminated.
• Water savings of between 15% and 45% were delivered using the new irrigation
scheduling strategy, without reducing Class 1 yields. Since nutrients were added
at each irrigation event, fertiliser savings of up to 45% have also been delivered,
without affecting foliar nutrient concentrations or fruit quality
• An RDI regime was developed that limited excessive canopy growth and
improved berry shelf-life potential in 60-day crops. However, Class 1 yields were
reduced by 17% in the main season crops, due to temporary losses of shoot
turgor at high evaporative demands when substrate water availability was limited.
• RDI would be difficult to implement in some commercial production systems
where the accuracy and consistency of water delivery may not be sufficient to
maintain VSMCs between upper and lower set points. Under these
circumstances, the limited substrate volumes (3-4 L per plant) would increase the
risk of shoot water deficits and associated reductions in Class 1 yields and quality
• An automated system has been developed that triggers irrigation automatically
once the VSMC has fallen to a pre-determined lower set point. By adjusting the
frequency and duration of irrigation events, the volume of run-off can be fine-
tuned at different stages of crop development. The system is currently being
tested in commercial grower trials in HDC project SF 136
• Altering the contribution of NH4-N from 10% to either 20% or 30% did not alter
plant physiology or aspects of fruit quality in either cv. ‘Elsanta’ or cv. ‘Sonata’.
Further strategic work is needed to identify the NO3-N:NH4-N ratio that affects
plant physiology and fruit quality attributes. The potential of altering N nutrition to
improve tolerance to salinity stress in substrate soft fruit production should also
be investigated
• Fertiliser savings of between £448 and £2,025 per ha per annum could be
achieved by scheduling irrigation so that run-off was minimised or eliminated
• The potential of using the new irrigation scheduling strategy to reduce water and
fertiliser inputs in commercial strawberry production is currently being tested in
HDC project SF 136
• New fertigation regimes need to be developed for to optimise plant nutrition under
water-saving irrigation strategies

© 2012 Agriculture and Horticulture Development Board. All rights reserved. 42
Knowledge exchange and technology transfer events
2009-2010
• Presentation of the work to the HDC Board on 8 June 2009
• The aims and objectives of the work were discussed during the visit of Rt. Hon.
Hilary Benn MP, Minister for the Environment & Rural Affairs on 20 July 2009
• An overview of the work was presented during the farm tours at Fruit Focus on 22
July 2009
• Presentation of the work to Sainsbury’s food technologists on 16 October 2009
• Presentation of the work to a delegation from ICAR on 4 December 2009
• Presentation of work to West Sussex Fruit Group on 9 December 2009
• Presentation of work to Prof. Ian Crute, AHDB Chief Scientist on 18 December
2009
• Presentation of work at EMRA Pear Day on 25 February 2010
• Regional news broadcasts: BBC South East and Meridian South East
• BBC National News and BBC Breakfast
2010-2011
• Presentation of work to School of Biological Sciences, University of Reading in
May 2010
• Presentation of work to Sainsbury’s / BBSRC in May 2010, EMR
• Presentation of work at Fruit Focus on 20 July 2010, EMR
• Presentation of work to Dr Jerry Knox et al., Cranfield University on 11 August
2010, EMR
• Presentation of work at Warwick-HRI Water Day II on 2 September 2010,
Warwick-HRI
• Presentation of work to Dr Sue Popple, Defra in October 2010, EMR
• Presentation of work to Defra Food and Farming Group in October 2011, EMR
• Presentation of work to Board of Directors, EMR and Stockbridge Technology
Centre on 11 February 2011
• Presentation of work to BBSRC on 15 February 2011, EMR
• Presentation of work at Sainsbury’s / AG Thames Pear Day on 16 February
2011, EMR

© 2012 Agriculture and Horticulture Development Board. All rights reserved. 43
2011-2012
• Presentation of work at Sainsbury’s / AG Thames Pear Day on 16 February
2011, EMR
• An overview of the work was presented at the HDC SF Agronomy Day in Feb
2011, EMR
• Presentation of the work to The Abu Dhabi Food Control Authority, Abu Dhabi in
April 2011, UAE
• Presentation of the work at a Waitrose Innovation Forum in June 2011, Aylesford,
Kent
• Demonstration of work during 5 field tours at Fruit Focus 2011 in July 2011, EMR
• Presentation of the work to the EMR Science Committee in September 2011,
EMR
• Poster presentation at the BerryGardens Annual Technical Conference, Ashford
in Nov 2011
• Presentation of work to a Sainsbury’s soft fruit grower group, Dartford in
November 2011
• Presentation of work to BBSRC during visit to EMR in December 2011
• Presentation at the SSCR / Bulrush Grower Information Day in February 2012,
Dundee
References
1) Knox JW, Kay MG, Weatherhead EK, Burgess C, Rodriguez-Diaz JA (2009)
Development of a Water Strategy for Horticulture. HDC Technical Report
2) HDC Factsheet 06/0: Principles of strawberry nutrition in soil-less substrates,
2007
3) ADAS: Irrigation Best Practice Grower Guide – Top and Soft Fruit (2003)
4) WU0102: A study to identify baseline data on water use in agriculture. ADAS Final
Report 2006.
5) HH3696: Sustainability of UK strawberry crop. Final Report. www.defra.gov.uk
/science/project_data/DocumentLibrary/HH3606NSF/HH3606NSF_3194_FRP.do
c.
6) HH3609TX: Partial rootzone drying: delivering water saving and sustained high
quality yield into horticulture. Lancaster University, East Malling Research,
Unversity of Dundee, 2004-2009. Final Report 2009.
© 2012 Agriculture and Horticulture Development Board. All rights reserved. 44
7) Defra WU0110: Developing novel water-saving irrigation strategies to produce
fruit with more consistent flavour and quality and an improved shelf-life. EMR,
2007-2012. Annual Report 2009.
8) HL0187 / SF 83: Improving water use efficiency and fruit quality in field-grown
strawberry. EMR, 2007-2012. Annual Report March 2008.
9) Terry LA, Chope GA, Bordonaba JG (2007). Effect of water deficit irrigation and
inoculation with Botrytis cinerea on strawberry (Fragaria x ananassa) fruit quality.
Journal of Agricultural and Food Chemistry 55, 10812-10819
10) Tabatabaei SJ, Yusefi M, Hajiloo J (2008) Effects of shading and N)3:NH4 ratio
on the yield, quality and N metabolism in strawberry. Scientia Horticulturae 116,
264-272
11) Tabatabaei SJ, Faterni LS, Fallahi E (2006) Effect of ammoinium:nitrate ratio on
yield, calsium concentration and photosynthesis rate in strawberry. Journal of
Plant Nutrition 29, 1273-1285
12) Sharma RR Sharma, Patel VB Krishna H (2006). Relationship between light,
fruit and leaf mineral content with albinism incidence in strawberry (Fragaria x
ananassa Duch.). Scientia Horticulturae 109, 66-70; 17) MRS 003/002, SCRI,
EMR (2002-2007)
13) Cardenas-Navarro R, Lopez-Perez L, Lobit P, Ruiz-Corro R, Castellanoos-Morales VC (2006). Effects of nitrogen source on growth and development of
strawberry plants. Journal of Plant Nutrition 29, 1699-1707
14) Lieten P (2003) Proceedings of the International Fertiliser Society, 528, 1-20
15) Ghanem ME, Martinez-Andujar C, Albacete A, Pospisilova H, Dodd IC, Perez-Alfocea F, Lutts S (2011). Nitrogen Form Alters Hormonal Balance in Salt-treated
Tomato (Solanum lycopersicum L.). Journal of Plant Growth Regulation 30, 144-
157.
Acknowledgements We are grateful to Mr Michael Daly (The Agrology House) for much helpful technical
advice on fertigation of substrate-grown strawberries and to Prayon UK Ltd for the gift of
the fertilisers used in the first year of this trial.