Project Sunrise Summary of Market Findings
43
Sept 2021 Project Sunrise Summary of Market Findings
Transcript of Project Sunrise Summary of Market Findings

Sept 2021
Project SunriseSummary of Market Findings
2 ©
Notice (Page 1 of 2):
This report (“the Report”) has been prepared in accordance with the proposal agreed between AMR International (“AMR”) and the addressee of the Report (“The Proposal”) and its attached terms and conditions (“Terms and Conditions”).
Background:
The Report has been prepared solely for the use of the addressee of the Proposal, which is the business or entity the sale of which forms the subject matter of the Proposal (“the Business”) (“the Purpose”), or the owners of the Business. Such addressee wishes reliance on this Report to be extended to the eventual purchaser of the Business, along with persons funding the purchase of the Business. Reliance on the Report is permitted only to the addressees and those parties who have signed a Reliance Letter with AMR (“the Authorised Recipients”).
All parties should note that the Report has been prepared solely on the basis of the scope of work contained in the Proposal and not in contemplation of any specific interests or questions that any potential purchaser or funder or other party may have as regards the transaction concerned.
Reliance and Exclusion of Liability
Reliance upon the Report by any party other than an Authorised Recipient, or for any purpose other than the Purpose, will not result in any duty of care or liability on the part of AMR whatsoever and all liability in such circumstances is specifically excluded. Accordingly, any persons other than the Authorised Recipients who seek to rely on the Report do so entirely at their own risk. AMR to the fullest extent permitted by law, excludes all liabilities which may arise to such persons in any event.
For the avoidance of doubt, none of the Proposal, the Terms and Conditions or our Report create any right which is enforceable by any person other than an Authorised Recipient, save (with AMR’s prior written consent only, not to be unreasonably withheld) a successor to or assignee of the rights of an Authorised Recipient.
Our Assumptions
The Report has been prepared in reliance on information provided to AMR from a variety of sources, which may include, but are not limited to, the addressees of the Proposal; the management of the Business; plans and forecasts of the Business and other management and financial reports provided by the management of the Business or their advisers; interviews with parties including the management of the Business, market participants, customers of the Business, and competitors of the Business; public market research; published academic and economic research; and other such sources.
The Authorised Recipients accept that it is reasonable for AMR to have relied on such information sources. AMR accepts no responsibility and will not be liable if any such information relied upon by AMR during the course of completing the Report is subsequently found to be inaccurate.

3 ©
Notice (Page 2 of 2):
The Report is based on information available as at the date of its delivery, and AMR is not liable for, and is under no responsibility to update the Report based on, information which becomes available after this time.
Warranties
The Report consists of factual information on the market and market positioning of the Business, within the terms of reference and approach outlined in the Proposal. Save as aforementioned, AMR gives no representation or warranty, whether express or implied, as to the accuracy or completeness of the Report.
Investment Business
In carrying out our work and in preparing and delivering our Report we do not purport to, and nor do we, carry on any investment business within the meaning of the Financial Services and Markets Act 2000.
In particular, each Authorised Recipient hereby acknowledges that AMR does not give investment advice and that the Report does not constitute investment advice save to the extent that such advice is an essential part of advice given to the addressees of the Proposal during our normal course of business as advisers on commercial strategy and/or in the conduct of commercial due diligence.
The Report and our work preparing and delivering it do not constitute an invitation or inducement to engage in investment activity within the meaning of section 21(1) of the Financial Services and Markets Act 2000.
Without limitation to the foregoing, the Report does not constitute advice as to the merits, wisdom or sufficiency of any consideration or investment envisaged by the addressees of the Proposal, any of the Authorised Recipients or any other person, nor of the method, the timing or the financing of any such investment.
Intellectual Property
AMR retains the entire right, title and interest in, and ownership of any copyright, moral right and any other intellectual property rights attaching to or arising in respect of, this Report.
Applicable Law
This notice shall be governed by and construed in accordance with the laws of England and Wales. The courts of England shall have exclusive jurisdiction to settle any disputes which may arise in connection with the same.
AMR work
AMR’s work was conducted between 3 May 2021 and 18 June 2021
4 ©
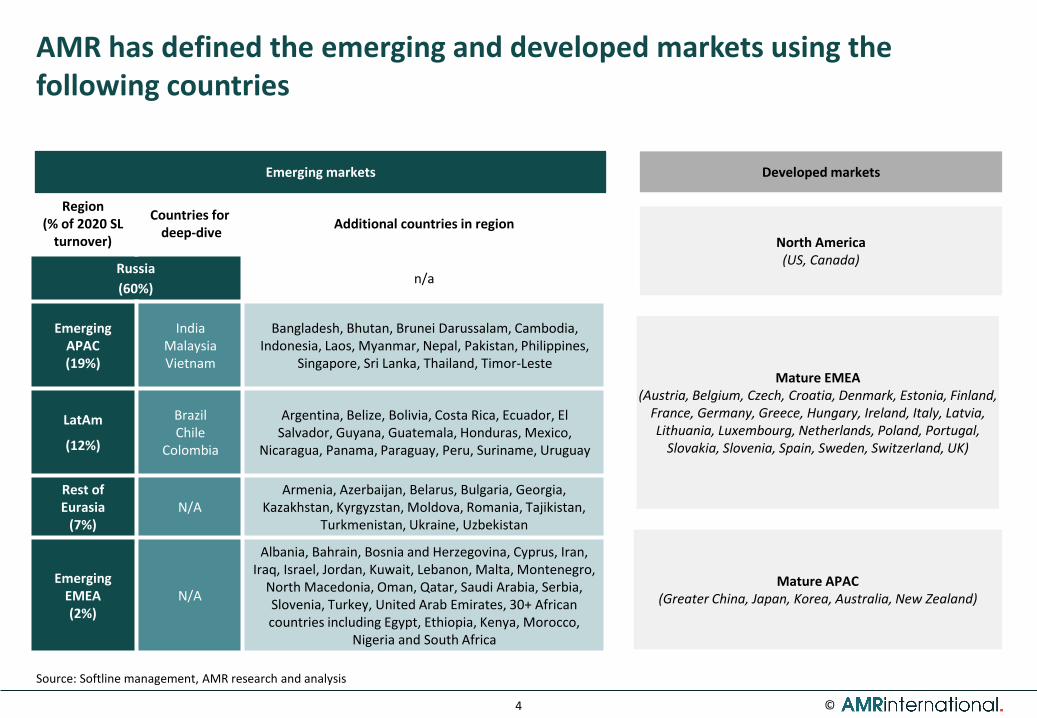
AMR has defined the emerging and developed markets using the following countries
Region(% of 2020 SL
turnover)
Countries fordeep-dive
Additional countries in region
Russia
(60%)n/a
Emerging APAC(19%)
IndiaMalaysiaVietnam
Bangladesh, Bhutan, Brunei Darussalam, Cambodia, Indonesia, Laos, Myanmar, Nepal, Pakistan, Philippines,
Singapore, Sri Lanka, Thailand, Timor-Leste
LatAm
(12%)
BrazilChile
Colombia
Argentina, Belize, Bolivia, Costa Rica, Ecuador, El Salvador, Guyana, Guatemala, Honduras, Mexico,
Nicaragua, Panama, Paraguay, Peru, Suriname, Uruguay
Rest of Eurasia
(7%)N/A
Armenia, Azerbaijan, Belarus, Bulgaria, Georgia, Kazakhstan, Kyrgyzstan, Moldova, Romania, Tajikistan,
Turkmenistan, Ukraine, Uzbekistan
Emerging EMEA(2%)
N/A
Albania, Bahrain, Bosnia and Herzegovina, Cyprus, Iran, Iraq, Israel, Jordan, Kuwait, Lebanon, Malta, Montenegro,
North Macedonia, Oman, Qatar, Saudi Arabia, Serbia, Slovenia, Turkey, United Arab Emirates, 30+ African countries including Egypt, Ethiopia, Kenya, Morocco,
Nigeria and South Africa
Source: Softline management, AMR research and analysis
Emerging markets Developed markets
North America (US, Canada)
Mature EMEA (Austria, Belgium, Czech, Croatia, Denmark, Estonia, Finland,
France, Germany, Greece, Hungary, Ireland, Italy, Latvia, Lithuania, Luxembourg, Netherlands, Poland, Portugal,
Slovakia, Slovenia, Spain, Sweden, Switzerland, UK)
Mature APAC (Greater China, Japan, Korea, Australia, New Zealand)

5 ©
Glossary
Term Definition
3D 3-dimensional
A (e.g., 2018A) Actual
AI Artificial intelligence
APAC Asia Pacific
app Application
AR Augmented reality
ASEAN Association of Southeast Asian Nations
AWS Amazon Web Services
B2B Business-to-business
B2C Business-to-consumer
BI Business intelligence
bn Billion
BPO Business process outsourcing
c. Circa
CAD Computer aided design
CAE Computer aided engineering
CAGR Compound annual growth rate
CAM Computer aided manufacturing
Term Definition
CASB Cloud access security broker
CEE Central and Eastern Europe
CEO Chief executive officer
CFO Chief financial officer
CIO Chief information officer
CISO Chief information security officer
CRM Customer relationship management
CSP Cloud solution providers
CTO Chief technology officer
dev Development
DevOps Development and operations
DM Developed markets
DX Digital transformation
E (e.g., 2020E) Estimate
e.g. Exempli Gratia
EM Emerging markets
EMEA Europe, the Middle East and Africa
EPP Endpoint protection platform

6 ©
Glossary
Term Definition
ERM Enterprise resource management
etc. Et cetera
EV Enterprise value
F (e.g., 2022F) Forecast
FTE Full-time employees
FX Foreign exchange
GCI Global Cybersecurity Index
GDP Gross domestic product
GDPR General Data Protection Regulation (EU law)
GPU Graphic processing unit
GSI Global systems integrator
GTM Go-to-market
GVA Gross value-added
GW Gigawatts
HQ Headquarters
HR Human resources
i.e. Id est
IaaS Infrastructure-as-a-Service
Term Definition
ICT Information, Communications and Technology
ID Identity
IDE Integrated development environment
IDP Intrusion detection and protection
IMF International Monetary Fund
IoT Internet of Things
IPO Initial public offering
IPS Intrusion protection system
ISV Independent software vendor
IT Information Technology
ITSM IT service management
KPI Key performance indicator
LAN Local area network
LatAm Latin America
Lic. License
LSP Licensing solution provider
m Million
M&A Mergers and Acquisitions

7 ©
Glossary
Term Definition
Maint. Maintenance
MDR Managed detection and response
MFA Multi-factor authentication
Mgmt Management
ML Machine learning
MSFT Microsoft
MSP Managed service provider
N/A Not applicable
NAFTA North American Free Trade Agreement
NGFW Next-generation firewall
O&G Oil and gas [industry]
OS Operating system
p.a. Per annum
PaaS Platform-as-a-Service
PC Personal computer
PE Private equity
PPM Project portfolio management
RoE Rest of Eurasia (excluding Russia)
Term Definition
RPA Robotic process automation
SaaS Software-as-a-Service
SAM Software asset management
SI Systems integrator
SME Small and medium enterprises
SVP Senior vice president
Telco Telecommunications [industry]
tn Trillion
UC Unified communications
USD United States Dollars
USMCA US-Mexico-Canada Agreement
UTM Unified threat management
VC Venture capital
VPN Virtual private network
VR Virtual reality
WAP Wireless application protocol
XDR Cross-layers detection and response
yoy Year-on-year

8 ©
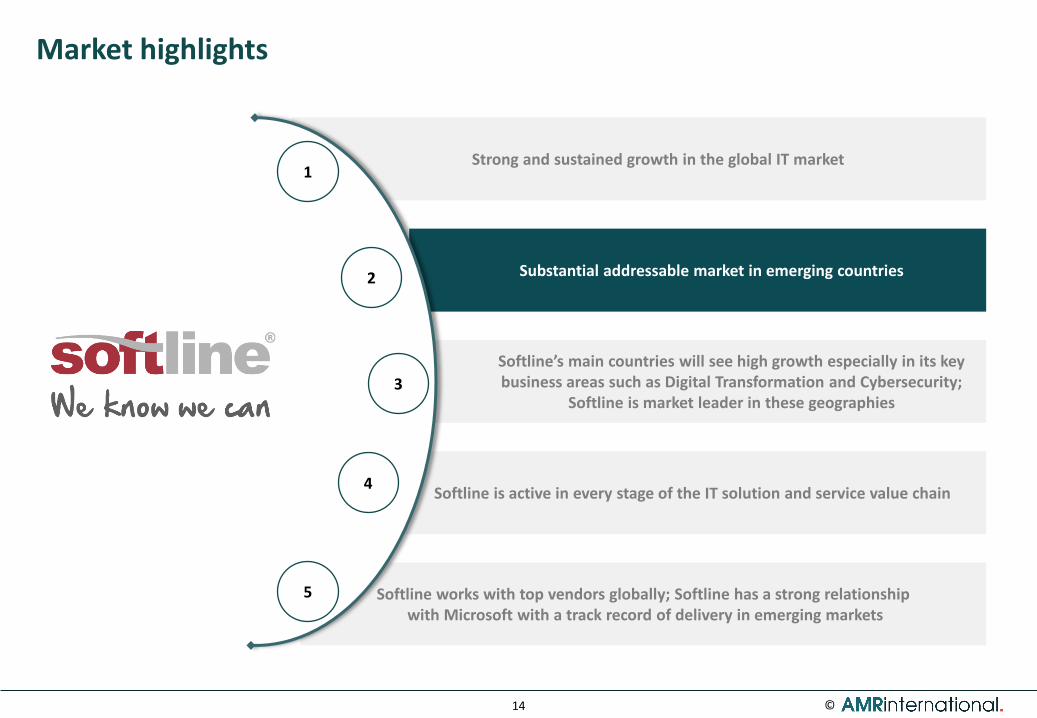
Strong and sustained growth in the global IT market
Substantial addressable market in emerging countries
Softline’s main countries will see high growth especially in its key business areas such as Digital Transformation and Cybersecurity;
Softline is market leader in these geographies
Softline is active in every stage of the IT solution and service value chain
Softline works with top vendors globally; Softline has a strong relationshipwith Microsoft with a track record of delivery in emerging markets
Market highlights
3
2
4
1
5

9 ©
Global IT spending is c. $3.6tn and segments in three ways
Segmentation
Subsegments
Blended-in categories
Solution offering Digital transformation technology Region
Digital transformation
Region
Solution offering
Region Digital transformation
Solution offering
Services CloudSoftware
$1,584bn
Hardware
$960bn $385bn$628bn
Base
$1,793bn
Disruptive
$1,765bn
Developed Emerging
$3,168bn $389bn
Σ = $3.6tn Σ = $3.6tn Σ = $3.6tn
Note: The numbers for hardware, software and service split exclude cloud, which will be covered in detail in section 3.2 as a standalone category
Source: AMR market model, research and analysis
Global ICT spending c. $4.9tn
Global IT spending (c. $3.6tn)Telecom (c. $1.3tn)
(not included in this study)
AMR will provide three distinct segmentations of global IT spending. Each
segmentation encompasses the same
total underlying IT spend
All three segmentations shown have a further
subsegment layer (e.g., types of hardware, software and
services for solution offerings, types of disruptive
technologies, and further country, solution and DX technology breakdowns
within emerging markets)
Market segmentation

10 ©
Global IT spend (excluding cloud) is forecast to grow at 6% CAGR from 2020-24, reaching c. $4.1tn in 2024
Drivers and trends
3,562
595
2,0101,880
628630
904
2022F
1,554
2018A 2024F
1,636
2019A
960
1,584
1,032
2020A
6683,054
1,653
2021F
675
1,131
1,755
679
1,239 1,361
680
2023F
977
3,243 3,172
3,7983,353
4,051+6% -2%+6%
CAGR (%)
Segments 18-19 20-24F
Hardware 5.7% 2.0%
Software 8.1% 9.1%
Services 5.3% 6.7%
CAGR (%)
Segments 18-19 20-24F
Infrastructure 3.0% 5.0%
Network equipment 7.0% 3.4%
Devices 6.1% (0.7%)
System infrastructure software 6.1% 6.1%
Application dev. and deployment 9.4% 10.2%
Applications 8.4% 9.8%
Project oriented 5.1% 8.0%
Managed services 6.6% 8.0%
IT outsourcing 6.7% 7.1%
Support services 2.6% 2.4%
149
80
2019A
108
2018A
86
109
143
81
11293
2020A
151
2022F
91
100
336
2021F
157
99
105
162
108
165
2023F
118
2024F
151
109
346317
342 361 379 395+3% -8%
+6% CAGR (%)
Segments 18-19 20-24F
Hardware 1.8% 3.6%
Software 7.2% 9.9%
Services 1.1% 4.7%
▪Global slowdown in growth observed in 2020 attributed to Covid. Strong growth above pre-Covid levels is expected in the next four years as markets bounce back from Covid
▪ Emerging market services 2020-24 CAGR appears low, however if including cloud services the number significantly rises to 8.7%
Global IT spend breakdown by solution (excl. cloud), 2018-2024 ($bn)1
Note: 1Numbers for both global and emerging markets exclude cloud spend, which is expected to rise dramatically in the forecast period
Source: AMR market model, research and analysis
Global IT spending ($bn)
EM IT spending ($bn)
11 ©
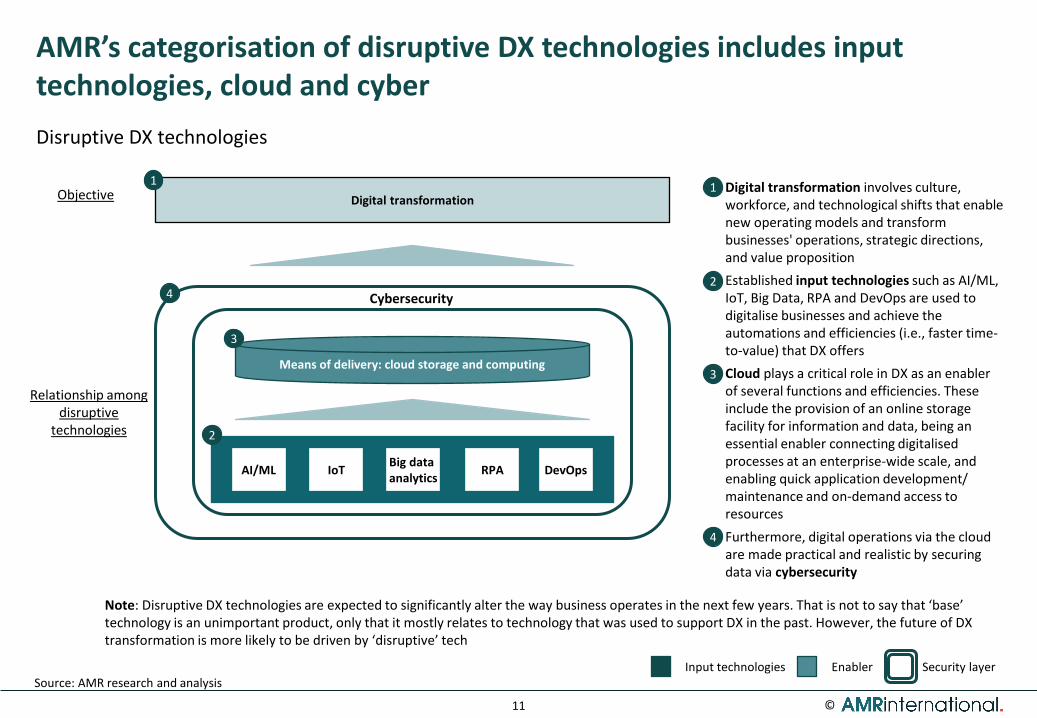
AMR’s categorisation of disruptive DX technologies includes input technologies, cloud and cyber
Digital transformation
Means of delivery: cloud storage and computing
AI/ML RPAIoTBig data analytics
DevOps
Cybersecurity
▪Digital transformation involves culture, workforce, and technological shifts that enable new operating models and transform businesses' operations, strategic directions, and value proposition
▪ Established input technologies such as AI/ML, IoT, Big Data, RPA and DevOps are used to digitalise businesses and achieve the automations and efficiencies (i.e., faster time-to-value) that DX offers
▪ Cloud plays a critical role in DX as an enabler of several functions and efficiencies. These include the provision of an online storage facility for information and data, being an essential enabler connecting digitalised processes at an enterprise-wide scale, and enabling quick application development/ maintenance and on-demand access to resources
▪ Furthermore, digital operations via the cloud are made practical and realistic by securing data via cybersecurity
Disruptive DX technologies
Source: AMR research and analysisInput technologies Security layerEnabler
1
2
3
4
1
2
3
4
Objective
Relationship among disruptive
technologies
Note: Disruptive DX technologies are expected to significantly alter the way business operates in the next few years. That is not to say that ‘base’ technology is an unimportant product, only that it mostly relates to technology that was used to support DX in the past. However, the future of DX transformation is more likely to be driven by ‘disruptive’ tech

12 ©
DX is supported by many technologies
Base
Disruptive
Segmentation by DX technology
DX technology segmentation
2
Cybersecurity
Cloud
AI/ML
IoT
Big data analytics
RPA
Dev Ops
Note: This segmentation does not exclude the solution view presented earlier. That is built-in in this segmentationSource: AMR market model
∑ = $3.6tn
▪Disruptive technology: tools that are most commonly considered central to achieving digital transformation (DX) efforts
▪ Base technology: tools that contribute to an enterprises’ overall IT system but are supplementary to achieving digital transformation
1,793
1,765
2020A
3,557
Global IT split by technology type ($bn)
Global ICT spending c. $4.9tn
Global IT spending (c. $3.6tn)Telecom (c. $1.3tn)
(not included in this study)

13 ©
Global investment into digital transformation technology was $1.8tn in 2020 and is forecast to grow to c. $3.1tn by 2024 at 16% CAGR
3,557
1,765
1,793
2020A
Disruptive technology:
tools that are most commonly considered central to achieving digital transformation (DX) efforts
Base technology:
tools that contribute to an enterprises’ overall IT system but are supplementary to achieving digital transformation
Global IT split by technology type ($bn)
1,028
2018A
385118 474
318
1,125
2019A
125
2,409
1,255
2020A
175
136
1,434
2,753
2021F
148 833
577
3,148
1,684
2022F
108
2023F
695
1,897 2,140
2024F
161
260
1,765
1,396
1,561
2,044+12%+13%
+16%Global DX spending ($bn)
CAGR (%)
Segments 18-19 20-24F
Cybersecurity 9.3% 8.8%
Cloud 22.4% 21.3%
Input tech 9.4% 14.3%
EM DX spending ($bn)²
2023F
101
149
2018A
2828
110
196
2019A
3135
121
2020A
35
318
46
140
23 228
41
2024F
59166
169
2022F
47
76
25
53
95
375
2021F
187221
270
+12%+13%
+19%
Note: 1 Sum excludes base technologies. Adding those to DX would total c. $3.6tn; ²Sum of segments may not equal total due to roundingSource: AMR market model, research and analysis
Global and emerging market DX spend breakdown, 2018-2024 ($bn)1
CAGR (%)
Segments 18-19 20-24F
Cybersecurity 14.0% 13.9%
Cloud 21.2% 28.3%
Input tech 8.8% 17.1%
14 ©
Strong and sustained growth in the global IT market
Substantial addressable market in emerging countries
Softline’s main countries will see high growth especially in its key business areas such as Digital Transformation and Cybersecurity;
Softline is market leader in these geographies
Softline is active in every stage of the IT solution and service value chain
Softline works with top vendors globally; Softline has a strong relationshipwith Microsoft with a track record of delivery in emerging markets
Market highlights
3
2
4
1
5

15 ©
AMR estimates the size of Softline’s addressable geographic market at $352bn in 2020
Note: 1Emerging regions include: Russia, Latin America, Emerging APAC, Rest of Eurasia and Emerging EMEA. Core countries include: India, Brazil, Russia, Malaysia, Colombia, Chile and VietnamSource: AMR market model, research and analysis
Addressable market sizing methodology ($bn)
2020
3,557
2020
3,557
389
3,168
2020
352
Global IT market sizeGlobal IT market size split by emerging and mature regions
SL’s geographic addressable IT market (emerging regions1)
Addressable IT market split by each emerging region
Global market for all IT products excluding
telecommunications
Splitting the global IT market by spend in developing and emerging regions as defined
earlier
Addressable emerging market is the total emerging IT market excluding business process
outsourcing and service provider network infrastructure spend
Splitting the addressable emerging market by spend in
each emerging region
111
109
106
21 5
2020A
352
Rest of Eurasia
Russia
Emerging EMEA
Latin America
Emerging APACDeveloped
Emerging

16 ©
Emerging market growth segments and drivers
Several solution and DX technology segments are expected to achieve very high growth in emerging markets between 2020-24F
Note: Sum of DX tech segments or solution segments displayed does not come to $352bn as base technologies and hardware are excluded (as they are not high growth segments)Source: AMR research and analysis
Major growth segment
Commentary2020-24F
CAGR2020 size
($bn)
Software
Services
Input technology
Cloud
▪Growth in software spending in emerging markets is likely to be driven by increased customer digital advancement, leading to:
‒ A greater need for data management solutions, enterprise software and other CRM systems, as well as e-commerce and remote selling management software
▪ Services growth in emerging markets is expected to be accelerated by Covid-19 and driven by:
‒ Increasing complexity of solutions required to update legacy IT systems and support digitalisation efforts
‒ Increasing need for cybersecurity in the form of managed security services
▪AI is expected to be the main growth driver: rising adoption of mobile enables more AI use-cases (e.g., via AI-enabled services, mobile banking etc.)
▪ IoT, which comprises the largest proportion of input technology, is expected to be highly applicable to emerging markets, as applications can provide viable ways to overcome deficits in existing infrastructure
▪Due to strict data sovereignty and security measures, emerging markets have typically not used hyperscalers resulting in the emergence of many local cloud providers
▪However, this is likely to change: the pandemic has instilled an urgency to use cloud to scale and leverage the investments/innovations of public cloud providers
▪Developing financial markets, greater digitisation (especially cloud adoption), government incentives and recent high-profile attacks are among the most relevant drivers
▪ Cybersecurity spend in emerging markets has been totally resilient during the pandemic, due to the need to protect more attacks stemming from accelerated digitisation and work from home setups
Cybersecurity
Solu
tio
n s
egm
en
tsD
X t
ech
no
logy
se
gme
nts
9.8%
4.7%
17.1%
28.3%
13.9%
81
93
121
35
31

17 ©
Forecast
Forecast
The pursuit of DX and efforts in adapting to post-Covid remote working culture are expected to drive EM hardware spending at 4% CAGR
Addressable hardware market
2018A 2019A 2022F2020A 2021F 2023F 2024F
151149 143 151 157 162 165
+2% -5% +4%
90
53
2018A
95
56
93
56
2019A 2021F2020A
95
56
99
58
2022F
102
60
2023F
104
61
2024F
149 151 143 151 165157 162
Addressable market hardware spending ($bn)
Secondary Core
Source: AMR market model, research and analysis
Addressable market hardware spending: SL core vs secondary countries ($bn)
▪Hardware spending across EM markets increased slowly between 2018-19 at 2% CAGR, attributed to countries amongst the different beginning stages of DX gradually shifting spend towards software and services
▪However, Covid-19 has reignited demand for hardware (mostly devices e.g., PCs, tablets, laptops) to support necessary user equipment, network and data storage and architecture needed for remote working
▪ Additionally as countries resume their DX efforts, spend towards infrastructure, wireless network equipment and servers are likely to drive spend in the forecast period
▪ Softline’s core and secondary addressable markets are expected to see growth in hardware spend at 3.5% and 3.7% CAGR respectively between 2020-24
▪ The nature of hardware spend will vary by the different stages of DX and IT market characteristics (e.g., government support, industry sector concentrationetc.)
▪ Less advanced countries such as Vietnam and Colombia are likely to see a sustained increase in hardware spend for the next 1-3 years before it’s gradually substituted for software and service spend
CAGR 2020-24F
3.7%
3.5%

18 ©
Forecast
Forecast
ERP, CRM and e-commerce applications are expected to drive software spend at 10% CAGR as EM regions undergo digitalisation
Addressable software market
2021F2018A
9986
2023F2022F2019A 2020A 2024F
818091
108118+7% -6%
+10%
51
29
52
43
75
29
2018A
31
55
2019A 2020A
58
33
2022F2021F
63
36
69
39
2023F 2024F
108
80 86 8191 99
118
Addressable market software spending ($bn)
Addressable market software spending: SL core vs secondary countries ($bn)
Secondary Core
Source: AMR market model, research and analysis
▪Growth in software spending is likely to be across several fronts:
‒ Digital advancement of businesses will increase emphasis on data management solutions, enterprise software and other CRM systems as countries in EM wrestle with the enhanced software needs associate with a digitally advancing economy
‒ Increased migration to cloud will support application development deployment software segment, as user and language requirements will need cloud services and applications to be synced with local platforms and other local enterprise systems
‒ E-commerce and remote selling management software is also expected to see uptick in sales driven by Covid and parallel rise in digitalisation across economies
▪ Core and secondary markets are expected to see 10.0% and 9.7% CAGR respectively in software spending over the forecast period
▪Within EM, more advanced countries such as India, Malaysia, Brazil and Russia, growth in software is likely to mirror the overall EM software growth as these countries have the infrastructure to support rapid software growth
▪However, other countries with relatively basic IT infrastructure will take longer (3-5 years) to see similar acceleration of software spend
CAGR 2020-24F
9.7%
10.0%

19 ©
Forecast
Forecast
The focus of rising services spend is set to include systems implementation and managed security services
Addressable services market
Source: AMR market model, research and analysis
2018A 2019A 2023F2022F2020A 2024F2021F
108 10993 100 105 109 112
+1% -14% +5%
109 109
40
6254
2018A
46
2023F
63
47
2019A 2022F2020A
58
43
2021F
60
45
62
47
64
48
2024F
108 10093105 112
Secondary Core
Addressable market services spending ($bn)
Addressable market services spending: SL core vs secondary countries ($bn)
▪ Focus of IT services spend across countries will vary:
‒ Lack of skilled IT workers is particularly pronounced in emerging EMEA and LatAm region (e.g., Pakistan, Egypt, Argentina, Peru). Demand for basic IT outsourcing and managed services (e.g., systems implementation, integration services etc.) is likely to support spend on services
‒ Other slightly advanced countries such as Malaysia, India, Brazil will experience demand to support digitalisation efforts and manage associated security risks
‒ In general, most EM countries could also serve as attractive location for offshore IT delivery centres serving the local regional, given low cost base
▪Growth in IT services spend is supported by:
‒ Increasing complexity of solutions required to update legacy IT systems and support digitalisation efforts. Project oriented services such as systems implementation and custom application development could be the cornerstone of this spend
‒ Higher governmental and enterprise importance towards risks posed by weak cybersecurity infrastructure supporting the demand for managed security services
‒ Changes in business models and processes led by Covid-19, resulting in demand for IT outsourcing, which offset any decline in spend from lower budgets
CAGR 2020-24F
4.6%
4.9%

20 ©
Addressable market cloud spending ($bn)
Addressable market cloud spending: SL core vs secondary countries ($bn)
Soaring cloud adoption is expected to see the addressable cloud market grow at 28% CAGR 2020-24 reaching $95bn in 2024
Addressable cloud market
Forecast
Forecast
Forecast
Forecast
2023F
35
2019A2018A 2024F
28
2020A 2021F 2022F
23
95
4659
76+21% +26%
+28%
10
2019A
22
6
2020A
17
76
2023F2018A
207
25
1346
68
2021F
17
42
2022F
2854
27
2024F
2335
59
33
95
Core cloud Secondary cloud
▪With increasing cloud adoption in the addressable emerging market, cloud spending is forecast to grow at 28% CAGR from 2020-24F
▪Overall, EMs are mirroring the same trend in cloud evolution that can be observed across more developed markets with SaaS driving growth in the nascent stages and IaaS and PaaS adoption gaining momentum as the market matures
▪Historically, due to strict data sovereignty and security measures, EM countries have not used hyperscalers (i.e. global public cloud providers such as Azure, AWS, Google, Oracle), resulting in the emergence of many local cloud providers
▪However, this is likely to change: the pandemic has instilled an urgency to use cloud to scale and leverage the investments/innovations of public cloud providers
‒ Hyperscale clouds have an advantage over other players due to their provision of services that sit on top of the cloud (e.g., security, data services), and cost efficiencies that come from scale
▪At the same time, part of the demand will still be serviced by private cloud solutions, reflecting demand from the sectors dealing with highly sensitive data
▪Despite the increase in overall cloud spending across the addressable markets, there are varying levels of adoption across regions and countries
▪ In countries with relatively higher levels of cloud adoption (India, Brazil), companies have migrated to hyperscale public cloud while most SMEs and mid-market customer have on-premise private cloud solutions. Overall, in these countries, public cloud represents an increasingly larger share of the overall cloud market despite growth in private cloud
▪ Countries with a basic cloud market (Vietnam, Cambodia etc.) companies mostly adopt ‘off-the-shelf’ public cloud offerings as the remove the need to invest in local infrastructure and management of on-premise services
Source: AMR market model, research and analysis
CAGR 2020-24F
29.7%
27.8%

21 ©
Strong and sustained growth in the global IT market
Substantial addressable market in emerging countries
Softline’s main countries will see high growth especially in its key business areas such as Digital Transformation and Cybersecurity;
Softline is market leader in these geographies
Softline is active in every stage of the IT solution and service value chain
Softline works with top vendors globally; Softline has a strong relationshipwith Microsoft with a track record of delivery in emerging markets
Market highlights
3
2
4
1
5

22 ©
Collectively, emerging markets have substantial IT spend. These regions have the most potential for digital transformation
Geographic segmentation approach
GDP
$20,281bn
Latin America
Russia
Emerging APAC
Emerging EMEA
Rest of Eurasia
Source: AMR market model
Russia: $1,474 bn
Emerging APAC: $6,561 bn
LatAm: $4,425 bn
RoE: $895 bn
Emerging EMEA: $6,926 bn
IT spending
$352.4bn
Russia: $21.4 bn
Emerging APAC: $108.6 bn
LatAm: $105.9 bn
RoE: $5.4 bn
Emerging EMEA: $111.1 bn
Population5.32bn
Russia: 146 m
Emerging APAC: 2.57 bn
LatAm: 597 m
RoE: 171 m
Emerging EMEA: 1.84 bn

23 ©
Higher growth is forecast in emerging countries, attributed to their low maturity and a variety of fundamental market changes
▪All of the regions within addressable markets are expected to grow at over 8% CAGR between 2020-24; higher than the global rate
▪Given low growth rates before pre-Covid, it is likely that these regions are going to go through a period of accelerated growth. This is expected to be driven by their natural progress in maturity leading to structural shifts such as cloud, increasing sophistication of customers, adoption of modern technology, consolidation and modernisation of the value chain, and pent-up demand induced by the pandemic
‒ While some countries in these regions are adopting cutting-edge solutions, growth may also occur as countries strive to ‘catch up’ on basic IT usage
155
150
147
30 7
2024F
490Region
2020-2024FCAGR
IT spending as a % of GDP
Rest of Eurasia
8.0% 0.6%
Russia 8.9% 1.5%
Latin America
8.5% 2.4%
Emerging APAC
8.5% 1.7%
Emerging EMEA
8.7% 1.6%
Global1 8.2%
111
109
106
215
2020A
352
LeadingAcceleratingDevelopingLaggards
IT market maturity
North AmericaMature
EMEA
Mature APAC
Latin America
Rest of Eurasia
China
Emerg. APAC
Russia
Emerg. EMEA
Time
Note: 1Global includes both the developed and emerging regionsSource: AMR market model, research and analysis

24 ©
Softline’s revenue growth has outpaced market growth locally. This is forecast to continue in all regional IT markets in which it is present
111.0 115.4 108.6 119.3 129.1 139.6 150.2
2018A 2022F2019A 2024F2020E 2021F 2023F
(CAGR)
Source: Softline management, AMR market model
2018-19 2019-20 2020-24
(5.9%) 8.5%4.0%IT Market
Softline 55.0%84.4%
Emerging APAC IT market ($bn)
5.4 5.7 5.4 5.9 6.3 6.8 7.3
2020E2019A2018A 2024F2021F 2022F 2023F
(CAGR)2018-19 2019-20 2020-24
(5.3%) 8.0%5.1%IT Market
Softline (0.4%)22.7%
Rest of Eurasia IT market ($bn)
108.5 112.5 105.9 116.5 126.0 136.4 147.0
2023F2022F2020E2018A 2019A 2024F2021F
(CAGR)2018-19 2019-20 2020-24
(5.8%) 8.5%3.6%IT Market
Softline 5.2%(5.9%)
LatAm IT market ($bn)
113.0 117.7 111.1 122.4 132.6 143.9 155.4
2021F2020E2018A 2019A 2024F2023F2022F
(CAGR)2018-19 2019-20 2020-24
(5.6%) 8.7%4.1%IT Market
Softline 27.5%151.9%
Emerging EMEA IT market ($bn)
Above market growth Above market growth
Above market growth Above market growth

25 ©
Russia is an attractive market, with expected high growth rates. Softline is the top solutions provider
21.5 22.7 21.423.7
25.928.1
30.1
2018E 2024F2023F2020E2019E 2021F 2022F
+6% -6%+9%
Russian 2020 KPIs and drivers
1.62.1
2.7
3.9
5.4
7.1
9.1
2018A 2020E 2022F 2024F
+36%
Russian cloud market size (constant $bn)
1.31.4
1.71.9
2.02.1 2.2
2022F2018A 2020E 2024F
+7%
Russian cybersecurity market size (constant $bn)
Source: AMR market model, research and analysis
Population (m)
GDP ($bn)
IT spending as a % of GDP
Hardware as a % of IT spending
Cloud as a % of IT spending
146 1,474 1.5 44.0 12.6
Drivers
▪ The Russian IT market has seen a pronounced shift towards cloud solutions, boosted by the accelerating effects of Covid-19
▪ Demand for public cloud solutions is formed predominately by the tertiary sector, with roughly 80% of use coming from the retail, services (including financial and telco) and government sectors
▪ The government is highly involved in shaping and regulating business processes throughout the economy so market trends follow policy closely. As a result, Russian vendors could be favoured whilst start to gain market shares from foreign vendors
Russian addressable market size (constant $bn)
43%
18%
10%
27%
Softline
Lanit
SoftwareONE
2%Croc
Others
Russian Microsoft solutions market share (%)Indicative

26 ©
India’s IT market is forecast to grow at 8% CAGR, driven by rapid digital transformation
45.1 46.943.4
47.751.6
55.659.5
20242018 20232019 2020 20222021
+4% -7%+8%
Indian 2020 KPIs and drivers
5.47.3
8.811.2
14.6
19.2
24.1
2020E2018A 2022F 2024F
+29%
Indian cloud market size (constant $bn)
1.8 1.92.3
2.63.0
3.33.7
2024F2018A 2020E 2022F
+13%
Indian cybersecurity market size (constant $bn)
Population (m)
GDP ($bn)
IT spending as a % of GDP
Hardware as a % of IT spending
Cloud as a % of IT spending
1,366 2,709 1.6 43.2 21.0
Drivers
▪ India’s public cloud market has been growing at c. 30% p.a., and is now being adopted across all industries
▪ Cybersecurity legislation is being further developed due to a major bank breach. This will encourage companies to increase spending on cybersecurity solutions
▪ Both the public and private sectors are rapidly undergoing digital transformation; beyond cloud, they are also embracing IoT and AI
Indian addressable market size (constant $bn)
21%
18%
11%6%
45%
Sonata
Softline
SoftwareONESify
Others
Indian Microsoft solutions market share (%)
Source: AMR market model, research and analysis
Indicative

27 ©
Malaysia has a relatively mature IT market with strong forecast growth, driven by the increasing adoption of cloud
8.2 8.57.9
8.79.4
10.211.1
2021F2018A 2019A 2020E 2024F2022F 2023F
+3% -8%+9%
Malaysian 2020 KPIs and drivers
1.0 1.1 1.11.3
1.6
2.1
2.8
2018A 2020E 2022F 2024F
+28%
Malaysian cloud market size ($bn)
0.50.6
0.70.8
0.9
1.1
1.3
2024F2018A 2020E 2022F
+15%
Malaysian cybersecurity market size ($bn)
Population (m)
GDP ($bn)
IT spending as a % of GDP
Hardware as a % of IT spending
Cloud as a % of IT spending
32 338 2.3 26.5 14.1
Drivers
▪ Adoption of cloud and cybersecurity solutions is high, particularly among large businesses and MNCs at over 90%. Covid has accelerated spending on these
▪ Four hyperscale CSPs, including Microsoft and AWS, have obtained approval to build in-country data centres, further accelerating cloud adoption
▪ Malaysia is ranked 2nd in APAC for its cybersecurity commitment
Malaysian addressable market size ($bn)
19%
13%
7%
60%
SoftwareONE
2%
CTC
Softline
Crayon
Others
Malaysian Microsoft solutions market share (%)
Source: AMR market model, research and analysis
Indicative

28 ©
Vietnam’s IT market is growing moderately; rapid growth is expected in the medium term when more industries digitalise
4.9 5.0 4.85.2 5.5 5.9 6.2
2024F2018A 2019A 2020E 2021F 2023F2022F
+3% -4%+7%
Vietnamese 2020 KPIs and drivers
0.7 0.8 0.80.9
1.1
1.3
1.6
2020E2018A 2022F 2024F
+20%
Vietnamese cloud market size ($bn)
0.10.1
0.10.2
0.2
0.2
0.2
2018A 2020E 2022F 2024F
+15%
Vietnamese cybersecurity market size ($bn)
Population (m)
GDP ($bn)
IT spending as a % of GDP
Hardware as a % of IT spending
Cloud as a % of IT spending
96 341 1.4 63.4 16.5
Drivers
▪ Digital transformation is being led by early adopters of tech such as the finance industry, which is investing large amounts into digitalising payment and e-commerce processes
▪ Vietnam’s government has targeted to expand the country’s digital economy from 5% of GDP in 2019 to 30% of GDP in 2030. This is being driven by initiatives to develop local IT talent as well as increase adoption of cybersecurity solutions
Vietnamese addressable market size (constant $bn)
21%
16%
9%5%
49%Others
CMC
HPT
SoftwareONE
Softline
Vietnamese Microsoft solutions market share (%)
Source: AMR market model, research and analysis
Indicative

29 ©
The Brazilian market is growing rapidly, helped by market-leading cloud adoption growth and government reform
42.6 44.4 42.347.0
51.456.2
61.2
2019A 2021F2020E2018A 2024F2022F 2023F
+4% -5%+10%
Brazilian 2020 KPIs and drivers
3.54.8
6.1
8.5
11.6
15.0
18.3
2024F2020E2018A 2022F
+32%
Brazilian cloud market size ($bn)
4.45.1 5.5
6.37.3
8.3
9.6
2018A 2024F2020E 2022F
+15%
Brazilian cybersecurity market size ($bn)
Population (m)
GDP ($bn)
IT spending as a % of GDP
Hardware as a % of IT spending
Cloud as a % of IT spending
213 1,434 2.9 29.6 14.4
Drivers
▪ The pattern of growth in Brazil is similar to that of the rest of the LatAm region, as Covid hampered demand in the short run but accelerated transformation over time
▪ The Brazilian government has implemented successful reform to ensure the digital transformation of the economy
▪ Brazil’s cloud market is experiencing faster growth than most countries, both in the LatAm region and globally
▪ Firms in Brazil are typically ill-prepared for cyber attacks. Rising awareness and updated regulations will contribute to growth
Brazilian addressable market size (constant $bn)
19%
9%
64%
SoftwareONE
Brasoftware
4% 4%Logicalis
SoftlineOthers
Brazilian Microsoft solutions market share (%)
Source: AMR market model, research and analysis
Indicative

30 ©
Colombia’s recent stability supports renewed IT market growth. Cyber is particularly strong at 14% CAGR to 2024
7.2 7.6 7.38.0
8.79.4
10.2
2020E 2022F2018A 2019A 2021F 2023F 2024F
+6% -4%+9%
Colombian 2020 KPIs and drivers
1.3 1.4 1.41.6
2.1
2.6
3.3
2022F2020E 2024F2018A
+23%
Colombian cloud market size ($bn)
0.70.9
0.91.1
1.21.4
1.6
2018A 2024F2020E 2022F
+14%
Colombian cybersecurity market size ($bn)
Population (m)
GDP ($bn)
IT spending as a % of GDP
Hardware as a % of IT spending
Cloud as a % of IT spending
51 271 2.7 49.9 19.8
Drivers
▪ The Colombian IT market is less mature than most of LatAm, however this is changing as software spending is expected to grow at 13% p.a.
▪ Continued political stability is key to sustained IT market growth in Colombia as the public sector is the largest IT spender
▪ Colombia’s public cloud market is expected to grow at 30% p.a., spurred by increasing trust in off-premise data storage
▪ Colombia developed a national cybersecurity strategy ahead of its neighbours, so spending growth rates have been strong
Colombian addressable market size (constant $bn)
19%
17%
15%11%
38%
SoftwareONE
Globant
Others
SoftlineSonda
Colombian Microsoft solutions market share (%)
Source: AMR market model, research and analysis
Indicative

31 ©
Chile’s economy is going through rapid transformation as a result of the effects of Covid
5.8 5.9 5.66.1
6.67.1
7.7
2023F2018A 2020E2019A 2024F2021F 2022F
+3% -5%+8%
Chilean 2020 KPIs and drivers
0.8 0.9 0.91.0
1.3
1.6
1.9
2022F2018A 2020E 2024F
+23%
Chilean cloud market size ($bn)
0.60.7 0.7
0.80.9
1.1
1.2
2018A 2020E 2022F 2024F
+13%
Chilean cybersecurity market size ($bn)
Population (m)
GDP ($bn)
IT spending as a % of GDP
Hardware as a % of IT spending
Cloud as a % of IT spending
19 253 2.2 43.6 15.1
Drivers
▪ Chile is a small but rapidly developing market, with 8% CAGR expected, driven by explosive cyber and cloud spend growth
▪ It has been slow to adopt technologies indicative of digital transformation, but Covid has accelerated the pace of change
▪ The awareness of the cyber threat has been low in Chile. Outdated laws have failed to boost cyber adoption
‐ However, cyber has become an important item on the political agenda, following several high-profile cyber attacks
Chilean addressable market size (constant $bn)
40%
33%
15%
8%
Sonda
SoftwareONEDatco
Softline
Others
4%
Chilean Microsoft solutions market share (%)
Source: AMR market model, research and analysis
Indicative

32 ©
Strong and sustained growth in the global IT market
Substantial addressable market in emerging countries
Softline’s main countries will see high growth especially in its key business areas such as Digital Transformation and Cybersecurity;
Softline is market leader in these geographies
Softline is active in every stage of the IT solution and service value chain
Softline works with top vendors globally; Softline has a strong relationshipwith Microsoft with a track record of delivery in emerging markets
Market highlights
3
2
4
1
5

33 ©
Softline is active in every stage of the IT solution and service value chain
IT solution and service value chain
Major steps
IT consultancies
Global & regional solution & service providers
Systems integrators
Next-gen digital service providers
Managed service providers
Pure-play reseller
IT solution and service delivery to end-customers
Advise & DesignProcure & Purchase
Develop & Build Deploy & DeliverManage & Optimise
Mostly local & regional resellers
Participant type
Source: Softline management, AMR research and analysis Area of focus: High Low

34 ©
The IT procurement value chain is typically two-tier, involving distributors and IT solution providers
Description and
capabilities
IT vendors Distributors IT solution providers End-client
▪ Create the core technology for IT hardware, services and software
▪ Vendors can be specialist or generalist in nature by virtue of their focus in products and services
▪Offer logistics, financial management (exchange rate management, cash collection, import and export admin) and more value-add services such as dedicated sales support (product marketing, packaging, strategic sales guidance) to vendors of IT products and solutions
▪ Provide IT solution specification, installation and configuration, and value-add services such as 1st level support. Typically have direct interaction with end-client
IT procurement value chain1 (illustrative2)
▪ End-users of IT products and solutions
▪ These can range from small and medium companies to large enterprises, as well as government and public entities
Note: 1Only applicable to software and hardware (excluding service and cloud); 2The interactions amongst participants are not always linear; participants can have multiple positionsSource: AMR research and analysis
Example companies
Participant
IT solution and service delivery to end-customers
Advise & Design Procure & Purchase Develop & Build Deploy & Deliver Manage & Optimise

35 ©
There are various types of distributor and solution provider, each with a slightly different service provision focus
Note: 1Softline management assessmentSource: AMR research and analysis
IT procurement participant by sub-types
Category Type Description Softline focus1
Distribution
Value-added distributor
▪ Typically, international distributors with specialised product segment focuses
▪Most offer additional value-added services to vendors and resellers, e.g., marketing and sales support, cash collection etc.
1
Broadliner▪ Typically global distributors with high volume distribution across several product categories
▪Most focused on more mature IT technology segments and vendors and provide a limited service offering 0
IT solution provision
Systems integrator
▪ Typically local resellers who offer products and value-added services (e.g., implementation, IT outsourcing services etc.) to end-customers 2
Pure-play reseller
▪ Firms only specialised in bringing together components (software and hardware) and ensuring that those subsystems function together seamlessly
▪A sub-type is global systems integrators (GSIs), who are typically telecom firms with global reach0
End-to-end solution
providers
▪On top of functions fulfilled by pure-play resellers, end-to-end solution providers provide additional offerings across IT service and solution value chain (IT services, cloud services, distribution, platform or even proprietary IT products as demanded by customers)
4
Managed service
provider (MSP)
▪ MSPs provide outsourced monitoring and management of IT devices and systems
▪ As MSP signs on new customers, they can also be tasked to upgrade customers’ IT set-up, so they can provide procurement of IT solutions for customers
2
Consultancies
▪ Consultancies advise organisations on their use of information technology to meet business objectives, and to improve the structure and efficiency of IT systems
▪ Consultancies can act as an anchor to procure solutions from vendors2
High NoneSoftline focus
The boundaries between reseller sub-types are becoming increasingly blurry. IT solution providers often sit across categories

36 ©
(For details, please refer to IT procurement section)
The IT service value chain encompasses five main steps; global solution and service providers can provide end-to-end offerings
IT service value chain (illustrative)1
Advise & Design Develop & Build Deploy & Deliver Manage & OptimiseKey steps
Description
▪Map out vision and objective of required demand
▪Draw out delivery roadmap and plan for execution considerations
▪ Set goal and anticipate outcome of proposed service
▪Develop offerings to meet agreed needs of the business in terms of costs, quality and delivery times
▪ Build process and service components with requirements and specifications
▪Deliver developed offerings to end-customers and provide support in the transition period
▪ Integrate service components into customers’ existing IT infrastructure and comply with existing protocols
▪ Continuous management of services throughout their lifecycles
▪ Provide support and maintenance to the daily operation and execution of business functions and activities
Relevant services1
Note: 1Based on IDC IT spending taxonomy and the details to the services can be found on the following page; 2Based on Softline management assessment
Source: AMR research and analysis
Procure & Purchase
IT solution and service delivery to end-customers
▪ Based on vision and objective procure appropriate solution from vendors
IT consulting
IT education & training
Custom application dev.System & network
implementation
Software deploy & support
Application management
Hosted infrastructure services
Network & endpoint outsourcing
Hardware deploy & support
end-to-end offerings2

37 ©
Softline claims a strong focus across all types of services
Value chain Type1 Category2 DescriptionSoftline focus3
Advise & Design
IT consultingProject-oriented
Delivery of advice to customers aimed at managing their IT organisation and at improving an organisation's IT performance, infrastructure and related processes 1
IT education and trainingSupport
and training Education of IT-related topics to ensure development of employee competencies and training professionals in business and IT 3
Develop & Build
Custom application developmentProject-oriented
Delivering standalone, custom code sets or software to meet a client's business needs. The services can span the entire application development life-cycle 4
Deploy& Deliver
System and network
implementation
Network consulting and integration Project-
oriented
Building local and wide area data networks including converged wireless, and wireline networks to be propagated across a single, common infrastructure 2
System integrationIntegration of various platforms and technologies. This may include hardware, software, and services and is consumed on-premise, on-demand, or in the cloud 2
IT deploy and support
Hardware deploy and support Support
and training
Deployment services consist of the installation and basic configuration of hardware; support services comprises remote and on-site diagnostics, remediation 3
Software deploy and support
Deployment services consist of the installation and basic configuration of software; support services comprises remote and on-site diagnostics, remediation 3
Manage & Optimise
Technology outsourcing
Application management
Managed services
Managed security services, support services and application of software and hardware 3
Hosted infrastructure services
Managed infrastructure includes establishing LAN, WAPs, and various connections alongside managed backup and storage options. 3
Network and endpoint outsourcing
Outsourcing the support and management of one or more elements of the client/server and network communications infrastructure of an organisation 2
Note: 1Type of services can be mapped on the service value chain across key steps on previous page; 2 Based on IDC IT spending taxonomy; 3Softline management assessment Source: Softline management, AMR research and analysis
IT service by category
High NoneSoftline focus

38 ©
Strong and sustained growth in the global IT market
Substantial addressable market in emerging countries
Softline’s main countries will see high growth especially in its key business areas such as Digital Transformation and Cybersecurity;
Softline is market leader in these geographies
Softline is active in every stage of the IT solution and service value chain
Softline works with top vendors globally; Softline has a strong relationshipwith Microsoft with a track record of delivery in emerging markets
Market highlights
3
2
4
1
5

39 ©
The largest IT vendors (hardware and software), each with over $10bn in revenue, constitute approximately 45-50% of the global market
Global IT spending (hardware, software and cloud only) (c. $2.0tn)
Large-scale vendors(>$10bn revenue)
Mid-scale vendors($10bn-$1bn revenue)
Small-scale vendors(<$1bn revenue)
Indicative
Indicative share of revenue:
45-50% 20-25% 25-35%
Vendor landscape – by size
Note: Top-ten next-gen service vendor data not availableSource: Pitchbook, AMR research and analysis
Example vendors:
Top-10 of an estimated 30-40
large-scale vendors

40 ©
▪Despite the strength of industry leaders, the IT market is experiencing a strong growth in the number of vendors: the number of new US tech companies set up in 2019 was 30% higher than in 2016
‒ In a survey by Zwyft Filings, 56% of business owners in the technology industry said that increased demand for products and services was a driver for growth in 2019
▪A primary driver of this growth has been the increasing relevance of the SaaS model, which spawns thousands of new vendors every year
Leading disruptive tech vendors are continuing to grow through M&A. The long tail of IT vendors is getting longer as new entrants carve niches
Vendor landscape – market dynamics
120
102
130
90
100
110
120
130
20172016 20192018
Source: Pitchbook, Crunchbase, CardConnect, State of Zwyft, AMR research and analysis
0
500
1,000
1,500
201120092005 2007 2013 2015 2017 2019
There is a constant influx of new entrants to the IT market as new tech niches are continuously created
Number of new US technology companies founded – 2016 indexed to 100 (2016-2019, %)
Number of new SaaS companies founded globally (2005-2019)
▪ The cybersecurity market has witnessed a surge of investment since 2015. For example, Symantec was acquired by Broadcom for $10.7bn in November 2019
‒ Growth in total valuation of companies receiving investment was 26.6% p.a. between 2015 and 2020
▪ Likewise, the IoT industry set a new venture capital exit record in 2020, achieving $14bn in total value across 61 exits
‒ Growth in the market has been driven by a reduction in the cost to produce IoT hardware: sensor costs have declined by around 50% since 2010 which has directly led to the explosion in IoT vendors
The major disruptive technology vendors are attracting significant investment to achieve further growth
0
10
20
30
402.0
0.0
0.5
1.0
1.5
Valuation ($m)# of deals (000s)
2015 2016 2017 2018 2019 2020
1.21.3
1.51.6 1.6
1.9
Median valuation
Deal count
Cybersecurity deal count and median valuation (2015-2020, $m)

41 ©
Softline works with over 6,000 vendors, amongst which MSFT is of greatest importance due to its significant turnover contribution
Importance of MSFT
616743
860
207
237214
66
7893463
552
610
2020
1,352
2018 2019
1,610
1,778
+19%
+10%
Remainder
Microsoft
Key vendors (13-27th largest)
Strategic vendors (2-12th largest)
▪ Softline works with over 6,000 vendors, the largest being MSFT
‒ The top 12 vendors (including MSFT) are defined as strategic vendors, providing $50-100m in turnover
▪MSFT is of great importance as it generated the greatest turnover for Softline (48% of Softline’s 2020 turnover) whilst growing at 18% p.a. from 2018-2020
▪ The majority of MSFT’s revenue come from enterprise technologies, which fall under Productivity & Business Processes and Intelligent Cloud
‒ Between 2018-2020, MSFT revenue has outperformed global IT spending (12% p.a. vs 2%)
Softline turnover by vendor (2018-2020, $m)
Source: Softline management, S&P Global Market Intelligence, AMR research and analysis

42 ©
▪ Softline is a top two IT solution provider in MSFT’s addressable cloud solutions and licensing & subscriptions businesses within emerging markets
‒ The majority of other providers are mostly national/regional providers
▪Globally, MSFT relies upon an extensive partner ecosystem to deliver its suite of technology, services and solutions enabling business transformation. Softline is one of only ten companies worldwide holding the Globally Managed Partner designation
Softline is one of MSFT’s 10 globally managed partners and has a strong track record of delivery in emerging markets
Current Microsoft channel split in emerging markets (est.) for cloud vs industry norm
95% 85% 80%
5% 15% 20%
Industry NormMSFT Cloud MSFT All
Direct
Indirect
▪ Since becoming MSFT’s CEO in 2014, Nadella has reinforced MSFT’s partner strategy which has helped to re-engineer MSFT’s business model as a hybrid computing provider with its Azure platform
▪ In April 2021, MSFT began to urge partners to sell its full technology portfolio with the goal of longer customer engagements and greater consumption
▪Given MSFT’s continued dependency on partners, particularly within emerging markets where MSFT requires local expertise, Softline is a highly relevant and valued partner
15%
10%
72%
SoftwareOne
Softline
3% Crayon
Others
12%
78%
SoftwareOne
Softline7%
Others
4%Crayon
#1 Microsoft LSP Partner, Russia
#1 Partner of the Year, Cambodia
#1 Microsoft Partner of the Year, Cambodia, Chile & Kazakhstan
#1 Partner in Russia by sales volume
#1 Microsoft Partner of the Year, Georgia
Strong partnership track record and delivery in emerging marketsOne of MSFT’s 10 globally managed partners
Market share in MSFT’s addressable licensing & subscriptions business²
Market share in MSFT’s addressable cloud solutions business¹
Note: ¹Other major players include Sonata (3%), Logicalis (3%) and Sonda (2%); ²Other major players include Logicalis (3%), Sonata (3%) and Sonda (3%)Source: Microsoft, AMR market model, research and analysis
Select Softline Accolades
Indicative

London ■ New York ■ Paris ■ New Delhi ■
Florent JarryPartner
Min LiPrincipal
AMR International Limited 77 Farringdon Road
LondonEC1M 3JU
United Kingdom
Tel: + 44 (0) 20 7534 3600