NSW Council for Intellectual Disability- Summary of highlights of inclusive sessions
Project Summary Intellectual Merit. We propose to improve understanding of the lithosphere-scale structure of North America's stable continental interior (Midcontinent cratonic platform) by addressing seven major issues: (1) How does the lithosphere beneath intracratonic uplifts (domes and arches) differ from that beneath intracratonic basins? (2) How did the lithosphere of the cratonic platform assemble during the Proterozoic? (3) What is the manifestation of rifts and other fault-and-fold zones at depth? (4) What characteristics distinguish lithospheric regions with a propensity for intraplate seismicity from regions that do not? (5) What lies beneath the anorogenic granite-rhyolite province? (6) How did the Midcontinent platform of the United States transform into a craton and what provides the craton's strength? (7) What features of the lithosphere are associated with sharp gradients displayed on maps of potential-field data? We propose to deploy a 3-D, broadband, passive seismic array centered over the depocenter of the Illinois Basin. The array was designed to provide enhanced station density or 3 to 1 relative to the Earthscope TA. The design builds on the experience of the first major EarthScope FA experiment (SNEP) that was set up in the southern Sierra Nevada. SNEP unambiguously demonstrated the imaging capabilities of a dense 3-D array, and showed how existing imaging methodologies can provide important insight into lithospheric-scale processes. In order to ensure that we are able to extract the best results from our data, and thus go beyond the simple production of "redite-bluite" seismic images, we have built the foundation for a larger-scale interdisciplinary collaboration of researchers at a recent EarthScope Workshop on Geoscience Issues of the Midcontinent. Our study area includes some of the best examples of cratonic platform lithosphere structures to be found anywhere. Specifically, it spans the Ozark Dome and the Illinois Basin (including the abrupt boundary between them along which the Precambrian/Cambrian unconformity displays over 7.5 km of structural relief), as well as the Rough Creek Graben and other major fault zones including the Wabash Valley Seismic Zone. It also crosses major Proterozoic sutures and the enigmatic Eastern Granite-Rhyolite province. The seismic experiment we propose will provide sufficient resolution to determine if distinct crustal or upper-mantle features relate to these features, and thus will provide a basis for testing models put forth to explain these features. We will occupy 120 stations over a 3-year period coinciding with the deployment of the TA; site occupation will roll in four distinct stages using a maximum of 60 simultaneously operating stations. The main data analysis tools we propose to use as part of this project are: (1) travel-time tomography using teleseismic P and S waves; (2) wave-field imaging with P receiver functions using CCP stacking methods and a recently developed 3-D plane-wave migration method; and (3) complementary wavefield imaging of S-wave receiver functions. We will also conduct a detailed analysis of seismicity recorded on this dense array, to better locate earthquake sources and characterize faults. Estimates from previous work in the area suggest we can expect of the order of 100 local earthquakes and 12,000 mining explosions during the recording period. Broader Impacts. The Midwest does not have a strong tradition of earth-science awareness, so our project provides a unique opportunity to reach a new audience. We propose an integrated education and outreach component, involving: (1) In-service teacher workshops, to expand the pool of master teachers knowledgeable about EarthScope science; (2) a teacher Research Fellows program to include high school science teachers in summer research teams; (3) Involvement of students and the public in EarthScope-related activities using already established connections with schools, pre-college research symposia, and State Survey outreach programs (field trips; open houses; public presentations); (4) Development of material for "Active Earth" displays for regional outreach, and for incorporation in widely used introductory geoscience textbooks (authored by one of the projects co-PIs); (5) an undergraduate REU program; and (6) graduate student education at all institutions.

PROJECT DESCRIPTION
Perspectives on the Continental Interior: A Geoscience Frontier The stable continental interior ("cratonic platform") of North America is a relatively unexplored frontier for EarthScope. Indeed, one might argue that advances in understanding the structure and dynamics of the continental interior from USArray may prove to provide a bigger jump in understanding than did those made in the Cordillera, because so little is known about the deeper structure of the lithosphere of the US Midcontinent. Many first-order problems about the region remain to be addressed. One of the founding principles of USArray was that increased resolution made possible by the array would improve understanding of the processes that created and shaped the continent. The resolution gap in the stable interior is vast compared to the Cordillera. In the continental interior, there are almost no high-resolution models for regions outside of the New Madrid region. And even the most recent tomographic models (e.g. Bedle and van der Lee, 2006) have an order of magnitude lower resolution than local models that existed in numerous places in the western US prior to EarthScope. One of the major contributions of USArray to date is that it has provided a framework in which a patchwork of higher resolution models can be integrated with results using the regular geometry of the new array. The Midcontinent, in contrast, lacks even that patchwork to build upon. Our proposal seeks to produce a transformational understanding of cratonic structure, and the processes that produced it, by establishing a high-density passive seismic array experiment. This experiment will provide an integrated, high-resolution view across a swath of the continental interior that includes definitive examples of major intracratonic structures (basins, domes, sutures, geochemical boundaries, rifts, fault zones, and anorogenic granite provinces). Our results will provide insight into the relation of these features to characteristics of the deeper crust and upper mantle, and will provide a foundation to tie together results from decades of geological research -- much of which resides in state geological survey archives -- into a coherent picture. It will also set the stage for future active-source and magnetotelluric studies that can help relate upper-crustal features to deeper ones that are less tied to the transportable array. Scientific Focus, and Problems to be Addressed Cratons are the relatively stable and long-lived portions of continents whose overall fabric and metamorphic grade has not changed significantly during at least the past half-billion years of Earth history. They comprise over a quarter of the continental area of the Earth. Geoscientists divide cratons into shields, regions in which Precambrian crust crops out over a broad area, and cratonic platforms, regions in which a veneer of Phanerozoic sedimentary strata up to 7 km thick buries Precambrian basement. The portion of North America's craton that lies within the United States is almost entirely a cratonic platform with low topographic relief. Because of its cover, the at-depth structure of this region remains very poorly understood. What is known about it comes from compilations of drill-hole data, potential-field studies, a few available seismic-reflection profiles, and low-resolution tomographic studies. As a result, so many first-order questions about this substantial volume of lithosphere remain unanswered that a focused Earthscope experiment in the region will undoubtedly make a major contribution. The EarthScope transportable array (TA) will sweep into the USA Midcontinent portion of the craton during 2011 and provides a unique and invaluable opportunity to address several of these questions. However, many of the key features of the craton that need to be analyzed have dimensions on the order of tens of kilometers, and thus cannot be resolvable by TA data alone. We propose to use instruments of the flexible array (FA) to densify instrument spacing within a key region of the cratonic platform (Fig. 1). The densification of the array will provide sufficient resolution to provide substantial new insight into the formation and behavior of the lithosphere of a cratonic platform. The specific region that we propose to analyze (Figures 1 and 2) extends across two of
the largest epeirogenic structures in the world (the Ozark Dome and the Illinois Basin), two possible major sutures associated with the Proterozoic assembly of the craton (the 1.6 Ga crustal boundary and the Grenville Front), several important rifts and fault-and-fold zones (including the Reelfoot Rift and the Rough Creek Graben), one of North America's most active regions of intraplate seismicity (including the Wabash Valley seismic zone), and one of the world's largest "anorgogenic" igneous province (the 1.47 Ga Eastern Granite-Rhyolite province). Data from this experiment (Fig. 1) will be used to address the following issues related to the structure and dynamics of cratonic North America.
Fig. 1. Geometry of proposed flexible array (FA) experiment. Upper map is a shaded relief map of topography and the lower right map shows the location of the upper map in reference to a map of faults and depth to the top of Precambian rocks. Triangles show the idealized location of TA stations and circles show approximate locations of 120 FA stations we propose to add to supplement the TA in this region. The approximate location of the Grenville Front is shown to illustrate how the arrays spans Precambrian outcrop in Missouri to the Grenville Front.
How does the lithosphere beneath intracratonic uplifts (domes and arches) differ from
that beneath intracratonic basins? The surface of lithospheric basement in cratonic platforms is not horizontal (even where overlain by flat topography) but rather is affected by broad (> 100-km wavelength), first-order warps that rise or subside in pulses over geologic time (e.g., Park and Jaroszewski, 1994; van der Pluijm and Catacosinos, 1996; Howell and van der Pluijm, 1999). They are long-lived, in the sense that intracratonic uplifts (domes and arches) host thin,
condensed sections whereas intracratonic basins host thick, fairly complete sections (Heidlauf, et al., 1986; Leighton et al., 1991; Bond and Kominz, 1991; Kolata and Nelson, 1991; McBride et al., 2003). Subsidence analysis indicates that, in general, when basins are subsiding, uplifts are rising (Tranel, 2005). Our proposed study area spans the Ozark dome (presently manifested by a broad plateau), the Illinois basin, and a portion of the Cincinnati arch. Notably, the structural relief between the Precambrian/Cambrian unconformity exposed at crest of the Ozark Plateau and the same horizon on the floor of the Illinois Basin, only 100 km to the east, is over 7.5 km, comparable to orogenic relief between the Ganges and the summit of Mt. Everest (Figure 2; Marshak et al. 2005). Our proposed analysis will allow us to compare the lithosphere beneath these examples of epeirogenic provinces to determine if behavior during the past half-billion
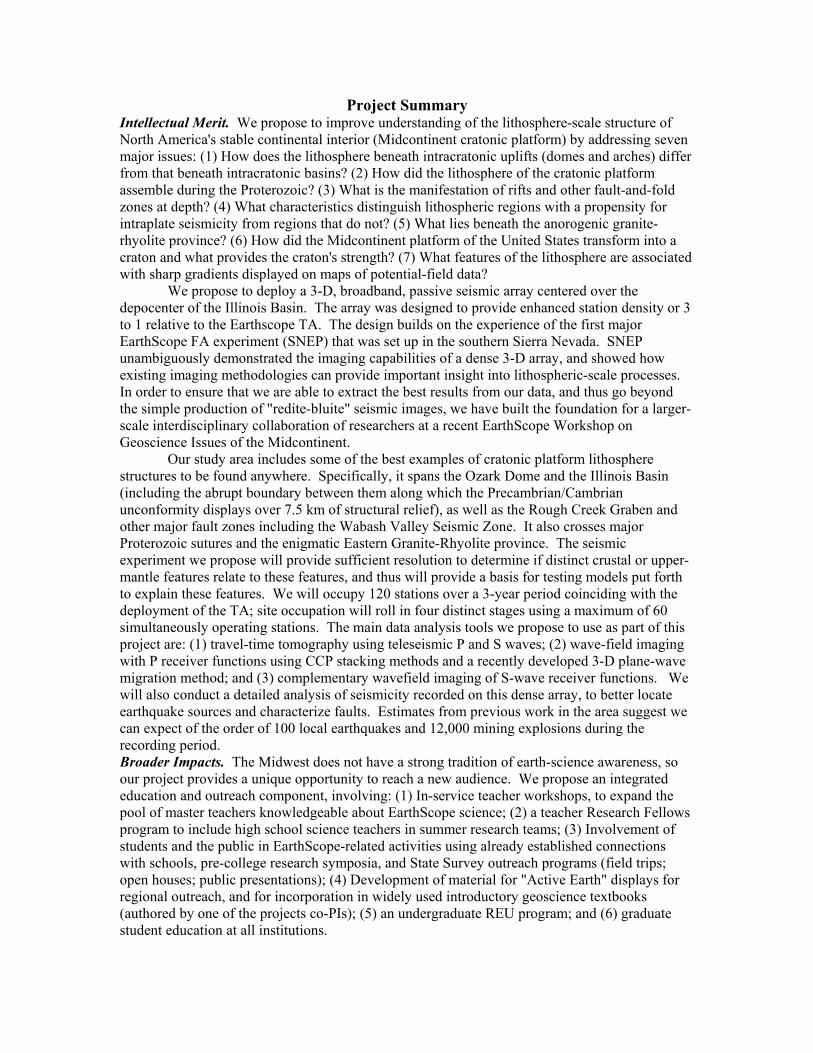
years correlates with lithospheric scale structure. Debate has not been resolved as to whether epeirogenic provinces of cratonic platforms are flexural, are a manifestation of lithospheric buckling, are related to the existence of uncompensated crustal or mantle loads (positive beneath uplifts and negative beneath basins) that move at times when the lithosphere weakens, or are associated with sub-lithospheric mantle anomalies (e.g., Marshak and van der Pluijm, 2003). We will focus in particular on the character of the abrupt boundary between the Ozark Plateau and the Illinois basin and the northern edge of the Rough Creek graben as it is likely that the greatest contrasts will be observed across these boundaries. The study area also encompasses the abrupt boundary separating the portion of the Illinois basin that has subsided the most (the Fairfield sub-basin) from portions to the north that have subsided less.
Figure 2. (a) Oblique, vertically exaggerated, shaded-relief map of the central Midcontinent, emphasizing the structural relief on the Precambrian/Cambrian contact between the Ozark Plateau and the Illinois Basin. (b) Schematic tectonic map of crustal provinces and regional structures in the central USA.
Seismic images obtained in this study will be able to determine if there are significant contrasts in lithospheric properties. This is testable by comparison of 3D wavespeed estimates from tomography and detailed crustal thickness estimates from P receiver function analysis to geologic data. For example, we expect to produce higher-resolution images of the diffuse low-velocity body revealed by the Bedle and vanderLee (2005) tomography model (Fig. 3), and we can produce a real estimate of crustal thickness to compare to the well known features of this basin. How did the lithosphere of the cratonic platform assemble during the Proterozoic?
Although the crust of the cratonic platform was assembled in the Precambrian it is now nearly completely covered with younger sediments. As a result the detailed geometric relationship of different blocks of lithosphere that form this region remains virtually unknown. Recent compilations suggest that the boundary between the Mazatzal and Yavapai terranes (Fig. 2) trends northwest and through the northern boundary of Illinois (Van Schmus et al., 2007; Holm et al., 2007; Sims et al., 2008). Which way the suture dips at depth is not known. It may or may not dip southeastward beneath the Illinois basin. A second, poorly known boundary, cuts diagonally through the center of the Illinois basin. This boundary, which is based on ages measured from limited deep core samples of granite, appears to delineate the southeastern edge of 1.6 Ga crust (Van Schmus et al., 2007). Whether or not this boundary can be imaged remains to be determined. The eastern end of the proposed study area includes the Grenville Front, a shear zone delineating the northwestern limit of the 1.1 Ga Grenville Orogen (e.g., Baranoski et al., 2009). Imaging this relatively well-known boundary, will provide a basis for interpretation of other potential sutures within the proposed study area. In both cases, the increased resolution made possible by the proposed FA experiment is essential to address these issues. Lateral resolution of structures with existing array imaging techniques is close to the average station spacing. Since 70 km is roughly twice the thickness of the crust and is comparable to our best estimates of lithospheric thickness, this is a serious limitation. The dense spacing of our proposed
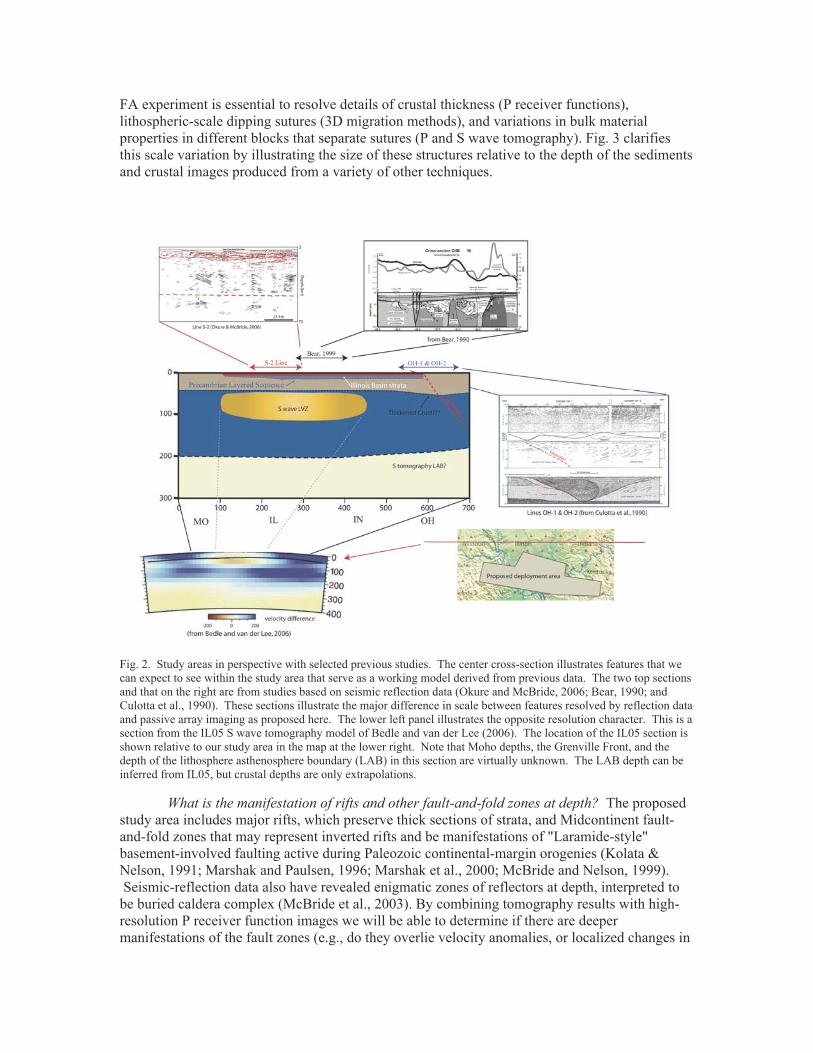
FA experiment is essential to resolve details of crustal thickness (P receiver functions), lithospheric-scale dipping sutures (3D migration methods), and variations in bulk material properties in different blocks that separate sutures (P and S wave tomography). Fig. 3 clarifies this scale variation by illustrating the size of these structures relative to the depth of the sediments and crustal images produced from a variety of other techniques.
Fig. 2. Study areas in perspective with selected previous studies. The center cross-section illustrates features that we can expect to see within the study area that serve as a working model derived from previous data. The two top sections and that on the right are from studies based on seismic reflection data (Okure and McBride, 2006; Bear, 1990; and Culotta et al., 1990). These sections illustrate the major difference in scale between features resolved by reflection data and passive array imaging as proposed here. The lower left panel illustrates the opposite resolution character. This is a section from the IL05 S wave tomography model of Bedle and van der Lee (2006). The location of the IL05 section is shown relative to our study area in the map at the lower right. Note that Moho depths, the Grenville Front, and the depth of the lithosphere asthenosphere boundary (LAB) in this section are virtually unknown. The LAB depth can be inferred from IL05, but crustal depths are only extrapolations.
What is the manifestation of rifts and other fault-and-fold zones at depth? The proposed study area includes major rifts, which preserve thick sections of strata, and Midcontinent fault-and-fold zones that may represent inverted rifts and be manifestations of "Laramide-style" basement-involved faulting active during Paleozoic continental-margin orogenies (Kolata & Nelson, 1991; Marshak and Paulsen, 1996; Marshak et al., 2000; McBride and Nelson, 1999). Seismic-reflection data also have revealed enigmatic zones of reflectors at depth, interpreted to
be buried caldera complex (McBride et al., 2003). By combining tomography results with high-resolution P receiver function images we will be able to determine if there are deeper manifestations of the fault zones (e.g., do they overlie velocity anomalies, or localized changes in

crustal thickness). The densification of instruments will also allow for better location of earthquake sources, which may permit delineation of fault dip in the upper crust. Knowledge of fault dip direction is essential for the determination of the strain significance of faulting. What characteristics distinguish lithospheric regions with a propensity for intraplate
seismicity from regions that do not? Seismicity in intracratonic regions occurs far less frequently than that at plate boundaries, but it does occur and can pose substantial seismic risk (e.g., Hamburger and Rupp, 1988; Bear et al., 1997; McKenna et al., 2007; Tuttle et al., 2002; Stein and Mazzotti, 2007). At least five moderate-sized (M~5) earthquakes have taken place in the past half-century in our proposed study area, which lies to the north of the significantly more infamous New Madrid Seismic zone. In addition, evidence from paleoseismology indicates that the zone has hosted at least six large, prehistoric earthquakes over the past 20Ka. (Obermeier et al., 1991; Munson et al., 1995). However, the distribution of intraplate seismicity is not uniform. A significant concentration of seismicity occurs in the Wabash Valley (Nuttli, 1979; Braile et al., 1982; 1986; Nelson and Lumm, 1984; Sexton et al., 1986; Bear et al., 1997a; Pavlis et al., 2002; Kim, 2003; Pavlis et al., 2002; Eagar et al., 2006). Our proposed study area traverses the Wabash Valley zone and also straddles a subtle boundary (approximately the latitude of St. Louis) between the relatively seismic and relatively aseismic portions of the Illinois basin. Our analyses will allow us to determine if there are changes in lithospheric structure across this boundary and provide insight into the question of what determines the spatial distribution of seismicity. A more detailed understanding of seismogenesis in such intracratonic settings relies on improved models of lithospheric structure and rheology of intraplate seismic zones. Various models for this seismicity have been proposed, including: seismicity occurs in zones of weakness (Sykes, 1978); lithospheric weakening due to high heat flow (Liu and Zoback, 1997); gravitational instabilities due to high-density crustal bodies (Pollitz et al., 2001); variations in lithospheric thickness (Schulte and Mooney, 2005); manifestation of glacial unloading (Wu and Mazzotti. 2007; Grollimund and Zoback, 2001) or of poroelastic effects associated with changes in river discharge (Costain et al., 1987); transient processes in the lower crust (Kenner and Segall, 1997); or is driven dynamically by the sinking of the underlying Farallon slab in the asthenosphere (Bedle and van der Lee, 2006; Forte et al., 2007). Our project will permit evaluation of the options by producing 3-D models of Earth structure that can be compared with more precise (albeit small) catalogs of earthquake hypocenters made possible by the dense recording array and historical seismicity. What lies beneath the anorogenic granite-rhyolite province? A carapace of granite and rhyolite cover forms the upper part of the crust throughout much of the central United States (Fig.2; Van Schmus et al., 1996). Fundamental debate remains as to whether these rocks originated in association with subduction, rifting and extensional collapse, or some other mechanism. Distinguishing among such alternatives requires better constraints on the thickness of the granite-rhyolite carapace, and on whether there is correlative zone below the rhyolite from which the magma was derived. This project can help distinguish among alternative hypotheses for the origin of the granite-rhyolite province by relating 3-D images from tomography to current estimates of regional extent of these rocks. In particular, a working hypothesis is that the wavespeed of the crust and upper mantle would be different under the granite-rhyolite province than areas not impacted by this event. How did the Midcontinent platform of the United States transform into a craton and what
provides the craton's strength? The process by which orogenic crust transforms into craton remains one of the great enigmas in geoscience (e.g. Hinz, 1996). The proposed study area contains crust that has undergone such a transition relatively recently (post 1.6 Ga). Our proposed FA experiment will allow us to evaluate this issue with improved resolution in a region of the lithosphere where we have every reason to believe there could be rapid variations in lithospheric properties. For example, results from MOMA (Li et al., 2002) suggest lithospheric thickness decreases significantly across the Grenville Front. This issue is complicated by the fact
that there are multiple measures for estimating the lithosphere asthenosphere boundary (LAB) from seismic data (Romanowitz, 2009) that are not internally consistent. In particular, inferences from tomographic methods like that of Bedle and van der Lee (2009) (Fig. 3) are not consistent with inferences from P (Li et al, 2002) and/or S receiver functions. Receiver functions have the best potential for high resolution mapping of lithospheric thickness, but as Romanowitz (2009) points out the current methods lack an unambiguous mineral physics link to explain the velocity reversal commonly interpreted as the LAB. This is particularly problematic for cratons where there is little data and the cratonic "root" may have a drastically different signature. We will address this issue using 3-D S receiver function images cross-validated with tomography models. S wave receiver functions have been used extensively in a series of recent papers (e.g. Kumar et al., 2005a,b,2006; Landes et al.,2007) to define a seismic LAB. The more commonly used P receiver functions are problematic for imaging the LAB because crustal multiples back project to the same depths. S-to-P data, in contrast, do not suffer from this problem but come at the cost of being harder to estimate reliably and having a lower frequency content due to the lower frequency content of S waves relative to P waves. We propose to address this issue using S receiver function imaging at two scales: (1) a S-to-P, three-dimensional image within the study area, and (2) a comparable continental scale image volume from the entire TA. Pavlis will be working on the later under a recent grant from the Earthscope program. The higher resolution result from this experiment is then a natural add on and will allow us to directly address this issue. Given the disconnect between lithospheric thickness estimated from tomography and receiver function data (Romanowicz, 2009), it will also be important to cross-validate the receiver function results with our own tomography results and regional scale results by other investigators (see collaboration letters in supplement). What features of the lithosphere are associated with sharp gradients displayed on maps
of potential-field data? Sharp gradients in geophysical field measurements cross our proposed study area (Braile et al., 1982; Hildenbrand and Ravat, 1997). Some of these, for example, the Commerce Geophysical Lineament (Hildenbrand et al., 2002; McBride et al., 2002), are spatially associated with known fault zones or align with Precambrian structural grain. However, not all display such associations, and thus may be related with as yet unknown features at greater depth. Imaging deeper crustal and mantle levels will allow us to test this concept and understand the fundamental nature of potential-field fabrics in cratonic platforms. Because none of the PIs assembled for this project are potential-field specialists, this will be addressed with collaboration made possible by the regional collaborations described below (see also support letters). Surprisingly, decades after the advent of plate tectonics, we have no universally accepted theory to explain controls on tectonism in cratonic platforms, even though these regions account for over 25% of continental lithosphere. The limitation on understanding comes largely from lack of data on the deeper character of the crust and mantle beneath these regions. Such data may become available through EarthScope, so the unique opportunity to organize a coordinated scientific agenda for studying a particularly illustrative example of cratonic platform is not to be missed. Below, we provide the details of our proposed instrumentation plan, a work plan for setting it up, and a description of the specific types of analyses that we will do with the data that we collect. We anticipate that our results will set the stage for a new generation of focused studies, including work with active-source seismology, magnetotellurics, and geodynamic modeling, which will serve to link the at-depth images that we obtain more directly with upper-crustal features, and lead to a better understanding of the dynamic evolution of the region. We also describe an ambitious program of education and outreach that has the potential to disseminate the excitement of this grand scientific experiment to a broader audience throughout the Midwest.
Experiment Design Geophysical observations of the central portion of North America provided observations
of crustal structure [e.g. Braile et al., 1982; Bear et al, 1997; McBride et al., 2002; French et al., 2009] that primarily focused on shallow features (Fig. 3). Comparison to existing images of large-scale features in the mantle offer enticing glimpses into the potential to relate crustal structures to mantle features, and thus provide insight into the complex evolution of the continent (e.g. Li et al., 1998; Li et al., 2002; van der Lee et al., 2002; Bedle and van der Lee, 2006). With this in mind we designed our experiment based on three principles. (1) Improving understanding of North America's continental-interior (cratonic platform) lithosphere requires resolution at a scale better than what is currently possible with the TA but broader than the scale that can be derived from surface geology and seismic-reflection imaging. (2) The structure of the cratonic platform is unambiguously three-dimensional so techniques based on linear arrays of receivers cannot effectively address most of the problems described above. (3) To obtain the best data, the array should intentionally avoid areas with thick glacial deposits or with thick accumulations of unconsolidated sediments (e.g., the Mississippi embayment). The area that we have selected will provide bedrock sites for most stations (based on M. Hamburger’s experience in GPS monitoring in this region), providing better quality data than might be obtainable from other potential study areas in the Midcontinent.
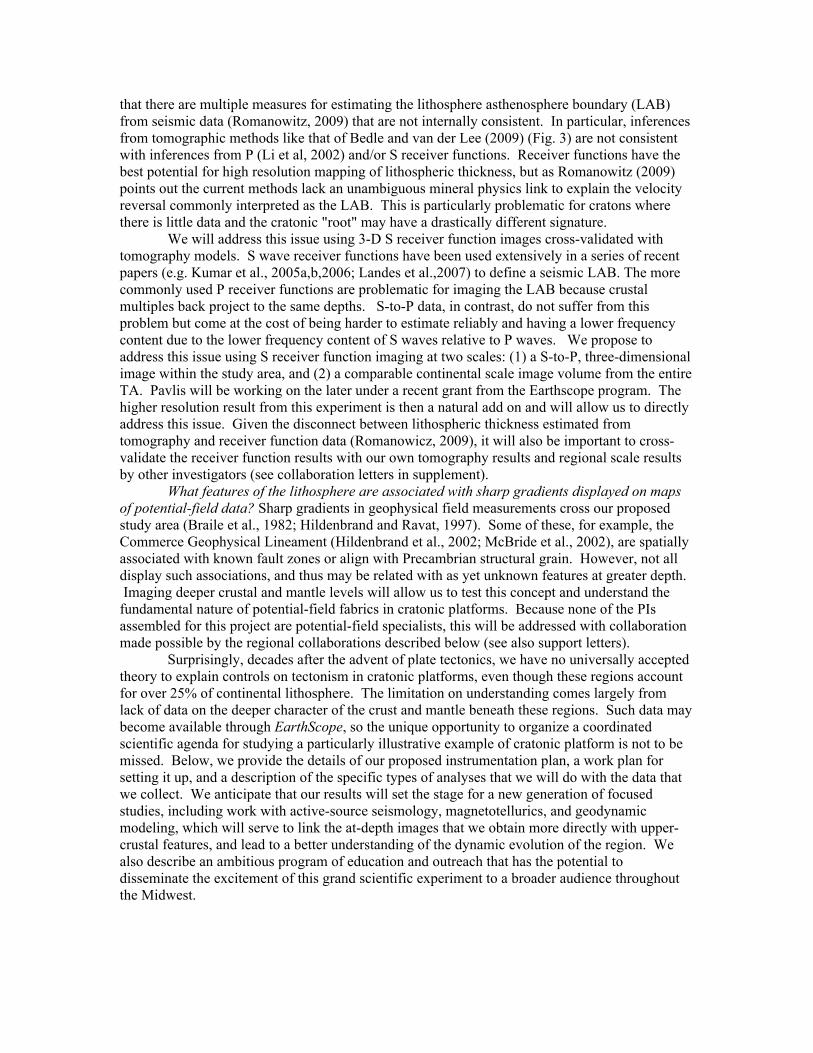
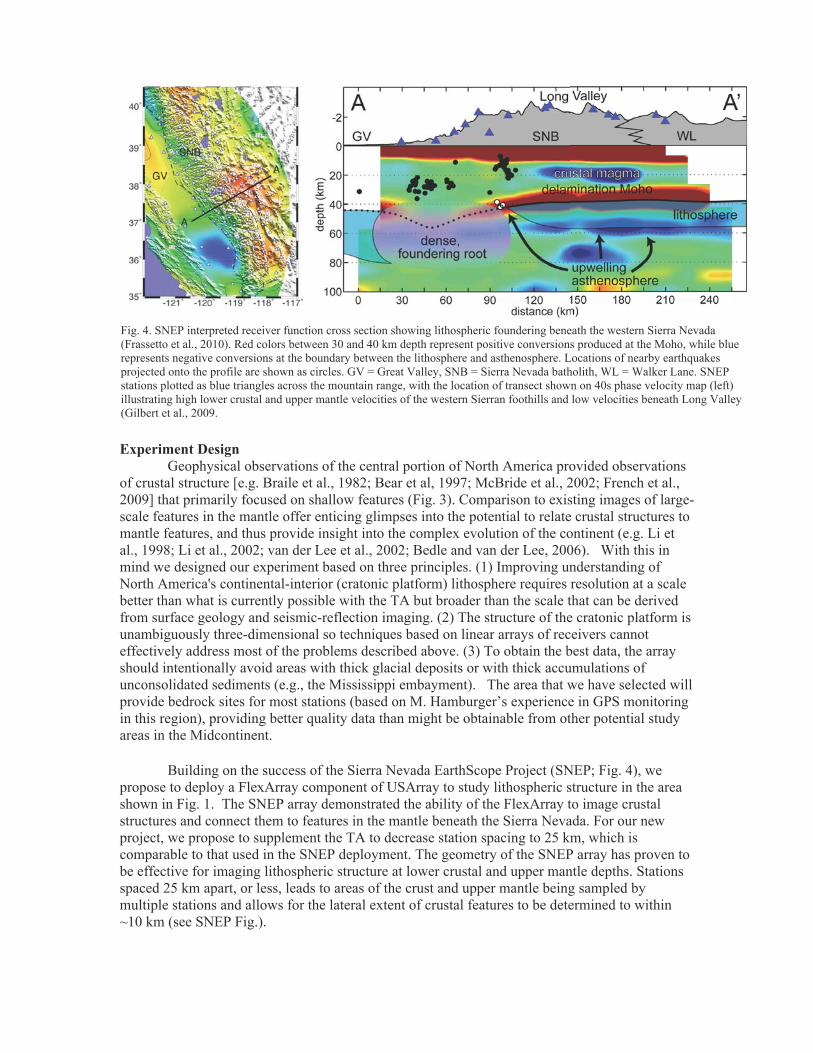
Building on the success of the Sierra Nevada EarthScope Project (SNEP; Fig. 4), we propose to deploy a FlexArray component of USArray to study lithospheric structure in the area shown in Fig. 1. The SNEP array demonstrated the ability of the FlexArray to image crustal structures and connect them to features in the mantle beneath the Sierra Nevada. For our new project, we propose to supplement the TA to decrease station spacing to 25 km, which is comparable to that used in the SNEP deployment. The geometry of the SNEP array has proven to be effective for imaging lithospheric structure at lower crustal and upper mantle depths. Stations spaced 25 km apart, or less, leads to areas of the crust and upper mantle being sampled by multiple stations and allows for the lateral extent of crustal features to be determined to within ~10 km (see SNEP Fig.).
Fig. 4. SNEP interpreted receiver function cross section showing lithospheric foundering beneath the western Sierra Nevada (Frassetto et al., 2010). Red colors between 30 and 40 km depth represent positive conversions produced at the Moho, while blue represents negative conversions at the boundary between the lithosphere and asthenosphere. Locations of nearby earthquakes projected onto the profile are shown as circles. GV = Great Valley, SNB = Sierra Nevada batholith, WL = Walker Lane. SNEP stations plotted as blue triangles across the mountain range, with the location of transect shown on 40s phase velocity map (left) illustrating high lower crustal and upper mantle velocities of the western Sierran foothills and low velocities beneath Long Valley (Gilbert et al., 2009.
There are approximately 30 TA stations within the footprint of the proposed FA deployment. Correspondence with the IRIS-PASSCAL instrument center (see supplemental documents) indicates 50 to 60 instruments could be available within a timeline to match the arrival of the TA in western Missouri. Our design is based on a 60 element array rolling as close as possible with the TA. Scheduling constraints will get us slightly out of phase because at best only 25 broadband instruments would be available to us by summer 2011 and the remainder would not be available until early 2012. But the east-west dimension of this profile is approximately matched with the TA roll schedule. This is the basic reason for our proposed 3 year deployment since this area spans approximately a 2 year TA roll schedule with the added year needed to match the 18 month nominal station recording time. The total number of proposed stations is 120 to match this roll schedule. Data Management For a long list of reasons we plan to use the cell modem telemetry that is available for FA experiments. In this region that means that most, but probably not all, stations will provide a near real-time data stream. We plan to build an extended virtual network using neighboring TA stations and as many broadband ANSS stations of the New Madrid network as possible. The FA real time data will be streamed directly to IRIS in a manner similar to the TA. We are completely familiar with the Antelope system used for FA telemetry and will use it to set up an automated, real-time detection and event association/location mechanism. This system will aid our data processing strategy allowing us to build a complete database of events actually detected in near real-time. This will also provide important feedback to identify data problems quickly so field teams can be sent to fix problems. A graduate student assistant will be responsible for review of real-time arrival picks, producing a catalog of preliminary event locations, and maintaining the real-time and archival database. Because of incomplete cell phone coverage and a host of other factors, real time data streams are never complete. Hence, we will need to assimilate late date from two main sources: (1) media downloads from station service runs, and (2) regional stations not accessible in real time but available from IRIS DMC. We have done this multiple times with other experiments. Indiana University has a useful facility for doing this processing called the data capacitor, which provides a scratch space of 500 TB. The merged data will be transmitted to IRIS as definitive data using established procedures with which both Pavlis and Gilbert are familiar. Data Analysis Earth Structure. When the merged data are assembled we will measure P and S arrival times with the recently developed dbxcor (Pavlis and Vernon, 2010) program. This program, which was developed to streamline this type of processing for the TA, will significantly enhance the speed and quality of teleseismic body wave arrival time measurements. We have found that the arrival time database produced by this processing is also an effective way to winnow out poor-quality data to reduce the effort required for P and S receiver function estimation. Standard receiver function estimates will be produced using existing data flows based on the iterative method of Ligorria and Ammon (1999). We also intend to experiment with alternative algorithms Pavlis is developing under current Earthscope support. The most promising is a multichannel generalization of the Ligorria and Ammon method. Body-wave tomography models will be estimated by multiple methods in collaboration with the larger regional collaborative group (see supplementary support documents). We have used S. Roecker’s code successfully in the past (Yang, 2004; Wu, 2004; Bravo and Pavlis, 2007). We plan, however, to compare results with a modification by Cecily Wolfe (used in Wolfe et al., 2009) of the popular Vandecarr code. Her modifications provide the option of using finite frequency kernels instead of the conventional ray theory approach. We will use both options as the finite-frequency theory is based on an approximation that is poor for this type of data at crustal depths (Wolfe, written communication). We also plan to use surface wave tomography to

help further refine the depth extent of lithospheric features. We intend to utilize the two-plane method of Forsyth and Li (2005) adapted for finite-frequency kernels (Yang and Forsyth, 2006). This approach helped to illuminate detailed variations in the depth extent of lithospheric structure in the Sierra Nevada (Fig 4). Gilbert is familiar with this processing technique and will lead this effort. P receiver function data will be analyzed by a set of conventional and nonconventional methods. Conventional methods we will use include: (1) the Zhu and Kanamori (2000) method which provides estimates of average crustal Vp/Vs and crustal thickness by superimposing primary and crust-mantle free surface multiples; and (2) CCP stacking (Dueker and Sheehan, 1997, 1998) focused on the crust-mantle boundary with the enhancement described by Frassetto et al. (2010). We will also use the recently developed 3D, plane-wave imaging algorithm (Pavlis, in review; Fig. 6a) based on the theoretical framework of Poppeliers and Pavlis (2003a,b). This method is well suited to this experimental geometry as is capable of resolving much more steeply dipping structures than are possible with the now conventional CCP method. With this approach we may, for example, be able to directly image the suture at the Grenville Front and possible lithospheric-scale boundaries associated with the 1.6 Ga discontinuity. A more regional synthesis with TA data can provide links possible lithospheric discontinuities associated with the Mazatzal and Yavapai terrane boundaries (Fig. 2). S receiver function data are more problematic, but as noted above provide a critical means to test questions about lithospheric structure of the craton. We have experience with this processing with data from the Bolivar project (Landes and Pavlis, in review) and from the STEEP project in Alaska (Bauer et al., 2008). There are some important technical issues regarding how this analysis can be done more efficiently and reliably. There is not sufficient space to address these issues and they are largely outside the scope of this project, which is focused on earth science issues and not data processing methodologies. For example, the generalized iterative method noted above for P receiver function estimation may be adaptable to this purpose. The key point is some technical work will be required make processing data for S receiver functions more robust. We have existing processing flows that allow us to construct CCP stacks of S receiver functions in 3D, but for this project we would use a revision of the plane wave code (under development) that would allow 3D back projection or plane wave migration of S receiver function data.
Seismicity. Analysis of intraplate seismicity in the Illinois Basin and environs will be an important additional scientific product of this experiment. The deployment of 150 broadband sensors (counting TA) in the Ozark/Illinois Basin/Rough Creek Graben area will significantly augment existing seismograph networks in the region. The deployment will enable high-precision earthquake location and possible first-motion source mechanism determination. Based on our experience with previous deployments in the region, we anticipate reduction of the nighttime detection threshold to M1.5 within the network and 2.0 for surrounding areas of the Illinois Basin. Day-time magnitude thresholds are expected to increase by 0.3-0.5 magnitude units (Pavlis et al. 2002; Webb et al., 2006). Based on current seismicity rates (see Fig. 5 of Pavlis et al., 2002) we can expect to record ~40 earthquakes per year, or ~120 earthquakes in the full 3-year period. Precise hypocentral locations, magnitudes, and earthquake mechanisms for local events may allow us to identify the location, geometry, and level of activity associated with seismogenic faults. In addition, the enhanced sensitivity of the network will allow us to examine the unusual nest of microearthquakes in the Wabash Valley seismic zone reported by Pavlis et al. (2002) and Eager et al. (2006) which they speculated was an induced swarm and hence may no longer be active. An easily unappreciated challenge for seismicity studies in this area is discrimination. A detailed study of events detected by broadband stations in southernmost Indiana (Webb et al., 2006) in a 251 day period in 2002 found: 207 larger teleseismic events, 28 regional events (mostly New Madrid), 2 local earthquakes, and 5 events that were unclassified. In the same time
period there were approximately 8000 mining explosions. Fortunately, however, the discrimina-tion problem is generally fairly unambiguous as explosions in this region nearly always have a distinctive Rg phase that can be readily identified. We have found this as an ideal introductory research project for an undergraduate intern or teachers who want to learn about seismology. Hence, we propose to utilize undergraduate interns and EarthScope teacher summer research fellows (see ’Broader Impacts’ section) to assist with this event identification processing. Data Integration
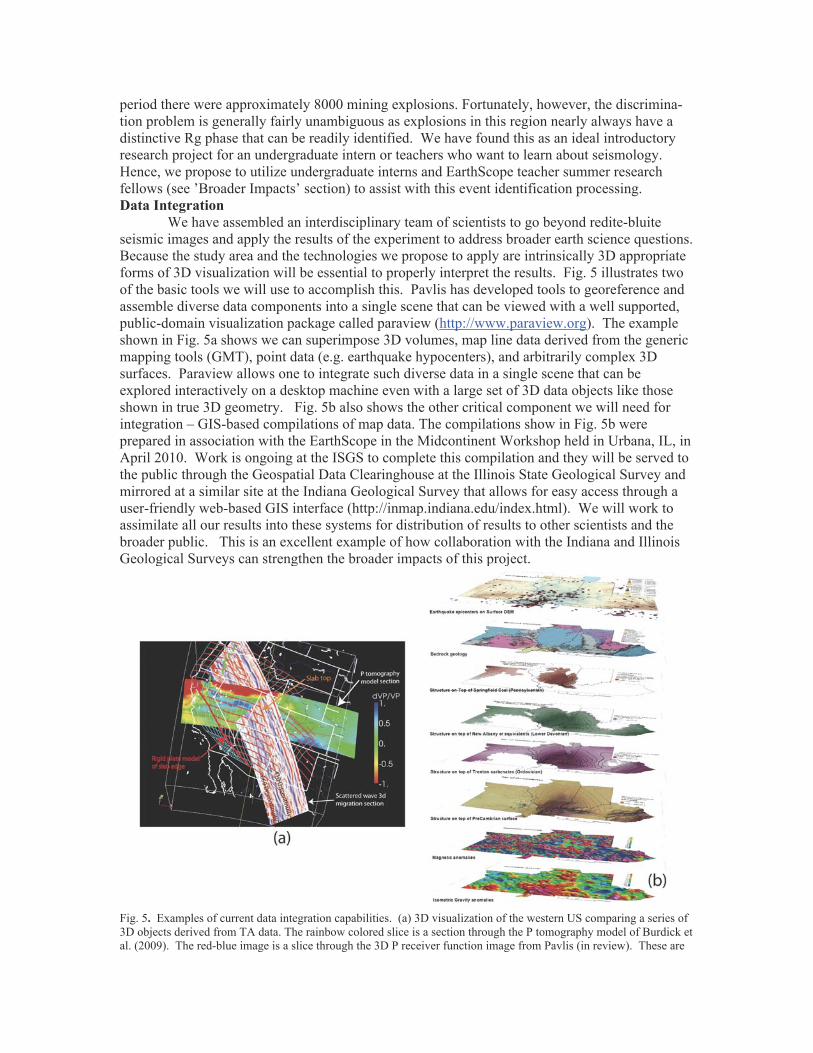
We have assembled an interdisciplinary team of scientists to go beyond redite-bluite seismic images and apply the results of the experiment to address broader earth science questions. Because the study area and the technologies we propose to apply are intrinsically 3D appropriate forms of 3D visualization will be essential to properly interpret the results. Fig. 5 illustrates two of the basic tools we will use to accomplish this. Pavlis has developed tools to georeference and assemble diverse data components into a single scene that can be viewed with a well supported, public-domain visualization package called paraview (http://www.paraview.org). The example shown in Fig. 5a shows we can superimpose 3D volumes, map line data derived from the generic mapping tools (GMT), point data (e.g. earthquake hypocenters), and arbitrarily complex 3D surfaces. Paraview allows one to integrate such diverse data in a single scene that can be explored interactively on a desktop machine even with a large set of 3D data objects like those shown in true 3D geometry. Fig. 5b also shows the other critical component we will need for integration – GIS-based compilations of map data. The compilations show in Fig. 5b were prepared in association with the EarthScope in the Midcontinent Workshop held in Urbana, IL, in April 2010. Work is ongoing at the ISGS to complete this compilation and they will be served to the public through the Geospatial Data Clearinghouse at the Illinois State Geological Survey and mirrored at a similar site at the Indiana Geological Survey that allows for easy access through a user-friendly web-based GIS interface (http://inmap.indiana.edu/index.html). We will work to assimilate all our results into these systems for distribution of results to other scientists and the broader public. This is an excellent example of how collaboration with the Indiana and Illinois Geological Surveys can strengthen the broader impacts of this project.
Fig. 5. Examples of current data integration capabilities. (a) 3D visualization of the western US comparing a series of 3D objects derived from TA data. The rainbow colored slice is a section through the P tomography model of Burdick et al. (2009). The red-blue image is a slice through the 3D P receiver function image from Pavlis (in review). These are
displayed with a 3D model of the top of the Juan de Fuca/Farallon slab displayed as a wireframe with 2.5 Ma contours based on the current plate motion of Juan de Fuca – North America (NUVEL1A). (b) compilation of multiple data sets for the Illinois Basin by the Illinois Geological Survey.
Experimental Plan
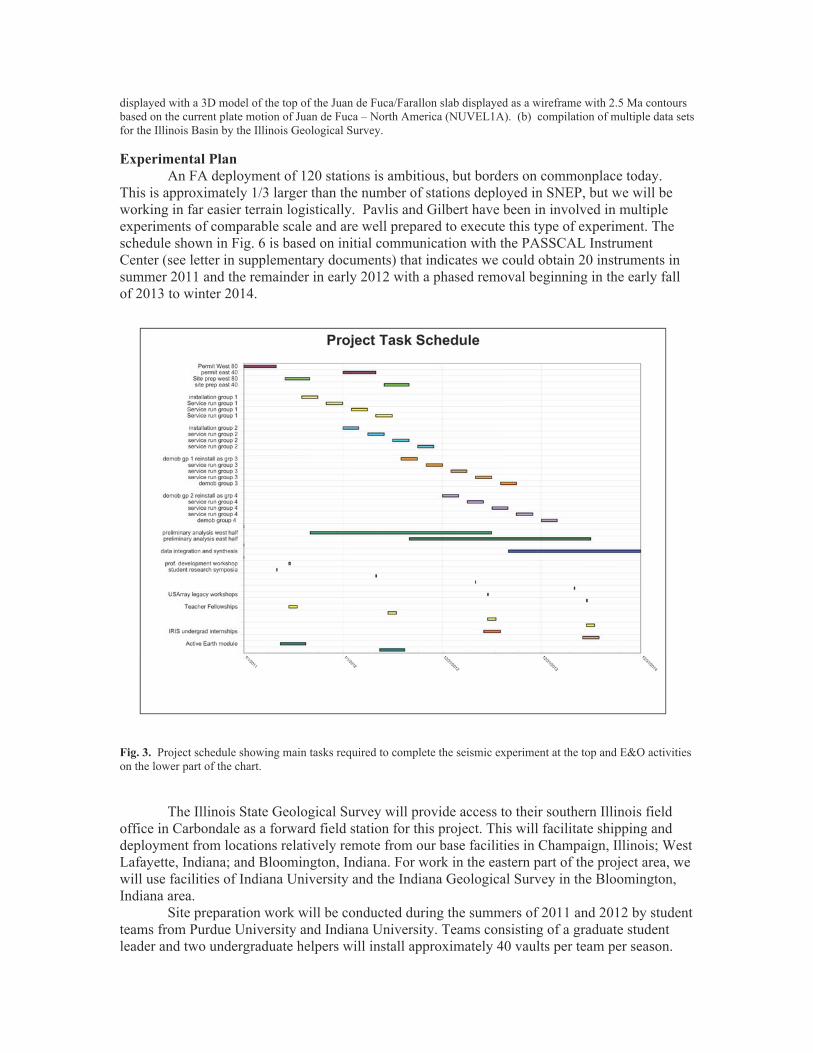
An FA deployment of 120 stations is ambitious, but borders on commonplace today. This is approximately 1/3 larger than the number of stations deployed in SNEP, but we will be working in far easier terrain logistically. Pavlis and Gilbert have been in involved in multiple experiments of comparable scale and are well prepared to execute this type of experiment. The schedule shown in Fig. 6 is based on initial communication with the PASSCAL Instrument Center (see letter in supplementary documents) that indicates we could obtain 20 instruments in summer 2011 and the remainder in early 2012 with a phased removal beginning in the early fall of 2013 to winter 2014.
Fig. 3. Project schedule showing main tasks required to complete the seismic experiment at the top and E&O activities on the lower part of the chart.
The Illinois State Geological Survey will provide access to their southern Illinois field
office in Carbondale as a forward field station for this project. This will facilitate shipping and deployment from locations relatively remote from our base facilities in Champaign, Illinois; West Lafayette, Indiana; and Bloomington, Indiana. For work in the eastern part of the project area, we will use facilities of Indiana University and the Indiana Geological Survey in the Bloomington, Indiana area.
Site preparation work will be conducted during the summers of 2011 and 2012 by student teams from Purdue University and Indiana University. Teams consisting of a graduate student leader and two undergraduate helpers will install approximately 40 vaults per team per season.

During the summer of 2011 we will use a team from Purdue and a team from Indiana to make sure that we will be ready for the instruments when they arrive. During the summer of 2012 we will need only a single site preparation team. We plan to install the first set of 20 instruments in summer 2011. A required training course will be held at Bloomington, Indiana, prior to the first installations. All inexperienced participants would then take part in the initial station installs to apply course content. The remaining installs would take place in stages according to the plan outlines in Fig. 6 using teams from each of the institutions. The rolling characteristic of this experiment means the timelines can be viewed as nearly constant activity with periods of more intense activity in summer and when equipment first arrives and stations are scheduled to roll from west to east. The constant background is dominated by two activities: (1) repairing failed equipment, and (2) service runs. The former is possible because real time telemetry will allow us to know when failures occur. To avoid schedule conflicts that would increase down time costs for such maintenance trips are spread between the institutions. The second is necessary even with real-time telemetry for two reasons. First, there will inevitably be some stations without cell coverage. Second, the auxiliary recording devices currently available for the FA fill to capacity in approximately 120 days at the planned sample rate of 40 Hz. Thus we plan four-month service intervals to avoid loss of data. We are familiar with executing large experiments like this and emphasize it is manageable only if there is good communication among the different institutions and responsibilities of different parties are clear. We are taking advantage of the logistical strengths of the different types of institutions involved in the project. The Illinois and Indiana Geological Surveys have long-standing contacts with local officials and landowners. We will leverage these contacts in the permitting process. State surveys also have professional staff available for extended field assignments during winter months when students are not as available for fieldwork. We will use these staff to deploy the large groups of instruments that we anticipate to have available early in 2012 and then move them again the following winters. On the other hand, we will use student workers whenever practical providing them with valuable field experiences.
Data analysis responsibilities will be divided between the research groups at Purdue and Indiana University according to interests and expertise and will be determined relative to our most important scientific goals. We have scheduled group meeting for the entire research team twice a year. The proximity of all involved facilitates gathering for daylong meetings to discuss deployment issues, seismic observations, and results as the data set matures. The tectonic analysis and integration of data sets will take place at these group meetings and include all the PIs and their students. These meetings will also provide an opportunity for students involved on the project to get to know the students at the other institutions. Tectonic analysis will be carried out in concert with 3-D visualization analysis so that relationships among various geological features stand out and can be addressed. The locations of these meetings will rotate or occasionally take place in a location equidistant from Bloomington, West Lafayette, and Urbana. Finally, to further facilitate group dynamics among students we have budgeted for more extended student exchanges between the three locations for one person-week per year.
Broader Impacts Because of the intimate relation of this project to the arrival of the EarthScope TA, this project presents a timely opportunity to enhance geoscience education and public awareness in the region. The Midcontinent has not, traditionally, been a region of in which public awareness of geoscience is high — EarthScope provides a major opportunity to remedy this situation. An important strength of the PI team assembled for this project is that we have the foundations for building a high-impact, integrated education and outreach program linked to the project: (1) both the Indiana and Illinois Geological Surveys have comprehensive geoscience education and outreach programs upon which our program can build; (2) Hamburger and Pavlis have been leaders for more than a decade in a highly successful seismographs in schools program
(Hamburger and Pavlis (2003); see http://www.indiana.edu/~pepp); and (3) Marshak is the author of two of the most widely used undergraduate geology textbooks and is in a position to immediately place EarthScope-related methods and scientific results in undergraduate education nationwide. The commitment to education and outreach as a core component of this project is underscored by the fact that 13% of the budget is devoted to an E&O program. This funding will support six distinct efforts. (1) Professional Development Workshops. We will develop in-depth professional development workshops for in-service teachers solicited from the four-state area covered by our experiment (Missouri, Illinois, Indiana, and Kentucky). We propose a week-long workshop in Year 1, followed by shorter ‘refresher’ workshops in years 3 and 4. The workshops will be directed at earth science, physics, and environmental science instructors at the middle- and high-school level who are particularly interested in introducing authentic scientific research into their classrooms. The goal of these workshops is to produce master teachers in the four-state study area who will “spread the gospel” about EarthScope in the midcontinent to a broad audience—and who will work with us to bring EarthScope data and science into the classroom. We will follow the format of previous workshops conducted at Indiana and Purdue, and will incorporate exercises and instructional materials from IRIS’s highly successful ‘Seismographs in Schools’ workshops (see support letter from IRIS). Indiana University has agreed to provide continuing education credits at no cost to participants (see supplements). Recruitment, workshop organization, and curricular materials will be coordinated with Robert Nelson (Illinois State University), who has initiated a similar professional development program for the State of Illinois. (2) EarthScope Student Research Symposia. A unique aspect of our PEPP Earthquake Science program has been an annual student-teacher research symposium (now in its tenth year), which brings together about 30-40 high-school students from regional high schools to learn about seismology and share the results from their own independent research, mentored by PEPP high-school teachers. This has proven to be an important connection to a pool of science-oriented students including many from underrepresented groups. We propose to expand these workshops to include a wider range of schools and to focus research projects on data acquired through the EarthScope project. We will develop a clearinghouse for suggested research projects that make use of dense seismic data from USArray, provide resources to help teachers mentor student researchers, and will focus activities during our student research symposia around the USArray experiment. (3) Participation of Teacher and Student Interns. This project affords a special opportunity to provide research experience for undergraduate students and science teachers. The undergraduate internship will be done in collaboration with the IRIS REU program (see IRIS support letter). In addition to providing critical support for data analysis, this training will allow us to broaden the impact to a much larger group. The teacher interns will be able to use these skills to mentor their own students in seismology research. For the student interns, we anticipate using the internship to recruit students from other institutions—particularly including underrepresented minority students—in our research efforts, which coincides with one of the top priorities of the IRIS E&O program (see support letter from IRIS).
(4) Active Earth Displays. In order to further expand the visibility and impact of EarthScope deployments in our study area, we will collaborate with the IRIS Education & Outreach program to develop a new material on Midcontinent seismicity for their “Active Earth” museum display. Active Earth is a web-based interface that allows for widespread dissemination seismological information and real-time data incorporated into a museum style display. Our midcontinent module will include a series of interactive pages related to earthquakes, crustal structure, seismogenesis, and earthquake hazards in the midcontinent. A broad range of users of the Active Earth displays, in turn, can incorporate these. We also request funds for acquisition of two Active Earth touch-screen kiosks that could be used as ‘traveling museum exhibits’ for this

region. The displays will initially be installed at the offices of the state Geological Surveys, but will be distributed to other educational institutions for periods of 2-3 months. We have already made preliminary contacts with a number of interested museums, government organizations, and educational institutions that are interested in hosting an Active Earth display.
(5) Legacy Deployment of Educational Seismographs. Funding of this project would aid us in efforts to extend the USArray ‘Adopt-a-Station’ and Siting Outreach programs to help retain some of the USArray stations in the Midcontinent once the Transportable Array leaves our area in 2013-14. This effort could also result in an effective, long-term monitoring network for the region that could fill in persistent gaps in regional monitoring networks. We will work with participating organizations to offer a range of options for adoption, ranging from (a) full adoption of a USArray station (cost ~ $30-37K); (b) acquisition of a networked PEPP digital broadband station (cost ~$3-6K) to (c) acquisition of low-cost IRIS ‘Seismographs in Schools’ instruments (~$600); or (d) other commercial alternatives (see http://www.indiana.edu/~usesn) and IRIS Seismographs in Schools (http://www.iris.edu/hq/sis). We can build on educational materials already in place for the ‘Buyers Guide’ at the US Educational Seismology Network (see http://www.indiana.edu/~usesn). Funding for these legacy stations is not requested here. Support for this project, however, will aid our cause in working with local and state funding agencies for the future. Operation of educational seismographs will be an explicit focus of the professional development workshops in years 3 and 4 and could fold into this plan as it develops. (6) Regional Seismic Hazard Workshops. The Indiana Geological survey has an ongoing program of outreach to teacher groups and emergency management groups that will provide an outlet for products of this project. The most effective means of reaching large numbers is to take the outreach programs to the schools and communities. Regional outreach will incorporate a 3-pronged approach: 1) a day science teachers workshop, which incorporates the materials from the in-service workshops described above; 2) a “general assembly” program on earthquakes and seismicity in the Midcontinent for students in the same school corporation; and 3) an evening “town hall” program with a specific focus on elected officials and the first responders (fire, law enforcement, etc.) in the community. We request support or the E&O coordinator of the Indiana Geological Survey to allow him to develop appropriate materials and for travel connected to this activity. Support will be leveraged with matching funds from the Indiana Department of Homeland Security (see letter of support).
Michael Hamburger and Walter Gray (E&O Coordinator for the Indiana Geological Survey) will lead the E&O activities for this project. Pavlis and Parke will assist as needed. Central US Working Group
This is part of a series of proposals submitted as part of an informal, regional collaboration described in supplementary document titled “Collaboration and Coordination Statement”. The critical point is this is an agreement for free an open exchange of data between collaborators with protection mechanism for students involved in the research. See the supplement for details.
Results from Prior NSF support CMG0327827 Imaging Earth Structure with Elastic Waves by Application of the Inverse Scattering Series (Jan. 1, 2004-Dec. 31, 2008, $246,496). This project was funded by the Opportunities for Research Collaborations Between the Mathematical Sciences and the Geosciences (CMG) program. It was a partnership between Art Weglein at the University of Houston and Indiana University. Pavlis, G. L. (in review). Three-dimensional, wavefield imaging of broadband seismic array data,
Computers and Geosciences, accepted with changes subject to editorial approval. Pavlis, G L. (in review). Three-dimensional wavefield imaging of data from the USArray: New
constraints on the geometry of the Farallon Slab, Geosphere, reviewed acceptable with revisions.

Pavlis, G. L. and F. L. Vernon (2010). Array processing of teleseismic body waves with the USArray, Computers and Geosciences, doi 10.1016/j.cageo.2009.10.008.
Fan, Chengliang (2006). Extracting P-primary Transmission and Reflection Responses from Teleseismic Data, Ph.D. dissertation, Indiana University.
Fan, C., G. L. Pavlis, A. B. Weglein, and B. G. Nita (2006). Removing free surface multiples from teleseismic transmission data and reconstructing the reflection response using reciprocity and the inverse scattering series, Geophysics,71, S171-S178.
Weglein, A. B., B. G. Nita, K. Innanen, E. Otnes, S. A. Shaw, F. Liu, H. Zhang, A. C. Ramirez, J., G. L. Pavlis, and C. Fan (2006), Using the inverse scattering series to predict the wavefield at depth and the transmitted wavefield without an assumption about the phase of the measured reflection data or back-propagation in the overburden, Geophysics, 71, SI125-SI137.
EAR-0454554, Collaborative Research: Lithospheric Foundering Beneath the Sierra Nevada, H. Gilbert and with G. Zandt, 1/1/05-12/31/08, $380,525, Deployment of 80 seismic stations in the Sierra Nevada. Publications to date: numerous abstracts and: Gilbert, H., Jones, C., Owens, T.J., and Zandt, G., 2007, Imaging Sierra Nevada Lithospheric Sinking: Eos,
Tran. AGU, v. 88, p. 225&9. Frassetto, A., G. Zandt, H. Gilbert, T. J. Owens, and C. H. Jones, Improved imaging with phase-weighted
common conversion point stacks of receiver functions, Geophys. J. Int., 182, 368-374, 2010. Frassetto, A. M., G. Zandt, H. Gilbert, T. J. Owens, C. H. Jones, Lithospheric Structure of the Sierra
Nevada from Receiver Functions and Implications for Lithospheric Foundering, Geosphere, in review, 2009.
Assessing diffusive differentiation during igneous intrusion using integrated theoretical, experimental and field studies, $270,442 (C. Lundstrom, PI; Marshak, co-PI), NSF EAR 0609726 6/06-6/09. This project has funded work on temperature gradient-based experiments as well as measurements of non-traditional isotope systems in both experiments and a field study. The results provide new insight into the process of forming granitic rocks through the process of thermal diffusion. A number of important findings are already published and several more are either in review or in preparation, including: F. Huang, C.C. Lundstrom, J. Glessner, A. Ianno, A. Boudreau, J. Li, E. C. Ferré, S. Marshak, & J.
DeFrates, 2009, Chemical and isotopic fractionation of wet andesite in a temperature gradient: GCA 73, 729-749.
C.C. Lundstrom, 2009, Hypothesis for origin of convergent margin granitoids and Earth's continental crust by thermal migration zone refining, GCA 73, 5709-5729, 2009.
X. Ding, W. Sun, F. Huang, C. Lundstrom, & J. Li, 2009, High mobility and fractionation of Nb and Ta under a large thermal gradient, Intern. Geol. Rev. 51, 473-501.
F. Huang, Lundstrom, C.C., Glessner, J.G.J, Ianno, A., & Zhang, Z.F. 2009, Magnesium isotopic composition of igneous rock standards measured by MC-ICP-MS, Chem. Geol. 268, 15-23.
F. Huang, P. Chakraborty, C.C. Lundstrom, C.E. Lesher, C. Holmden, J.J.G. Glessner, and S. Kieffer, 2008, Isotopic fractionation in silicate melts by thermal diffusion, Nature 464, 396-400. C.C. Lundstrom, S. Marshak, J. DeFrates and J. Mabon, 2010, Alternative processes for developing fabric and mineral compositional zoning in intrusive rocks. Intl. Geology Review.
F. Huang, C.C. Lundstrom, 2007, 231Pa excesses in arc volcanic rocks: Constraint on melting rates at convergent margins, Geology 35, 1007-1010, 2007.
F. Huang, L. Gao, C. C. Lundstrom, 2008, The effect of assimilation and fractional crystallization on U-series disequilibria in arc lavas, GCA 72, 4136-4145, 2008.


![Intellectual Property, Tourism and Culture€¦ · Intellectual Property, Tourism and Culture SUMMARY • Research Objectives and Methodology ... AUTHENTICITY OPPORTUNITIES IP STRATEGIES]](https://static.fdocuments.in/doc/165x107/5f08ecff7e708231d424643d/intellectual-property-tourism-and-culture-intellectual-property-tourism-and-culture.jpg)