Project Scheduling.3 (final)
71
By: Ali Y. Yousef 1
-
Upload
ali-yousef -
Category
Documents
-
view
369 -
download
2
Transcript of Project Scheduling.3 (final)

By: Ali Y. YousefBy: Ali Y. Yousef 1

Project
• A project is a temporary endeavor designed to produce a unique product, service or result with a defined beginning and end (usually time-constrained, and often constrained by funding or deliverables), undertaken to meet unique goals and objectives, typically to bring about beneficial change or added value.
2

Project Success Criteria
• On time• On budget• Meeting the goals that have been agreed
upon
3

Iron Triangle
4

The Typical PMs Role Overall responsibility for the successful
planning, execution, monitoring, control and closure of a project.
Primary point of contact with project sponsors
Key tasks Plans Meets Communicates
Project Management == Leadership5

10 Qualities of a PM
1. Inspires a Shared Vision
2. Good Communicator
3. Integrity & Honesty
4. Interest & Enthusiasm
5. Empathy & Understanding
6. Competence & Skill
7. Ability to Delegate Tasks
8. Cool Under Pressure
9. Team-Building Skills
10. Problem Solving Skills
6

What does a PM do?
• Development process divides development into phases and activities
• To execute it efficiently, must allocate resources, manage them, monitor progress, take corrective actions, …
• These are all part of the PM process• Hence, PM process is an essential part of
executing a project
7

PM Process Phases
• There are three broad phases– Before: Initiating and Planning– During
• Monitoring and control• Communication facilitation
– After: termination analysis• Planning is a key activity that produces a
plan, which forms the basis of monitoring
8

Project Manager
• Project managers need both leadership and management skills, with a ability for problem solving.
• Project managers are there to plan and manage the work – NOT to do it!
• Ultimately responsible for the Project’s Success
• Plan and Act• Focus on the project’s end
9

Project management
• is the application of knowledge, skills and techniques to execute projects effectively and efficiently. It’s a strategic competency for organizations, enabling them to tie project results to business goals — and thus, better compete in their markets.
• is the process and activity of planning, organizing, motivating, and controlling resources, procedures and protocols to achieve specific goals in daily problems.
10

Project Mgmt Process Groups• Initiating – Defines and authorizes the project • Planning – Describes how the project will be
managed • Executing – Helps the project groups work
together to complete the work • Monitoring and Controlling – Checks the
progress of the project and corrects problems.
• Closing – Formally closes each phase or the project and receives approval of the project work for the phase or project.
11

Project Mgmt knowledge Areas
12
• an area of project management defined by its knowledge requirements and described in terms of its associated process, practices, inputs, outputs, tools and techniques
1. Project Integration Management
2. Project Scope Management
3. Project Time Management
4. Project Cost Management
5. Project Quality Management
6. Project Human Resource Management
7. Project Communications Management
8. Project Risk Management
9. Project Procurement Management

PM Knowledge Areas & Process Groups
PM Process Groups / Knowledge Area Processes
Initiating Process Group
Planning Process Group Executing Process Group Monitoring & Controlling Process Group
Closing Process Group
Project Management Integration
Develop Project Charter Develop Prelim Project Scope Statement
Develop Project Management Plan
Direct and Manage Project Execution
Monitor and Control Project WorkIntegrated Change Control
Close Project
Project Scope Management
Scope PlanningScope DefinitionCreate WBS
Scope VerificationScope Control
Project Time Management
Activity Definition & SequencingResource EstimatingDuration EstimatingSchedule Development
Schedule Control
Project Cost Management
Cost EstimatingCost Budgeting
Cost Control
Project Quality Management
Quality Planning Perform Quality Assurance Perform Quality Control
Project HR Management
Human Resources Planning Acquire Project TeamDevelop Project Team
Manage Project Team
Project Communications Management
Communications Planning Information Distribution Performance ReportingManage Stakeholders
Project Risk Management
Risk Management PlanningRisk IdentificationQualitative / Quantitative Risk AnalysisRisk Response Planning
Risk Monitoring and Control
Project Procurement Management
Plan Purchases and AcquisitionsPlan Contracting
Request Seller ResponsesSelect Sellers
Contract Administration Contract Closure
13

Project Integration Management• effective integration of the processes required to
accomplish project objectives• processes include
1. project charter development
2. preliminary project scope statement development
3. project management plan development
4. project execution
5. monitoring and control of project work
6. Integrated Change Control
7. Close Project
5

Project Scope Management
• defines and controls what is and is not included in the project
• processes include
1. scope planning
2. scope definition
3. creation of a Work Breakdown Schedule
4. scope verification
5. scope control
15

Project Time Management• includes processes required for the timely
completion of a project• processes include
1. defining activities
2. sequencing activities
3. estimating resource activities
4. estimating duration of activities
5. developing the project schedule
6. controlling the project schedule
16

Project Cost Management
• planning, estimating, budgeting and controlling costs to ensure the project can be completed within the approved budget
• processes include
1. cost estimating
2. cost budgeting
3. cost control
17

Project Quality Management
• all activities that determine quality policies, objectives and responsibilities for the project to satisfy the needs for which it was undertaken
• processes include
1. quality planning
2. performing quality assurance
3. performing quality control
18

Project Human Resource Management
• processes that organize and manage the project team
• processes include:
1. human resource planning
2. acquiring the project team
3. developing the project team
4. managing the project team
19

Project Communications Management
• activities to ensure project information is timely and appropriately generated, collected, distributed, stored, retrieved and disposed of
• processes include
1. communications planning
2. information distribution
3. performance reporting
4. managing stakeholders
20

Project Risk Management
• processes to increase the probability and impact of positive events and decrease the probability and impact of negative events
• updated throughout the project• processes include
1. risk management planning
2. risk identification
3. qualitative risk analysis
4. quantitative risk analysis
5. risk response planning
6. risk monitoring and control21

Project Procurement Management• processes to purchase/acquire the products, services
or results needed to perform the project work• includes contract management and change control
processes to administer contracts or purchase orders• processes include:
1. planning purchases and acquisitions
2. contract planning
3. requesting seller responses
4. selecting sellers
5. contract administration
6. contract closure
22

PM Knowledge Areas & Process Groups
PM Process Groups / Knowledge Area Processes
Initiating Process Group
Planning Process Group Executing Process Group Monitoring & Controlling Process Group
Closing Process Group
Project Management Integration
Develop Project Charter Develop Prelim Project Scope Statement
Develop Project Management Plan
Direct and Manage Project Execution
Monitor and Control Project WorkIntegrated Change Control
Close Project
Project Scope Management
Scope PlanningScope DefinitionCreate WBS
Scope VerificationScope Control
Project Time Management
Activity Definition & SequencingResource EstimatingDuration EstimatingSchedule Development
Schedule Control
Project Cost Management
Cost EstimatingCost Budgeting
Cost Control
Project Quality Management
Quality Planning Perform Quality Assurance Perform Quality Control
Project HR Management
Human Resources Planning Acquire Project TeamDevelop Project Team
Manage Project Team
Project Communications Management
Communications Planning Information Distribution Performance ReportingManage Stakeholders
Project Risk Management
Risk Management PlanningRisk IdentificationQualitative / Quantitative Risk AnalysisRisk Response Planning
Risk Monitoring and Control
Project Procurement Management
Plan Purchases and AcquisitionsPlan Contracting
Request Seller ResponsesSelect Sellers
Contract Administration Contract Closure
23

Time Management
24

• The process of converting a general or outline plan for a project into a time-based graphic presentation using information on available resources and time constraints.
What is Scheduling?
25

Project Management Process
Next Launch the Plang Recruit and organize project
teamg Establish team operating
rulesg Level project resourcesg Assign work
Then Monitor & Control Progress
g Establish progress reporting system
g Set up change control processg Define problem escalation
processg Monitor progress vs. plang Revise project plan
Finally Close Out Projectg Obtain client acceptanceg Install project deliverablesg Complete project
documentationg Complete post-implementation
auditg Issue final project report
Then Develop Detailed Plan
g Identify project activitiesg Estimate activity durationg Determine resource
requirementsg Construct / analyze project
networkg Prepare project schedule
Start with Define the Project
g State need, problem or opportunity
g Define project objectivesg Identify success criteriag List assumptions, risks and
obstaclesg Define project scope and work
breakdown structureFeedbackWe are here
26

Elements of Developing a Project Plan
ClientSOW
WorkBreakdown Structure
ActivityDefinition
ResourcePlanning
ResourcePool
ActivitySequencing
ActivityDuration
Estimating
CostEstimating
ScheduleDevelopment
WorkPackages
Project PlanDevelopment
27

· To obtain the best detailed schedule, you must first have:– A Work Breakdown Structure (WBS). – A list of activities derived from each Work
Package. – A list of activities timing.– Staffing and resources required, or available, for each activity.
Preparing a Schedule
28

Create a work breakdown structure (WBS) “The Work Breakdown Structure (WBS) is the foundation for defining the project’s work as it relates to the objectives and establishes a structure for managing the work to its completion. The WBS defines: the project’s work in terms of activities that create deliverables.
First: Identify the project’s statement of work and main
tasks.
Second: Start by listing the major pieces (summary
tasks) of the project, and then map out the minor pieces within each major
piece.
Third: Continue to break down each piece until you
have sufficient level of detail (activities) to support your
plan. 29

Estimate Activities Duration
• Expert Judgment• Analogous estimating• Parametric estimating• Three-point estimating• Reverse Analysis
Start with estimate the time it will take to
complete each activity: Hourly, Daily, Weekly.
Then identify the Early start, Early Finish, Late
Start and Late Finish for each activity.
30
1. Identify the predecessor and the successor for each
activity.
2. Sequence the activities by determining the
dependencies relations among activities (FS, SS,
FF, SF).
Create DependenciesA dependency occurs when the start or finish of one activity depends
upon the start or finish of another
31

Assign Resources
• Manpower• Equipment• Material
1. Estimate the resources for each
activity:
2. Level the resources: resource assignments drive the duration for
each activity, the duration shortens or
lengthens as resources are added or removed
from an activity.
32

33

34

REPRESENTING & SCHEDULING PROJECT PLANS
The Most commonly used methods are :-
GANTT CHART
NETWORK DIAGRAMS (PERT/ CPM)
35

GANTT CHART• A graphical representation of a Project that shows
each task as a horizontal bar whose length is proportional to its time for completion.
• A GANTT Chart is a horizontal bar chart that illustrates a Project schedule.
• In the GANTT Chart Time is displayed on the horizontal axis and the Tasks/ Activities are arranged vertically from top to bottom, in order of their start dates.
• A detailed GANTT Chart for a large project might be quite complex and hard to understand. To simplify the chart Project manager can combine related activities into one Task.
36

GANTT CHART
A graphical representation of a Project that shows each task as a horizontal bar whose length s proportional to its time for completion.
GANTT CHART do not show how tasks must be ordered (precedence) but simply show when a task should begin and should end
GANTT Chart is often more useful to for depicting relatively simple projects or sub projects of a large project, the activities of a single worker, or for monitoring the progress of activities compared to scheduled completion dates..
37

GANTT CHART
38

NETWORK DIAGRAM Is a graphical depiction of Project tasks and their
inter-relationships.
The distinguishing feature of a Network Diagram is that the ordering of Tasks is shown by connecting with its predecessor and successor tasks. tasks.
Network Diagramming is a Critical Path Scheduling Technique used for controlling resources.
CRITICAL PATH SCHEDULING
A scheduling technique whose order and duration of a sequence of task activities directly affect the Completion Date of a Project
39

NETWORK DIAGRAM
You would use a Network Diagram when Project Tasks:-
Are well defined and have clear beginning and end point
Can be worked on independently of other tasks
Are ordered
Serve the purpose of project
40

PROGRAM EVALUATION REVIEW TECHNIQUE (PERT)
• One of the most difficult and most error prone activities when constructing a Project Schedule is the determination of the TIME DURATION for each task within a Work Breakdown Structure (WBS), specially when there is a high degree of complexity and uncertainty about a task.
• PERT is a technique used to calculate the Expected Time for a tasks.
• PERT is a technique that uses Optimistic time (O), Pessimistic time (P) and Realistic Time (R) estimates to calculate the EXPECTED TIME (ET) or a particular task.
41

PROGRAM EVALUATION REVIEW TECHNIQUE (PERT)
• PERT is a technique that uses Optimistic time (o), Pessimistic time (p) and Realistic Time (r) estimates to calculate the EXPECTED TIME (ET) or a particular task.
• The Optimistic time (o) and Pessimistic time (p) reflects the minimum and maximum possible periods of time for an activity to be completed.
• The Realistic time (r) or the Most likely time , reflects the Project manager’s “Best Guess” of the amount of time required for a task completion.
42

PROGRAM EVALUATION REVIEW TECHNIQUE (PERT)
CALCULATING EXPECTED COMPLETION TIME (ET)
o + 4r + p ET = ------------------- 6
Because the expected Completion time should be closer to the realistic time (r), it is typically weighed Four times more than the Optimistic time (o) and the Pessimistic time (p). Once you add these values together , it must be divided by 6 to determine the Expected Time for a task.
43

HOW TO CONSTRUCT A NETWORK DIAGRAM (PERT / CPM)
DEVELOPING A NETWORK DOAGRAM IS A FOUR STEP PROCESS:-
1. Identify each Project Activity to be completed
2. Determine Time estimates and calculate Expected Completion Time for each Activity
3. For each Activity, identify the immediate predecessor Activities
4. Enter the Activities with connecting arrows based on Dependencies and calculate Start and End times based on Duration and Resources.
44

PERT CHART SYMBOLSSLACK TIME:-
The Slack Time available for any Task is equal to the difference between the Earliest completion Time (ECT) and the Latest Completion Time (LCT)
SLACK TIME = (LCT – ECT)
CRITICAL PATH:- Is a sequence of Dependent Tasks that have the Largest sum of
Estimated Time (ET). IT is the Path that has no Slack Time built in.
• The Critical Path on PERT chart is shown with thick Dark line.
• To find the Critical Path begin with identifying all alternative paths that exist from Event 1 to the Final Event.
45

46

GANTT CHART vs PERT CHART
47

GANTT CHART vs PERT CHART• GANTT chart visually shows the duration of Tasks
whereas a PERT chart visually shows the sequence dependencies between tasks.
• GANTT visually shows the Time overlap of Tasks whereas a Network does not show time overlap but does show which tasks could be done in parallel.
• Some form of GANTT chart can visually show Slack Time available within an Earliest Start and Latest finish time..
• Most Project Managers find PERT very helpful for scheduling, monitoring and controlling Projects.
• PERT is recommended for Large Projects with high intertask dependencies and the GANTT chart for simpler Projects.
• Most Project Management Case Tools nowadays (eg. MS-Project ) allow the best feature of PERT to be incorporated into GANTT Charts. 48

Earned Value Management • Earned Value, EV or BCWP• Planned Value, PV or BCWS (after leveling!)• Actual Cost of Work Performed, AC or ACWP• Schedule Variance: SV = EV - PV (negative $=trouble)• Cost Variance: CV = EV - AC (negative $=trouble)• Schedule Performance Index: SPI = EV/PV (<1=trouble)
• (My favorite – you get this one free! Stay on schedule & you’ll stay on budget.)
• Cost Performance Index: CPI = EV/AC (<1=trouble) CV (%) = CV/EV SV (%) = SV/PV
49

Cost Management
50

What is Cost and Project Cost Management?
• Cost is a resource sacrificed or foregone to achieve a specific objective or something given up in exchange
• Costs are usually measured in monetary units like dollars
• Project cost management includes the processes required to ensure that the project is completed within an approved budget
51

Cost Management Plan
• A cost management plan is a document that describes how the organization will manage cost variance on the project
• A large percentage of total project costs are often labor costs, so project managers must develop and track estimates for labor
52

Project Cost Management Processes
• Cost estimating: developing an approximation or estimate of the costs of the resources needed to complete a project
• Cost budgeting: allocating the overall cost estimate to individual work items to establish a baseline for measuring performance
• Cost control: controlling changes to the project budget
53

Basic Principles of Cost Management
• Most members of an executive board better understand and are more interested in financial terms than project terms, so project managers must speak their language– Profits are revenues minus expenditures– Profit margin is the ratio of revenues to profits– Life cycle costing considers the total cost of
ownership, or development plus support costs, for a project
– Cash flow analysis determines the estimated annual costs and benefits for a project and the resulting annual cash flow 54

Basic Principles of Cost Management• Tangible costs or benefits are those costs or
benefits that an organization can easily measure in dollars
• Intangible costs or benefits are costs or benefits that are difficult to measure in monetary terms
• Direct costs are costs that can be directly related to producing the products and services of the project
• Indirect costs are costs that are not directly related to the products or services of the project, but are indirectly related to performing the project
• Sunk cost is money that has been spent in the past; when deciding what projects to invest in or continue, you should not include sunk costs
55

Basic Principles of Cost Management (continued)
• Learning curve theory states that when many items are produced repetitively, the unit cost of those items decreases in a regular pattern as more units are produced
• Reserves are dollars included in a cost estimate to mitigate cost risk by allowing for future situations that are difficult to predict– Contingency reserves allow for future
situations that may be partially planned for (sometimes called known unknowns) and are included in the project cost baseline
– Management reserves allow for future situations that are unpredictable (sometimes called unknown unknowns)
56

Types of Cost Estimates
57
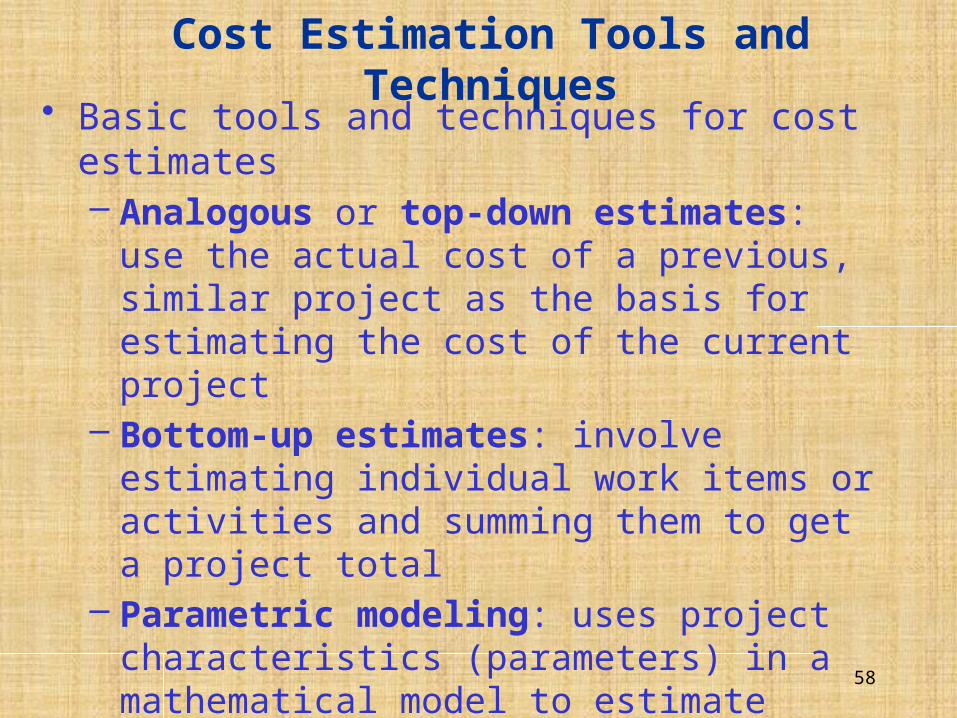
Cost Estimation Tools and Techniques• Basic tools and techniques for cost estimates
– Analogous or top-down estimates: use the actual cost of a previous, similar project as the basis for estimating the cost of the current project
– Bottom-up estimates: involve estimating individual work items or activities and summing them to get a project total
– Parametric modeling: uses project characteristics (parameters) in a mathematical model to estimate project costs
– Three-Points Estimates – PERT: uses Program Evaluation and Review Technique 58

Cost Budgeting
• Cost budgeting involves allocating the project cost estimate to individual work items over time
• The WBS is a required input to the cost budgeting process since it defines the work items
• An important goal is to produce a cost baseline– A time-phased budget that project managers
use to measure and monitor cost performance
59

Cost Control
• Project cost control includes:– Monitoring cost performance– Ensuring that only appropriate project
changes are included in a revised cost baseline
– Informing project stakeholders of authorized changes to the project that will affect costs
• Many organizations around the globe have problems with cost control
60

Earned Value Management (EVM)
• EVM is a project performance measurement technique that integrates scope, time, and cost data
• Given a baseline (original plan plus approved changes), you can determine how well the project is meeting its goals
• You must enter actual information periodically to use EVM
• More and more organizations around the world are using EVM to help control project costs
61

Earned Value Management Terms• The planned value (PV), formerly called the
budgeted cost of work scheduled (BCWS), also called the budget, is that portion of the approved total cost estimate planned to be spent on an activity during a given period
• Actual cost (AC), formerly called actual cost of work performed (ACWP), is the total of direct and indirect costs incurred in accomplishing work on an activity during a given period
• The earned value (EV), formerly called the budgeted cost of work performed (BCWP), is an estimate of the value of the physical work actually completed
• EV is based on the original planned costs for the project or activity and the rate at which the team is completing work on the project or activity to date 62

Earned Value: Example
On Day X:• PLANNED VALUE (Budgeted cost of the work
scheduled, BCWS) = 18 + 10 + 16 + 6 = 50• EARNED VALUE (Budgeted cost of the work
performed, BCWP) = 18 + 8 + 14 + 0 = 40
• ACTUAL COST (of the work performed , ACWP) = 45 (from your project tracking - not evident in above
chart) 63
18
8
14
Today

Earned Value: Example
64
Co
st (
Pe
rso
n-H
our
s)
Time (Date)
Planned Value: what your plan called for sending on the tasks planned to be completed by this date.
Today
Earned Value: value (cost) of what you have accomplished to date, per the base plan.
Actual Cost: what you have actually spent to this point in time.
Budgeted (Planned) Spending
Actual Spending
Earned Value

Earned Value: Example
65
Co
st (
Pe
rso
n-H
our
s)
Time (Date)
Today
Budgeted (Planned) Spending
Actual Spending
Earned Value Behind Schedule
Over Budget

Variance• Any schedule or cost deviation from a specific plan.• Used within an organization to verify the budget and
schedule for a project• Frequently used as a key component of plan reviews and
performance measurement• Must compare scheduling and budget variance at the
same time– Schedule variance: deviations from work planned – not
a measure of changes in cost– Cost variance: deviations from the
budget – not a measure of work scheduled vs. work completed• Example: applying more $$/people to a task may
maintain the schedule, but it adds to cost… schedule on track… over budget on expenses (cost)66

Performance Indices
• Cost Performance Index– CPI = BCWP/ACWP
• Schedule Performance Index– SPI = BCWP/BCWS
• Analysis– CPI > 1.0 exceptional performance– CPI < 1.0 poor performance– Similar for SPI
67

Earned Value & Variance: Example
On Day X:• PLANNED VALUE (BCWS) = 18 + 10 + 16 + 6 = 50• EARNED VALUE (BCWP) = 18 + 8 + 14 + 0 = 40• ACTUAL COST (ACWP) = 45 (from your project tracking)Therefore:• Schedule Variance = BCWP – BCWS = 40 - 50 = -10 (behind
schedule)• Schedule Performance Index = 40 / 50 = 0.8, or 80% of plan • Cost Variance = BCWP - ACWP = 40 - 45 = -5• Cost Performance Index = 40/45 = .89, or you’re getting an
89¢ return on every $1.00 (or, person-hour) spent on this project 68
18
8
14

The need for project management is becoming increasingly apparent in the world today. Speed, quality, and cost control are taking on increased significance in business, government, and non-profit sectors. Project management allows managers to plan and manage strategic initiatives that generate new revenue in expanding sectors of the market. Project management tools decrease time to market, control expenses, ensure quality products, and enhance profitability. Project management helps to sell products and services by positively differentiating them from their competitors. Project management is one of the most important management techniques for ensuring the success of an organization.
WHY PROJECT MANAGEMENT IS NECESSARY IN TODAY'S WORLD
69

• That's it! Now, you're ready to present your management plan and to use it to track and manage your project.
70

Ali Y. Yousef - Project Support Specialist. B.Eng., PMP ® @ CBCL LimitedLocation: Halifax, NS Canada Industry: Mechanical Engineering
Previous Companies: SBM Offshore, Halifax - CanadaGulf House of Trade and Contacting Co., Doha - QatarEl Concorde Ltd. Amman - Jordan
Professional MembershipJordanian Association Engineers (JAE)American Society of Mechanical Engineers (ASME)Canadian Council of Professional Engineers (CCPE)Project Management Institute (PMI ID No.2316875)
Email:[email protected]
71