
PROJECT REPORT - Sreeja Nagsreejanag.com/Documents/JPLReport2008_SN.pdf · THEMIS and MOC images by...
47
Page 1 of 47 PROJECT REPORT Sreeja Nag (Summer Intern - Jet Propulsion Laboratory, California Institute of Technology) [email protected] Advisor : Dr. Paul R. Lundgren NASA Planetary Geology and Geophysics Undergraduate Research Program INTRODUCTION Mars has long been known to share many similarities with Earth. Geologic and evolutionary differences are explained largely by differences in size and orbital distance from the Sun. Perhaps the single most apparent feature of Mars is its crustal dichotomy, as represented by its global topography and crustal thickness variations [Zuber et al., 2000; Zuber, 2001; Neumann et al., 2004]. Graben and pit craters are found over much of Mars and may be closely linked to both the creation of large flood events and the channeling of fluids in its subsurface. Determining the causes of the large numbers of fractures, graben, and pit crater chains on Mars is fundamental toward understanding the structural development of the planet‟s surface and the interaction of the mantle with the near surface and surface environment. Our objectives are: To understand the 3-D structures and processes related to graben and pit crater variability in size and distribution. To determine the effects of regional stresses on the development of groups of fracture systems. For example, this would include understanding what controls the parallel variations in graben and pit crater sizes in some areas.. We focused on graben and pit crater chains of the Alba Patera region. (Figure 1) To constrain models for the mechanics and development of these graben-pit catenae structure, 3-D numerical mechanical analyses has been proposed, of which I shall be using boundary element modeling to help understand both individual, and complex groups of graben and pit chains on Mars. The models will account for the interaction of structures in the graben and pit chains. The numerical modeling will yield surface displacements and stress fields that will be directly compared to the structures at the surface of Mars as seen in MOLA topography, and MOC and THEMIS images. Graben and pit crater chains or catenae are found extensively on Mars, with fractures and graben in many places extending for hundreds of kilometers. Many of these are associated with plume-related uplift and volcanism of the Tharsis region [Tanaka, 1990; Wilson and Head, 2002]. Whether graben and pit crater chains are associated with regional tectonic extension or long radial dikes is not entirely clear. The mechanism for pit crater formation is a matter of debate, with more than one process possible for different sets of pit craters. By their very nature, pit craters have
Transcript of PROJECT REPORT - Sreeja Nagsreejanag.com/Documents/JPLReport2008_SN.pdf · THEMIS and MOC images by...

Page 1 of 47
PROJECT REPORT
Sreeja Nag (Summer Intern -
Jet Propulsion Laboratory, California Institute of Technology)
Advisor : Dr. Paul R. Lundgren
NASA Planetary Geology and Geophysics Undergraduate Research Program
INTRODUCTION
Mars has long been known to share many similarities with Earth. Geologic and evolutionary differences are explained largely by differences in size and orbital
distance from the Sun. Perhaps the single most apparent feature of Mars is its
crustal dichotomy, as represented by its global topography and crustal thickness variations [Zuber et al., 2000; Zuber, 2001; Neumann et al., 2004]. Graben and pit
craters are found over much of Mars and may be closely linked to both the creation of
large flood events and the channeling of fluids in its subsurface. Determining the
causes of the large numbers of fractures, graben, and pit crater chains on Mars is fundamental toward understanding the structural development of the planet‟s
surface and the interaction of the mantle with the near surface and surface
environment. Our objectives are:
To understand the 3-D structures and processes related to graben and pit
crater variability in size and distribution.
To determine the effects of regional stresses on the development of groups of
fracture systems. For example, this would include understanding what controls the parallel variations in graben and pit crater sizes in some areas..
We focused on graben and pit crater chains of the Alba Patera region. (Figure 1)
To constrain models for the mechanics and development of these graben-pit catenae
structure, 3-D numerical mechanical analyses has been proposed, of which I shall be
using boundary element modeling to help understand both individual, and complex groups of graben and pit chains on Mars. The models will account for the interaction
of structures in the graben and pit chains. The numerical modeling will yield surface
displacements and stress fields that will be directly compared to the structures at the
surface of Mars as seen in MOLA topography, and MOC and THEMIS images.
Graben and pit crater chains or catenae are found extensively on Mars, with
fractures and graben in many places extending for hundreds of kilometers. Many of these are associated with plume-related uplift and volcanism of the Tharsis region
[Tanaka, 1990; Wilson and Head, 2002]. Whether graben and pit crater chains are
associated with regional tectonic extension or long radial dikes is not entirely clear. The mechanism for pit crater formation is a matter of debate, with more than one
process possible for different sets of pit craters. By their very nature, pit craters have

Page 2 of 47
been considered to form either as the direct result of shallow crustal fluids or
volatiles, or if from a magmatic or tectonic mechanism, then above structures that are likely conduits for fluid flow in the near surface [Wyrick et al., 2004]. The main
candidates proposed include:
1) Karst processes
2) Opening mode cracks 3) Dike intrusion
4) Dilation above a normal fault
BASIC APPROACH
We applied 3-D numerical software that take into account the full 3-D displacements
and stress fields generated by fracture systems under a range of crustal conditions
and that account for mechanical interaction. Our primary observational constraint
for these models for Mars was the surface topography, which requires assembling MOLA profiles. Our approach was to apply a 3-D boundary element code [Poly3D; Thomas, 1993; Okubo and Martel, 1998] to test which types of structures (i.e. normal
faults, tensile cracks or dikes) beneath graben systems best fit the surface topography by matching the elastic solution in half space (details later). An important
contribution of these 3D numerical models is the ability to test complex source
structures. Observations of Mars suggest more than one type of mechanism is present (e.g., simple graben and radial dikes). We tested different source models and
stress conditions by comparing the numerical solutions for fault slip and surface
displacement with surface observations.
Initially for Mars, we considered stress conditions that favor the development of pit
craters and grabens rather than trying to model the micromechanics of their actual
development. We used observations on pit crater distribution and size a posteriori to evaluate subsurface models. The primary constraints on model parameters (e.g.
fracture location, geometry, sense of slip) comprised topography and imagery
observations. We explored a range of stress drops on faults and driving pressures on dikes to evaluate model sensitivity to those parameters and developed forward models
to understand the main differences between the candidate source types (i.e., tensile
fractures, normal faults at depth, and dikes). Depending on the data quality and
surface structure complexity, inverse models could be developed, but this is more time consuming than developing simpler forward models, and may be beyond the
scope of this project.
BACKGROUND
Similar approaches have been followed, implemented on a variety of Martian terrains
and published over the last decade. The data and forward models have mainly been
2D, hence more literature is available for approximately E-W trending features
because the MOLA profiles from the MGS are the primary source of data. Since the
MGS is in polar orbit, the MOLA profiles intersect EW trending features almost

Page 3 of 47
orthogonally, making the data more reliable. Schultz et al (2004) investigated the
Tharsis radial grabens within Memnonia region of Mars by fitting topography over a
simple graben with a dike intrusion and forcing multiple such events (Figure 2a).
They also introduced an “hourglass” model since it agreed with data that showed
fault offsets decreasing toward fault tips (2000) as shown in Figure 2b. Direct surface
topography can be linked to the modes of formation via observation too. Okubo and
Schultz (2005), at SE Alba Patera and Valles Marines, demonstrated that
Characteristic concave-up surface topography is usually produced by two normal
faults, concave-down produced by a dike intrusion and a mixed mode also possible
(Figure 2c). Asymmetry can be due to single normal faults, antithetic faulting,
unequal fault dips and offset magnitudes on either side of the graben. An example of
NS trending grabens is the analysis by Polit et al (2005) of Alba Patera where the
region was divided into two regions of different faulting depths due to different depth
restrictions. A 3D investigation of the Valles Marines grabens was done by Schultz
and Lin (2001) using standard geodetic inversion of fault-related topography. Two
profiles were concentrated upon, boundary element method was used to understand
displacement dependency on fault parameters and the trench floor was used as the
datum plane to finally sketch a strength envelope for the region. (Figure 2d)
DATA
MOC and THEMIS have made it possible to incorporate structural analysis of fault
systems to evaluate their potential influence on permeability in the martian crust.
Quantifying the extent and degree of fault network connectivity with provide key
constraints for hydrological models. We used THEMIS images, available at the online
image repository to select a potential target site to begin modeling relatively simple
3D grabens. The approximate mural is shown in Figure 3a. The THESIS instrument
(Thermal Emission Imaging System) is aboard the Mars Odyssey Spacecraft. It
produces images of resolution 18m/pixel (visual images) and 100m/pixel (IR images).
„Thermoclinometry‟ is a technique used to extract the quantitative component of
THEMIS and MOC images by using frequency band analysis to separate albedo and
thermal inertia effects from topographic component [Kirk et al, 2003; Soderblom et al,
2002; Gaddis et al, 2005]. Atmospheric effects are removed to derive DEM. The Mars
Orbital Camera narrow angle image for the same area is also shown (Figure 3b, 3c).
The MOC is aboard the Mars Global Surveyor. It takes photographs of resolution 1.5-
12m/pixel (Narrow angle), 240 m/pixel (Wide angle) and 7.5 km/pixel (daily global
imaging). Unfortunately, HiRise data is not available for the selected region, due to
the high resolution, the data coverage of Mars is quite limited. The selected region
spans 21.5 to 24 degrees latitude and 265.6 to 288 degrees longitude.

Page 4 of 47
The Mars Orbitor Laser Altimeter aboard the Mars Global Surveyor provided 143
MOLA profiles passing through the selected region and 75629 shots in total. It gives
range measurements along profile every ~300 m along MGS ground track. The
resolution on MOLA groundtrack is 300 m with footprint of each measurement being
168m. Vertical ranging errors are between 0.23m to 10m (for slopes 1-30o
respectively).
The MOLA profiles are available as Precision experiment data records (PEDRs) via
NASA‟s Planetary Data System. The data is made usable by converting it to .TAB
files using a pedr2tab executable, having specified the region of interest to extract the
20 shot MOLA frames within. Crossover corrections are implemented and the height
data along long-lat are extracted from the TAB files using Matlab. The output txt file
is used in GMT and the blockmean decimation routine implemented. Finally, the
surface routine (tension parameter T=0.5, convergence limit C=1) is used to make the
2D gridfile with x-y resolution of 200 pixels/degree (~60km/grid spacing). The
surface routine uses continuous spline in tension method of interpolating curved
surfaces and has a curvature of 70935.9. The spatial density of observations varies
inversely with pixel size, RMS Error is 0.0403891 and the total no. of iterations is
1549 in 6 parts. Grdgradient is used to apply artificial illumination (Min artificial
intensity used = -36512.9, Max artificial intensity used = 41760.4) and pswiggle
shows the position of some MOLA profiles in the 2D interpolated figure. The entire
process of data extraction is shown in the form of a flowchart (Figure 4). To check the
interpolated quality of the data, the MOLA profile ap20107l.TAB was removed from
the data, the rest of the profiles to interpolate the grid, GMT routine grdtrack used to
extract the topography along the removed profile from the grid and compared with
the original. The figure (Figure 5) shows a good match, hence the interpolated grid
can be used for the purpose of modeling. GMT routine grd2xyz converts the grid into
a Matlab readable format (Figure 3d, 3e), where from profiles can be extracted.
The main reason for choosing this region was the presence of a graben whose depth
increases, almost linearly, in the along strike direction. The shallowest part pinches
out as the end of the graben with a slight offset before ending. The deeper part almost
resembles a hole after which the depth of the graben abruptly rises, and the width
abruptly narrows in the form of a pit crater chain i.e. along strike features from west
to east is a deepening graben, followed by a very deep crater followed by a pit crater
chain. If 2D profiles were taken across the graben and analysed, it should yield
similar results to previous works. It is the 3D structure of the graben that is
interesting and a 3D analysis, like the one we are using, may yield informative
results. It must be noted however, that grabens may be deeper than they seem due to
sediments in wedges.

Page 5 of 47
The MOLA profiles (129 in number) were windowed to keep only the region of
interest, i.e. the graben system, constrained within two parallel lines: lat =
0.7143*long -168.1429 and lat = 0.8333*long -199.3333. The sliced profiles are
shown in Figure 6. It can be seen that there is a gap in data/profiles around the
region of maximum depth. Since the grid size is less than this gap between
successive MOLA profiles (at times), interpolation may cause artifacts to form as
shown in the profile extracted from the gridded DEM (Figure 7b). The sudden rise in
topography within the deepest data points seems to be an interpolation artifact. The
DEM can be used for a 3D view of any area and to decide the course of modeling to
use, however for detailed fitting, depth points considered for along graben profiles
rather than fitting lines through the graben strike direction. Similarly, MOLA profiles
considered for cross-graben profiles rather than extracting profiles (Figure 7a) to
avoid spurious artifacts. East-west ramp is removed by picking latitudinal profiles
and detrending.
The latitude-longitude position of the deepest points in the graben system which is
assumed to be the graben‟s strike direction is shown in Figure 8a. The depth of each
of these points is plotted in Figure 8b. Depth is calculated by fitting a line (by the
least mean square method) over the topographic profile perpendicular to the graben
strike, subtracting the height of the line from the actual depth of the graben at the
same x-y point. Approximate width of the graben at each of the points shown in
Figure 8a is plotted in Figure 8c and slope in Figure 8d, i.e. along the strike of the
graben. The erratic distribution could be attributed to small residual features as
opposed to representing the regional trend. Slope is calculated by half width by
depth.
The system can be supposed to have two types of asymmetry- along strike and across
strike (complicated by a ramp-topography of the area). A fault dominated model was
attempted to explain the cross strike asymmetry. Since it does not yield convincing
results, it is detrended and assumed symmetrical for the time being.
MODELING
Boundary element method is used to run forward models using POLY3D, which is a
C language computer program that calculates displacements, strains and stresses
induced in an elastic whole or half space by planar, polygonal-shaped elements of
displacement discontinuity. Boundary conditions can take the form of either relative
displacements or tractions. Poly3d has been modified to account for gravitational
body forces in a manner similar to its two-dimensional counterpart TWODD [Martel,
2000]. The polygonal element represents some part of the fracture or fault surface
which is acts as the source. The displacement field is continuous everywhere except

Page 6 of 47
across the element itself. Boundary conditions can be burger vectors or traction (from
which burger vectors are calculated) or mixed mode. (Figure 9a)
Angular dislocation is a linear function of the three Burgers vector components where the Uij are displacement influence coefficients for the angular dislocation..
More specifically Uij gives the displacement component, ui, at position, x , resulting
from a Burgers vector component, bj, of unit magnitude on an angular dislocation
defined by ξ , β, and ω. —Uij is directly related to strain influence coefficients Eijk by:
In general, an N-sided polygon requires 2N angular dislocations, so the total
displacement field is given by:
Stress is related to strain via Hooke’s Law:
where μ is the shear modulus, λ is LamŽ's lambda, δij is the Kroenecker delta, where S are the stress influence coefficients for an N-sided polygonal element. Hence, via
boundary element modeling displacements can be calculated from burger
vectors/boundary tractions and from the displacements, stress and strains may also
be calculated.
The input parameters required are the physical parameter constants, the coordinate
systems for all the calculations, exact geometry of the source in the form of
coordinates of all vertices of the elements (numbered correctly) and orientation with
respect to each other in the case of multiple sources, observation grids and stress
conditions. A Matlab GUI is used to define the input parameters (modified and
rewritten to suit this particular problem), which is mexed into the C code. A planar
geometrical approach is shown in Figure 9b. The output file gives the displacements,
stresses and principal stresses at each point on the observation grid.
The analysis was initiated using a simple graben modeled by two normal faults
dipping toward each other with a dike intrusion at the base (Figure 10). The dike is
forced to have a tensile opening (uniform) while linearly increasing the hydrostatic
stress at the rate of 8.162 MPa/km with depth. This calculation is done using simple

Page 7 of 47
hydrostatic pressure (g = 3.71m/s2) exerted by the magma chamber over a particular
depth. Density of magma varies with depth but using the model from Wilson and
Head, 2002 a uniform density of 2200 km/m3 is adopted (Figure 10). The normal
faults have zero stress conditions. These conditions are maintained for the following
models too. A number of such forward models were run, changing sequentially the
input parameters to observe the effect on the surface displacements. The aim is to
decide on a suitable starting model for the fault-dike system which causes
displacements similar to the ones that can plausibly cause the observed Martian
topography. This starting model can then be used to run a 3D inversion to solve for
the displacement discontinuities which caused this topography. Knowledge of the
source geometry and intensity can give us valuable information about the mechanism
of development of this geological feature. This can prove to be important because
there is a dense grid of tension cracks immediately east of this deepening graben
system, a feature speculated to be an indicator or fluvial systems.
The input parameters that were varied are:
Basic source geometry (two normal faults and an intrusive dike, a dike
intruding an asymmetric normal fault, a single normal fault causing a tensile
opening, the graben-dike system with a cylindrical magma intrusion on one
side, dike intrusion whose horizontal extent exceeds the normal faults,
plunging normal faults with a dike intrusion)
Dip of the graben
Dip of the dike
Ratio of the depth of the graben with respect to depth of dike
Vertical separation between graben and magma intrusion
Horizontal separation between the 2 legs of normal faults
Along-strike length of the fault-dike system to check edge effects and the
displacement-length ratio (which is an indicator of mechanical restriction at
depth)
Stress conditions (horizontally varying linearly, vertically varying linearly,
constant throughout)
The effect of the above modeling changes are shown in Figure 11 a-e with detailed
explanations alongside the figures. Although, this process provided valuable insight
into the kind of source needed to match the profile of the graben shoulders, none of
the dike-graben simple structures could explain the asymmetry in depth of the data.
To bring in the asymmetry, the tensile opening was forced to vary linearly along
strike, however that increased upthrow rather than increase depth. A cylindrical
intrusion was included on one end, which again did not cause the effect needed. The

Page 8 of 47
cylinder represents the upwelling of a thin magma chamber that is the source of
stress that spreads horizontally, along strike, to form the dike opening. Since the
latter process has not been modeled and added to the displacement solution, both
the models show an unnaturally high and sudden positive displacement at the point
where the stress is concentrated (Figure 12, 13). Although, both the above models do
bring in an along-strike asymmetry but we resorted to a plunging graben system to
explain the asymmetry seen in the data.
As the length increased, the displacement to length ratio increased slightly then
continued indicating that the faults are probably restricted by a mechanical
boundary [Polit et al, 2005]. However, if a segmented echelon geometry exists [Goudy
& Schultz, 2005], lower than expected rations may be measured. Hence, length ratios
do not seem to be a very dependable factor to constrain crustal dichotomy, at least in
this area (Figure 11d).
PLUNGING GRABEN SYSTEM
The along-strike asymmetry was modeled using a pair of normal faults which dipped
toward each other and along plunged along-strike leading to a smoothly plunging
graben with a dike intrusion at its base. This system is modeled using trapeziums as
the normal faults and the dike as opposed to rectangular sections as before. The
geometrical controls for each trapezium are as follows: [1] Strike φ (width of the
graben opening), [2] Dip ψ (Steepness of the graben), [3] Trapezium angle θ (marked in
Figure 14), [4] Plunge of the normal fault contact P, [5] Length of the trapezium sides
L(asymmetry of plunge), [6] Depth at which the graben begins h, [7] Width of the
graben W(surface horizontal extent of the feature). Out of the 4 angles, only 2 are
independent so as to make the 2 trapeziums touch each other to form a graben with
the plunging edge CB and edge DA at the Martian surface as shown in Figure 14. The
dike intrusion touches the base of the graben, CB. The angle of ABCDA with the
vertical is the dip and the angle DEC in the side view is the plunge P. To, find the
exact relations between the 7 parameters in terms of the 3 independent terms, the
following equations are used:
These equations eventually simplify to:

Page 9 of 47
… Eq (1)
… Eq (2)
… Eq (3)
Evidently, for any model, atmost 2 of the angles, one among h and L to determine the
size of the fault sides and width of the faults (W for horizontal extent) can be
specidifed. The angular dependence can be clearly seen in Figure 15. The dike is also
modeled as a trapezium whose θ is equal to (90-P), P being the plunge of the graben
system. The length L of the dike is chosen according to how deep it needs to be,
width in accordance to width of the graben (since lateral extension causes artifacts
seen in Fig. 11) and the strike being the average of the strikes of the normal faults.
Once these parameters are determined, the polygonal elements used to model the
shapes are a combination of rectangular and trapezoidal. All the vertices and element
numbers are calculated and fed into poly3d for forward modeling.
From modeling experiments using the plunging model and stress conditions as
before, the following facts are inferred:
The cross-graben vertical displacement solution shows a graben width similar
to the distance between the normal faults at the surface at that point. In other
words, the strike does not change from model to solution (Figure 16a). This is a
decisive factor and is kept as an independent variable.
Plunge of the actual displacement solution is about 5 orders of magnitude less
than the plunge of the source model (Figure 16b). Hence, this is not a decisive
factor and can be kept as a dependent variable.
The graben walls in actual displacement solution are much steeper than those
of the source model (Figure 16a). Also, as proven in Figure 11a, as the dip of
the model faults decreases, the solution graben walls become steeper. This is a
decisive factor and is kept as an independent variable.
Trapezium angle must be very large, i.e. the normal fault segments should be
almost rectangular in order to avoid unrealistic solutions resulting from models
like in Figure 16c. From Figure 15, high θ agrees with the calculations that
strike should be very low when dip is high. Hence, it is safe to keep this
variable as dependent on dip and strike.
To calculate the strike, the data distribution (Figure 8) is used which shows width to
vary from 3km to 6km approximately over a graben length of ~150km. From Figure
17, strike ~1 degree. Since such a small value is giving rise to artifacts, strike is
approximated to be 2 degrees. Data also shows dip of 70-80 degrees, hence model dip

Page 10 of 47
should be higher, eventually selected as 85 degrees. The final model (scaled down in
distance) and vertical displacement solution is shown in Figure 18. As expected, an
along-strike asymmetry is seen while maintaining graben formation and as the faults
in the model (above) widen and deepen, the graben in the solution widens and
shallows out due to the dike going further away from the surface.
RESULTS AND CONCLUSION
Since detrending the topography removed the cross-graben asymmetry considerably,
the modeling concentrates on attempting to explain the along-graben asymmetry.
Individual profiles cutting across the graben (MOLA profiles) are compared with
profiles extracted from the POLY3D solution on the 2D observation grid, at similar
points along the graben. The results are shown in Figure 19. In (A), the dike dip is
almost 90 degrees hence the profile is symmetrical while in (B), cross-graben
asymmetry is brought about by modeling the dike dipping at 75 degrees. Many of the
profiles show that the cross-strike topographic profile of a graben is asymmetric, i.e.,
one side is concave-up and the other side is concave-down (Figure 6). This
asymmetric profile is attributed to unequal fault dips and offset magnitudes on either
side of the graben [e.g., Rubin, 1992; Schultz et al., 2004].
Figure 20 compares the along-graben profile of Martian topography data (red curve)
and the plunging model vertical displacement solution (blue curve). The model (strike
divergence of normal faults = 2 degrees, dip of faults = 85 degrees, plunge = 25.74
degrees) plunges from left to right and the deepest point is approximately at X=0,
Y=150 km as shown in Figure 18. The strike is forced to match the width of the
graben varying from 2.5km to 6 km. The vertical displacements caused by the
plunging model do deepen but exponential decrease in topography is only possible if,
at the deepest point of displacement solution, the tensile extensive stress is high
enough to cause a pit crater to form. The tensile component of stress along the
graben is calculated by adding the X-components of the 3 principal stresses. A scaled
version is plotted as the black curve in (A) and the actual version (for unit tensile
boundary condition on the dike) in (B). The graben is along the Y-axis so the tensile
opening will be along X. It is maximum toward the beginning of the profile where
vertical displacement is maximum, i.e. the point at which the dike is closest to the
ground surface. This increase in extensive tensile component due to the plunging
model may lead to the formation of a large pit crater at the deepening end of the
graben, as seen in the data. Further along the strike, the tensile stress component
decreases hence the depth of the pit craters decrease. This is clearly seen in the MOC
images in Figure 21.
Page 11 of 47
The offset between the two grabens as seen at 266.15 deg longitude and 22.3 deg
latitude in Figure 8a, can be explained by a segmented fault-dike system as shown in
Figure 22. The system to the west of the offset does not seem to be a plunging system
because the depth of the graben along that segment is uniform (corresponds to the
segment between 25 km to 70 km along profile in Figure 8b). The system to the east
of the offset is proven to be a plunging system from east to west, as described earlier,
with varying dike dip and offset to explain the variation in cross-graben symmetry. As
the graben continues eastward, the extensive (negative) stress increases in the cross-
graben (along X-axis) direction and beyond a particular point causes pit crater to
open up. We see this in the DEM topography as a deepening graben culminating in a
very deep pit crater. The formation of this structure relieves the strain considerably
and the pit crater chain following along the same strike, decreases in depth toward
the east.
FUTURE WORK
The work done in the project was an initiation to the approach of intertwining Poly3d
modeling and data from MOC, THEMIS and MOLA in order to explain the formation
of the structures at Alba Patera. A candidate site was selected for the same, the
approach applied and an approximate explanation cited. In order to justify the
purpose of the project, more such sites will be selected, modeled and a pervasive
mechanism suggested for the formation of the Tharsis graben and pit crater chains.
ACKNOWLEDGEMENTS
This research was carried out at the Jet Propulsion Laboratory, California Institute of
Technology, and was sponsored by NASA PGGURP and the National Aeronautics and
Space Administration. I would like to express my deepest sense of gratitude to my
supervisor, Dr. Paul Lundgren for expert guidance and support throughout the
project work, Dr. Steve Martel for valuable insight into the problem, the JPL/Beacon
and the CalTech SFL for the huge amount of reading material and the Student
Faculty Programs Office and the PGGURP Committee for making this trip, halfway
across the Globe, possible not only in terms of excellent research experience, the
greatest friends and an opportune career launcher but also for allowing me a
wonderful summer-full of memories to take home with me.
REFERENCES
Cailleau, Beatrice et al, Unveiling the origin of radial grabens on Alba Patera volcano by finite element modeling, Icarus, Volume 176, Issue 1, p. 44-56, 07/2005. Ferrill, David et al, Dilational fault slip and pit chain formation on Mars, GSA Today, pp. 4–12, DOI: 10.1130/1052-5173(2004)014
Page 12 of 47
Gaddis, L. et al, High-resolution topography of layers in the Valles Marineris via „Thermoclinimetry‟, Thirty-Sixth Lunar and Planetary Science Conference, 2005
Goudy, Cheryl L., Schultz, Richard A., Dike intrusions beneath grabens south of Arsia Mons, Mars, Geophy. Research Letters, VOL. 32, L05201, doi:10.1029/2004GL021977, 2005 Kirk, R.L. et al, High-resolution topomapping of candidate MER landing sites with Mars Orbiter Camera narrow-angle images, Journal of Geophysical Research, Volume 108, Issue E12, pp. ROV 29-1, 12/2003. Martel, S.J, Muller, J.R, A Two-dimensional Boundary Element Method for Calculating Elastic Gravitational Stresses in Slopes, Pure and Applied Geophysics, Volume 157, Issue 6-8, pp. 989-1007 (2000). Neumann, G. A., M. T. Zuber, M. A. Wieczorek, P. J. McGovern, F. G. Lemoine, and D. E. Smith, Crustal structure of Mars from gravity and topography, J. Geophys. Res., 109,
E08002, doi:10.1029/2004JE002262, 2004. Okada, Yoshimitsu, Surface deformation due to shear and tensile faults in a half-space, Bulletin of the Seismological Society of America; August 1985; v. 75; no. 4; p. 1135-1154 Okubo, C. H., and S. J. Martel, Pit crater formation on Kilauea volcano, Hawaii, J. Volcanol. Geotherm. Res., 86, 1-18, 1998. Okubo, C. H.; Schultz, R. A., Evidence of Tharsis radial dike intrusion in Southeast Alba Patera from MOLA-based Topography of Pit Crater Chains,36th Annual Lunar and Planetary Science Conference, March 14-18, 2005, in League City, Texas Okubo CH, Schultz RA, Evidence Of Normal Faulting And Dike Intrusion At Valles Marineris From Pit Crater Topography, Thirty-Sixth Lunar and Planetary Science Conference, 2005 Okubo, C. H. et al, Gridding Mars Orbiter Laser Altimeter data with GMT: effects of pixel size and interpolation methods on DEM integrity, Computers & Geosciences, Volume 30, Issue 1, February 2004, Pages 59-72
Polit, A. T. et al, A Tale of Two Stratigraphies: From Alba Patera to the Northern Plains, 36th Annual Lunar and Planetary Science Conference, March 14-18, 2005, in League City, Texas Roberts, G.P. et al, Possible evidence for on-going volcanism on Mars as suggested by thin, elliptical sheets of low-albedo particulate material around pits and fissures close to Cerberus Fossae, Earth, Moon, and Planets, Volume 101, Issue 1-2, pp. 1-16 Schultz, R.A., Lin, Jian, Three-dimensional normal faulting models of the Valles Marineris, Mars, and geodynamic implications, Journal of Geophysical Research, Volume 106, Issue B8, p. 16549-16566, 08/2001. Schultz, R.A. et al, Igneous dikes on Mars revealed by Mars Orbiter Laser Altimeter topography, Geology; October 2004; v. 32; no. 10; p. 889-892; DOI: 10.1130/G20548.1

Page 13 of 47
Schultz, R.A. et al, Revised model for simple planetary grabens and tectonic implications, Proceedings of the 31st Lunar and Planetary Science Conference, Lunar and Planetary Institute, Houston, 1990.
Tanaka, K. L., Tectonic History of the Alba Patera-Ceraunius Fossae region of Mars, Proceedings of the 20th Lunar and Planetary Science Conference, pp 515-523, Lunar and Planetary Institute, Houston, 1990. Soderblom, L.A. et al, Accurate Fine-Scale Topography for the Martian South Polar Region from Combining MOLA Profiles and MOC NA Images, 33rd Annual Lunar and Planetary Science Conference, March 11-15, 2002, Houston, Texas Thomas, A. L., POLY3D: A three-dimensional, polygonal element, displacement discontinuity boundary element computer program with application to fractures, faults and cavities in the Earth‟s crust, M.S. Thesis, Stanford University, 41 pp, 1993. Wilson, L., and J. W. Head III, Tharsi-radial graben systems as the surface manifestation of
plume-related dike intrusion complexes: Models and implications, J. Geophys. Res., 107, E8, 5057, doi:10.1029/2001JE001593, 2002. Wyrick, D., D. A. Ferrill, A. P. Morris, S. L. Colton, and D. W. Sims, Distribution, morphology, and origins of Martian pit crater chains, J. Geophys. Res., 109, E06005, doi:10.1029/2004JE002240, 2004. Zuber, M. T., The crust and mantle of Mars, Nature, 412, 220-227, 2001. Zuber, M. T., S. C. Solomon, R. J. Phillips, et al., Internal structure and early thermal evolution of Mars from Mars Global Surveyor topography and gravity, Science, 287, 1788-1793, 2000.

Page 14 of 47
FIGURES AND TABLES
Figure 1: Topography from the MOLA MEGR database of the Alba Patera region.
Black wiggly line is an example of a MOLA PEDR trace with its 1000 m vertical scale in lower right, and the map scale in the lower left.

Page 15 of 47
Figure 2a : Normal fault and dike geometry proposed in Schultz et al, 2004 to explain
the cross-sectional (symmetrical) profile of most of the Martian graben systems. The
paper suggests that three consecutive events were necessary to produce the stress
required to cause the observed deformation.
Figure 2b: The „hourglass‟ model for surface-breaking planetary grabens as proposed
in Schultz et al, 2000. The fault sets shown can retrodeform using dip-slip offsets.

Page 16 of 47
Figure 2c: A characteristic concave-up surface topographic profile produced by two
normal faults and a concave-down topography produced by a dike intrusion. In a lot
a cases, a mixed-mode is also observed.
Figure 2d: Map showing fault geometries used in 3-D boundary element modeling of
the entire trough system. Dashed curves show profiles for which individual BEM solutions were compared against MOLA topography; numbers denote the fault
segments. Surface breaks of the segments are indicated by solid symbols on heavy
curves. (Schultz and Lin 2001)

Page 17 of 47
.
Figure 3a: Arrangement of THEMIS images (numbers marked within) of the
graben/region of interest with the approximate latitude in degrees (Y axis), longitude
in degrees (X axis) marked. The length of the feature, along strike, is about 240km.

Page 18 of 47
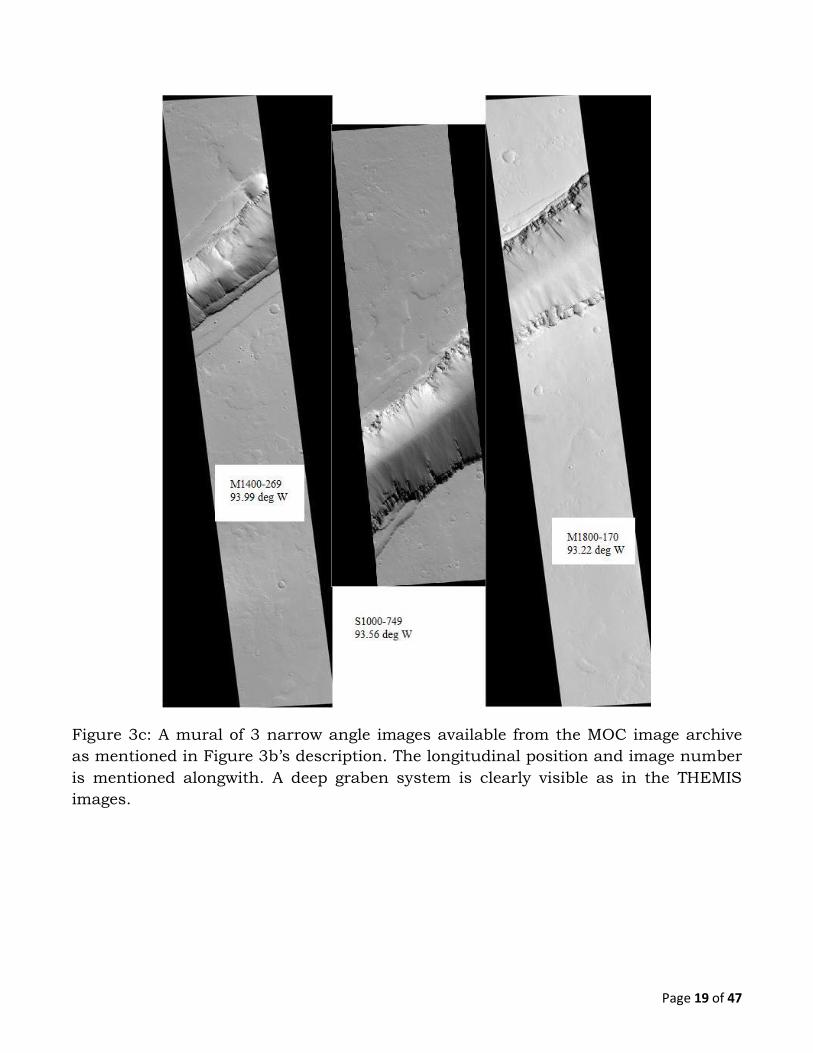
Figure 3b: http://www.msss.com/moc_gallery/ has the narrow and wide angle MOC
images captured from 1999-2005. The view shown above is a small part of the
Tharsis region which we chose as a candidate site. The blue spots, on the figure to
the left are regions where the narrow angle MOC images are available. The figure to
the right is the wide-angle MOC image (M14-00270) of the region of interest, height =
117.68 km and width = 121.55 km.
Page 19 of 47
Figure 3c: A mural of 3 narrow angle images available from the MOC image archive
as mentioned in Figure 3b‟s description. The longitudinal position and image number
is mentioned alongwith. A deep graben system is clearly visible as in the THEMIS
images.
Page 20 of 47
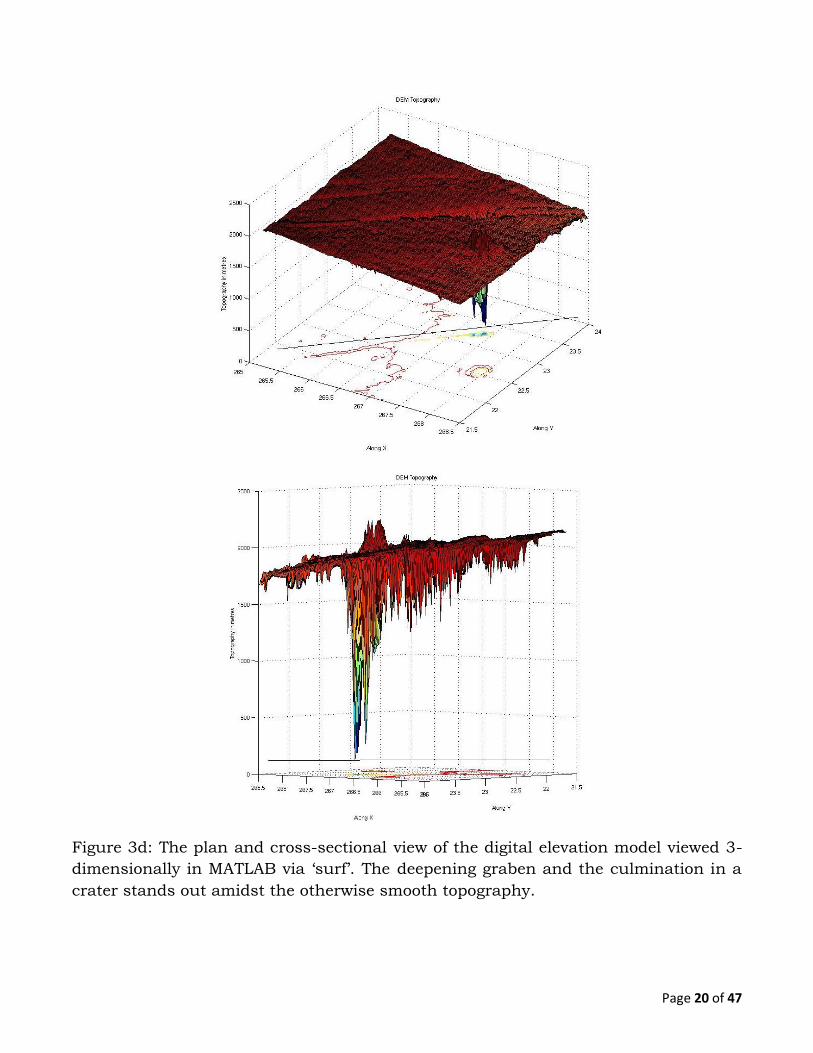
Figure 3d: The plan and cross-sectional view of the digital elevation model viewed 3-
dimensionally in MATLAB via „surf‟. The deepening graben and the culmination in a
crater stands out amidst the otherwise smooth topography.

Page 21 of 47
Figure 3e: GMT generated DEM of the region of interest. The feature to concentrate
upon is the graben with a slight offset toward the west and culminating in a large
crater toward the east.

Page 22 of 47
Figure 4: Flowchart showing the conversion of MOLA PEDRs to a MATLAB exportable
DEM (left sequence). The files and parameters required for each step is indicated on
the right side.

Page 23 of 47
Figure 5: To check the interpolated quality of the data, the MOLA profile ap20107l
was removed from the data, the rest of the profiles to interpolate the grid, GMT
routine grdtrack used to extract the topography along the removed profile from the
grid and compared with the original.
Page 24 of 47
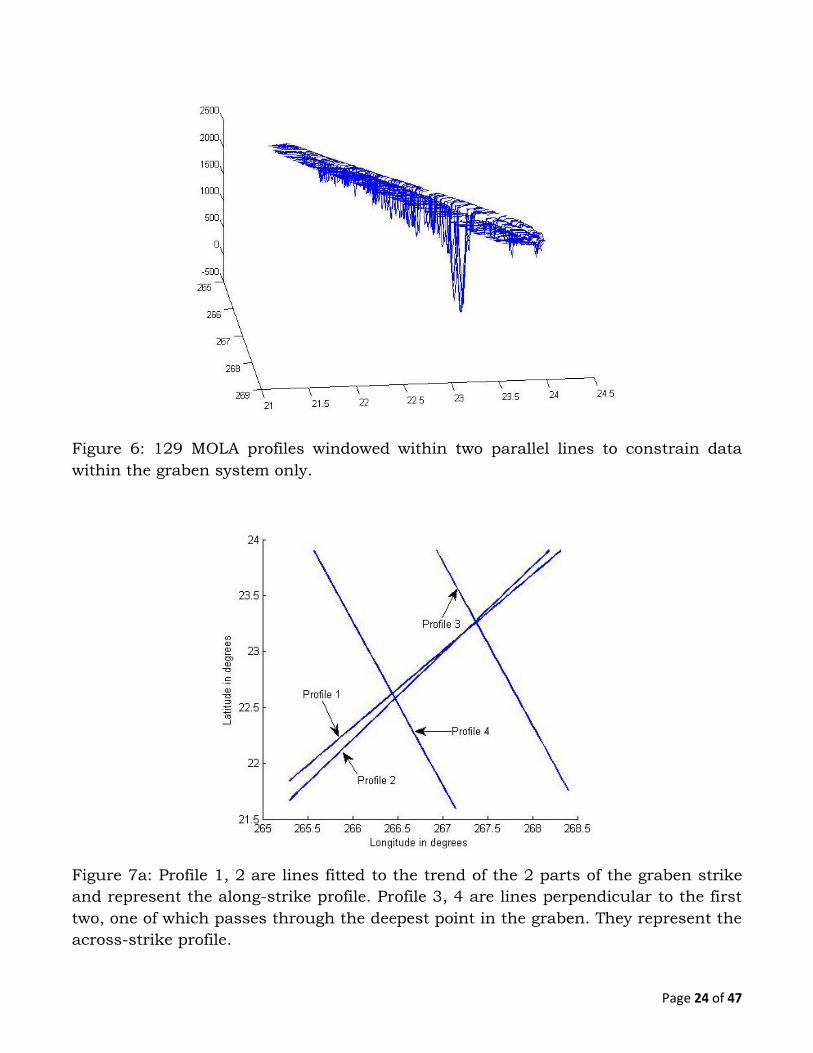
Figure 6: 129 MOLA profiles windowed within two parallel lines to constrain data
within the graben system only.
Figure 7a: Profile 1, 2 are lines fitted to the trend of the 2 parts of the graben strike
and represent the along-strike profile. Profile 3, 4 are lines perpendicular to the first
two, one of which passes through the deepest point in the graben. They represent the
across-strike profile.

Page 25 of 47
Figure 7b: Topography extracted from the gridded DEM along Profile 1. The sudden
rise in topography within the deepest data points seems to be an interpolation
artifact.
Figure 8a: The latitude-longitude position of the deepest points in the graben system
which is assumed to be the graben‟s strike direction. The offset at longitude 266.15E

Page 26 of 47
can clearly be seen. The deepest points were chosen from the MOLA profiles passing
through the region of interest constrained within two parallel lines: lat = 0.7143*long
-168.1429 and lat = 0.8333*long -199.3333.
Figure 8b: A depth profile is plotted from the depth of the above points. Depth is
calculated by fitting a line (by the least mean square method) over the topographic
profile perpendicular to the graben strike, subtracting the height of the line from the
actual depth of the graben at the same x-y point.

Page 27 of 47
Figure 8c: Approximate width of the graben at each of the points shown in Figure 8a,
i.e. along the strike of the graben. The erratic distribution could be attributed to
small residual features as opposed to representing the regional trend.
Figure 8d: Approximate slope of the graben at each of the points shown in Figure 8a
calculated by half width by depth. The erratic distribution could be attributed to
incoherences in width as explained above.

Page 28 of 47
Figure 9a: As per Thomas, 1993‟s PLOY3D code, the polygonal element with the
specified burger vectors is shown (top). An N sided polygon has 2N angular
dislocations. The elements are arranged onto the fault plane (below), coordinates
specified and solution calculated at the observation grid specified – in our case
ground surface.
Page 29 of 47
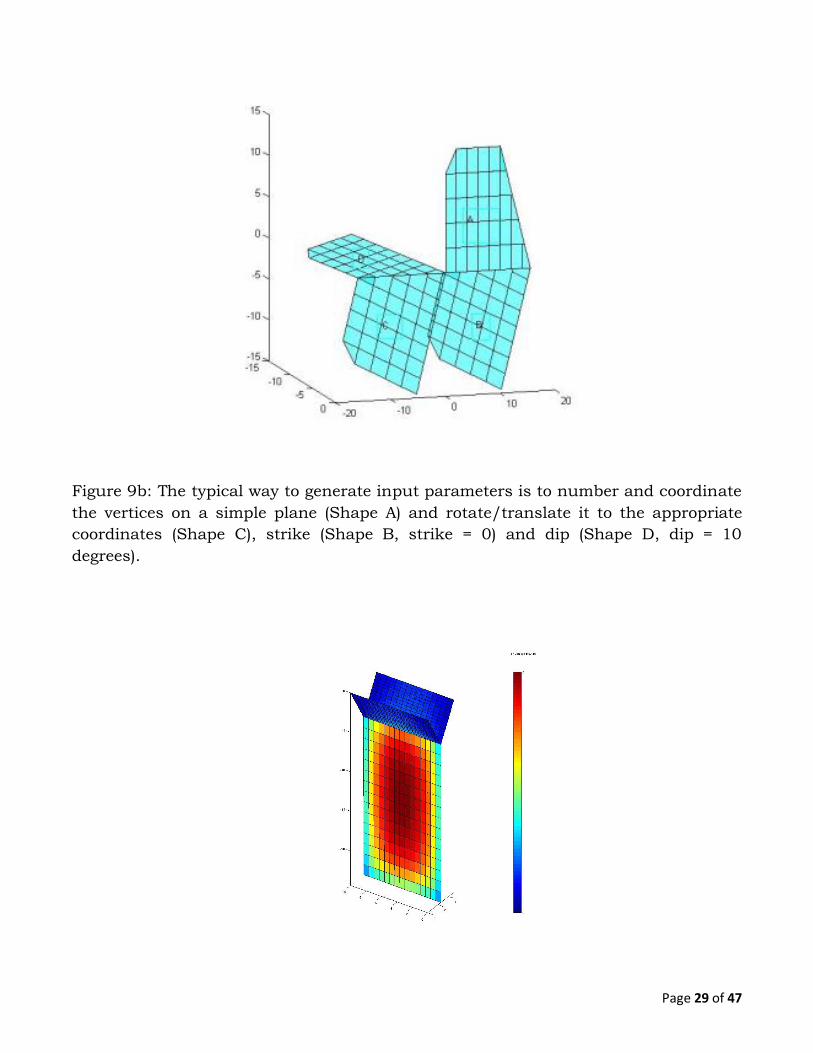
Figure 9b: The typical way to generate input parameters is to number and coordinate
the vertices on a simple plane (Shape A) and rotate/translate it to the appropriate
coordinates (Shape C), strike (Shape B, strike = 0) and dip (Shape D, dip = 10
degrees).
Page 30 of 47
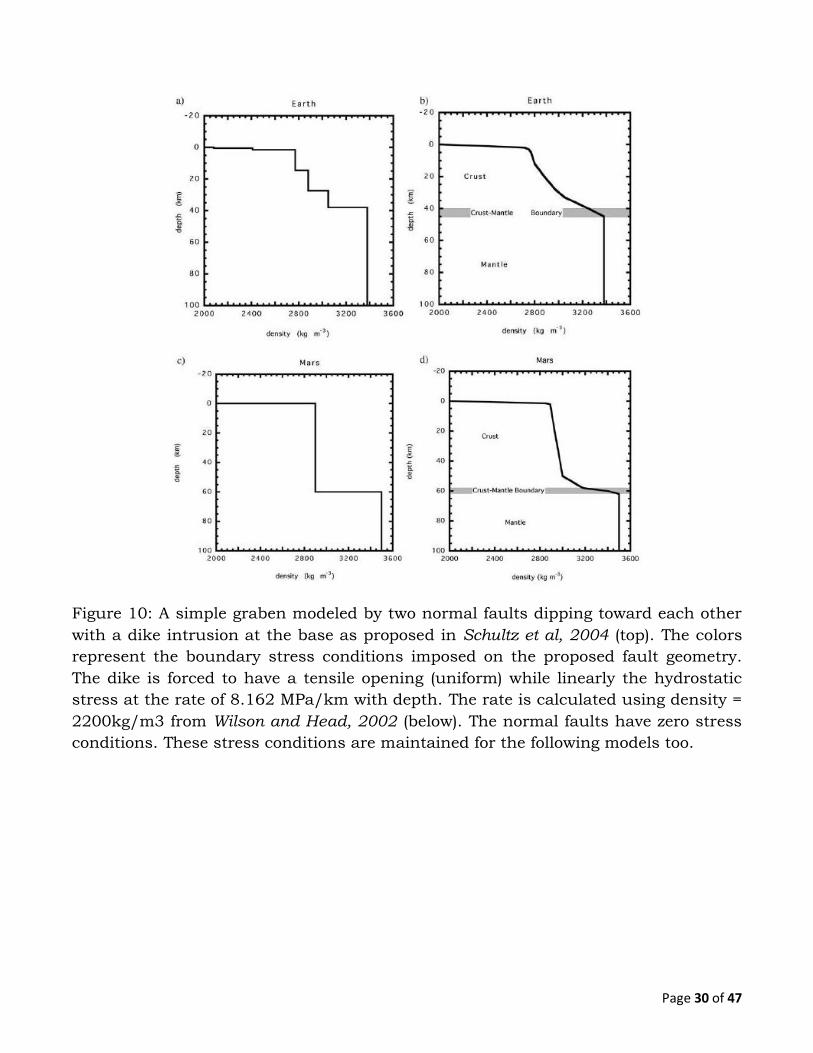
Figure 10: A simple graben modeled by two normal faults dipping toward each other
with a dike intrusion at the base as proposed in Schultz et al, 2004 (top). The colors
represent the boundary stress conditions imposed on the proposed fault geometry.
The dike is forced to have a tensile opening (uniform) while linearly the hydrostatic
stress at the rate of 8.162 MPa/km with depth. The rate is calculated using density =
2200kg/m3 from Wilson and Head, 2002 (below). The normal faults have zero stress
conditions. These stress conditions are maintained for the following models too.

Page 31 of 47
Figure 11a: The system in Figure 10 is tested with different dips of the normal faults,
with the tip of the fault system being constant in space and the vertical (u3)
displacement is plotted along two profile lines. Decreasing dip causes higher
shoulders of the graben as seen in the cross-graben profile (top). Decreasing dip
causes a flatter along-graben profile (down) where the deepest point will be at the
centre of the graben system. Lower the dip, the closer the dike opening comes to the
ground surface, hence more the upthrow.

Page 32 of 47
Figure 11b: The system in Figure 10 is tested with a horizontal gap (sep) between the
normal faults, with the tip of the fault system being constant in space and the
vertical (u3) displacement is plotted along an across graben profile line (top).
Similarly, an isolated dike which has not reached the graben system is modeled
(below) and cross-graben vertical displacement modeled. The depression seen the
topography is primarily due to the dike opening as is obvious from the above
experiments.

Page 33 of 47
Figure 11c: Across strike asymmetry in figure 10‟s model is possible only if the dike
has a dip (top). Less the dip, more the asymmetry – dip = 90 deg is modeled as 89.9
deg because poly3d cannot handle vertices directly below one another, hence the
slight asymmetry. Along strike (bottom), symmetry is maintained and less the dip,
closer the dike to the ground and more the displacement.

Page 34 of 47
Figure 11d: As the length increased, the displacement to length ratio decreased
slightly indicating that the faults are probably restricted by a mechanical boundary
(Polit et al, 2005). However, if a segmented echelon geometry exists (Goudy & Schultz,
2005), lower than expected rations may be measured. The figure shows an erratic
solution for horizontal and vertical displacements (u1,u2,u3) with increasing length –
across graben profiles plotted.

Page 35 of 47
Figure 11e: A cross-graben profile of the vertical displacements is shown (top) for a
dike that extends horizontally below the normal faults (bottom). More the extension,
more the height of the shoulders of the graben. Non-uniform extension, i.e. the
upwelling of the magma around the normal faults leads to very high shoulders. Since
this is not observed in the data, this model was rejected.

Page 36 of 47
(A)
(B)
Figure 11f: (A) is a model of a normal fault at depth, which when activated causes the
plane above it to open up horizontally. Thus, a graben may form even in the absence
of a dike. The vertical plane is forced to have a tensile opening and zero stress on the
fault. (B) shows the vertical displacement solution over the 2D grid. There is an
expected asymmetry across the graben, which is not desired. Modeling experiments
show that as dip of faults increases, the displacement decreases. Also, the deeper the
normal fault, more the displacement due to more opening.

Page 37 of 47
Figure 12: The model on the left forces a tensile opening on the dike increasing
linearly from left to right while the boundary tractions on the normal faults is yet
zero. The introduction of the cylindrical magma chamber to the right brings about the
same stress conditions in the dike more realistically. The displacement solutions
using these models is thus, very similar.
(A)

Page 38 of 47
(B)
(C)
Figure 13a: (A) shows the vertical displacement from the model in 11f over the
2D observation grid. The cross and along graben profiles are also marked. (B)
shows an along graben profile for a model where the cylinder reaches the
surface (long cyl) and one where it terminates at the dike depth (short cyl). The
magma upwelling causes an unrealistic surge of u3. (C) shows the across
graben profile.
Page 39 of 47
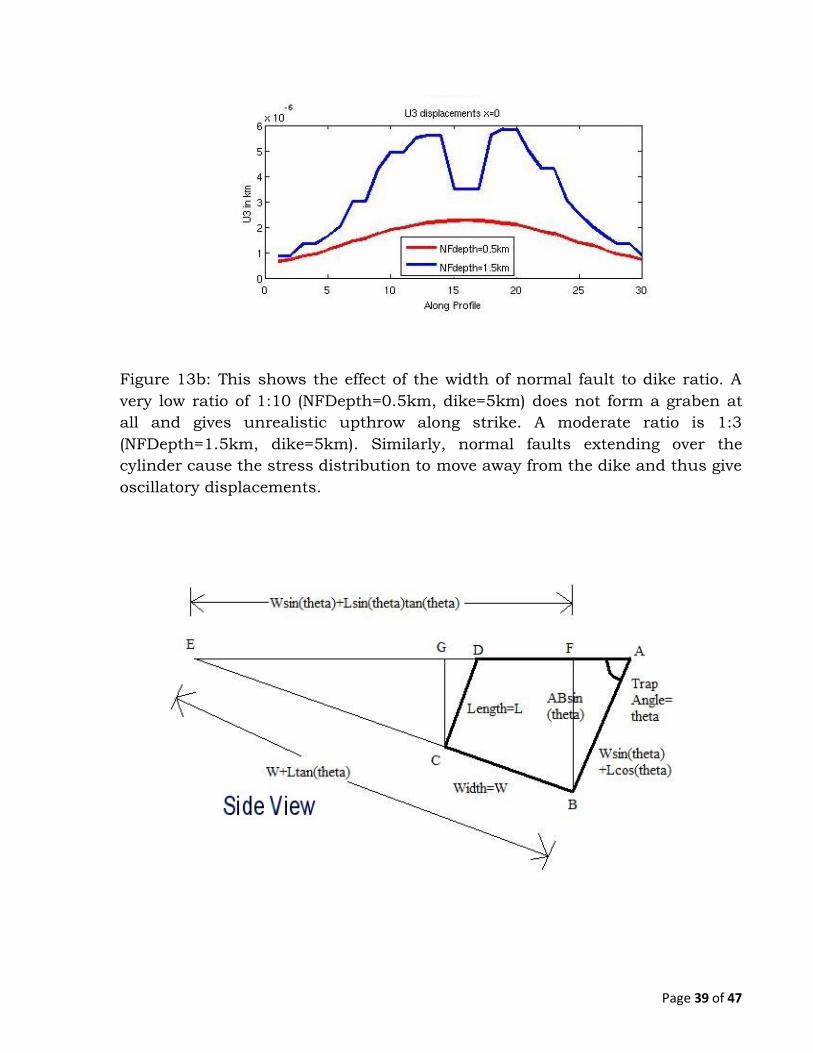
Figure 13b: This shows the effect of the width of normal fault to dike ratio. A
very low ratio of 1:10 (NFDepth=0.5km, dike=5km) does not form a graben at
all and gives unrealistic upthrow along strike. A moderate ratio is 1:3
(NFDepth=1.5km, dike=5km). Similarly, normal faults extending over the
cylinder cause the stress distribution to move away from the dike and thus give
oscillatory displacements.
Page 40 of 47
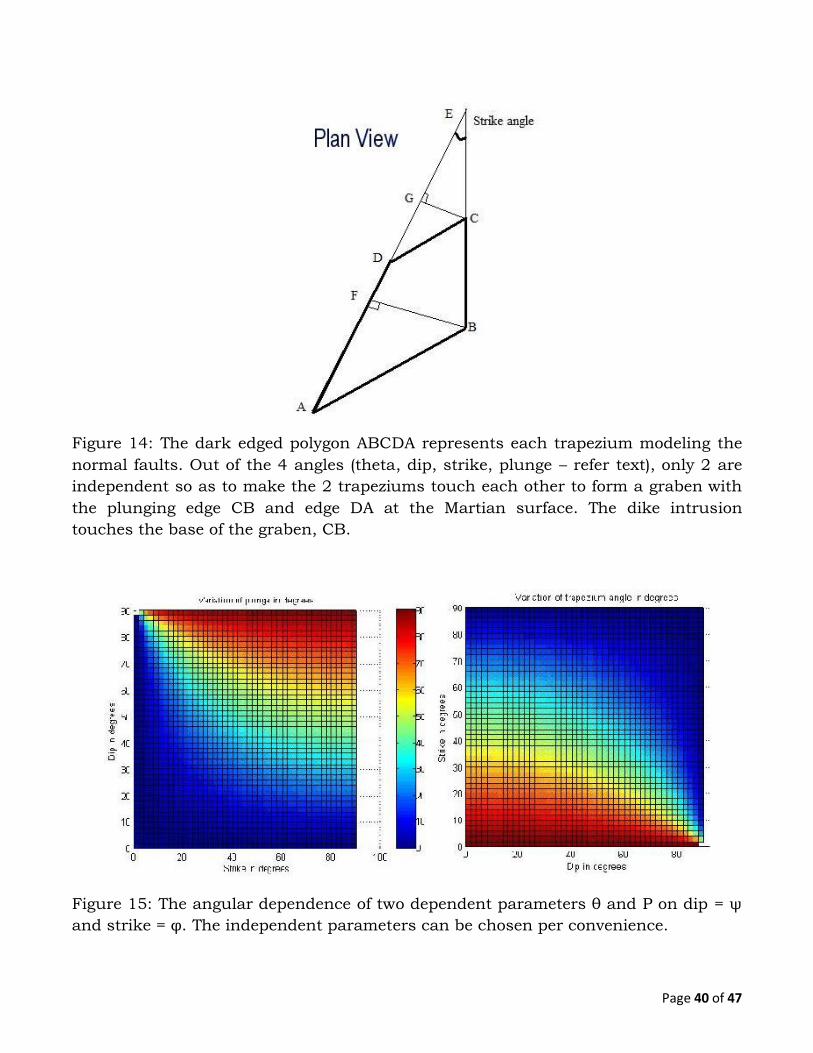
Figure 14: The dark edged polygon ABCDA represents each trapezium modeling the
normal faults. Out of the 4 angles (theta, dip, strike, plunge – refer text), only 2 are
independent so as to make the 2 trapeziums touch each other to form a graben with
the plunging edge CB and edge DA at the Martian surface. The dike intrusion
touches the base of the graben, CB.
Figure 15: The angular dependence of two dependent parameters θ and P on dip = ψ
and strike = φ. The independent parameters can be chosen per convenience.

Page 41 of 47
(A)
(B)
(C)

Page 42 of 47
Figure 16: (A) shows that increase in model dip decreases the steepness of the
solution graben. The profile is a cross-graben profile where h=5km, strike=2 degrees
and dip is forced to vary as specified, all other parameters calculated. The model
width at this point is about 8 km too, proving that the strike does not change much
from model to solution. (B) shows an along graben profile where h=5km, strike=2
degrees and plunge is forced to vary as specified, all other parameters calculated.
Solution plunge reduces tremendously compared to model plunge. (C) is a test model
with very low θ, which is unnaturally skewed and gives solutions filled with artifacts.
Figure 17: Calculation of the model strike angle based on the width and length of the
graben from the MOLA data. Strike is less than 1 degree.

Page 43 of 47
Figure 18: The final model (scaled down in distance) and vertical displacement
solution as a function of the 2D observational grid. As expected, an along-strike
asymmetry is seen while maintaining graben formation. As the faults in the model
(above) widen and deepen, the graben in the solution widens and shallows out due to
the dike going further away from the surface. The horizontal length of the model and
solution are similar ~ 150km.

Page 44 of 47
(A)
(B)
Figure 19: (A) is the comparison of a cross-graben profile of Martian topography data
and the plunging model vertical displacement solution. The dike is almost 90 degrees
hence the profile is symmetrical. (B) Cross-graben asymmetry is brought about by
modeling the dike dipping at 75 degrees. The cross-strike asymmetry varying along
the graben, implies a varying dike dip and offset.

Page 45 of 47
(A)
(B)
Figure 20: (A) is the comparison of a along-graben profile of Martian topography data
and the plunging model vertical displacement solution. The model plunges from left
to right as shown in Figure 18. The plunging model explains the deepening graben
while the principal stress (shown separately in (B)) calculated along the same profile

Page 46 of 47
shows a large increase at the deepest part. This extensive stress could be the cause of
the pit crater/hole formation.
Figure 21: (A) is a wide-angle MOC image, R0501983, of the area east of the graben-
and-crater system being studied, showing the presence of nothing but pit craters
continuing in the strike direction. (B) Is the narrow angle view of the same, MOC
narrow-angle image R0501982.

Page 47 of 47
Figure 22: Example of a Poly3D solution for a dike-graben pair with small offsets
between the two graben and dikes. The nearer dike is 10 km long, and the far dike is
15 km long. A unit pressure opens each dike with no ambient (external) stress field. The faults dip at 60°, are free of shear tractions, and remain in contact. (a) Vertical
surface displacements. (blue, negative; red positive displacement). (b) Crack relative
displacement magnitudes (blue, minimum amount, to red, the maximum amount; for the dikes this is mostly opening, and for the graben mostly downdip slip). The
horizontal surface depicts vertically exaggerated ground displacements. The fault
planes in (b) that dip towards the viewer are revealed, but those that dip away from
the viewer are largely concealed by the ground surface in this perspective.