Project Report RP12 - Deliverable 5.5 Project: … · Practitioner’s Guide on the Use of Cloud...
39
Project Report RP12 - Deliverable 5.5 Project: Distributed Computing in Finance Binghuan Lin Email: binghuan.lin@techila.fi Techila Technologies Ltd Supervisor: Mr. Rainer Wehkamp & Prof. Juho Kanniainen
Transcript of Project Report RP12 - Deliverable 5.5 Project: … · Practitioner’s Guide on the Use of Cloud...

Project Report RP12 - Deliverable 5.5
Project: Distributed Computing in Finance
Binghuan Lin
Email: [email protected]
Techila Technologies LtdSupervisor: Mr. Rainer Wehkamp & Prof. Juho Kanniainen

Acknowledgment: The research leading to this report has received funding from theEuropean Union’s Seventh Framework Programme FP7/2007-2013 under grant agreementNo. 289032.
First of all, I am thankful to Mr. Rainer Wehkamp and Prof. Juho Kanniainen for theirsupervision and support. I am also grateful to colleagues from Techila Technologies’s R&Dteam, in particular, Tuomas Eerola, Teppo Tammisto, Kari Koskinen and Marko Koskinenfor their helpful comments on the reports.
I would like to thank people who provided research support during my past 3 years. Inparticular, I would like to thank Erik Vynckier, Grigorios Papamanousakis, Terence Naharand Jinzhe Yang for hosting my secondment to SWIP. I would like to thank Raf Woutersfor hosting and supervising me during my visit to National Bank of Belgium. I would liketo thank Juha Kilponen and Jani Luoto of Bank of Finland for research collaboration andI would also like to thank Prof. Eduardo Trigo Martinez and Prof. Rafael Moreno Ruiz forhosting my visit to Malaga.

Practitioner’s Guide on the Use of Cloud Computing inFinance
Binghuan Lin∗, Rainer Wehkamp†, Juho Kanniainen‡
December 1, 2015
∗Techila Technologies Ltd & Tampere University of Technology†Techila Technologies Ltd‡Tampere University of Technology

Contents
1 What is Cloud Computing? 11.1 Why cloud computing and why now? . . . . . . . . . . . . . . . . . . . . . . 2
2 Backgrounds 42.1 The taxonomy of parallel computing . . . . . . . . . . . . . . . . . . . . . . 42.2 Glossary . . . . . . . . . . . . . . . . . . . . . . . . . . . . . . . . . . . . . . 7
3 Financial Applications of Cloud Computing 93.1 Derivative Valuation and Pricing . . . . . . . . . . . . . . . . . . . . . . . . 93.2 Risk Management and Reporting . . . . . . . . . . . . . . . . . . . . . . . . 103.3 Quantitative Trading . . . . . . . . . . . . . . . . . . . . . . . . . . . . . . . 113.4 Credit Scoring . . . . . . . . . . . . . . . . . . . . . . . . . . . . . . . . . . . 11
4 The Nature of Challenges 13
5 Implementation and Practices 135.1 Implementation Example: Techila Middleware with MATLAB . . . . . . . . 145.2 Computation Needs . . . . . . . . . . . . . . . . . . . . . . . . . . . . . . . . 155.3 Solution Selection . . . . . . . . . . . . . . . . . . . . . . . . . . . . . . . . . 175.4 Algorithm Design . . . . . . . . . . . . . . . . . . . . . . . . . . . . . . . . . 205.5 Evaluation and Optimization . . . . . . . . . . . . . . . . . . . . . . . . . . 22
6 Case Studies 236.1 Portfolio Backtesting . . . . . . . . . . . . . . . . . . . . . . . . . . . . . . . 236.2 Distributed Portfolio Optimization . . . . . . . . . . . . . . . . . . . . . . . 266.3 Distributed Particle Filter for Financial Parameter Estimation . . . . . . . . 29
7 Cloud Alpha: Economics of Cloud Computing 327.1 Cost Analysis . . . . . . . . . . . . . . . . . . . . . . . . . . . . . . . . . . . 327.2 Risks . . . . . . . . . . . . . . . . . . . . . . . . . . . . . . . . . . . . . . . . 33
4

1. What is Cloud Computing?
It takes mankind centuries to learn how to make use of electricity. In the early age,
factory and corporations are powered by on-site small scale power plant. Maintaining such
power plants are expensive due to the additional labor cost. Nowadays with the help of large
scale power plants and efficient transmission networks, electricity powers modern industrial
society for transportation, heating, lighting, communications and so on. Electricity is at
everyone’s disposal at a reasonable price.
Cloud computing shares many of the similarities with electricity. By connecting end-
users via Internet to data centers, where powerful computing hardware are located, cloud
computing makes computation available to everyone. The core concept of cloud computing
is resource sharing. To harvest the computing power, cloud computing is also a practice of
operation research in computing resource optimization. Such technology enables the process-
ing of massive-parallel computations by using shared computing resources. The computing
resources usually consists of large numbers of networked computing nodes. The word “cloud”
is used to depict such networked computing resources.
The formal definition of cloud computing given by National Institute of Standards and
Technology (NIST) of U.S. Department of Commerce is:
“a model for enabling ubiquitous, convenient, on-demand network access to a
shared pool of configurable computing resources (e.g., networks, servers, storage,
applications, and services) that can be rapidly provisioned and released with
minimal management effort or service provider interaction. ”
Mell and Grance (2009),NIST
The following five essential characteristics differentiate cloud computing from other com-
puting solutions, such as on-premise servers:
• On-demand self-service: a consumer can provision computing capacity as needed
without interaction with service provider.
• Broad network access: computing resources are available to the consumer through
the network and can be accessed from mobile phones, tablets, laptops and workstations.
• Resource pooling: Resources are dynamically assigned to customers’ needs.
• Rapid elasticity: Capacities can be reconfigured automatically to scale rapidly in
response to the changing demand.
• Measured service: The resource utilization is automatically controlled and optimized
by the cloud systems. The utilization is monitored, measured and reported.
1

1.1. Why cloud computing and why now?
The first reason is the increasing computing demand from industry, especially
from financial industry. Joseph, Conway, Dekate, and Cohen (2014) from International
Data Corporation (IDC) reported the demand for high-performance computing (HPC) from
13 sectors. They predict a 8.7% yearly growth in the spending of HPC in economics/financial
sector from 2013 to 2018, which is among the top 3 of all the 13 sectors studied as shown in
Fig 1. The second reason is the pervasiveness of cloud computing. Cloud computing
has its deep root date back to utility computing in 1960s:
“If computers of the kind I have advocated become the computers of the
future, then computing may someday be organized as a public utility just as the
telephone system is a public utility... The computer utility could become the
basis of a new and important industry.”
John McCarthy at MIT Centennial in 1961
The technology has developed since then. To provide an overview of the technology
developments, Fig 2 shows the advances of cloud computing related technology alongside
the innovations in financial engineering. While the innovation of more complex models
in financial engineering increase the demand for high performance computing technology,
the supply of high performance computing technology increases with the development of
technologies, such as cloud computing. There is also evidence of increasing awareness of
cloud computing from the public. Fig 3 shows an increasing search trend for cloud computing
using Google Trends.
Fig. 1. HPC Spending By Sector 2013 V.S. 2018, Data Source: IDC2014
2

1900s 1940s 1950s 1960s 1970s 1980s 1990s 2000 2000s 2006 2012 2015
1900Theory of speculations – Louis. Bachelier
1952Portfolio selection – Harry Markowitz
1973Black-Scholes-MertonF.Black, M.ScholesR.Merton
1990-2000Stochastic Volatility Model and Local Volatility Model
2000-Jump diffusion model, Levy model, etc
Large-scale mainframe computers
Time-sharing service, IBM VM Operating System
Virtual private network (VPN)
2006,Amazon introduce Elastic Compute Cloud
1900s
2008, Microsoft Azure
2013 - Basel III
Fig. 2. History of Financial Engineering and Cloud Computing
Fig. 3. Google search trend of cloud computing (since 2004)
3

The undergone development and commercialization of cloud computing are significantly
boosted by the increase computation demands in the real world. According to Gartner’s
reportSmith (2008):
“By 2012, 80 percent of Fortune 1000 enterprises will pay for some cloud com-
puting service and 30 percent of them will pay for cloud computing infrastructure.
Through 2010, more than 80 percent of enterprise use of cloud computing will
be devoted to very large data queries, short-term massively parallel workloads,
or IT use by startups with little to no IT infrastructure.”
Modern day commercial cloud computing has also revolutionized a new level of industrial
computing practice, especially in financial industry where the computing need is massive.
Our focus is on how to utilize the enormous computing resource from cloud computing
to harness the massive computing challenges posed by financial industry.
We start by introducing parallel computing problems and massive parallel computing
tasks in finance industry.
We then compare cloud computing with alternative solutions from the following aspects:
• Performance;
• Cost;
• Elasticity;
To improve understanding about what kind of problems users may face in practice and
how they can be solved, we also walk readers through a complete implementation proce-
dure in financial industry with case studies and an implementation of Techila R© Middleware
Solution.
2. Backgrounds
2.1. The taxonomy of parallel computing
Computer processors process instructions sequentially. Thus traditional computing prob-
lems are serial problems by such design. The birth of multiprocessors has innovated a new
type of computing problem: how to utilize the parallel structure?
Parallel computing problem, in contrast to serial computing problems, refers to the
type of computing problems that can be divided into sub-problems to be processed simulta-
neously.
Based on the dependency structure of sub-problems, it can be further classified into
embarrassingly parallel and non-embarrassingly parallel computing problems. If the
4

processing of one sub-problem is independent of other sub-problems, then it is an embar-
rassingly parallel computing problem. It is called non-embarrassingly parallel computing
problem otherwise.
The following figure illustrate the structure of embarrassingly parallel and non-embarrassingly
parallel problems.
There is no communication between jobs in embarrassingly parallel case as in Fig.4(a),
while communication is required in non-embarrassingly parallel case as in Fig.4(b).
By the nature of underlying problem, it can be classified as data-parallel problem and
task-parallel problem. While data parallelism focus on distributing data across different
processors, task parallelism focus on distributing execution processes (subtasks) to different
processors.
Another important aspect of parallel computing is whether the parallel computing prob-
lem is a scalable problem. A scalable problem has either a scalable problem size or scalable
parallelism. Either the solution time reduces with the increasing of parallelism, or the per-
formance of the solution increase with the problem size. The elasticity of the computing
architecture is the key to the success of processing of scalable problems.
Here we provides two examples from finance industry:
(a) Embarrassingly parallel computing (b) Non-embarrassingly parallel computing
Fig. 4. Parallel Computing Structure
5

Example 2.1 (Monte Carlo Option Pricing). Monte Carlo simulation is a typical
embarrassingly parallel and task-parallel computing problem.
By the fundamental theorem of arbitrage pricing, option price is equal to the expected
payoff V discounted by a discount factor D. The expectation can be evaluated via
Monte Carlo method. The Monte Carlo estimator of option price is given by:
C0 = D1
N
∑ω∈sample set
V (ω)
where N is the number of sample paths.
1. The simulation of each price path is independent of other paths. Thus, it is easy
to parallel process the simulation of different paths on different computing nodes;
2. It is task-parallel in the sense that simulation of each path is a small task. How-
ever, it is not data-parallel since there is no data set to be distributed to different
computing nodes.
3. There is benefit in scaling the computation. The accuracy of the price estimator
improves with the increase of N . (The error has convergence of O( 1√N
)).
To illustrate the difference between task-parallel and data-parallel, we use the following
example.
6

Example 2.2 (Backtesting Investment Strategy). Depending how you imple-
menting the computation tasks, back-testing can be either task-parallel or data-
parallel.
Suppose you need to back-test a basket of different investment strategies to identify
the optimal strategies. The processing of each investment strategies are independent
of each other and can be run simultaneously. Distributing the processing of differ-
ent strategies to different computing nodes is an embarrassingly parallel and task
parallel implementation.
Input: A set of investment strategies, historical data sample;
Output: PnL, Portfolio Attribution, Risk Exposures, etc;
for i← 1 to number of strategies do
PnL← ProfitandLoss(strategy i, datasample);
PA← PortfolioAttribute(PnL) ;
RE ← RiskExposure(PnL) ;
endAlgorithm 1: Task-Parallel Backtesting
Back-testing of one strategy can also be implemented as data-parallel. By generating
sub samples from test data set (for example by bootstrapping), strategy can be processed
on different sub samples simultaneously. The result on different sub samples are then
aggregated to generate the performance and risk report of the strategy.
Input: Investment strategy, sub data samples
Output: PnL, Portfolio Attribution, Risk Exposures, etc;
for i← 1 to number of data sample do
PnL[i]← ProfitandLoss(strategy, data sample i);
end
PnL total = aggregate(PnL)Algorithm 2: Data-Parallel Backtesting
2.2. Glossary
• Computing instance refers to a (virtual) server instance that is linked to a com-
puting network to provide computing resources. To offer flexibility to their customers,
cloud vendors offer different types of nodes that comprise varies combination of CPU,
7

memory, storage and networking capacity1.
• Data Center A data center comprises of a large number of computing nodes, the
network to connect these nodes and necessary facility to house the computer system.
• Server-Worker Nodes Server-worker nodes is a typical mechanism to coordinate the
computation between different computing nodes. The server nodes assign computing
tasks to worker nodes and collect results from worker nodes. Worker nodes receive
instructions from server nodes, execute the computations and send the results back to
server.
• Middleware Middleware is a computer software that “glues” software applications
with computing hardware. In cloud computing, middleware is used to enable commu-
nications and management of data.
• Job Scheduler and Resource Manager Softwares to optimize the usage of comput-
ing resources based on the resources available and job priority. Commercial solutions
usually package job scheduling, resource management with middleware.
• Virtualization Using computer resources to imitate other computer resources. By
virtualization, users are not locked with specific operating systems, CPU architecture,
etc. Thus, middleware and virtualization are particularly important to ensure on-
demand self-service of cloud computing.
• Cloud Bursting Cloud computing offers on-demand service. Cloud bursting refers to
the process of dynamic deployment of software applications.
• Elastic Computing Elastic computing is a computing service which has the ability
to scale resources to meet requirements.
• Public Cloud Public cloud is the cloud computing service that is available to public
and can be accessed through Internet.
• Private Cloud Private cloud, in contrast to public cloud, is not available to public.
The computing resources are dedicated to select users.
• Hybrid Cloud Hybrid cloud is a cloud computing service that combines different
type of services, for example, public and private. A hybrid cloud combines public and
private clouds and allows workloads move between public and private clouds. The
flexibility offers users optimize the allocations to reduce cost while still have direct
control of their environments.
• Wall Clock Time (WCT) Wall clock time is the human perception of the passage
of time from the start to the completion of a task.
• CPU Time: The amount of time for which a central processing unit (CPU) was used
for processing instructions of a computer program or operating system, as opposed to,
1We will provide a list of different computing nodes in section 5
8

for example, waiting for input/output (I/O) operations or entering low-power (idle)
mode.
• Workload In cloud computing, workload is measured by the amount of CPU time
and memory consumption.
• CPU Efficiency CPU efficiency measured as the CPU time used for computation
divided by the sum of CPU time and I/O time used for data transfer. Thus CPU
efficiency measures the overhead of paralleling a computation. A low CPU efficiency,
in general, indicates a high overhead.
• Acceleration Factor Acceleration factor is measured by wall clock time of running
the program locally on end users computer divided by the wall clock time of running
it on the cloud. In an ideal case, the acceleration factor can be linear in the number
of cores used for computation.
• Total Cost of Ownership (TCO) TCO measures both direct and indirect cost of
deploying the solution. In cloud computing and alternative computing solutions, TCO
includes the cost of: hardware, software, operating expenses (such as infrastructure,
electricity, outage cost, etc) and long term expenses (such as replacement, upgrade and
scalability expenses, decommissioning, etc)
3. Financial Applications of Cloud Computing
3.1. Derivative Valuation and Pricing
One of the core businesses of front office is derivative pricing. Even though, the mar-
ket for exotic derivatives has shrunk after the crisis in 2008 - 2009, the exoticization of
vanilla products has increased the complexity of the valuation process. Moreover, numerical
methods needed with certain models, even with vanilla options, such as non-affine variance
models, infinite-activity jump models, etc.
The valuation process usually requires high performance numerical solutions, as well as a
high performance technology platform. The size of the book and time criticalness requires a
platform that is both suitable for handling large data and processing massive computing. A
recently paper by Kanniainen, Lin, and Yang (2014) evaluates the computation performance
of using Monte Carlo method for option pricing. With the aid of cloud computing and
Techila Middleware Solution2, the time consumption of valuating option contracts using
Monte Carlo methods is comparable with other numerical methods:
2For more information, please visit: http://www.techilatechnologies.com
9

... valuate once the 32,729 options in Sample A using the Heston-Nandi
(HN) model was 25 s with the HN quasi-closed-form solution and 249 s
with the Monte-Carlo methods. Moreover, with cloud-computing with the
Techila middleware on 173 Azure extra small virtual machines (173 × 1
GHz CPU, 768 MB RAM) and the task divided into 775 jobs according to
775 sample dates, the overall wall clock time was 55 s and the total CPU
time 44 min and 33 s. The Monte-Carlo running-times were approximately
the same for GJR and NGARCH. Substantially shorter wall clock times can
be recorded if more workers (virtual machines) are available on the cloud
or if the workers are larger (more efficient). Then the wall clock time differs
very little between the HN model with the quasi-closed-form solution on a
local computer and the HN model or some other GARCH model (such as
GJR or NGARCH) with the Monte-Carlo methods on a cloud computing
platform. Consequently, with modern acceleration technologies closed-form
solutions are no longer a critical requirement for option valuation.
Another key post-crisis trend is the populating of XVAs (Fund Valuation Adjustment
(FVA), Credit Valuation Adjustment (CVA), etc). The books of XVAs are usually huge
and the time constraint to process the valuation is tight. An industry success in the award-
winning in-house system of Danske Bank. The combination of advanced numerical technique
and modern computing platform allows real-time pricing of derivative counterparty risk.
3.2. Risk Management and Reporting
The financial crisis also reshaped the business of risk management in financial industry.
The implementation of Solvency II for insurance and Basel III for banking respectively, pose
new challenge to financial computing.
First, the computations are highly resource-intensive. Second, the computation needs
are dynamic rather than static. Risk report (Solvency II, Basel III, etc) are required at
monthly or quarterly frequency. Computation needs are periodic, where they reach their
peak before the reporting deadline. Building and managing a dedicated data center to meet
the computation need at its peak will significantly increase the cost. One the other hand,
most of the computing resource will be wasted during relatively less intensive period.
Cloud computing has the advantage of being scalable, which allows it meet the dynamic
computation need from financial industry. Using Google search volume, we find an interesting
pattern. Google search volume for cloud computing increased rapidly after 2009 as shown in
10

Fig. 3. So have the search volumes for Solvency II and Basel III. We are not suggesting any
causality between the increasing attention of cloud computing and that of risk regulation.
However, such trends shows the right timing of popularity of cloud computing as a potential
solution for regulation-oriented computation needs.
Financial industry started to embrace cloud solutions, especially when they are inte-
grated to support the need for an effective and timely risk management. IBM’s survey on
the implementation of cloud computing for Solvency II in the insurance industry points out
the trend of adopting cloud computing as part of the implementation strategy for risk man-
agement. Of the 19 firms, 27% are either have successfully implemented cloud solutions or in
the process of implementing cloud solutions. Another 23.8% have started considering cloud
solutions.
One of the key questions is whether a cloud solution is cost-efficient. Little (2011) from
Moody’s Analytics analyze the potential usage of cloud for economic scenario generation and
Solvency II in general. They conclude:
“Building a Solvency II platform on the cloud is a realistic and cost-effective
option, especially when scenario generation and Asset Liability Modeling are
both performed on a cloud.”
3.3. Quantitative Trading
The lowering barrier in the market participation challenges the development of more
complicated trading strategies as well as a race of technology. Quantitative trading, especially
high frequency trading, requires a quick time-to-production as well as a quick time-to-
market.
Fast R&D of trading strategies and back testing in a timely manner will significantly
shorten time-to-market. Firms, by taking advantage of cloud computing, are generating
alpha even before trading strategies are actually implemented in market.
The quick prototyping and back testing of strategies requires close-to-data computing
as well as adaptability to the heterogeneity of developer tools, such as different end-user
applications, different data storage types and different programming languages. On the
other hand, the adaptability to different end-user software has been one of the key feature
of the matured cloud computing platform.
3.4. Credit Scoring
Cloud computing is arguably the solution for big data problems in finance. One typical
big data problem in finance industry is credit scoring.
11

Credit scoring is the procedure for lenders, such as banks and credit card companies
to evaluate the potential risk posed by lending money to consumers. It has been widely
treated as classification problem in machine learning literature (Hand and Henley (1997);
West (2000); Baesens, Van Gestel, Viaene, Stepanova, Suykens, and Vanthienen (2003) and
many others).
The large number of consumers and the variety of credit report formats create a big data
problem. To solve the classification problem over the massive data set of credit history of
consumers, an efficient data storage and processing system is required.
As a summary, modern day financial computing requires
• Adaptability to the heterogeneity end-user softwares;
• Processing large data and close-to-date computing;
• Massive computing;
• Data security;
In the following chapter, we are going to introduce details of how modern cloud computing
can help to solve these problems. There are also innovative cloud-supported new business
models using the concept of sharing, such as cooperative quantitative strategy development
platforms. While we focus the massive computation part of cloud computing for financial
engineering, we refer readers who are interested in those platforms to Internet resources.
12

4. The Nature of Challenges
Integrating massive computing power to existing IT systems may face several challenges.
Finance industry poses certain specific requirements to cloud computing.
System needs to be multi-tenant. The system needs to support multiple users accessing
the computing resource at the same time. Meanwhile, the system has to be smart enough to
allocate computing resource based on the priority and need of the tasks. The requirements
arise from the heterogeneous and dynamic nature of financial computing. Computing from
different desks have different priorities and uneven demand for resources.
Compliance requirement and cybersecurity. Finance industry operates with public data
/ information as well as business critical private data/information. Due to compliance re-
quirements, a hybrid system needs to make computing with sensitive data in-house while
allow utilizing external computing resource with non-confidential data.
A unified platform for quality assurance. Large financial organizations have teams sup-
porting local business operations across the world. A unified platform will make life of
quantitative support, model validation/review teams easier by guaranteeing consistency and
coherency of data and models for users.
IT Legacy. Maintaining a monster-level of legacy codes is a huge task for IT departments.
Any change that needs complete re-write of the codes will be a nightmare. Thus IT systems
have to have a high level of adaptability to have effortless integrating with existing libraries.
5. Implementation and Practices
In previous section, we reviewed the technical and non-technical challenges in the inte-
gration process of cloud computing in finance industry. Luckily, with the development of
commercial cloud computing services, the complexity of cloud computing are hidden behind
user-friendly interfaces.
Aiming to ease the use of cloud computing, many softwares and computing framework
were developed during the past decade. To mention a few, popular computing framework
includes Hadoop+MapReduce, Apache Spark, etc. Middleware solutions such as Techila
Middleware, Sun Grid Engine also help commercial users to distributed computing tasks to
computing nodes.
In this section, we will introduce using an example of Techila Middleware on how chal-
lenges in section 4 can be handled by cloud computing solution.
Then we walk readers through the procedure of implementing cloud computing in prac-
tice.
13

5.1. Implementation Example: Techila Middleware with MATLAB
Techila Middleware Solution, developed by Techila Technologies Ltd3, is a commercial
software solution aiming to provide user-friendly integration of cloud computing. The ser-
vice structure of Techila R© is shown in Fig.5. The specific design of the service structure
allows accessing both on-premise and external computing resources to ensure compliance
requirements are met when necessary.
The system is multi-tenant, where users can assign different priorities to computing jobs
sent to Techila system through secured Gateway. The jobs are scheduled according to the
availability of resources and priorities.
The solution hides the complexity of integration to heterogeneous end-user software be-
hind a user-friendly interface. To illustrate that, we provide an example of using Techila with
MATLAB. For more information of the programming languages and softwares that Techila
supports, please refer to the company’s website at: www.techilatechnologies.com.
Before proceeding to use Techila solution, the end user needs some minor configuration.
Readers are referred to Techila’s online documents4 for more details.
3For more information, please visit: http://www.techilatechnologies.com4Techila Online Documents
Fig. 5. Techila High Level Architecture
14

5.1.1. Easy Implementation: Code Example
When Techila is successfully installed, using cloud computing with existing codes devel-
oped in MATLAB is straight-forward.
Suppose end user have a code contains are for loop structure:
1 f unc t i on r e s u l t = l o c a l l o o p s ( l oops )
2
3 r e s u l t = ze ro s (1 , l oops ) ;
4 f o r counter =1: l oops
5 r e s u l t ( counter ) = counter ∗ counter ;
6 end
To parallelize the computation inside the for loop on cloud computing resources, the end
user only needs to make a minor change to the code:
1 f unc t i on r e s u l t = r u n l o o p s d i s t ( l oops )
2 % the only change i s change for−end to c loud for−cloudend
3 r e s u l t = ze ro s (1 , l oops ) ;
4 c l o u d f o r counter = 1 : l oops
5 r e s u l t ( counter ) = counter ∗ counter ;
6 cloudend
5.2. Computation Needs
Before making a decision to adopt any high performance computing solution, a key step
is to understand your computational need and usage pattern. The best choice of solution
depends on the answers to the following questions:
• Do you have a computational bottleneck?
• Where is the computational bottleneck?
Do you have a computational bottleneck?
The question may seem to be trivial at first sight. A computational bottleneck exists
when the current computing resource can not process the computing tasks within given time
constraints. However, many of the cases, the computational bottleneck arises from another
15

dimension, that is the time it required to upgrade computing resource to meet the increased
demand.
The point we would like to emphasize is that the planning of computing needs to be
forward-looking. While quants, researchers and developers are aware of the computational
bottleneck, it is usually the IT department’s decision to whether expand current IT resources.
The procedure may take some time. Thus, forward-looking planning is critical in order to
ensure an efficient and effective response to the computational need.
The scalability and elasticity of cloud computing may offer an alternative solution by
providing computing resource on demand.
Where is your computational bottleneck?
A typical computational bottleneck from finance industry pose one of the following types
of challenges:
1. Massive computational time exceeds time constraints;
2. Massive memory consumption exceeds limited memory and storage;
3. Dynamic usage pattern meets non-scalable computing resource.
There are several solutions for type 1 challenge. In a production scenario, e.g. when
implementing a high frequency trading algorithm, hardware accelerators, such as FPGA and
GPU, may be better alternatives to cloud computing5. The reasons are:
1. Execution time is critical. Hardware acceleration may be the only solution to accelerate
the algorithm;
2. No frequent reconfiguration needed. The cost to configure and adapt the algorithm for
hardware acceleration is less than the profit gain from shorter execution time.
While in an R&D scenario, time-to-market is more important. The easy implementation and
massive parallel features provided by cloud computing will enable researchers and developers
to quickly prototype and backtest algorithms and models.
Cloud computing is also an economical solution to type 2 and type 3 challenges. A
distributed storage and memory consist of relatively cheaper hardware, compared with ex-
pensive local instances that have adequate memory and storage size, reduce significant the
cost to invest in hardware. The elasticity of cloud computing provides users on-demand ser-
vice. In a type 3 challenge, an investment in computer instances that can process computing
5Although in practice, there are firms implementing their algorithms in the cloud to gain benefit for lowerlatency in connection to exchange when colocation is not possible or too costly to implement.
16

demands at their peak time is a waste of resource during periods where computing demands
are less intensive.
5.3. Solution Selection
Both performance and cost should be taken into consideration when choosing a cloud
vendor. Among them, Amazon Elastic Compute Cloud (AWS), Google Compute Engine
(GCE) and Microsoft Azure (Azure) are three popular cloud computing platforms.
Vendors provide a variety of instance types. For example, the cloud instances used in
a recent benchmark by Techila include 4 different instances from AWS and Azure and 2
instances from GCE as listed in Table A.1 of Techila (2015). These instances are optimized
for different purposes: CPU, memory, I/O, cost, storage, etc.
Vendors adopt different pricing models. The cost of using cloud computing is affected by
the pricing model. Table 1 provides an overview of pricing models adopted by vendors for
data centers based in Europe. The table reports price per instance (PPI), price per CPU
core (PPC) and the billing granularity for AWS, Azure and GCE6. Generally speaking, a
minute-based (even seconds-based) pricing model offer more flexibility for the utilization of
cloud computing. While an hour-based pricing model makes using distributing computation
for short intervals (less than 1 hour) an unwise choice. However, the difference among pricing
models isrelatively insignificant when the computation is massive.
Cloud Platform Instance Type PPI (USD/h) PPC (USD/h) Billing GranularityAWS c4.4xlarge(win) 1.667 0.1041875 HourAWS c4.4xlarge(linux) 1.003 0.0626875 HourAWS c3.8xlarge(win) 3.008 0.094 HourAWS c3.8xlarge(linux) 1.912 0.06 Hour
Azure A11(win) 3.5 0.219 MinuteAzure A11(linux) 2.39 0.149 MinuteAzure D14(win) 2.372 0.148 MinuteAzure D14(linux) 1.542 0.096 MinuteGCE n1-standard-16(win) 1.52 0.095 MinuteGCE n1-standard-16(linux) 0.88 0.055 Minute
Table 1: Pricing Model and Cost
Depending on the vendor, instance types and the operating systems, instances have vary-
ing time consumption for configuration and deployment. According to Techila’s benchmark
report in Techila (2014), the differences are significant as shown in Fig.6 and Fig.7. These
6GCE machine types are charged a minimum of 10 minutes. After 10 minutes, instances are charged in1 minute increments, rounded up to the nearest minute.
17

are non-negligible factors for the elasticity of cloud computing. As a rule of thumb, the
operating systems, instances type and vendor should be chosen according to the end-user’s
version of software applications.
Fig. 6. Configuration Time
Fig. 7. Deployment Time
We cite the test results from two recent benchmark reports Techila (2014, 2015) from
Techila to provide readers an impression of the cost of utilizing cloud computing. The test
cases simulate real-world financial applications in many areas including: portfolio analytics,
machine learning, option pricing, backtesting, model calibration, etc. However, readers
18

should be aware of the different nature of these applications, whether they are high I/O,
high memory consumption or high CPU consumption.
Fig.8 summarizes the cost of computing for different vendor and instances versus the
performance of computing.
Fig. 8. Cost V.S. Performance
Table 2 provides the cost in the portfolio simulation case7. The simplified cost provides
the cost per unit of computation after correcting for the difference in pricing model. For
example, for portfolio simulation, the simplified cost range from 0.58 USD (GCE with n1-
standard-16 instance on Linux Debian 7 operating system) to 1.99 USD (Azure A11 on
Windows Server 2012 R2). The difference is significant (about 4 times). However, if we take
into consideration the pricing model, the real cost (that is the billing from vendor) differences
even more. The cost of using AWS is more than 10 times the cost using Azure or GCE.
This is because AWS using hour-based pricing model. Users should be able to allocate their
computation as units of hours to reduce the cost of computation with AWS.
The report provides valuable insight about the effect of pricing models on the cost of cloud
computing. Together with the benchmarks on instance performances, this should provide
readers some information on how to choose cloud vendors.
7For more information of other user scenarios, please refer to Techila’s latest “Cloud HPC in FinancebenchmarkTechila (2015)
19

Table 2: Cost of Cloud Computing Case: Portfolio SimulationCloud Platform Instance Type PPC(USD/hour) Cost (USD) Simplified(USD)
AWS c4.4xlarge(win) 0.104 26.672 0.926AWS c4.4xlarge(linux) 0.063 16.048 0.566AWS c3.8xlarge(win) 0.094 24.064 1.324AWS c3.8xlarge(linux) 0.060 15.296 0.701
Azure A11(win) 0.219 2.8 1.991Azure A11(linux) 0.149 1.275 1.073Azure D14(win) 0.148 1.898 1.550Azure D14(linux) 0.096 1.234 0.829GCE n1-standard-16(win) 0.095 4.053 1.486GCE n1-standard-16(linux) 0.055 2.347 0.583
5.4. Algorithm Design
Designing a well-suited algorithm for specific problem can significantly boost the perfor-
mance and benefit from cloud computing.
We use the following simple example to illustrate how the design of algorithm can change
the performance.
20

Example 5.1 (Distributed Matrix Multiplication). M is a matrix of size d×n. N is
another matrix of size n× d. The matrix multiplication of M and N: G = MN can be
done via two schemes.
• Scheme 1: Inner Product. The entry in i− th row and j − th column of matrix
G: Gi,j =∑n
r=1Mi,rNr,j.
1 % Scheme 1 : v i a inner produc t
2 c l o u d f o r i =1:d
3 c l o u d f o r j =1:d
4 G( i , j ) = M( i , : ) ∗N( : , j )
5 c loudend
6 c loudend
• Scheme 2: Outer Product. Alternatively, we can return the matrix G as the sum
of the outer products between corresponding rows and columns of M and N .
1 % Scheme 2 : v i a o u t e r produc t
2 c l o u d f o r i = 1 : n
3 c l o u d f o r j = 1 : n
4 %c f : sum=G
5 G =M( : , i )∗N( j , : )
6 c loudend
7 c loudend
%cf:sum=G command is used to sum the return value from each worker node.
The two schemes differ in both storage complexity and computational complexity.
1. To send the data, scheme 1 requires a distributed storage of O(nd2) while scheme
2 requires O(nd)
2. To return the result, scheme 1 requires a local storage of O(1) and total of O(d2)
while scheme 2 requires a local storage of O(d2) and total of O(nd2)
3. Both scheme require a distributed computation of O(nd2). Scheme 1 requires a
local computation of O(n) on each worker nodes while scheme 2 requires O(d2).
Depending the relative value of n and d, one of the scheme outperform the other
scheme. In terms of computation, outer product scheme parallel computation in the
direction of n, thus is preferred when n is large, while inner product scheme is preferred
in large d scenario.
21

5.5. Evaluation and Optimization
One of the characteristics of cloud computing is measured services. Users can review the
automatically generated reports to evaluate the usage of cloud and optimize it.
Several rules of thumb:
1. Minimize data transfer and communication between jobs;
2. Uniformly distribute computation across nodes;
3. Optimize based on number of jobs and job size;
22

6. Case Studies
6.1. Portfolio Backtesting
In this subsection, I demonstrate how portfolio backtesting can be accelerated with dis-
tributed computing technique, in particular Techila Middleware solution.
Backtesting is widely used in financial industry to estimate the performance of a trading
strategy or a predictive model using historical data. Instead of gauging the performance
using the time period forward, which may take many years, traders/portfolio managers can
measure the effectiveness of their strategies and understand the potential risks by backtesting
on prior time period using the datasets that are available today. Computer simulation of the
strategy/model is the main part of modern backtesting procedure. It might be very time-
consuming due to a few computing issues raised during the procedure. Thus it is necessary to
seek acceleration using modern techniques and shorten time-to-market in the rapid-changing
financial world.
6.1.1. Potential Computing Bottleneck
Backtesting requires three main components: Historical Datasets, Trading Strategy/-
Model and Performance Measure. The following computing issues might be raised for each
of the components:
1. The datasets used for testing might be huge while the requested output (performance
measure) is relatively small. For example, a portfolio consist of N assets. Its historical
return data series over the past T time period is N*T. The covariance matrix is of size
N*N. In case N=75000, the memory size of the covariance matrix is 450GB.
2. The simulation of the strategies/models can be computational-intensive. The intensity
of computing is increasing w.r.t the complexity of the strategies/models. Complex
logic branching operations can also be involved.
3. The evaluation of the performance measure can also be time-consuming. Measures
that are based on Monte-Carlo approach require simulation of thousands and even
more paths.
Cloud computing has its natural advantage of processing large data. In general, CPU threads
have better performance than GPU threads, especially in handling complex logic branching
operations. Thus cloud computing seems to be a suitable technique for accelerating back-
testing procedure. To illustrate how to use cloud computing for backtesting, we did some
experiment in Microsoft Windows Azure Cloud, as well as a local cluster. The results are
presented in the following subsubsections.
23

6.1.2. Computing Environment and Architecture
By installing Techila SDK on their computer, end users (traders/portfolio managers) can
use Techila-enabled computing tools: Matlab, R, Python, Perl, C/C++, Java, FORTRAN,
etc to access the computing resource managed by Techila Server.
Techila Server works as a resource manager, as well as a job scheduler. Computational
jobs are distributed through Techila Server to Techila Workers, which are machines in the
Cloud (Azure, Google Computing Engine, Amazion EC2, etc) or local cluster. When the
computation on the worker node finished, the requested results are sent back to end-user
through Techila Server. In our experiment, we use Techila environment on Windows Azure
Cloud. The testing code is written in Matlab. The computational jobs (optimization and
evaluation of each data sets) are sent to each of the worker nodes (virtual machine in Azure).
When dealing with large data sets which exceed single machines capability, there are two
solutions: 1. Data sets can be stored in a common storage that can be accessed by each of
the workers (Blob on Azure for example); 2. Under specific license, workers can easily access
data sources such as Bloomberg, Thomson Reuters, etc.
6.1.3. Experiment Design and Test Result
The callback feature of Techila enable streaming result when a computational job is
finished. This can also be used to monitor intermediate result of a computational job.
This enable us to update the visualization of the result when a computational job is
finished.
To visualize the result, we plot the time evolution of efficient frontier over the backtesting
period as a 3D surface. We also plot the maximum Sharpe Ratio portfolio as a 3-D line.
In the mean-variance optimization framework of Markowitz, this portfolio is the tangency
portfolio. Thus, we should expect the line is on the surface 8 as shown in figure 6.1.3.
We first performance a small scale test using 20 stocks. The result based on cloud
computing are consistent with the result generated from local run on my own laptop.
Using weekly return from 2000 to 2013, I performance several tests using different number
of stocks and different length of backtesting period.
I set the historical estimation window length equal to 60 weeks, the strategy is re-
estimated every 3 weeks. The weekly return data from 26-Feb 2001 to 07-Oct-2013 are
separated into 220 windows. A straightforward way of distributing the computational load
is to treat the backtesting for each window as independent job.
8the visualization code is adapted from Portfolio Demo by Bob Taylor athttp://www.mathworks.com/matlabcentral/fileexchange/31290-using-matlab-to-optimize-portfolios-with-financial-toolbox
24

Fig. 9. Time evolution of efficient frontier
By default, Techila Middleware will automatic distributed the computing project such
that each job will have sufficient length to reduce the overhead caused in data transfer. User
can also set the job length (iterations per job) using the job specification parameter.
I ran tests for 50, 100, 500 stocks. When the number of stocks increased, the optimizer
will take a longer time to find the portfolio that maximize Sharpe ratio. In fact, when the
number of stocks are too large, the optimization problem might became an ill-posed problem.
However, the performance of the optimizer is not the concern of this report. Compared with
simply setting the stepsperworker=1, Techilas default setting significantly improved the CPU
efficiency (CPU time/Wall clock time) as shown in table 3
Table 3: CPU Efficiency in Portfolio BacktestingNoS NoJ (step = 1) ACE (step=1) NOJ (Auto) ACE(Auto)
50 220 88.14% 55 96.57 %100 220 90.49% 74 112.79 %500 220 114.13% 220 114.13%
NoS is number of stocks. NoJ is number of jobs. Auto refers to Techila’s automated jobdistribution scheme. step = 1 refers to assigning 1 step to each job.
25

6.2. Distributed Portfolio Optimization
In this subsection, we demonstrate how large scale portfolio optimization problem can
be solved with distributed computing technique with specific algorithm design.
6.2.1. Challenges in Large Scale Portfolio Construction
Constructing optimal portfolio consists two steps. The first step is to construct future
belief of the return distribution, which is essentially an inference and prediction problem.
The second step is to find the optimal portfolio weights, which is an optimization problem
deal with the trade off between portfolio risk and portfolio return.
On one hand, this problem is a statistical challenge. Most of the portfolio optimization
and risk minimization approaches require estimation of the co-variance or its inverse of the
return series. When using the sample variance as the expected variance, the estimation error
could be large. To achieve a reasonable accuracy, as state in DeMiguel, Garlappi, and Uppal
(2009), an in-sample period of 3000 months is needed for a portfolio of 25 assets to beat naive
1/N strategy. The problem become even more significant when the portfolio size is large. As
noticed in Fan, Lv, and Qi (2011), estimating the moments of high-dimension distribution
is challenging. Among them, one crucial problem is the spurious correlation arise with the
curse of dimension.
One the other hand, the problem is also challenging numerically. First, when the degree
of freedom is large, finding optimum in high-dimension parameter space is almost impossible
to achieve in reasonable time with general optimizers. Additionally, we need to take good
care of the property of the matrices to have retain feasibility. It is also a data- intensive
problem from hardware perspective. Suppose we are dealing with 75,000 assets (data of the
universe), the covariance matrix have 2812537500 parameters. That means, it take more
than 20GB of memory if we are using double-precision. Last but not least, the matrix
operation for matrix size of M N have linear computational cost increase with the number
of columns.
6.2.2. Algorithm Design for Large Scale Mean-Variance Optimization Problem
In the classical Markowitz’s mean-variance framework, the portfolio optimization problem
is to minize the variance for given expected return b = wTµ. The optimum w∗ is a solution
to:
minwTCw
26

s.t.
wTµ = b
wT1N = 1
This optimization problem is equivalent to solve:
minE[|ρ− wT rt|2] (1)
with the same restriction. ρ = 1T b
By replace the expectation in equation 1 with its sample average, the problem can be
considered as a least-square regression.
Regularization methods are introduced targeting to solve the problem arises with estima-
tion error via shrinkage and achieve either stability or sparsity or both. The regularization
can be achieved by adding ln−penalty term r(x) to the objective function:
r(x) = λ ‖x‖n (2)
Where λ is a constant that scale the penalty term.
When n = 1, the objective is a LASSO regression. While n = 2, it is a ridge regression.
In order to find a solution to this penalized problem, more over to utilize the modern
computing environment - computer cluster/cloud, I try to solve the problem using distributed
optimization technique, namely the alternative direction method of multiplier (ADMM) and
block splitting. An detailed introduction of this optimizer can be found in Boyd, Parikh,
Chu, Peleato, and Eckstein (2011).
Noticing that we can transform the constraint optimization problem to its consensus
form:
min||b1T −Rw||22 + λ||w||1 + IC(w) (3)
where IC is the indicator function, i.e.IC(w) = 0, if w ∈ C
IC(w) =∞, if w /∈ C(4)
And C is the constraint set C = {w|wTµ = b, wT1N = 1}
27

Here we rewrite the problem in ADMM form (denote b1T := B):
wk+11 := argminw((1/2)||Rw −B||22 + (ρ/2)||w − zk + µk1||22) (5)
wk+12 := ΠC(z − µ2) (6)
zk+1 := 1/2(Sλ/ρ(wk+11 + µk) + Sλ/ρ(w
k+12 + µk)) (7)
µk+11 := µk1 + wk+1
1 − zk+1 (8)
µk+12 := µk2 + wk+1
2 − zk+1 (9)
The update of w1 is Tikhonov-regularized least squares which have analytical solution:
wk+11 := (RTR + ρI)−1(RTB + ρ(zk − µk))
Via Block Splitting, we can utilize distributed computing environment, and solve the problem
for small data block of R and B in parallel:
two cases: allocation and consensus. Depending on the data structure. If the number of
assets are larger than the length of the asset pricing series, allocation is prefered, while in
the other case, consensus is preferrable alternative that is also easier to implement, since it
is consistent with the previous decomposition.
wk+1i := (RT
i Ri + ρI)−1(RTi Bi + ρ(zk − µk))
28
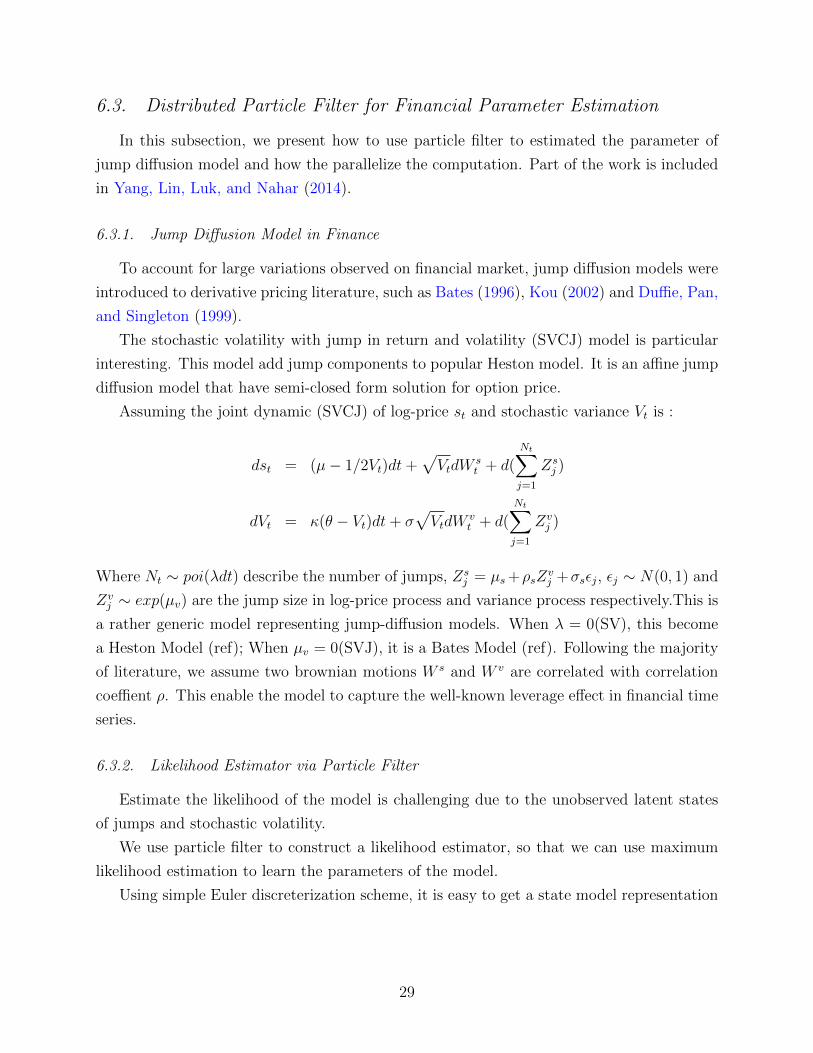
6.3. Distributed Particle Filter for Financial Parameter Estimation
In this subsection, we present how to use particle filter to estimated the parameter of
jump diffusion model and how the parallelize the computation. Part of the work is included
in Yang, Lin, Luk, and Nahar (2014).
6.3.1. Jump Diffusion Model in Finance
To account for large variations observed on financial market, jump diffusion models were
introduced to derivative pricing literature, such as Bates (1996), Kou (2002) and Duffie, Pan,
and Singleton (1999).
The stochastic volatility with jump in return and volatility (SVCJ) model is particular
interesting. This model add jump components to popular Heston model. It is an affine jump
diffusion model that have semi-closed form solution for option price.
Assuming the joint dynamic (SVCJ) of log-price st and stochastic variance Vt is :
dst = (µ− 1/2Vt)dt+√VtdW
st + d(
Nt∑j=1
Zsj )
dVt = κ(θ − Vt)dt+ σ√VtdW
vt + d(
Nt∑j=1
Zvj )
Where Nt ∼ poi(λdt) describe the number of jumps, Zsj = µs+ρsZ
vj +σsεj, εj ∼ N(0, 1) and
Zvj ∼ exp(µv) are the jump size in log-price process and variance process respectively.This is
a rather generic model representing jump-diffusion models. When λ = 0(SV), this become
a Heston Model (ref); When µv = 0(SVJ), it is a Bates Model (ref). Following the majority
of literature, we assume two brownian motions W s and W v are correlated with correlation
coeffient ρ. This enable the model to capture the well-known leverage effect in financial time
series.
6.3.2. Likelihood Estimator via Particle Filter
Estimate the likelihood of the model is challenging due to the unobserved latent states
of jumps and stochastic volatility.
We use particle filter to construct a likelihood estimator, so that we can use maximum
likelihood estimation to learn the parameters of the model.
Using simple Euler discreterization scheme, it is easy to get a state model representation
29

of the jump-diffusion model as follows:
sn = sn−1 + µ∆t− 1/2Vn−1∆t
+√
(1− ρ2)Vn∆tε1,n−1
+ρ(Vn − Vn−1 − κ(γ − Vn−1)∆t)/σ
+(∆Nn)(∆Nn∑j=1
Zsj )
Vn = Vn−1 + κ(γ − Vn−1)∆t+ σ√Vn−1ε2,n−1
+(∆Nn)(∆Nn∑j=1
Zvj )
∆Nn = Nn −Nn−1 is the total number of jumps generated between stage n− 1 and n
Then, we use the auxiliary particle filter proposed by Pitt and Shephard (1999). We
extended the algorithm to SVCJ model. The detail of the algorithm is available in our paper
Yang et al. (2014). As a byproduct, the likelihood can be estimated from the weight of
particles.
6.3.3. Distributed Implementation
This computational bottleneck can potentially be solved by parallel computing. Due to
the necessary steps of resampling and normalization, the particle filtering is non-embarassingly
parallel problem. There are naturally 2 parallel schemes: external parallelization and internal
parallelization.
The external scheme divides the particle swarm of N particles into M groups of K
particles, where N = M ×K, and likelihood estimator:
LdN(θ) ≈ 1
MLd
K(θ) (10)
Resampling using parallel resampling scheme (ref Miguez) at group level is needed if particle
shrank at group level.
The external scheme is rather simple and require less implmentation effort. In (ref bhl2),
the scheme is applied for MLE of heston model (can be viewed a s a special case of SVCJ
when λ = 0) parameters using Techila Middleware. The test is performed on distributed
computing system (both a local computer cluster (TUTgrid) and Window Azure Cloud).
Noticing the communication between computing nodes is comparable costly. By proper
choosing the quantity of K, we can reduce the unnecessary resampling at group level. In
optimal situation, embarassingly parallelizable at group level can be achieved. In the test,
30

we take K = 500 and M = 20, so we can have a total number of 10, 000 particles. The
acceleration factor approximately is 14 times. The required quantity of K is expected to
increase with the frequency of jumps.
The internal scheme is more statistically efficient compared with external scheme. In
fact, the internal scheme can be considered as an extreme case of the external scheme, with
K = 1 and maximum required times of resampling.
31

7. Cloud Alpha: Economics of Cloud Computing
In their review of cloud computing, Armbrust, Fox, Griffith, Joseph, Katz, Konwinski,
Lee, Patterson, Rabkin, Stoica, et al. (2010) proposed a formula to evaluate the economic
value of cloud computing by comparing to alternative solutions9:
UserHourscloud × (revenue− costcloud) ≥ UserHoursdatacenter × (revenue− CostdatacenterUtilization
)
The cost of cloud computing or alternative solutions can be summarized into total cost of
ownership (TCO).
While cloud computing and alternative solutions may have different risk of IT failure.
The effect on risk measure should be taken into account when evaluating the potential benefit
of cloud computing. Thus we derive the following formula of benefit as the change in revenue
plus cost reduction and benefit of risk control:
Benefitcloud = ∆(Revenue)−∆(TCO)− γ∆(Risk) (11)
Where ∆(Revenue) = Revenuecloud−Revenuealternative is the profit difference from cloud v.s.
alternative solution. ∆(TCO) = TCOcloud− TCOalternative is the negative of cost reduction.
∆(Risk) = Riskcloud−Riskalternative measures the change in risk and γ is the risk premium.
The optimal choice of computing solutions is simply the optimum of the following Markowitz-
style objective:
maxs∈S
Revenues − TCOs − γRisks
S is the set contains all feasible computing solutions.
Quantitative measuring of revenue, cost and risk is a difficult task and is beyond the
scope of this book. Thus, in the following subsections, we only provide qualitative analysis
of cost, revenue and risk to give some intuition of the economics of cloud computing.
7.1. Cost Analysis
Financial market reduce transaction cost. As an example, asset managers issue ETF and
ETN to investors, offering them a lower cost of diversification and exposures to risks and
markets that may be costly for an individual investor to access.
Cloud computing, by pooling computing resources, offer clients lower total cost of own-
ership (TCO) and access to up-to-date hardware.
9Here they compare cloud computing with a dedicated data center.
32

Cloud computing may offer cost reduction along one of the following dimensions. The
first dimension of cost reduction is from lower cost of hardware maintenance and upgrade.
The second dimension of cost reduction is from elasticity of cloud computing. The third
dimension of cost reduction is from lower cost of human resources.
7.2. Risks
The risk of IT system failure is unnegligible in finance industry. The following two
examples provide some ideas of the importance of having backup IT systems and highly-
reliable IT systems.
Example 7.1 (NYSE and Bloomberg). The New York Stock Exchange crashed at
11:32am ET, July 8, 2015. The exchange was down for 3 hours and 38 minutes.
According to NYSE’s (reference online document), this was due to software update to
the IT system.
Coincidentally, Bloomberg terminals suffered a widespread outage on April 17, 2015,
affecting more than 325,000 terminals worldwide.
IT failure can be costly. What would be the best way of risk management for IT systems?
Cloud computing can be viewed as an insurance of IT. While diversification is widely
accepted concept in finance industry, cloud computing maybe an easy way to diversify the
IT failure risk for finance industry.
The distributed file systems, either in-house or in cloud vendors’ data centers, protect
data from hardware failures.
Cloud vendors also offer access to computing to data centers located in various locations
around the world. Such scheme provide constant supply of computing resources in case of
catastrophic tail events, such as earthquakes, tsunamis, etc.
References
Armbrust, M., Fox, A., Griffith, R., Joseph, A. D., Katz, R., Konwinski, A., Lee, G., Patter-
son, D., Rabkin, A., Stoica, I., et al., 2010. A view of cloud computing. Communications
of the ACM 53, 50–58.
Baesens, B., Van Gestel, T., Viaene, S., Stepanova, M., Suykens, J., Vanthienen, J., 2003.
Benchmarking state-of-the-art classification algorithms for credit scoring. Journal of the
Operational Research Society 54, 627–635.
33

Bates, D. S., 1996. Jumps and stochastic volatility: Exchange rate processes implicit in
deutsche mark options. Review of financial studies 9, 69–107.
Boyd, S., Parikh, N., Chu, E., Peleato, B., Eckstein, J., 2011. Distributed optimization and
statistical learning via the alternating direction method of multipliers. Foundations and
Trends R© in Machine Learning 3, 1–122.
DeMiguel, V., Garlappi, L., Uppal, R., 2009. Optimal versus naive diversification: How
inefficient is the 1/n portfolio strategy? Review of Financial Studies 22, 1915–1953.
Duffie, D., Pan, J., Singleton, K., 1999. Transform analysis and asset pricing for affine jump-
diffusions. Tech. rep., National Bureau of Economic Research.
Fan, J., Lv, J., Qi, L., 2011. Sparse high dimensional models in economics. Annual review
of economics 3, 291.
Hand, D. J., Henley, W. E., 1997. Statistical classification methods in consumer credit
scoring: a review. Journal of the Royal Statistical Society. Series A (Statistics in Society)
pp. 523–541.
Joseph, E., Conway, S., Dekate, C., Cohen, L., 2014. Idc hpc update at isc’14.
Kanniainen, J., Lin, B., Yang, H., 2014. Estimating and using garch models with vix data
for option valuation. Journal of Banking & Finance 43, 200–211.
Kou, S. G., 2002. A jump-diffusion model for option pricing. Management science 48, 1086–
1101.
Little, M., 2011. Esg and solvency ii in the cloud. Moody’s Analytics Insights .
Mell, P., Grance, T., 2009. The nist definition of cloud computing. National Institute of
Standards and Technology 53, 50.
Pitt, M. K., Shephard, N., 1999. Filtering via simulation: Auxiliary particle filters. Journal
of the American statistical association 94, 590–599.
Smith, D. M., 2008. Cloud computing scenario.
Techila, T., 2014. Cloud benchmark - round 1.
Techila, T., 2015. Cloud hpc in finance, cloud benchmark report with real-world use-cases.
34

West, D., 2000. Neural network credit scoring models. Computers & Operations Research
27, 1131–1152.
Yang, J., Lin, B., Luk, W., Nahar, T., 2014. Particle filtering-based maximum likelihood esti-
mation for financial parameter estimation. In: Field Programmable Logic and Applications
(FPL), 2014 24th International Conference on, IEEE, pp. 1–4.
35