Project Report on A Pedal-Operated Seed Cleaner (PoS ...
30
Project Report on A Pedal-Operated Seed Cleaner (PoS-Cleaner) To Boost Post Harvest Grain & Legume Quality, Increase School-Study time & Create Financial Freedom in Rural-Uganda. Submitted to Makerere University Research and Innovations Fund (Mak- RIF) September 2020 Prepared By Dr. Peter Tumutegyereize (PhD)- CAES Dr. Julia Kigozi (PhD)- CAES Mr. Isaac Oluk- Badaye Tech Ltd Mr. Ismael Mayanja- UC, Davis (USA) Mr. Wilber Akatuhurira- CAES Mr. Thomas Buyinza – ISU-UP Ms. Maureen Mbeiza -ISU-UP
Transcript of Project Report on A Pedal-Operated Seed Cleaner (PoS ...
Project Report on A Pedal-Operated Seed Cleaner (PoS-Cleaner) To Boost Post Harvest
Grain amp Legume Quality Increase School-Study time amp Create Financial Freedom in
Rural-Uganda Submitted to Makerere University Research and Innovations Fund (Mak-
RIF)
September 2020
Prepared
By
Dr Peter Tumutegyereize (PhD)- CAES
Dr Julia Kigozi (PhD)- CAES
Mr Isaac Oluk- Badaye Tech Ltd
Mr Ismael Mayanja- UC Davis (USA)
Mr Wilber Akatuhurira- CAES
Mr Thomas Buyinza ndash ISU-UP
Ms Maureen Mbeiza -ISU-UP
i
Project Summary
About the Project
Post-harvest handling processes such as drying threshing and storage have progressed among small scale farmers in
developing countries However there is still a lag in technology interventions addressing cleaning It is uncertain
whether this lag is attributed to technology access or the unnecessity for cereal and pulse cleaning technology This
work assessed the effect of access on the use of improved cleaning technologies for seeds as compared to drying
threshing and storage technologies among key farmers in Kamuli district Uganda Challenges and opportunities to
access and use postharvest handling technologies were taken into consideration A needsrsquo assessment survey in post-
harvest handling technologies was done Pre-set questionnaires were administered in face to face interviews to 200
farmers who had been purposively selected This was followed by developing five pedal-operated seed cleaners (PoS-
Cleaner) that were distributed to five farmer groups but positioned at host farmersrsquo residences based on intermediated
technology use and technology acceptance approach Findings suggest that ownership awareness and distance which
are measures of technology access influence technology use to a greater extent There is a maximum distance which
farmers with quantities of produce for cleaning may not go beyond to access the services of the available improved
cleaning technology in the area Irrespective of the positioning of the cleaners limiting their flexibility in terms of
movement from one household to another produce cleaning using the improved machine was found necessary given
that farmers with 200-800 kg of produce for cleaning endured to push it on bicycles to and fro over a total distance
of 3-4 km to access and use Capitalizing on this maximum distance farmers can access and use technologies
expensive for them to own if positioned within a radius of 1km This would improve timely unit operations reduce
postharvest handling losses and exposure to dust during cleaning
2 Value addition of the project
The pedal operated seed cleaner is able to clean over 500 kgh of maize and 280 kgh of beans compared to less than
100 kgh using the traditional cleaning baskets trays and sieves
3 Good practices (If applicable)
The PoS-Cleaner reduces seed loss withing the chaff and dust accomplishes the cleaning tusk in a timely manner
and the user of the technology is not exposed to dust like when using trays and baskets
4 Project and community testimonies
Figure 0 shows the distances farmers moved to access and use the PoS-Cleaner This is a testimony showing the
necessity of the improved seed cleaning technologies among smallholder farmers It can be seen that a farmer with
800 kg of produce endured a distance of 2 km to access and use the cleaner and there after carry back the cleaned
produce through the same distance totaling to 4 km It should be noted that bicycles were the ones used to push the
produce
Figure 0 Distances farmers moved to access and use the PoS-Cleaner and quantities cleaned
000
100
200
300
0 200 400 600 800 1000
Dis
tan
ce m
ove
d b
y th
e
farm
er
(km
)
Quantity of produce brought for cleaning (kg)
Approximate distance moved by farmers to clean theirproduce (km)
ii
5 Engagement pictures
6 Lessons learnt
i If an expensive technology is available and farmers are aware hire service may improve its use
ii Technology use is greatly influenced by ownership awareness and accessibility distance
iii A maximum distance exists which farmers with given quantities of produce may not go beyond to access
technology services
iv Technology flexibility in terms of portability is key in technology acceptance and use
v Provided a technology is necessary users will move to access and use it irrespective of its limited flexibility
in terms of movement from one household to another
vi Farmers were found treating signs and symptoms of low yields by depending on loans for school fees without
knowing that low yields were the cause of less revenue and high household expenses
7 Media mentions and publications
The media link below gives more information on engagement with farmers using the developed seed cleaner
httpswwwnewvisioncougnews1525273farmers-clean-produce
Peter Tumutegyereize Isaac Oluk Julia Kigozi Ismail Mayanja Thomas Buyinza Moureen Mbeiza (2020)
Assessing the Effect of Access on the Use of Improved Seed Cleaning Technologies Challenges and Opportunities
among Farmers in Kamuli District-Uganda Submitted to World Development Journal
Wilber Akatuhurira Peter Tumutegyereize Isaac Oluk Emmanuel Baidhe Julia Kigozi Ismael Mayanja amp Hussein
Balimunsi Kivumbi (2020) Development and Performance Evaluation of a Pedal Operated Seed Cleaner (Pos-
Cleaner) For Seeds with Diameter Size Range Of 66 ndash 18mm Submitted to SN Applied Sciences Journal
iii
Contents
Project Summary i
List of Figures iv
List of Tables v
Acronyms vi
1 Introduction 1
2 Approach 2
21 Survey approach 2
22 Design of the pedal-operated seed cleaner components 3
221 Hopper 3
222 Trommels (Rotating sieves) 4
223 Belt and pulley design 5
224 prockets and chain drive design 6
225 Power required to operate the machine 7
226 Design of Sieve shaft 7
227 Design of centrifugal blower 7
23 Optimization of the cleaning process 8
3 Study findings and discussion 9
31 Level of technology ownership awareness and use 9
32 Effect of distance on use of seed cleaner by farmer groups 10
33 Optimization of the cleaning process 12
34 Feedback on seed cleaner timeliness by farmer groups 12
35 Challenges and opportunities to access and use postharvest handling technologies 14
4 Conclusion 17
Acknowledgment 18
References 18
Appendix A Traditional post-harvest cleaning technologies of seeds 21
Appendix B Production drawings 22
Appendix B Farmers using the Improved seed cleaning technology 23
iv
List of Figures
Figure 1 Assembly of the Pedal Operated Seed Cleaner 4
Figure 2 One farmer group learning how to use the seed cleaner machine 8
Figure 3 Approximate distances moved by farmers to the seed cleaner host with respect to the quantities
of their produce needed to be cleaned 11
Figure 4 A plot of cleaning efficiency against sieve size 12
Figure 5 Quantities of maize brought by farmers for cleaning with respect to time taken 13
Figure 6 Quantities of beans brought by farmers for cleaning with respect to time taken 14
Figure 7 Response by percentage for the use of loans secured by farmers 17
v
List of Tables
Table 1 Level of selected postharvest handling technology ownership and awareness by percentage 9
Table 2 Level of use of postharvest handling technologies by percentage 9
Table 3 One-month feedback on seed cleaner access and use 11
Table 4 Farmers yield percentages of maize and time taken during cleaning using trays and baskets 16
vi
Acronyms
CAES College of Agricultural and Environmental Sciences
CBOs Community Based Organizations
CE Cleaning Efficiency
FAO Food and Agriculture Organization
ISU-UP Iowa State University -Uganda Programme
MAAIF Ministry of Agriculture Animal Industry and Fisheries
NGO Non-Governmental Organization
PoS-Cleaner Pedal Operated Seed Cleaner
SACCO Savings and Credit Cooperative Organizations
SDG Sustainable Development Goals
TAM Technology Acceptance Model
UBOS Uganda Bureau of Statistics
UC University of California
VSLA Village Savings and Loan Associations
1
1 Introduction Cereals and pulses form the largest percentage of carbohydrate and protein sources for the majority
population in the developing countries In Uganda cereals and pulses account for 25 and 14
respectively of the crop area (FAO 2003) Most of the food supply comes from small scale farming
(operating on less than 2 acres) Taking an example of beans where an estimated 60-90 is
attributed to small scale farming (MAAIF 2018a) As such a lot of effort in terms of research
funding has been directed to developing varieties that are high yielding maturing in a short time
and resistant to pests and diseases to create favorable farming conditions for small scale farmers
However limited funding or research has been allocated to developing postharvest handling
technologies to handle the increased yields In contrast to developed countries where advanced
post-harvest handling technologies such as combine harvesters are used for threshing cleaning
and temporary storage manual methods are still employed in developing countries even on a large
scale It must be noted that the limited research that has focused on postharvest handling
technologies of cereals and pulses in developing countries has focused on threshing drying and
storage neglecting the unit operation of cleaning (Tefera et al 2011 Kumar amp Kalita 2017
Bradford et al 2018 River et al 2018) Yet cleaning is considered to be one of the most effective
unit operations in reducing levels of Mycotoxins in grains (Bullerman amp Bianchini 2007) Apart
from threshing using sticks there are now both manual and motorized shellers or threshers that
small-scale farmers can have access to use Similarly hermetic storage methods have been
developed such that farmers can access other than the traditional systems of storage like heaping
in house open-air hanging and traditional granaries (Omotilewa et al 2018) Whereas drying
threshing and storage technologies have moved a step cleaning operation remains lagging among
small scale farmers who form the largest percentage of cereal and pulse supplies in developing
countries In Uganda much of the cleaning of cereals and pulses is done by women using baskets
and trays This traditional screening or winnowing said to be inefficient time consuming labour
intensive coupled with 4 of total production losses (Kumar amp Kalita 2017) low revenues and
ill health exposure resulting from inhalation of dust (Tibagonzeka et al 2018) For rural schools
that depend on in-kind food tuition contributions from parents pupils traditionally clean seeds
hence reducing their study time and educational performance Certainty as to why appropriate
technology interventions addressing cereal and pulse cleaning as a unit operation in postharvest
handling are lagging among small scale farmers remains unclear Is it a question of technology
access or the technology of cereal and pulse cleaning is not necessary Technology access is being
looked at in terms of technology presence ownership awareness or proximate distance to the
technology being favorable In this context access is being considered as the right or opportunity
to use or benefit from the technology as defined in the Oxford dictionary Therefore this work
aimed at assessing the effect of access on the use of improved appropriate cleaning technologies
for cereals and pulses as compared to drying threshing and storage technologies among key
farmers in Kamuli district Uganda However challenges and opportunities to access and use
postharvest handling technologies were also taken into consideration This was in light of the fact
that a technology may be available and farmers fail to use it due to other underlying challenges
apart from access or they may have alternative technologies better than the technology of interest
2
In the work by Norris et al (2003) it is suggested when there is no access to a technology there
will not be use of the technology as well its impact Further it points out that the strongest
predictors of technology use are measures of technology access Given that most of the work done
on technology access and use has been focusing of information technology this work looked at
technology access and use in post-harvest handling unit operations
2 Approach
21 Survey approach To assess the effect of access on use of improved cleaning technologies for cereals and pulses in
relation to drying threshing and storage technologies a household survey was first conducted
During the survey purposive sampling was used It was necessary to identify potential farmers
without random sampling such that if they are found to be vulnerable in terms of lack ownership
and awareness of improved postharvest handling technologies income insecurity diseases
exposure stress drudgery and exploitation by middlemen then the other farmers who are on the
lower level would also be vulnerable Therefore 200 key farmers who have their own land and
have been practicing production of maize beans and ground nuts for a long period of time were
identified with the help of Iowa State University-Uganda Program (ISU-UP) an NGO that works
in Kamuli-Uganda in three sub counties of Butansi Nabwigulu and Namasagali in Kamuli
District The study area represents a suitable example where most of the sustainable development
goals (SDG) are far from being met In these sub counties 116-159 of female aged 10-19 years
have given birth 118-171 of youth aged 18-30 years are not in school and not working 139-
169 of children aged 6-12 years are not in school 339-612 of the households are 5 km and
above from the nearest public health facility and 43-85 of the households have less than 2 meals
a day (UBOS 2017) In addition most households in this study are rent out their land to sugarcane
out growers which leaves them with limited or no land for food production This suggests that the
area is characterized by food insecurity and malnutrition This is one of the reasons why ISU-UP
is operating in this area having established centres where it provides diets to under age expectant
and breast-feeding mothers school going children and the elderly The selected farmers are
considered as trainer farmers who are expected to train others Interviews were conducted face to
face using a preset questionnaire per the selected farmer or household Among the key parameters
that were assessed are post-harvest handling technology ownership awareness use accessibility
distance land size ownership crop yields challenges to unreliable income membership to any
savings group access to loan loan security and loan use
In order to establish whether access to seed cleaning technologies is necessary five pedal operated
seed cleaners were developed and distributed to five farmer groups which are active in grain crop
production in Butansi and Namasagali sub counties The cleaner consists of a bicycle-like pedaling
system hopper a centrifugal fan and three cleaning sieves which include two inside interlocking
sieves and one fixed whose meshes can be adjusted to be larger than the size of the unclean seeds
by simply translating the second sieve to achieve the appropriate seed size (Figure 1) This allows
trapping of foreign impurities larger than the seeds The outer third sieve has mesh holes smaller
3
than both unclean seeds hence eliminating impurities smaller than the seeds The fan and sieve
rotary motion derived from pedaling supports seed continuous movement through the sieves due
to gravity and centrifugal forces During operation the unclean seeds are fed into the hopper which
then flow down gravitationally At this stage light foreign materials are blown off by the
centrifugal fan This first separation stage utilizes the difference in aerodynamic property of the
materials being separated After the seeds are channeled to the sieves for further separation and
cleaned seeds are collected in one receptacle Host farmers for the machines among the five groups
were selected based on their potential to provide space and security for the machine as well as
potential to train other farmers on the use and operation of the machine Figure 2 shows farmers
learning how to use one of the machines at the residence of the host farmer This method was
informed by work done by Sambasivan et al (2010) on intermediated technology use in
developing countries where persons for whom technology is inaccessible due to barriers like lack
of awareness financial constraints lack of technology and skills for operation are enabled to
benefit from technologies through second or third party who have no access barriers to the
technology A data collection sheet was also provided so that whoever uses the machine registers
his or her subcounty parish village type of seed brought for cleaning quantity cleaned time taken
and remarks for feedback Distances between the residences of the hosts of the seed cleaners and
farmers who brought produce for cleaning were also approximated This was intended to establish
the effect of distance on machine use since it is one of the factors that limits one to benefit from
any available technology or service By doing this time to market flexibility integration and user
satisfaction which are considered to be the main variables of concern in the technology acceptance
model (TAM) (Hong and Yu 2018) were tested Measuring time taken to clean a given quantity
of produce was related to variable of time to market enables users to accomplish very complex
tasks in a short period of time In addition this also measured user satisfaction given that if the
rate of produce cleaning is below or equal to what farmers have been getting while using their
traditional cleaning technologies then user satisfaction is not met However if it is much higher
the user is satisfied Given that the piloted pedal operated seed cleaners could not be moved from
one farmer to another it has no flexibility in terms of movement This limitation in flexibility was
used to show the usefulness and necessity of the technology Integration on the other hand which
refers to a technology being used in conjunction with existing systems as reported by Hong and
Yu (2018) was said to be assessed if farmers used the pedal operated seed cleaning machine
instead of their traditional cleaning technologies
22 Design of the pedal-operated seed cleaner components
221 Hopper
4
Figure 1 Assembly of the Pedal Operated Seed Cleaner
The hopper shape is of a square-base pyramid frustum The volume of the hopper was determined
using Equation (1) (Mayanja et al 2018)
V=H
3(A1+A2+radic(A
1timesA2)) (1)
Where V is the volume of a hopper (m3) h is the height of the hopper (m) 1198601 is the area of the top
part of a hopper (m2) and 1198602 is the area of the bottom part of the hopper (m2)
Hopper capacity for the different grains was determined using Equation (2) M=ρtimesV (2)
Where ρ is the density of the grain
222 Trommels (Rotating sieves)
The three sieves rotate in tandem The two inner sieves are meshed together and can be adjusted
longitudinally to vary the mesh hole size to clean grains of varying sizes The efficiency of cleaning
generated from the trommels (rotary sieves) depends on its length diameter speed and angle of
inclination (Bellocq Ruiz Delaplace Duri amp Cuq 2017) The length and diameter of these sieves
should be long enough to provide for more time of contact of the seeds to be cleaned (Lee amp Lee
2020) The desired operating speed of trommels is computed relative to the critical speed the speed
at which a centripetal acceleration of 98ms2 at the screen surface is achieved (Amoah Aggey
Addo amp Abdulai 2017) According to (Mayanja et al 2018) the best operating speed of the
rotating sieve ranges from 33 to 45 of the critical speed Critical speed (Nc) was determined
from the sieve radius using the relationship in Equation (3) (Amoah et al 2017)
119873119888=30
120587radic
119892
119877 sin 120579 (3)
5
Where Nc is the critical angular speed of the sieve (rpm) R is the radius of the sieve(m) g is the
acceleration due to gravity (ms2) θis the maximum angle of lifting approximated to be the angle
of friction (degrees)
223 Belt and pulley design
(a) Length of the belt
The pedal operated seed cleaner has two pulleys with a belt connection to transmit power from the
chain drive to the trommels The diameter of the pulley is given by the relationship in Equation (4)
(Khurmi amp Gupta 2005) d1
d2
=N2
N1
(4)
Where d1 is the diameter of the driver pulley (m) d2 is the diameter of the driven pulley (m) N1 is
the speed of the driver pulley (rpm) N2 is the speed of the driven pulley (rpm)
The length of the belt (L) depends on the diameter of the driven and driving pulleys and the center
distance between the pulleys given by the relationship in Equation (5) (Khurmi amp Gupta 2005)
L=2C+157(d1+d2)+(d2-d1)
2
4C (5)
Where C is the center distance between two adjacent pulleys (m) determined by Equation (6)
(Sobowale Adebiyi amp Adebo 2015)
C=d1 + d2
2+ 1198891 (6)
(b) Tension in the tight and slack side of the belt
Tension in the tight side of the belt (1198791) is created on that section of the belt approaching the driver
pulley Tight side tension is a function of both maximum tension and centrifugal tension Tight side
tension is given by Equation (7) (Khurmi amp Gupta 2005)
T1 = Tmax - Tc (7)
Where Tmax is the maximum allowable tension in the belt (N) given by Equation (8) and Tc is the
centrifugal tension in the belt given by Equation (9) (Sobowale et al 2015)
Tmax = σ times1198601 (8)
Tc = mv2 (9)
Where σ is the stress for the belt material (Nm2) 119898 is the mass per unit length of the belt (kgm)
119907 is the speed of the belt (ms) determined by Equation (10) (Sobowale et al 2015) and A1 is the
cross-sectional area of the belt (m2) determined using Equation (11)
v =12058711987311198631
60(10)
1198601= (119861 + 119909
2) 119905 (11)
Where B and x are the outer and inner belt breadth respectively (mm) t is the belt thickness (mm)
6
Slack side tension is created on the section of the belt approaching the driven pulley The slack side
tension (T2) of the belt is given by Equation (12)
23 log (T1
T2) = μOslash csc β (12)
Where βis the half groove angle (degrees) Oslash is the angle of lap on the smaller pulley (radians)
given by Equation (13) and micro is the angle of friction between the belt and the pulley (unitless)
Oslash= (180-2 sinminus1 (1199031 minus 1199032
119862))
π
180 (13)
Where r1 and r2 = radii of the big and small pulleys (mm) respectively
(c) Power transmitted by the belt
The power required in transmitting the belt (P1) was determined using Equation (14) (Khurmi amp
Gupta 2005)
P1=(T1-T2)v (14)
224 prockets and chain drive design
The driver and driven sprockets are connected through a chain The driven sprocket (small) runs at
the same speed at the driver pulley in the belt-pulley arrangement The driver sprocket (Big) runs
at a speed determined by the relationship given by Equation (15) (Khurmi amp Gupta 2005)
NsTs = NbTb (15)
Where Ns is the speed of rotation for the small sprocket (rpm) Nb is the speed of rotation for the
big pulley (rpm) Ts is the number of teeth for the small sprocket Tb is the number of teeth for the
big sprocket
The length of the chain (Lc) was determined using Equation (16) (Khurmi amp Gupta 2005)
119871119888 = 119870119901 (16)
Where K is the number of chain links given by Equation (17) (Khurmi amp Gupta 2005) and p is the
pitch of the chain
K =119879119904 + 119879119887
2+
2119862119888
119901+ [
119879119887 minus 119879119904
2120587]
2 119901
119862119888 (17)
Where Cc is the center distance between the sprockets (mm)
The power transmitted by the chain (P2) based on breaking load was determined using Equation
(18) (Khurmi amp Gupta 2005)
1198752=119882119887 times 119907119888
119899 times 119896119904 (18)
Where Wb is the breaking load (N) n is the factor of safety vc is the velocity of the chain given by
Equation (19) and ks is the service factor given by Equation (20) (Khurmi amp Gupta 2005)
119907119888 =119879119901119873
60 (19)
Where N is the speed of rotation (rpm) T is the number of teeth
119896119904=1198961 times 1198962 times 1198963 (20)
Where k1 k2 k3 are the load factor lubrication factor and rating factor respectively
7
225 Power required to operate the machine
The total power required to run the machine was calculated by summing the power required in
transmitting the belt and the chain given by Equation (21)
P =1198751 + 1198752 (21)
226 Design of Sieve shaft
(a) Shaft diameter
The diameter of the shafts was ascertained mathematically using Equation (22) (Mayanja et al
2018)
D3=16
πτs
radic(KBMB)2+(KTMT)
2 (22)
Where D is the diameter of the shaft (m) Kb is the combined shock and fatigue factor applied to
bending moment KT is the combined shock and fatigue factor applied to torsional moment 120591119904 is
the allowable shear stress for bending and torsion (Nm2) MB is the maximum bending moment
(Nm) given by Equation (23) (Mayanja et al 2018) MT is the torsional moment (Nm) given by
Equation (24)
Mb=radicMh2+Mv
2 (23)
Where Mh is the horizontal component of the bending moment (Nm) Mv is the vertical component
of the bending moment (Nm) The maximum bending moment was divided into vertical bending
moments Mv and the horizontal Mh since the loadings are acting in different directions
MT=(T1+T2)D2
2 (24)
Where T1 is the tension in the tight side of the belt (N) T2 is the tension in the slack side of the belt
(N) and D2 is the diameter of the driven pulley (m)
(b) Shaft design based on torsional rigidity
This angle of twist was used to establish if the shaft was safe The angle of twist was determined
using Equation (25) according to (Olusegun Emeka Afolabi amp Alake 2018)
θ= 584119872119879L
G1198634 (25)
Where θ is the angle of twist (degrees) MT is the torsional moment (Nm) G is the torsional
modulus of rigidity (Nm2) L is the length of the shaft (m)
227 Design of centrifugal blower
A blower is used to move the air constantly with a slight increase in static pressure to allow for
separation of the grain-chuff mixture The blower air discharge was estimated using the expression
of continuity as given by Equation (26) (Olusegun et al 2018)
Q = 1198604V (26)
8
Where Q is the air discharge (m3s) A4 is the area of the blade (m2) and V is the velocity of air (ms)
produced form the blower
23 Optimization of the cleaning process
The geometric mean diameter was used to estimate the grain size A sample of 25 grains was picked
from maize beans and groundnut batches Using a vernier caliper the grain dimensions (length
width and thickness) were measured and used to calculate the geometric mean diameter for maize
beans and groundnuts using Equation (27) (Yenge Kad amp Nalawade 2018)
Size = (119886 times 119887 times 119888)13 (27)
Where a is the length (mm) b is the width (mm) c is the thickness (mm) of the grain
The inner sieve was then adjusted based on the size of grains Ten kilograms of maize were mixture
with known volumes of undesirable material The inner sieve was adjusted to 12 mm and the
mixture was then fed into the cleaning machine after which pedaling was done at 60 rpm This is
because lower cadences are known for lower energy demands (Abbiss Peiffer amp Laursen 2009)
The weight of clean maize collected at the clean seed outlet was determined using a digital weighing
scale The experiment was done in duplicate and an average was taken The same procedure was
repeated when the inner sieve was set at 13 14 and 15 mm respectively The respective cleaning
efficiencies were determined using Equation (30) The process was repeated for beans with inner
sieve holes adjusted to 14 15 16 and 17 mm and for ground nuts with inner sieve holes adjusted
to 8 10 12 14 16 mm The values of cleaning efficiency were compared to establish the highest
values The sieve hole size at which the cleaning machine recorded the highest cleaning efficiency
was taken to be the optimal sieve hole size for the grain while pedaling at 60 rpm
Figure 2 One farmer group learning how to use the seed cleaner machine
9
3 Study findings and discussion
31 Level of technology ownership awareness and use Table 1 presents the level of ownership of some selected postharvest handling technologies and
awareness It shows that even when the farmers are aware of the technology ownership may not
be possible if the cost of that technology is high given that cost is also one of the access barriers
(Porter and Donthu 2006) This is explained by the awareness percentage of tarpaulin for drying
and bags for storage which is 100 for each of them but their percentages of ownership are far
too different It can be seen that tarpaulin has a low ownership percentage of 417 while storage
bags have 78 This is probably due to the cost difference between tarpaulin and a storage bag
That is tarpaulin is over fifty times higher than the cost of a bag However if the technology is
available but expensive and farmers are aware hire service seems to be favored This is supported
by the percentage of awareness of the threshing machine (776) and its hire service percentage
of 924 Table 2 on the other hand presents percentage use of the different postharvest handling
technologies Comparing Tables 1 and 2 it can be said that ownership and awareness of a
technology influence use of the technology to a greater extent Taking cleaning machine as an
example whose percentage of awareness is 126 and ownership percentage is 0 by individual
and 1 by group basis its percentage use is very low (2) compared to the other technologies
whose awareness and ownership percentages are higher This supports Norris et al (2003)
argument that having one unit of a technology (machine) in a community is not access nor will it
lead to significant community use In addition the lack of awareness probably explains partly the
939 of why farmers are still heavily relying on the traditional methods of cleaning using trays
and baskets
Table 1 Level of selected postharvest handling technology ownership and awareness by
percentage
Attribute Tarpaulin Threshing
machine
Winnowing
machine
Storage bags
Individual
ownership
417 57 0 78
Group
ownership
0 76 1 0
Hire 924 1
Aware of
technology
100 776 126 100
Table 2 Level of use of postharvest handling technologies by percentage
Postharvest activities
Drying
Technology
use
Threshing
Technology
use
Cleaning
Technology
use
Storage
Technology
use
10
Tarpaulin 322 Sticks 645 Winnowing
basketstrays
939 bags 78
Bare
ground
583 Threshersheller 225 Cleaning
machine
20 drums 4
Tarpaulin
and bare
ground
95 Sticks and
threshersheller
130 Winnowing
sieves
41 hip in house
corner
175
32 Effect of distance on use of seed cleaner by farmer groups Table 3 presents a one-month feedback on access and use from three seed cleaners out of the five
that were distributed It should be noted that the harvesting season was towards the end when the
farmer groups received the seed cleaners and farmers would go to clean their produce when they
wanted in their own time However of the two hosts that did not send feedback one closed home
and went somewhere for some time after receiving the machine while the other host is a training
center which was not operating as supposed due to covid-19 restrictions This suggests that
technology use depends on access This is further supported by Figure 3 which shows the
approximate distances farmers travelled to the seed cleaner hosts with respect to the quantities of
produce that needed to be cleaned Regardless of the limited flexibility in terms of movement of
the cleaning machine from one household to another farmers where able to carry their produce to
be cleaned showing the necessity of the technology It should be noted that both men and women
were involved in the cleaning process indicating the role of improved technology is gender
balance It is generally shown that farmers who brought their produce for cleaning were from
within a radius of 2 km In addition it was only farmers with 200 kg and above that found it
necessary to carry their produce in a distance of more than 1 km for cleaning This implies that
farmers with small quantities found it not worthwhile to move long distances to access the
technology However if the seed cleaners were within their reach they would use them
irrespective of the quantity This is evidenced by the fact that the majority who used the machine
were within 1 km and less with less than 200 kg of produce for cleaning Note that farmers with
zero distances moved are the host farmers of the seed cleaners Given that farmers with large
quantities of produce were the ones who moved long distances to access and use the seed cleaners
it suggests that there is a relationship between distance to access a technology and the quantity of
produce to be cleaned That is there is maximum distance beyond which a farmer with a given
quantity of produce to be cleaned cannot exceed to access a technology for use Further it proves
the necessity of postharvest handling cleaning technologies for seeds as well as the magnitude of
the problems associated with seed cleaning using the local technologies From the survey over
90 of the respondents reported that winnowing with baskets and trays was associated with
diseases due to dust time consuming and tiresomeness Paining of cheeks after a long day of seed
cleaning using trays was singled out as a major problem among women It is important that as
efforts to improve productivity with high yielding varieties continue attention should be put on
developing and availing technologies for cleaning Like threshing machines that have been
integrated in the system through hire service seed cleaning machines can be integrated in the
11
system through the same since farmers showed that they are needed Further governments can
capitalize on this maximum distance by positioning postharvest handling technologies expensive
for farmers to own within radii of 1 km to improve their access and use
Table 3 One-month feedback on seed cleaner access and use
No Farmer group area Seed cleaner
location
Number of
users
Quantity of
maize
cleaned (kg)
Quantity
of beans
cleaned
(kg)
1 Bugulu zone Bwiiza
parish-Namasagali
subcounty
N0deg 57676
E32deg 59179
6 280 27
2 Kabanyolo zone
Namasagali parish-
Namasagali subcounty
N 10 01408rsquo
E32 057 416rsquo
17 3490 295
3 Bugogo Zone kiwungu
parish-Butansi subcounty
N0deg 54224
E33deg 04146
21 2630 -
4 Bugeywa Zone Bugeywa
parish-Butansi subcounty
N0deg 54786
E33deg 01743
- - -
5 Butegere Zone Naluwoli
parish-Butansi subcounty
N0deg 56323
E33deg 03601
- - -
Figure 3 Approximate distances moved by farmers to the seed cleaner host with respect to the quantities of their produce needed
to be cleaned
000
050
100
150
200
250
0 100 200 300 400 500 600 700 800 900
Dis
tan
ce m
oved
by
th
e fa
rmer
(k
m)
Quantity of produce brought for cleaning (kg)
Approximate distance moved by farmers to clean their produce (km)
12
33 Optimization of the cleaning process
Figure 4 shows the variation of cleaning efficiency (CE) with sieve size It is observed that the
cleaning efficiency is initially low but increases with increasing sieve size for all grains The low
CE at smaller sieve sizes is attributed to the inability of the grains to fall through the sieve therefore
ending up in the chaff At a very large sieve size the CE is observed to reduce for all grains This
could be a result of excessive infiltration of the undesired materials into the grains which is
eventually collected at the clean grain outlet Upon optimizing the sieve size for the different grains
results indicate that maize beans and groundnuts had their highest CE of 9509 8761 and
8167 at the inner sieve size of 13 mm 16 mm and 10 mm respectively
Figure 4 A plot of cleaning efficiency against sieve size
34 Feedback on seed cleaner timeliness by farmer groups Figures 5 and 6 show the quantities of maize and beans respectively from different farmers that
were cleaned by the machines and the time each farmer took to complete the cleaning process
using the machine From the equations of best lines of fit 5169 kg and 2881 kg of maize and
beans respectively can be cleaned by the seed cleaner in an hour These values are not far from
what had been determined using 10 kg of both maize and beans Cleaning rates of 571 kgh and
375 kgh of maize and beans respectively had been determined by extrapolation basing on 10 kg
70
75
80
85
90
95
100
75 85 95 105 115 125 135 145 155 165 175
Cle
anin
g E
ffic
iency
(C
E)
-
Sieve size (mm)
Maize Beans Groundnuts
13
of each produce that was used for testing Therefore one can confidently say that the seed cleaner
can clean over 500 kgh and 280 kgh of maize and beans respectively In comparison with existing
practices 944 of respondents reported taking more than five hours to clean their produce
whereby 764 reported yields of over 5 bags before cleaning On the other MAAIF (2018ab)
reported a blanket figure for both maize and beans as 100 kgh for an individual using tray or
basket and 500 kgh using a sieve However 500 kgh with a sieve never factored in the time to
sort out large constituents which the seed cleaner takes care of On the other hand if using a sieve
would achieve 500 kgh as given by MAAIF (2018ab) then no farmer would bear the burden of
pushing 200-800 kg of maize on a bicycle for a distance of 15-2 km looking for a cleaner and then
pushes it back after cleaning considering the conditions of village roads In this regard time to
market and user satisfaction were met by the machinersquos higher rates of cleaning of over 500 kgh
for maize and 280kgh for beans compared to what farmers normally achieve when using trays
baskets and sieves
Figure 5 Quantities of maize brought by farmers for cleaning with respect to time taken
y = 51688xRsup2 = 0984
0
100
200
300
400
500
600
700
800
900
000 020 040 060 080 100 120 140 160
Qu
an
tity
of
maiz
e cl
ean
ed (
kg
)
Time (h)
Quantity Cleaned (kg) line of fit
14
Figure 6 Quantities of beans brought by farmers for cleaning with respect to time taken
35 Challenges and opportunities to access and use postharvest handling
technologies From the survey 657 reported income not reliable due to three main factors contributing 96
of the respondents These factors are less revenue from produce high household expenses and
postharvest loss There is an opportunity underlying this challenge given that 925 of the farmers
were found belonging to certain Village Savings and Loan Associations (VSLA) or Savings and
Credit Cooperative Organizations (SACCO) although only 639 were active members
Collective marketing would give them bargaining power thus enhancing their incomes However
this opportunity of collective marketing was only found being exploited by only 35 of the
respondents while 83 reported middlemen coming for their produce from their homes
Furthermore if collective marketing was adopted access to postharvest handling technologies
would be much easier For instance in the case where farmers pushed 200-800 kg of produce on
bicycles (Figure 3) to the cleaning machines and back covering a total distance of 3-4 km the
machine would be positioned at the collecting center so that the farmer does not have to carry the
produce back after cleaning In this way the farmers would save their energy and time by carrying
once their produce instead of twice As already highlighted in Section 32 over 90 of the
respondents reported that winnowing with baskets and trays was time consuming tiresome and
associated with diseases due to dust Table 4 shows the time farmers take while cleaning their
produce using baskets and trays Working in groups would enable farmers access technology
through credit or hire purchase which individuals may not be in position to achieve Moreover by
the time this interview took place 65 of the farmers had taken loans of which 84 of these had
taken the loan in less than 12 months back In addition the loans taken were most especially used
for paying fees as shown in Figure 7 To secure loans 22 used their land as mortgage 327
were recommended by those who trusted them that would pay back 29 took salary loans and
y = 28813x
Rsup2 = 09953
0
20
40
60
80
100
120
140
160
000 010 020 030 040 050 060
Qu
an
tity
of
bea
ns
clea
ned
(k
g)
Time (h)
Quantity of beans cleaned line of fit
15
43 used their houses as mortgage Given that the respondents were purposively sampled based
on those who own land and were using it to grow maize beans and groundnuts this implies that
those do not have land or are marginalized have limited chance of securing loans since they cannot
get security for the loan like land recommender or salary This indicates that children of the
marginalized households drop out of school since their parents have limited chances of securing a
loan for school fees like the households who have land However this dependence on loan to take
children to school puts probably all households in a vulnerable position of not being able to
purchase a technology on individual basis Also storage space was found to be limited for 51 of
the respondents which can be addressed through bulk storage in groups
In respect to the cleaning machines that were positioned at the residences of host farmers those
who used the machines to clean their produce suggested modification on the machines in order for
them to be moved from household to household It should be noted that the seed cleaners that
where distributed had no wheels to be pulled like some of the threshing machines The machines
are also large in size to be carried by motorcycles which farmers depend on to carry threshing
machines that do not have wheels Amidst this challenge of machines being in one place farmers
are continuing carrying their produce to and fro to have it cleaned This shows the need or
necessity for improved technologies to handle the cleaning unit operation that has been lagging
when compared to drying threshing and storage operations It also shows the underlying
challenges farmers face during cleaning of their produce
This work has revealed gaps in the value chain of crop production that need attention by
innovators extension workers in areas of soil fertility management post-harvest handling social
to financial NGOs CBOs governments First about 91 of the respondents were found to have
more than 1 acre of land which to some extent agrees with the 61 of the respondents having more
than 5 bags of maize harvest Although the phrase ldquomore than 5 bagsrdquo was not defined to be
specific MAAIF (2018b) states that current average maize yield per acre to be between 089 MT
and 101 MT compared to the potential yield of 32 MTacre Considering the quantities of maize
farmers carried for cleaning to the cleaning machines none was in the range of 089-101 MT
Worse still 897 were below 5 bags which is contrary to the survey data Partly one would
probably argue that farmers carried a portion of their harvest to be cleaned However what is being
revealed in this finding is that use of questionnaire method to determine parameters at households
may not show exactly the situation on ground By availing a new technology (seed cleaning
machine) farmers probably brought out all they had harvested for cleaning The farmers who
carried 2 to 8 bags of maize for cleaning most probably was all they had which are far below the
current average yield range of 089-101 MTacre without considering the potential yield of 32
MTacre It is surprising that none of the respondents suggested low yields as one of the causes of
unreliable income Only 24 of the respondents reported that they had small pieces of land which
relates to small quantities of harvest This suggests that farmers know that the land sizes at their
disposal is sufficient but they probably do not know the yields expected from their land The
underlying main cause of less revenue failure to meet household expenses and postharvest loss as
the factors for unreliable income that farmers may not be aware of is probably low yields as
revealed in the presented analysis These low yields point to soil degradation impacts of climate
16
change poor agronomical practices limited or no extension services as well as limited resources
in terms of labour and capital to put in place what would be needed to increase yields Since 100
of the respondents were directly engaged in farming as their primary source of income the effects
of low yields directly affect attaining goals number 1 and 2 of no poverty and zero hunger
respectively of the Sustainable Development Goals (SDG) In addition low yields hinder the
quality of health and well-being quality of education economic growth as well as industry
development which are all part and parcel of the SDG For instance the effect of low yields on
the quality of education is depicted in Figure 5 where majority of the households depend on loans
to take children to school Therefore this calls for new innovative approaches from government
agencies and researchers when determining household parameters if the SDG are to be practically
fully attained
The other gap identified in this study is that the seed cleaner machines that were piloted among
farmers can only handle seeds in the range of 66-18 mm in size (maize beans and groundnuts)
However farmers in the developing countries grow rice soya beans and many other crops with
smaller seed sizes whose unit operation of cleaning has no improved technology to address it This
is an opportunity that can be tapped into
Table 4 Farmers yield percentages of maize and time taken during cleaning using trays and
baskets
Yield (100 kg
bags)
Before cleaning
()
After cleaning
()
Time taken (h)
lt2 55 90 lt3
2-3 45 95 3-4
3-4 60 55 4-5
4-5 75 131 gt5
gt5 764 618 gt5
17
Figure 7 Response by percentage for the use of loans secured by farmers
4 Conclusion Irrespective of the limited or no flexibility of the pedal operated seed cleaning machine in terms
of movement from one household to another farmers including both men and women carried their
produce to where the machines were stationed for cleaning and back This proved the necessity of
improved technologies for the cleaning unit operation Although farmers moved to use the
machines the study established that there is maximum distance beyond which a farmer with a
given quantity of produce to be cleaned cannot exceed to access a technology for use given that
farmers with quantities less than 200 kg were from within a radius of not more than 1 km from the
seed cleanersrsquo host farmers While on the other hand farmers with 200-800 kg were from within
a radius of 15 to 2 km Improved seed cleaning technology was found necessary since farmers
with 200-800 kg of produce for cleaning endured to push it on bicycles to and fro over a total
distance of 3-4 km to access and use the cleaner It is important that as efforts to improve
productivity with high yielding varieties continue attention should be put on developing and
availing technologies for the cleaning unit operation as well
Results from the use of the seed cleaner by farmers show that the seed cleaner is able to clean
over 500 kgh of maize and 250 kgh of beans which are about five times higher than what can be
achieved by the commonly used trays and baskets This partly meets user satisfaction and time to
market parameters important for any technology development to be acceptable
18
Less revenue from produce high household expenses postharvest loss time consuming drudgery
disease susceptibility and dependence on loans were the main challenges farmers are experiencing
However if these farmers took advantage of collective marketing of which over 90 were found
belonging to certain farmer groups they would have bargaining powers over their produce thus
enhancing their income and potential to secure technologies through credit or hire purchase like
the seed cleaner relieving them of drudgery time wastage postharvest losses and disease
susceptibility
During the face to face interviews using a questionnaire 764 of the farmers suggested that they
harvest more than 5 bags of maize However analysis of data collected during the piloting of the
seed cleaning machine show that 897 of those who carried their maize for cleaning were below
5 bags contrary to the survey results Although low yields were not reported as one of the
challenges during the survey what is has been revealed is that low yields is probably the
underlying cause of less revenue that results into failure to meet household expenses and school
fees In addition this implies that new innovative approaches of carrying out household baseline
surveys are needed if reliable demographic variable information to base on for planning is to be
attained
Acknowledgment
This is made possible with funding from the Government of the Republic of Uganda through
Makerere University Research and Innovations Fund
References
Abbiss R C Peiffer J J amp Laursen P B (2009) Optimal cadence selection during cycling
International SportMed Journal 10(1) 1ndash15
Amoah J Y Aggey M Addo D amp Abdulai I (2017) Development and Performance Evaluation of a
Mechanized two-ply Palm Nut Cracked Mixture Rotary Sieve Journal of Ghana Science Association
17(2) 47ndash51
Bellocq B Ruiz T Delaplace G Duri A amp Cuq B (2017) Screening ef fi ciency and rolling effects
of a rotating screen drum used to process wet soft agglomerates Journal of Food Engineering 195 235ndash
246 httpsdoiorg101016jjfoodeng201609023
Bradford KJ Dahal P Van Asbrouck J Kunusoth K Bello P Thompson J et al (2018) The
dry chain Reducing postharvest losses and improving food safety in humid climates Trends in
Food Science amp Technology 71 pp 84-93
Bullerman L B amp Bianchini A (2007) Stability of mycotoxins during food processing
International Journal of Food Microbiology 119(1) 140-146
FAO Food and Agriculture Organization (2003) The Implementation experience ndash Developing
country case studies httpwwwfaoorg3y4632ey4632e0xhtm
19
Hong S H amp Yu J H (2018) Identification of external variables for the Technology Acceptance
Model (TAM) in the assessment of BIM application for mobile devices MSampE 401(1) 012027
httpsdoi1010881757-899X4011012027
Khurmi R S amp Gupta J K (2005) A Textbook of Machine Design (1st ed) New Delhi India Eurasia
Publishing House (Pvt) ltd
Kumar D Kalita P (2017) Reducing postharvest losses during storage of grain crops to
strengthen food security in developing countries Foods 6 (1) p 8 103390foods6010008
Lee M D amp Lee P S (2020) Design and Development of Size Segregation Sieve Machine with
Centrifugal Action Universal Journal of Mechanical Engineering 8(4) 208ndash215
httpsdoiorg1013189ujme2020080406
MAAIF (2018a) Beans Training Manual for Extension workers in Uganda
httpswwwagriculturegougwp-contentuploads201909Beans-training-manual-for-
extension-workers-in-Ugandapdf
MAAIF (2018b) Maize Training Manual for Extension workers in Uganda
httpswwwagriculturegougwp-contentuploads201909Maize-training-manual-for-
extension-workers-in-Ugandapdf Mayanja I K Kigozi J Kawongolo J B amp Brumm T J (2018) Design Fabrication and Testing of
a Pedal Operated Maize Grain Cleaner Journal of Advances in Food Science amp Technology 5(3) 105ndash
111
Norris C Sullivan T Poirot J amp Soloway E (2003) No access no use no impact snapshot
surveys of educational technology in K x2013 12 Journal of research on technology in
education 36(1) 15-27 httpsdoiorg10108015391523200310782400 Olusegun J O Emeka O C Afolabi O A amp Alake A S (2018) Development of a motorized rice
de-stoning machine Agricultural Engineering International CIGR Journal 20(4) 202ndash209
OmotilewaJO Ricker-Gilbert J John Herbert Ainembabazi JH Shively EG (2018) Does
improved storage technology promote modern input use and food security Evidence from a
randomized trial in Uganda Journal of Development Economics 135 176ndash198
httpsdoiorg101016jjdeveco201807006
Porter C E amp Donthu N (2006) Using the technology acceptance model to explain how
attitudes determine Internet usage The role of perceived access barriers and
demographics Journal of business research 59(9) 999-1007
httpsdoi101016jjbusres200606003
Rivier M Colligman A Meot J Madoumier M Sebastian P (2018) ldquoModeling a process
combining a cereal dryer with a bioenergy unit for equipment design in developing countriesrdquo J
Food Process Eng Vol 41 pp e12836 httpsdoiorg101111jfpe12836
20
Sambasivan N Cutrell E Toyama K amp Nardi B (2010 April) Intermediated technology use
in developing communities In Proceedings of the SIGCHI Conference on Human Factors in
Computing Systems (pp 2583-2592) httpsdoiorg10114517533261753718
Sobowale S S Adebiyi J A amp Adebo O A (2015) Design Construction and Performance
Evaluation of a Melon Seeds Sheller Food Processing amp Technology 6(7) 463
httpsdoiorg1041722157-71101000463
Tefera T Kanampiu F De Groote H Hellin J Mugo S Kimenju S Beyene Y Boddupalli
PM Shiferaw B Banziger M (2011) The metal silo an effective grain storage technology for
reducing post-harvest insect and pathogen losses in maize while improving smallholder farmers
food security in developing countries Crop Prot 30 (2011) pp 240-245
Tibagonzeka J E Akumu G Kiyimba F Atukwase A Wambete J Bbemba J amp Muyonga
J H (2018) Post-harvest handling practices and losses for legumes and starchy staples in
Uganda Agricultural Sciences 9(1) 141-156 DOI 104236as201891011
UBOS (2017) National Population and Housing Census 2014 Area specific profiles- Kamuli
District April 2017
Yenge G B Kad V P amp Nalawade S M (2018) Physical Properties of Maize ( Zea mays L) Grain
Journal of Krishi Vigyan 7(Special Issue) 125ndash128 httpsdoiorg1059582349-44332018001733
21
Appendix A Traditional post-harvest cleaning technologies of seeds
22
Appendix B Production drawings
23
Appendix B Farmers using the Improved seed cleaning technology
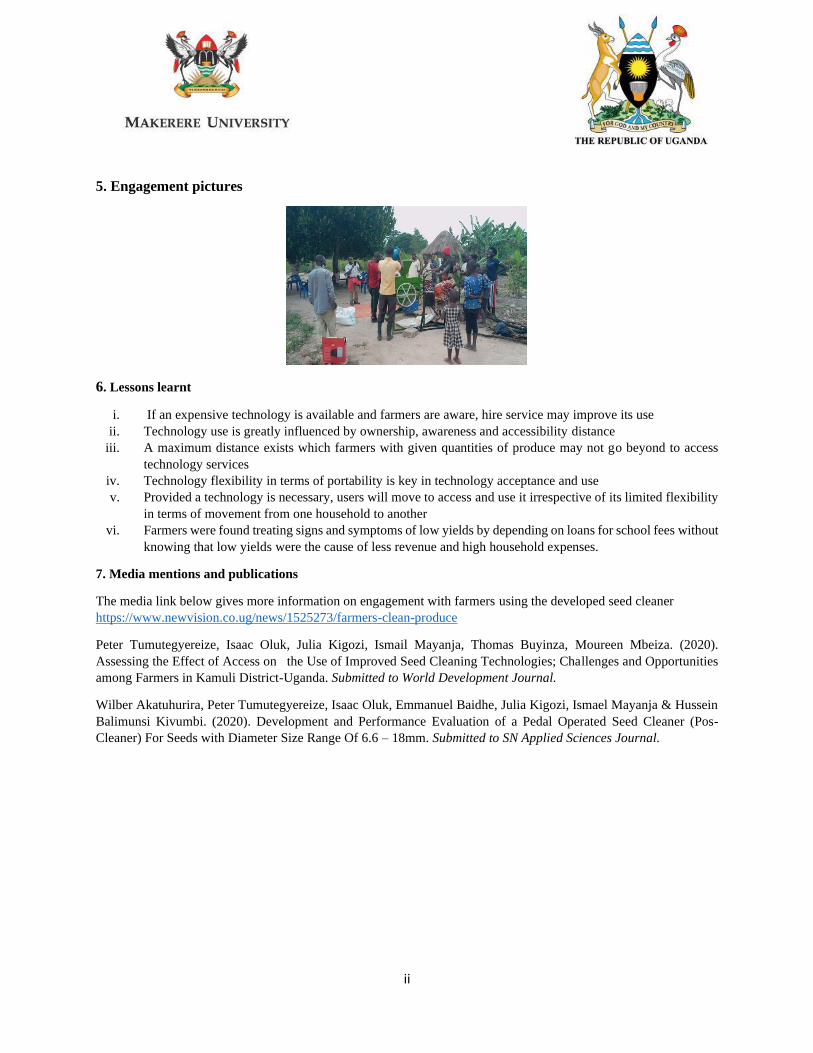

2
In the work by Norris et al (2003) it is suggested when there is no access to a technology there
will not be use of the technology as well its impact Further it points out that the strongest
predictors of technology use are measures of technology access Given that most of the work done
on technology access and use has been focusing of information technology this work looked at
technology access and use in post-harvest handling unit operations
2 Approach
21 Survey approach To assess the effect of access on use of improved cleaning technologies for cereals and pulses in
relation to drying threshing and storage technologies a household survey was first conducted
During the survey purposive sampling was used It was necessary to identify potential farmers
without random sampling such that if they are found to be vulnerable in terms of lack ownership
and awareness of improved postharvest handling technologies income insecurity diseases
exposure stress drudgery and exploitation by middlemen then the other farmers who are on the
lower level would also be vulnerable Therefore 200 key farmers who have their own land and
have been practicing production of maize beans and ground nuts for a long period of time were
identified with the help of Iowa State University-Uganda Program (ISU-UP) an NGO that works
in Kamuli-Uganda in three sub counties of Butansi Nabwigulu and Namasagali in Kamuli
District The study area represents a suitable example where most of the sustainable development
goals (SDG) are far from being met In these sub counties 116-159 of female aged 10-19 years
have given birth 118-171 of youth aged 18-30 years are not in school and not working 139-
169 of children aged 6-12 years are not in school 339-612 of the households are 5 km and
above from the nearest public health facility and 43-85 of the households have less than 2 meals
a day (UBOS 2017) In addition most households in this study are rent out their land to sugarcane
out growers which leaves them with limited or no land for food production This suggests that the
area is characterized by food insecurity and malnutrition This is one of the reasons why ISU-UP
is operating in this area having established centres where it provides diets to under age expectant
and breast-feeding mothers school going children and the elderly The selected farmers are
considered as trainer farmers who are expected to train others Interviews were conducted face to
face using a preset questionnaire per the selected farmer or household Among the key parameters
that were assessed are post-harvest handling technology ownership awareness use accessibility
distance land size ownership crop yields challenges to unreliable income membership to any
savings group access to loan loan security and loan use
In order to establish whether access to seed cleaning technologies is necessary five pedal operated
seed cleaners were developed and distributed to five farmer groups which are active in grain crop
production in Butansi and Namasagali sub counties The cleaner consists of a bicycle-like pedaling
system hopper a centrifugal fan and three cleaning sieves which include two inside interlocking
sieves and one fixed whose meshes can be adjusted to be larger than the size of the unclean seeds
by simply translating the second sieve to achieve the appropriate seed size (Figure 1) This allows
trapping of foreign impurities larger than the seeds The outer third sieve has mesh holes smaller
3
than both unclean seeds hence eliminating impurities smaller than the seeds The fan and sieve
rotary motion derived from pedaling supports seed continuous movement through the sieves due
to gravity and centrifugal forces During operation the unclean seeds are fed into the hopper which
then flow down gravitationally At this stage light foreign materials are blown off by the
centrifugal fan This first separation stage utilizes the difference in aerodynamic property of the
materials being separated After the seeds are channeled to the sieves for further separation and
cleaned seeds are collected in one receptacle Host farmers for the machines among the five groups
were selected based on their potential to provide space and security for the machine as well as
potential to train other farmers on the use and operation of the machine Figure 2 shows farmers
learning how to use one of the machines at the residence of the host farmer This method was
informed by work done by Sambasivan et al (2010) on intermediated technology use in
developing countries where persons for whom technology is inaccessible due to barriers like lack
of awareness financial constraints lack of technology and skills for operation are enabled to
benefit from technologies through second or third party who have no access barriers to the
technology A data collection sheet was also provided so that whoever uses the machine registers
his or her subcounty parish village type of seed brought for cleaning quantity cleaned time taken
and remarks for feedback Distances between the residences of the hosts of the seed cleaners and
farmers who brought produce for cleaning were also approximated This was intended to establish
the effect of distance on machine use since it is one of the factors that limits one to benefit from
any available technology or service By doing this time to market flexibility integration and user
satisfaction which are considered to be the main variables of concern in the technology acceptance
model (TAM) (Hong and Yu 2018) were tested Measuring time taken to clean a given quantity
of produce was related to variable of time to market enables users to accomplish very complex
tasks in a short period of time In addition this also measured user satisfaction given that if the
rate of produce cleaning is below or equal to what farmers have been getting while using their
traditional cleaning technologies then user satisfaction is not met However if it is much higher
the user is satisfied Given that the piloted pedal operated seed cleaners could not be moved from
one farmer to another it has no flexibility in terms of movement This limitation in flexibility was
used to show the usefulness and necessity of the technology Integration on the other hand which
refers to a technology being used in conjunction with existing systems as reported by Hong and
Yu (2018) was said to be assessed if farmers used the pedal operated seed cleaning machine
instead of their traditional cleaning technologies
22 Design of the pedal-operated seed cleaner components
221 Hopper
4
Figure 1 Assembly of the Pedal Operated Seed Cleaner
The hopper shape is of a square-base pyramid frustum The volume of the hopper was determined
using Equation (1) (Mayanja et al 2018)
V=H
3(A1+A2+radic(A
1timesA2)) (1)
Where V is the volume of a hopper (m3) h is the height of the hopper (m) 1198601 is the area of the top
part of a hopper (m2) and 1198602 is the area of the bottom part of the hopper (m2)
Hopper capacity for the different grains was determined using Equation (2) M=ρtimesV (2)
Where ρ is the density of the grain
222 Trommels (Rotating sieves)
The three sieves rotate in tandem The two inner sieves are meshed together and can be adjusted
longitudinally to vary the mesh hole size to clean grains of varying sizes The efficiency of cleaning
generated from the trommels (rotary sieves) depends on its length diameter speed and angle of
inclination (Bellocq Ruiz Delaplace Duri amp Cuq 2017) The length and diameter of these sieves
should be long enough to provide for more time of contact of the seeds to be cleaned (Lee amp Lee
2020) The desired operating speed of trommels is computed relative to the critical speed the speed
at which a centripetal acceleration of 98ms2 at the screen surface is achieved (Amoah Aggey
Addo amp Abdulai 2017) According to (Mayanja et al 2018) the best operating speed of the
rotating sieve ranges from 33 to 45 of the critical speed Critical speed (Nc) was determined
from the sieve radius using the relationship in Equation (3) (Amoah et al 2017)
119873119888=30
120587radic
119892
119877 sin 120579 (3)
5
Where Nc is the critical angular speed of the sieve (rpm) R is the radius of the sieve(m) g is the
acceleration due to gravity (ms2) θis the maximum angle of lifting approximated to be the angle
of friction (degrees)
223 Belt and pulley design
(a) Length of the belt
The pedal operated seed cleaner has two pulleys with a belt connection to transmit power from the
chain drive to the trommels The diameter of the pulley is given by the relationship in Equation (4)
(Khurmi amp Gupta 2005) d1
d2
=N2
N1
(4)
Where d1 is the diameter of the driver pulley (m) d2 is the diameter of the driven pulley (m) N1 is
the speed of the driver pulley (rpm) N2 is the speed of the driven pulley (rpm)
The length of the belt (L) depends on the diameter of the driven and driving pulleys and the center
distance between the pulleys given by the relationship in Equation (5) (Khurmi amp Gupta 2005)
L=2C+157(d1+d2)+(d2-d1)
2
4C (5)
Where C is the center distance between two adjacent pulleys (m) determined by Equation (6)
(Sobowale Adebiyi amp Adebo 2015)
C=d1 + d2
2+ 1198891 (6)
(b) Tension in the tight and slack side of the belt
Tension in the tight side of the belt (1198791) is created on that section of the belt approaching the driver
pulley Tight side tension is a function of both maximum tension and centrifugal tension Tight side
tension is given by Equation (7) (Khurmi amp Gupta 2005)
T1 = Tmax - Tc (7)
Where Tmax is the maximum allowable tension in the belt (N) given by Equation (8) and Tc is the
centrifugal tension in the belt given by Equation (9) (Sobowale et al 2015)
Tmax = σ times1198601 (8)
Tc = mv2 (9)
Where σ is the stress for the belt material (Nm2) 119898 is the mass per unit length of the belt (kgm)
119907 is the speed of the belt (ms) determined by Equation (10) (Sobowale et al 2015) and A1 is the
cross-sectional area of the belt (m2) determined using Equation (11)
v =12058711987311198631
60(10)
1198601= (119861 + 119909
2) 119905 (11)
Where B and x are the outer and inner belt breadth respectively (mm) t is the belt thickness (mm)
6
Slack side tension is created on the section of the belt approaching the driven pulley The slack side
tension (T2) of the belt is given by Equation (12)
23 log (T1
T2) = μOslash csc β (12)
Where βis the half groove angle (degrees) Oslash is the angle of lap on the smaller pulley (radians)
given by Equation (13) and micro is the angle of friction between the belt and the pulley (unitless)
Oslash= (180-2 sinminus1 (1199031 minus 1199032
119862))
π
180 (13)
Where r1 and r2 = radii of the big and small pulleys (mm) respectively
(c) Power transmitted by the belt
The power required in transmitting the belt (P1) was determined using Equation (14) (Khurmi amp
Gupta 2005)
P1=(T1-T2)v (14)
224 prockets and chain drive design
The driver and driven sprockets are connected through a chain The driven sprocket (small) runs at
the same speed at the driver pulley in the belt-pulley arrangement The driver sprocket (Big) runs
at a speed determined by the relationship given by Equation (15) (Khurmi amp Gupta 2005)
NsTs = NbTb (15)
Where Ns is the speed of rotation for the small sprocket (rpm) Nb is the speed of rotation for the
big pulley (rpm) Ts is the number of teeth for the small sprocket Tb is the number of teeth for the
big sprocket
The length of the chain (Lc) was determined using Equation (16) (Khurmi amp Gupta 2005)
119871119888 = 119870119901 (16)
Where K is the number of chain links given by Equation (17) (Khurmi amp Gupta 2005) and p is the
pitch of the chain
K =119879119904 + 119879119887
2+
2119862119888
119901+ [
119879119887 minus 119879119904
2120587]
2 119901
119862119888 (17)
Where Cc is the center distance between the sprockets (mm)
The power transmitted by the chain (P2) based on breaking load was determined using Equation
(18) (Khurmi amp Gupta 2005)
1198752=119882119887 times 119907119888
119899 times 119896119904 (18)
Where Wb is the breaking load (N) n is the factor of safety vc is the velocity of the chain given by
Equation (19) and ks is the service factor given by Equation (20) (Khurmi amp Gupta 2005)
119907119888 =119879119901119873
60 (19)
Where N is the speed of rotation (rpm) T is the number of teeth
119896119904=1198961 times 1198962 times 1198963 (20)
Where k1 k2 k3 are the load factor lubrication factor and rating factor respectively
7
225 Power required to operate the machine
The total power required to run the machine was calculated by summing the power required in
transmitting the belt and the chain given by Equation (21)
P =1198751 + 1198752 (21)
226 Design of Sieve shaft
(a) Shaft diameter
The diameter of the shafts was ascertained mathematically using Equation (22) (Mayanja et al
2018)
D3=16
πτs
radic(KBMB)2+(KTMT)
2 (22)
Where D is the diameter of the shaft (m) Kb is the combined shock and fatigue factor applied to
bending moment KT is the combined shock and fatigue factor applied to torsional moment 120591119904 is
the allowable shear stress for bending and torsion (Nm2) MB is the maximum bending moment
(Nm) given by Equation (23) (Mayanja et al 2018) MT is the torsional moment (Nm) given by
Equation (24)
Mb=radicMh2+Mv
2 (23)
Where Mh is the horizontal component of the bending moment (Nm) Mv is the vertical component
of the bending moment (Nm) The maximum bending moment was divided into vertical bending
moments Mv and the horizontal Mh since the loadings are acting in different directions
MT=(T1+T2)D2
2 (24)
Where T1 is the tension in the tight side of the belt (N) T2 is the tension in the slack side of the belt
(N) and D2 is the diameter of the driven pulley (m)
(b) Shaft design based on torsional rigidity
This angle of twist was used to establish if the shaft was safe The angle of twist was determined
using Equation (25) according to (Olusegun Emeka Afolabi amp Alake 2018)
θ= 584119872119879L
G1198634 (25)
Where θ is the angle of twist (degrees) MT is the torsional moment (Nm) G is the torsional
modulus of rigidity (Nm2) L is the length of the shaft (m)
227 Design of centrifugal blower
A blower is used to move the air constantly with a slight increase in static pressure to allow for
separation of the grain-chuff mixture The blower air discharge was estimated using the expression
of continuity as given by Equation (26) (Olusegun et al 2018)
Q = 1198604V (26)
8
Where Q is the air discharge (m3s) A4 is the area of the blade (m2) and V is the velocity of air (ms)
produced form the blower
23 Optimization of the cleaning process
The geometric mean diameter was used to estimate the grain size A sample of 25 grains was picked
from maize beans and groundnut batches Using a vernier caliper the grain dimensions (length
width and thickness) were measured and used to calculate the geometric mean diameter for maize
beans and groundnuts using Equation (27) (Yenge Kad amp Nalawade 2018)
Size = (119886 times 119887 times 119888)13 (27)
Where a is the length (mm) b is the width (mm) c is the thickness (mm) of the grain
The inner sieve was then adjusted based on the size of grains Ten kilograms of maize were mixture
with known volumes of undesirable material The inner sieve was adjusted to 12 mm and the
mixture was then fed into the cleaning machine after which pedaling was done at 60 rpm This is
because lower cadences are known for lower energy demands (Abbiss Peiffer amp Laursen 2009)
The weight of clean maize collected at the clean seed outlet was determined using a digital weighing
scale The experiment was done in duplicate and an average was taken The same procedure was
repeated when the inner sieve was set at 13 14 and 15 mm respectively The respective cleaning
efficiencies were determined using Equation (30) The process was repeated for beans with inner
sieve holes adjusted to 14 15 16 and 17 mm and for ground nuts with inner sieve holes adjusted
to 8 10 12 14 16 mm The values of cleaning efficiency were compared to establish the highest
values The sieve hole size at which the cleaning machine recorded the highest cleaning efficiency
was taken to be the optimal sieve hole size for the grain while pedaling at 60 rpm
Figure 2 One farmer group learning how to use the seed cleaner machine
9
3 Study findings and discussion
31 Level of technology ownership awareness and use Table 1 presents the level of ownership of some selected postharvest handling technologies and
awareness It shows that even when the farmers are aware of the technology ownership may not
be possible if the cost of that technology is high given that cost is also one of the access barriers
(Porter and Donthu 2006) This is explained by the awareness percentage of tarpaulin for drying
and bags for storage which is 100 for each of them but their percentages of ownership are far
too different It can be seen that tarpaulin has a low ownership percentage of 417 while storage
bags have 78 This is probably due to the cost difference between tarpaulin and a storage bag
That is tarpaulin is over fifty times higher than the cost of a bag However if the technology is
available but expensive and farmers are aware hire service seems to be favored This is supported
by the percentage of awareness of the threshing machine (776) and its hire service percentage
of 924 Table 2 on the other hand presents percentage use of the different postharvest handling
technologies Comparing Tables 1 and 2 it can be said that ownership and awareness of a
technology influence use of the technology to a greater extent Taking cleaning machine as an
example whose percentage of awareness is 126 and ownership percentage is 0 by individual
and 1 by group basis its percentage use is very low (2) compared to the other technologies
whose awareness and ownership percentages are higher This supports Norris et al (2003)
argument that having one unit of a technology (machine) in a community is not access nor will it
lead to significant community use In addition the lack of awareness probably explains partly the
939 of why farmers are still heavily relying on the traditional methods of cleaning using trays
and baskets
Table 1 Level of selected postharvest handling technology ownership and awareness by
percentage
Attribute Tarpaulin Threshing
machine
Winnowing
machine
Storage bags
Individual
ownership
417 57 0 78
Group
ownership
0 76 1 0
Hire 924 1
Aware of
technology
100 776 126 100
Table 2 Level of use of postharvest handling technologies by percentage
Postharvest activities
Drying
Technology
use
Threshing
Technology
use
Cleaning
Technology
use
Storage
Technology
use
10
Tarpaulin 322 Sticks 645 Winnowing
basketstrays
939 bags 78
Bare
ground
583 Threshersheller 225 Cleaning
machine
20 drums 4
Tarpaulin
and bare
ground
95 Sticks and
threshersheller
130 Winnowing
sieves
41 hip in house
corner
175
32 Effect of distance on use of seed cleaner by farmer groups Table 3 presents a one-month feedback on access and use from three seed cleaners out of the five
that were distributed It should be noted that the harvesting season was towards the end when the
farmer groups received the seed cleaners and farmers would go to clean their produce when they
wanted in their own time However of the two hosts that did not send feedback one closed home
and went somewhere for some time after receiving the machine while the other host is a training
center which was not operating as supposed due to covid-19 restrictions This suggests that
technology use depends on access This is further supported by Figure 3 which shows the
approximate distances farmers travelled to the seed cleaner hosts with respect to the quantities of
produce that needed to be cleaned Regardless of the limited flexibility in terms of movement of
the cleaning machine from one household to another farmers where able to carry their produce to
be cleaned showing the necessity of the technology It should be noted that both men and women
were involved in the cleaning process indicating the role of improved technology is gender
balance It is generally shown that farmers who brought their produce for cleaning were from
within a radius of 2 km In addition it was only farmers with 200 kg and above that found it
necessary to carry their produce in a distance of more than 1 km for cleaning This implies that
farmers with small quantities found it not worthwhile to move long distances to access the
technology However if the seed cleaners were within their reach they would use them
irrespective of the quantity This is evidenced by the fact that the majority who used the machine
were within 1 km and less with less than 200 kg of produce for cleaning Note that farmers with
zero distances moved are the host farmers of the seed cleaners Given that farmers with large
quantities of produce were the ones who moved long distances to access and use the seed cleaners
it suggests that there is a relationship between distance to access a technology and the quantity of
produce to be cleaned That is there is maximum distance beyond which a farmer with a given
quantity of produce to be cleaned cannot exceed to access a technology for use Further it proves
the necessity of postharvest handling cleaning technologies for seeds as well as the magnitude of
the problems associated with seed cleaning using the local technologies From the survey over
90 of the respondents reported that winnowing with baskets and trays was associated with
diseases due to dust time consuming and tiresomeness Paining of cheeks after a long day of seed
cleaning using trays was singled out as a major problem among women It is important that as
efforts to improve productivity with high yielding varieties continue attention should be put on
developing and availing technologies for cleaning Like threshing machines that have been
integrated in the system through hire service seed cleaning machines can be integrated in the
11
system through the same since farmers showed that they are needed Further governments can
capitalize on this maximum distance by positioning postharvest handling technologies expensive
for farmers to own within radii of 1 km to improve their access and use
Table 3 One-month feedback on seed cleaner access and use
No Farmer group area Seed cleaner
location
Number of
users
Quantity of
maize
cleaned (kg)
Quantity
of beans
cleaned
(kg)
1 Bugulu zone Bwiiza
parish-Namasagali
subcounty
N0deg 57676
E32deg 59179
6 280 27
2 Kabanyolo zone
Namasagali parish-
Namasagali subcounty
N 10 01408rsquo
E32 057 416rsquo
17 3490 295
3 Bugogo Zone kiwungu
parish-Butansi subcounty
N0deg 54224
E33deg 04146
21 2630 -
4 Bugeywa Zone Bugeywa
parish-Butansi subcounty
N0deg 54786
E33deg 01743
- - -
5 Butegere Zone Naluwoli
parish-Butansi subcounty
N0deg 56323
E33deg 03601
- - -
Figure 3 Approximate distances moved by farmers to the seed cleaner host with respect to the quantities of their produce needed
to be cleaned
000
050
100
150
200
250
0 100 200 300 400 500 600 700 800 900
Dis
tan
ce m
oved
by
th
e fa
rmer
(k
m)
Quantity of produce brought for cleaning (kg)
Approximate distance moved by farmers to clean their produce (km)
12
33 Optimization of the cleaning process
Figure 4 shows the variation of cleaning efficiency (CE) with sieve size It is observed that the
cleaning efficiency is initially low but increases with increasing sieve size for all grains The low
CE at smaller sieve sizes is attributed to the inability of the grains to fall through the sieve therefore
ending up in the chaff At a very large sieve size the CE is observed to reduce for all grains This
could be a result of excessive infiltration of the undesired materials into the grains which is
eventually collected at the clean grain outlet Upon optimizing the sieve size for the different grains
results indicate that maize beans and groundnuts had their highest CE of 9509 8761 and
8167 at the inner sieve size of 13 mm 16 mm and 10 mm respectively
Figure 4 A plot of cleaning efficiency against sieve size
34 Feedback on seed cleaner timeliness by farmer groups Figures 5 and 6 show the quantities of maize and beans respectively from different farmers that
were cleaned by the machines and the time each farmer took to complete the cleaning process
using the machine From the equations of best lines of fit 5169 kg and 2881 kg of maize and
beans respectively can be cleaned by the seed cleaner in an hour These values are not far from
what had been determined using 10 kg of both maize and beans Cleaning rates of 571 kgh and
375 kgh of maize and beans respectively had been determined by extrapolation basing on 10 kg
70
75
80
85
90
95
100
75 85 95 105 115 125 135 145 155 165 175
Cle
anin
g E
ffic
iency
(C
E)
-
Sieve size (mm)
Maize Beans Groundnuts
13
of each produce that was used for testing Therefore one can confidently say that the seed cleaner
can clean over 500 kgh and 280 kgh of maize and beans respectively In comparison with existing
practices 944 of respondents reported taking more than five hours to clean their produce
whereby 764 reported yields of over 5 bags before cleaning On the other MAAIF (2018ab)
reported a blanket figure for both maize and beans as 100 kgh for an individual using tray or
basket and 500 kgh using a sieve However 500 kgh with a sieve never factored in the time to
sort out large constituents which the seed cleaner takes care of On the other hand if using a sieve
would achieve 500 kgh as given by MAAIF (2018ab) then no farmer would bear the burden of
pushing 200-800 kg of maize on a bicycle for a distance of 15-2 km looking for a cleaner and then
pushes it back after cleaning considering the conditions of village roads In this regard time to
market and user satisfaction were met by the machinersquos higher rates of cleaning of over 500 kgh
for maize and 280kgh for beans compared to what farmers normally achieve when using trays
baskets and sieves
Figure 5 Quantities of maize brought by farmers for cleaning with respect to time taken
y = 51688xRsup2 = 0984
0
100
200
300
400
500
600
700
800
900
000 020 040 060 080 100 120 140 160
Qu
an
tity
of
maiz
e cl
ean
ed (
kg
)
Time (h)
Quantity Cleaned (kg) line of fit
14
Figure 6 Quantities of beans brought by farmers for cleaning with respect to time taken
35 Challenges and opportunities to access and use postharvest handling
technologies From the survey 657 reported income not reliable due to three main factors contributing 96
of the respondents These factors are less revenue from produce high household expenses and
postharvest loss There is an opportunity underlying this challenge given that 925 of the farmers
were found belonging to certain Village Savings and Loan Associations (VSLA) or Savings and
Credit Cooperative Organizations (SACCO) although only 639 were active members
Collective marketing would give them bargaining power thus enhancing their incomes However
this opportunity of collective marketing was only found being exploited by only 35 of the
respondents while 83 reported middlemen coming for their produce from their homes
Furthermore if collective marketing was adopted access to postharvest handling technologies
would be much easier For instance in the case where farmers pushed 200-800 kg of produce on
bicycles (Figure 3) to the cleaning machines and back covering a total distance of 3-4 km the
machine would be positioned at the collecting center so that the farmer does not have to carry the
produce back after cleaning In this way the farmers would save their energy and time by carrying
once their produce instead of twice As already highlighted in Section 32 over 90 of the
respondents reported that winnowing with baskets and trays was time consuming tiresome and
associated with diseases due to dust Table 4 shows the time farmers take while cleaning their
produce using baskets and trays Working in groups would enable farmers access technology
through credit or hire purchase which individuals may not be in position to achieve Moreover by
the time this interview took place 65 of the farmers had taken loans of which 84 of these had
taken the loan in less than 12 months back In addition the loans taken were most especially used
for paying fees as shown in Figure 7 To secure loans 22 used their land as mortgage 327
were recommended by those who trusted them that would pay back 29 took salary loans and
y = 28813x
Rsup2 = 09953
0
20
40
60
80
100
120
140
160
000 010 020 030 040 050 060
Qu
an
tity
of
bea
ns
clea
ned
(k
g)
Time (h)
Quantity of beans cleaned line of fit
15
43 used their houses as mortgage Given that the respondents were purposively sampled based
on those who own land and were using it to grow maize beans and groundnuts this implies that
those do not have land or are marginalized have limited chance of securing loans since they cannot
get security for the loan like land recommender or salary This indicates that children of the
marginalized households drop out of school since their parents have limited chances of securing a
loan for school fees like the households who have land However this dependence on loan to take
children to school puts probably all households in a vulnerable position of not being able to
purchase a technology on individual basis Also storage space was found to be limited for 51 of
the respondents which can be addressed through bulk storage in groups
In respect to the cleaning machines that were positioned at the residences of host farmers those
who used the machines to clean their produce suggested modification on the machines in order for
them to be moved from household to household It should be noted that the seed cleaners that
where distributed had no wheels to be pulled like some of the threshing machines The machines
are also large in size to be carried by motorcycles which farmers depend on to carry threshing
machines that do not have wheels Amidst this challenge of machines being in one place farmers
are continuing carrying their produce to and fro to have it cleaned This shows the need or
necessity for improved technologies to handle the cleaning unit operation that has been lagging
when compared to drying threshing and storage operations It also shows the underlying
challenges farmers face during cleaning of their produce
This work has revealed gaps in the value chain of crop production that need attention by
innovators extension workers in areas of soil fertility management post-harvest handling social
to financial NGOs CBOs governments First about 91 of the respondents were found to have
more than 1 acre of land which to some extent agrees with the 61 of the respondents having more
than 5 bags of maize harvest Although the phrase ldquomore than 5 bagsrdquo was not defined to be
specific MAAIF (2018b) states that current average maize yield per acre to be between 089 MT
and 101 MT compared to the potential yield of 32 MTacre Considering the quantities of maize
farmers carried for cleaning to the cleaning machines none was in the range of 089-101 MT
Worse still 897 were below 5 bags which is contrary to the survey data Partly one would
probably argue that farmers carried a portion of their harvest to be cleaned However what is being
revealed in this finding is that use of questionnaire method to determine parameters at households
may not show exactly the situation on ground By availing a new technology (seed cleaning
machine) farmers probably brought out all they had harvested for cleaning The farmers who
carried 2 to 8 bags of maize for cleaning most probably was all they had which are far below the
current average yield range of 089-101 MTacre without considering the potential yield of 32
MTacre It is surprising that none of the respondents suggested low yields as one of the causes of
unreliable income Only 24 of the respondents reported that they had small pieces of land which
relates to small quantities of harvest This suggests that farmers know that the land sizes at their
disposal is sufficient but they probably do not know the yields expected from their land The
underlying main cause of less revenue failure to meet household expenses and postharvest loss as
the factors for unreliable income that farmers may not be aware of is probably low yields as
revealed in the presented analysis These low yields point to soil degradation impacts of climate
16
change poor agronomical practices limited or no extension services as well as limited resources
in terms of labour and capital to put in place what would be needed to increase yields Since 100
of the respondents were directly engaged in farming as their primary source of income the effects
of low yields directly affect attaining goals number 1 and 2 of no poverty and zero hunger
respectively of the Sustainable Development Goals (SDG) In addition low yields hinder the
quality of health and well-being quality of education economic growth as well as industry
development which are all part and parcel of the SDG For instance the effect of low yields on
the quality of education is depicted in Figure 5 where majority of the households depend on loans
to take children to school Therefore this calls for new innovative approaches from government
agencies and researchers when determining household parameters if the SDG are to be practically
fully attained
The other gap identified in this study is that the seed cleaner machines that were piloted among
farmers can only handle seeds in the range of 66-18 mm in size (maize beans and groundnuts)
However farmers in the developing countries grow rice soya beans and many other crops with
smaller seed sizes whose unit operation of cleaning has no improved technology to address it This
is an opportunity that can be tapped into
Table 4 Farmers yield percentages of maize and time taken during cleaning using trays and
baskets
Yield (100 kg
bags)
Before cleaning
()
After cleaning
()
Time taken (h)
lt2 55 90 lt3
2-3 45 95 3-4
3-4 60 55 4-5
4-5 75 131 gt5
gt5 764 618 gt5
17
Figure 7 Response by percentage for the use of loans secured by farmers
4 Conclusion Irrespective of the limited or no flexibility of the pedal operated seed cleaning machine in terms
of movement from one household to another farmers including both men and women carried their
produce to where the machines were stationed for cleaning and back This proved the necessity of
improved technologies for the cleaning unit operation Although farmers moved to use the
machines the study established that there is maximum distance beyond which a farmer with a
given quantity of produce to be cleaned cannot exceed to access a technology for use given that
farmers with quantities less than 200 kg were from within a radius of not more than 1 km from the
seed cleanersrsquo host farmers While on the other hand farmers with 200-800 kg were from within
a radius of 15 to 2 km Improved seed cleaning technology was found necessary since farmers
with 200-800 kg of produce for cleaning endured to push it on bicycles to and fro over a total
distance of 3-4 km to access and use the cleaner It is important that as efforts to improve
productivity with high yielding varieties continue attention should be put on developing and
availing technologies for the cleaning unit operation as well
Results from the use of the seed cleaner by farmers show that the seed cleaner is able to clean
over 500 kgh of maize and 250 kgh of beans which are about five times higher than what can be
achieved by the commonly used trays and baskets This partly meets user satisfaction and time to
market parameters important for any technology development to be acceptable
18
Less revenue from produce high household expenses postharvest loss time consuming drudgery
disease susceptibility and dependence on loans were the main challenges farmers are experiencing
However if these farmers took advantage of collective marketing of which over 90 were found
belonging to certain farmer groups they would have bargaining powers over their produce thus
enhancing their income and potential to secure technologies through credit or hire purchase like
the seed cleaner relieving them of drudgery time wastage postharvest losses and disease
susceptibility
During the face to face interviews using a questionnaire 764 of the farmers suggested that they
harvest more than 5 bags of maize However analysis of data collected during the piloting of the
seed cleaning machine show that 897 of those who carried their maize for cleaning were below
5 bags contrary to the survey results Although low yields were not reported as one of the
challenges during the survey what is has been revealed is that low yields is probably the
underlying cause of less revenue that results into failure to meet household expenses and school
fees In addition this implies that new innovative approaches of carrying out household baseline
surveys are needed if reliable demographic variable information to base on for planning is to be
attained
Acknowledgment
This is made possible with funding from the Government of the Republic of Uganda through
Makerere University Research and Innovations Fund
References
Abbiss R C Peiffer J J amp Laursen P B (2009) Optimal cadence selection during cycling
International SportMed Journal 10(1) 1ndash15
Amoah J Y Aggey M Addo D amp Abdulai I (2017) Development and Performance Evaluation of a
Mechanized two-ply Palm Nut Cracked Mixture Rotary Sieve Journal of Ghana Science Association
17(2) 47ndash51
Bellocq B Ruiz T Delaplace G Duri A amp Cuq B (2017) Screening ef fi ciency and rolling effects
of a rotating screen drum used to process wet soft agglomerates Journal of Food Engineering 195 235ndash
246 httpsdoiorg101016jjfoodeng201609023
Bradford KJ Dahal P Van Asbrouck J Kunusoth K Bello P Thompson J et al (2018) The
dry chain Reducing postharvest losses and improving food safety in humid climates Trends in
Food Science amp Technology 71 pp 84-93
Bullerman L B amp Bianchini A (2007) Stability of mycotoxins during food processing
International Journal of Food Microbiology 119(1) 140-146
FAO Food and Agriculture Organization (2003) The Implementation experience ndash Developing
country case studies httpwwwfaoorg3y4632ey4632e0xhtm
19
Hong S H amp Yu J H (2018) Identification of external variables for the Technology Acceptance
Model (TAM) in the assessment of BIM application for mobile devices MSampE 401(1) 012027
httpsdoi1010881757-899X4011012027
Khurmi R S amp Gupta J K (2005) A Textbook of Machine Design (1st ed) New Delhi India Eurasia
Publishing House (Pvt) ltd
Kumar D Kalita P (2017) Reducing postharvest losses during storage of grain crops to
strengthen food security in developing countries Foods 6 (1) p 8 103390foods6010008
Lee M D amp Lee P S (2020) Design and Development of Size Segregation Sieve Machine with
Centrifugal Action Universal Journal of Mechanical Engineering 8(4) 208ndash215
httpsdoiorg1013189ujme2020080406
MAAIF (2018a) Beans Training Manual for Extension workers in Uganda
httpswwwagriculturegougwp-contentuploads201909Beans-training-manual-for-
extension-workers-in-Ugandapdf
MAAIF (2018b) Maize Training Manual for Extension workers in Uganda
httpswwwagriculturegougwp-contentuploads201909Maize-training-manual-for-
extension-workers-in-Ugandapdf Mayanja I K Kigozi J Kawongolo J B amp Brumm T J (2018) Design Fabrication and Testing of
a Pedal Operated Maize Grain Cleaner Journal of Advances in Food Science amp Technology 5(3) 105ndash
111
Norris C Sullivan T Poirot J amp Soloway E (2003) No access no use no impact snapshot
surveys of educational technology in K x2013 12 Journal of research on technology in
education 36(1) 15-27 httpsdoiorg10108015391523200310782400 Olusegun J O Emeka O C Afolabi O A amp Alake A S (2018) Development of a motorized rice
de-stoning machine Agricultural Engineering International CIGR Journal 20(4) 202ndash209
OmotilewaJO Ricker-Gilbert J John Herbert Ainembabazi JH Shively EG (2018) Does
improved storage technology promote modern input use and food security Evidence from a
randomized trial in Uganda Journal of Development Economics 135 176ndash198
httpsdoiorg101016jjdeveco201807006
Porter C E amp Donthu N (2006) Using the technology acceptance model to explain how
attitudes determine Internet usage The role of perceived access barriers and
demographics Journal of business research 59(9) 999-1007
httpsdoi101016jjbusres200606003
Rivier M Colligman A Meot J Madoumier M Sebastian P (2018) ldquoModeling a process
combining a cereal dryer with a bioenergy unit for equipment design in developing countriesrdquo J
Food Process Eng Vol 41 pp e12836 httpsdoiorg101111jfpe12836
20
Sambasivan N Cutrell E Toyama K amp Nardi B (2010 April) Intermediated technology use
in developing communities In Proceedings of the SIGCHI Conference on Human Factors in
Computing Systems (pp 2583-2592) httpsdoiorg10114517533261753718
Sobowale S S Adebiyi J A amp Adebo O A (2015) Design Construction and Performance
Evaluation of a Melon Seeds Sheller Food Processing amp Technology 6(7) 463
httpsdoiorg1041722157-71101000463
Tefera T Kanampiu F De Groote H Hellin J Mugo S Kimenju S Beyene Y Boddupalli
PM Shiferaw B Banziger M (2011) The metal silo an effective grain storage technology for
reducing post-harvest insect and pathogen losses in maize while improving smallholder farmers
food security in developing countries Crop Prot 30 (2011) pp 240-245
Tibagonzeka J E Akumu G Kiyimba F Atukwase A Wambete J Bbemba J amp Muyonga
J H (2018) Post-harvest handling practices and losses for legumes and starchy staples in
Uganda Agricultural Sciences 9(1) 141-156 DOI 104236as201891011
UBOS (2017) National Population and Housing Census 2014 Area specific profiles- Kamuli
District April 2017
Yenge G B Kad V P amp Nalawade S M (2018) Physical Properties of Maize ( Zea mays L) Grain
Journal of Krishi Vigyan 7(Special Issue) 125ndash128 httpsdoiorg1059582349-44332018001733
21
Appendix A Traditional post-harvest cleaning technologies of seeds
22
Appendix B Production drawings
23
Appendix B Farmers using the Improved seed cleaning technology
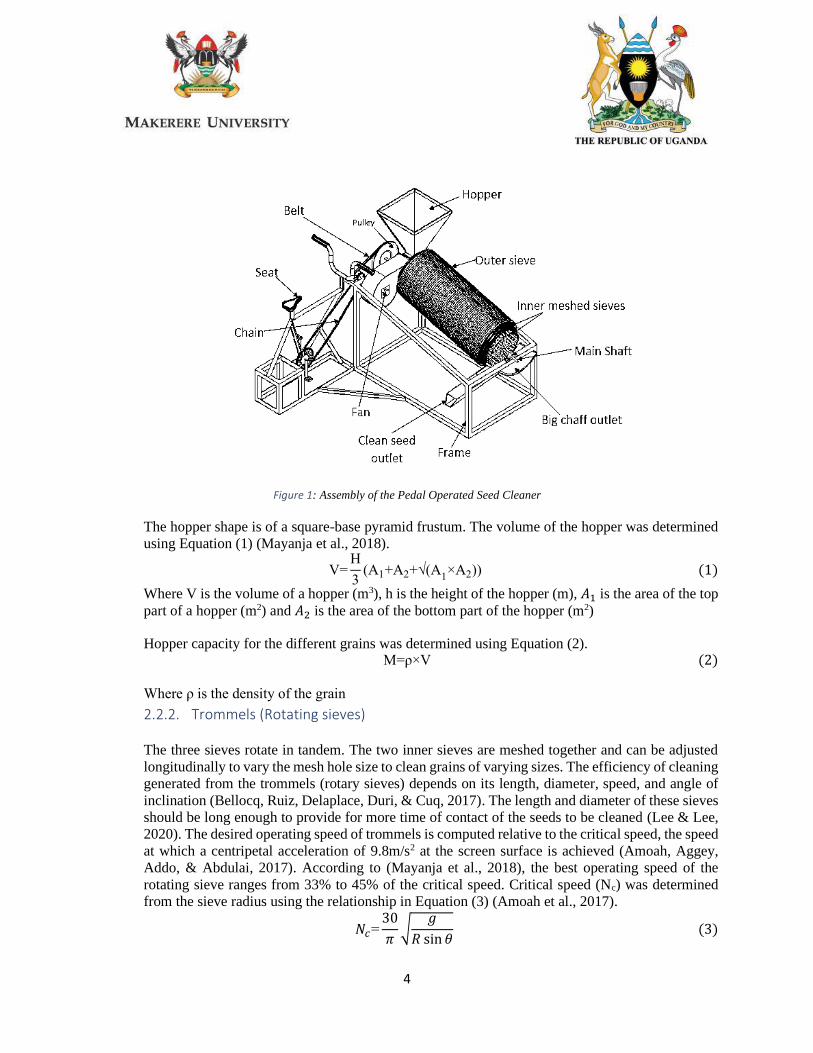
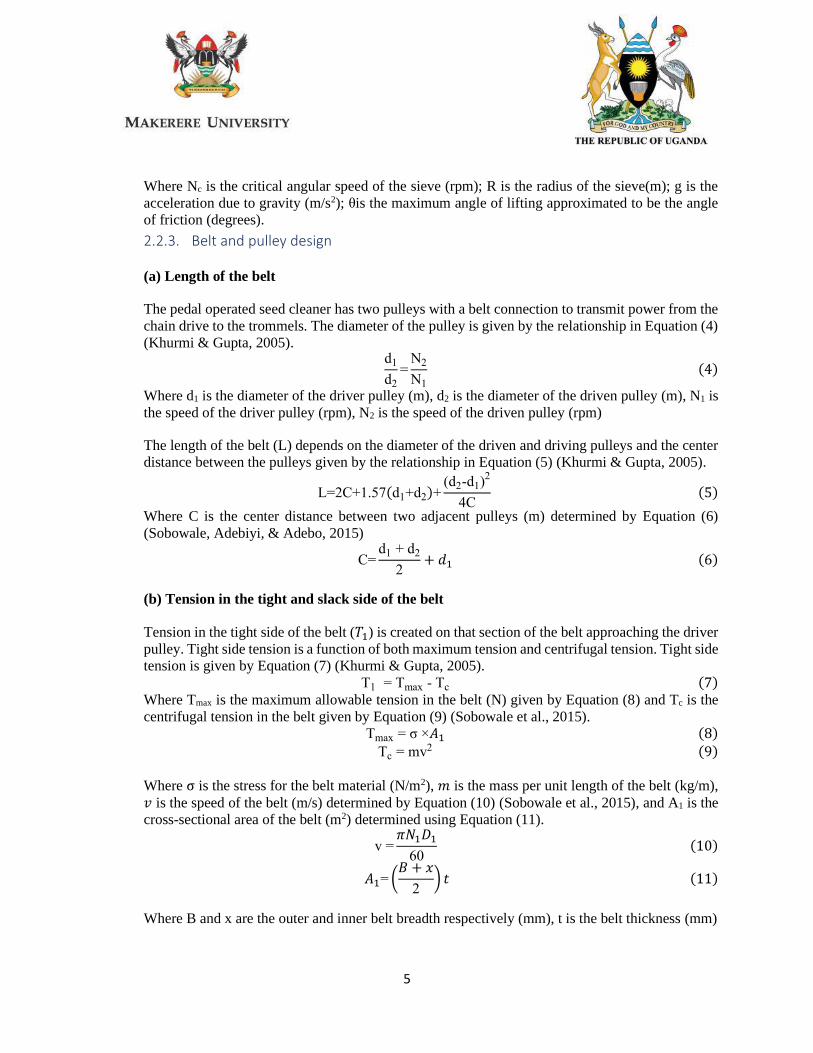
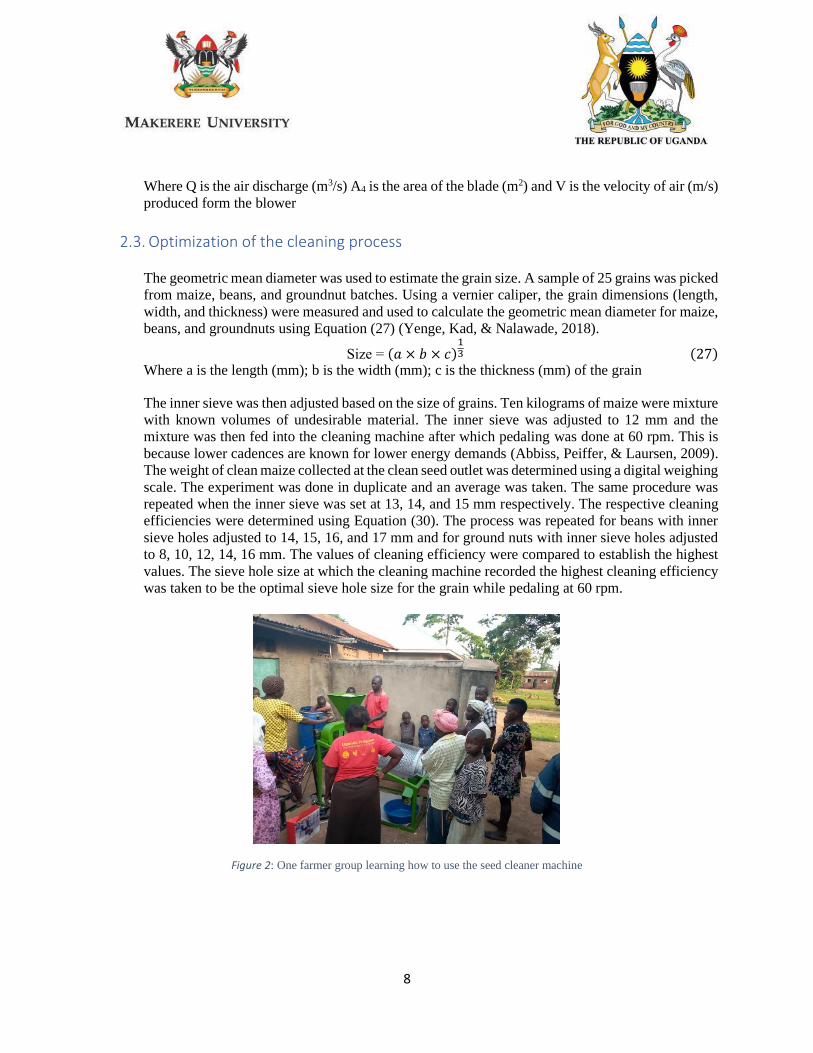
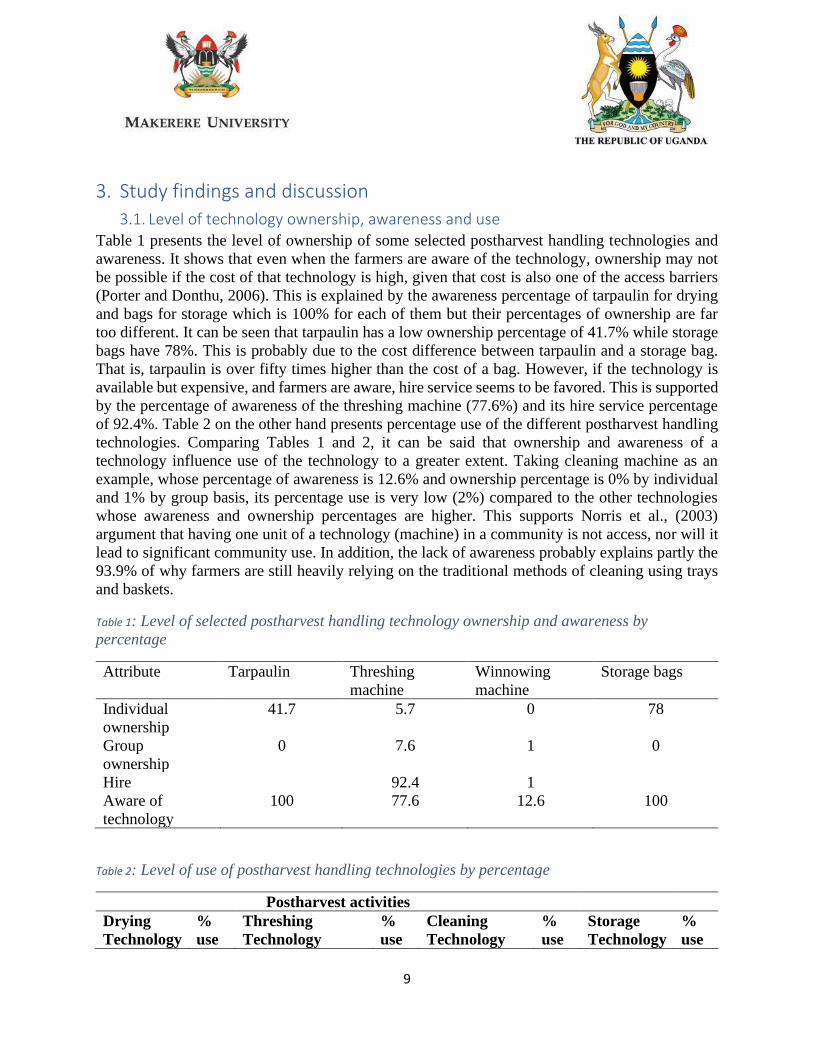
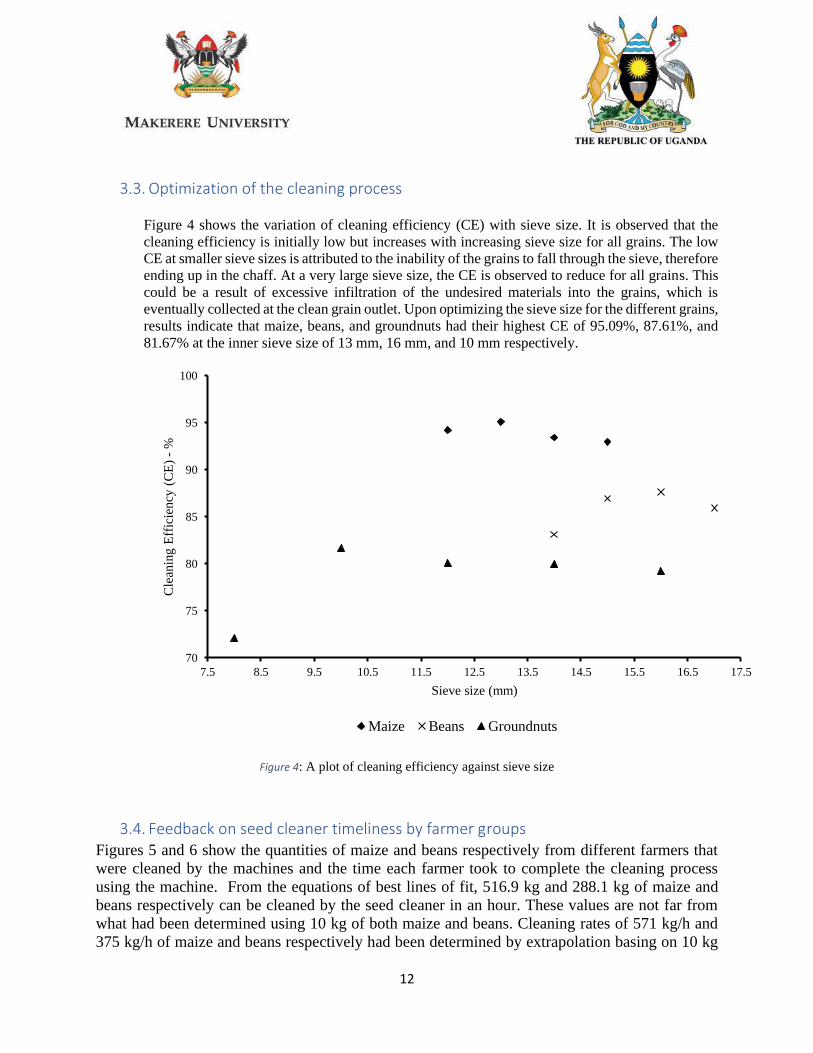
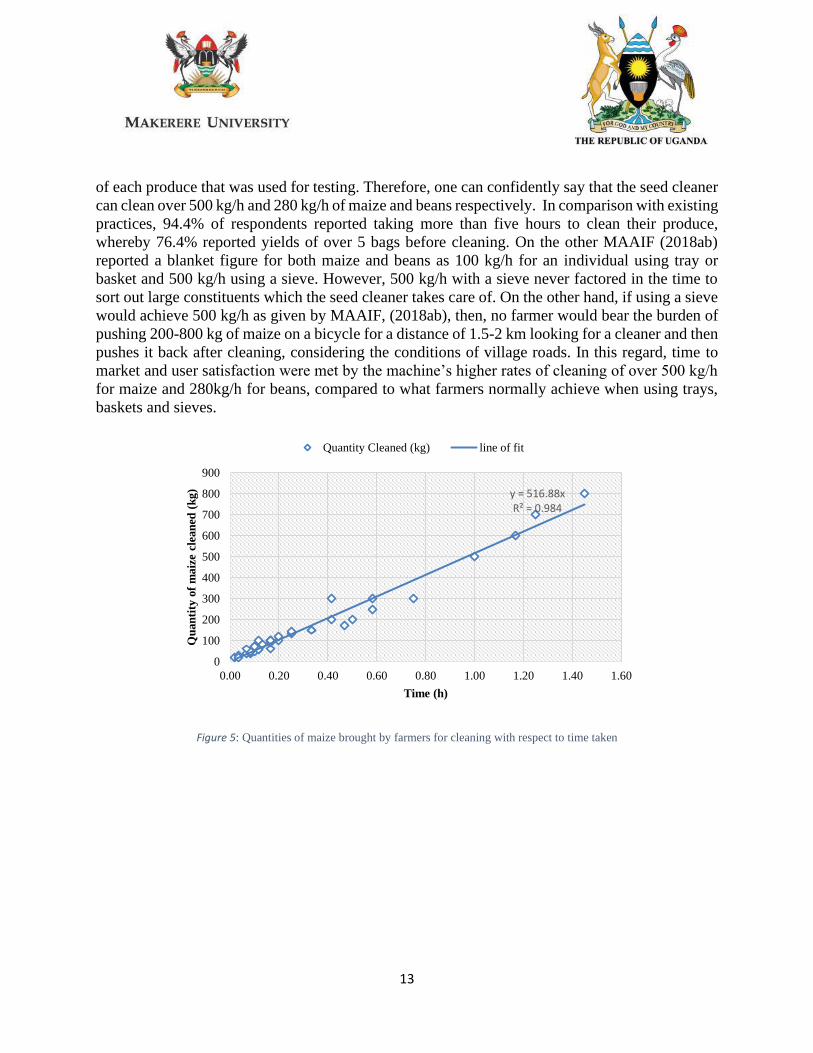
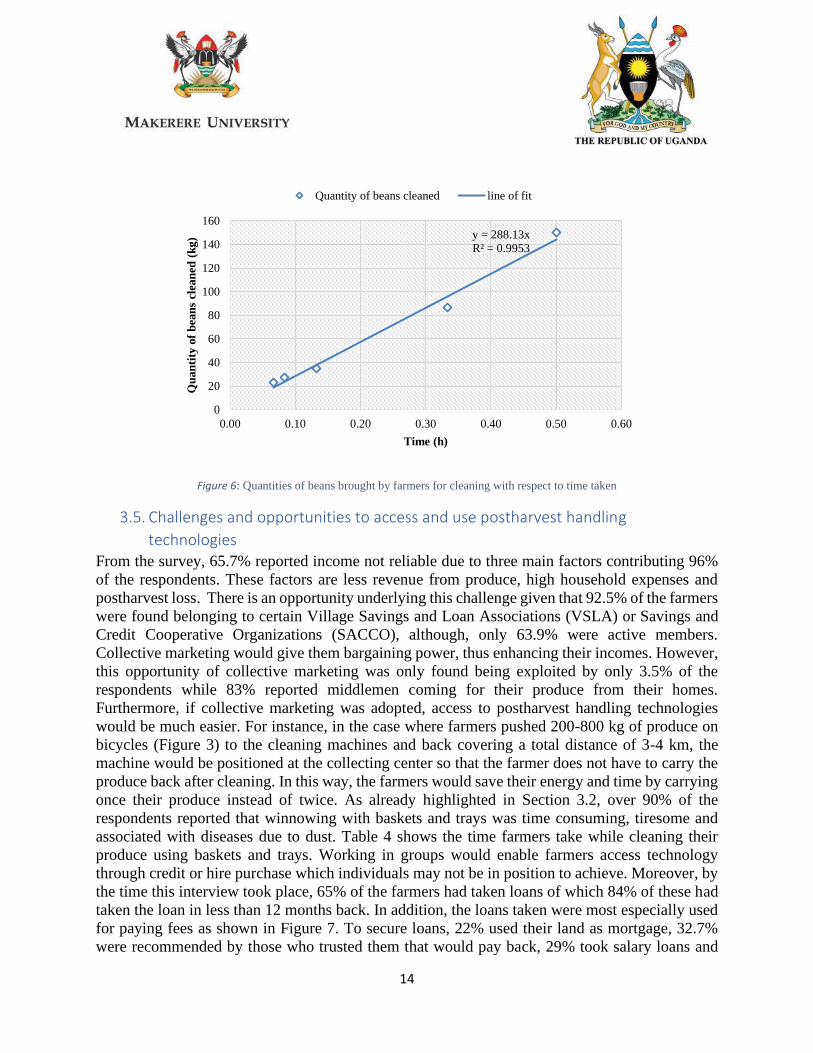
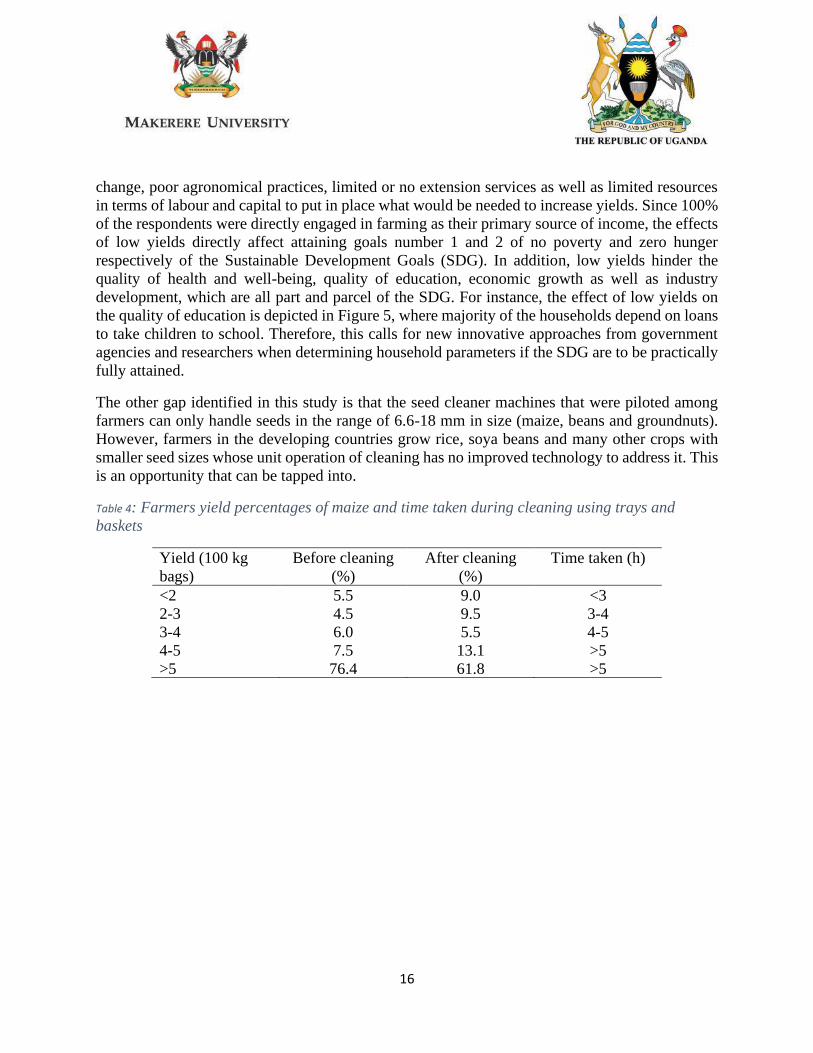
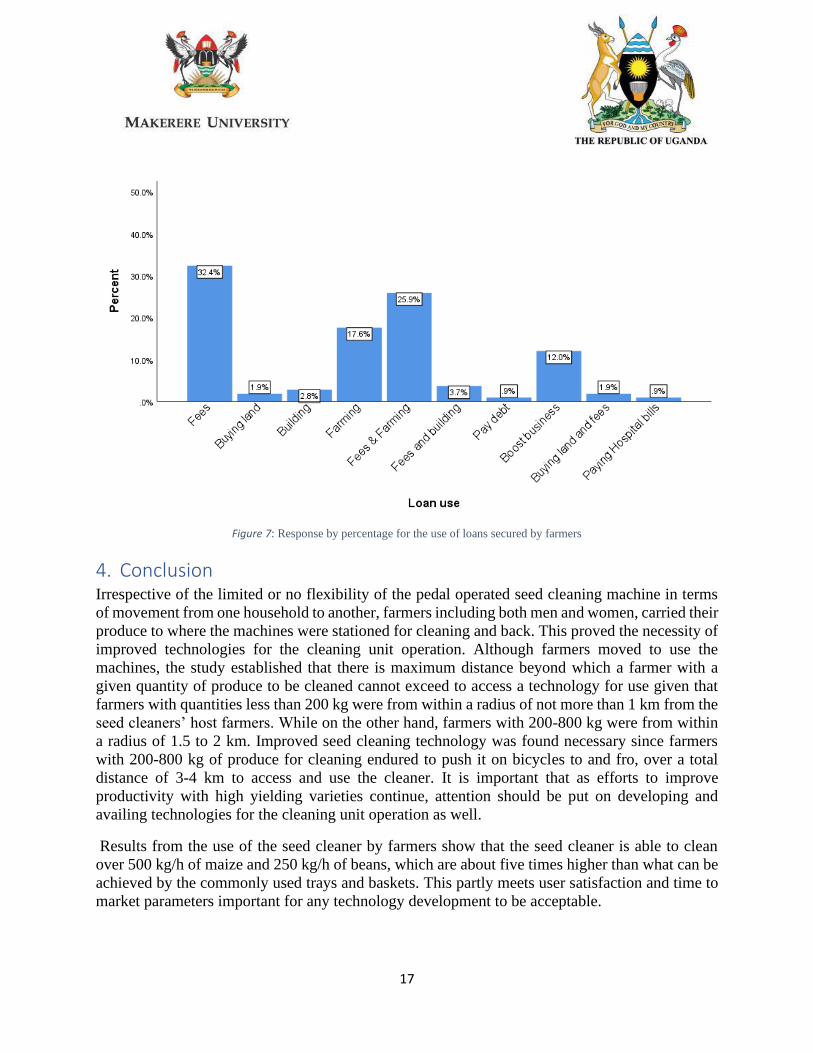
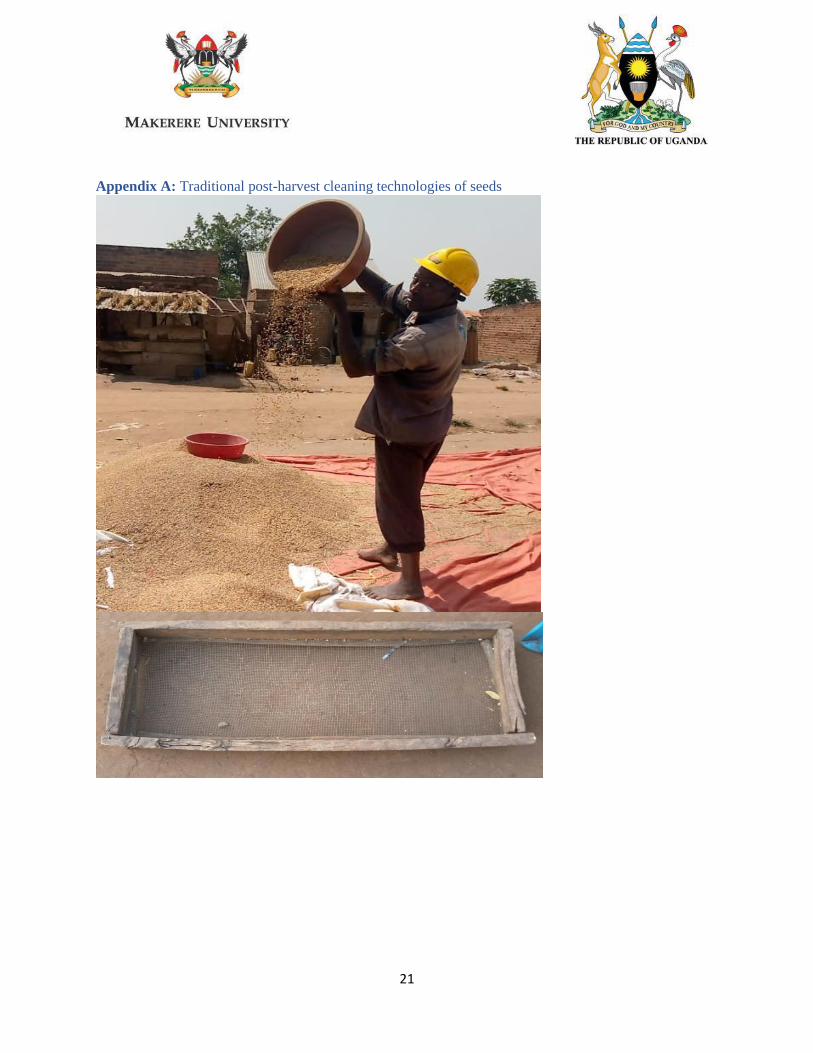
21
Appendix A Traditional post-harvest cleaning technologies of seeds
22
Appendix B Production drawings
23
Appendix B Farmers using the Improved seed cleaning technology
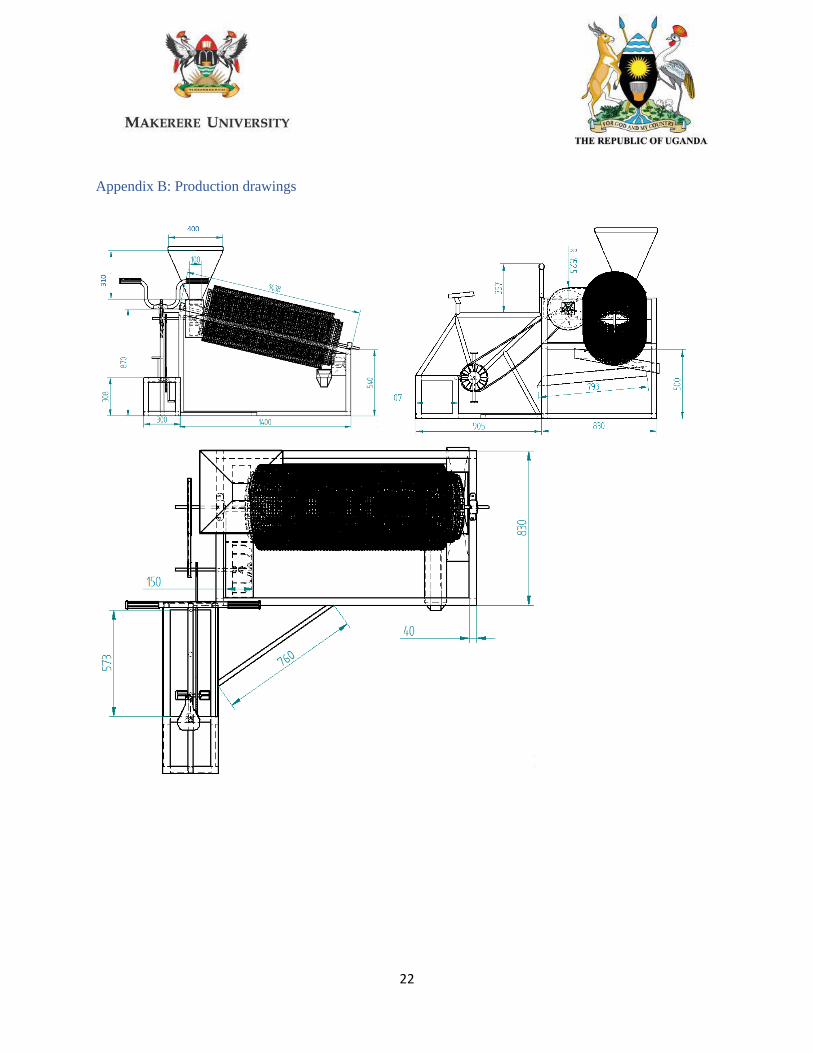
22
Appendix B Production drawings
23
Appendix B Farmers using the Improved seed cleaning technology
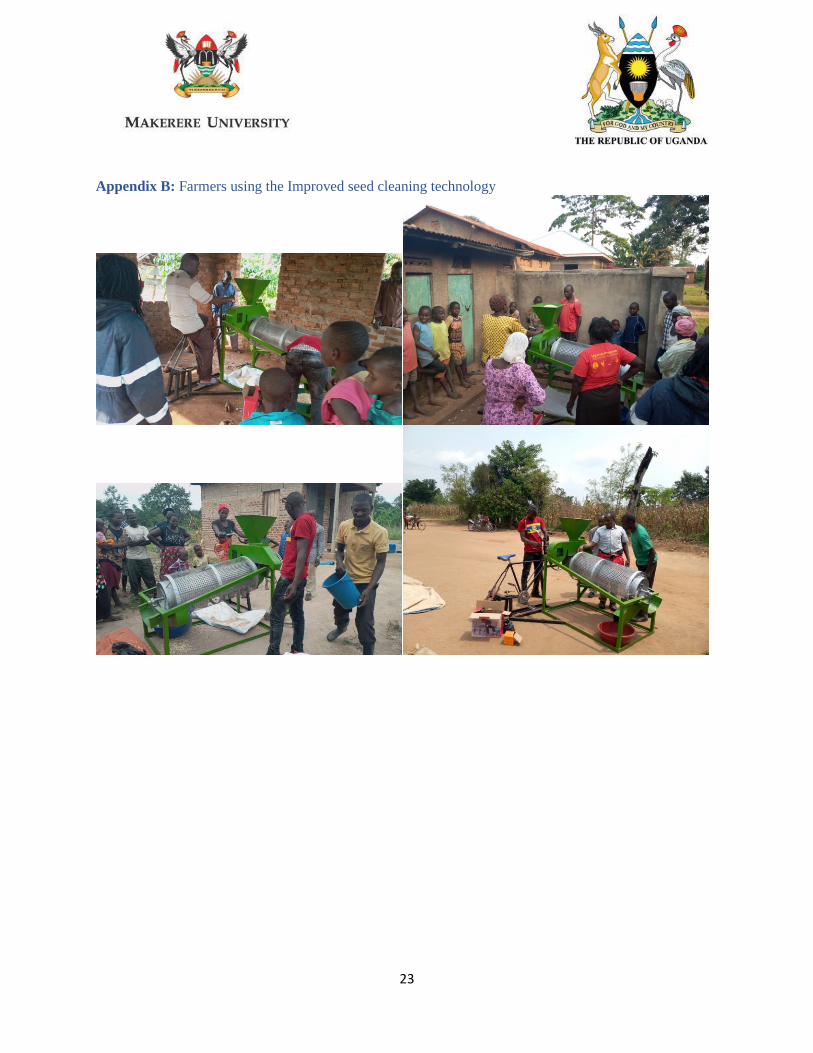
23
Appendix B Farmers using the Improved seed cleaning technology