project related to inflatable wing
49
1 INTRODUCTION 1.1 MOTIVATION OF WORK Exploration of Mars and Venus has a long-term goal of human space efforts. Attempts to explore Mars started in the early 60s with orbits by the USSR and US. In 1964, the US spacecraft Mariner 4 returned with 21 close-up photos of Mars, opening the door for other spacecrafts, orbiters, and landers being sent to Mars to investigate the surface and atmosphere of the planet. These missions led to the current rover missions and resulted in scientists obtaining the evidence of past liquid water on Mars. With this discovery, the question of “Is there life on Mars?” was raised. In order to answer this question, NASA is taking the approach to “Follow the Water”. Closely observing the surface of Mars, scientists can obtain clues on the history of water. Currently, two rover missions are in progress to examine a wide range of rocks on Mars. Although these rovers are making successful discoveries, NASA has additional plans to explore Mars in the near future. For instance, the Mars Reconnaissance Orbiter and Phoenix landers are two missions that will be launched in 2005 and 2007, respectively. In addition to these missions, using unmanned airplanes to observe Mars and Venus is considered to be a future exploration concept (illustrated in Figure 1.1).
-
Upload
bandaru-swetha -
Category
Documents
-
view
62 -
download
3
description
this wing is used in space uav aircrafts
Transcript of project related to inflatable wing
1
INTRODUCTION
1.1 MOTIVATION OF WORK
Exploration of Mars and Venus has a long-term goal of human
space efforts. Attempts to explore Mars started in the early 60s with
orbits by the USSR and US. In 1964, the US spacecraft Mariner 4
returned with 21 close-up photos of Mars, opening the door for other
spacecrafts, orbiters, and landers being sent to Mars to investigate the
surface and atmosphere of the planet. These missions led to the current
rover missions and resulted in scientists obtaining the evidence of past
liquid water on Mars. With this discovery, the question of “Is there life on
Mars?” was raised. In order to answer this question, NASA is taking the
approach to “Follow the Water”. Closely observing the surface of Mars,
scientists can obtain clues on the history of water.
Currently, two rover missions are in progress to examine a wide range of
rocks on Mars. Although these rovers are making successful discoveries,
NASA has additional plans to explore Mars in the near future. For
instance, the Mars Reconnaissance Orbiter and Phoenix landers are two
missions that will be launched in 2005 and 2007, respectively. In addition
to these missions, using unmanned airplanes to observe Mars and Venus
is considered to be a future exploration concept (illustrated in Figure 1.1).

2
Advantages of airplanes are that they can obtain closer images than
satellites and can observe larger territory than rovers. With this extensive
range of view, scientists are capable of observing places where rovers
could not reach and following interesting land features such as valleys
and dry riverbeds.
Fig: 1.1 Wing types in UAV
1.2 KEYPLAYERS OF DESIGN
Although flight is feasible, designing an airplane for Mars is
difficult due to the low density atmosphere and the cost of launch.
Motivation for this research work is to develop a low-density aircraft that
can be evaluated at high-earth altitude as a prototype Marscraft. Flight
conditions at high altitude on Earth are similar to flight conditions at sea-
level on Mars. Marscraft prototypes have been tested at high-earth
altitude in the recent past. At this altitude, design criteria of aircraft,
especially the wing design factor, become different from most general
aviation aircraft.

3
One of the important design factors of any wing is Reynolds number
(Re), which is dependent on speed and flight conditions. Re is
proportional to density, speed, and geometry of the wing, and inversely
proportional to viscosity. The density of Mars is extremely thin so that it
causes a major reduction of Re. Therefore, Marscraft must be designed
for low-Re flight, below 500,000 as illustrated in Figure 1.2. At low Re,
flow over the wing is uncertain leading to poor aerodynamic
performance.
1.3 UAV- THE CHOICE
Given the Reynolds number and operating velocity, it is quiet
convincing that for such low Reynolds number and hence a density, an
Unmanned Aerial Vehicle is the predominant choice.
Fig 1.2 Performance region of Marscraft
4
1.4 INFLATABLE WING
To address the challenge of low Reynolds number flight, designers
typically increase wing span. However, for a Marscraft, a larger wing
span leads to increased launch costs. Possible solutions are an aircraft
with folding or inflatable wings, provided wings can be designed for low-
Re performance. With these concepts, an aircraft does not require a large
volume in the spacecraft during its shipment to Mars. Once it reaches the
destination point, large inflatable wings would then deploy and enable
flight over the Martian terrain.
In addition to inflatable wing technology, rigidization of wings has been
developed recently. As with any composite layup, the material starts as
soft and flexible, but hardens as the resin cures. Here, the curing process
is initiated by exposure to Ultraviolet (UV) radiation upon deployment.
Thus combining this and inflatable wing technology, a flexible inflatable
wing becomes a solid rigid wing before flight on Mars.
Development of inflatable wing technologies started in the 1950s, and a
good example of inflatable aircraft was the Goodyear’s Inflatoplane.
Goodyear Aircraft Company (which is presently owned by Lockheed
Martin) designed and developed an airplane with inflatable material using
their technologies lighter-than-aircraft in 1956. The motivation of this
development was to use this aircraft as a military rescue plane, which
could be dropped behind the enemy lines to rescue downed pilots.

5
At first, the single seated inflatoplane, XAO-3 was developed, with
a total length of 19 ft 7 in. with a 22 ft wing span that could be inflated in
about 5 minutes using less pressure than a car tire. The plane was
powered by a two-cycle 40 horsepower Nelson engine and held 20
gallons of fuel. The maximum weight of plane was 240 lb and its flight
range was 390 miles with an endurance of 6.5 hours. The two-seated
inflatoplane, XAO-2(GA-466 ), was also developed, however, it had 19 ft
2 in. total length and 28 ft wing span with 60 horsepower McCulloch
4318 engine. It held 18 gallons of fuel and had the gross weight of 740 lb.
Airplane inflation took about 6 minutes. It flight range was 275 miles
with an endurance of 5.4 hours.
A NASA Dryden project tested on inflatable wing at low altitude (800 -
1,000 feet) (Figure 1.3). The skeleton of the wing was made of inflatable
tubes, and crushable foam was used to maintain the shape of wing. After
the aircraft was released, the five-foot span inflatable wing was deployed
quickly, on the order of a third of a second, and completed a successful
flight.
To maintain strength in the wing, high pressurization was required using
Nitrogen gas. ILC Dover Inc. who manufactured the inflatable/rigidizable
wing for the BIG BLUE Project has been researching and developing
inflatable wing technology since the 1970s. Their first inflatable wing
technology was used in the Apteron, an unmanned aerial vehicle which
had a 5.1 feet wingspan, a 0.5 hp engine and a 7 lbs gross weight. They
also used this inflatable wing technology for the tail-fin of a lighter-than-
aircraft and also for the fin of missiles for stabilization purpose.

6
Fig 1.3 A NASA Dryden project tested on inflatable wing at low altitude
(800 -1,000 feet)
During development of inflatable wing, several different
techniques were attempted, including a method that used various sizes of
inflatable tubes as skeleton of the wing and covered with skin and
sometimes with foam to maintain the smooth airfoil shape.
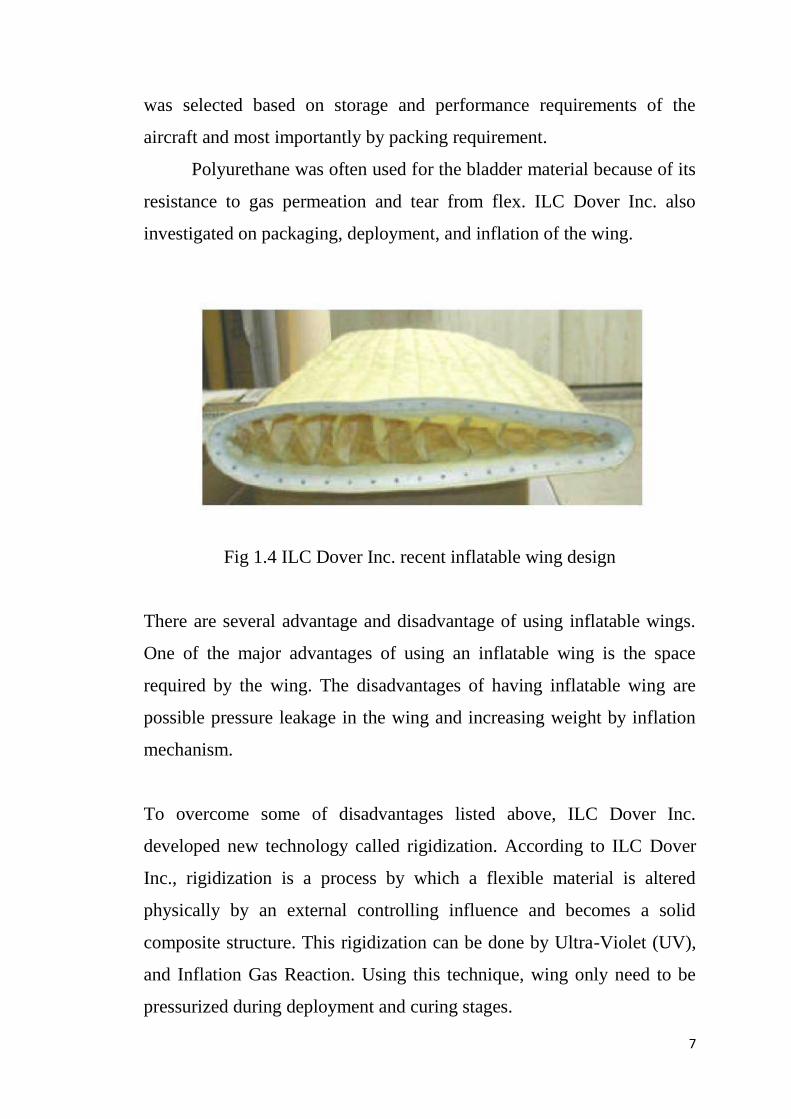
Their recent inflatable wing design 1.4 was constructed using a bladder
that holds pressure and a structure restraint which maintain the wing
shape under inflation and aerodynamic loading. Due to this bladder and
restraint, the wing had rough and bumpy shape (Figure 3.8); however,
skinning wing was an option. The wing stiffness was depending on
internal pressure and the material properties of restraint. Therefore, the
high modulus fibers such as PBO, Vectran and Kevlar, etc. became the
choices for the wing restraint. Out of several choices, the restraint fiber
7
was selected based on storage and performance requirements of the
aircraft and most importantly by packing requirement.
Polyurethane was often used for the bladder material because of its
resistance to gas permeation and tear from flex. ILC Dover Inc. also
investigated on packaging, deployment, and inflation of the wing.
Fig 1.4 ILC Dover Inc. recent inflatable wing design
There are several advantage and disadvantage of using inflatable wings.
One of the major advantages of using an inflatable wing is the space
required by the wing. The disadvantages of having inflatable wing are
possible pressure leakage in the wing and increasing weight by inflation
mechanism.
To overcome some of disadvantages listed above, ILC Dover Inc.
developed new technology called rigidization. According to ILC Dover
Inc., rigidization is a process by which a flexible material is altered
physically by an external controlling influence and becomes a solid
composite structure. This rigidization can be done by Ultra-Violet (UV),
and Inflation Gas Reaction. Using this technique, wing only need to be
pressurized during deployment and curing stages.

8
The inflatable wing with this rigidization technique is suitable for
the Marscraft by packaging and mechanism standpoints. The major
advantage of this rigidizable wing is that the wing will not require
pressurization during the entire flight, and reducing the weight of the
inflation system and the risk of leakage. Mars exploration vehicles have
constraints on volume and weight due to the launch and flight to Mars
and also require the system to endure a long travel time.
Inflatable/rigidizable wings address many of the challenges involved in
developing Mars aircraft.
9
OBJECTIVES AND OVERVIEW
2.1 OBJECTIVES
The objectives of this project are to design an inflatable/rigidizable
wing that can perform at high altitude conditions and analyse the stresses
acting on the material while internal pressures are acting and when they
are subjected to aerodynamic loading.
The inflatable wing is constructed of woven composite fabric following
the design of their inflatable wing, but impregnated with UV-curable
resin that will rigidize once exposed to UV light. Initial design of the
wing was done by a choosing base airfoil profile for the inflatable wing
with its aerodynamic performance in the Re range of interest, 50,000 to
500,000.
The selection of the airfoil was based on numerical analysis and
manufacturing considerations. Once the profile of the inflatable wing was
obtained, stress analyses were conducted to determine the type and
thickness of composite layers of the initial design of the inflatable wing
under a steady, level flight condition. In addition, static load analyses
were also conducted using the same model. For the final design, wing
stress analyses were conducted to optimize the root strength and weight
of the wing with the number of composite layers varying from the root to
tip of the wing.
10
2.2 OVERVIEW OF THE PROJECT
This project presents the design and static stress analysis process of
the inflatable/rigidizable wing. Chapter 3 provides the background that
includes the flight condition of high altitude gliders and Marscrafts, the
flow behaviours at low Re region and their difficulty in wing design.
After the background information of the glider, the process of the airfoil
selection of inflatable/rigidizable wing is presented in Chapter 4. In this
chapter, aerodynamic analysis of five candidate airfoils and the final
profile of the wing are discussed.
Using the final profile, finite element analyses of the wing were
conducted to determine the type and thickness of composite layers, and
results of these analyses are presented in Chapter 5. Chapter 6
summarises the results of analyses and testing and presents possible
future analyses and improvements on the inflatable/rigidizable wings.

11
DESIGN PARAMETERS
The major wing design parameters, flight conditions and flow
behaviour at low Reynolds number and their implications on the wing
design are discussed in detail in this chapter.
3.1 Flight Conditions
3.1.1 High Altitude Conditions on Earth
Flight conditions for the glider are those above the earth-altitude of 30
km. Figure 3.1 presents the variation of density, pressure, and
temperature with altitude, respectively. Density and pressure drop
exponentially with altitude; both density and pressure at 30 km (98, 425.2
feet) are approximately 1% of sea level values. Temperature drops
linearly in the troposphere, and then stabilizes in the stratosphere where
the glider will be released. The speed of sound is a function of
temperature, making it vary as well (Figure 3.1(d)).
𝑎 = 𝛾𝑅𝑇
Where a is speed of sound, ɣ is ratio of constant pressure and volume (for
air at standard conditions, is 1.4), R is the gas constant per unit mass (for
air at standard conditions in SI, R is 287 J/ (kg·K)), and T is temperature.
At the altitude of 30 km, absolute pressure, density, viscosity, and
temperature are 1185.5 Pa, 1.7861x10⁻²
kg/m3, 1.475x10⁻⁵
kg/ (m · s)
and 231.24 K, respectively. The speed of sound at this altitude is 304.82
m/s.

12
Fig 3.1 Variation of density, pressure, and temperature with altitude
13
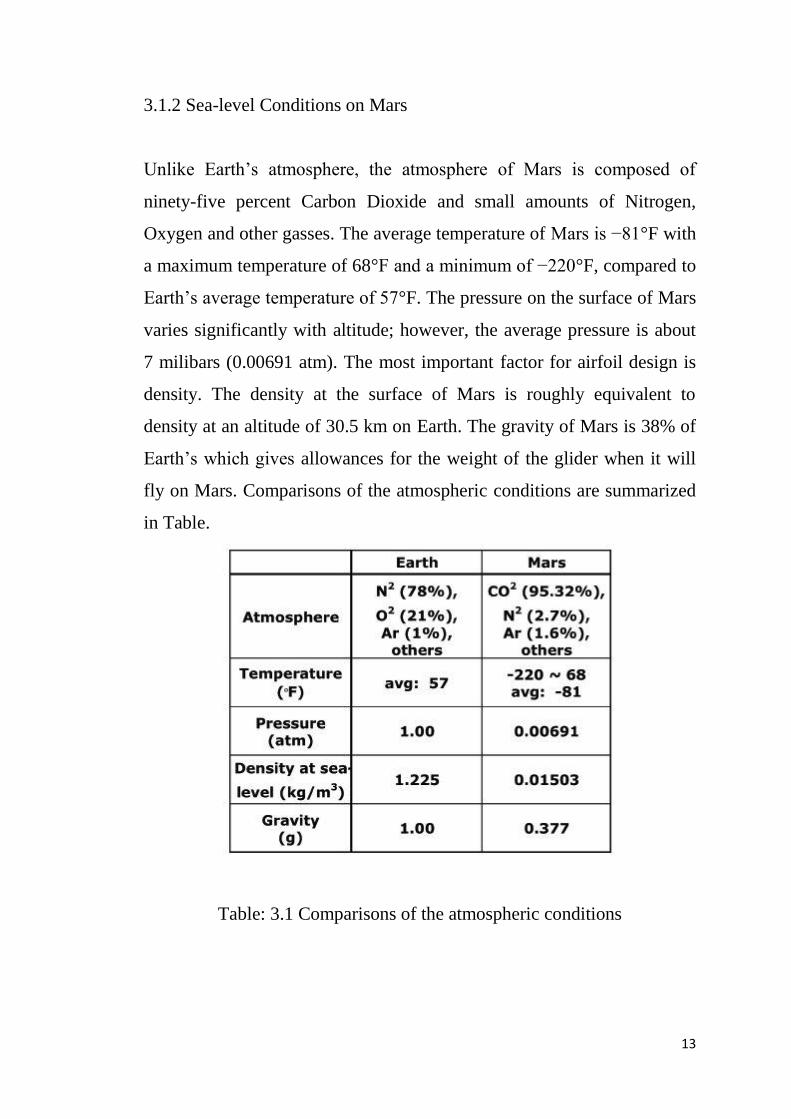
3.1.2 Sea-level Conditions on Mars
Unlike Earth’s atmosphere, the atmosphere of Mars is composed of
ninety-five percent Carbon Dioxide and small amounts of Nitrogen,
Oxygen and other gasses. The average temperature of Mars is −81°F with
a maximum temperature of 68°F and a minimum of −220°F, compared to
Earth’s average temperature of 57°F. The pressure on the surface of Mars
varies significantly with altitude; however, the average pressure is about
7 milibars (0.00691 atm). The most important factor for airfoil design is
density. The density at the surface of Mars is roughly equivalent to
density at an altitude of 30.5 km on Earth. The gravity of Mars is 38% of
Earth’s which gives allowances for the weight of the glider when it will
fly on Mars. Comparisons of the atmospheric conditions are summarized
in Table.
Table: 3.1 Comparisons of the atmospheric conditions
14
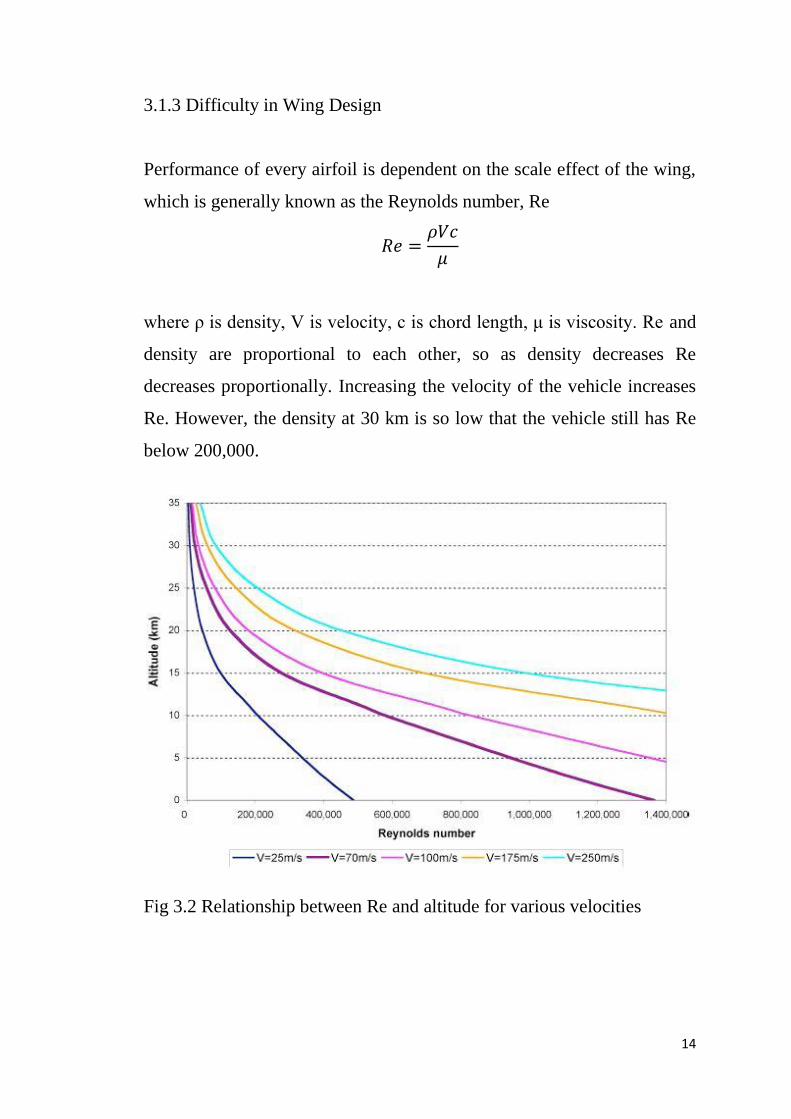
3.1.3 Difficulty in Wing Design
Performance of every airfoil is dependent on the scale effect of the wing,
which is generally known as the Reynolds number, Re
𝑅𝑒 =𝜌𝑉𝑐
𝜇
where ρ is density, V is velocity, c is chord length, μ is viscosity. Re and
density are proportional to each other, so as density decreases Re
decreases proportionally. Increasing the velocity of the vehicle increases
Re. However, the density at 30 km is so low that the vehicle still has Re
below 200,000.
Fig 3.2 Relationship between Re and altitude for various velocities

15
Figure 3.2 illustrates the relationship between Re and altitude for various
velocities: 25 m/s, 75 m/s, 100 m/s, 175 m/s, and 250 m/s. In this region,
flow over the wing is hard to predict due to laminar separation. Causes
and effects of laminar separation are discussed in the next section. In
addition to low Re effects, the glider also experiences a relatively high
Mach number, M.
The equation for Mach number is
𝑀 =𝑉
𝑎
Figure 3.3 shows the change in Mach number as the altitude increases.
Depending on the gliding velocity, the glider will encounter a Mach
number range of 0.07 to 0.82; Mach numbers between 0.4 and 0.6 are
considered as high subsonic.
Fig 3.3 Change in Mach number vs Altitude

16
Behaviour of the flow in the regions of low Re and high subsonic
Mach number is not well known, thus flow prediction over a designed
wing will be difficult and requiring testing. Other important factors in
wing design are lift, drag, and moment coefficients (Cl, Cd, and Cm,
respectively).
They are defined as follows:
where L is lift, D is drag, M is moment and S is surface area of the wing.
Steady flight depends on equilibrium of the vehicle weight and lift.
Looking at the lift coefficient, the relation between lift to density is
inversely proportional. At lower densities, the wing will require an
increase in Cl to maintain steady flight. Thus, decreasing weight,
increasing velocity, or increasing wing area will be required. Therefore,
one of the solutions for low Re aircrafts is to have a large surface area
wing.

17
3.2 Flow Behaviour at Low Re
3.2.1 Smooth versus Rough Airfoil
As mentioned in previous sections, the major challenge in
designing a wing for high altitude is consideration of low-Re flow
behaviour. In general at lower Reynolds numbers viscous effects are
relatively large, causing high drag and limiting maximum lift. Figure 2.7
[17] by McMasters and Henderson illustrates typical variation in L/Dmax
as a function of Re of various airfoils versus Re for smooth and rough
airfoils. Note that the performance of smooth airfoils drops dramatically
for Re < 105 and becomes less than that of rough airfoils.
This critical Re is parting the two major airfoil shapes from each other.
They are the insect (Re less than 104) and the general aviation airfoil
profiles (Re larger than 106). Insects, such as dragonflies, do not have a
smooth wing surface; instead, rough wing surface helps to delay flow
separation. The dragonflies in Re 5,000 have extremely small L/Dmax of
approximately 5. However, birds, like pigeon which is in around Re
50,000 and has approximately 15 L/Dmax, have very smooth sections. As
the Re decreases, roughness becomes a significantly important factor to
airfoil design. This is due to separation of the flow.
Normally, flow over the smooth airfoil is laminar; however, as Re
increases, the flow over the airfoil becomes turbulent. Separation is
frequently seen in laminar flow over smooth airfoils. For rough airfoils,
the flow is tripped by the rough surface and becomes turbulent. Thus,
performance of the airfoil does not change dramatically over the Re range
in question. The following subsections explain the causes and effects of
laminar separation in detail.
18
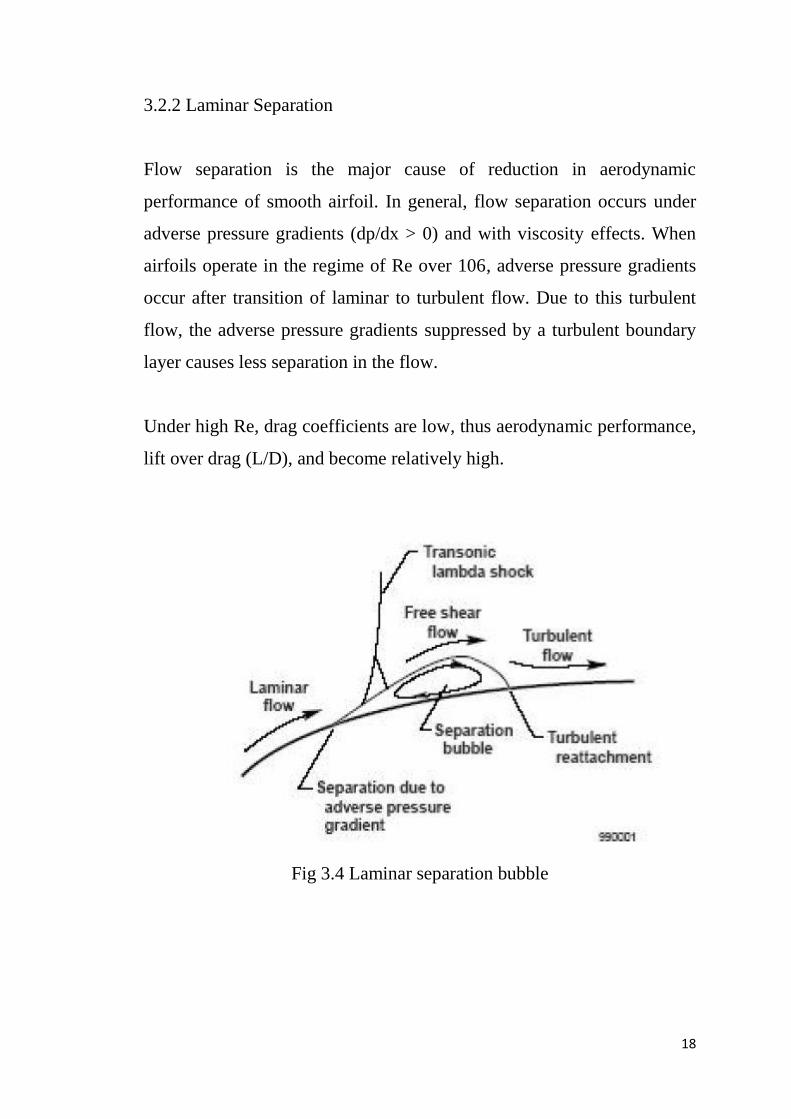
3.2.2 Laminar Separation
Flow separation is the major cause of reduction in aerodynamic
performance of smooth airfoil. In general, flow separation occurs under
adverse pressure gradients (dp/dx > 0) and with viscosity effects. When
airfoils operate in the regime of Re over 106, adverse pressure gradients
occur after transition of laminar to turbulent flow. Due to this turbulent
flow, the adverse pressure gradients suppressed by a turbulent boundary
layer causes less separation in the flow.
Under high Re, drag coefficients are low, thus aerodynamic performance,
lift over drag (L/D), and become relatively high.
Fig 3.4 Laminar separation bubble

19
However, in a lower Re regime (below 50,000), the adverse pressure
gradients occur while flow is still laminar, producing laminar separation
over the trailing end of the airfoil that continues into the wake. As a result
of this laminar separation, the airfoil observes a low lift coefficient and
high drag. After the laminar boundary layer separates, the separated layer
changes to the turbulent flow by influence of separated shear layer
transition. This turbulent flow reattaches the separated flow to the surface
as a turbulent boundary layer, which causes a laminar separation bubble
to form (illustrated in Figure 3.4)
This phenomenon was evaluated by Carmichael that obtained the
relationship between the distances of separation to reattachment to a
bubble length Re. Any airfoil, which does not reach the critical Re of
about 70,000, is too short to create reattachment conditions. For flow
above this critical Re, reattachment occurs and a laminar separation
bubble is then generated.
Fig 3.5 Variation of L/D vs Re
20
The length of a laminar separation bubble has a huge effect on the
airfoil performance. The length of this bubble is also related to Re and
angles of attack, because it is dependent upon the airfoil shape and chord.
Hence, Lissaman and other engineers looked at bubble proportions in
terms of Re and angles of attack. At lower Re, a long bubble is generated
over 20 to 30% of the airfoil length, causing major changes in pressure
distribution.
On the other hand, the short bubble that forms at higher Re has the size of
a few percent of the airfoil chord. Since it is so small, it does not affect
the performance of airfoil. However, the short bubble can burst to
produce a long bubble as a result of larger pressure recovery for
reattachment at greater angles of attacks, and this behaviour is called
stall.
The above characteristics make this flow regime extremely difficult to
model. Therefore, the elimination of laminar separation becomes very
important. One way to eliminate laminar separation is to produce
turbulent flow before adverse pressure gradients occurs. Carmichael
discussed the transition-promoting devices, called turbulator, whose
usages are 1) simple mechanical roughness elements includes: serrations,
strips, bumps, or ridges on the airfoil leading edge, 2) transpiration
methods: air-jets emitting from surface of airfoil, 3) transition caused by
exciting sound waves, or 4) mechanical vibration of the wing. Transition
in the flow can be also hastened by increasing the free-stream turbulence
intensity (FSTI). However, excess design of the turbulator can also cause
the boundary layer to become unnecessarily thick and creates more drag.

21
WING DESIGN
4.1 AIRFOIL SELECTION
A first step to designing the wing began with choosing an airfoil.
The flight condition for the glider is extremely low Re condition. Because
of lower speed of sound and high velocity descent, the glider will be
experiencing high subsonic flight conditions. The airfoil selection for the
glider becomes critical under these flight conditions.
From the airfoil coordinate database at the University of Illinois at
Urbana-Champaign (UIUC), five low Re profiles were selected across a
range of geometric parameters. They were DAE11, DAE31, E387, E398
and S7012, all shown in figure. DAE11 and DAE31 are Drela airfoils,
which are designed for low Reynolds number performance. E387 and
E398 are both Eppler airfoils. E387 is low Re airfoil and E398 is human
powered aircraft airfoil. S7012 is Selig low Re airfoil.
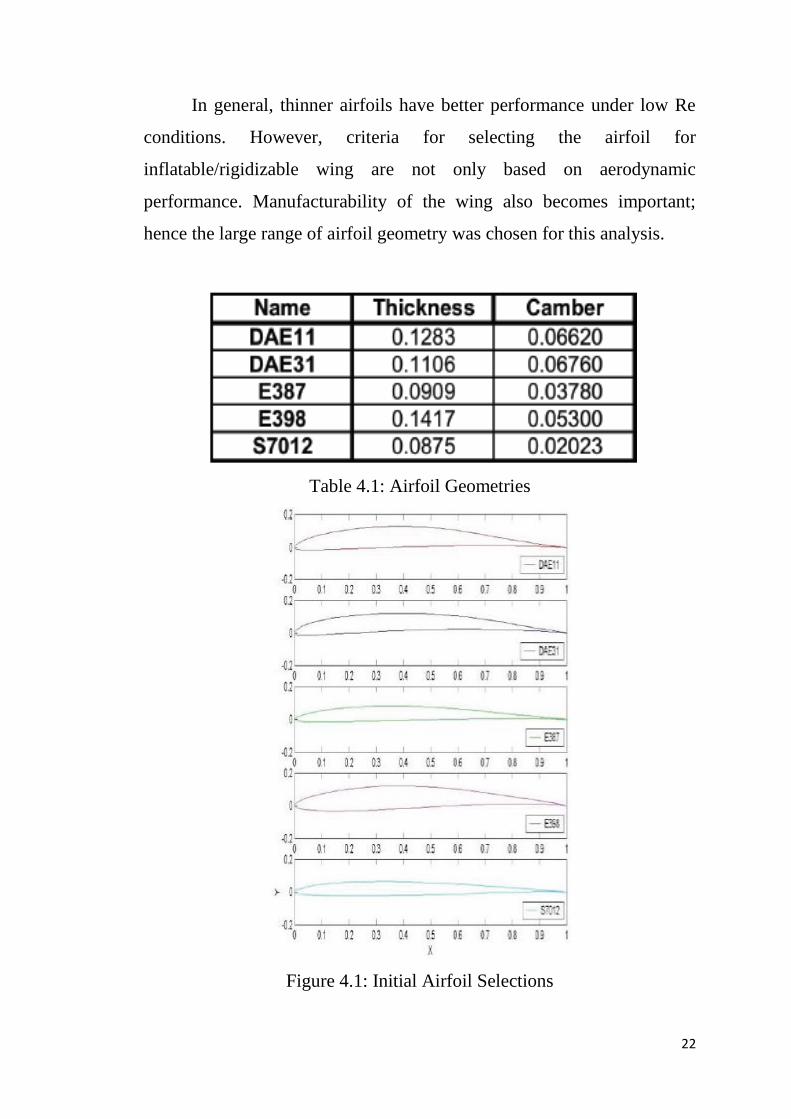
All the basic geometries, such as thickness and chamber of airfoils, are
shown in table. The values of thickness and chamber were based on unit
chord length. The range of thickness in these five airfoils was from
0.0875 to 0.1417 and chamber was from 0.02023 to 0.06760.
22
In general, thinner airfoils have better performance under low Re
conditions. However, criteria for selecting the airfoil for
inflatable/rigidizable wing are not only based on aerodynamic
performance. Manufacturability of the wing also becomes important;
hence the large range of airfoil geometry was chosen for this analysis.
Table 4.1: Airfoil Geometries
Figure 4.1: Initial Airfoil Selections

23
4.2 AERODYNAMIC CALCULATION
4.2.1 XFOIL ANALYSES
These profiles were then analyzed using XFoil. XFoil is
aerodynamic software written by Mark Drela. The software can be used
for subsonic isolated airfoils under viscous and inviscid conditions.
Airfoil modifications such as increasing thickness, leading edge radius,
and adding flap are possible in the software.
Using this software, the aerodynamic performance of each airfoil was
obtained under various Re and angles of attacks (AoA). The Re range
were chosen based on the estimated altitude, which the glider will be
flying. However, the flight altitude of the glider was uncertain at this
point of work, and also without chord length, the exact Re range for the
glider was not available.
Five airfoils were analyzed under Re of 60,000, 120,000, 250,000, and
500,000 with AoA of -6° to 12° with increment of 2. However, a few
cases were impossible to obtain data for due to no convergence of the
solutions. The causes of these no convergence were different in each
cases, with some caused by extremely low Re and others from low AoA.
The acquired results of lift coefficient versus AoA, lift coefficient versus
drag coefficient, and lift over drag versus AoA were plotted using
Matlab.

24
The results are shown in figures below. Re 60,000, 120,000,
250,000 and 500,000 are shown in red, blue, green and pink, respectively.
From lift coefficient versus AoA, the stall angles of DAE11, E398 and
S7012 were seen clearly. Also, the parabolic relationship between lift and
drag coefficient was viewed from E387 and S7012 plots. Airfoil
performance under a specific Re was obtained by observing L/D plots.
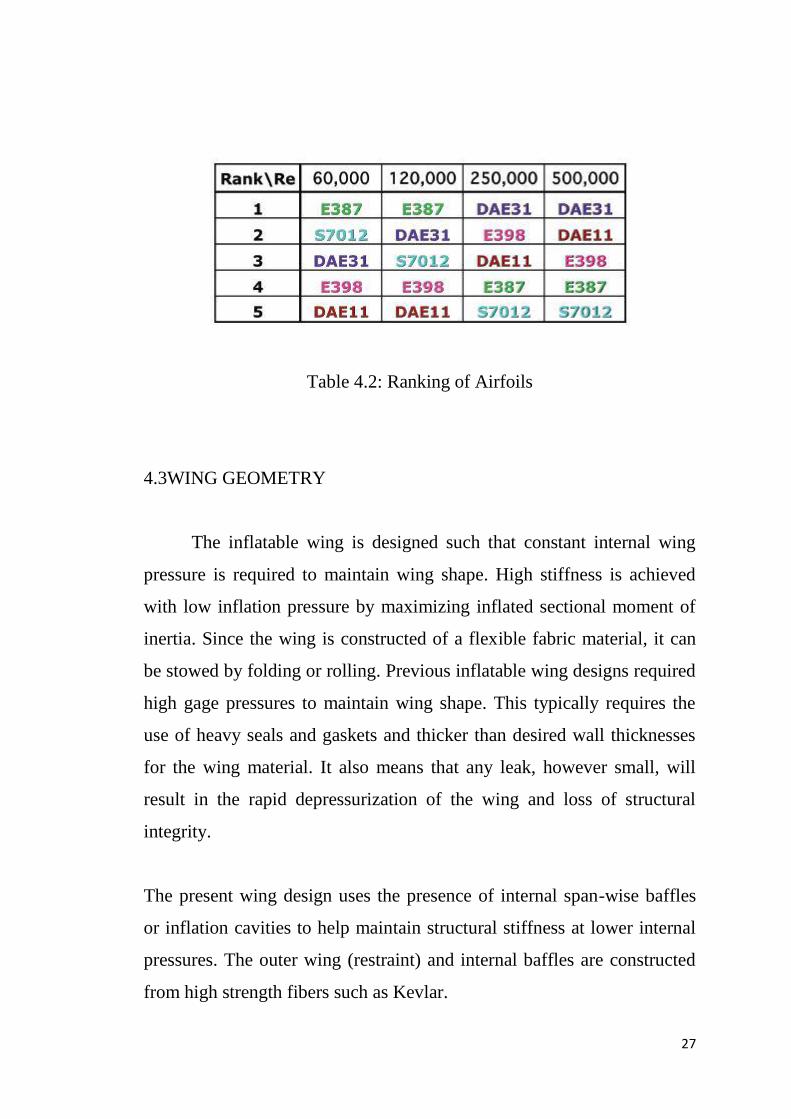
Ranking of airfoils were obtained under each Re and the results are
illustrated in the table. Since the flight conditions of the wing was
assumed to be extremely low Re, results from Re 60,000 were examined
carefully. At a Re of 60,000, both thin airfoils, E387 and S7012, have
better aerodynamic performance than the others. As Re increased, the
airfoils with large chamber, DAE11 and DAE31, began to perform better.
Most airfoils are designed in a certain point of Re; once they are out of
that Re, the performance of the airfoils will drop. Hence, wing designer
needs to be aware of the flight condition, especially Re. E387 is chosen
since it has better performance at low Reynolds number.
Fig 4.2(a) DAE11

25
Fig 4.2(b) DAE31
Fig 4.2(c) E387

26
Fig 4.2(d) E398
Fig 4.2(e) Selig S7012
27
Table 4.2: Ranking of Airfoils
4.3WING GEOMETRY
The inflatable wing is designed such that constant internal wing
pressure is required to maintain wing shape. High stiffness is achieved
with low inflation pressure by maximizing inflated sectional moment of
inertia. Since the wing is constructed of a flexible fabric material, it can
be stowed by folding or rolling. Previous inflatable wing designs required
high gage pressures to maintain wing shape. This typically requires the
use of heavy seals and gaskets and thicker than desired wall thicknesses
for the wing material. It also means that any leak, however small, will
result in the rapid depressurization of the wing and loss of structural
integrity.
The present wing design uses the presence of internal span-wise baffles
or inflation cavities to help maintain structural stiffness at lower internal
pressures. The outer wing (restraint) and internal baffles are constructed
from high strength fibers such as Kevlar.

28
The current incarnation as tested herein is made of Vectran, a
manufactured fiber spun from Celanese Vectra liquid crystal polymer.
The fibers have high-temperature resistance, high strength and modulus,
and high resistance to moisture and chemicals, with good property
retention in hostile environments. Since Vectran is porous, a polyurethane
elas-tomer bladder is used to keep the internal volume pressurized.
Design pressure is 186 kPa (27 psi), though the wing has been
successfully flight tested at values down to 52 kPa (7.5 psi) with
sufficient wing stiffness for low speed applications.
The wing is constructed in semi-span sections and mounted to a
plenum that can then be attached to an aircraft fuselage. The wing in both
uninflated and inflated states is shown in figure. The wing profile is based
around a NACA 4318 with a 4 degree incidence angle. The taper ratio is
0.65 with an aspect ratio of 5.39 and a span of approximately 1.8 m (6 ft).
The wing planform and root and tip cross-sections are shown in figure.
Fig 4.3: Profile of Wing

29
4.4 WING MODEL
CATIA V5 is design software developed by Dassault systems to
meet the complicated design requirements in the field of aerospace and
automotive. In our project we use CATIA as a main design tool to
develop the wing.
Fig 4.4 2D Model of Wing
Fig 4.5 3D Model of Wing
30
FINITE ELEMENT STRESS ANALYSIS
5.1 INTRODUCTION
Once the final profile of the inflatable/rigidizable wing was chosen,
the strength of the wing structure became the next challenge in the wing
design. For this purpose the wing was subjected to adequate G-load (2.5G
and 5G) analyses were performed along with the internal pressurization
for inflating the wing.
The software used for finite element stress analysis is PATRAN &
NASTRAN. The set of software operates hand in hand, following a
sequential order as follows:
1. Geometry
2. Meshing
3. Properties
4. Loads & Boundary conditions
5. Analysis
6. Results
Patran does the operations of creating geometry, if any necessary, the
meshing of the model, applying properties, loads and boundary
conditions. This file from the Patran is exported to Nastran and is
analysed using it. The results of this analysis are then imported back to
Patran again to study the results obtained.
31
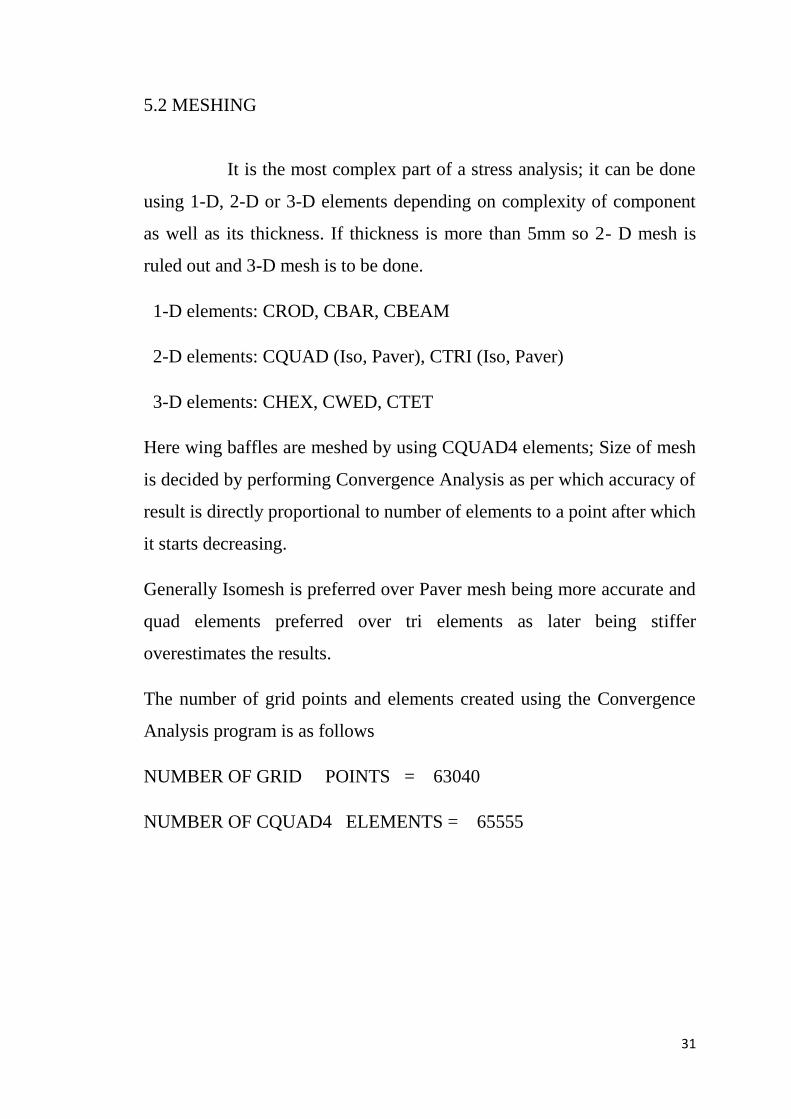
5.2 MESHING
It is the most complex part of a stress analysis; it can be done
using 1-D, 2-D or 3-D elements depending on complexity of component
as well as its thickness. If thickness is more than 5mm so 2- D mesh is
ruled out and 3-D mesh is to be done.
1-D elements: CROD, CBAR, CBEAM
2-D elements: CQUAD (Iso, Paver), CTRI (Iso, Paver)
3-D elements: CHEX, CWED, CTET
Here wing baffles are meshed by using CQUAD4 elements; Size of mesh
is decided by performing Convergence Analysis as per which accuracy of
result is directly proportional to number of elements to a point after which
it starts decreasing.
Generally Isomesh is preferred over Paver mesh being more accurate and
quad elements preferred over tri elements as later being stiffer
overestimates the results.
The number of grid points and elements created using the Convergence
Analysis program is as follows
NUMBER OF GRID POINTS = 63040
NUMBER OF CQUAD4 ELEMENTS = 65555

32
5.2.1 MESHED MODEL
Fig 5.1 MESHED MODEL OF INFLATABLE WING
33
5.3 MATERIAL PROPERTIES
The application of material properties to the wing model in Patran is
discussed below.
5.3.1DEFINING MATERIAL
We define of what material our component is made with in the
following sequence.
CreateIsotropicManual I/PI/P propertiesElastic
ModulusPoisson RatioOKApply
5.3.2 DEFINING PROPERTIES
The properties like Poisson ratio and Young’s modulus
corresponding to the material defined is given and application region is
selected.
Create2-DShellProp NameMat prop nameOKSelect
memberApply

34
5.3.3 MATERIAL SELECTION
The wing is constructed using fibreglass fabric with a special UV-
curable vinyl-ester epoxy resin. This composite wing is flexible prior to
exposure to the UV-light, and then becomes solid material after several
minutes of curing process. The time to cure depends on the temperature.
One concern for this composite wing was strength. Composite materials
have been used in the wing of many aircraft; however, there have not
been any composite-material wings that transform their shape this
extensively.
Two types of fiber glass fabrics were considered: S-glass and E-glass. For
both composites, the fabric was combined with a special vinyl-ester
epoxy resin. Comparison of the material properties are summarized in the
following Table 5.1. The material properties of these fabrics are after
rigidization. Thus, internal pressurization of the wing was ignored.
Table 5.1 Comparison of the material properties

35
5.4 LOADS AND BOUNDARY CONDITIONS
5.4.1 LOADS
The aerodynamic loading of a rectangular wing varies along
the span, and this loading can be expressed as an elliptical function:
Where Pmax is the wing pressure at the fuselage that varies in the y
direction along the span, and b is the wingspan, 36 in. for this analysis.
Adequate G-load (2.5G and 5G) analyses were also performed to insure
sufficient wing strength.
Fig 5.2 Pressure distribution for 2.5G
2.9919
2.9769
2.9315
2.854
2.742
2.59112.3935
2.1366 1.795
1.304
00
0.5
1
1.5
2
2.5
3
3.5
0 95 190 285 380 475 570 665 760 855 950
PRESSURE DISTRIBUTION OVER FULL SPAN P(y)
36
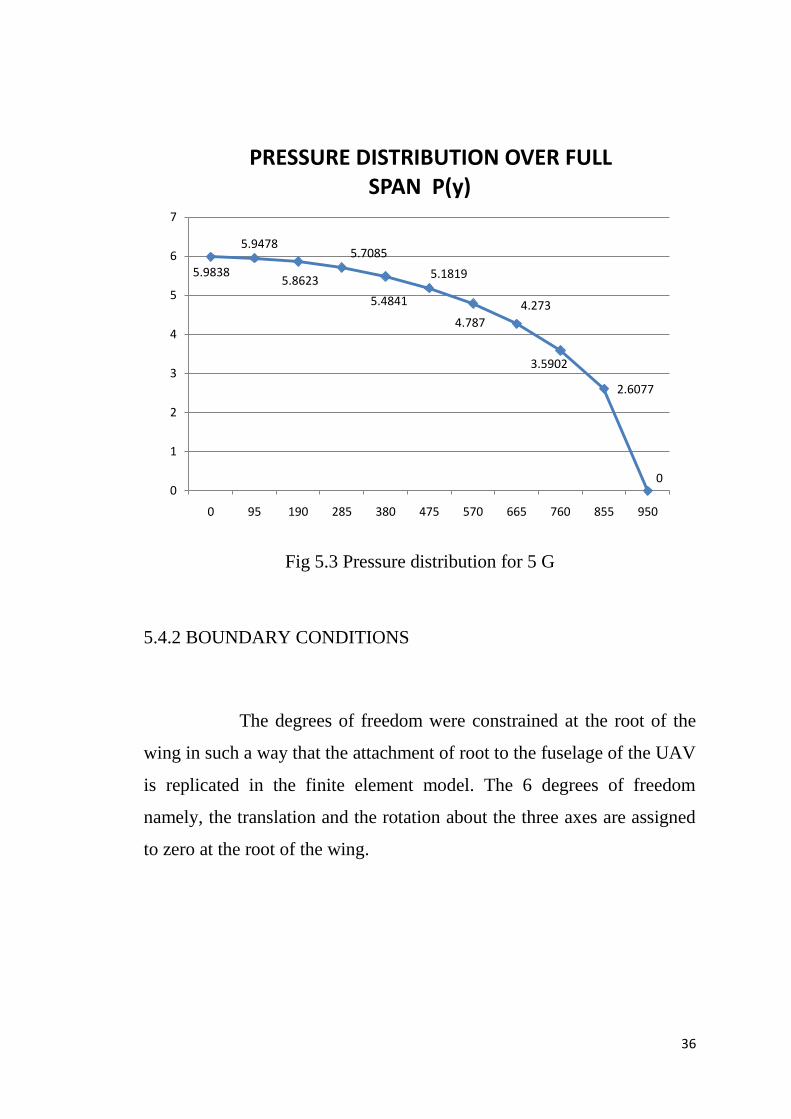
Fig 5.3 Pressure distribution for 5 G
5.4.2 BOUNDARY CONDITIONS
The degrees of freedom were constrained at the root of the
wing in such a way that the attachment of root to the fuselage of the UAV
is replicated in the finite element model. The 6 degrees of freedom
namely, the translation and the rotation about the three axes are assigned
to zero at the root of the wing.
5.9838
5.9478
5.8623
5.7085
5.4841
5.1819
4.787
4.273
3.5902
2.6077
00
1
2
3
4
5
6
7
0 95 190 285 380 475 570 665 760 855 950
PRESSURE DISTRIBUTION OVER FULL SPAN P(y)

37
5.4.3 LOADED MODEL
Fig 5.4 MESHED MODEL WITH BOUNDARIES CONSTRAINED
Fig 5.5 MESHED MODEL WITH INTERNAL PRESSURE LOADING
38
Scr=yes old=no news = no
5.5 ANALYSIS
Analysis is done in Patran in the following sequence:
Analyze Entire Model Analysis deck Translational Parameters
Select OP2 data output Sub case SelectOK Apply
This is then submitted for solving to Nastran by selecting required output
file. The *.bdf file is generated. Processing is done using Nastran; the
command prompt is:
>>Nast 2004
>>filename.bdf
The *.f06 and *.op2 files are generated of which *.f06 file is checked for
fatal error. Nastran tool calculates global stiffness matrix, elemental
forces from data given in loads and BCs. It then interprets the Matrices
for geometry and gives the displacement, stress and strain for model.
Result can be verified by cross checking the reaction obtained from
manual calculation and reaction in *.f06 file. Now *.op2 file is submitted
to Patran for post processing by:
Access ResultsRead OP2Result EntitiesSelect Result fileApply.

39
5.6 RESULTS OF THE ANALYSIS
5.6.1 E-GLASS FIBER
Fig 5.6 DEFLECTION AT 5 psi INTERNAL PRESSURE LOADING
Fig 5.7 DEFLECTION AT 40 psi INTERNAL PRESSURE LOADING

40
Fig 5.8 DEFLECTION AT 5 psi & 2.5 G AERODYNAMIC LOADING
Fig5.9 DEFLECTION AT 40 psi & 2.5 G AERODYNAMIC LOADING
41
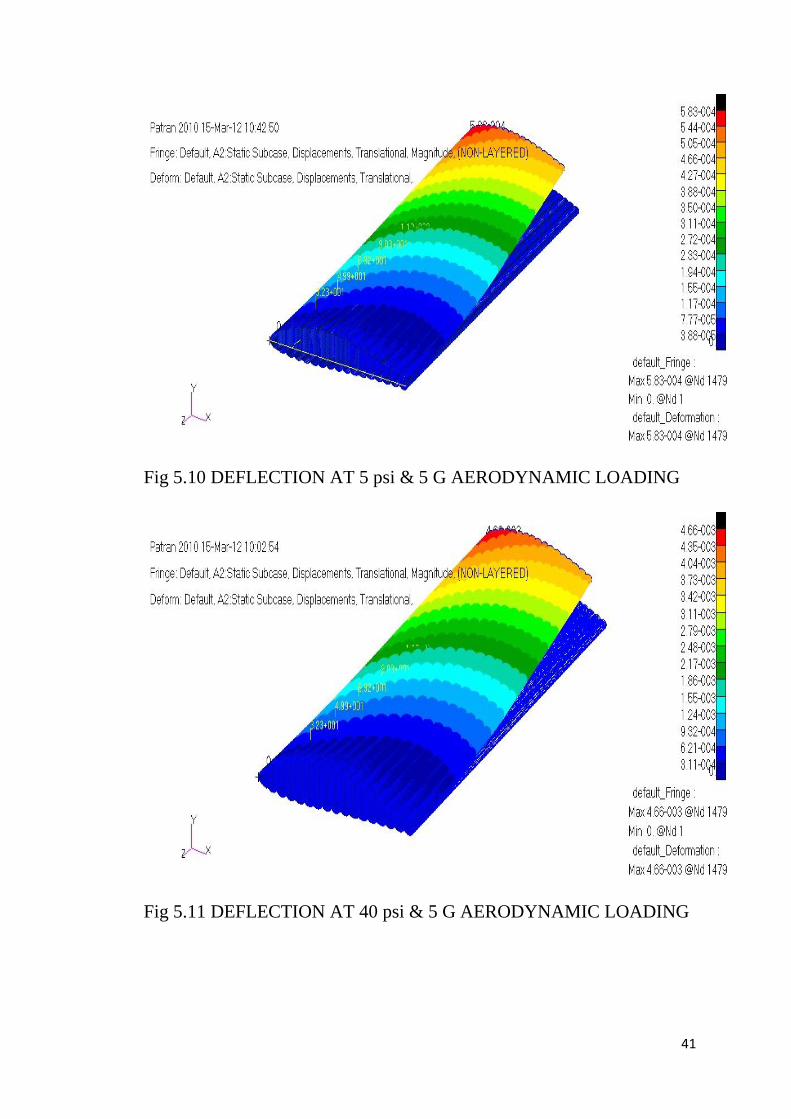
Fig 5.10 DEFLECTION AT 5 psi & 5 G AERODYNAMIC LOADING
Fig 5.11 DEFLECTION AT 40 psi & 5 G AERODYNAMIC LOADING

42
5.6.2 S-GLASS FIBER
Fig 5.12 DEFLECTION AT 5 psi INTERNAL PRESSURE LOADING
Fig 5.13 DEFLECTION AT 40 psi INTERNAL PRESSURE LOADING
43
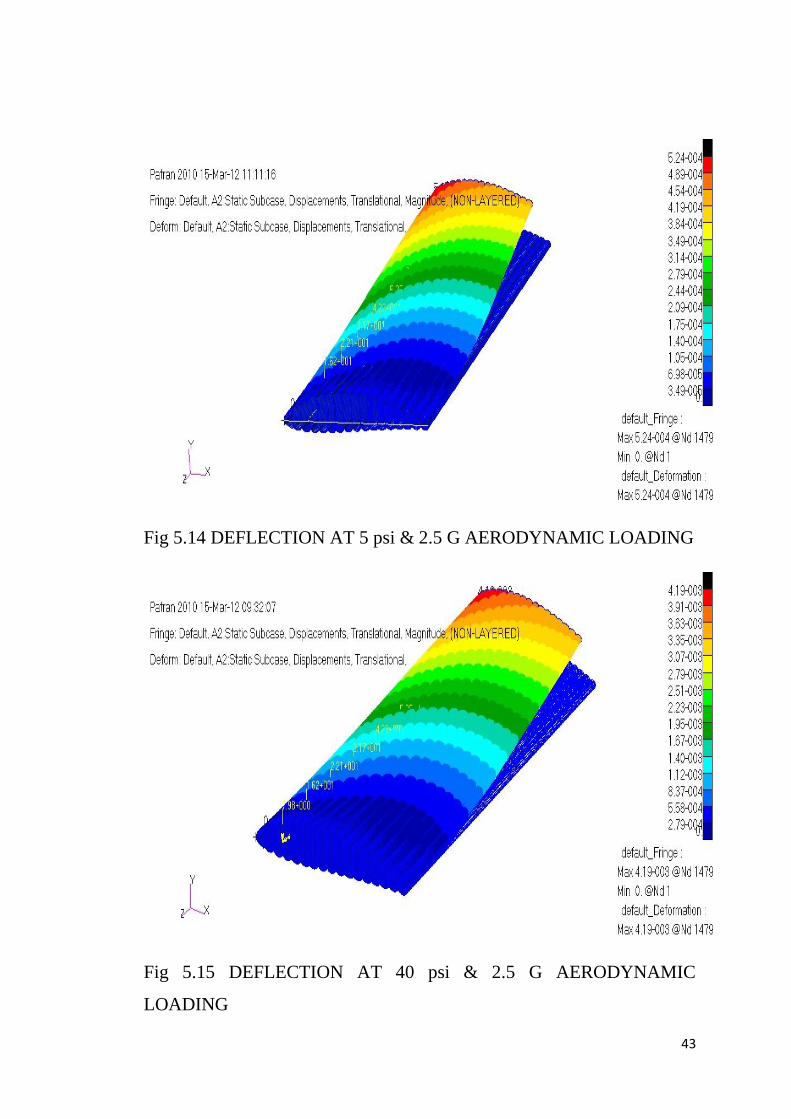
Fig 5.14 DEFLECTION AT 5 psi & 2.5 G AERODYNAMIC LOADING
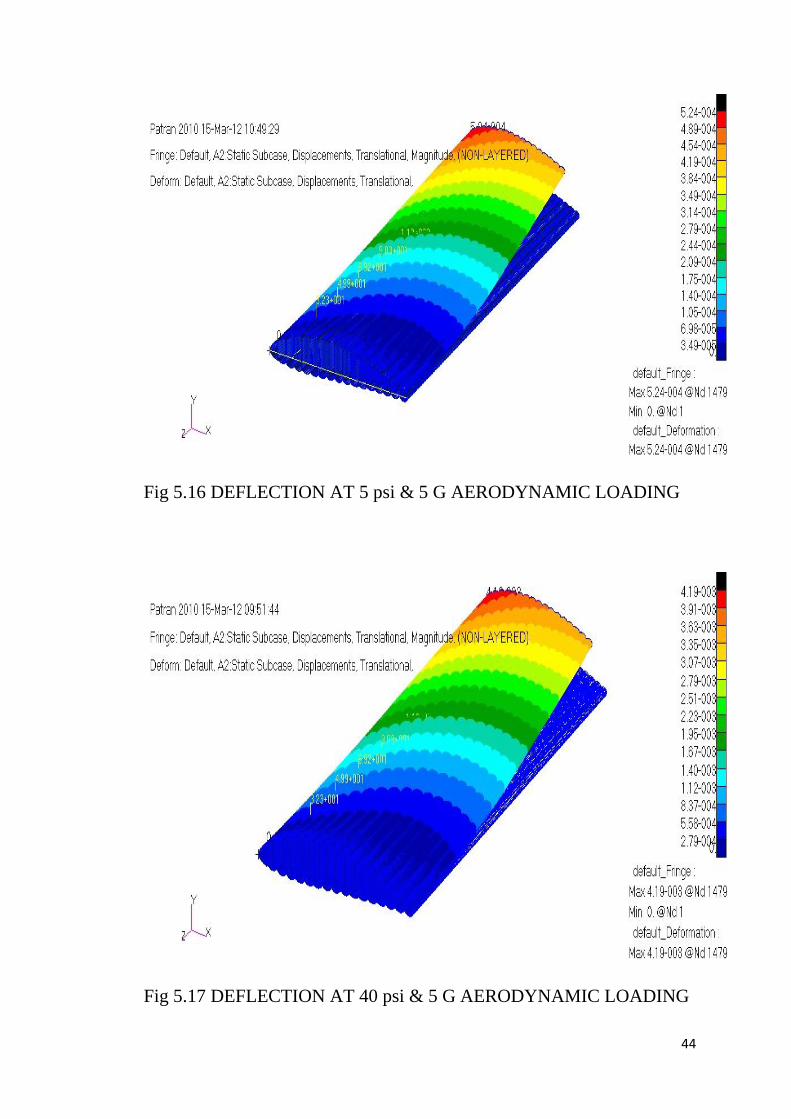
Fig 5.15 DEFLECTION AT 40 psi & 2.5 G AERODYNAMIC
LOADING
44
Fig 5.16 DEFLECTION AT 5 psi & 5 G AERODYNAMIC LOADING
Fig 5.17 DEFLECTION AT 40 psi & 5 G AERODYNAMIC LOADING

45
5.6.3 AT WORKING PRESSURE
Fig 5.18 DEFLECTION AT 27 psi INTERNAL PRESSURE LOADING
Fig 5.19 DEFLECTION AT 27 psi & 2.5 G AERODYNAMIC
LOADING

46
Fig 5.20 DEFLECTION AT 27 psi & 5 G AERODYNAMIC LOADING

47
CONCLUSION
6.1 MATERIAL SELECTION
The material on which the stresses act and that would withstand
them is prioritised.
Of the two materials, S glass and E glass, E glass material was selected
because of its moisture resistance property and its better curability when
exposed to UV radiation.
The material selected is so E-glass fiber with special vinyl epoxy as resin.
6.2 STRESS ANALYSIS
The main focus of this project was to design and analyze the
stresses acting on the wing. The wing was found to deflect up to a
maximum of 4.66 x10⁻³
mm at an internal pressure of 40psi with
aerodynamic loading of 5 G and it deflects up to 3.14 x 10⁻³
mm at the
working pressure of 27 psi with aerodynamic loading of 5 G.
48
REFERENCE
1. Michiko Usui, Aeromechanics of Low Inflatable/Rigidizable Wing,
May 7, 2004
2. NASA’s Mars Exploration Program, http://marsprogram.jpl.nasa.gov/,
May 7, 2004
3. Mars Exploration Rover Mission,
http://marsrovers.jpl.nasa.gov/home/index.html, May 7, 2004
4. University of Kentucky Baseline Inflatable Glider Balloon Launch
Unmanned Experiment, http://www.engr.uky.edu/ bigblue, May 7, 2004
5. S.C. Smith, A.S. Hahn, W.R. Johnson, D.J.Kinnery, J.A. Pollitt, J.J.
Reuther “The Design of the Canyon Flyer, an Airplane for Mars
Exploration.” AIAA Paper No. 2000-0514, 38th AIAA Aerospace
Sciences Meeting, Reno, NV, Jan. 2000.
6. G.A. Landis, A. Colozza, C.M. LaMarre “Atmospheric Flight on
Venus.” AIAA Paper No. 2002-0819 40th AIAA Aerospace Sciences
Meeting, Reno, NV, Jan. 2002
7. D. Greer, P. Hamory, K. Krake, M. Drela “Design and Predictions for
a High-Altitude (Low- Reynolds-Number) Aerodynamic Flight
Experiment.” 17th Applied Aerodynamics Conference and 14th
Computational Fluid Dynamics Conference, Norfok, VA, 1999.
8. P.B.S. Lissaman “Low-Reynolds-Number Airfoils.” Annual Review
of Fluid Mechanics, 15, pp. 223–39, 1983. 153
9. M.D. Guynn, M.A. Croom, S.C. Smith, R.W. Parks, P.A. Gelhausen
“Evolution of a Mars Airplane Concept for the Ares Mars Scout
Mission.” 2nd AIAA ”Unmanned Unlimited” Systems, Technologies, and
Operations-Aerospace, San Diego, CA, 2003.
49
10. D. Cadogan, T. Smith, R. Lee, S. Scarborough, D. Graziosi
“Inflatable and Rigidizable Wing Components for Unmanned Aerial
Vehicles.” 44th AIAA/ASME/ASCE/AHS/ASC SDM Conference,
Norfolk, VA, 2003.
11. T. Mueller. “Low Reynols Number Aerodynamics.” Springer Verlag,
1989.
12. M. Drela. “XFOIL: An Analysis and Design System for Low
Reynolds Number Airfoils.” Low Reynolds Number Aerodynamics. T.J.
Mueller (Editor). Lecture Notes in Engineering No.54, Springer Verlag,
1989.
13. R. C. Juvinall and K. M. Marshek, Fundamentals of machine
Component Design, John Wiley and Sons, Inc., NY, 2000
14. G. K. Batchelor, An Introduction to Fluid Mechanics, Cambridge
University Press, Cambridge,1990.
15. S. Batill and T. Mueller. “Visualization of Transition in the Flow
Over an Airfoil Using the Smoke Wire Technique.” AIAA Journal, 19,
pp. 340–345, 1981.
16. J.D. Anderson, Aircraft Performance and Design, WCB/McGraw-
Hill, Boston, 1999