Project Overview Sanakham - mrcmekong.org
33
Transcript of Project Overview Sanakham - mrcmekong.org


Overview Sanakham Hydropower Project and the Documentation
Submitted for Prior Consultation This document provides an overview on the Sanakham Hydropower Project (SNHPP) and the submitted documents of the proposed project from Lao PDR. It presents key information extracted from the submitted documents, except where stated otherwise. It is intended to provide a summary of the SNHPP, to facilitate discussions with stakeholders, who may be interested in the PNPCA process. It will enable stakeholders to find essential information with respect to the project design, as well as potential negative impacts and proposed mitigation measures, monitoring programmes, social and environmental impact assessments.
Contents
1 Introduction 1
2 Purpose of this document 1
3 Summary of the Sanakham Hydropower Project 1
3.1 Background 1 3.2 Engineering structures of the proposed project 2
3.2.1 Powerhouse 3
3.2.2 Flood release structures and Sand Sluicing Gates 3
3.2.3 Navigation Lock 3
3.2.4 Fish Passage Facilities 4
3.2.5 Auxiliary Dams 4 3.3 Dam safety 4 3.4 Operations 5 3.5 Construction Plan and Scheduling 6
4 Overview of the submitted documents 8
4.1 Engineering Status Report 8 4.2 Hydrological Data and Sediment Sampling Report 8
4.2.1 Water level stations 8 4.3 Reservoir Sedimentation and Backwater Report 9 4.4 Automatic Hydrologic Data Collection and Transmission Report 11 4.5 Sediment Monitoring System Report 12 4.6 Sediment management Report 13 4.7 Numerical Simulation of Reservoir Sedimentation Report 14 4.8 Navigation Channel Sedimentation Report 15 4.9 Hydraulic Physical Model Investigation of Filling and Emptying System Report 16 4.10 Social Impact Assessment 16 4.11 Social Management and Monitoring Plan 19 4.12 Resettlement Action Plan 20 4.13 Environmental Impact Assessment 22 4.14 Environmental Management and Monitoring Plan 25 4.15 Transboundary Environmental and Social Impact Assessment & Cumulative Impact Assessment 26 4.16 Fish Passage Facilities Design 27

1
1 Introduction On 09 September 2019, the Mekong River Commission (MRC) Secretariat received notification from the National Mekong Committee of Lao PDR submitting the Sanakham Hydropower Project (SNHPP) for Prior Consultation (PC) under the Procedures for Notification, Prior Consultation and Agreement (PNPCA). The proposed SNHPP is the sixth proposed use of the water of the Mekong River System submitted for the PC process under the MRC’s PNPCA. The earlier five PC processes are for the Xayaburi, the Don Sahong, the Pak Beng, the Pak Lay, and the Luang Prabang Hydropower Projects conducted in 2010-2011, 2014-2015, 2016-2017, 2018-2019, and 2019-2020, respectively. Documentation for the SNHPP was submitted about one month after the submission of Luang Prabang Hydropower Project (LPHPP). The MRC Joint Committee at the Preparatory Meeting for the 26th Council Meeting on 25 November 2019 consequently decided to shift the PC process for the SNHPP to after the completion of the PC process for LPHPP so that the MRC can focus attention on each separately. The end date for LPHPP PC process was intended to be on 07 April 2020. However, due to the COVID 19 pandemic the planned Special Session of the MRC Joint Committee to conclude the PC process for LPHPP was postponed to 4 June 2020. The PNPCA require the three notified Member Countries (Cambodia, Thailand and Viet Nam) to acknowledge and review the documents submitted for prior consultation and submit their replies (through an Official Reply Form) to the MRC Joint Committee. The MRC Joint Committee may direct the MRC Secretariat to assist in the evaluation of the proposed use by undertaking a technical review of the submitted documents. This may include an assessment of possible impacts on other water uses, the ecological functioning of the river system, and any possible impingement on the rights of the Member Countries. 2 Purpose of this document This report provides a summary of the documents submitted by Lao PDR. It will enable stakeholders to access key information on the project design, likely social and environmental impacts and potential measures, and the proposed monitoring and forecasting schemes. The report only presents a summary of the information in the submitted documents, except where stated otherwise. 3 Summary of the Sanakham Hydropower Project 3.1 Background The SNHPP is the fifth in the cascade of run-of-river projects on the mainstream from upstream to downstream of the Lower Mekong River, located around 1,737 km from the sea. The dam site is located between Xayaburi Province and Vientiane Province of Lao PDR. It lies approximately 25 km upstream from Sanakham district of Vientiane Province, about 155 km from Vientiane Capital at downstream, and 83.7 km

2
downstream of the Pak Lay Hydropower Project (PLHPP). The dam site is only some 2 km upstream of the Lao / Thai border. The power plant is planned to have an installed capacity of 684 MW, designed with 12 turbines (generators), each producing 57 MW. The project is mainly intended for power generation for export and local consumption, but it will also serve to improve navigation and tourism. The construction is planned to commence in 2020. The power station is expected to start operations in 2028.
3.2 Engineering structures of the proposed project The project consists of a powerhouse, a flood discharge and sand flushing sluices structure, a ship lock, a fish passage facility, and auxiliary dams. The main structures of the Sanakham HPP are illustrated in Figure 2. The dam crest elevation is 229.5 m, the maximum dam height is about 56.2 m, and the dam crest
The Sanakham Hydropower Project (1) Run-of-river project (2) 5th in the Cascade of hydropower
projects in the lower mainstream Mekong River
(3) 83.7 km downstream of the Pak Lay HPP
(4) About 155 km from Vientiane Capital (5) Installed capacity: 684 MW (6) Turbines: 12*57 MW (7) Expected construction start date:
2020 (8) Expected operations start date: 2028 (9) Mainly for export and local
consumption (10) Total cost: 2,073 Million USD
Figure 2: Main components and infrastructure of the Sanakham Hydropower Project
Figure 1 The location and key metrics of the proposed Sanakham Hydropower Project

3
length is 909.9 m. The powerhouse is located in the main river channel, the discharge sluices are located at right side and left side of powerhouse, and the navigation lock is arranged on the left bank. The fish passage facility is designed as a bypass channel on the right bank. 3.2.1 Powerhouse Powerhouse includes two parts: 1) Powerhouse and 2) 500 kV outdoor GIS switchyard. The powerhouse has 12 turbines (generators) of 57 MW each. The main erection bay is located at right side of powerhouse and the auxiliary erection bay is located at the left side. The total length of the powerhouse section is 350.2 m, which includes the main machine hall, main erection bay and auxiliary erection bay. To maintain the power intake free of sediment, one desilting hole is included on the central pier between each turbine units with 6 in total. 3.2.2 Flood release structures and Sand Sluicing Gates The flood release structures are composed of flood discharge and sand flushing sluices on the right and left of the powerhouse. On the left bank, 13 flood discharge and sand flushing sluices are arranged to discharge flood, sediment and floating debris with dimensions of 15 m x 22 m (W x H) and a bottom plate elevation at 198.0 m. Five units are bottom outlets, while the other eight units are surface outlets. On the right bank, five flood discharge and sand flushing sluices are planned. Four units are designed as high-level bottom outlet sluices to discharge floods and sediment. These are equipped with breast walls with opening dimensions of 12.5 m x 16 m (W x H) and a bottom plate elevation of 192.0 m. The remaining sluice is an open type, designed to discharge floating debris with an opening dimension of 12.5m x 22m (W x H) and a bottom plate elevation of 198.0 m. The six sand sluices have dimensions of 2.5 m × 4.5 m (W×H) and are designed in the powerhouse section for every two generating units passing through the bottom of the powerhouse in order to prevent siltation in front of the power intake and assure clear water entering into the intakes. The bottom elevation of the inlet and outlet is 176.3m and 189m, respectively. In addition, an emergency gate is designed for the inlet, a plain service gate and a bulkhead gate for the outlet. 3.2.3 Navigation Lock The navigation lock is a one-line and one-step ship lock for 500-ton vessels. Space for the future upgrading into a double-line lock has been reserved. The maximum working head is 20.59 m, the size of lock chamber is 120 m x 12 m x 4 m (LxWxD), and the maximum navigable air clearance is 8 m. The navigation structures are arranged on left bank and consist of the ship lock and

4
access channels. The total length of upstream approach channel is 626 m with the navigation area, adjustment area and park area with 8 dolphin piers (mooring pillars) available on the left side of the approach channel. The total length of the downstream approach channel is 873 m with navigation area, adjustment area and park area with 8 dolphin piers (mooring pillars) available on the right side of the approach channel. 3.2.4 Fish Passage Facil it ies A natural like bypass fishway namely imitative-ecological fishway has been proposed for both upstream and downstream migration of all the life stages of the fish species passing the dam. The imitative-ecological fishway has a total length of 2.48 km located on a terrace at the elevation of about 216 m on the right riverbank, with two inlets and one outlet. Luring facilities such as lighting and an electric screen for fish blocking will be set at the inside and outside of the inlet respectively based on the response to light, colour and sound given by fish. More details of the fish passage facilities are provided in Section 4.16. 3.2.5 Auxiliary Dams Two auxiliary dams will be constructed on the left and right banks in order to close the original river channel. The left auxiliary dam is located on the left side of the navigation lock, the length and width of dam crest length are 100 m and 22 m respectively. The right auxiliary dam is located on the right side of right bank sluice, the length and width of dam crest length are 85.7 m and 22 m respectively. The fishway structure goes through the right auxiliary dam, and the elevation of the fishway bottom is 217 m. 3.3 Dam safety The design parameters for the SNHPP are as follows:
• Seismic standards The earthquake safety evaluation for SNHPP shows that the seismic peak ground acceleration with 50-year probability of exceedance of 10%, and 50-year probability of exceedance of 5%, in the project area are 0.063 and 0.090 respectively. Considering these results and design experience of similar projects, the horizontal seismic peak ground acceleration standards for the design and check events are 0.063g and 0.090g respectively.
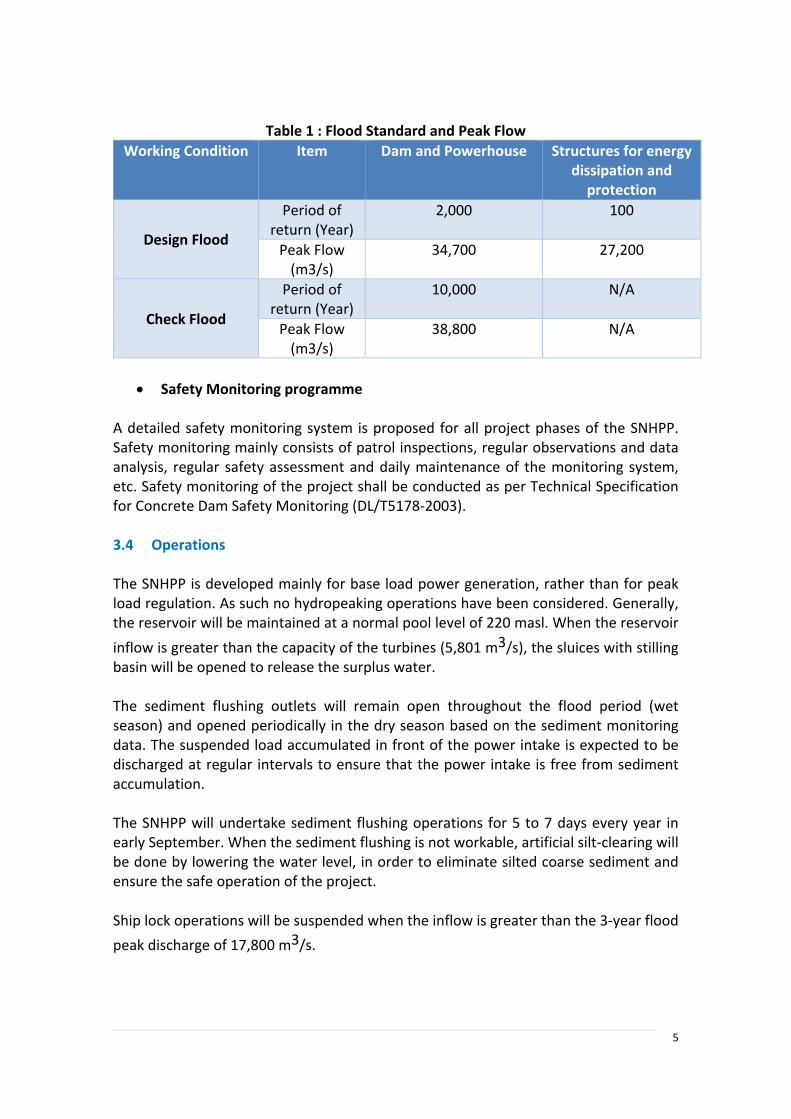
• Flood standard As per Chinese national standards and technical standards of Chinese power industry, and to meet the requirements of the Lao technical standards, the preliminary flood standards and flow peaks are outlined in Table 1.
5
Table 1 : Flood Standard and Peak Flow Working Condition Item Dam and Powerhouse Structures for energy
dissipation and protection
Design Flood
Period of return (Year)
2,000 100
Peak Flow (m3/s)
34,700 27,200
Check Flood
Period of return (Year)
10,000 N/A
Peak Flow (m3/s)
38,800 N/A
• Safety Monitoring programme
A detailed safety monitoring system is proposed for all project phases of the SNHPP. Safety monitoring mainly consists of patrol inspections, regular observations and data analysis, regular safety assessment and daily maintenance of the monitoring system, etc. Safety monitoring of the project shall be conducted as per Technical Specification for Concrete Dam Safety Monitoring (DL/T5178-2003). 3.4 Operations The SNHPP is developed mainly for base load power generation, rather than for peak load regulation. As such no hydropeaking operations have been considered. Generally, the reservoir will be maintained at a normal pool level of 220 masl. When the reservoir inflow is greater than the capacity of the turbines (5,801 m3/s), the sluices with stilling basin will be opened to release the surplus water. The sediment flushing outlets will remain open throughout the flood period (wet season) and opened periodically in the dry season based on the sediment monitoring data. The suspended load accumulated in front of the power intake is expected to be discharged at regular intervals to ensure that the power intake is free from sediment accumulation. The SNHPP will undertake sediment flushing operations for 5 to 7 days every year in early September. When the sediment flushing is not workable, artificial silt-clearing will be done by lowering the water level, in order to eliminate silted coarse sediment and ensure the safe operation of the project. Ship lock operations will be suspended when the inflow is greater than the 3-year flood peak discharge of 17,800 m3/s.

6
Figure 3 Operating rule curve for the Sanakham HPP
During normal operations, an “operating range” of around 1.00 m will be required for practical purposes (control system), i.e. the FSL will vary between 219.0 and 220.0 m asl. The SNHPP is furnished with 10 flat-bottomed flood sluices with stilling basins on the left and right banks. At discharges of less than 11,000 m3/s, the 5 flood sluices on the right bank shall be operated as the main discharge outlet, and the 5 flood sluices on the left bank shall be operated at intervals. Or a combination operating mode of 4 or 3 outlets on the right bank and 2 or 3 outlets on the left bank shall be applied to enhance the sand flushing effect. At discharges between 11,000 m3/s and 17,800 m3/s (i.e. a 3-year flood) all 10 sluices will be opened. The documentation indicates that when a 3-year or larger flood occurs at the Luang Prabang HPP (before completion of Pak Beng hydropower station) or 3-year or larger flood occurs at the Pak Beng HPP station and all water releasing works of Pak Beng hydropower project is fully opened for water discharge, the Sanakham HPP shall start advance releases with flowrate controlled as 3-year peak flow of 17,800 m3/s, and the reservoir level shall decrease accordingly. It will take about 1 to 2 days for the flood at the upstream LPHPP to reach the SNHPP station. During this time the outflow rate shall be maintained at 17,800 m3/s. When the water head is below 4 m, all units shall be shut down; when the reservoir level reaches 213.85 m, all gates shall be opened for flood release and sand flushing. These operating rules will have to be adjusted to adopt any future cascade operating rules. 3.5 Construction Plan and Scheduling

7
The construction period including testing and commission is planned for 96 months. At the end of December in eighth year, the last power generation unit will be ready for commercial operation. Due to topographic and geological conditions, and the engineering complex, the preliminary plan is to adopt a 2 stages river diversion. The First-stage Diversion on the left bank will start from first year of construction until December of the fourth year (Figure 4). This involves the 1st stage starter cofferdam, and the 1st stage upstream and downstream year-round cofferdams, as well as the longitudinal concrete guide wall (including open caisson). The upstream and downstream year-round cofferdams are constructed to divert river flows through the narrowed riverbed. During this time the original riverbed will be used for navigation. The navigation facilities and left-bank Flood sluice gate section will be constructed.
The second-stage diversion on the left bank (Figure 5) is planned to start in January of the fifth year of construction, and will last until July of the Seventh year. The 2nd stage river diversion includes upstream and downstream year-round cofferdams and a longitudinal guide wall. During this stage, the left-bank sluice gates as well as the ship locks will be in operation and the powerhouse section, right-bank Flood sluice gate section and fish pass will be constructed.
From August in seventh year to December in eighth year, the permanent structures will be used for water releases and for testing and commissioning of turbines and generators.
Figure 4 The first stage river diversion
Figure 5 The second stage coffer dams.

8
4 Overview of the submitted documents A total of 16 reports and the appendices, three PowerPoint presentations and a 15-minute video clip have been submitted. The following sections present a summary of each report. 4.1 Engineering Status Report The Engineering Status Report covers the engineering aspects of the project including geology and geotechnical investigation, topography and mapping, hydrology and sediment, project planning and layout, components of infrastructure, dam safety, fish passage, mechanical and electrical equipment, construction plan and scheduling and total cost of the project. The appendix to the report tabulates compliance of the proposed project with the MRC Preliminary Design Guidance, which was prepared by the developer.
4.2 Hydrological Data and Sediment Sampling Report This report provides information on the establishment of the flow gauging stations, discharge measurement, survey works for longitudinal, cross sections and water surface profile as well as sediment sampling and analysis. The data collected to date are also presented. 4.2.1 Water level stations Six manual water level stations were established at the Ban Donmen Dam site in late April 2008. Gauge P is located 250 m upstream the Sanakham islet at Ban Donmen dam site, gauge A and gauge A’ are on the right and left channel of the dam axis, respectively. Gauge B and gauge B’ are on the right channel and left channel of the plant site (lower dam axis), respectively. Gauge C is 250 m downstream of the river islet. An automatic water level station was installed on the right bank at gauge C and has collected data since 1 May 2008. The frequency of automatic data collection is not mentioned in the report. Since the new Sanakham dam site at Ban Veunkham was selected in December 2009, four additional manual water level gauges were established. Gauge P is located 600 m upstream of the upper dam axis, gauge A is at the narrowest river channel at Ban Houayla village, gauge B is at the lower dam axis and gauge C is at Ban Veunkham village. All gauges started operations on 1 December 2009. Daily average water levels of all above gauges are attached in the report. The records at the Ban Donmen dam site starts from 01 May 2008 to 31 December 2009. The records at Ban Veunkham dam site starts from 01 January 2010 to 31 December 2012 and from 01 January 2015 to 30 April 2016. Discharge measurement

9
Discharge measurements have been conducted since 01 May 2015, at gauge C - Ban Veunkham dam site. Measurements were taken at least once a month. A total of 28 measurements from 01 May 2015 to 30 April 2016 are presented in the report. Water depth was measured by an ultrasonic depth finder. The flow measurement was conducted using a dedicated hand-handled winch hung with a 25 kg elliptical type weight, the flow velocity was measured by a LS25-3A propeller type current meter. Survey of longitudinal & cross sections and water surface profiles Seven surveys for cross sections (gauge P, A, B, C, upper dam site, middle dam axis, lower dam axis) and one longitudinal section (gauge C) were conducted at the Ban Donmen dam site. Five surveys for cross sections (upper dam axis, gauges P, A, B, C) and one longitudinal section (gauge C) were conducted at Ban Veunkham dam site. All survey results are provided in the report. Sediment sampling The sediment sampling was done with a 200ML hammering horizontal type sampler. The field sediment sampling was undertaken at Section C once every day at 9am from 1 May to 30 December 2016, by using a tension horizontal type sampler. There are a total of 245 unit sediment content measurements and 19 sectional sediment content measurements. From 1 January to 30 April 2016, there are 121 unit sediment content measurements and 5 sectional sediment measurements. The sediment sample volume was measured on site, and the sediment content was tested by using the substitution method. The suspended sediment particle size analysis was conducted using the particle size meter method along with the transfer pipette method. The results of sediment particle size analysis for 2015 and 2016 are attached in the report. 4.3 Reservoir Sedimentation and Backwater Report This report provides information on the operations of the reservoir, the analysis and calculation of reservoir sedimentation and calculation of the reservoir backwater. The operations of the SNHPP are outlined in the previous section. Analysis and Calculation of Reservoir Sedimentation The Susbed-2, non-equilibrium sediment transport model with constant flow, developed by Wuhan University has been used to calculate reservoir sedimentation. The report notes that the model is widely used in the study and design of hydropower and water conservancy projects in China. The survey results for the longitudinal and cross section surveys of the reservoir area conducted in April 2008 and January 2009 by Power China were used in the analysis. There are 99.2 km of longitudinal section and 50 cross sections in the reservoir area.

10
The water and sediment data series at Chiang Khan Station from 1971 to 1980 were used for the sediment calculations. The suspended sediment gradation by CNR in May 2015 is used for the suspended sediment gradation. The results suggest that after 10 years of operation, the total inflow sediment would be 703.8 million tons of which 690 million tons is suspended load. The sedimentation in the impoundment area would account for 156 million tons of which 144 million tons is suspended load. The average sediment discharge ratio was 77.8%, which would cause a 15.3% loss of reservoir storage capacity after 10 years. After 50 years of operation, the total inflow sediment would be 3,519 million tons of which 3,450 million tons is suspended load. The sedimentation in the impoundment area would account for 344 million tons, of which 287 million tons is suspended load. An average sediment discharge ratio was 90.5% which would cause a 31.2% loss of reservoir storage capacity. Sedimentation would mainly occur in the middle section (28.1 km - 58.4 km from the dam) of the impoundment. Relatively less sediment would occur closer to the dam (first 28.1 km), where the width of the impoundment is narrower. The least sedimentation occurs in the upper reaches of the impoundment (58.4km away from the dam). After 10 years of operation, the sedimentation closer to the dam, the middle section and the upper impoundment would account for 15.5%, 74.5% and 10% of the total sedimentation in the impoundment, respectively. After 50 years of operation, these would be 24.8%, 70% and 5.2%, respectively. This suggests that the sedimentation wave would move gradually downstream. In the upper impoundment, the flow velocity variation between the natural condition and after operations would be relatively small. In the middle and lower reaches, at lower inflows the average flow velocities would be considerably lower than the natural condition. At higher inflows, the velocities across the length of the impoundment would be much the same as the natural condition. It was concluded that after commissioning the about 22% of the inflowing sediment load would be lost in the impoundment. This does not consider the impacts of the upstream HPPs in the Cascade. The section on sediment management below details the operations planned to sluice sediments. Calculation of Impoundment Backwater At the normal pool level of 220 m, the backwater level of the annual mean discharge of 4,410 m3/s would be 4.27 – 3.78 m higher than the natural water level at Pak Lay Town. At the 3-year flood with discharge of 17,800 m3/s, the backwater level at the town would be 0.30 – 0.19 m higher than the natural water level. These effects were based on the 10-year sedimentation results. At the normal pool level of 220 m, the backwater at the tailwater section of the Pak Lay HPP would range from 0.0 m to 4.16 m according to the flows range from 5,000 to 920 m3/s, respectively. At the annual mean discharge of 4,410 m3/s the backwater level at the PLHPP would be raised by 0.07 m. Detailed results of the calculations are tabulated in the report.

11
4.4 Automatic Hydrologic Data Collection and Transmission Report An Automatic System of Hydrologic Data Collection and Transmission (ASHDCT) has been designed to collect water level and rainfall data in real-time to support decision-making and dam operation on inflow monitoring, dispatching of flood control, power generation and water supply. The report includes the following chapters: overview, design basis, necessity and feasibility of the ADHDCT, design ideas and principles, function and major technical index of the ASHDCT, the forecast scheme and network, communication, the power supply and lightning protection, equipment configuration and technical requirements, the civil engineering, construction, acceptance and operation management, and investment estimation. The design of the ASHDCT follows Chinese standards. The design ideas and principles of the ASHDCT are described in the report including the station network in Lao PDR, the use of existing stations and sites, the combination of permanent stations and sites; uniform construction design, unified planning and overall consideration of cascade dams, and data sharing from other HPPs. The system will consist of collection and transmission, data storage, data processing, hydrological forecasting, backup communication, and protection. The central station can be extended to receive and process water information and data transmitted from other systems and incorporating these into the SNHPP system. This can potentially serve as a hub for possible future cascade operations. The system can provide medium and long-term runoff forecasting as well as reservoir operation functions. The major technical specifications are based on response speed, collection and transmission accuracy, reliability and normal operation of the equipment. The ASHDCT will cover the catchment from Luang Prabang to the SNHPP with a total area of 22,103 km2. The scheme is divided into construction period and operation period. Water level and discharge forecasting for the downstream reach will be based on the upstream and downstream flows using a river system forecasting method. A so-called Xin’anjiang hydrological and conceptual model developed by Hohai University will be used to simulate rainfall runoff process.
Figure 6: Hydrological station network distribution map

12
Water level and discharge of the inlet and outlet of the diversion tunnel will be forecasted during construction period. A new telemetry station at Luang Prabang will be established as the first upstream station while a new Sanakham telemetry station will be the last station located behind the outlet of the diversion tunnel. Luang Prabang telemetry station will be the forecasting inflow control station while the Sanakham telemetry station is taken as the outflow control station. The river forecasting system will forecast discharge at Sanakham dam site. The forecast lead time is intended to be 1-2 days with a 6-hour refresh frequency. During the operational period, rainfall-runoff forecasting will be integrated with the river forecasting system with a shorter forecasting frequency. There is no mention of integration with the existing Xayaburi HPP, or the other HPPs on the cascade. The ASHDCT network during the construction period is composed of a central station (at the camp), 15 telemetry rainfall stations and 2 telemetry hydrological stations (Luang Prabang and Sanakham) including telemetry stations at gauges A, B and C (Figure 6). Only gauge B will measure both water level and rainfall. Water level and discharge at the Sanakham station and water levels at gauges A, B and C will be forecasted in real-time. Discharge measurements will be conducted at the Sanakham station to obtain a stage-discharge relationship. However, the report does not provide clear information if the existing MRC Luang Prabang station is considered as a part of the system. During the operational period, gauges A and C will be removed, and 5 telemetry rainfall stations will be added to the network. The temporary central station will be converted to a permanent station in a control center in the dispatch building. The report suggests connecting the SNHPP system to the MRC HYCOS system. The network communications will be through GSM and/or the Beidou satellite depending on the signal strength. The report provides other detailed specifications for example, power supply and lightning protection, configuration of equipment and technical requirements etc. In addition, the civil engineering works requirements as well as the operational and investment costs are also detailed in the report. 4.5 Sediment Monitoring System Report The principle applied to sediment monitoring is to capture the changes to the hydrology and sediment loads. The existing hydrological and forecasting system stations are used as far as possible. The Luang Prabang monitoring station will be equipped with a LISST-100X field laser granulometer and data transmission equipment to monitor the real-time inflow of sediment to impoundment. However, this will now have to be reconsidered given the completion of the XHPP. The inflow water and sediment to the SNHPP will be monitored using an ADCP, and sediment concentration and grain size analyses. The outflow station will rely on the water regime outflow station, which is downstream of the SNHPP. The instruments and analyses will be the same as for inflow station. The water level measurement at the dam will utilise the existing water level gauging
13
station established for the forecasting system. The impoundment tailwater level will use the system to be established for the PLHPP. It has been proposed to establish 2 automatic water level gauging stations at Don Men Village and Pak Lay Town. The impoundment area control survey will form the basis for hydrological and sediment monitoring in the impoundment area. This will establish a plan and elevation system control networks for the whole impoundment area. Altogether 90 cross-sections are planned for the impoundment area, with the baseline having a total length of 90km. One longitudinal profile for the reservoir area is laid out, which is about 100km in length. 90 pairs of sectional monitoring beacons will be constructed along the impoundment area. The underwater topography will be surveyed with a digital echo-sounding instrument, land topography by the Total Station, positioned with a GPS. Professional data acquisition software, computation software, image integration software will also be used. A high-resolution satellite image of the Sanakham impoundment area will be acquired once a year. 3S technology will be used to generate the impoundment area topographic map. The annual variations of the river course, shorelines and terraces will be analysed. Each year before and after flood period, a patrol survey will be conducted for the impoundment area to inspect the banks in the impoundment area, especially along slopes that could possibly slump. To monitor the evolution of sedimentation, the dam site area topography will be monitored every year, to assess changes at the sand barrier, power intake, flood sluices, and upstream and downstream approach channels of the navigation facilities. 4.6 Sediment management Report The plan for sediment management operations is:
§ The right sluice will be opened to release water when the inflow is higher than 5,801 m3/s.
§ When inflow reaches 17,800 m3/s (peak discharge of the 3-year flood), the water level in the impoundment would be reduced. A warning lead time of about one to two days is expected. As such time taken to lower the impoundment water level is also one to two days.
§ As the water level in the impoundment decreases, the operator would gradually open more flood gates to maintain the discharge rate at 17,800 m3/s.
§ When the water head is less than 4 m, the power plant would be shut down. § When the water level in the impoundment further reduces to 213.85 m, all the
gates would be opened for discharging the flood and sediment. § When the inflow exceeds 17,800 m3/s, the ship lock will be out of service, and the
impoundment operates in the ungated pattern. The SNHPP is designed as a run-of-river power station, and sedimentation is not expected to be severe (from the hydropower operations perspective). The inflowing sand content would be decreased significantly, and the particle size of sediment flowing

14
into Sanakham impoundment would be small, considering the sand retaining effect of the upstream hydropower stations. Therefore, the sedimentation in front of the power intake is expected to be insignificant. A sand barrier would be set upstream of the power intake to guide the bed load to the downstream river channel through the gates to prevent coarse sediment from flowing into the turbine. Sedimentation at the entrance of the upper approach channel is slow since it is affected mainly by the backflow area. The sedimentation occurs mainly in the local area inside the outer guide wall of the upper approach channel. In contrast, the sand silted outside the outer guide wall could be washed out of the impoundment during full open of the flood gates on the left bank. The operator will dredge at the area where sediment sluicing has not been effective. The Sanakham impoundment is expected to have a low sand trapping rate and large sand sluicing ratio with a low head. Most of the inflow sediment would be discharged into the downstream river channel through the gates, so the difference between the natural sediment loads and the water-sediment relation after sand sluicing is expected to be small. No severe erosion is therefore expected in the downstream river channel. Water level fluctuation of the impoundment caused by normal operations may have some impact on the stability of the bank slopes of the upstream and downstream channels, so the sediment monitoring system includes monitoring of bank slopes. During the initial operations the monitoring of the bank slopes should be conducted carefully, to identify possible unstable rock blocks in the bank slope. Engineering measures such as cement laid stone masonry or gabion protection will be taken to stabilise the banks. This must be included in the operational costs. Spawning of the fishes generally lasts from March to June. Therefore, sand sluicing should not be performed during this period. The silt carrying flow that may affect egg-laying should be prevented from flowing into the downstream river channel. Therefore, the gates should be opened gradually and in sequence, to avoid a sudden increase of sand content. The outflow sediment content should be monitored during the sand sluicing and the downstream river channel. Moreover, the condition of the fishes should be monitored and investigated in the meantime, to inform the requirements of the outflow sand content. Besides, considering navigation and regular life of downstream inhabitants, the gates should be opened gradually to avoid a quick change of upstream and downstream water levels. 4.7 Numerical Simulation of Reservoir Sedimentation Report The developer used a two-dimensional mathematical model to simulate the sediment evolution in the impoundment. They used the 1/5000 topographic map, daily flow and sediment concentration at the Sanakham dam site from 1971 to 1980 and the grain composition of suspended load (CNR’s data) and the bedload. The model is based on the sedimentation dynamics of shallow water sediment transport. The model is set up from the section 5km upstream of the dam, as the inlet boundary condition and taking the normal storage level and desilting operation mode as the control condition of the outlet

15
water level. After 10 years, 20 years and 30 years of operations, the outflowing sediment rate would be 70.1%, 76.5% and 74.4%, of the inflows respectively. The impoundment volume at the normal operating level of 220 m would be decreased from 863 million m3 to 508 million m3, or about 118 million m3 in 10 years. The impoundment volume lost after 30 years of operation is about 41%. The active storage of the impoundment at normal storage level of 220 m~219 m would be reduced from 72 million m3 to 63 million m3, or about 3 million m3 in 10 years, the active storage loss rate after 30 years of operation is about 12.5%. In the first 30 years of operation, the annual average impoundment volume loss is about 1.4%, and the annual average active storage loss is about 0.41%. The impoundment storage loss in the first 30 years of operation is consequently significant. The sediment in the Sanakham impoundment area tends to accumulate along with the operation years. The talwegs at the near-dam section and the tailwaters elevate, showing that the sedimentation in these sections is severe. Sediment management will entail fully opened sluice gates. So, the changes in sediment concentration and particle size of outflowing sediment are relatively large. However, this is expected to match that of the inflowing sediment. Sluices are arranged on the left and right sides for flood release and / or sand discharge. The left sluice is primary for flood release. The river reach upstream of the dam mainly flows towards the left bank. The right sluice is located at the talweg of the original river course. In the first 30 years of operation, the sediment would occur mostly near the talweg, and only a small quantity of sediment would be deposited at the right sluice. The sedimentation with a maximum thickness of 2.4 m and silted elevation of 192.4 m is expected to occur at the upstream side of No.15~No.16 gates. 4.8 Navigation Channel Sedimentation Report When the SNHPP starts its operation sedimentation that may be harmful for shipping may occur at the entrance of the lower approach channel. The developer has completed a study on the riverbed and channel situation of downstream of the dam to confirm these risks. This was intended to understand the sediment deposition in the approach channel during operations, and to analyse and evaluate the sand sluicing effect of the channel silt-releasing sluice. This study concludes:
(1) When the reservoir inflow is between 4,410 m3/s and 5,500 m3/s, the velocity of longitudinal flow parallel to the ship route appears to be less than 2.0 m/s, the velocity vertical to the ship route would not exceed 0.3 m/s and the backflow velocity would not exceed 0.4 m/s. When the reservoir inflow is 16,300 m3/s and
16
17,800 m3/s, the navigation requirements could be satisfied by controlling the gate open mode and the flow regime upstream of the dam.
(2) Sedimentation at the entrance of upper approach channel is slow since it is affected by the backflow area. The sedimentation occurs mainly in local area inside the outer guide wall of the upper approach channel, while the sedimentation outside the outer guide wall would be washed out of the reservoir during flood operations on the left bank. The maximum siltation thickness at the entrance area of the upper approach channel after 2-years of operation would be about 0.08 m; after 5-years it will be 0.32 m and after 10-years 0.74 m.
(3) According to analysis, sediment deposition in the approach channel is expected
to be relatively small. Sedimentation appears in the shape of sand bar at the channel tail in the entrance area, which is about 70 m long and the siltation thickness is 0.3-1.3 m.
(4) According to the calculations, flow velocity in the approach channel is sufficient
to move the sediments through the system. Navigation would therefore not be affected by sedimentation.
The study suggests that the operator and administrative authority of the project should undertake sediment monitoring of the approach channel and its entrance area and carry out navigation channel maintenance by desilting or dredging if the navigation is influenced by the sediment. 4.9 Hydraulic Physical Model Investigation of Filling and Emptying System Report The developer has submitted a separate report to outline the hydraulic model investigation on the filling and emptying system. This verifies and optimises the hydraulic characteristics of the system and also supports the detailed layout of the system. According to the detailed layout study and the hydraulic calculation analysis, there are two possible filling and emptying systems: 1) two lock wall culverts with bottom centred lateral-manifold and 2) in-chamber bottom longitudinal culvert system. The physical model results recommend the in-chamber bottom longitudinal culvert system. The hydraulic model tests have been carried out under two design conditions: maximum lift condition and lowest upstream water level conditions to determine the operations of filling and emptying valves, opening time for valves and operation pattern. Four opening times for the valves (5 min, 6 min, 7 min and 8min) and two operation patterns (Normal two-valve synchronously and single valve) have been tested. The results recommend a valve opening time of 6 min both for filling and emptying. The filling and emptying time under above valve opening patterns are 9.62 min and 9.98 min. 4.10 Social Impact Assessment

17
The Social Impact Assessment (SIA) is part of a package of socio-economic issues comprising of the SIA itself, the Social Management and Monitoring Plan, and the Resettlement Action Plan, each of which is summarised below. The main objectives of the SIA are:
§ To examine the existing conditions of the human environment and the socio-economic and cultural status of the potentially affected areas and communities.
§ To identify and analyse the potential socio-economic and cultural impacts related to project design, construction and operation, and recommend cost effective mitigation measures for the significant negative impacts.
§ To set out principles for and record the participatory stakeholder consultations, particularly with affected people, and
§ To provide a cost estimate for the required mitigation measures. The methodology used involves a desk study of existing Lao law and regulations, socio-economic studies, field surveys including household census, and village interviews and meetings. The SIA also presents the links with the Environmental Impact Assessment and emphasises the exchange between the biophysical and socio-cultural discipline teams, from water levels, navigation and tourism activities, and fisheries and fish biology to socio-economic issues. The review of social policy and legal framework covers legislation 2005 to 2011 and respective government agency roles in compensation and resettlement, environmental and social impact assessments, hydropower environmental and social sustainability, ethnic groups, cultural and archaeology, tourism and land management. The legal framework review also touches upon international conventions and practices such as those of the World Commission on Dams, the World Bank, and the Mekong River Commission. The SIA then gives an overview of the socio-economic situation in Lao PDR, and Vientiane and Xayaburi Provinces, with information dating back to 2005-2010. The main land use in the project catchment area in the Pak Lay and Kenthao districts of Xayaburi Province and Sanakham District of Vientiane Province, are farming (for 80% of the population), mainly in rice for subsistence consumption, and fruit trees, and some livestock raising. Riverbank gardening is popular. The SIA provides detailed information on the health and education situations in these provinces and the related districts such as malnutrition rates, main causes of death and diseases. Regarding the more directly affected population, the SIA identifies three groups as follows: • Group 1 – Upstream and communities Directly Affected, living near construction
sites: 13 villages of which three with 267 families (1,127 people having houses and farmland submerged) require resettlement. Another 10 villages will be partially affected, not totally inundated, from which families will require relocation to higher ground. The SIA gives a very detailed account of the socio-economic situation, livelihood options, poverty profile and vulnerability (the disabled, mentally ill and

18
landless) and gender balance for these villages. Fishing is practised on a small scale in the rice field ponds mainly for household consumption. The average income per household is from 1,400 – 1,660 USD/per annum, which when translated to income per person, is below the international poverty line, and just above the Lao line.
Figure 7 Donsok Health Center (Left) and Left-River-bank Gardening by Woman at Ban Donsok (Right)
• Group 2 – Upstream less directly affected villages: 17 villages (3,929 families –
19,282 people) affected due to morphology changes, of which ten villages (354 families – 1808 people) will need relocation due to partial flooding. There is also a detailed account of the socio-economic situations in these villages, with figures showing the average income falling slightly below the Lao poverty line.
• Group 3 – two villages living near the quarry sites and one near the construction sites (2,106 people). In these villages the annual income for households is relatively high at nearly 6,000 USD.
Consultation with the potential affected villages showed that from 60% to 75% of people interviewed (over one thousand families) were reported to agree with the project, with the rest disagreeing or being unsure of the project. Study of women and vulnerable groups showed concerns over loss of housing, land and plantation areas, and loss of community properties such as schools and health centres. The SIA provides a detailed account of information on communities, including on the Thai side of the river, up to 100km downstream of the SNHPP, following MRC Strategic Environmental Assessment 2010 guidelines. For brevity this information will be covered in the section discussing the transboundary and cumulative impact assessment.
Figure 8 Participation of Vulnerable Groups in ESIA at Ban Khae (Left) and Ban

19
Donmen (Right) The SIA identifies potential impacts during various phases of pre-construction, construction and operation related to in-migration, health risks, displacement, livelihood losses including fishing. The overall impact significance was classified as medium with displacement and livelihood changes being rated high. There is a detailed list of mitigation measures for each type of impact, which comprise of resettlement and relocation, regular consultation and monitoring, training, through various mechanisms including community development funds. The total cost for resettlement is estimated to be US$ 23.3 million. The annexes include descriptions of the affected villages and records of meetings with these villages. 4.11 Social Management and Monitoring Plan The Social Management and Monitoring Plan (SMMP) is developed from the SIA study and is a project requirement under Government of Lao legislation. The overall objective of the SMMP is to improve the welfare of the people living in the project area who might be adversely affected by the project. The report defines and recommends the procedures that the project developer should follow during and after construction. The SMMP is developed under the following guiding principles:
§ Minimize the resettlement of the Project Affected Population (PAPs). § Provide adequate funding and support from the project to ensure that the living
standard of PAPs is restored to at least the same level as prior to the project development.
§ Allow PAPs to participate in the design, planning and implementation of the Resettlement Action Plan (RAP).
§ Identify gender and ethnic group concerns and include their specific needs and perspectives in all components, strategies and planned activities.
§ Maintain the social and cultural cohesion of villages to minimize cultural and livelihood disturbance.
§ Provide adequate livelihood restoration activities and infrastructure to minimize livelihood disturbance.
§ Have a transparent methodology for all planning, implementation and compensation tasks.
The SMMP also includes:
§ Institutional responsibilities. § Budget estimations. § Time and duration schedules. § Internal and external monitoring plans.
The SMMP covers similar issues to the SIA such as livelihoods, population, resettlement

20
with differentiated needs for men and women. It has a detailed list of potential social impacts, their significance, corresponding mitigation measures and responsible parties. There is also a list of potential losses and compensation principles covering the provision of land, cash, housing materials, basic infrastructure and training. A list of qualitative and quantitative monitoring indicators including gender related dimensions has been included for during and after project construction. The budget proposed for the SMMP is estimated to be US$ 274,120 per annum for eight years of construction and another 23 years of operation. The latter will include agriculture and forestry extension, fishery programmes, health and education outreach, community support and a social development fund. 4.12 Resettlement Action Plan The Resettlement Action Plan (RAP) is based on the SIA. A total of 2,935 people in 621 families will require resettlement (1,127 people to new villages) or relocation (1,808 people to higher ground in the same villages). These groups will be the main target population for the RAP. The main aims of the RAP report are:
§ Enhance the quality of life of project affected people. § Prevent or minimize the adverse social impacts that may be created from the
backwater effects of the project. § Mitigate these possible impacts through land and asset compensation and
infrastructure support facility and other support. The methodology in preparing the RAP involves a census survey of affected people, consultations including focus group meetings on resettlement site selection and responses to this feedback. A detailed list of potential impacts regarding loss of land and assets including community assets is provided together with mitigation measures. Resettlement and relocation sites have also been identified. A range of livelihood options are provided for resettled households including agriculture, livestock, community or private plantation, aquaculture (in the reservoir and fishponds) and non-farm employment and cottage industry. The figure below, taken from the RAP document, shows the institutional arrangements for the RAP.

21
Figure 9 Proposed Organization Set-up for SNHPP SMMP
(WREA – Water Resource and Environment Administration; EMU – Environment Management Unit, SMU – Social Management Unit; ESMI – Environment and Social Management Inspection; EMO – Environment
Management Office; SMO – Social Management Office) The summary of the compensation and resettlement cost is presented in Table 2.
Table 2: The compensation, resettlement and monitoring cost No. Items Construction (8 Years) Operation (23
Years) Environmental 1,358,872 1,500,170
1 EMMP 1,358,872 1,500,170 Social 23,441,518 180,000
2 Compensation 2,140,000 0
3 Resettlement Site Development
16,105,950 0
4 Livelihood Restoration Programme
5,101,448 0
5 Social Development Programme
94,120 180,000
Monitoring 70,000 85,000 6 Internal Monitoring 30,000 40,000 7 Independent Monitoring 40,000 45,000
Sub Total 24,870,390 1,765,170 Contingency (4%) 1,065,422 Grand Total 27,700,983

22
4.13 Environmental Impact Assessment The Environmental Impact Assessment (EIA) report is summarized in the five following key parts: (1) The key physical, chemical and biological data and information collected:
• Hydrology: The average annual discharge (Q) at Sanakham Station is 4,146 m3/s,
with the maximum discharge of around 22,600 m3/s in August and September, and the minimum discharge of 540 m3/s in March.
• Surface water quality: In the dry season, the water quality upstream, downstream and around SNHPP site was very good based on the DO, pH, TDS, TSS, NO3, NH3, turbidity, and coliform bacteria results. No heavy metals were detected at the project site. No results of surface water quality sampling in wet season were provided.
• Erosion and sedimentation: The major proportion of the sediment load (roughly
75%) is transported during the wet season (during May-October), with the peak loads (approximately 40%) occurring in August coinciding with the peak discharge in the river at the same period.
• Terrestrial ecology (Flora): Most of the project area located in unstocked forest,
bamboo forest, swidden areas, plantations or other agricultural land.
• Terrestrial ecology (Fauna): Three endangered mammal species, identified from the survey list, are the Asian elephant, Banteng or wild cow, and Duoc Langur. In the study area, other animal species were reported including: tigers, monkeys, deer, turtles, softshell turtles, water monitor, flying lizard, python, king cobra, Siamese fire back, and peafowl species.
• Protected area: The Project area does not adjoin any National Biodiversity
Conservation Areas. However, it lies within the proposed provincial protection forests, special spirit pool forests.
Figure 10: Water quality sampling sites

23
• Aquatic ecology, with the record of phytoplankton and zooplankton, benthic invertebrates, aquatic plants, and 43 fish species, with the detection of one Critically Endangered (CR) species, Jullien’s Golden Carp (Probarbus jullieni), and no Mekong giant catfish recorded in all field sampling stations; and
• Fisheries activities: The fisheries activities near the Sanakham dam site and the upstream town are less prevalent, subsistence fisheries and a small amount of fish sold at local markets. However, fisheries and related activities from downstream of the SNHPP site, particularly at Keng Mai, the rapids area; (2) the mouth of Nam Houng tributary; and (3) the river confluence with the Nam Mee tributary, are very important for household food security and income.
(2) The key environmental impacts during the construction phase are identified as
follows: • Impacts from the increase of sediment transport and higher flow velocities due
to the construction of SNHPP and coffer dams. • Impacts from the increase of TSS and the leakages of oils and chemical spills with
the increase of BOD concentration as a result of site clearance, earthwork activities, and sewage water from the construction camps.
• Impacts from the increase of turbidity and siltation caused by earthwork activities affecting the phytoplankton, benthic organism and fish populations.
• Impacts from water pollution and solute nutrients, generated from constructing activities inducing eutrophication in downstream aquatic ecosystems and the increase of pathogenic organisms.
• Impacts on fish migration, affecting fish species with long distance migration patterns and those that spawn in rapids or submerged vegetation; and
• Impacts on the long-term loss of vegetation in in construction area.
(3) The key environmental impacts during the operation phase are summarised in the following points: • Impacts from improper disposal of waste materials, especially organic waste
materials causing substantial environmental damage which could seriously pollute soil, water and air.
• Impacts from oil contamination to surface water quality of the Mekong due to the maintenance of the turbine systems.
Figure 11: Aquatic ecological sampling

24
• Impacts on the increase of backwater level and inundation hazard during high
flow events.
• Impacts from the changes of flow conditions. These will cause the loss of habitats with rapids, riffles and deep pools throughout the entire river stretch from the dam to the upper reservoir tail water, including considerable reduction in spawning and production areas and dry season habitat for rheophilic Mekong species (which require flowing water) and certain more sedentary type fish species expected; and
• Impacts from fragmentation and reduction of wildlife habitat due to permanent
change to long reservoir along the Mekong River. It could be expected that the Project’s permanent infrastructures will block the movement of wildlife, particularly, mammals.
(4) The key mitigation measures recommended include:
• Regular performance and appropriate techniques of water quality monitoring. • Removal of surplus vegetation in the reservoir area prior to impoundment. • Borrow pit material extraction to minimize erosion. • Distance of waste slag in the reservoir area from water inlets. • Completion of the reservoir site construction before implementation of water
pumped storage to protect wildlife remaining in the reservoir from the flood. • Monitor the downstream situation for any unusual erosion. • Undertake precautionary bank stabilization in the reservoir in susceptible areas; • Undertake vegetation clearance before the nesting season of birds. • Support local conservation initiatives to protect high-value habitat or
endangered species. • Establishment of a Wildlife Conservation and Management Unit in collaboration
with government. • Conduct environmental education and awareness programmes. • Development of a wildlife management Plan and a habitat restoration
programme. • Construct a Project fish passage facility to mitigate impacts on migratory fish;
and • Establish a fisheries research station near the project area, including fish
transport mobile unit with large container and aeration system.
(5) The public consultation and public disclosure of the project is detailed in Chapter 8 of the EIA report and the key feedback from different stakeholders includes the proposed RAP according to the plan; the arrangement of traditional ceremonies; additional assistance from the project; and concerned issues on cumulative and transboundary impact assessments.
25
4.14 Environmental Management and Monitoring Plan The Environmental Management and Monitoring Plan (EMMP) consists of three key components as follows: (1) The proposed key environmental mitigation measures for implementation during
the construction phase are: earthmoving activities; borrow pit material extraction; spoil disposal areas arrangement; the release downstream according to the season and environmental flows; removal of surplus vegetation; tube well installation in downstream villages; prevention of degradation of aquatic habitats and loss of ecosystem integrity due to changes in flow patterns; construction of a fish passage facility; a fishery research station near project area; a fish transport mobile unit with a large container and an aeration system; and adoption of aquaculture solution.
(2) The proposed key environmental mitigation measures for implementation during the operations phase are: engagement of a public information network; the early water release in the wet season of the first short natural flood event ( around 3 to 5 day duration); regular monitoring on signs and indicators of any impacts from discharging sediment hungry waters downstream; development of the management plan for wildlife and Non-Timber Forest Product (NTFP) collection and the provision of monitoring and policing of the wildlife trade; and the establishment of an Integrated River Basin Management Plan for the GoL.
Mitigation measures for cumulative and transboundary impacts have been addressed through the development of management techniques consistently, a shared learning experience and economic benefits, and the existing cooperation with the Mekong River Commission aimed at minimising the loss of the river fisheries, and the sharing information on flows. (3) The proposed key environmental monitoring programmes are summarized as
follows: a visual inspection on erosion and sediment control according to the season, river water quality monitoring with routine water sampling and monthly reservoir water temperature monitoring.
The exact monitoring sites for the abovementioned programmes have not been provided in the report. The details of monitoring programmes for aquatic ecology and fish have not been described.
The 17 key EMMP sub-plans in Annex A of EMMP report are:
• Erosion and Sediment Control. • Spoil Disposal Planning and Management. • Water Quality Monitoring Plan. • Emergency Plan for Hazardous Materials. • Vegetation Clearing Plan. • Waste Management and Disposal Plan; and • Environmental Training for Workers Plan.

26
Total budget for implementing the proposed environmental and social mitigation measures and monitoring programmes is US$27,700,983 or about 1.3% of total Project cost (US$2,073,000,000). The implementation of EMMP will cost around US$2,859,042, which includes US$1,358,872 during 8 years of construction and US$1,500,170 during the 23 years of operation, respectively. 4.15 Transboundary Environmental and Social Impact Assessment & Cumulative
Impact Assessment The report on transboundary environmental and social impact assessment (TbESIA) & cumulative impact assessment (CIA) is composed of seven chapters. This Overview of TbESIA & CIA report covers the following: (1) The scope of investigation
includes four key components: (a) key biophysical and social conditions before the proposed SNHPP project; (b) Hydrology and Sediment Change after the proposed SNHPP project; (c) Transboundary and Cumulative Impacts Issues; and (d) Mitigation and Management Interventions.
(2) Impact assessment zones are identified. This includes four zones; Zone 1: Thai-Laos – Pak Heuang to Ban Woenbuk; Zone 2: Southern Laos – Ban Woen buk to Cambodian border; Zone 3: Cambodia – Cambodia border to Viet Nam Border; and Zone 4: Southern Viet Nam – Viet Nam border to Mekong Delta.
(3) The approach and methodology for report preparation includes (1) desk reviews of
TbESIA & CIA related documents, (2) organized periodic workshops among the study teams and with the Chinese hydro engineers; (3) conducted expert surveys and consultations; (4) Sampling surveys and case studies in each zone (for social assessment only); and (5) modelling and scenarios assessment.
(4) The baseline and data collection
Data collection and the baselines of key physical, chemical and biological environments are summarized in Section 4.13 of the Environmental Impact Assessment.
Figure 12: The impact zones for the TbSEIA

27
Social baselines: The Transboundary Social Impact Assessment (SIA) presents the baseline in the 5 km corridor of the Mekong River in Thailand, Laos, Cambodia and Viet Nam. A detailed account of the social conditions regarding population, infrastructure, health and poverty in each of the four zones has been covered.
(5) Transboundary and Cumulative Impact Assessments have covered the hydrology, discharge and sediment; fish migration and fisheries; navigation; water quality; dam safety; climate change; and social aspects.
(6) Impact mitigation measures are identified for hydrology; fish migration and fisheries; navigation; sediment; and water quality. No mitigation measure for socio-economic transboundary impacts was discussed.
(7) Monitoring and adaptive management should be undertaken by the MRC and the
monitoring should be initiated before the construction starts, through construction, and be maintained throughout the operating period.
(8) Stakeholders participations and consultations: The report also presents the public
involvement process for the Sanakham project with stakeholders at four levels, namely village, district, national and regional, including MRCS experts, Cambodian, Lao and Vietnamese NGOs.
4.16 Fish Passage Facilities Design The fish and fisheries survey was done through secondary and primary data collection. The secondary data was gathered from literature and related documents. The primary data collection includes fish sampling in the dry (November 2010) and wet (July 2011) seasons at six sampling stations (upstream area at Houay Ting, upstream area at Keng Mai, upstream area at Ban Houay Thon, dam site area, downstream area before Nam Houng confluence, and downstream area at Houay Mee confluence), using suitable gears such as beach seine-nets, gillnets or cast nets depending on the characteristics of sampling areas. In addition to the fish sampling, fish market and fishing observation activities were conducted and recorded. A total of 43 fish species were found in both seasons during the field survey. Cyprinidae was a dominant family, accounting for about 40% in the catch. Many fish species migrated from the river into flooded areas during the onset of the rainy season and return to river habitats (e.g. deep pools) at the end of that period. The spawning ground for many fish species are in the tributaries. The Mekong River at Ban Keng Mai, 15 km upstream of Sanakham town, is known a good habitat for Probarbus jullieni during the early rainy season. Ten (10) fish species, Pangasianodon gigas, Cirrhinus microlepsis, Wallago attu, Pangasianodon hypophthalmus, Pangasius bocourti, Pangasius conchophilus, Pangasius larnaudii, Pangasius sanitwongsei, Bagarius yarrelli Sykes, and Probarbus jullieni, were selected as target species at the Sanakham hydropower project site when designing the natural like bypass fishway or imitative-ecological fishway.

28
The imitative-ecological fishway will be constructed on a terrace on the right riverbank, with an elevation of the terrace of about 216 m. There will be two inlets: one is near the estuary of Nam Hong tributary with elevation of the inlet baseboard at 206 m and another one in the Mekong River at the upper reaches of the Nam Hong estuary with the elevation of baseboard at 199m. Each inlet, at water depth of higher than 2 m and average flow velocity of about 1.1 m/s, will be equipped with a block chamber and a service gate in the block chamber and operates at water levels of 201.16 – 208.12 m. Luring facilities such as lighting and an electric screen for fish blocking will be constructed inside and outside of the inlet respectively based on the response to light, colour and sound given by fish. The full length of imitative ecological fishway channel is 2.48 km, with a gradient of 0.075 %. The imitative-ecological fishway section is a trapezoidal cross-section as shown in figure 13, with the bottom width of 5 m, top width of 6 m, and the water depth of more than 1.5 m. A pebble bed will be paved at the bottom and at the slopes on both sides facilitate fish movement. Grass will also be planted to fix the slope, and also several pools will be provided as resting pools for fishes. In addition to the inlet, an outlet is located in the reservoir (250 m upstream of the dam) at the water depth of 2 – 3 m, with the bottom elevation of 217 m, the bottom width of 5 m, and with trapezoidal open channel. The fishway outlet control section is located on the right bank auxiliary dam with 2 gates, 1 bulkhead gate and 1 service gate. The outlet operates at the normal operating water level range of 219 – 2020 m. The inlet and outlet will be a concrete structure at the early stage by laying the cobble and vegetation on the bottom and both sides, and then the concrete will be converted into the imitated natural like fishway. A jet flow will be placed in the inlet to provide a water discharge of at least 6.6 m3/s and flow velocity of 0.4 – 0.6 m/s for attracting the fishes into fishway. On the revetment at upper and lower reaches of imitated natural fishway, some evergreen vines will be planted about 1 m – 2 m above the highest water surface line, and some evergreen trees with underdeveloped roots will be planted about 5 m – 6 m above the water surface line to imitate the natural environment. The electric fish screen
Figure 13: Schematic diagram for cross-section of imitative-ecological fishway

29
will be ∠-shaped and 150m in length is placed in the lower reach of Sanakham power plant to guide fishes into the inlet. Another key part of the fishway facility is an observation facility used for recording a number of fish species passing through fishway; observing the fish adaptability and swimming; mastering the upstream rate and physical consumption of all kinds of fishes in fishway; analysing the quantity of fishes passing through and the relation with various environments, such as hydrology and water temperature; strengthening the understanding on fish activity habits and rules and guiding the operating practice of fishway; developing science popularization education activity; and improving the aquatic ecological protection consciousness.

30