Project Management Professional Development...
18
P ROJECT M ANAGEMENT P ROFESSIONAL D EVELOPMENT P ROGRAM Annual Performance Report - 2014
Transcript of Project Management Professional Development...
PROJECT MANAGEMENT
PROFESSIONAL DEVELOPMENT PROGRAM Annual Performance Report - 2014

Table of Contents
Executive Summary ................................................................................................................................ 1
Program Overview .................................................................................................................................. 2
Certification Programs ........................................................................................................................ 2
Professional Development Courses .................................................................................................... 2
Certification Programs ............................................................................................................................ 3
Competency Evaluations .................................................................................................................... 3
Participating Agencies ........................................................................................................................ 4
Participant Progress ........................................................................................................................... 5
Professional Development Courses ........................................................................................................ 6
Course Demographics......................................................................................................................... 6
Participants per Course .................................................................................................................. 7
Participants per Agency .................................................................................................................. 8
Course Evaluations ............................................................................................................................. 9
Course Material .............................................................................................................................. 9
Instructor Effectiveness .................................................................................................................. 9
Course Relevance to Job Duties ..................................................................................................... 9
Expectations Met .......................................................................................................................... 10
Overall Rating ............................................................................................................................... 10
Registered Education Provider Satisfaction Rating (PMI®) .......................................................... 10
Course Examinations Performance .................................................................................................. 11
Overall Exam Percentiles .............................................................................................................. 11
Exam Results by Course ................................................................................................................ 12
Exam Results by Agency ............................................................................................................... 13
Future Directions .................................................................................................................................. 14
Agency Outreach Initiative (continuing effort) ................................................................................ 14
Course Development ........................................................................................................................ 14
Learning Management System ......................................................................................................... 14

PM Professional Development Program Annual Performance Report Page 1 of 14
EXECUTIVE SUMMARY
The Project Management Professional Development Program, sponsored by the Georgia Technology Authority, continues to be enthusiastically accepted by state agencies and their personnel participating in program activities. The first graduating class of the project management certification program received their certifications this year. The program bestowed 15 individuals with either the Georgia Certified Project Manager certificate or the Associate Project Manager certificate. The PMP® Exam Preparation course has produced 6 new Project Management Professional (PMP®) credential holders for the State of Georgia that did not exist last year. Participation levels in the certification programs and the professional development courses remain high, and interest continues to rise. Participation increased from 66 individuals across 19 agencies to 90 individuals across 28 agencies, while participation in the professional development courses increased from 322 individuals across 17 agencies to 544 individuals across 28 agencies. The large response is primarily attributable to word-of-mouth by individuals telling their colleagues about the courses. Agency participation from business and management-level folks continues to be high as these customers demonstrate a desire to understand project and portfolio management in a way that will enhance their ability to execute and deliver on the agencies’ strategic goals through project management. Participants continue to express their approval of the courses with evaluation scores showing 99% satisfaction with the instructor, 99% stating that expectations were met, and a 99% overall satisfaction rating. The program continues to gauge the evaluations for improvement opportunities. Participants are also scoring well on course exams. Based on exam results, 96% of participants achieved passing scores and more than 77% of participants scored a 90% or higher score on their exams.
The Competency Assessment for participants in the certification program continues to indicate there is work to be done to improve project management competencies within the State. Because the course objectives in the program are mapped to the competency framework, an individual will be able to target the areas of improvement as well as bolster areas of strength. The program has reached its full complement of course offerings and continues efforts in course improvement. The agency outreach initiative is underway and has delivered seminars for the Georgia Student Finance Commission and the Department of Community Affairs this year. Additional seminars in Leadership and Organizational Change are in the planning stages. A Learning Management System is being reviewed for implementation and better course development tools are being procured. This will greatly expand our reach and serve a larger segment of the state government’s project management market on a more timely and efficient basis.
Believing that project management is the execution mechanism for delivering agency and state strategic objectives it becomes imperative to increase project management performance competencies and personal attribute competencies of project managers and other project personnel. The Project Management Professional Development program facilitates this through its program offerings. The following report discusses the accomplishments and direction of the program.
PM Professional Development Program Annual Performance Report Page 2 of 14
PROGRAM OVERVIEW
The program is at its target number of course offerings and fully implemented. The two certification programs, the Georgia Certified Project Manager (GCPM) and the Associate Project Manager (APM) certification programs have produced the first class of graduating recipients. The program shows all signs of marching toward its objective of achieving a business-focused project management practice across state government.
The definition of project management as stated in the PMBOK® Guide is “the application of knowledge, skills, tools, and techniques to a broad range of project activities to meet the requirements of the project.” The program supports this definition through the use of competency assessments, development courses, and individual mentoring. Each development activity has the student’s professional development in mind by first determining the need and then applying the appropriate development activity that fills a gap in knowledge, skills, tools, or technique. This approach will advance the practice and competency of project management across state government.
Certification Programs
The two programs have grown this year from 66 participants across 19 agencies to 90 participants across 28 agencies. A major milestone was achieved this year as 15 participants attained their certifications, 3 received the Georgia Certified Project Manager certificate and 12 received the Associate Project Manager certificate. We are excited about the overwhelming support for this program and the enthusiasm from its participants. The agency business community continues to express a desire to understand project and portfolio management in a way that will enhance their ability to meet the agencies’ business objectives and constituent needs. The awareness of the program has a solid foundation and more individuals are expressing a desire to participate and achieve one or both certifications. We are continuing to examine the feasibility to include an executive-level certification that was recommended by some of the business folks participating in the program.
Professional Development Courses
The purpose of the Project Management Professional Development Program is to enhance and increase the competencies of project managers within Georgia state government. This is being accomplished by concentrating on development initiatives that are based on industry best practices, standards, and processes. The program supports 15 courses designed to build the project manager and personal attribute competencies described in the Competency Framework. Participants are tested in each course on their understanding and knowledge of course objectives.
PM Professional Development Program Annual Performance Report Page 3 of 14
CERTIFICATION PROGRAMS
Competency Evaluations
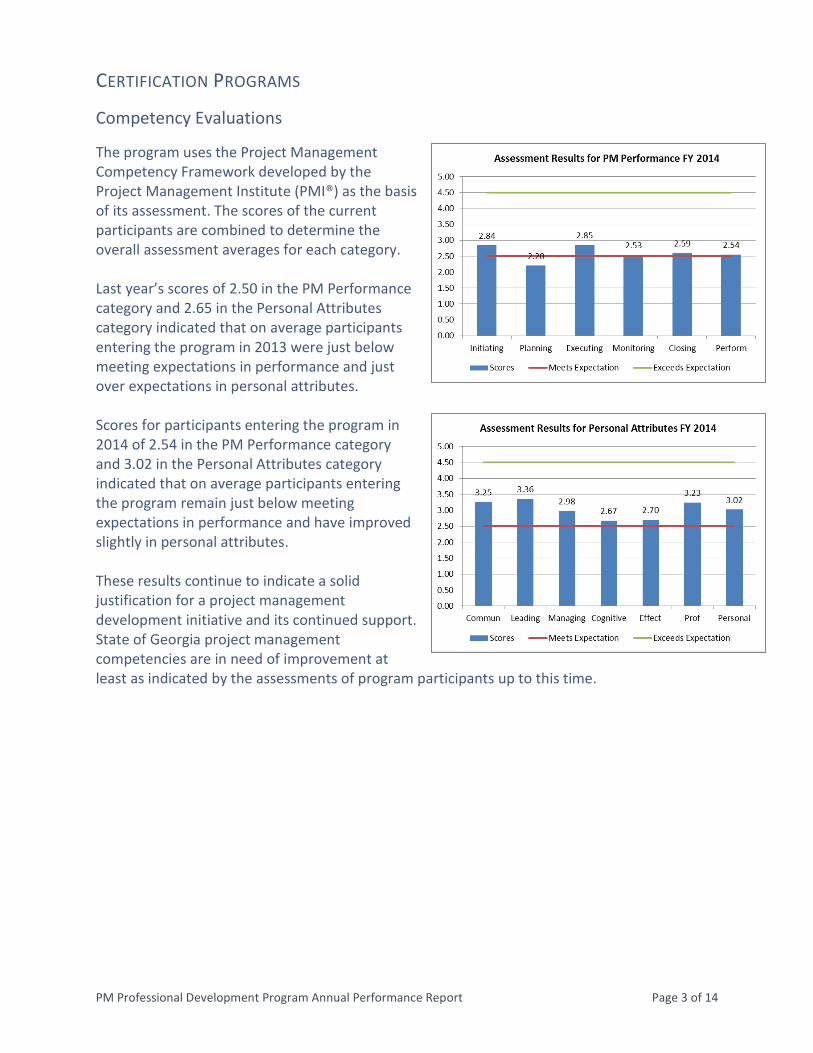
The program uses the Project Management Competency Framework developed by the Project Management Institute (PMI®) as the basis of its assessment. The scores of the current participants are combined to determine the overall assessment averages for each category. Last year’s scores of 2.50 in the PM Performance category and 2.65 in the Personal Attributes category indicated that on average participants entering the program in 2013 were just below meeting expectations in performance and just over expectations in personal attributes. Scores for participants entering the program in 2014 of 2.54 in the PM Performance category and 3.02 in the Personal Attributes category indicated that on average participants entering the program remain just below meeting expectations in performance and have improved slightly in personal attributes. These results continue to indicate a solid justification for a project management development initiative and its continued support. State of Georgia project management competencies are in need of improvement at least as indicated by the assessments of program participants up to this time.
PM Professional Development Program Annual Performance Report Page 4 of 14
Participating Agencies
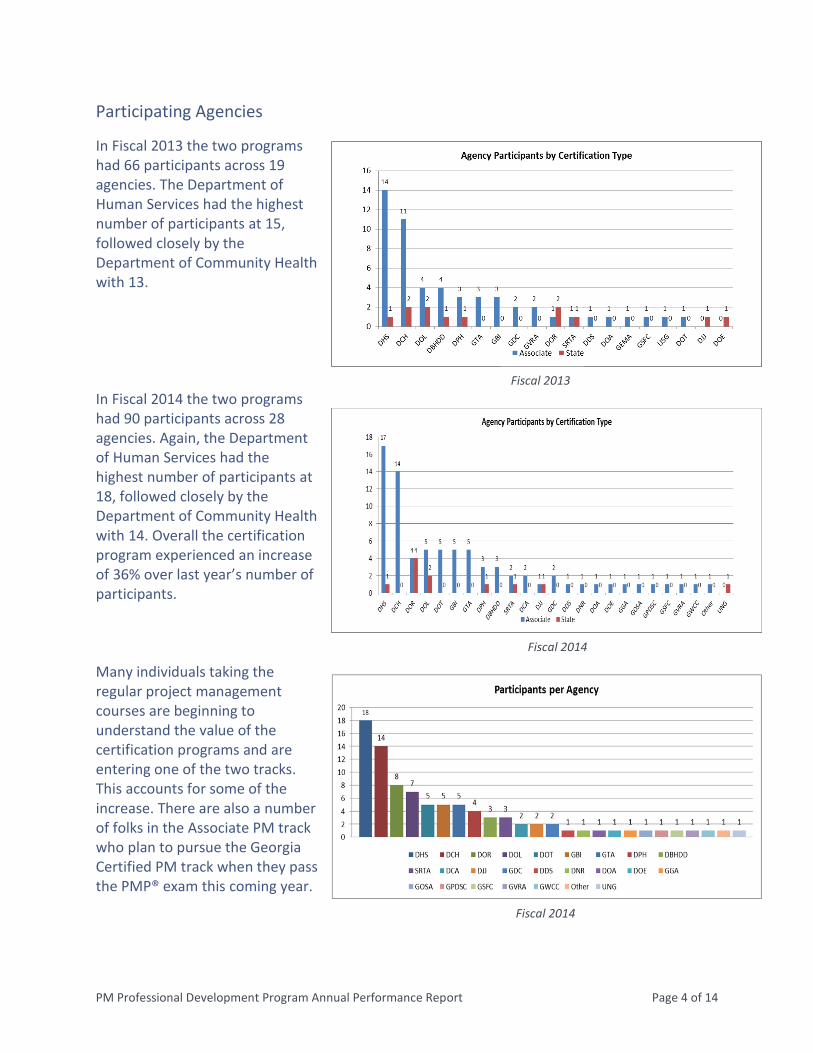
In Fiscal 2013 the two programs had 66 participants across 19 agencies. The Department of Human Services had the highest number of participants at 15, followed closely by the Department of Community Health with 13. In Fiscal 2014 the two programs had 90 participants across 28 agencies. Again, the Department of Human Services had the highest number of participants at 18, followed closely by the Department of Community Health with 14. Overall the certification program experienced an increase of 36% over last year’s number of participants. Many individuals taking the regular project management courses are beginning to understand the value of the certification programs and are entering one of the two tracks. This accounts for some of the increase. There are also a number of folks in the Associate PM track who plan to pursue the Georgia Certified PM track when they pass the PMP® exam this coming year.
Fiscal 2013
Fiscal 2014
Fiscal 2014
PM Professional Development Program Annual Performance Report Page 5 of 14
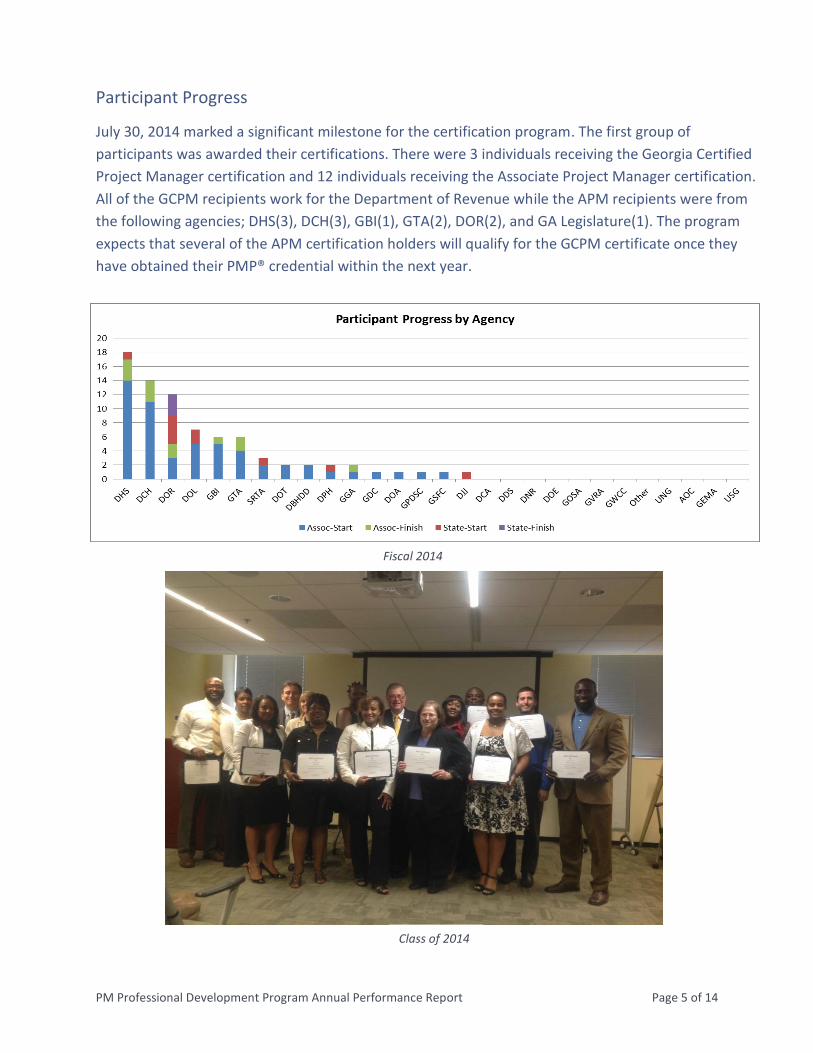
Participant Progress
July 30, 2014 marked a significant milestone for the certification program. The first group of
participants was awarded their certifications. There were 3 individuals receiving the Georgia Certified
Project Manager certification and 12 individuals receiving the Associate Project Manager certification.
All of the GCPM recipients work for the Department of Revenue while the APM recipients were from
the following agencies; DHS(3), DCH(3), GBI(1), GTA(2), DOR(2), and GA Legislature(1). The program
expects that several of the APM certification holders will qualify for the GCPM certificate once they
have obtained their PMP® credential within the next year.
Fiscal 2014
Class of 2014
PM Professional Development Program Annual Performance Report Page 6 of 14
PROFESSIONAL DEVELOPMENT COURSES
Course Demographics
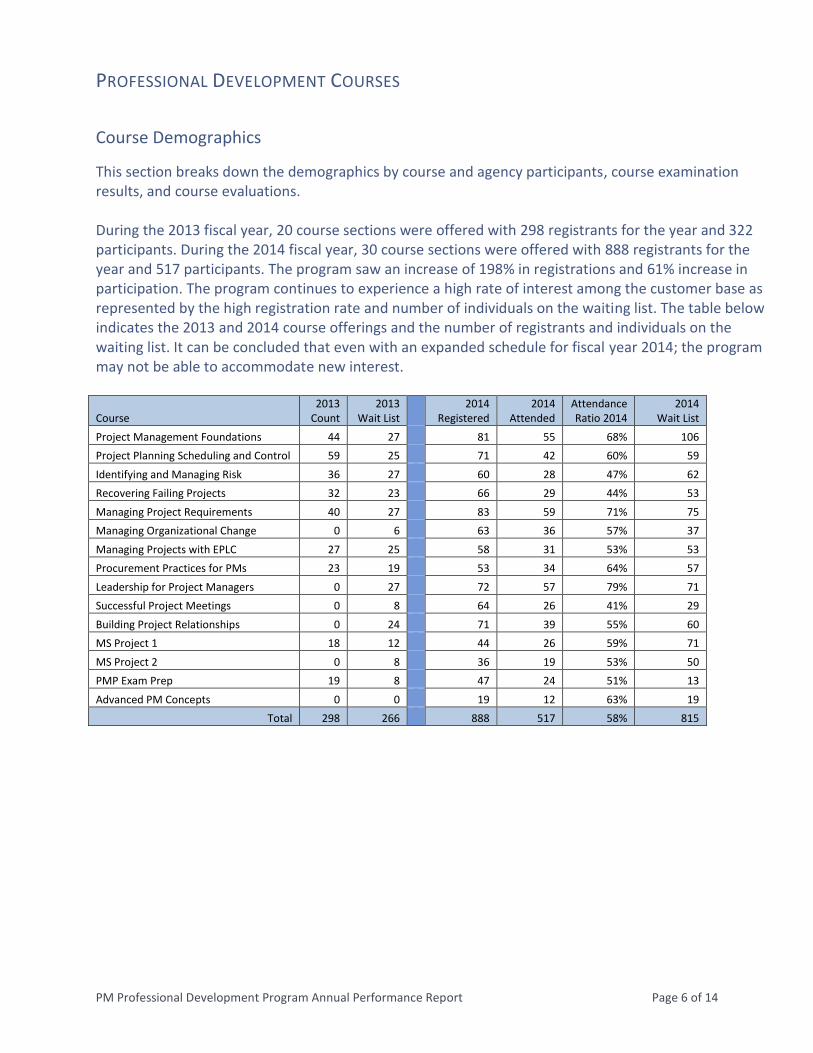
This section breaks down the demographics by course and agency participants, course examination results, and course evaluations. During the 2013 fiscal year, 20 course sections were offered with 298 registrants for the year and 322 participants. During the 2014 fiscal year, 30 course sections were offered with 888 registrants for the year and 517 participants. The program saw an increase of 198% in registrations and 61% increase in participation. The program continues to experience a high rate of interest among the customer base as represented by the high registration rate and number of individuals on the waiting list. The table below indicates the 2013 and 2014 course offerings and the number of registrants and individuals on the waiting list. It can be concluded that even with an expanded schedule for fiscal year 2014; the program may not be able to accommodate new interest.
Course 2013
Count 2013
Wait List 2014
Registered 2014
Attended Attendance Ratio 2014
2014 Wait List
Project Management Foundations 44 27 81 55 68% 106
Project Planning Scheduling and Control 59 25 71 42 60% 59
Identifying and Managing Risk 36 27 60 28 47% 62
Recovering Failing Projects 32 23 66 29 44% 53
Managing Project Requirements 40 27 83 59 71% 75
Managing Organizational Change 0 6 63 36 57% 37
Managing Projects with EPLC 27 25 58 31 53% 53
Procurement Practices for PMs 23 19 53 34 64% 57
Leadership for Project Managers 0 27 72 57 79% 71
Successful Project Meetings 0 8 64 26 41% 29
Building Project Relationships 0 24 71 39 55% 60
MS Project 1 18 12 44 26 59% 71
MS Project 2 0 8 36 19 53% 50
PMP Exam Prep 19 8 47 24 51% 13
Advanced PM Concepts 0 0 19 12 63% 19
Total 298 266 888 517 58% 815
PM Professional Development Program Annual Performance Report Page 7 of 14
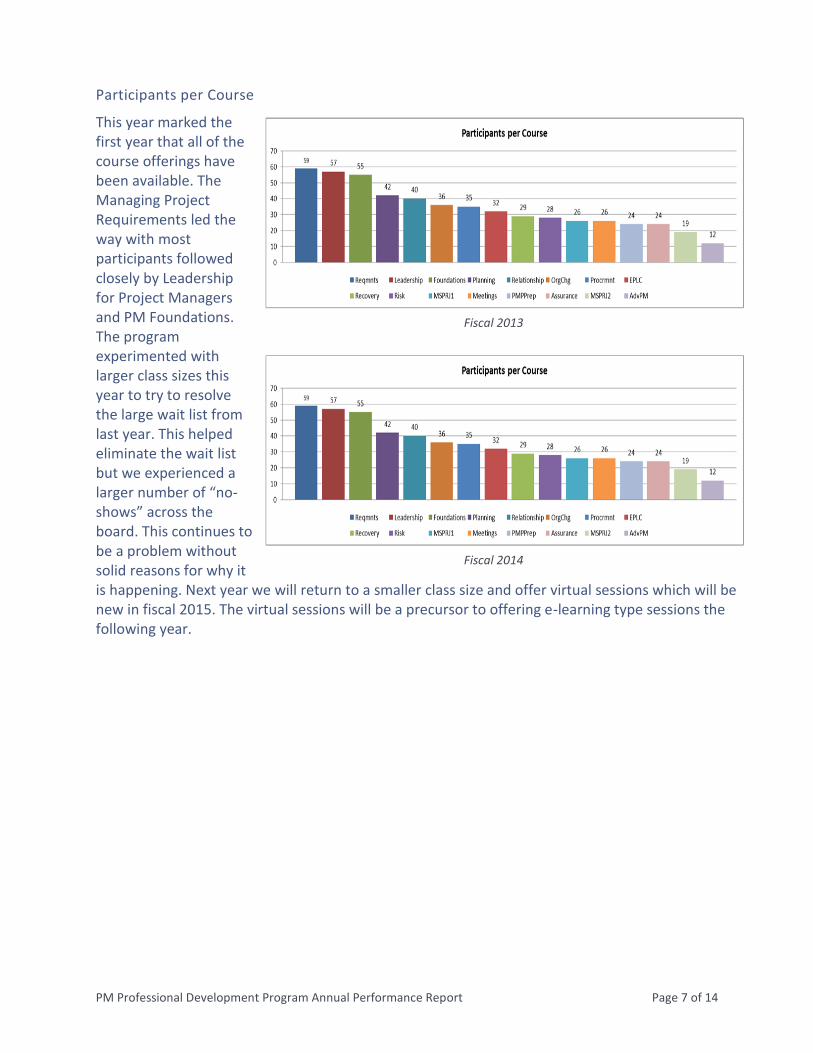
Participants per Course
This year marked the first year that all of the course offerings have been available. The Managing Project Requirements led the way with most participants followed closely by Leadership for Project Managers and PM Foundations. The program experimented with larger class sizes this year to try to resolve the large wait list from last year. This helped eliminate the wait list but we experienced a larger number of “no-shows” across the board. This continues to be a problem without solid reasons for why it is happening. Next year we will return to a smaller class size and offer virtual sessions which will be new in fiscal 2015. The virtual sessions will be a precursor to offering e-learning type sessions the following year.
Fiscal 2013
Fiscal 2014
PM Professional Development Program Annual Performance Report Page 8 of 14
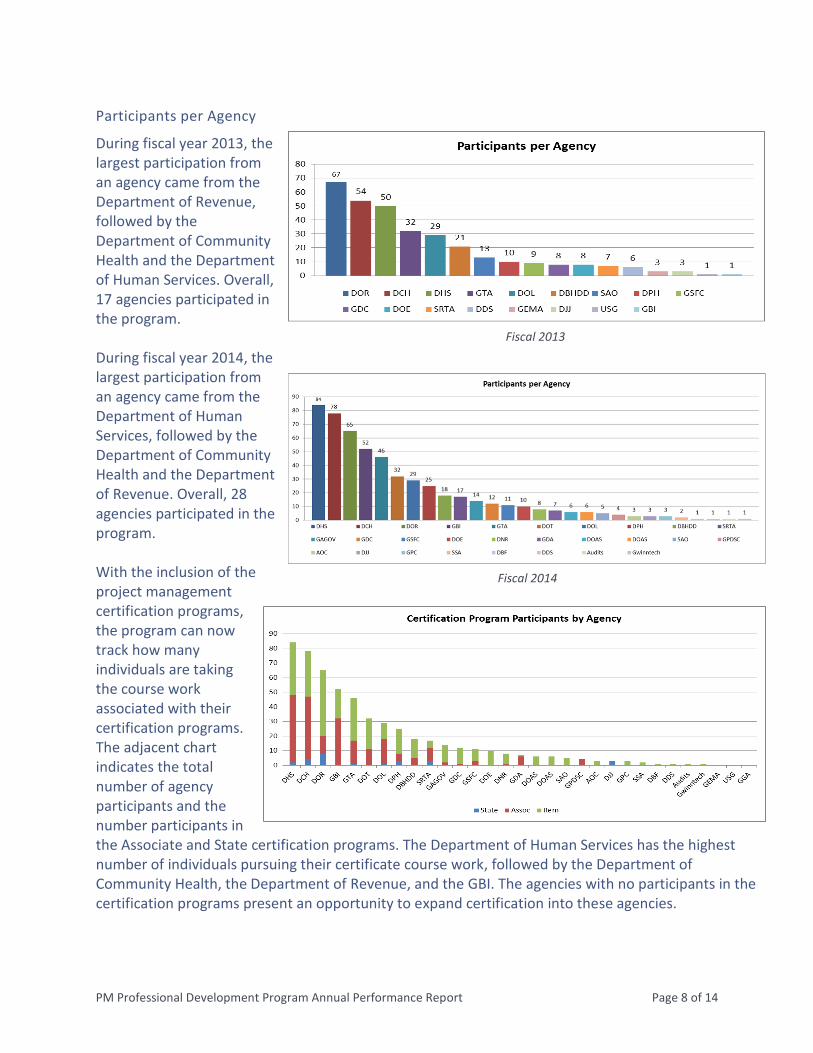
Participants per Agency
During fiscal year 2013, the largest participation from an agency came from the Department of Revenue, followed by the Department of Community Health and the Department of Human Services. Overall, 17 agencies participated in the program. During fiscal year 2014, the largest participation from an agency came from the Department of Human Services, followed by the Department of Community Health and the Department of Revenue. Overall, 28 agencies participated in the program. With the inclusion of the project management certification programs, the program can now track how many individuals are taking the course work associated with their certification programs. The adjacent chart indicates the total number of agency participants and the number participants in the Associate and State certification programs. The Department of Human Services has the highest number of individuals pursuing their certificate course work, followed by the Department of Community Health, the Department of Revenue, and the GBI. The agencies with no participants in the certification programs present an opportunity to expand certification into these agencies.
Fiscal 2013
Fiscal 2014
PM Professional Development Program Annual Performance Report Page 9 of 14
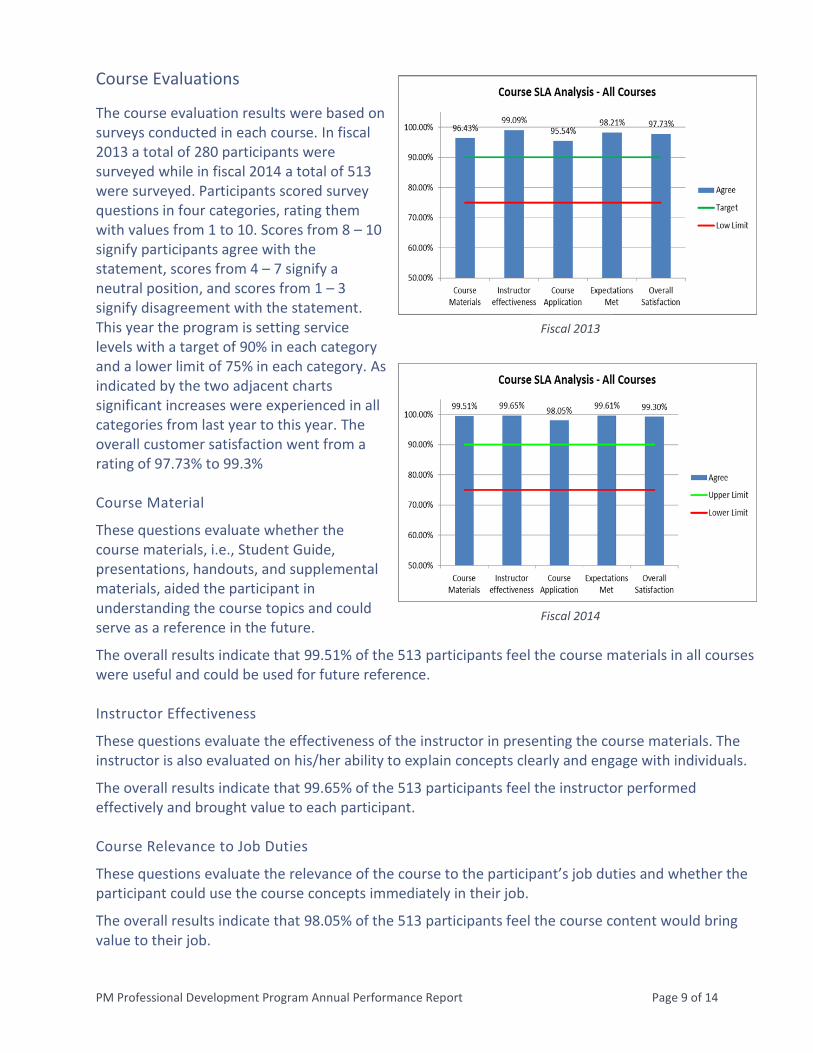
Course Evaluations
The course evaluation results were based on surveys conducted in each course. In fiscal 2013 a total of 280 participants were surveyed while in fiscal 2014 a total of 513 were surveyed. Participants scored survey questions in four categories, rating them with values from 1 to 10. Scores from 8 – 10 signify participants agree with the statement, scores from 4 – 7 signify a neutral position, and scores from 1 – 3 signify disagreement with the statement. This year the program is setting service levels with a target of 90% in each category and a lower limit of 75% in each category. As indicated by the two adjacent charts significant increases were experienced in all categories from last year to this year. The overall customer satisfaction went from a rating of 97.73% to 99.3% Course Material
These questions evaluate whether the course materials, i.e., Student Guide, presentations, handouts, and supplemental materials, aided the participant in understanding the course topics and could serve as a reference in the future.
The overall results indicate that 99.51% of the 513 participants feel the course materials in all courses were useful and could be used for future reference. Instructor Effectiveness
These questions evaluate the effectiveness of the instructor in presenting the course materials. The instructor is also evaluated on his/her ability to explain concepts clearly and engage with individuals.
The overall results indicate that 99.65% of the 513 participants feel the instructor performed effectively and brought value to each participant. Course Relevance to Job Duties
These questions evaluate the relevance of the course to the participant’s job duties and whether the participant could use the course concepts immediately in their job.
The overall results indicate that 98.05% of the 513 participants feel the course content would bring value to their job.
Fiscal 2014
Fiscal 2013
PM Professional Development Program Annual Performance Report Page 10 of 14
Expectations Met
These questions measure whether the participant’s expectations have been met.
The overall results indicate that 99.61% of the 513 participants feel the course met their expectations. Overall Rating
This rating is calculated as an average of all the evaluation categories.
The overall results indicate that 99.30% of the 513 participants were satisfied with their course experience and that they received value from it.
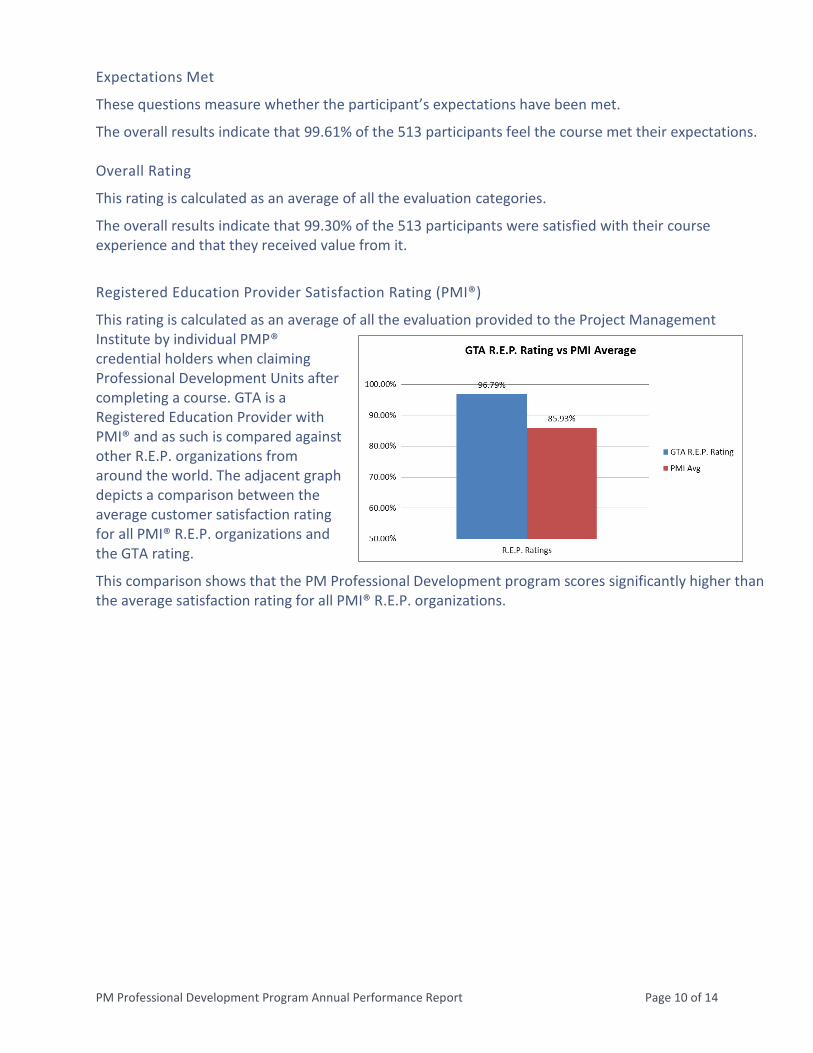
Registered Education Provider Satisfaction Rating (PMI®)
This rating is calculated as an average of all the evaluation provided to the Project Management Institute by individual PMP® credential holders when claiming Professional Development Units after completing a course. GTA is a Registered Education Provider with PMI® and as such is compared against other R.E.P. organizations from around the world. The adjacent graph depicts a comparison between the average customer satisfaction rating for all PMI® R.E.P. organizations and the GTA rating.
This comparison shows that the PM Professional Development program scores significantly higher than the average satisfaction rating for all PMI® R.E.P. organizations.
PM Professional Development Program Annual Performance Report Page 11 of 14
Course Examinations Performance
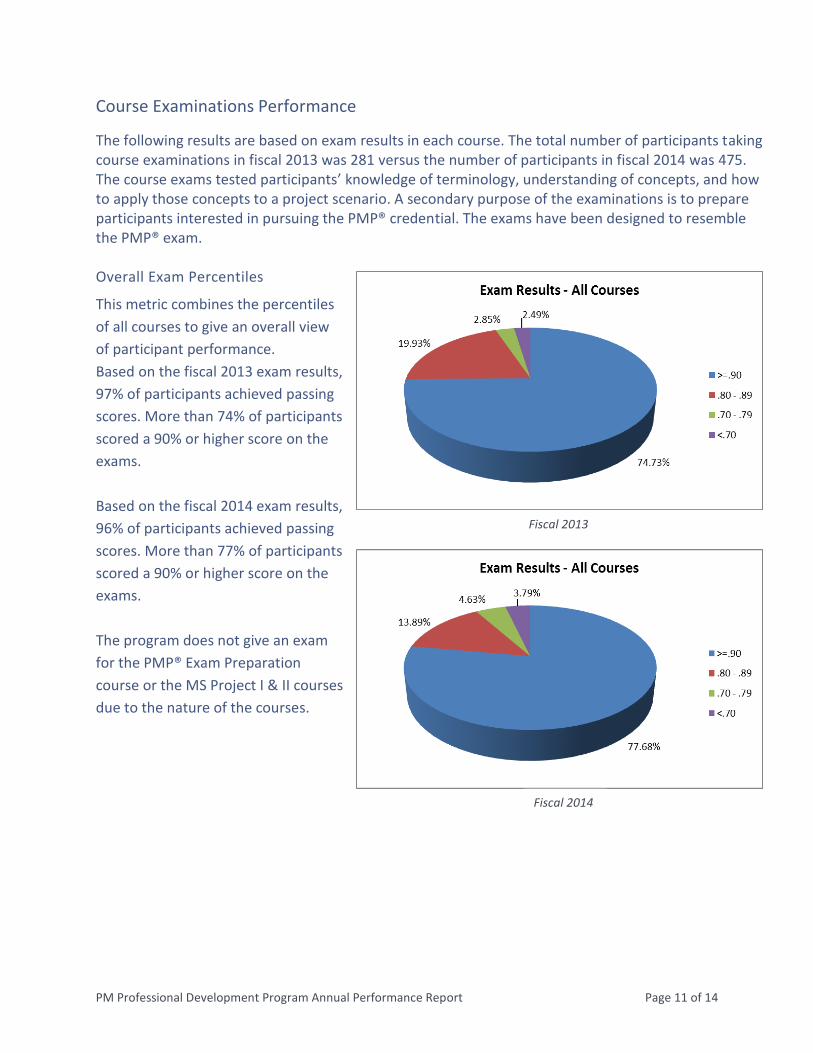
The following results are based on exam results in each course. The total number of participants taking course examinations in fiscal 2013 was 281 versus the number of participants in fiscal 2014 was 475. The course exams tested participants’ knowledge of terminology, understanding of concepts, and how to apply those concepts to a project scenario. A secondary purpose of the examinations is to prepare participants interested in pursuing the PMP® credential. The exams have been designed to resemble the PMP® exam. Overall Exam Percentiles
This metric combines the percentiles
of all courses to give an overall view
of participant performance.
Based on the fiscal 2013 exam results,
97% of participants achieved passing
scores. More than 74% of participants
scored a 90% or higher score on the
exams.
Based on the fiscal 2014 exam results,
96% of participants achieved passing
scores. More than 77% of participants
scored a 90% or higher score on the
exams.
The program does not give an exam
for the PMP® Exam Preparation
course or the MS Project I & II courses
due to the nature of the courses.
Fiscal 2013
Fiscal 2014
PM Professional Development Program Annual Performance Report Page 12 of 14
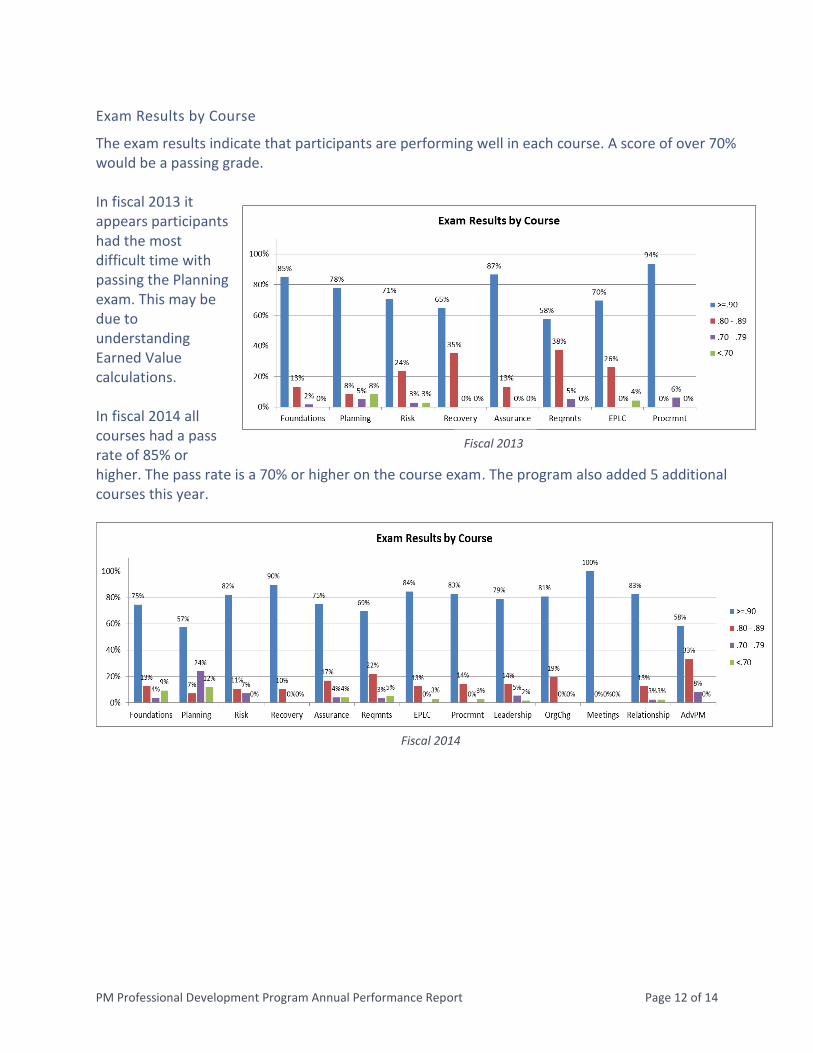
Exam Results by Course
The exam results indicate that participants are performing well in each course. A score of over 70% would be a passing grade. In fiscal 2013 it appears participants had the most difficult time with passing the Planning exam. This may be due to understanding Earned Value calculations. In fiscal 2014 all courses had a pass rate of 85% or higher. The pass rate is a 70% or higher on the course exam. The program also added 5 additional courses this year.
Fiscal 2013
Fiscal 2014
PM Professional Development Program Annual Performance Report Page 13 of 14
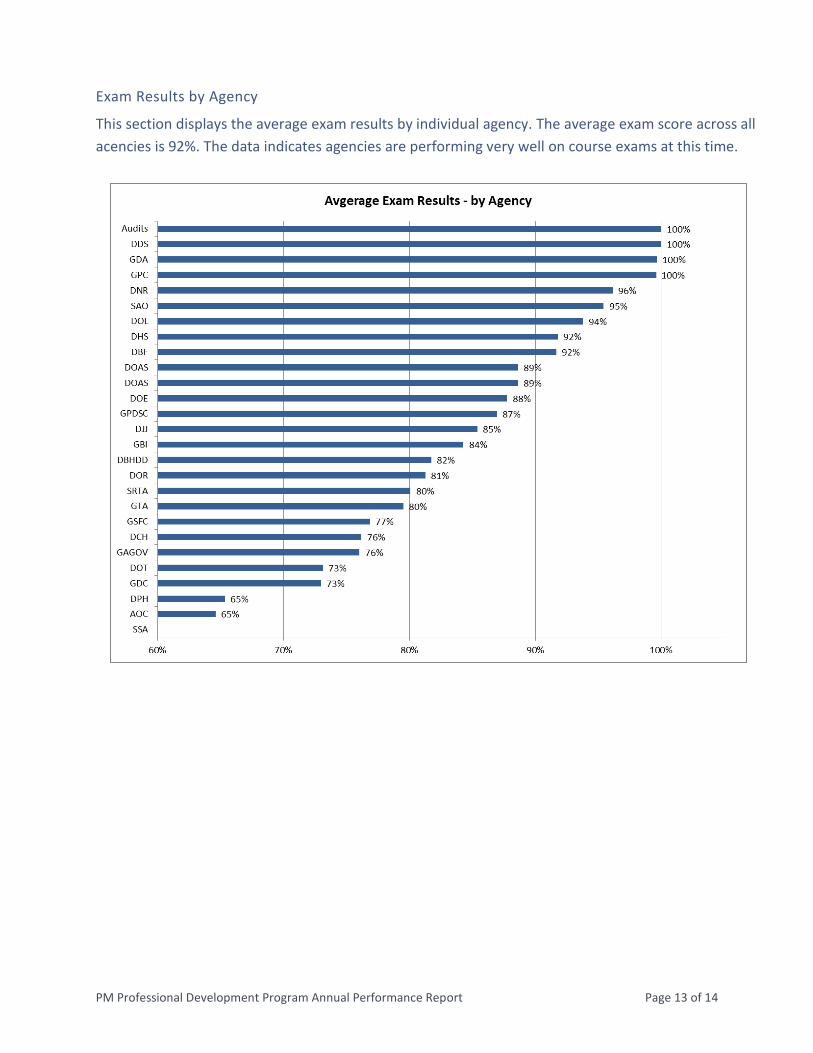
Exam Results by Agency
This section displays the average exam results by individual agency. The average exam score across all
acencies is 92%. The data indicates agencies are performing very well on course exams at this time.
PM Professional Development Program Annual Performance Report Page 14 of 14
FUTURE DIRECTIONS
The future looks bright for the program. Some initiatives are on-going and progressing well. The exciting part for the near-term is converting many of our existing class room courses into eLearning modules that can be taken at any time by our customers. This will be made possible with the implementation of the LMS this coming year. With this enhancement to the program we will be able to reach more people, more efficiently, with easy access for our customers. Through the use of technology the program will take a giant step forward in reaching more customers across state government.
Agency Outreach Initiative (continuing effort)
This year the program is getting several requests to present 1-day seminars or develop webinars on topics from leadership to project management best practices to organizational change management. There is a growing interest from agency directors and managers to understand who is participating in the program and how well they are doing. These are efforts the program plans to continue and expand. This initiative can be the foundation for building a strong consultancy practice for the EPMO.
Course Development
Based on survey results, individual interviews, and class room discussions, the program continues to discover opportunities for improving and expanding the course materials and course delivery improvements. The program will undertake several initiatives in the near and long term to address these opportunities:
1. Continue efforts to upgrade the old core courses to the latest edition of the Guide to the PMBOK®.
2. Continue to explore the development of an executive-level certification in project/program/portfolio management for management and executive-level personnel.
3. Begin the development of eLearning course and the LMS product. Four courses have been identified to start this effort.
4. Offer courses in a virtual meeting environment to ease wait list overload and provide easier access to participants outside the metro area.
Learning Management System
During the coming fiscal year the program will participate in the implementation of a Learning Management System. This system will allow the program to not only maintain its level of service as demand increases, but also to decrease turnaround time to customers and create new or improved capabilities within the program. We expect to automate the registration process, add eLearning courses, automate evaluations and exams, and generate reports with configured KPI’s.