San Pablo Ave at West St and W Mac bike/ped project, Oakland
Upload
harsha-yelisalaCategory
view
1.224download
0
An Energy Efficient Sub-threshold Multiplicationand Accumulation Unit for Low Power Digital
Signal Processing Applications
Harsha Yelisala
SPRING 2009 - SUMMER 2010

Technology Profile
The following technologies are used in this project,
I 90nm Pass Transistor Technology.
I Cadence IC design.
I Virtuoso schematic.
I Virtuoso Analog Design Environment.
I Cadence Spectre Simulator.
I Virtuoso Layout Suite.
I Synopsys Nanosim.
I Synopsys Hspice.
I Tcl Scripting.
I Perl Scripting.
I Python Programming Language.
Aim
The Objectives of this project are
I 1. To design an industry standard energy efficient circuit in a90nm Technology.
I 2. To emphasize the Subthreshold mode of operation.
I 3. To get hands on expertise on Cadence and Synopsys Tools.
I 4. To understand the hardware design flow.
I 5. To work with Perl and Tcl Scripting Languages.

Introduction
AbstractThe increased use of power consuming devices led to a new cornerof research in energy and power efficient designs. The conventionaldesign methodologies proved to be inefficient when energyefficiency is a prime metric. Of the several novel approaches, theone that is promising in terms of high energy savings and reducedcomplexity is the Sub-threshold mode of operation. A 220mVenergy efficient Subthreshold MAC unit is designed based on thedesigned custom cell library in 90nm Pass transistor technology.

Work Flow
I 1. Studying the literature regarding Subthreshold operation.
I 2. Investigating various logic families for Subthreshold scheme.
I 3. Designing a custom library of standard cells out of theproposed logic family.
I 4. Designing a MAC unit.
I 5. Verifying and testing the unit from power and energyperspective.

Subthreshold Mode
What is Subthreshold modeA basic MOS transistor works in three different modes of operation.1. Active or Saturation Mode2. Linear or Triode Mode3. Cutoff or Subthreshold Mode

Modes of a MOSFET operation
Modes of a MOSFETA basic MOS transistor works in three different modes of operation.1. Active or Saturation Mode2. Linear or Triode Mode3. Cutoff or Subthreshold Mode

All about Subthreshold Mode!
What is Subthreshold modeThe subthreshold operation of CMOS transistor is performed whenthe gate to source potential (Vgs) is less than thresholdvoltage(Vth).
Advantages:
1. As the device is operating in ultra low voltages(200-300mV),the dynamic power component is highly reduced.2. Highly suitable for low power low speed applications like sensornodes, battery operated devices etc.,
Disadvantages:
1. As the driving currents are the weak leakage currents the timeto charge and discharge the nodes is high, making the speed inbetween 1-10MHz.2. Transistor sizing criticality3. Low On-Off Current ratio.4. High Sensitivity to Process, Voltage and Temperature variations.

Subthreshold Current Model (1 of 2)
In Subthreshold regime, the drain current(Ids) varies exponentially.In long channel device, threshold voltage does not depend on drainvoltage or channel length. But in sub-micron technology, due todrain induced barrier lowering(DIBL), threshold voltage doesdepend on drain voltage, as source/drain depletion regionpenetrates significantly into the channel.The subthreshold current of CMOS transistor is given by thefollowing equation,
Isub = I0 × e(Vgs−Vth+ηVds )/nvt × 1 − e−Vds/Vth . (1)

Subthreshold Current Model (2 of 2)
Isub = I0 × e(Vgs−Vth+ηVds )/nvt × 1 − e−Vds/Vth . (2)
where
I0 = µoCox (W /L)(n − 1)V 2th (3)
and Vgs = transistor gate to source voltage,Vds = drain to source voltage,Vth = threshold voltage,vt = KT/q is the thermal voltage,n = subthreshold slope factor = (1 + Cd/Cox )Cd = drain capacitanceCox = gate capacitanceη = DIBL co-efficientµo = Mobility.W and L are the width and channel length of MOSFET
respectively.

Subthreshold Power Model (1 )
For low frequency mobile devices, the advantage of subthresholddesign is widely achieved through radical circuit power reduction atthe cost of operating speed . The total power consumption of thedigital circuit is given by following equation.
Ptotal = Pdynamic + Pshort−circuit + Pstatic (4)

Subthreshold Power Model (2 )
Dynamic Power
Dynamic power is described by following equation,
Pdynamic = αfCeff Vdd2 (5)
where α is activity factor, f is switching frequency, Ceff is theeffective capacitance. As dynamic power is directly proportionalwith the square of supply voltage, significant power reduction isachieved in subthreshold voltage.

Subthreshold Power Model (3 )
Dynamic Power
At 220mV, the dynamic charging current which is directlyproportional with dynamic power, is reduced by almost 248.49Xcompared to supply voltage of 1.2V for an inverter at TT processcorner.
0.2 0.4 0.6 0.8 1 1.210
−1
100
101
102
103
Supply voltage (V)
C
urr
en
t (u
A)
TT
FS
SF
SS
FF
Figure: Dynamic charging current rating under varying supply voltage foran inverter

Subthreshold Power Model (4 )
Static PowerStatic power is the power consumed by the circuit during idle stateand described by following equation.
Pstatic = ILeakageVdd (6)
The leakage current consists of various components, subthresholdleakage, gate tunneling, gate induced drain lowering (GIDL) andreverse bias diode leakage. The subthreshold leakage variesaccording to equation (2). Thus with reduction of drain voltage,the DIBL effect reduces which in turn reduces subthreshold leakagecurrent. The gate tunneling has significant contribution to overallleakage current, which also reduces with gate or supply voltage.GIDL and reverse bias diode leakage also significantly reduce dueto supply voltage reduction in a subthreshold circuit.

Subthreshold Power Model (5 )
Static PowerAt 220mV, the subthreshold leakage current at weak inversion isreduced by almost 8.55X compared to strong inversion(supplyvoltage 1.2V) at TT process corner.
0.2 0.4 0.6 0.8 1 1.210
−1
100
101
102
103
Supply voltage (V)
C
urr
en
t (n
A)
TT
FS
SF
SS
FF
Figure: Subthreshold leakage current rating under varying supply voltagefor an inverter

Subthreshold Power Model (6 )
Short Circuit PowerShort circuit power is the power dissipated due to currentconduction between Vdd and VSS during logic transition. It isdescribed by the following equation.
Pstatic = Ishort−circuitVdd (7)
Although short-circuit current flowing time is increased due toslower operation in subthreshold, but reduced supply voltagedecreases electron conduction, which in turn reduces Ishort−circuit .

Subthreshold Power Model (5 )
Short Circuit PowerAt 220mV, there is a 446.45X reduction in short circuit currentcompared to full rail voltage of 1.2V in TT process corner.
0.2 0.4 0.6 0.8 1 1.210
−2
10−1
100
101
102
Supply voltage (V)
C
urr
en
t (u
A)
TT
FS
SF
SS
FF
Figure: Short circuit current rating under varying supply voltage for aninverter

Subthreshold Design Challenges (1)
I Transistor Sizing Criticality
I On-Off Current Ratio
I PVT variations
I Noise Margin

Subthreshold Design Challenges (2)
Transistor Sizing Criticality
The relative strength of pull-up, pull-down is very critical foroptimal rise and fall time. As subthreshold current dependsexponentially on Vth, any variation in threshold of NMOS andPMOS can change the β ratio drastically which directly affectsrise/fall time and may trigger logic failure. The shift in β ratio isobserved in low-voltage, enforcing us to size the cell transistor verycarefully.

Subthreshold Design Challenges (2)
Ratio of NMOS ION and PMOS ION at different corners
0 0.2 0.4 0.6 0.8 1 1.2 1.410
0
101
102
103
Supply(V)
IO
N N
MO
S /
IO
N P
MO
S
TT
FF
FS
SF
SS
Figure: Ratio of NMOS ION and PMOS ION at different corners
Observation: Significant β ratio variation is observed in lowvoltage at different process corners.

Subthreshold Design Challenges (2)
Ratio of NMOS ION and PMOS ION at different temperatures
0 0.2 0.4 0.6 0.8 1 1.2 1.40
5
10
15
20
25
30
Supply(V)
IO
N N
MO
S /
IO
N P
MO
S
−40C
−20C
0C
20C
40C
60C
80C
100C
120C
Figure: Ratio of NMOS ION and PMOS ION at different temperatures
Observation: Significant β ratio variation is observed in lowvoltage at different temperatures.

Subthreshold Design Challenges (3)
On-Off Current RatioThe drain current of MOSFET increases exponentially insubthreshold region whereas in strong inversion it changes veryslowly due to velocity saturation of majority carriers. Insubthreshold region, the threshold voltage deviation anddegradation of ION/IOFF of the current makes the circuit operationvery critical. In subthreshold region like 0.2V, ION/IOFF degradesto below 300 at room temperature.There is strong race conditionbetween on and off devices during setting of a critical signal andthis determines the maximum number of allowable cells perbit-line. When this current ratio degrades to very low value, itbecomes very difficult to differentiate between logic ‘1’ and logic‘0’. If we consider process variations, this ratio becomes worse inFF corner as shown.

Subthreshold Design Challenges (3)
On-Off Current Ratio
0 0.2 0.4 0.6 0.8 1 1.2 1.410
0
101
102
103
104
105
Supply(V)
NM
OS
IO
N /
IO
FF
−40C
−20C
0C
20C
40C
60C
80C
100C
120C
Figure: Ratio of NMOS ION and IOFF at different temperatures
Observation: Significant β ratio variation is observed in lowvoltage at different temperatures.

Subthreshold Design Challenges (3)
On-Off Current Ratio
0 0.2 0.4 0.6 0.8 1 1.2 1.410
0
101
102
103
104
105
106
107
Supply(V)
PM
OS
IO
N /
IO
FF
−40C
−20C
0C
20C
40C
60C
80C
100C
120C
Figure: Ratio of PMOS ION and IOFF at different temperatures
Observation: Significant β ratio variation is observed in lowvoltage at different temperatures.

On-Off Current Ratio
0 0.2 0.4 0.6 0.8 1 1.2 1.410
0
101
102
103
104
105
Supply(V)
NM
OS
IO
N /
IO
FF
TT
FF
FS
SF
SS
Figure: Ratio of NMOS ION and IOFF at different corners
Observation: Significant β ratio variation is observed in lowvoltage at different temperatures.

On-Off Current Ratio
0 0.2 0.4 0.6 0.8 1 1.2 1.410
1
102
103
104
105
106
Supply(V)
PM
OS
IO
N /
IO
FF
TT
FF
FS
SF
SS
Figure: Ratio of PMOS ION and IOFF at different corners
Observation: Significant β ratio variation is observed in lowvoltage at different temperatures.

A Look into other Logic families
The conventional Complimentary MOS Logic family whenoperated in subthreshold voltages poses several disadvantages.A few of them are:1. High Power dissipation2. Weak Noise margins.3. Huge delays.Thus it is evident that a CMOS logic family is not optimum forsubthreshold operation.

A study of several other logic families is made with power andenergy consumption as prime concern.
Table: Minimum working voltages for different logic families for a basicAND gate
Logic Family Minimum Voltage(mv) Delay(ns) Driving Current(nA) Power(nW) PDP(fJ)Sub-CMOS 250 2.56 3330 1859 4.759
Pseudo NMOS 220 4.765 102.56 0.6023 2.87DTMOS 180 8.4173 32.54 233.63 1.97Domino 240 7.6477 476.13 639.41 4.89
Pass Transistor 200 4.9953 201.43 426.17 2.13DTPT 175 6.598 128.39 204.68 1.35
Table: Energy comparison at 250mV for different logic families for basicAND gate
Logic Family Delay(ns) Driving Current(nA) Power(nW) PDP(fJ)Sub-CMOS 2.56 3330 1859 4.759
Pseudo NMOS 3.8637 761.938 0.9848 3.805DTMOS 11.116 89.204 1.501 16.68Domino 4.5477 568.31 1.119 5.09
Pass Transistor 2.2641 652.88 1.502 3.39DTPT 1.8432 830 1.503 2.77

Custom Cell Library
All the standard cells are designed in 90nm PT technology. Thecells are fine tuned for their sizings, driving capability and minimumworking voltage magnitudes. The cells that are customized are:
I Inverter
I Buffer
I And
I Or
I Xor
I Xnor

Inverter
This is the only gate in the library that is based on CMOStechnology. The only modification is that the driving capability ofthe cell is increased by improving the effective channel length ofthe P and N devices as shown.

Buffer
Buffer gate is obtained by connecting two inverters in series.

And (1 of 2)
A
A'
B
B'
v d
c
output
p1
n1
p2
n2
p3 p4
n3 gnd
Figure: And gate
Operation:
I When A=0, B=0 the transistorsp1, n1, n3 are on and p2, n2, p3,p4 are off and transmits gnd.
I When A=0, B=1 the transistorsp1, n1, p3 are on and p2, n2, n3,p4 are off and transmits gnd.
I When A=1, B=0 the transistorsp2, n2, n3, p4 are on and p1, n1,p3 are off and transmits B.
I When A=1, B=1 the transistorsp1, n2, p3, p4 are on and p2, n2,n3 are off and transmits vdc.

And (2 of 2)
A
A'
B
B'
v d
c
output
p1
n1
p2
n2
p3 p4
n3 gnd
Figure: And gate
Need for additional Mosfets n3, p3, p4:
I when inputs are A=1, B=0, theoutput node is discharged to zero.
I when inputs are A=1, B=1, theoutput should be connected to Band should charge it to ‘1’.
I But due to larger sub thresholddelay, the node which wasdischarged earlier takes longertime to charge to ‘1’.
I Hence an alternate path isprovided to charge the outputnode to ‘1’ .

Or (1 of 2)
p1
n1
A
B
A'
p2
output
Figure: Or gate
Operation:
I When A=0, B=0 the transistorsp1, n1 are on and p2 is off andtransmits B.
I When A=0, B=1 the transistorsp1, n1 are on and p2 is off andtransmits B.
I When A=1, B=0 the transistorsp1, n1 are off and p2 is on andtransmits A.
I When A=1, B=1 the transistorsp1, n1 are off and p2 is on andtransmits A.

Or (2 of 2)
p1
n1
A
B
A'
p2
output
Figure: Or gate
This works fine in strong inversionregion. But when subthreshold mode isconsidered, the output current is notsufficient for the gate to drive a FO4load. Hence a chain of two inverters areconnected at the final output toconsider it as custom OR gate.

Xnor
n1
p1
n2
p2
B'
A
B
A'
output
Figure: Xnor gate
Operation:
I When A=0, B=0 the transistorsp1, n1 are on and p2, n2 are offand transmits B ′.
I When A=0, B=1 the transistorsp1, n1 are on and p2, n2 are offand transmits B ′.
I When A=1, B=0 the transistorsp1, n1 are off and p2, n2 are onand transmits B.
I When A=1, B=1 the transistorsp1, n1 are off and p2, n2 are onand transmits B.

Xor(1 of 2)
p1
n1
p2
n2
B
A
B
A
output
Figure: Xor gate
Operation:
I When A=0, B=0 the transistorsp1, n1 are off and p2, n2 are onand transmits B.
I When A=0, B=1 the transistorsp1, n1 are off and p2, n2 are onand transmits B.
I When A=1, B=0 the transistorsp1, n1 are on and p2, n2 are offand transmits B ′.
I When A=1, B=1 the transistorsp1, n1 are on and p2, n2 are offand transmits B ′.

Xor(2 of 2)
p1
n1
p2
n2
B
A
B
A
output
Figure: Xor gate
However, the direct XORimplementation is not used in ourcustom library, as the XOR derived fromXNOR works for much lesser minimumworking voltage than direct XORimplementation upon investigation. Thedetails are mentioned in the furtherslides.

Summary of the standard cells in PT technology
Table: Electrical characteristics of different basic cells using passtransistor logic in TT process corner
Basic cell Minimum Voltage(mv) Delay(ns) Driving Current(fA) Power(nW) PDP(aJ)Buffer 148 2.7258 582.06 0.134 0.365
Inverter 150 1.5655 590.65 0.197 0.308XOR 155 1.5739 611.69 0.562 0.884
NAND 170 0.9638 673.64 0.435 0.419AND 175 2.1523 689.82 0.47 1.011OR 155 3.9219 611.81 0.431 1.6903
Full adder 185 2.9647 734.61 29.516 87.506

Design of a MAC Unit
I MAC is one of the most occurring and energy consumingoperation in DSP or other computationally intensiveapplications.
I It represents a fundamental building block in all DSP tasks.Therefore, designing an ultra-low power MAC becomes asubject of substantial research interest.
I An energy efficient MAC unit is designed using the customcell library.

Design of a MAC Unit
Brief Specifications:
I Inputs : 8-bit Multiplier, 8-bit Multiplicand, 17-bit Addend
I Outputs :17-bit MAC output
I Type of Multiplier : Radix-4 Booth encoded multiplier
I Type of Adder : Ripple carry adder

Block diagram of MAC unit
2s Compliment
Booth Encoder
Shifter PP0
PP1
PP3
PP2
P0
P1
P2
P3
Shifter
-MD
- 2MD
2MD
MD<7:0>
MR<7:0>
I
N
P
U
T
Partial
Product
Adder
Adder <16:0>
<16:0>
O
U
T
P
U
T
MULTIPLIER ADDER
Partial Product
Generation
Figure: Block diagram of MAC unit
:

Flowchart of MAC Unit
2s Compliment
B o
o t h
e n
c o
d e
r
S h
i f t e r s
Partial product
generation
Partial product
addition
Adder
MULTIPLICAND
MULTIPLIER
MAC OUTPUT
ADDER INPUT
Figure: Flowchart for MAC operation

Sequence of logic flowI The multiplicand(MD) input enters the 2s compliment block
which negates the value of MD.I The obtained -MD when shifted left gives a -2MD.I The non negated MD is also shifted left to obtain 2MD.I The booth encoder block encodes the 8 bit multiplier(MR) to
12 bits which are used to control the partial productgeneration.
I The partial product generation involves selection of four 8 bitvectors based on the encoded bits.
I The four partial products are generated by the PP0, PP1, PP2and PP3 blocks respectively.
I The partial products are shifted and sign extended to 16 bitsby the P0, P1, P2 and P3 blocks respectively.
I The obtained partial products are finally added to obtain the17 bit multiplier output.
I A 17 bit external input is added with the obtained multiplierproduct to give final MAC output.

Modified booth encoding algorithm
Modified booth encoding algorithm is an often selected algorithmfor multiplication of signed numbers. This scheme is selected by itsvirtue of reducing the number of partial products to half thenumber of multiplier bits as compared to a conventional boothencoding scheme. This reduces the number of iterations at anincreased circuit complexity. Thus the power consumption is alsoreduced by half. The modified booth encoder based multiplierarchitecture is designed keeping in view of the power consumption.

Algorithm Description and Control ImplementationThe modified booth algorithm considers 3 multiplier bits (MRi+1,MRi , MRi−1) at a time and encodes to any value among -2MD,-MD, 0, MD, 2MD based on Table below. The value MRi refers tothe i th bit of the multiplier where i ranges from 0 to number ofmultiplier bits and MR−1 is taken to be 0.
Table: Mapping of multiplier bits to encoded bits using Radix 4 BoothEncoder
MRi+1 MRi MRi−1 Partial Product A B C0 0 0 0 0 0 00 0 1 MD 0 1 00 1 0 MD 0 1 00 1 1 2MD 0 0 11 0 0 -2MD 1 0 11 0 1 -MD 1 1 01 1 0 -MD 1 1 01 1 1 0 1 0 0
where A, B, C indicate the encoded bits for a given MRi+1, MRi ,MRi−1 bits of the multiplier bit sequence starting from the LSB.

ExampleConsider an example where,
I Multiplier(MR) :01001000
I Multiplicand(MD):00110110
I Adder input as01100010001000001
So, 2MD=01101100, -MD=11001010, -2MD=10010100
Encoding the MR:
I 010010000
I 01001000
I 01001000
I 01001000
I 000 encodes to 000
I 100 encodes to 101
I 001 encodes to 010
I 010 encodes to 010
Partial Products: After shifting and sign extending:pp0 :00000000pp1 :10010100pp2 :00110110pp3 :00110110
p0 :0000000000000000p1 :1111111001010000p2 :0000001101100000p3 :0000110110000000
Adder = 01100010001000001 + Product = 00000111100110000MAC OUTPUT = 0000111100110000
Test Chip
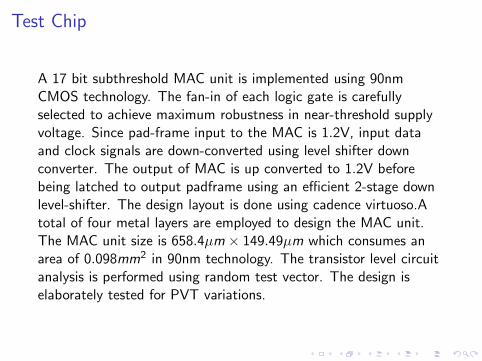
A 17 bit subthreshold MAC unit is implemented using 90nmCMOS technology. The fan-in of each logic gate is carefullyselected to achieve maximum robustness in near-threshold supplyvoltage. Since pad-frame input to the MAC is 1.2V, input dataand clock signals are down-converted using level shifter downconverter. The output of MAC is up converted to 1.2V beforebeing latched to output padframe using an efficient 2-stage downlevel-shifter. The design layout is done using cadence virtuoso.Atotal of four metal layers are employed to design the MAC unit.The MAC unit size is 658.4µm × 149.49µm which consumes anarea of 0.098mm2 in 90nm technology. The transistor level circuitanalysis is performed using random test vector. The design iselaborately tested for PVT variations.

Full chip layout of the proposed design with pad frame
Figure: Layout of MAC unit
:

Design Specs
Table: Subthreshold MAC design specifications
Minimum voltage 220mVSpeed 1 MHz
Energy per operation 1.63pJAverage power 2.04uWStandby power 1.4uW
The MAC unit is configured to operate at an extremely low voltageof 220mV at a speed of 1MHz for the worst case process corner(SS) at room temperature and can be functional even down to180mV at typical corner (TT).

MAC Simulation Results (1 of 8)
200 250 300 350 400 450 5000
10
20
30
40
50
60
70
80
90
100
voltage (mV)
pow
er (u
W)
Figure: Average Power Consumption of MAC at different supply voltages
:

MAC Simulation Results (2 of 8)
220 225 230 235 240 245 2500
2
4
6
8
10
12
Voltage (mV)
Fre
qu
en
cy (
MH
z)
SS
SF
FS
TT
FF
Figure: Operating frequency of MAC unit at different supply voltagesunder global variation
:

MAC Simulation Results (3 of 8)
200 250 300 350 400 450 5001000
2000
3000
4000
5000
6000
7000
voltage (mV)
Ene
rgy/
op (f
J)
Figure: Energy/operation at different supply voltages
:

MAC Simulation Results (4 of 8)
200 250 300 350 400 450 500−1
−0.5
0
0.5
1
1.5
2
2.5
3
Votage (mV)
Cur
rent
(uA
)
static current
dynamic current
capacitive current
Figure: Short circuit, static and capacitive current ratings at differentsupply voltages
:

MAC Simulation Results (5 of 8)
200 250 300 350 400 450 500−0.5
0
0.5
1
1.5
2
2.5
3
Supply (mV)
Sta
nd B
y P
ower
(uW
)
temp 0c
temp 27c
temp100c
Figure: Standby power versus supply voltage at different temperatures
:

MAC Simulation Results (6 of 8)
−40 −20 0 20 40 60 80 100 120−1
−0.5
0
0.5
1
1.5
2
2.5
3
temp (c)
Cur
rent
(uA
)
static current
dynamic current
capacitive current
Figure: Current ratings at different operating temperatures at supplyvoltage 220mV
:

MAC Simulation Results (7 of 8)
−40 −20 0 20 40 60 80 100 120100
200
300
400
500
600
700
800
900
1000
temp (c)
deal
y (n
s)
Figure: Performance of MAC at different temperatures at supply voltage220mV
:

MAC Simulation Results (8 of 8)
−40 −20 0 20 40 60 80 100 1200
50
100
150
200
250
300
temp (c)
pow
er (u
W)
Figure: Average power of MAC at different temperatures at supplyvoltage 220mV
:

Conclusion
In this research project,
I Several logical families are investigated in subthreshold rangeto build the optimum subthreshold standard cells.
I Pass transistor logic family was chosen due to its energyefficiency compared to other subthreshold logic families.
I An optimal design choice is made for each subthresholdstandard cell, based on power delay product.
I A 17 bit subthreshold MAC chip is implemented usingcustomized subthreshold standard cells.
I The custom cell layout is done using cadence virtuoso andtested in all process corners using nanosim simulator.
I It is designed to work for a minimum voltage of 220mV andconsumes an ultra low energy as minimum as 1.62pJ peroperation for an operating performance of 1.0MHz.