project gaurav pdf
63
BANARAS HINDU UNIVERSITY DEPARTMENT OF STATISTICS A survey on “SOCIO & ECONOMIC CONDITION OF AUTO RICKSHAW DRIVERS’’ IN VARANSI 2014-2015 Project Work Submitted in partial fulfilment of master’s Degree in Statistics Supervisor Prof. R.C. YADAV Professor Department of Statistics SESSION-(2014-2015) Submitted By: KUMAR GAURAV M.SC Statistics Examination Roll No. 13496SC020 Enrollment No. 327474
-
Upload
kumar-gaurav -
Category
Documents
-
view
244 -
download
0
Transcript of project gaurav pdf
BANARAS HINDU UNIVERSITY
DEPARTMENT OF STATISTICS
A survey on “SOCIO & ECONOMIC CONDITION OF AUTO RICKSHAW DRIVERS’’
IN VARANSI
2014-2015
Project Work
Submitted in partial fulfilment of master’s Degree in Statistics
Supervisor
Prof. R.C. YADAV
Professor
Department of Statistics
SESSION-(2014-2015)
Submitted By:
KUMAR GAURAV
M.SC Statistics
Examination Roll No. 13496SC020
Enrollment No. 327474
CERTIFICATE
This is hereby certified that this project report is collected, interpreted
and submitted by KUMAR GAURAV M.SC Statistics Semester IV.
This project report entitled, “SOCIO & ECONOMIC CONDITION OF AUTO RICKSHAW DRIVERS’’ IN VARANSI .
Dr. R.C .YADAV
Professor
Department of
Statistics
Banaras Hindu University
Date:-
ACKNOWLEDGEMENT
It gives me immense pleasure to express my gratitude, gratefulness and obligation to my affectionate Pt. Madan Mohan Malviya, the great founder of our great University his effort that makes me capable of doing this work.
The survey was conducted as a part of project work in the session 2014-2015 of M.SC ,Semester IV, as a part of fulfilment of master Degree.
I want to give special thanks teacher and supervisor Prof. R.C. YADAV Department of statistics ,faculty of science ,B.H.U,for his non stop help ,timely encouragement and to make quationaire to the final result
I wish to express my gratitude to Prof.S.K UPADHAY ,Head of department of statistics ,faculty of science,B.H.U for his valuable guidance & constant encouragement throughout the period.
I also express deep sense of gratefulness to my respected teacher Dr.Umesh Singh ,Dr.S.K.Singh Dr.B.B.khare ,Sri.M.K.Chaudhary.for their valuable suggestions and help that they will continue their guidance in future.
I acknowledge with my regard and sincere thanks to my friend Mr.Girish Gupta , Rajesh Kumar Viswakarma , Ravikant Kumar for their help and support .
I express my gratitude to the respondents for their kindly and extremely cooperative in providing the required information without which the survey would have been impossible.
Special thanks to the students and employees of statistics departments for their co-operation without whom I did not able to do this work.
Kumar Gaurav
M.SC Semester IV
Department of Statistics
Banaras Hindu University
CONTENTS
1. IntroductIon
2. Methodology of the survey 2.1 Planning of survey 2.2 Aim of survey 2.3 Schedule 2.4 AreA of survey 2.5 Sampling technique 2.6 Technique of daTa collecTion 2.7 ConCept of Chi square 2.8 AnAlysis & RepoRting 2.9 StatiStical Survey
3. TabulaTion and analysis
4. ConClusion
5. Field experience and difficulties
6. Questionnaire
IntroductIon
Chapter – I—Introduction
The term 'Social economics' may refer broadly to the "use of economics in the study of society." More narrowly, contemporary practice considers behavioral interactions of individuals and groups through social capital and social "markets" (not excluding for example, sorting by marriage) and the formation of social norms. In the latter, it studies the relation of economics to social values.
A distinct supplemental usage describes social economics as "a discipline studying the reciprocal relationship between economic science on the one hand and social philosophy, ethics, and human dignity on the other" toward social reconstruction and improvement or as also emphasizing multidisciplinary methods from such fields as sociology, history, and political science. In criticizing mainstream economics for its alleged faulty philosophical premises (for example the pursuit of self-interest) and neglect of dysfunctional economic relationships, such advocates tend to classify social economics as heterodox.
1. VARANSI
Varanasi also known as Banaras or Kashi is an North Indian city on the banks of the Ganga in Uttar Pradesh, 320 kilometres (200 mi) south-east of the state capital, Lucknow. It is the holiest of the seven sacred cities in Hinduism and Jainism, and played an important role in the development of Buddhism. Some Hindus believe that death at Varanasi brings salvation. It is one of the oldest continuously inhabited cities in the world. Varanasi is also known as the favourite city of the Hindu deity Lord Shiva . It has been mentioned in the Rigveda that this city in older times was known as Kashi .
The Kashi Naresh (Maharaja of Kashi) is the chief cultural patron of Varanasi, and an essential part of all religious celebrations. The culture of Varanasi is closely associated with the Ganges. The city has been a cultural centre of North India for several thousand years, and
has a history that is older than most of the major world religions. The Benares Gharana form of Hindustani classical music was developed in Varanasi, and many prominent Indian philosophers, poets, writers, and musicians live or have lived in Varanasi. Gautama Buddha gave his first sermon at Sarnath, located near Varanasi.
Varanasi is the spiritual capital of India. It is often referred to as "the holy city of India", "the religious capital of India", "the city of Shiva", and "the city of learning". Scholarly books have been written in the city, including the Ramcharitmanas of Tulsidas. Today, there is a temple in the city, the Tulsi Manas Mandir. The current temples and religious institutions in the city are dated to the 18th century.One of the largest residential universities of Asia, the Banaras Hindu University (BHU), is located here.
2. REASON OF TRAFFIC PROBLEM AND ROAD WORST CONDITION
The digging of roads for various development works in the city has aggravated commuter's woes, even as slow pace of construction work is making life hell for denizens.
While the divisional commissioner had taken a serious note of the delay in the construction and repair of roads at a recent review meeting, the work is yet to speed up. It is causing woes to commuters.
It may be mentioned here that divisional commissioner Chanchal Kumar Tiwari had recently presided over a review meeting of senior officials to take stock of the progress in infrastructural work, especially construction of roads. Sensing the slowness in work, the commissioner had also instructed to form a monitoring committee to supervise the construction of roads on a weekly basis under the Ganga Pollution Control Unit (GPCU) of the UP Jal Nigam. However, a realty check by TOI revealed slackness in the work. Boulders, water supply and sewage pipelines could be seen lying on the roads (some of them even lying in the congested gullies) and blocking traffic movement difficult in many parts of the city.
The worst condition was witnessed in DLW-Kakarmatta area where potholes and boulders were abundant below the rail overbridge. Similarly, the busy Sunderpur-DLW road that had recently witnessed construction after the digging work for laying water supply and sewer had also started to cave in due to load of heavy vehicles passing through the area.
The condition was almost similar in posh Ravindrapuri area that had repeatedly witnessed digging work for laying of underground cables, water and sewage pipelines. The vehicles were still being diverted from the main area due to bad condition of roads.
As per Ramesh Singh, general manager, GPCU, about 80% of the road dug along Sunderpur-DLW has been constructed. "The area needed a full bout of monsoon season to allow dug soil to settle properly and the roads constructed after the period would have long life. But, despite the deadline we are moving fast and not hampering movement in the city," he added.
It is also worth mentioning that the Varanasi Nagar Nigam (VNN) has also not completed the repair and construction of damaged roads which were badly hit during the past monsoon season. According to UN Tripathi, executive engineer, 60% of the roads have been repaired under the natural calamity fund and we are waiting for release of additional fund to complete the work before the start of next monsoon season. In all, a total of 47 roads in different parts of the city under VNN were damaged in the past monsoon season.
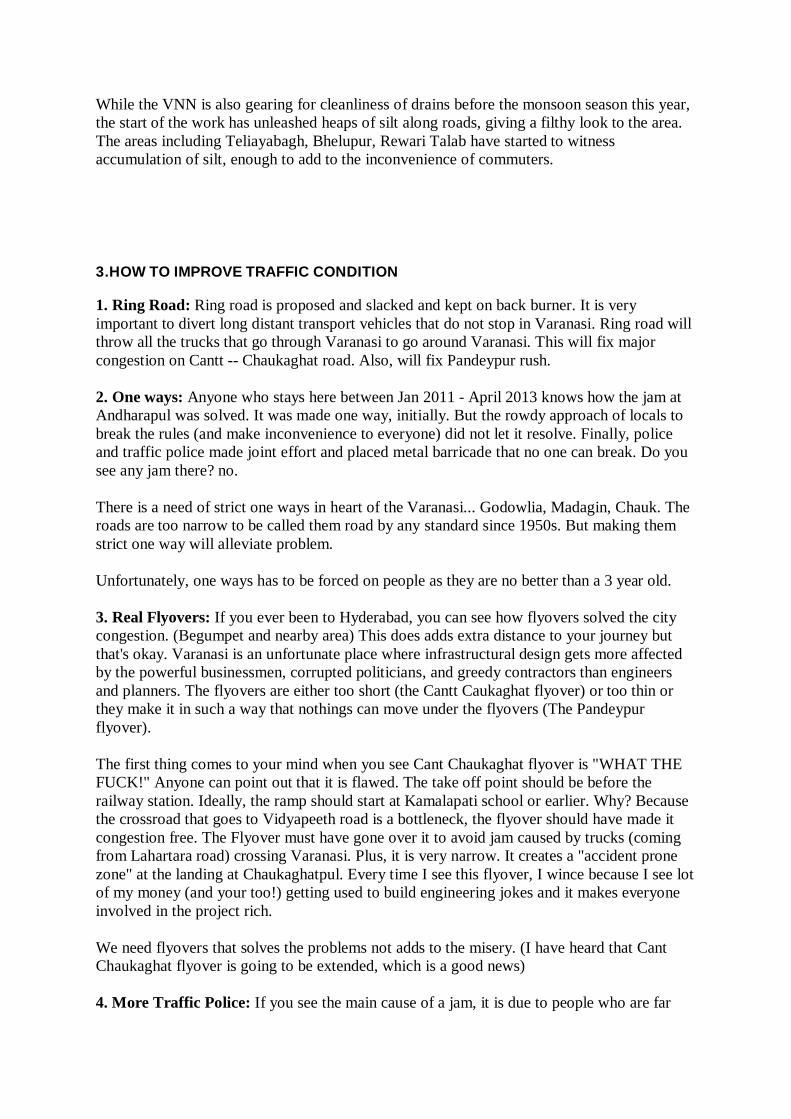
While the VNN is also gearing for cleanliness of drains before the monsoon season this year, the start of the work has unleashed heaps of silt along roads, giving a filthy look to the area. The areas including Teliayabagh, Bhelupur, Rewari Talab have started to witness accumulation of silt, enough to add to the inconvenience of commuters.
3.HOW TO IMPROVE TRAFFIC CONDITION
1. Ring Road: Ring road is proposed and slacked and kept on back burner. It is very important to divert long distant transport vehicles that do not stop in Varanasi. Ring road will throw all the trucks that go through Varanasi to go around Varanasi. This will fix major congestion on Cantt -- Chaukaghat road. Also, will fix Pandeypur rush. 2. One ways: Anyone who stays here between Jan 2011 - April 2013 knows how the jam at Andharapul was solved. It was made one way, initially. But the rowdy approach of locals to break the rules (and make inconvenience to everyone) did not let it resolve. Finally, police and traffic police made joint effort and placed metal barricade that no one can break. Do you see any jam there? no. There is a need of strict one ways in heart of the Varanasi... Godowlia, Madagin, Chauk. The roads are too narrow to be called them road by any standard since 1950s. But making them strict one way will alleviate problem. Unfortunately, one ways has to be forced on people as they are no better than a 3 year old. 3. Real Flyovers: If you ever been to Hyderabad, you can see how flyovers solved the city congestion. (Begumpet and nearby area) This does adds extra distance to your journey but that's okay. Varanasi is an unfortunate place where infrastructural design gets more affected by the powerful businessmen, corrupted politicians, and greedy contractors than engineers and planners. The flyovers are either too short (the Cantt Caukaghat flyover) or too thin or they make it in such a way that nothings can move under the flyovers (The Pandeypur flyover). The first thing comes to your mind when you see Cant Chaukaghat flyover is "WHAT THE FUCK!" Anyone can point out that it is flawed. The take off point should be before the railway station. Ideally, the ramp should start at Kamalapati school or earlier. Why? Because the crossroad that goes to Vidyapeeth road is a bottleneck, the flyover should have made it congestion free. The Flyover must have gone over it to avoid jam caused by trucks (coming from Lahartara road) crossing Varanasi. Plus, it is very narrow. It creates a "accident prone zone" at the landing at Chaukaghatpul. Every time I see this flyover, I wince because I see lot of my money (and your too!) getting used to build engineering jokes and it makes everyone involved in the project rich. We need flyovers that solves the problems not adds to the misery. (I have heard that Cant Chaukaghat flyover is going to be extended, which is a good news) 4. More Traffic Police: If you see the main cause of a jam, it is due to people who are far
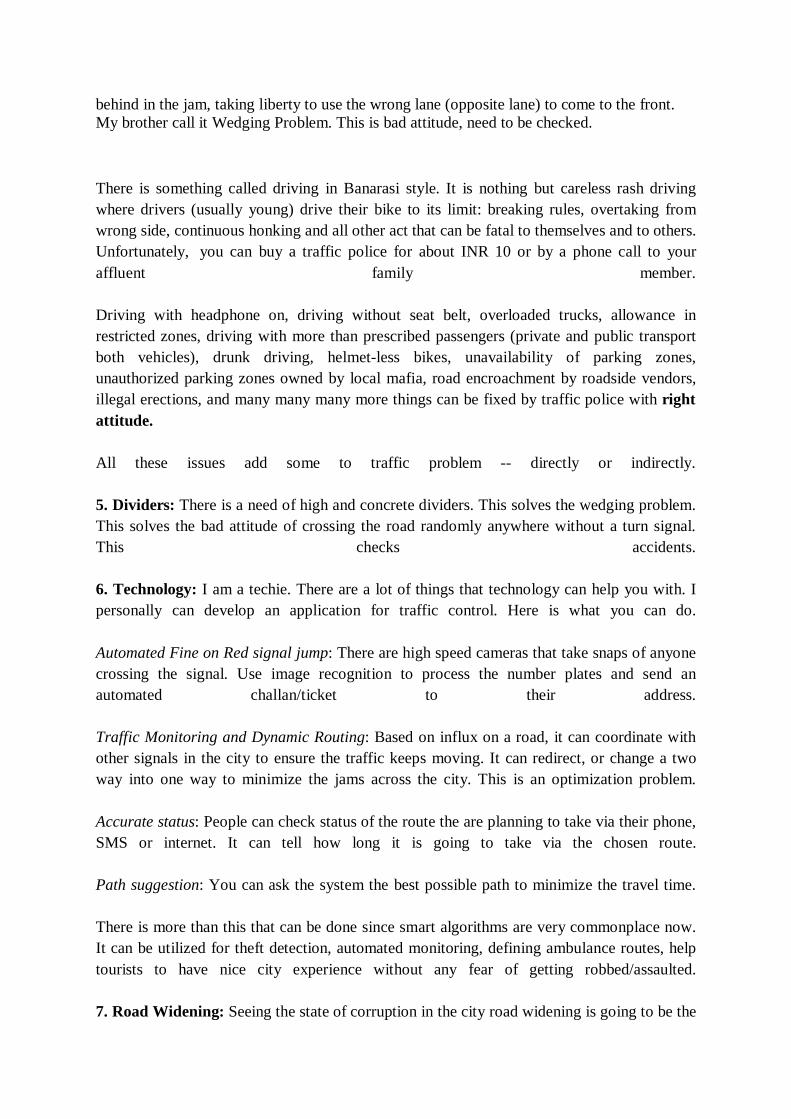
behind in the jam, taking liberty to use the wrong lane (opposite lane) to come to the front. My brother call it Wedging Problem. This is bad attitude, need to be checked.
There is something called driving in Banarasi style. It is nothing but careless rash driving where drivers (usually young) drive their bike to its limit: breaking rules, overtaking from wrong side, continuous honking and all other act that can be fatal to themselves and to others. Unfortunately, you can buy a traffic police for about INR 10 or by a phone call to your affluent family member. Driving with headphone on, driving without seat belt, overloaded trucks, allowance in restricted zones, driving with more than prescribed passengers (private and public transport both vehicles), drunk driving, helmet-less bikes, unavailability of parking zones, unauthorized parking zones owned by local mafia, road encroachment by roadside vendors, illegal erections, and many many many more things can be fixed by traffic police with right attitude. All these issues add some to traffic problem -- directly or indirectly. 5. Dividers: There is a need of high and concrete dividers. This solves the wedging problem. This solves the bad attitude of crossing the road randomly anywhere without a turn signal. This checks accidents. 6. Technology: I am a techie. There are a lot of things that technology can help you with. I personally can develop an application for traffic control. Here is what you can do. Automated Fine on Red signal jump: There are high speed cameras that take snaps of anyone crossing the signal. Use image recognition to process the number plates and send an automated challan/ticket to their address. Traffic Monitoring and Dynamic Routing: Based on influx on a road, it can coordinate with other signals in the city to ensure the traffic keeps moving. It can redirect, or change a two way into one way to minimize the jams across the city. This is an optimization problem. Accurate status: People can check status of the route the are planning to take via their phone, SMS or internet. It can tell how long it is going to take via the chosen route. Path suggestion: You can ask the system the best possible path to minimize the travel time. There is more than this that can be done since smart algorithms are very commonplace now. It can be utilized for theft detection, automated monitoring, defining ambulance routes, help tourists to have nice city experience without any fear of getting robbed/assaulted. 7. Road Widening: Seeing the state of corruption in the city road widening is going to be the
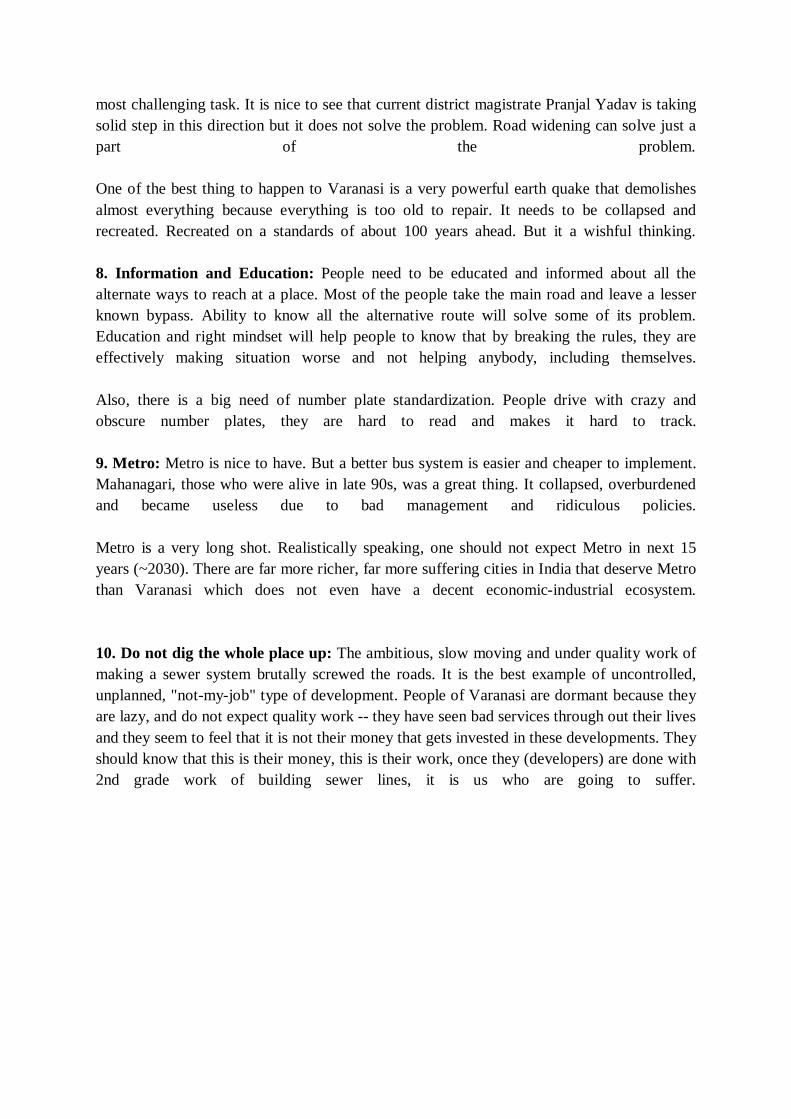
most challenging task. It is nice to see that current district magistrate Pranjal Yadav is taking solid step in this direction but it does not solve the problem. Road widening can solve just a part of the problem. One of the best thing to happen to Varanasi is a very powerful earth quake that demolishes almost everything because everything is too old to repair. It needs to be collapsed and recreated. Recreated on a standards of about 100 years ahead. But it a wishful thinking. 8. Information and Education: People need to be educated and informed about all the alternate ways to reach at a place. Most of the people take the main road and leave a lesser known bypass. Ability to know all the alternative route will solve some of its problem. Education and right mindset will help people to know that by breaking the rules, they are effectively making situation worse and not helping anybody, including themselves. Also, there is a big need of number plate standardization. People drive with crazy and obscure number plates, they are hard to read and makes it hard to track. 9. Metro: Metro is nice to have. But a better bus system is easier and cheaper to implement. Mahanagari, those who were alive in late 90s, was a great thing. It collapsed, overburdened and became useless due to bad management and ridiculous policies. Metro is a very long shot. Realistically speaking, one should not expect Metro in next 15 years (~2030). There are far more richer, far more suffering cities in India that deserve Metro than Varanasi which does not even have a decent economic-industrial ecosystem. 10. Do not dig the whole place up: The ambitious, slow moving and under quality work of making a sewer system brutally screwed the roads. It is the best example of uncontrolled, unplanned, "not-my-job" type of development. People of Varanasi are dormant because they are lazy, and do not expect quality work -- they have seen bad services through out their lives and they seem to feel that it is not their money that gets invested in these developments. They should know that this is their money, this is their work, once they (developers) are done with 2nd grade work of building sewer lines, it is us who are going to suffer.
CHAPTER- II – METHODOLOGY OF THE SURVEY
1. Planning of Survey:
For any statistical survey, preplanning is must for best result and its successful completion at minimum cost, labour and time. It was necessary to have some preliminary analysis of survey, we used to analyze the problem in question for this, we submitted some expected questions related to the topics to our survey In-charge. Under her able guidance the final questionnaire was framed. A pilot survey was conducted to check the accuracy & clarity of the questionnaire.
2. Aim of Survey:
The aim of the survey is to study the opinion of A survey on “SOCIO & ECONOMIC CONDITION OF AUTO RICKSHAW DRIVERS’’
IN VARANSI
3. Area of Survey:
For the completion of any survey, one has to choose a specific field for the survey which depends upon the aim, type and ability of the units required for the survey. According to the aim of the survey I have consulted personally a large number of auto rickshaw driver of different route.
4. Schedule:
Contents of the schedule were determined by taking into account the aim of the survey, keeping in mind the aim of the survey a questionnaire was prepared bearing the topic:
A survey on “SOCIO & ECONOMIC CONDITION OF AUTO RICKSHAW DRIVERS’’
IN VARANSI
The schedule was constructed in such as way that:
i) It was clear to both the respondents & interviewer. ii) The information can be filled in quickly and easily with minimum errors and
omissions.
iii) Simple alternative questions having answers ‘Yes’ or ‘No’. iv) Multiple choice questions whose answers could be given by putting a tick.
5.Technique of Data collection:
The foremost part of the survey is to prepare the tools of data collection. Data has been collected by filled up the questionnaire after directly interviewing and the questions were asked in a face to face situation and some time by distributing the questionnaire and after few days collecting them from the persons concerned.
6. Sampling techniques:
Sampling technique is also one of the points to be taken on the first hand. In my survey I used stratified random sampling where the respondent was a unit of the survey.
Concept of chi square : The null hypothesis is taken as
H0 : The two attributes are independent, Against the alternative hypothesis
H1 : The two attributes are dependent.
The test statistics under H0 is given by – X 2=∑∑(oij-eij)/eij ˜ X 2
(r-1)(s-1)
where,
Oij = observed frequency of (i,j)th cell
eij =expected frequency of (i,j)th cell
eij =(ni. * n.j)/n
where ni. and n.j are marginal totals and N is total observation. The test statistics follows distribution with (r-1)(s-1) degree of freedom.
Analysis and reporting : After collection of raw data I put them in coded form so that the
analysis becomes easy. For this purpose, I use software named as SPSS in which I fed raw data. Then I analyze and interpret the data by using statistical tools (bar diagram) available in SPSS.
Statistical survey :
Representation of statistical data by table and diagrams are more
effective in statistical analysis, being easily intelligible to layman. Indeed diagram is most essential whenever it is required to convey any statistical information to the general public. The important types of diagrams that are used in statistical work is :
Bar diagram : Mode of diagrammatic representation of data is the bar diagram. In this method bar of equal width are taken for the different items of the series. The length of the bar represents the value o the variable concerned.
TabulaTion
&
AnAlysis
Tables Bar diagram PI DIAGRAM InterpretatIon
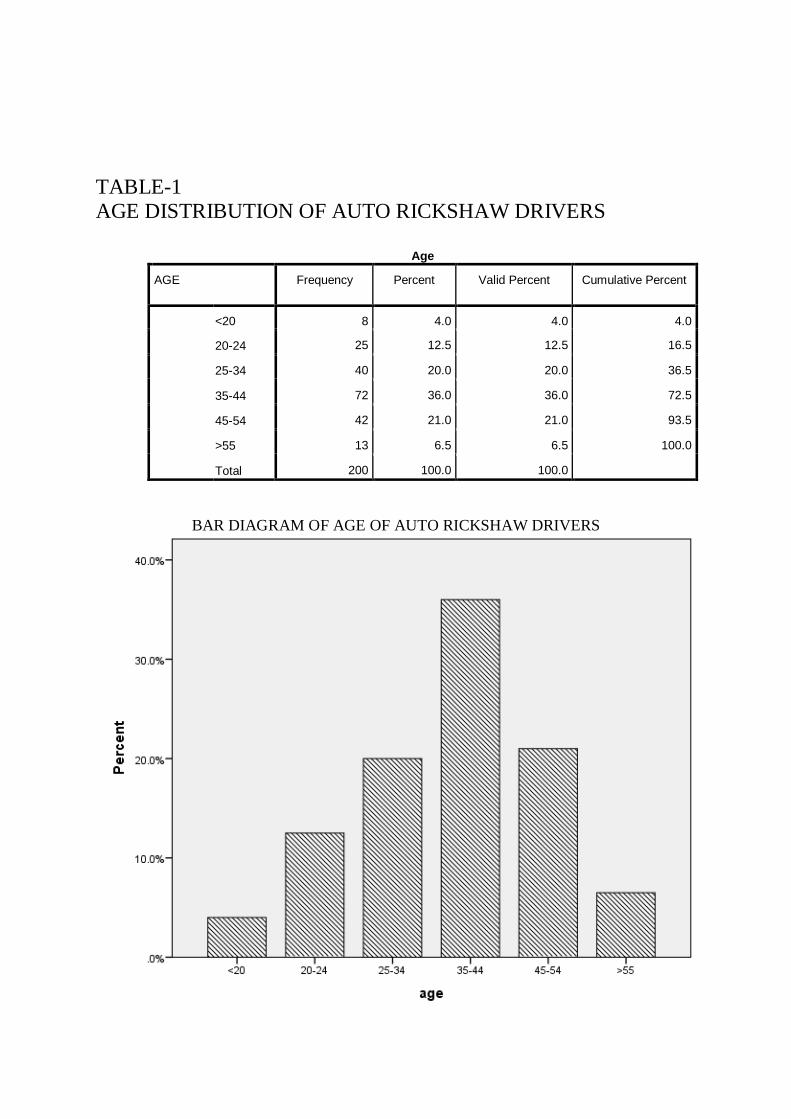
TABLE-1 AGE DISTRIBUTION OF AUTO RICKSHAW DRIVERS
Age
AGE Frequency Percent Valid Percent Cumulative Percent
<20 8 4.0 4.0 4.0
20-24 25 12.5 12.5 16.5
25-34 40 20.0 20.0 36.5
35-44 72 36.0 36.0 72.5
45-54 42 21.0 21.0 93.5
>55 13 6.5 6.5 100.0
Total 200 100.0 100.0
BAR DIAGRAM OF AGE OF AUTO RICKSHAW DRIVERS
INTERPRETATION:- THIS BAR DIAGRAM SHOWS THAT COMPARISON OF DIFFERENT AGE
GROUPS AUTO RICKSHAW DRIVERS.
THIS BAR DIAGRAM SHOWS THAT MOST OF AUTO RICKSHAW DRIVERS AGE GROUP ARE 35-44 AND SECOND MOST AGE GROUP IS 45-54.
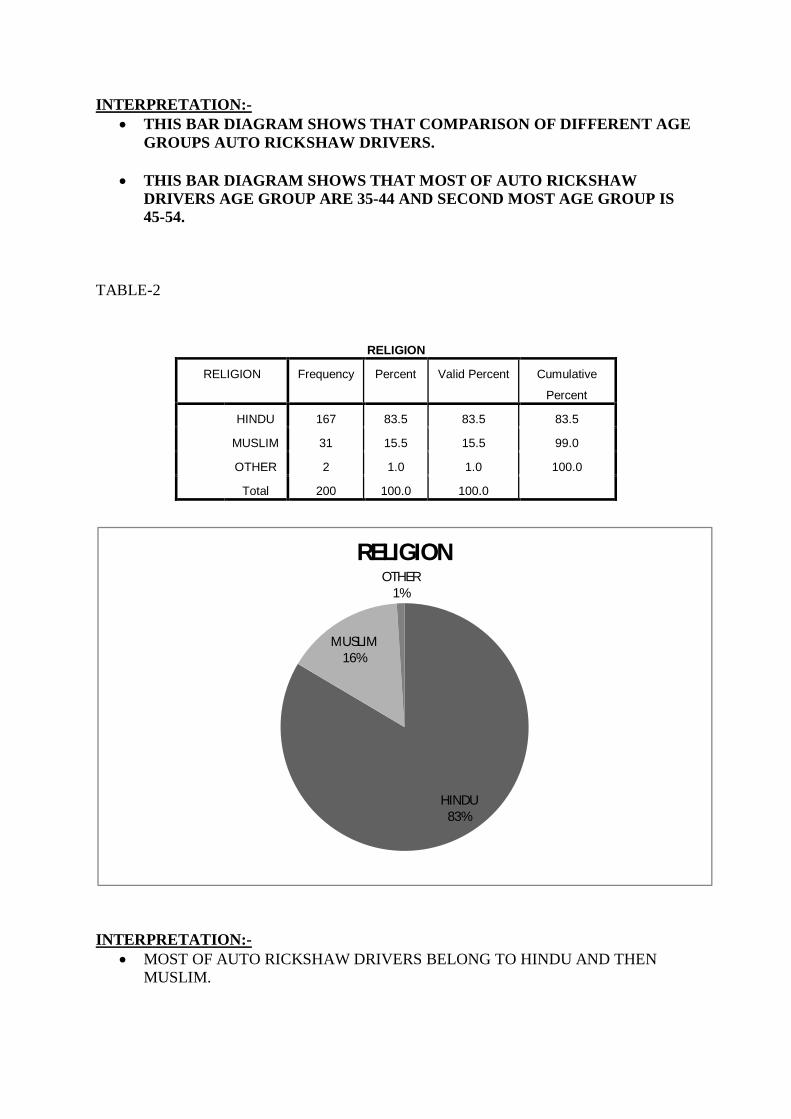
TABLE-2
RELIGION
RELIGION Frequency Percent Valid Percent Cumulative
Percent
HINDU 167 83.5 83.5 83.5
MUSLIM 31 15.5 15.5 99.0
OTHER 2 1.0 1.0 100.0
Total 200 100.0 100.0
INTERPRETATION:-
MOST OF AUTO RICKSHAW DRIVERS BELONG TO HINDU AND THEN MUSLIM.
HINDU83%
MUSLIM16%
OTHER1%
RELIGION
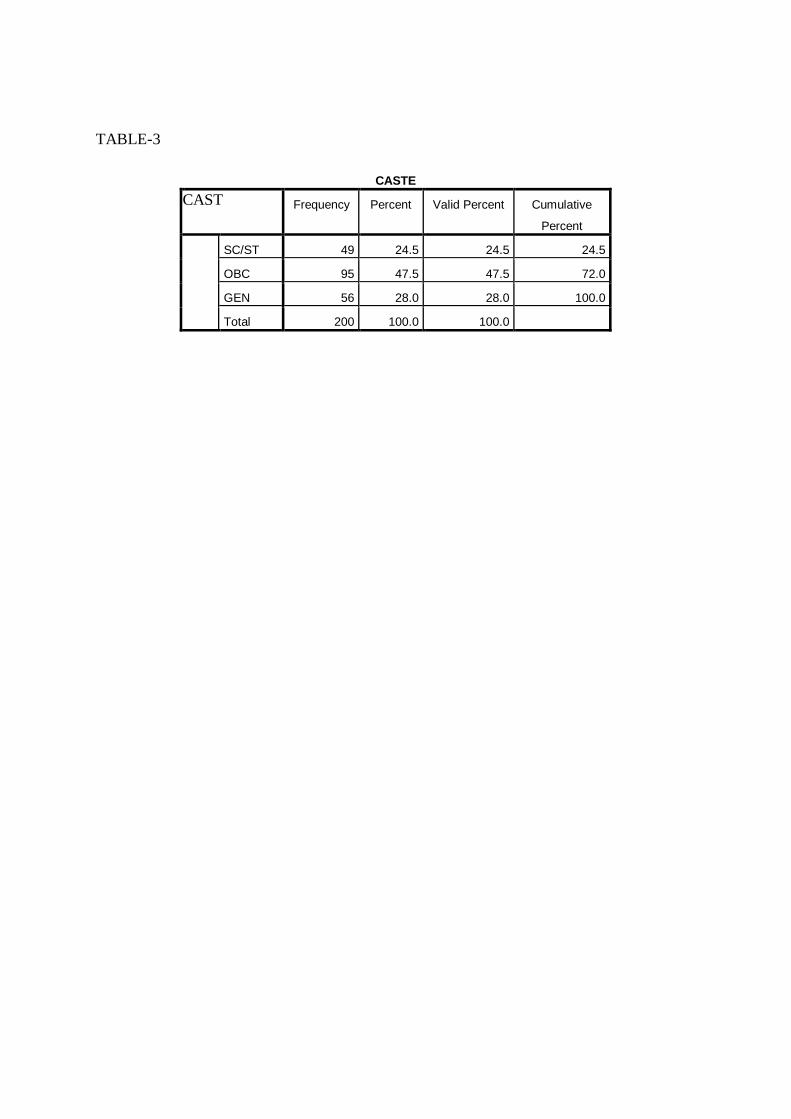
TABLE-3
CASTE CAST Frequency Percent Valid Percent Cumulative
Percent
SC/ST 49 24.5 24.5 24.5
OBC 95 47.5 47.5 72.0
GEN 56 28.0 28.0 100.0
Total 200 100.0 100.0
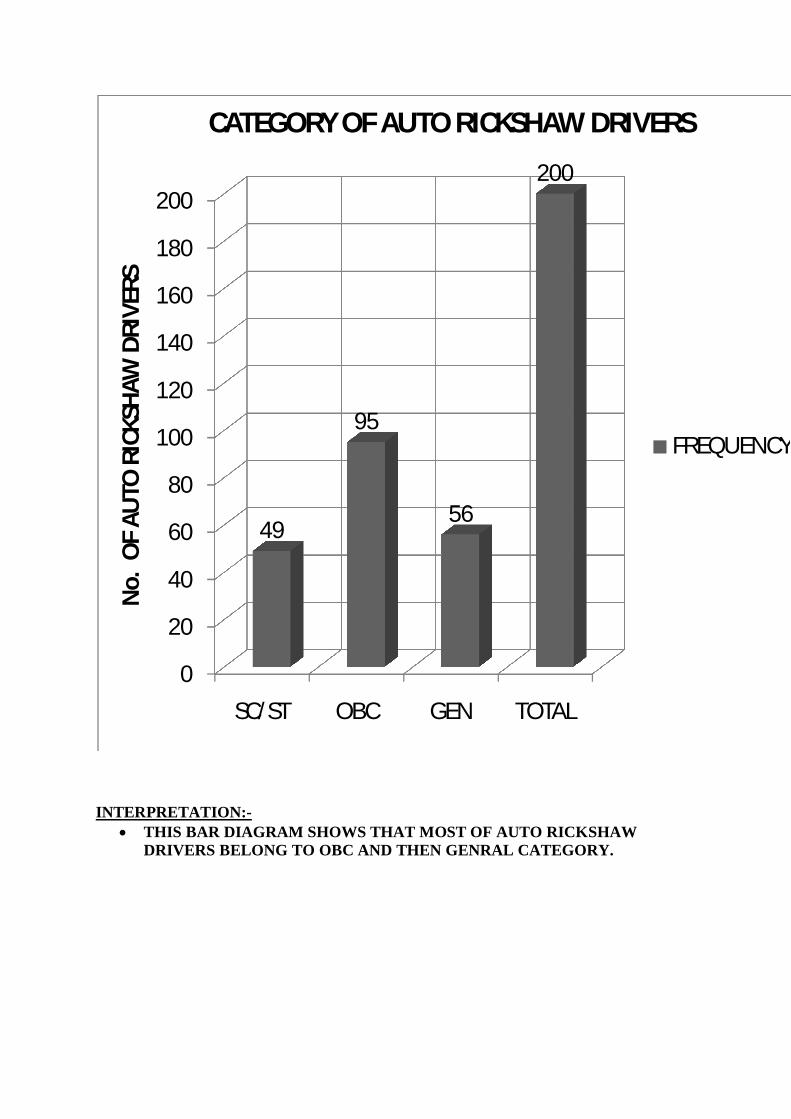
INTERPRETATION:-
THIS BAR DIAGRAM SHOWS THAT MOST OF AUTO RICKSHAW DRIVERS BELONG TO OBC AND THEN GENRAL CATEGORY.
0
20
40
60
80
100
120
140
160
180
200
SC/ST OBC GEN TOTAL
49
95
56
200
No.
OF
AUTO
RIC
KSHA
W D
RIVE
RSCATEGORY OF AUTO RICKSHAW DRIVERS
FREQUENCY
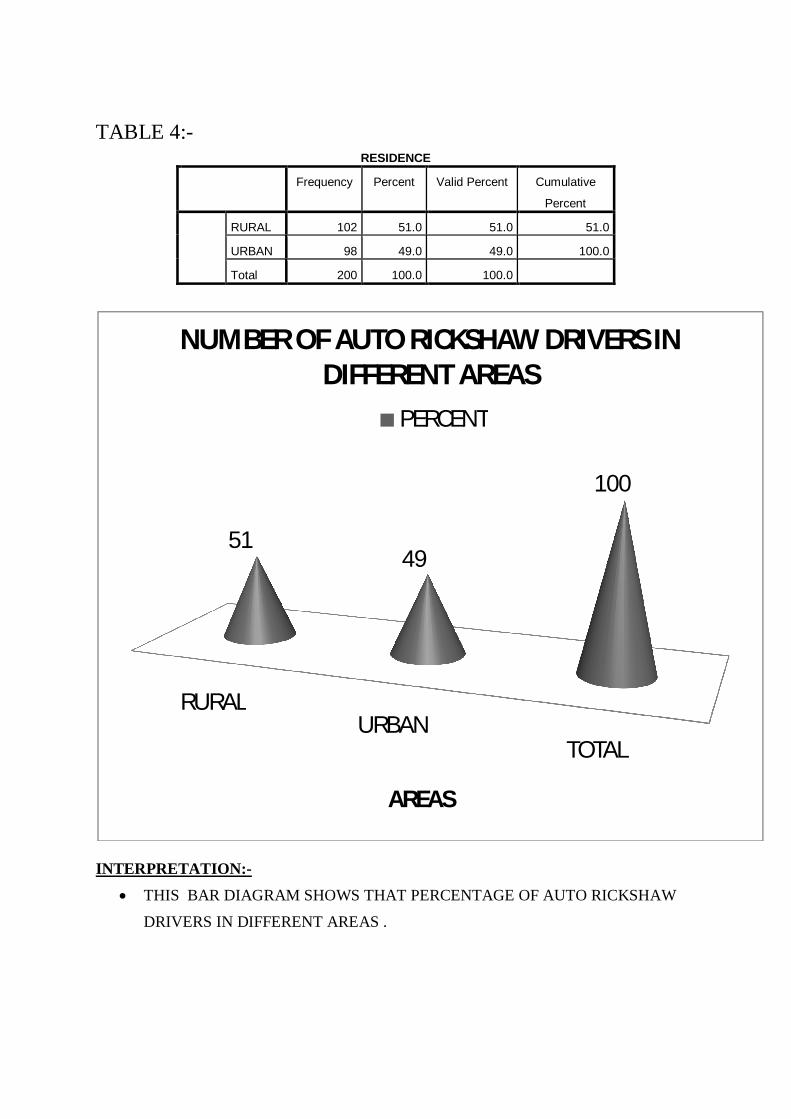
TABLE 4:-
RESIDENCE Frequency Percent Valid Percent Cumulative
Percent
RURAL 102 51.0 51.0 51.0
URBAN 98 49.0 49.0 100.0
Total 200 100.0 100.0
INTERPRETATION:-
THIS BAR DIAGRAM SHOWS THAT PERCENTAGE OF AUTO RICKSHAW
DRIVERS IN DIFFERENT AREAS .
RURALURBAN
TOTAL
5149
100
AREAS
NUMBER OF AUTO RICKSHAW DRIVERS IN DIFFERENT AREAS
PERCENT
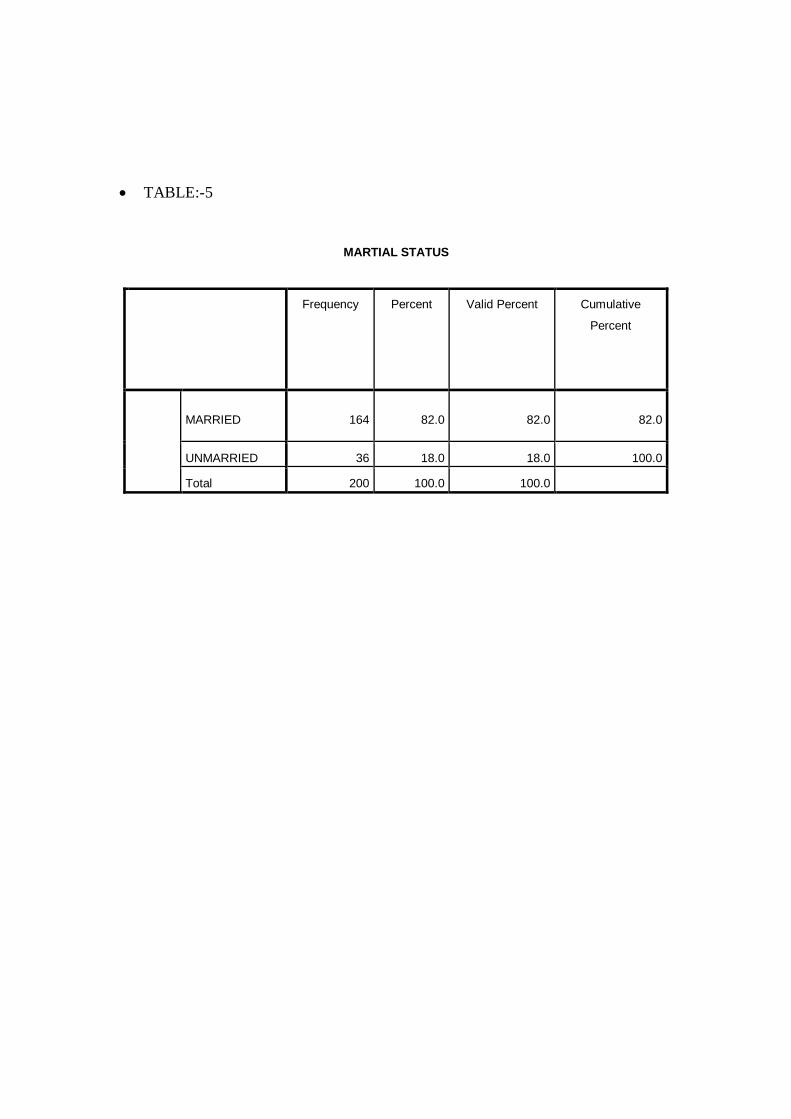
TABLE:-5
MARTIAL STATUS
Frequency Percent Valid Percent Cumulative
Percent
MARRIED 164 82.0 82.0 82.0
UNMARRIED 36 18.0 18.0 100.0
Total 200 100.0 100.0
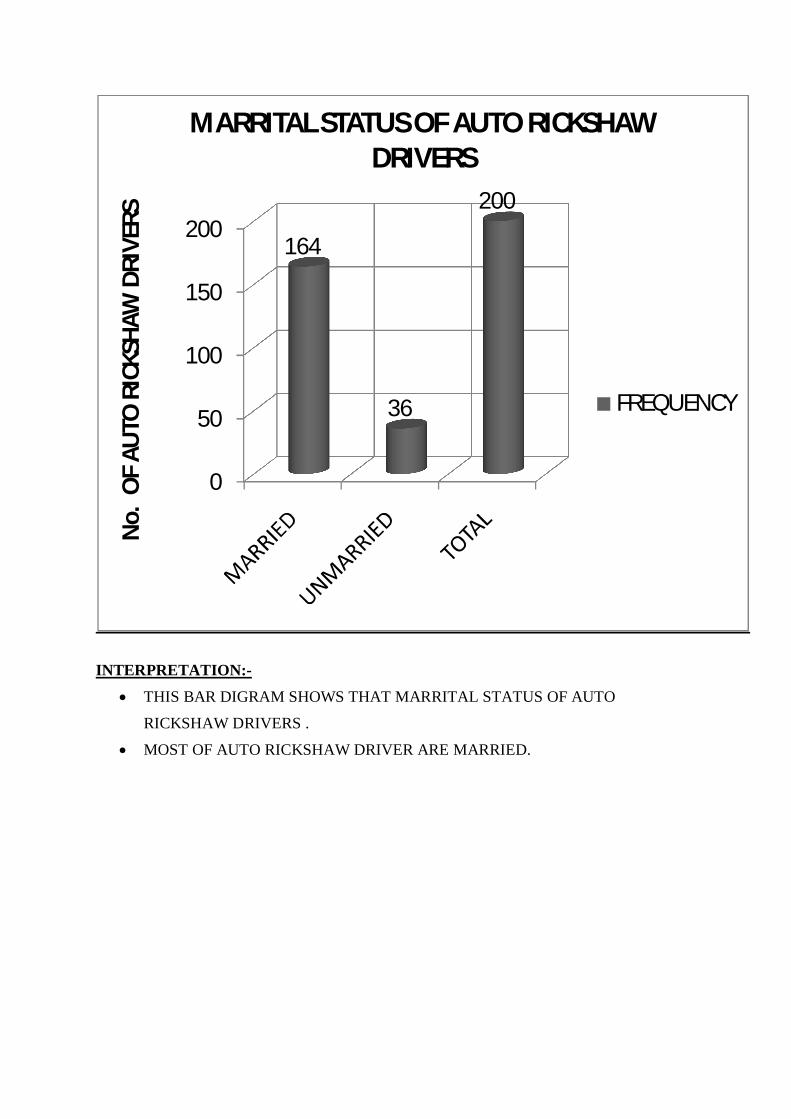
INTERPRETATION:-
THIS BAR DIGRAM SHOWS THAT MARRITAL STATUS OF AUTO
RICKSHAW DRIVERS .
MOST OF AUTO RICKSHAW DRIVER ARE MARRIED.
0
50
100
150
200164
36
200
No.
OF
AUTO
RIC
KSHA
W D
RIVE
RSMARRITAL STATUS OF AUTO RICKSHAW
DRIVERS
FREQUENCY
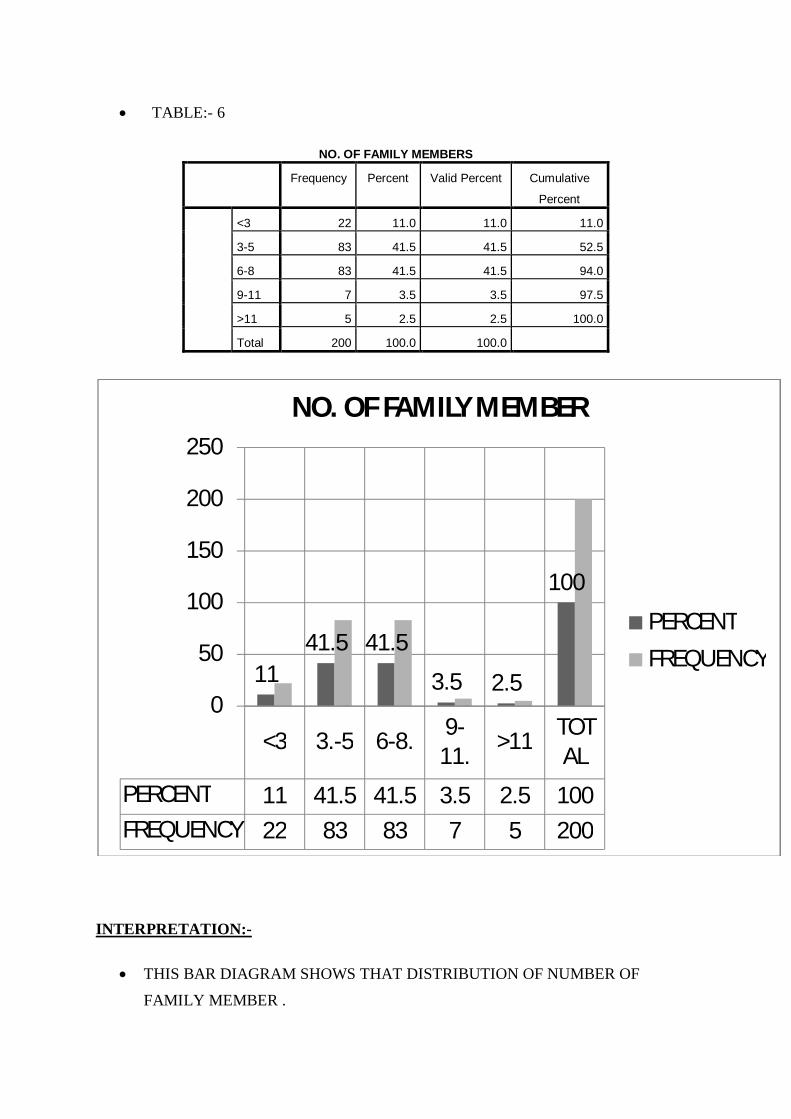
TABLE:- 6
NO. OF FAMILY MEMBERS Frequency Percent Valid Percent Cumulative
Percent
<3 22 11.0 11.0 11.0
3-5 83 41.5 41.5 52.5
6-8 83 41.5 41.5 94.0
9-11 7 3.5 3.5 97.5
>11 5 2.5 2.5 100.0
Total 200 100.0 100.0
INTERPRETATION:-
THIS BAR DIAGRAM SHOWS THAT DISTRIBUTION OF NUMBER OF
FAMILY MEMBER .
<3 3.-5 6-8. 9-11. >11 TOT
AL
PERCENT 11 41.5 41.5 3.5 2.5 100FREQUENCY 22 83 83 7 5 200
1141.5 41.5
3.5 2.5
100
0
50
100
150
200
250NO. OF FAMILY MEMBER
PERCENTFREQUENCY
41.5 PERCENT AUTO RICKSHAW DRIVERS HAVE 3-5 FAMILY AND ALSO
41.5 PERCENT AUTO RICKSHAW DRIVERS HAVE 6-8 FAMILY MEMBERS .
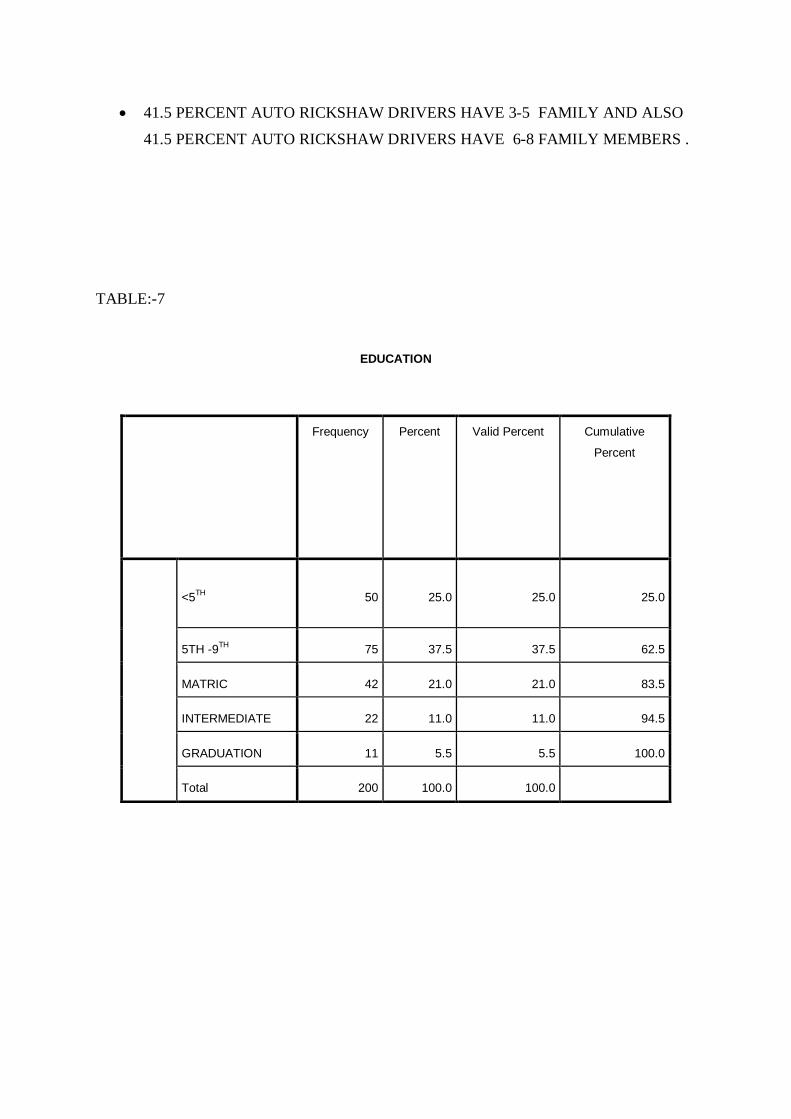
TABLE:-7
EDUCATION
Frequency Percent Valid Percent Cumulative
Percent
<5TH 50 25.0 25.0 25.0
5TH -9TH 75 37.5 37.5 62.5
MATRIC 42 21.0 21.0 83.5
INTERMEDIATE 22 11.0 11.0 94.5
GRADUATION 11 5.5 5.5 100.0
Total 200 100.0 100.0
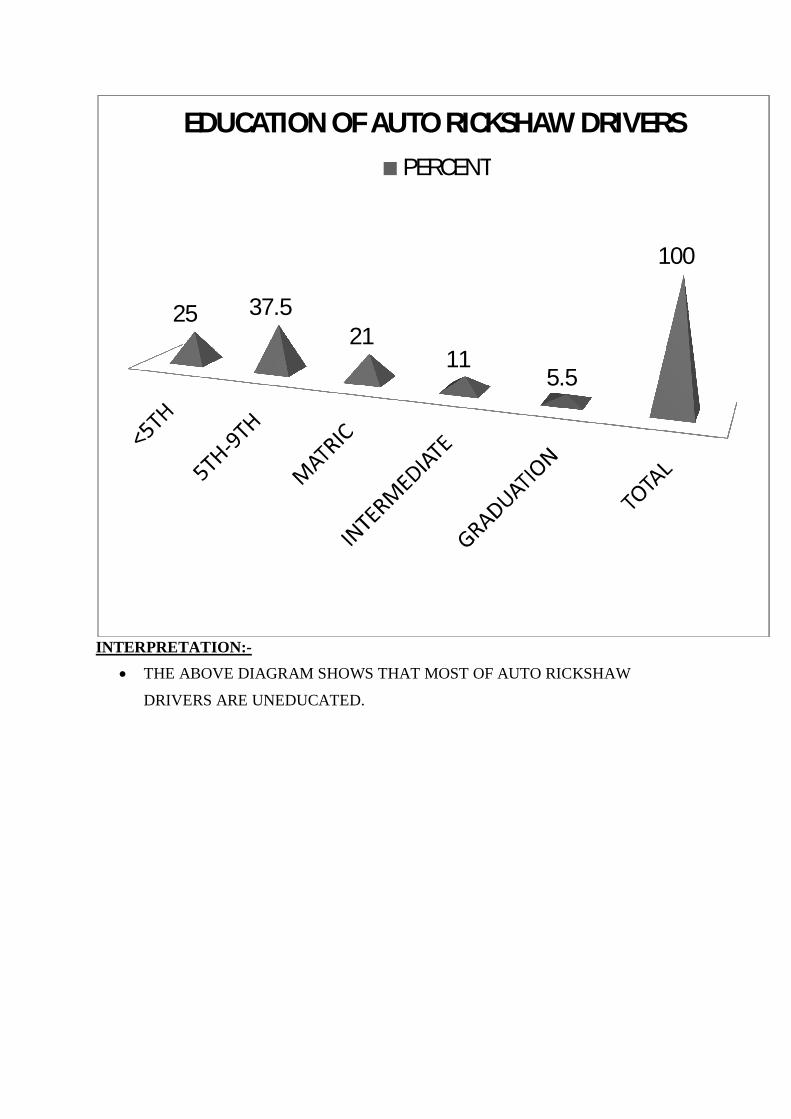
INTERPRETATION:-
THE ABOVE DIAGRAM SHOWS THAT MOST OF AUTO RICKSHAW
DRIVERS ARE UNEDUCATED.
25 37.521
115.5
100
EDUCATION OF AUTO RICKSHAW DRIVERSPERCENT
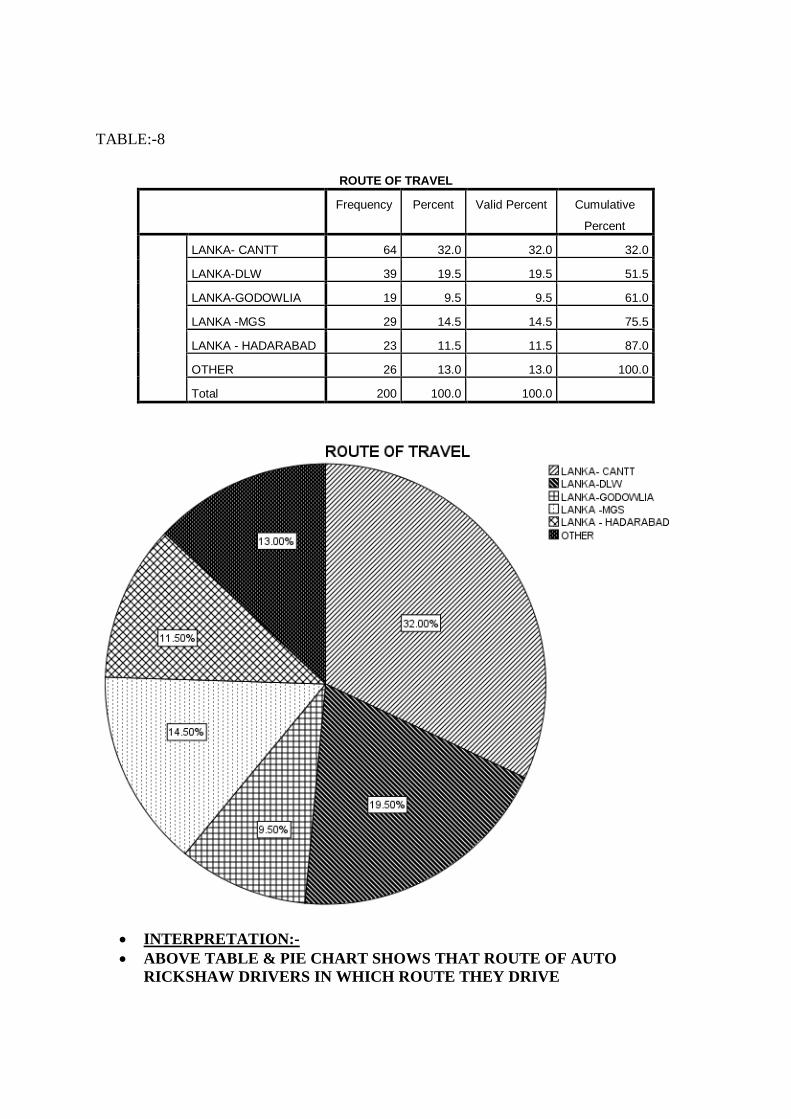
TABLE:-8
ROUTE OF TRAVEL Frequency Percent Valid Percent Cumulative
Percent
LANKA- CANTT 64 32.0 32.0 32.0
LANKA-DLW 39 19.5 19.5 51.5
LANKA-GODOWLIA 19 9.5 9.5 61.0
LANKA -MGS 29 14.5 14.5 75.5
LANKA - HADARABAD 23 11.5 11.5 87.0
OTHER 26 13.0 13.0 100.0
Total 200 100.0 100.0
INTERPRETATION:- ABOVE TABLE & PIE CHART SHOWS THAT ROUTE OF AUTO
RICKSHAW DRIVERS IN WHICH ROUTE THEY DRIVE
32% DRIVE IN LANKA-CANT ,19.5% DRIVE IN LANKA-DLW,9.5% DRIVE IN LANKA-GODOWLIA,14.5% DRIVE IN LANKA-MGS ,11.5% DRIVE IN LANKA-HADRABAD GATE AND 13% IN OTHER ROUTE.
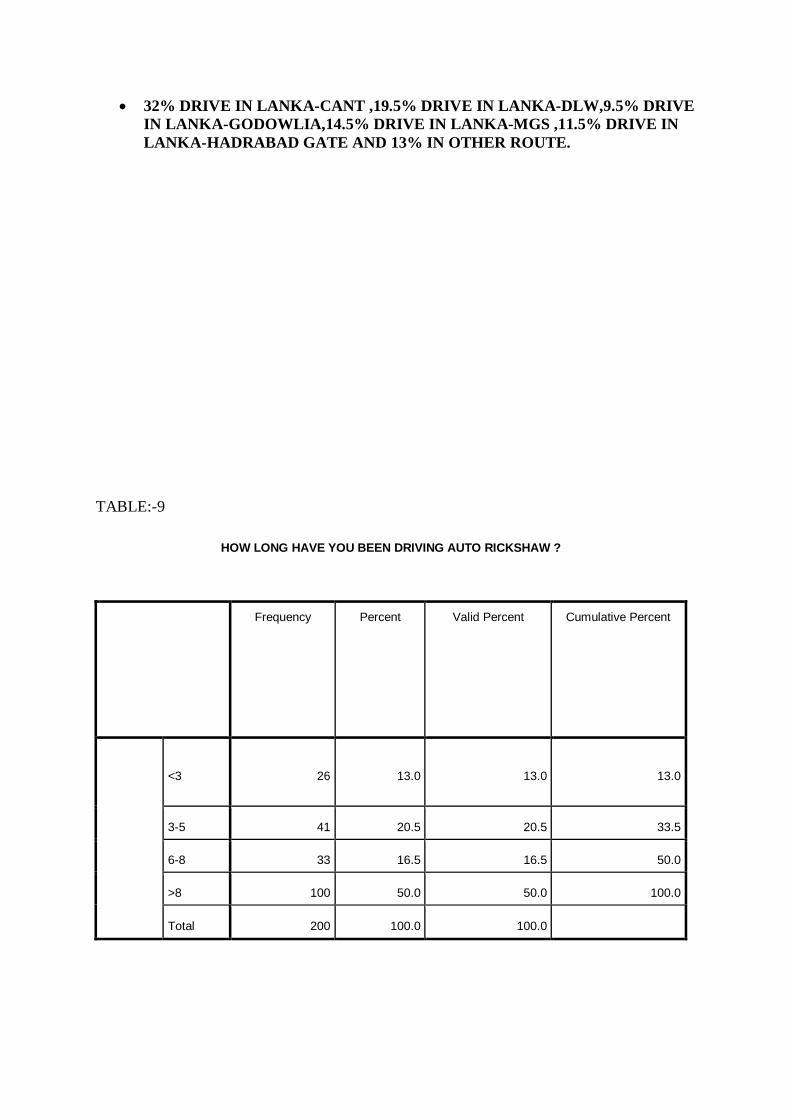
TABLE:-9
HOW LONG HAVE YOU BEEN DRIVING AUTO RICKSHAW ?
Frequency Percent Valid Percent Cumulative Percent
<3 26 13.0 13.0 13.0
3-5 41 20.5 20.5 33.5
6-8 33 16.5 16.5 50.0
>8 100 50.0 50.0 100.0
Total 200 100.0 100.0
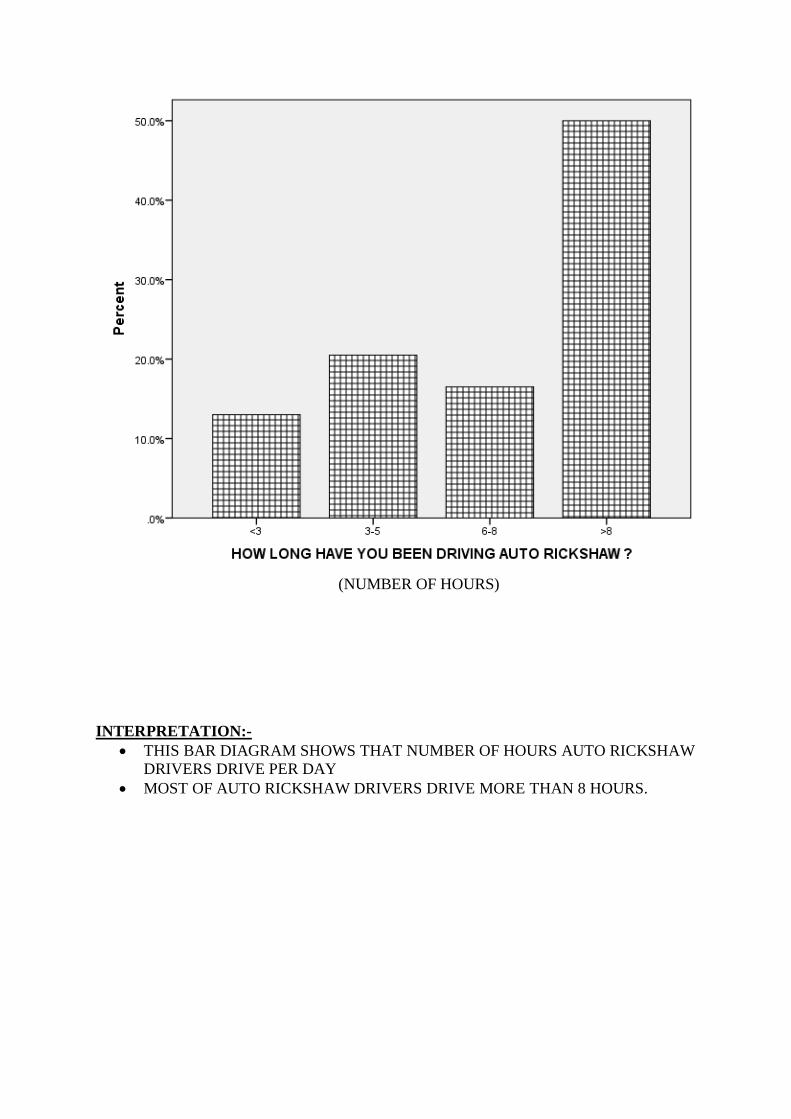
(NUMBER OF HOURS)
INTERPRETATION:-
THIS BAR DIAGRAM SHOWS THAT NUMBER OF HOURS AUTO RICKSHAW DRIVERS DRIVE PER DAY
MOST OF AUTO RICKSHAW DRIVERS DRIVE MORE THAN 8 HOURS.
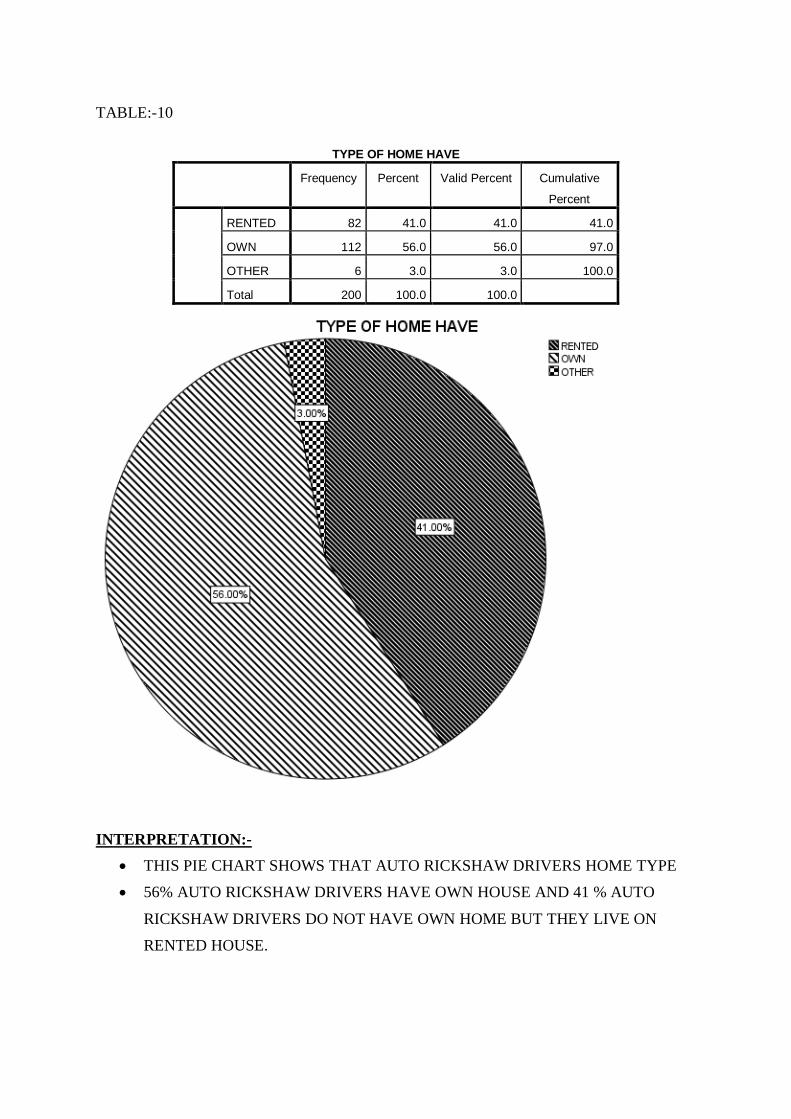
TABLE:-10
TYPE OF HOME HAVE Frequency Percent Valid Percent Cumulative
Percent
RENTED 82 41.0 41.0 41.0
OWN 112 56.0 56.0 97.0
OTHER 6 3.0 3.0 100.0
Total 200 100.0 100.0
INTERPRETATION:-
THIS PIE CHART SHOWS THAT AUTO RICKSHAW DRIVERS HOME TYPE
56% AUTO RICKSHAW DRIVERS HAVE OWN HOUSE AND 41 % AUTO
RICKSHAW DRIVERS DO NOT HAVE OWN HOME BUT THEY LIVE ON
RENTED HOUSE.
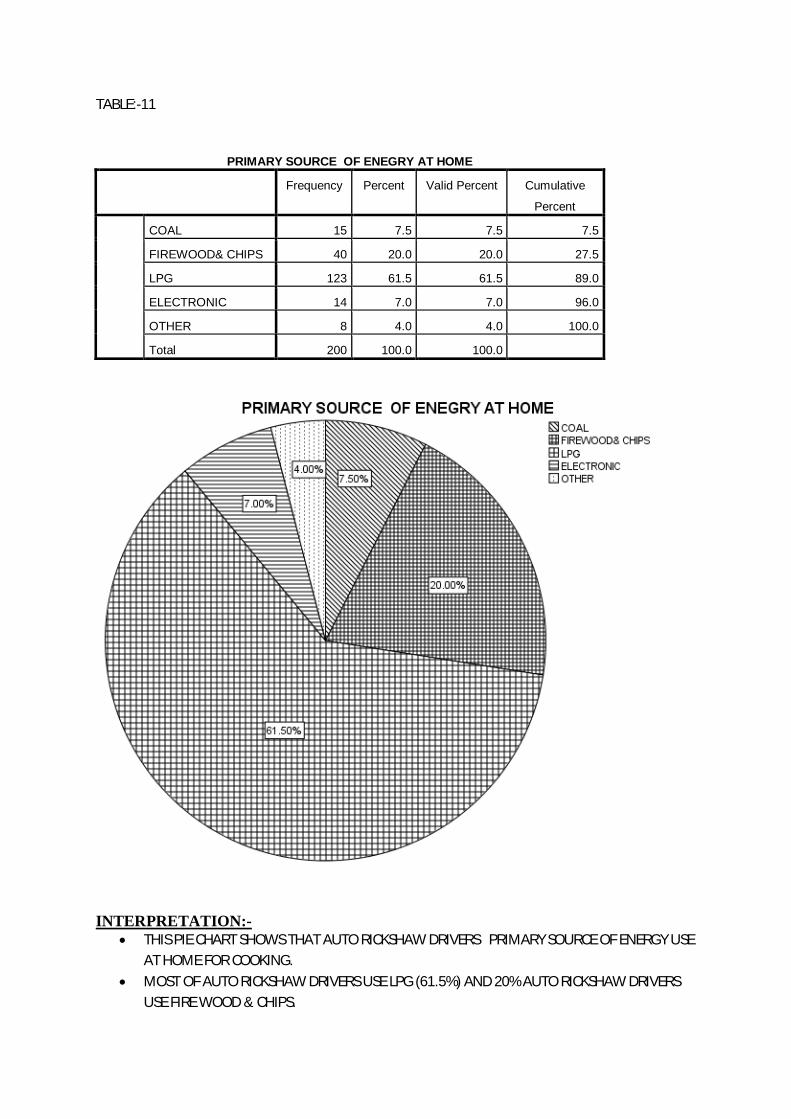
TABLE:-11
PRIMARY SOURCE OF ENEGRY AT HOME
Frequency Percent Valid Percent Cumulative
Percent
COAL 15 7.5 7.5 7.5
FIREWOOD& CHIPS 40 20.0 20.0 27.5
LPG 123 61.5 61.5 89.0
ELECTRONIC 14 7.0 7.0 96.0
OTHER 8 4.0 4.0 100.0
Total 200 100.0 100.0
INTERPRETATION:-
THIS PIE CHART SHOWS THAT AUTO RICKSHAW DRIVERS PRIMARY SOURCE OF ENERGY USE AT HOME FOR COOKING.
MOST OF AUTO RICKSHAW DRIVERS USE LPG (61.5%) AND 20% AUTO RICKSHAW DRIVERS USE FIRE WOOD & CHIPS.
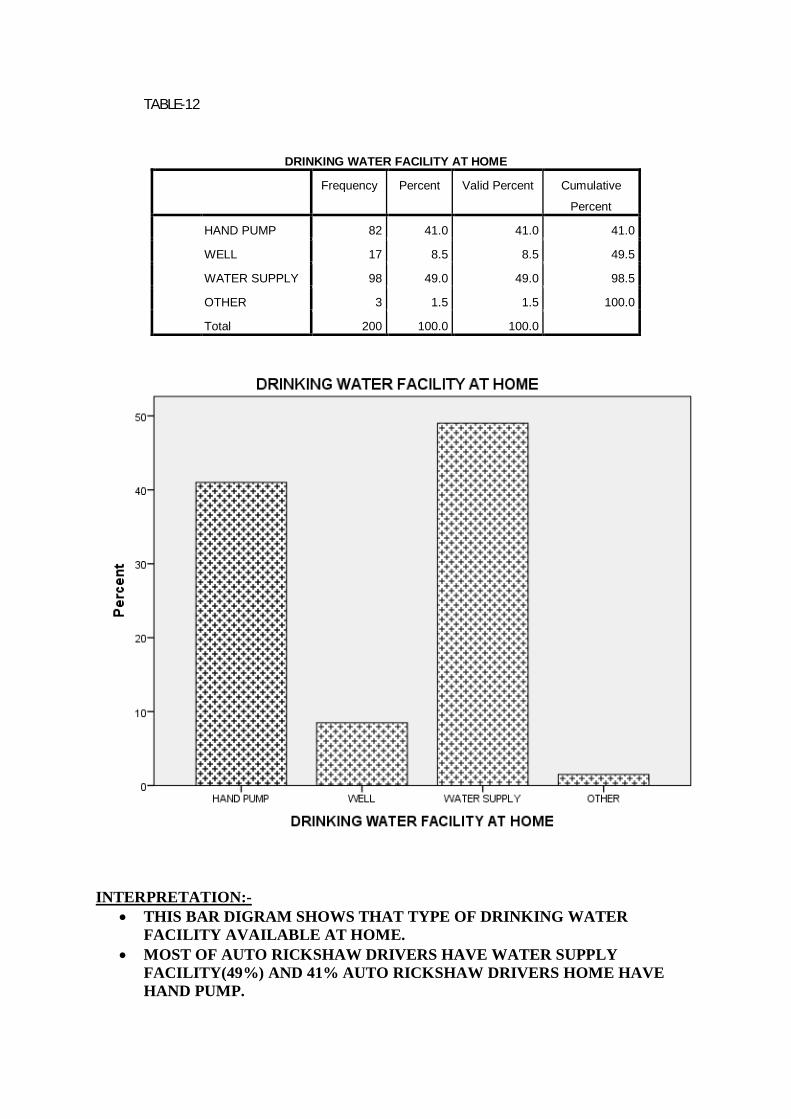
TABLE-12
DRINKING WATER FACILITY AT HOME
Frequency Percent Valid Percent Cumulative
Percent
HAND PUMP 82 41.0 41.0 41.0
WELL 17 8.5 8.5 49.5
WATER SUPPLY 98 49.0 49.0 98.5
OTHER 3 1.5 1.5 100.0
Total 200 100.0 100.0
INTERPRETATION:-
THIS BAR DIGRAM SHOWS THAT TYPE OF DRINKING WATER FACILITY AVAILABLE AT HOME.
MOST OF AUTO RICKSHAW DRIVERS HAVE WATER SUPPLY FACILITY(49%) AND 41% AUTO RICKSHAW DRIVERS HOME HAVE HAND PUMP.
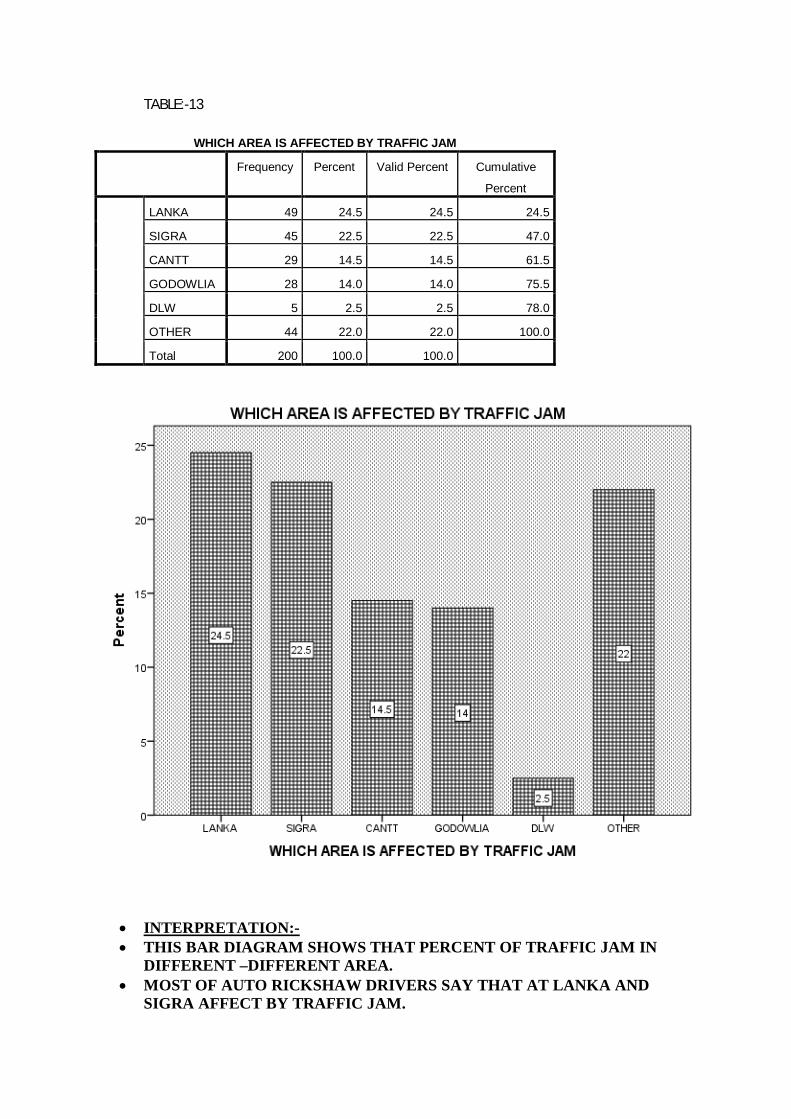
TABLE:-13
WHICH AREA IS AFFECTED BY TRAFFIC JAM Frequency Percent Valid Percent Cumulative
Percent
LANKA 49 24.5 24.5 24.5
SIGRA 45 22.5 22.5 47.0
CANTT 29 14.5 14.5 61.5
GODOWLIA 28 14.0 14.0 75.5
DLW 5 2.5 2.5 78.0
OTHER 44 22.0 22.0 100.0
Total 200 100.0 100.0
INTERPRETATION:- THIS BAR DIAGRAM SHOWS THAT PERCENT OF TRAFFIC JAM IN
DIFFERENT –DIFFERENT AREA. MOST OF AUTO RICKSHAW DRIVERS SAY THAT AT LANKA AND
SIGRA AFFECT BY TRAFFIC JAM.

TABLE:-14
HAVE YOU FACE ANY MEDICAL PROBLEM IN LAST SIX MONTH Frequency Percent Valid Percent Cumulative
Percent
YES 82 41.0 41.0 41.0
NO 118 59.0 59.0 100.0
Total 200 100.0 100.0
INTERPRETATION:- ABOVE TABLE AND PIE CHART SHOWS HEALTH CONDITION OF
AUTO RICKSHAW DRIVERS PREVIOUS SIX MONTHS 41% AUTO RICKSHAW DRIVERS FACED MEDICAL PROBLEM
PREVIOUS SIX MONTHS AND 59% DID NOT FACED ANY MEDICAL PROBLEM PREVIOUS SIX MONTHS.
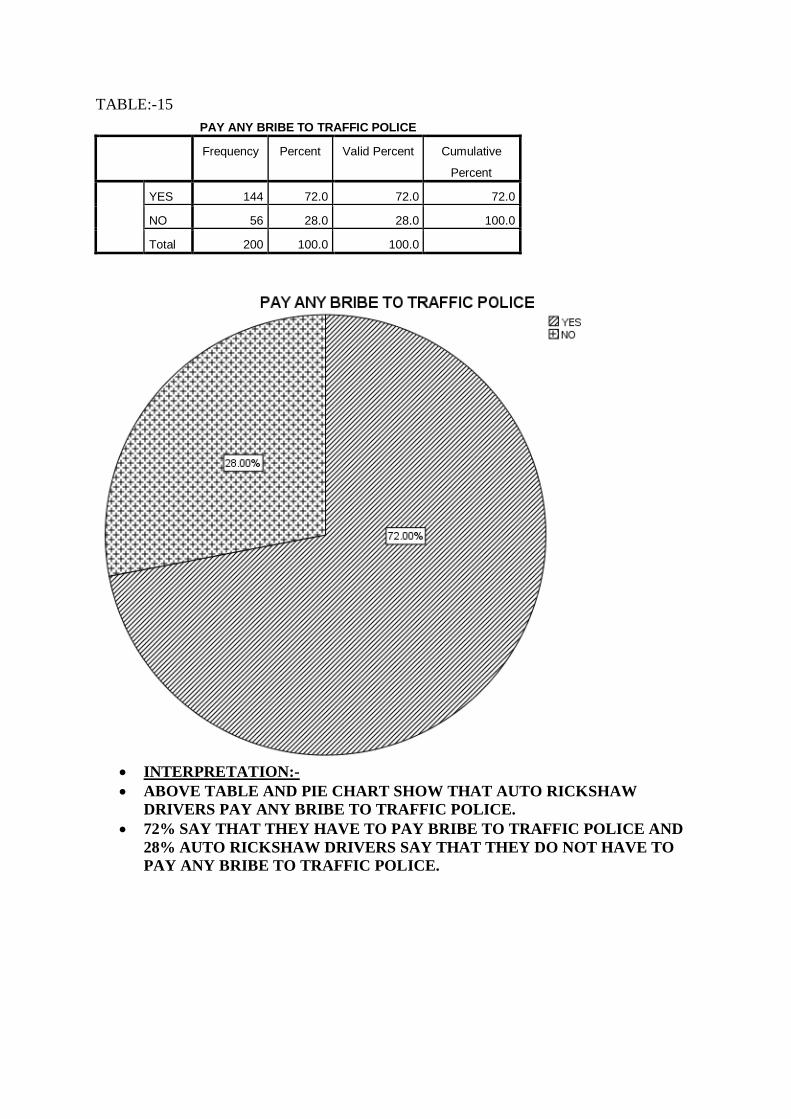
TABLE:-15 PAY ANY BRIBE TO TRAFFIC POLICE
Frequency Percent Valid Percent Cumulative
Percent
YES 144 72.0 72.0 72.0
NO 56 28.0 28.0 100.0
Total 200 100.0 100.0
INTERPRETATION:- ABOVE TABLE AND PIE CHART SHOW THAT AUTO RICKSHAW
DRIVERS PAY ANY BRIBE TO TRAFFIC POLICE. 72% SAY THAT THEY HAVE TO PAY BRIBE TO TRAFFIC POLICE AND
28% AUTO RICKSHAW DRIVERS SAY THAT THEY DO NOT HAVE TO PAY ANY BRIBE TO TRAFFIC POLICE.
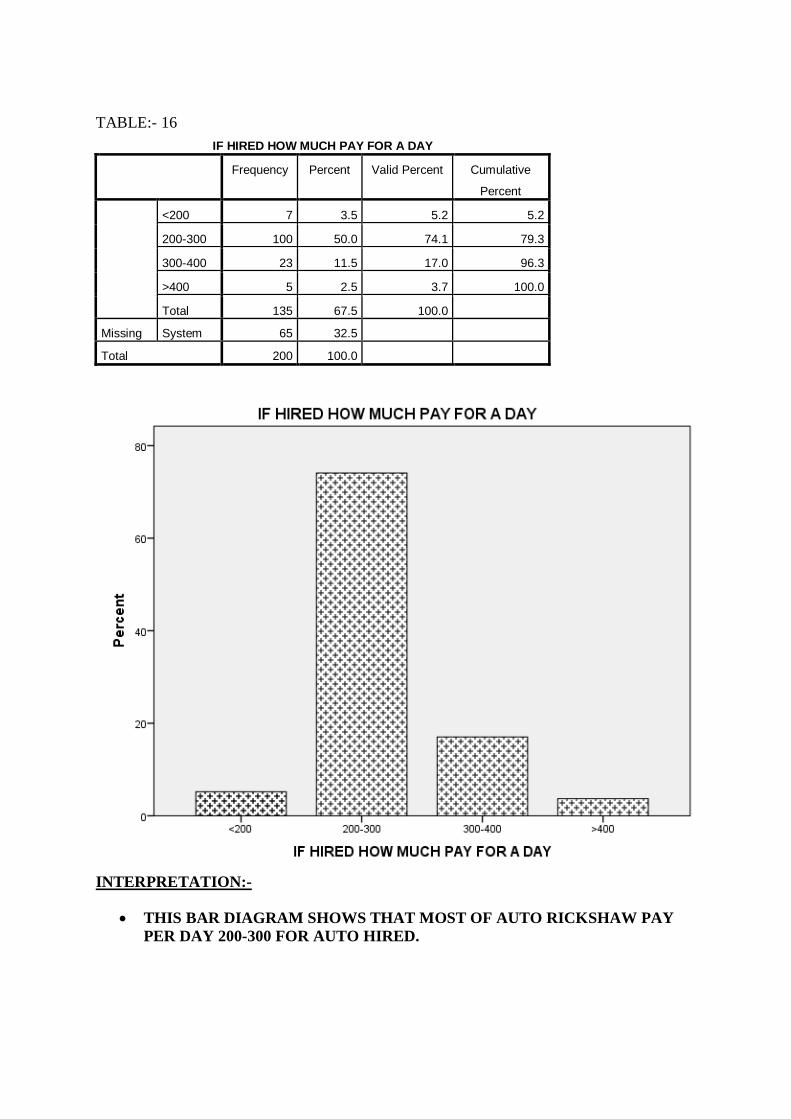
TABLE:- 16
IF HIRED HOW MUCH PAY FOR A DAY Frequency Percent Valid Percent Cumulative
Percent
<200 7 3.5 5.2 5.2
200-300 100 50.0 74.1 79.3
300-400 23 11.5 17.0 96.3
>400 5 2.5 3.7 100.0
Total 135 67.5 100.0 Missing System 65 32.5
Total 200 100.0
INTERPRETATION:-
THIS BAR DIAGRAM SHOWS THAT MOST OF AUTO RICKSHAW PAY PER DAY 200-300 FOR AUTO HIRED.
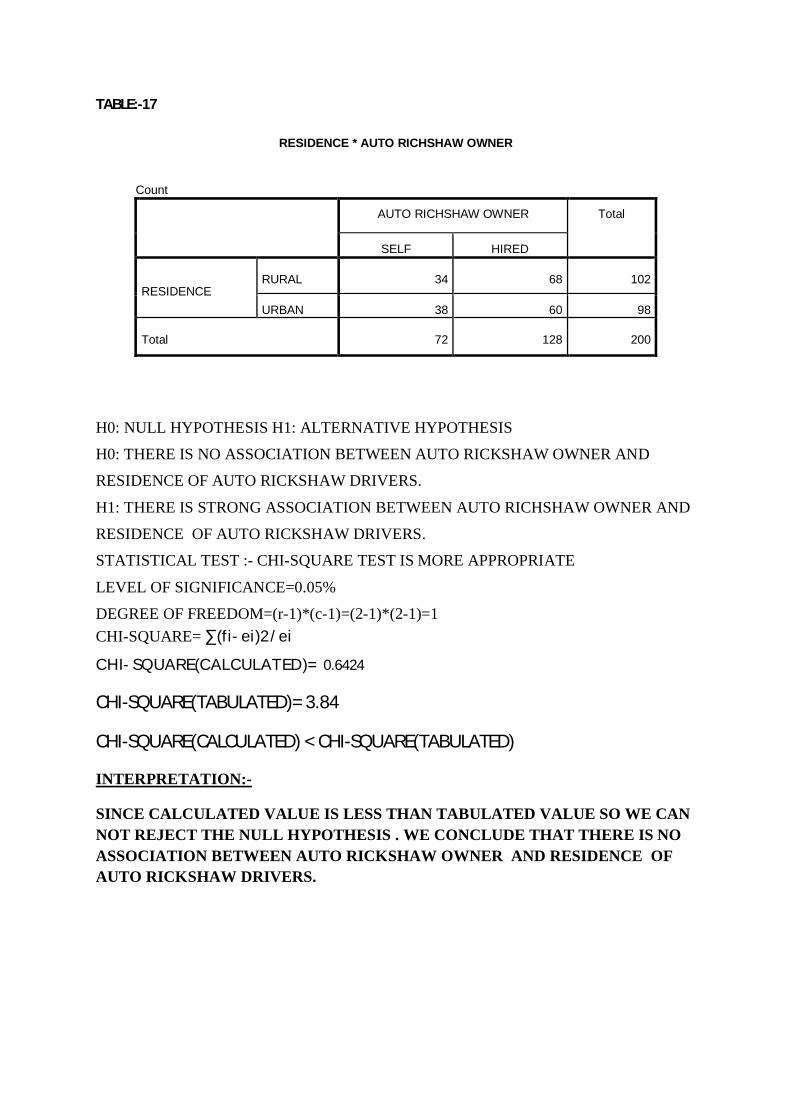
TABLE:-17
RESIDENCE * AUTO RICHSHAW OWNER
Count AUTO RICHSHAW OWNER Total
SELF HIRED
RESIDENCE RURAL 34 68 102
URBAN 38 60 98
Total 72 128 200
H0: NULL HYPOTHESIS H1: ALTERNATIVE HYPOTHESIS
H0: THERE IS NO ASSOCIATION BETWEEN AUTO RICKSHAW OWNER AND
RESIDENCE OF AUTO RICKSHAW DRIVERS.
H1: THERE IS STRONG ASSOCIATION BETWEEN AUTO RICHSHAW OWNER AND
RESIDENCE OF AUTO RICKSHAW DRIVERS.
STATISTICAL TEST :- CHI-SQUARE TEST IS MORE APPROPRIATE
LEVEL OF SIGNIFICANCE=0.05%
DEGREE OF FREEDOM=(r-1)*(c-1)=(2-1)*(2-1)=1 CHI-SQUARE= ∑(fi-ei)2/ei CHI-SQUARE(CALCULATED)= 0.6424
CHI-SQUARE(TABULATED)= 3.84
CHI-SQUARE(CALCULATED) < CHI-SQUARE(TABULATED)
INTERPRETATION:-
SINCE CALCULATED VALUE IS LESS THAN TABULATED VALUE SO WE CAN NOT REJECT THE NULL HYPOTHESIS . WE CONCLUDE THAT THERE IS NO ASSOCIATION BETWEEN AUTO RICKSHAW OWNER AND RESIDENCE OF AUTO RICKSHAW DRIVERS.
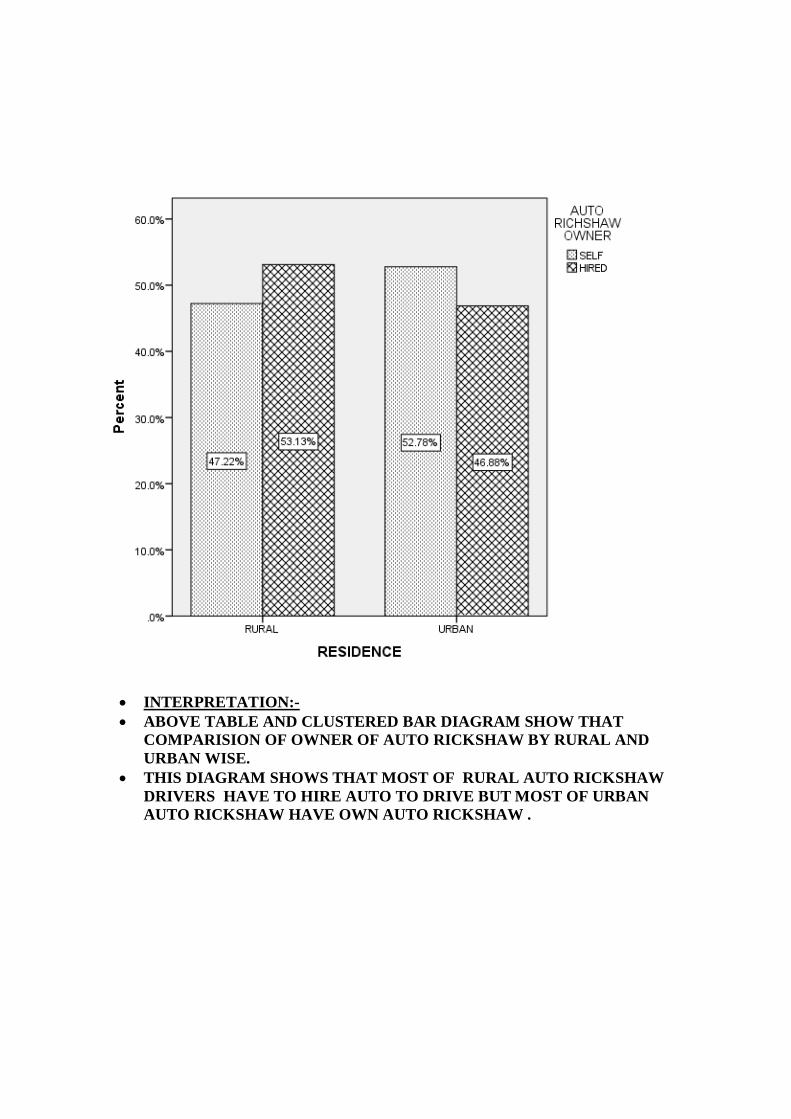
INTERPRETATION:- ABOVE TABLE AND CLUSTERED BAR DIAGRAM SHOW THAT
COMPARISION OF OWNER OF AUTO RICKSHAW BY RURAL AND URBAN WISE.
THIS DIAGRAM SHOWS THAT MOST OF RURAL AUTO RICKSHAW DRIVERS HAVE TO HIRE AUTO TO DRIVE BUT MOST OF URBAN AUTO RICKSHAW HAVE OWN AUTO RICKSHAW .
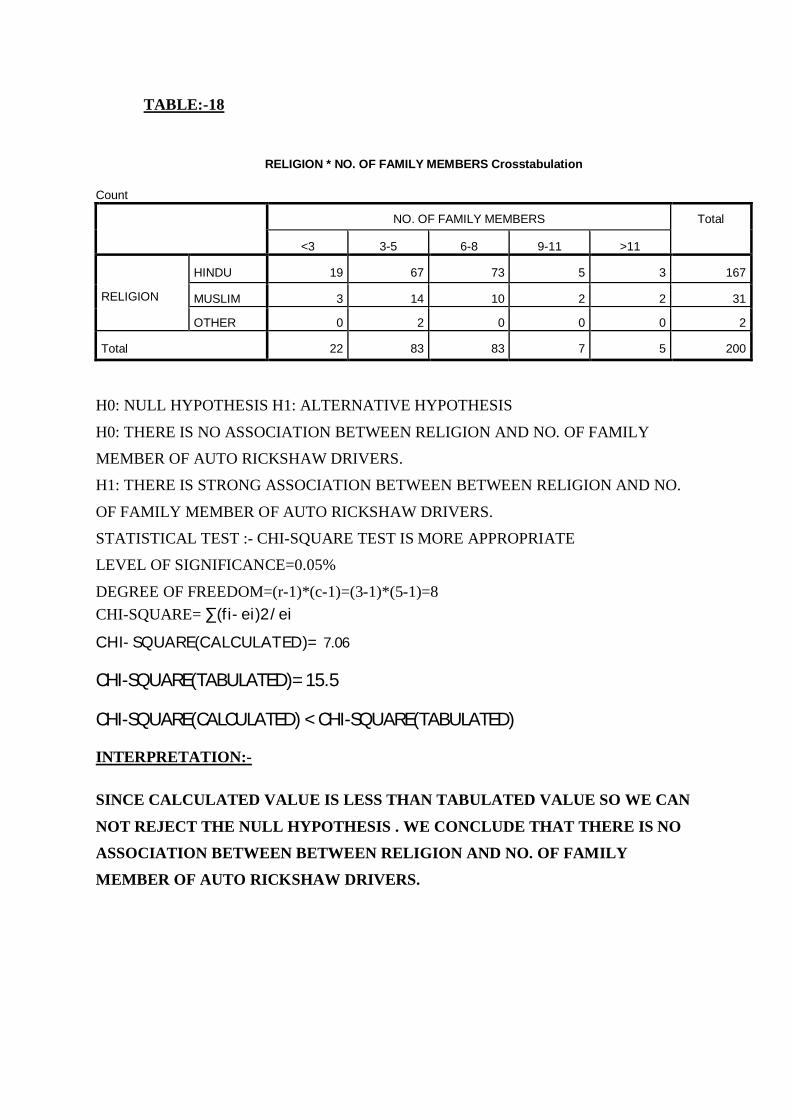
TABLE:-18
RELIGION * NO. OF FAMILY MEMBERS Crosstabulation
Count NO. OF FAMILY MEMBERS Total
<3 3-5 6-8 9-11 >11
RELIGION
HINDU 19 67 73 5 3 167
MUSLIM 3 14 10 2 2 31
OTHER 0 2 0 0 0 2
Total 22 83 83 7 5 200
H0: NULL HYPOTHESIS H1: ALTERNATIVE HYPOTHESIS
H0: THERE IS NO ASSOCIATION BETWEEN RELIGION AND NO. OF FAMILY
MEMBER OF AUTO RICKSHAW DRIVERS.
H1: THERE IS STRONG ASSOCIATION BETWEEN BETWEEN RELIGION AND NO.
OF FAMILY MEMBER OF AUTO RICKSHAW DRIVERS.
STATISTICAL TEST :- CHI-SQUARE TEST IS MORE APPROPRIATE
LEVEL OF SIGNIFICANCE=0.05%
DEGREE OF FREEDOM=(r-1)*(c-1)=(3-1)*(5-1)=8 CHI-SQUARE= ∑(fi-ei)2/ei CHI-SQUARE(CALCULATED)= 7.06
CHI-SQUARE(TABULATED)= 15.5
CHI-SQUARE(CALCULATED) < CHI-SQUARE(TABULATED)
INTERPRETATION:-
SINCE CALCULATED VALUE IS LESS THAN TABULATED VALUE SO WE CAN
NOT REJECT THE NULL HYPOTHESIS . WE CONCLUDE THAT THERE IS NO
ASSOCIATION BETWEEN BETWEEN RELIGION AND NO. OF FAMILY
MEMBER OF AUTO RICKSHAW DRIVERS.
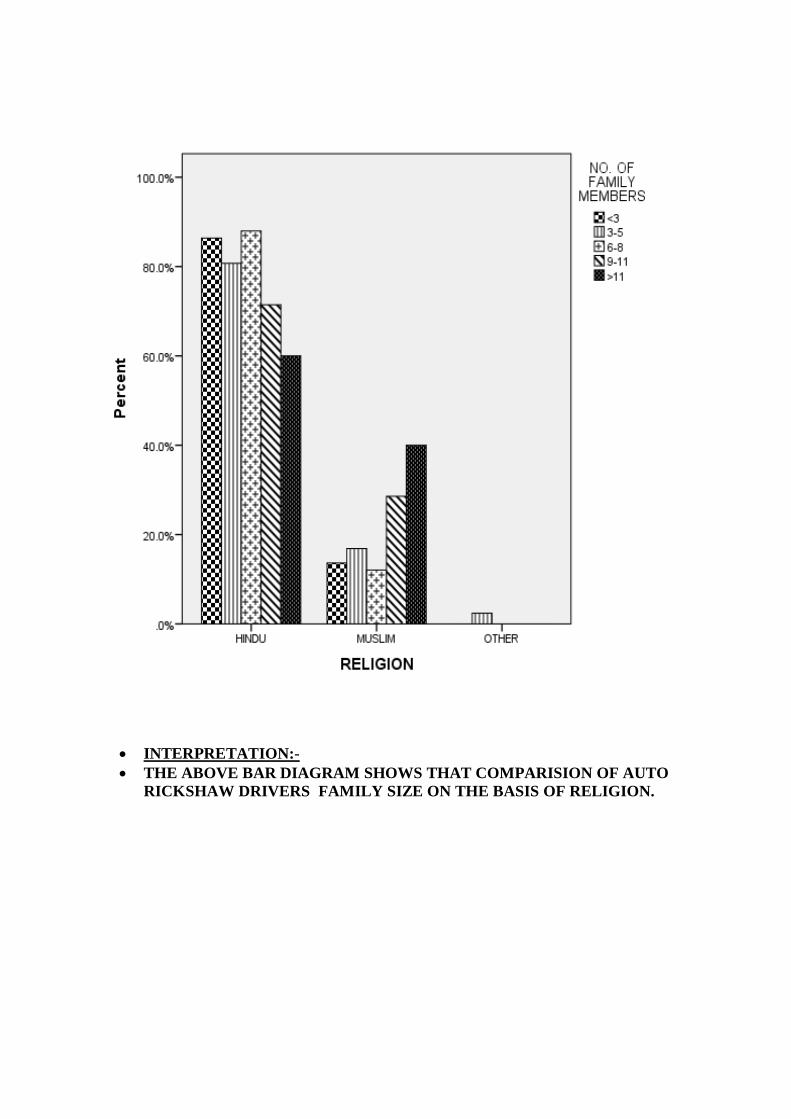
INTERPRETATION:- THE ABOVE BAR DIAGRAM SHOWS THAT COMPARISION OF AUTO
RICKSHAW DRIVERS FAMILY SIZE ON THE BASIS OF RELIGION.
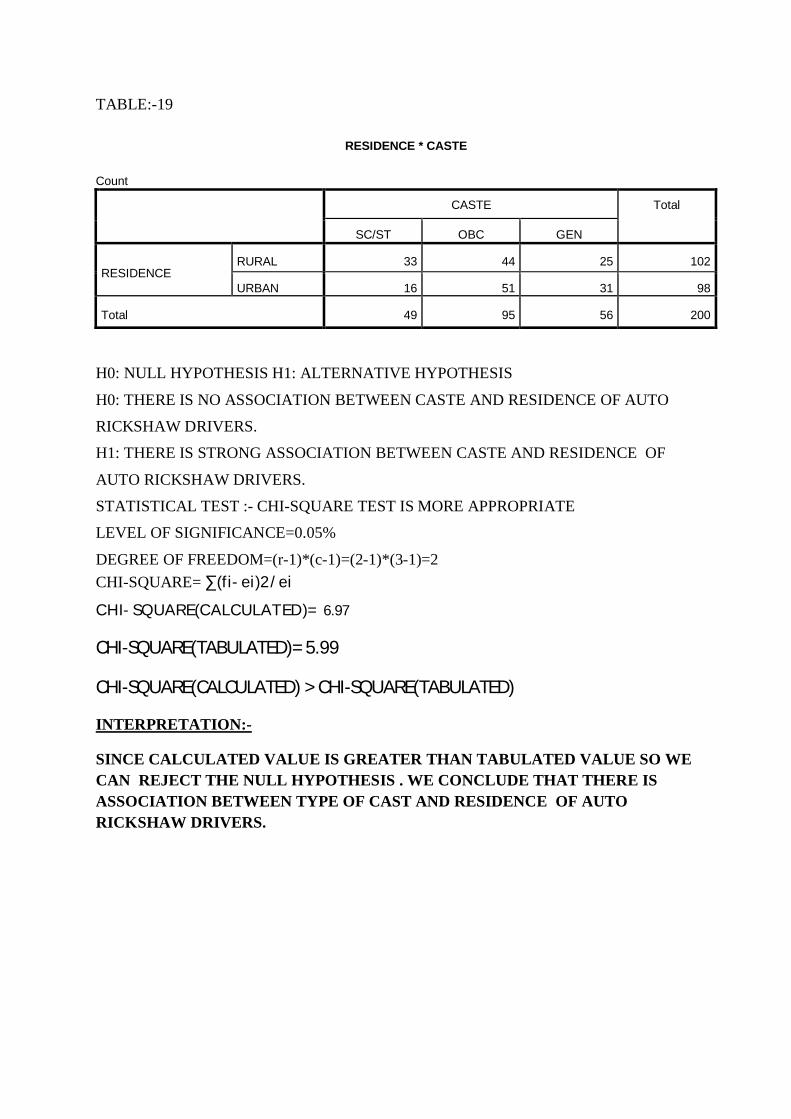
TABLE:-19
RESIDENCE * CASTE
Count CASTE Total
SC/ST OBC GEN
RESIDENCE RURAL 33 44 25 102
URBAN 16 51 31 98
Total 49 95 56 200
H0: NULL HYPOTHESIS H1: ALTERNATIVE HYPOTHESIS
H0: THERE IS NO ASSOCIATION BETWEEN CASTE AND RESIDENCE OF AUTO
RICKSHAW DRIVERS.
H1: THERE IS STRONG ASSOCIATION BETWEEN CASTE AND RESIDENCE OF
AUTO RICKSHAW DRIVERS.
STATISTICAL TEST :- CHI-SQUARE TEST IS MORE APPROPRIATE
LEVEL OF SIGNIFICANCE=0.05%
DEGREE OF FREEDOM=(r-1)*(c-1)=(2-1)*(3-1)=2 CHI-SQUARE= ∑(fi-ei)2/ei CHI-SQUARE(CALCULATED)= 6.97
CHI-SQUARE(TABULATED)= 5.99
CHI-SQUARE(CALCULATED) > CHI-SQUARE(TABULATED)
INTERPRETATION:-
SINCE CALCULATED VALUE IS GREATER THAN TABULATED VALUE SO WE CAN REJECT THE NULL HYPOTHESIS . WE CONCLUDE THAT THERE IS ASSOCIATION BETWEEN TYPE OF CAST AND RESIDENCE OF AUTO RICKSHAW DRIVERS.
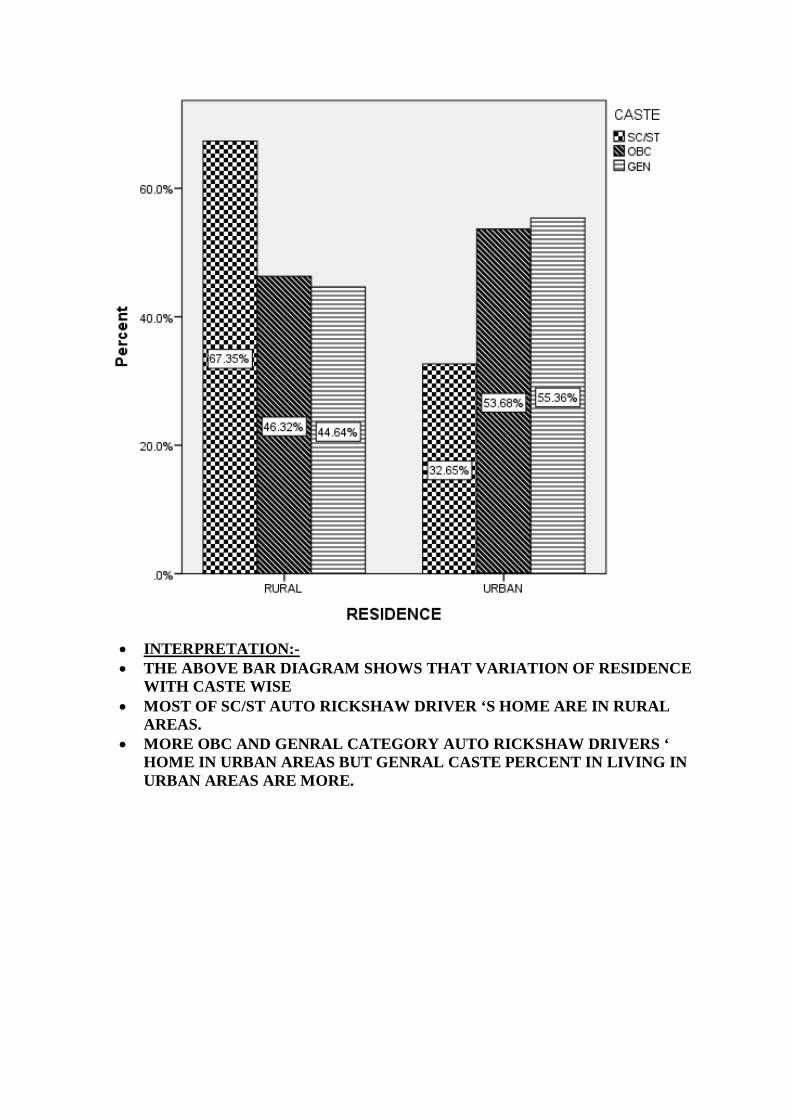
INTERPRETATION:- THE ABOVE BAR DIAGRAM SHOWS THAT VARIATION OF RESIDENCE
WITH CASTE WISE MOST OF SC/ST AUTO RICKSHAW DRIVER ‘S HOME ARE IN RURAL
AREAS. MORE OBC AND GENRAL CATEGORY AUTO RICKSHAW DRIVERS ‘
HOME IN URBAN AREAS BUT GENRAL CASTE PERCENT IN LIVING IN URBAN AREAS ARE MORE.
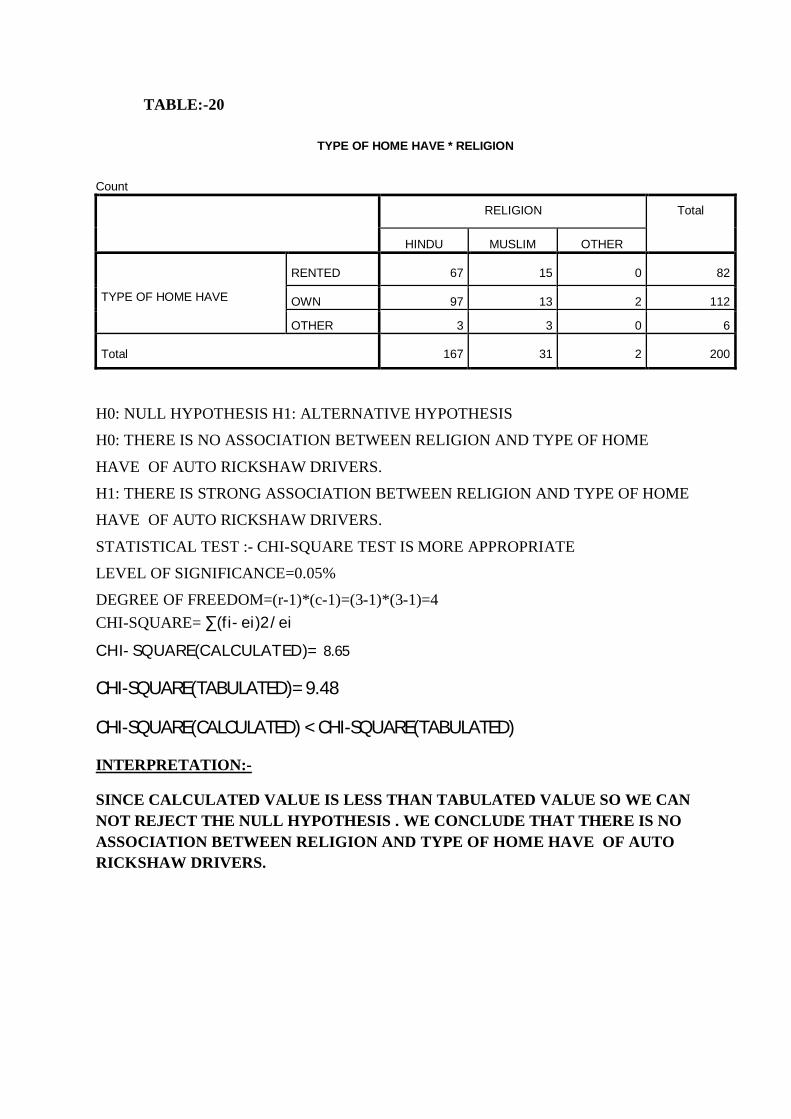
TABLE:-20
TYPE OF HOME HAVE * RELIGION
Count RELIGION Total
HINDU MUSLIM OTHER
TYPE OF HOME HAVE
RENTED 67 15 0 82
OWN 97 13 2 112
OTHER 3 3 0 6
Total 167 31 2 200
H0: NULL HYPOTHESIS H1: ALTERNATIVE HYPOTHESIS
H0: THERE IS NO ASSOCIATION BETWEEN RELIGION AND TYPE OF HOME
HAVE OF AUTO RICKSHAW DRIVERS.
H1: THERE IS STRONG ASSOCIATION BETWEEN RELIGION AND TYPE OF HOME
HAVE OF AUTO RICKSHAW DRIVERS.
STATISTICAL TEST :- CHI-SQUARE TEST IS MORE APPROPRIATE
LEVEL OF SIGNIFICANCE=0.05%
DEGREE OF FREEDOM=(r-1)*(c-1)=(3-1)*(3-1)=4 CHI-SQUARE= ∑(fi-ei)2/ei CHI-SQUARE(CALCULATED)= 8.65
CHI-SQUARE(TABULATED)= 9.48
CHI-SQUARE(CALCULATED) < CHI-SQUARE(TABULATED)
INTERPRETATION:-
SINCE CALCULATED VALUE IS LESS THAN TABULATED VALUE SO WE CAN NOT REJECT THE NULL HYPOTHESIS . WE CONCLUDE THAT THERE IS NO ASSOCIATION BETWEEN RELIGION AND TYPE OF HOME HAVE OF AUTO RICKSHAW DRIVERS.
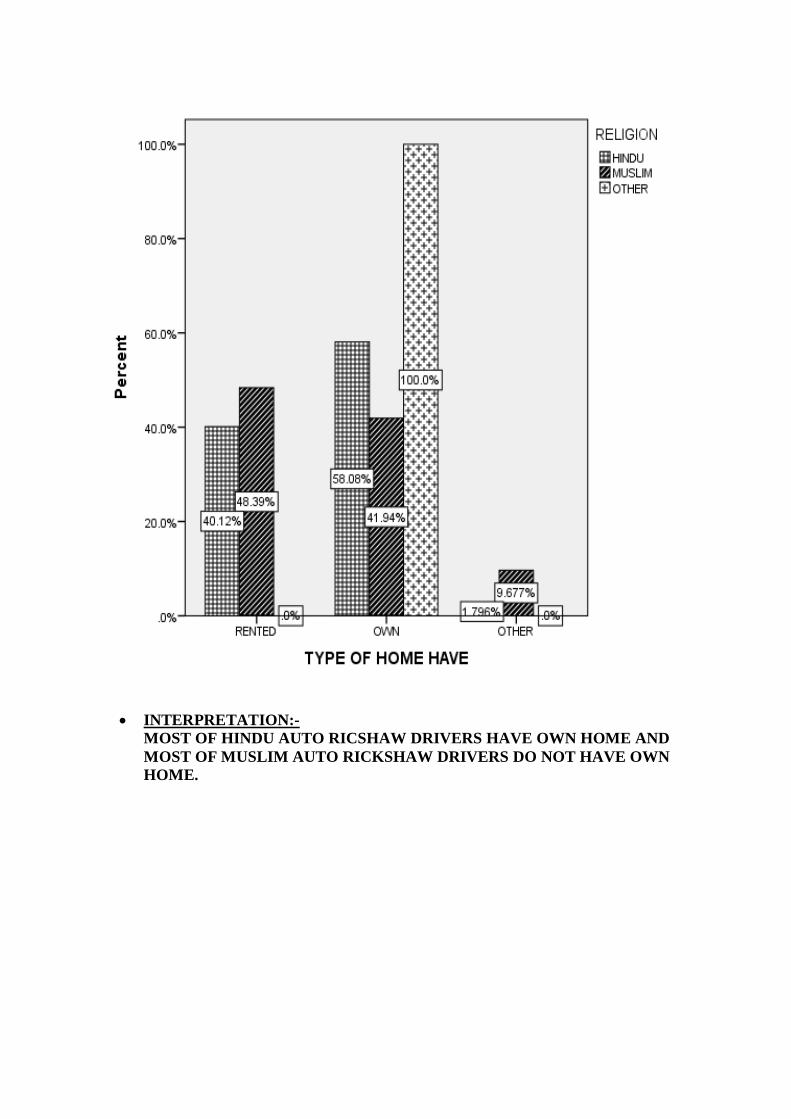
INTERPRETATION:- MOST OF HINDU AUTO RICSHAW DRIVERS HAVE OWN HOME AND MOST OF MUSLIM AUTO RICKSHAW DRIVERS DO NOT HAVE OWN HOME.
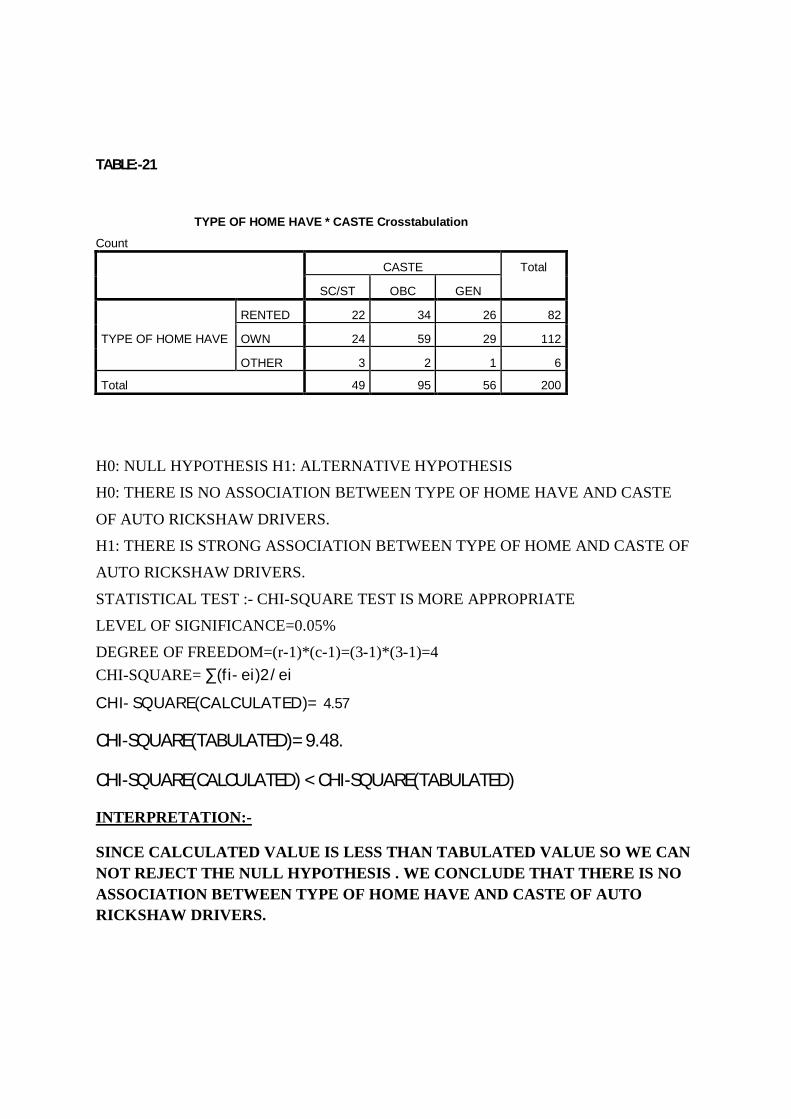
TABLE:-21
TYPE OF HOME HAVE * CASTE Crosstabulation
Count CASTE Total
SC/ST OBC GEN
TYPE OF HOME HAVE
RENTED 22 34 26 82
OWN 24 59 29 112
OTHER 3 2 1 6
Total 49 95 56 200
H0: NULL HYPOTHESIS H1: ALTERNATIVE HYPOTHESIS
H0: THERE IS NO ASSOCIATION BETWEEN TYPE OF HOME HAVE AND CASTE
OF AUTO RICKSHAW DRIVERS.
H1: THERE IS STRONG ASSOCIATION BETWEEN TYPE OF HOME AND CASTE OF
AUTO RICKSHAW DRIVERS.
STATISTICAL TEST :- CHI-SQUARE TEST IS MORE APPROPRIATE
LEVEL OF SIGNIFICANCE=0.05%
DEGREE OF FREEDOM=(r-1)*(c-1)=(3-1)*(3-1)=4 CHI-SQUARE= ∑(fi-ei)2/ei CHI-SQUARE(CALCULATED)= 4.57
CHI-SQUARE(TABULATED)= 9.48.
CHI-SQUARE(CALCULATED) < CHI-SQUARE(TABULATED)
INTERPRETATION:-
SINCE CALCULATED VALUE IS LESS THAN TABULATED VALUE SO WE CAN NOT REJECT THE NULL HYPOTHESIS . WE CONCLUDE THAT THERE IS NO ASSOCIATION BETWEEN TYPE OF HOME HAVE AND CASTE OF AUTO RICKSHAW DRIVERS.
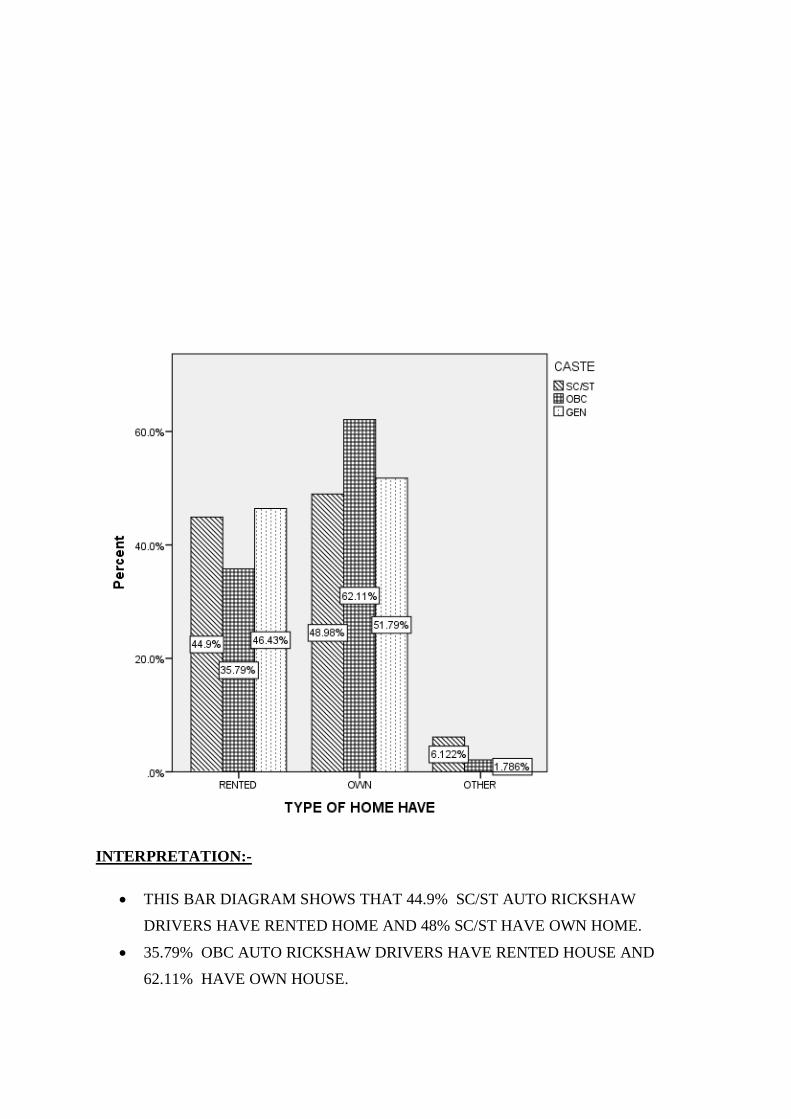
INTERPRETATION:-
THIS BAR DIAGRAM SHOWS THAT 44.9% SC/ST AUTO RICKSHAW
DRIVERS HAVE RENTED HOME AND 48% SC/ST HAVE OWN HOME.
35.79% OBC AUTO RICKSHAW DRIVERS HAVE RENTED HOUSE AND
62.11% HAVE OWN HOUSE.
46.43% AUTO RICKSHAW DRIVERS HAVE RENTED HOME AND 51.79%
HAVE OWN HOME.
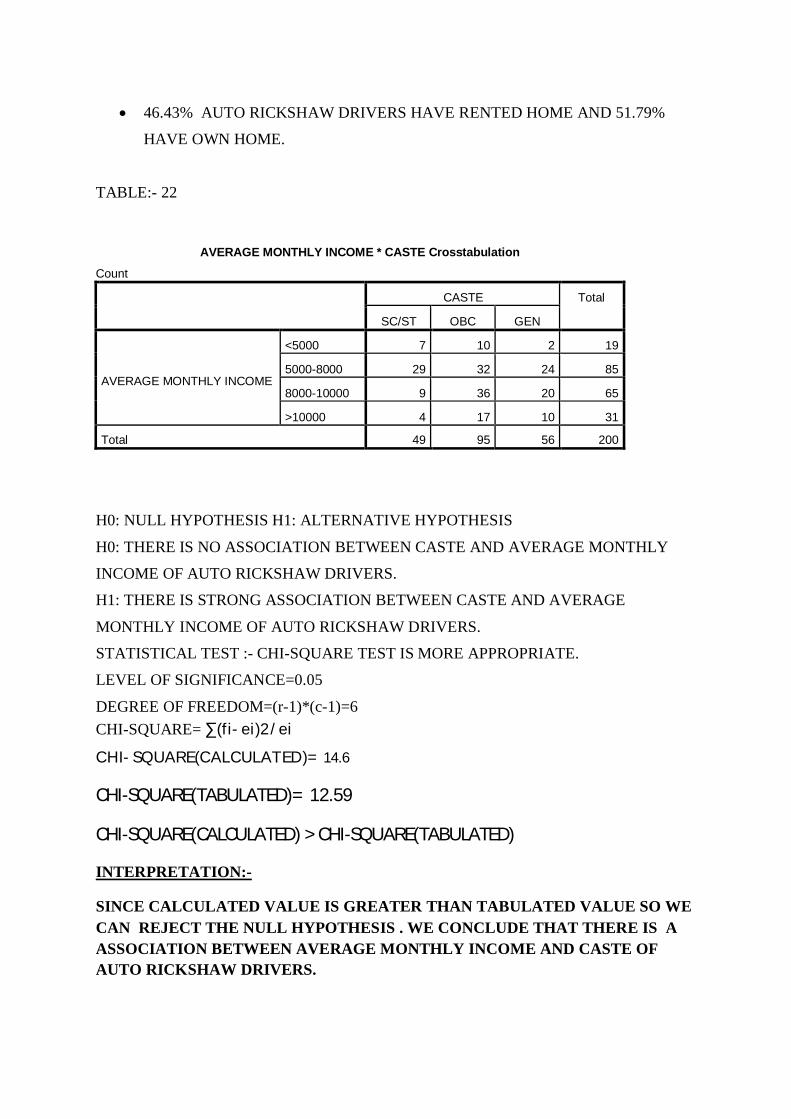
TABLE:- 22
AVERAGE MONTHLY INCOME * CASTE Crosstabulation
Count CASTE Total
SC/ST OBC GEN
AVERAGE MONTHLY INCOME
<5000 7 10 2 19
5000-8000 29 32 24 85
8000-10000 9 36 20 65
>10000 4 17 10 31
Total 49 95 56 200
H0: NULL HYPOTHESIS H1: ALTERNATIVE HYPOTHESIS
H0: THERE IS NO ASSOCIATION BETWEEN CASTE AND AVERAGE MONTHLY
INCOME OF AUTO RICKSHAW DRIVERS.
H1: THERE IS STRONG ASSOCIATION BETWEEN CASTE AND AVERAGE
MONTHLY INCOME OF AUTO RICKSHAW DRIVERS.
STATISTICAL TEST :- CHI-SQUARE TEST IS MORE APPROPRIATE.
LEVEL OF SIGNIFICANCE=0.05
DEGREE OF FREEDOM=(r-1)*(c-1)=6 CHI-SQUARE= ∑(fi-ei)2/ei CHI-SQUARE(CALCULATED)= 14.6
CHI-SQUARE(TABULATED)= 12.59
CHI-SQUARE(CALCULATED) > CHI-SQUARE(TABULATED)
INTERPRETATION:-
SINCE CALCULATED VALUE IS GREATER THAN TABULATED VALUE SO WE CAN REJECT THE NULL HYPOTHESIS . WE CONCLUDE THAT THERE IS A ASSOCIATION BETWEEN AVERAGE MONTHLY INCOME AND CASTE OF AUTO RICKSHAW DRIVERS.
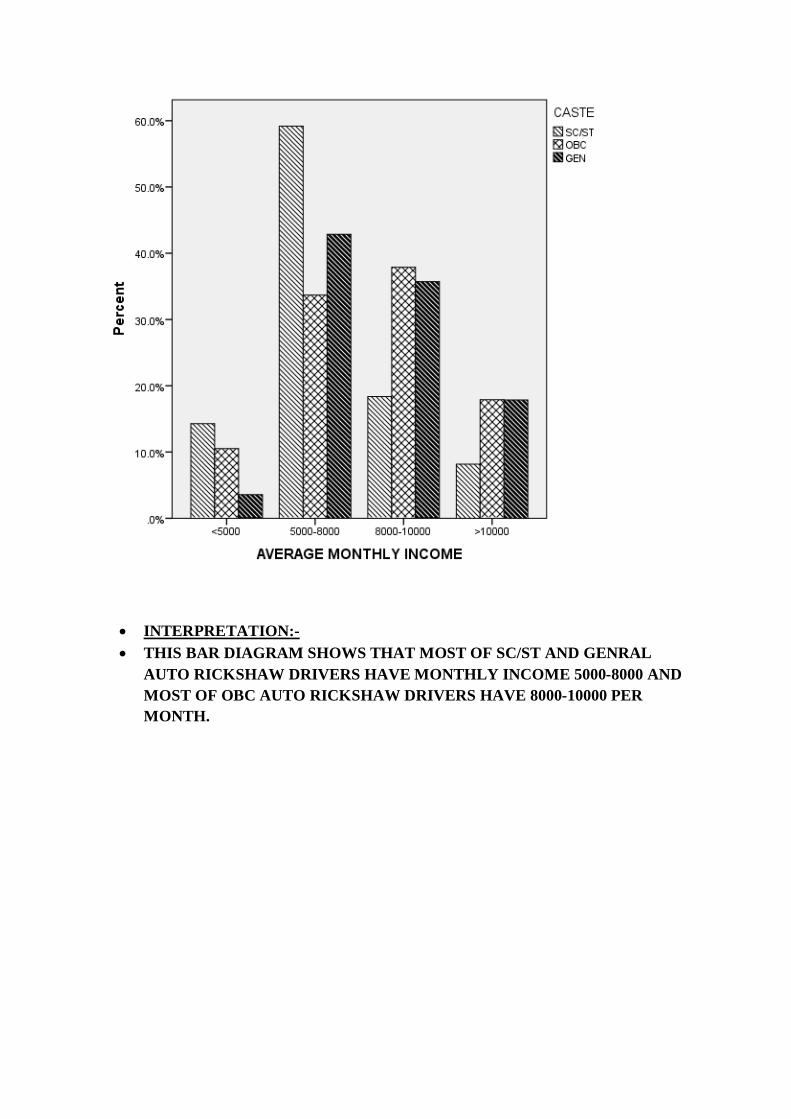
INTERPRETATION:- THIS BAR DIAGRAM SHOWS THAT MOST OF SC/ST AND GENRAL
AUTO RICKSHAW DRIVERS HAVE MONTHLY INCOME 5000-8000 AND MOST OF OBC AUTO RICKSHAW DRIVERS HAVE 8000-10000 PER MONTH.
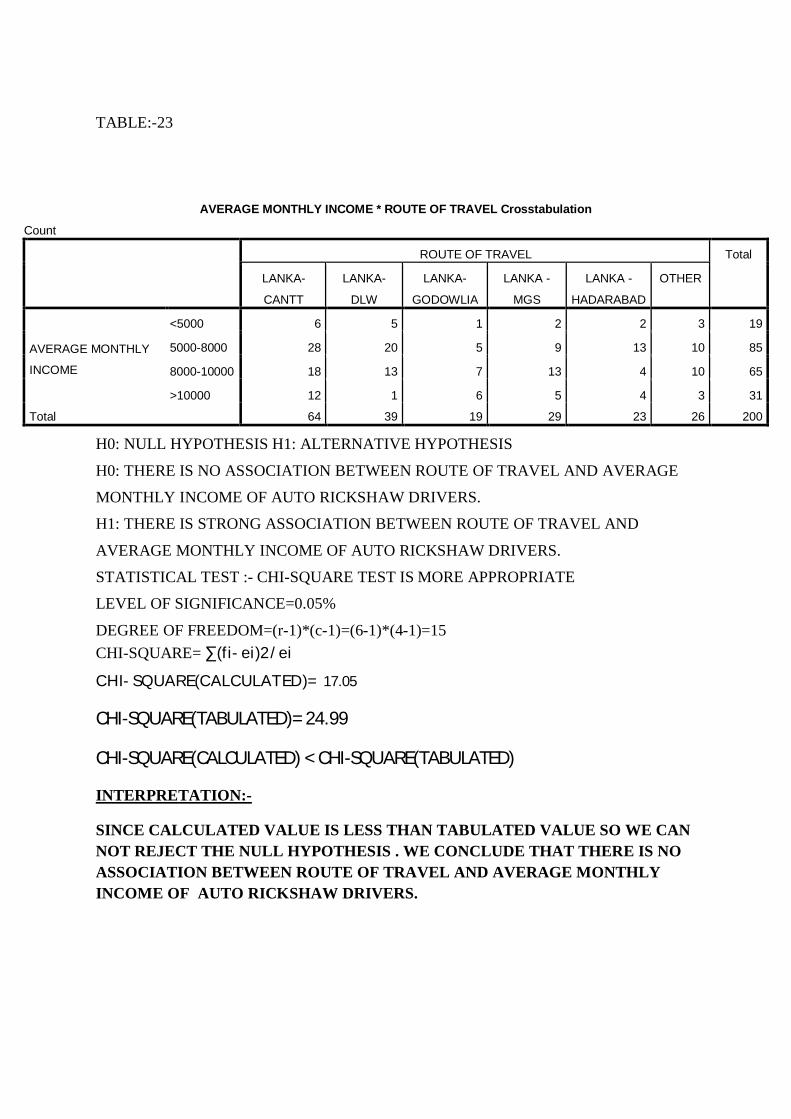
TABLE:-23
AVERAGE MONTHLY INCOME * ROUTE OF TRAVEL Crosstabulation
Count ROUTE OF TRAVEL Total
LANKA-
CANTT
LANKA-
DLW
LANKA-
GODOWLIA
LANKA -
MGS
LANKA -
HADARABAD
OTHER
AVERAGE MONTHLY
INCOME
<5000 6 5 1 2 2 3 19
5000-8000 28 20 5 9 13 10 85
8000-10000 18 13 7 13 4 10 65
>10000 12 1 6 5 4 3 31
Total 64 39 19 29 23 26 200
H0: NULL HYPOTHESIS H1: ALTERNATIVE HYPOTHESIS
H0: THERE IS NO ASSOCIATION BETWEEN ROUTE OF TRAVEL AND AVERAGE
MONTHLY INCOME OF AUTO RICKSHAW DRIVERS.
H1: THERE IS STRONG ASSOCIATION BETWEEN ROUTE OF TRAVEL AND
AVERAGE MONTHLY INCOME OF AUTO RICKSHAW DRIVERS.
STATISTICAL TEST :- CHI-SQUARE TEST IS MORE APPROPRIATE
LEVEL OF SIGNIFICANCE=0.05%
DEGREE OF FREEDOM=(r-1)*(c-1)=(6-1)*(4-1)=15 CHI-SQUARE= ∑(fi-ei)2/ei CHI-SQUARE(CALCULATED)= 17.05
CHI-SQUARE(TABULATED)= 24.99
CHI-SQUARE(CALCULATED) < CHI-SQUARE(TABULATED)
INTERPRETATION:-
SINCE CALCULATED VALUE IS LESS THAN TABULATED VALUE SO WE CAN NOT REJECT THE NULL HYPOTHESIS . WE CONCLUDE THAT THERE IS NO ASSOCIATION BETWEEN ROUTE OF TRAVEL AND AVERAGE MONTHLY INCOME OF AUTO RICKSHAW DRIVERS.
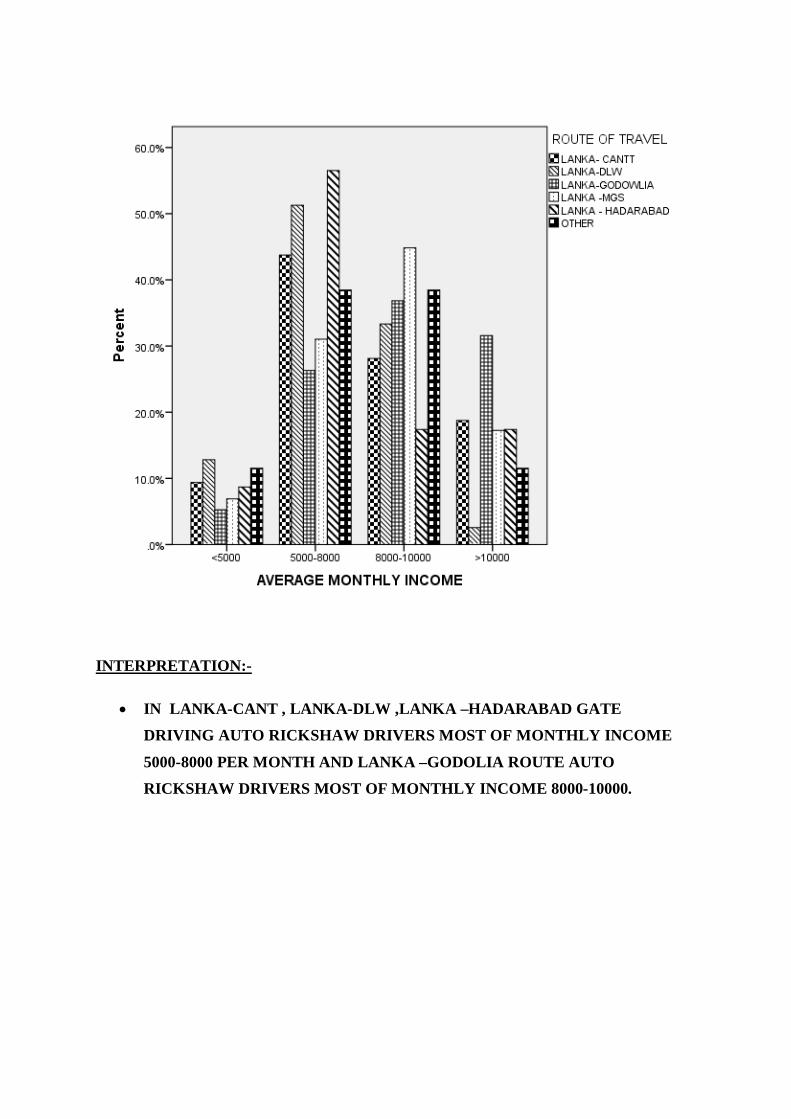
INTERPRETATION:-
IN LANKA-CANT , LANKA-DLW ,LANKA –HADARABAD GATE
DRIVING AUTO RICKSHAW DRIVERS MOST OF MONTHLY INCOME
5000-8000 PER MONTH AND LANKA –GODOLIA ROUTE AUTO
RICKSHAW DRIVERS MOST OF MONTHLY INCOME 8000-10000.
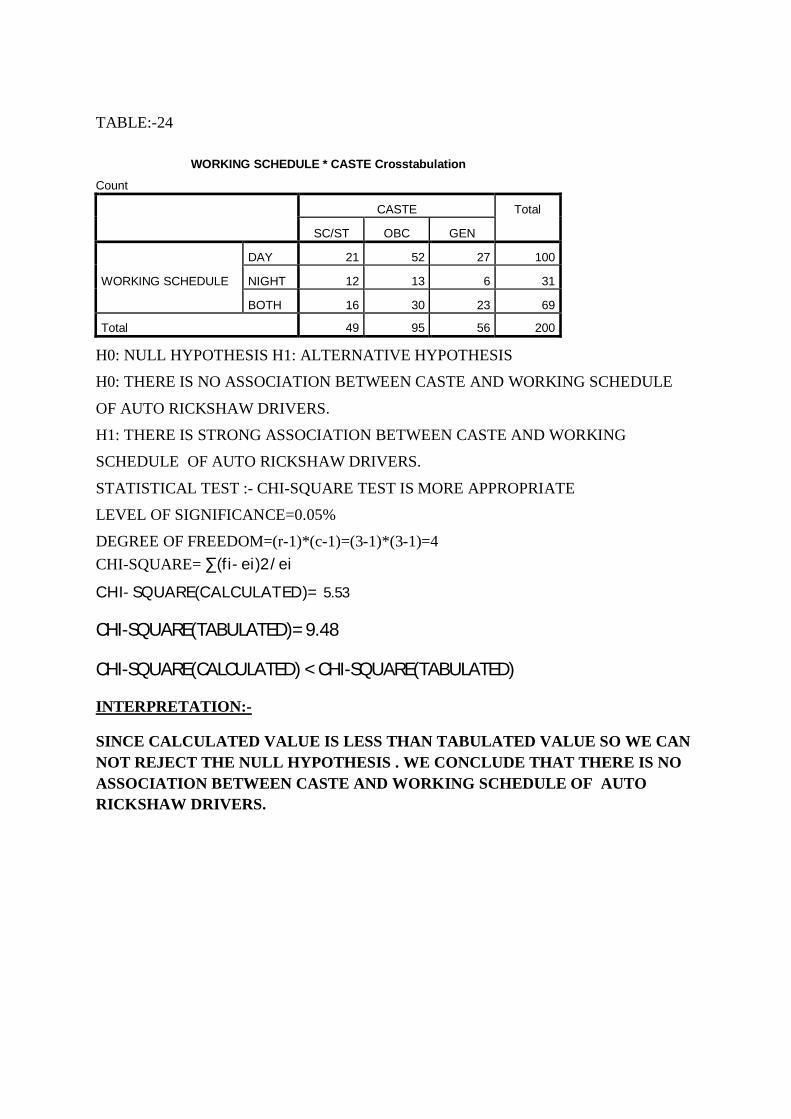
TABLE:-24
WORKING SCHEDULE * CASTE Crosstabulation
Count CASTE Total
SC/ST OBC GEN
WORKING SCHEDULE
DAY 21 52 27 100
NIGHT 12 13 6 31
BOTH 16 30 23 69
Total 49 95 56 200
H0: NULL HYPOTHESIS H1: ALTERNATIVE HYPOTHESIS
H0: THERE IS NO ASSOCIATION BETWEEN CASTE AND WORKING SCHEDULE
OF AUTO RICKSHAW DRIVERS.
H1: THERE IS STRONG ASSOCIATION BETWEEN CASTE AND WORKING
SCHEDULE OF AUTO RICKSHAW DRIVERS.
STATISTICAL TEST :- CHI-SQUARE TEST IS MORE APPROPRIATE
LEVEL OF SIGNIFICANCE=0.05%
DEGREE OF FREEDOM=(r-1)*(c-1)=(3-1)*(3-1)=4 CHI-SQUARE= ∑(fi-ei)2/ei CHI-SQUARE(CALCULATED)= 5.53
CHI-SQUARE(TABULATED)= 9.48
CHI-SQUARE(CALCULATED) < CHI-SQUARE(TABULATED)
INTERPRETATION:-
SINCE CALCULATED VALUE IS LESS THAN TABULATED VALUE SO WE CAN NOT REJECT THE NULL HYPOTHESIS . WE CONCLUDE THAT THERE IS NO ASSOCIATION BETWEEN CASTE AND WORKING SCHEDULE OF AUTO RICKSHAW DRIVERS.
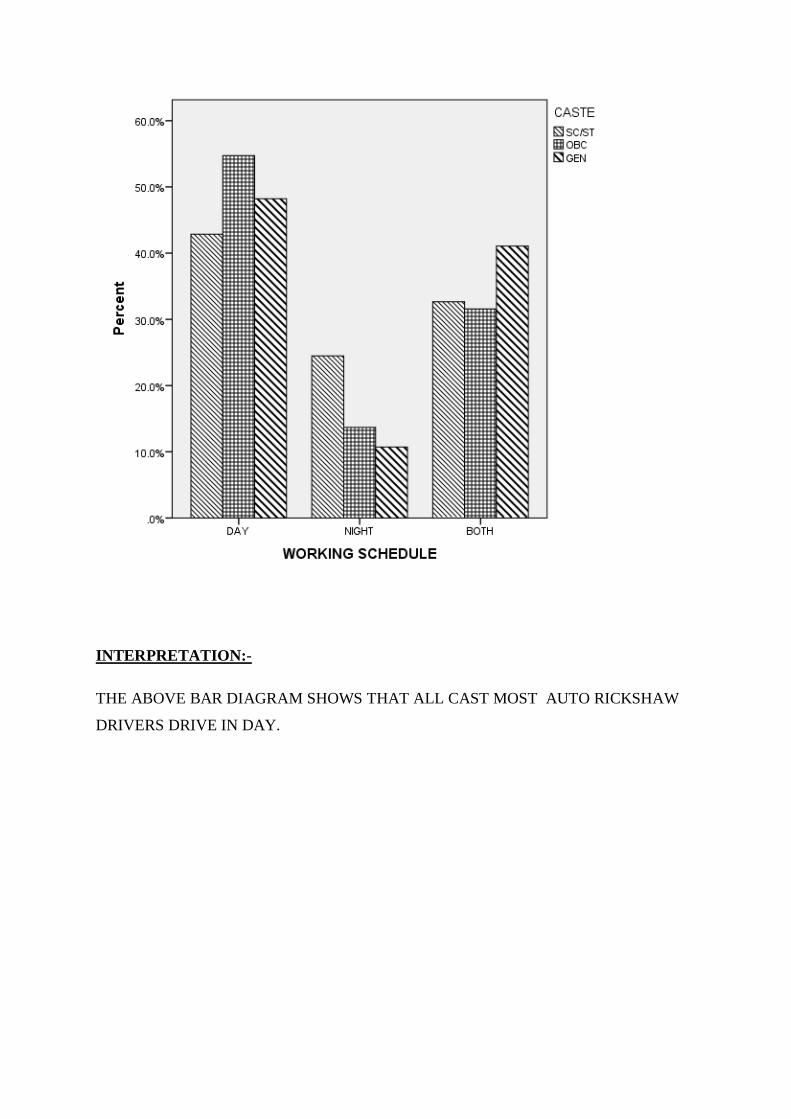
INTERPRETATION:-
THE ABOVE BAR DIAGRAM SHOWS THAT ALL CAST MOST AUTO RICKSHAW
DRIVERS DRIVE IN DAY.
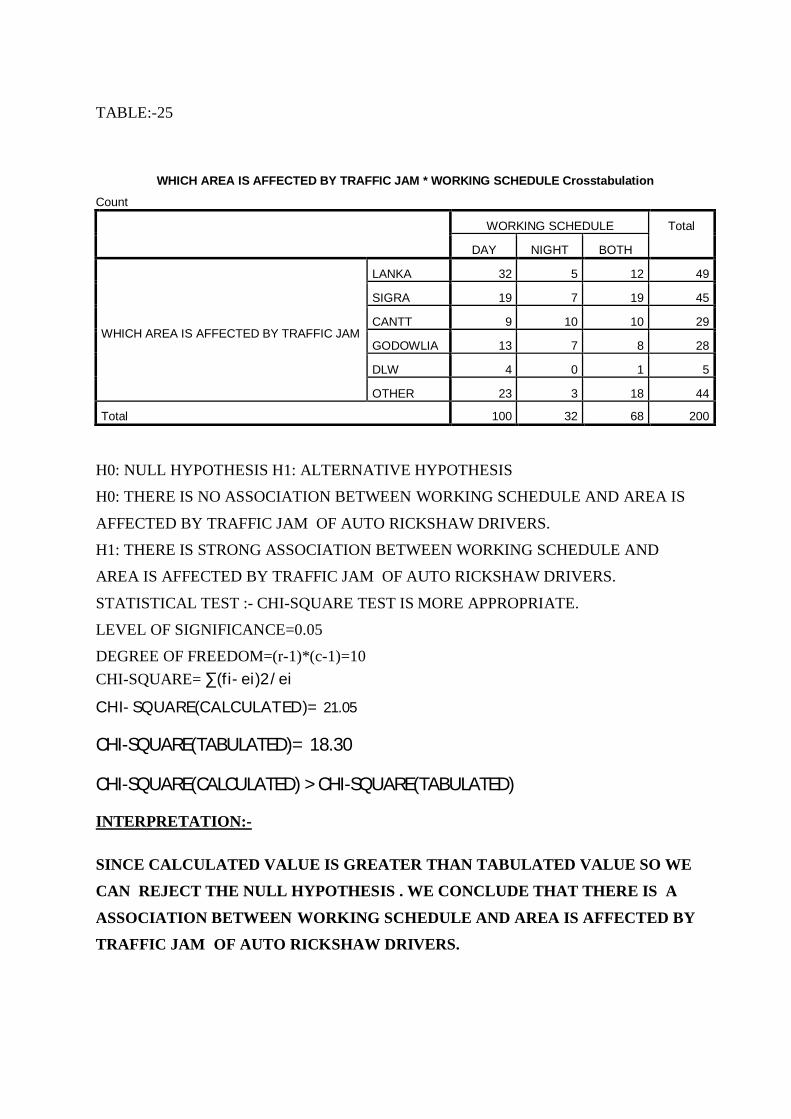
TABLE:-25
WHICH AREA IS AFFECTED BY TRAFFIC JAM * WORKING SCHEDULE Crosstabulation
Count WORKING SCHEDULE Total
DAY NIGHT BOTH
WHICH AREA IS AFFECTED BY TRAFFIC JAM
LANKA 32 5 12 49
SIGRA 19 7 19 45
CANTT 9 10 10 29
GODOWLIA 13 7 8 28
DLW 4 0 1 5
OTHER 23 3 18 44
Total 100 32 68 200
H0: NULL HYPOTHESIS H1: ALTERNATIVE HYPOTHESIS
H0: THERE IS NO ASSOCIATION BETWEEN WORKING SCHEDULE AND AREA IS
AFFECTED BY TRAFFIC JAM OF AUTO RICKSHAW DRIVERS.
H1: THERE IS STRONG ASSOCIATION BETWEEN WORKING SCHEDULE AND
AREA IS AFFECTED BY TRAFFIC JAM OF AUTO RICKSHAW DRIVERS.
STATISTICAL TEST :- CHI-SQUARE TEST IS MORE APPROPRIATE.
LEVEL OF SIGNIFICANCE=0.05
DEGREE OF FREEDOM=(r-1)*(c-1)=10 CHI-SQUARE= ∑(fi-ei)2/ei CHI-SQUARE(CALCULATED)= 21.05
CHI-SQUARE(TABULATED)= 18.30
CHI-SQUARE(CALCULATED) > CHI-SQUARE(TABULATED)
INTERPRETATION:-
SINCE CALCULATED VALUE IS GREATER THAN TABULATED VALUE SO WE
CAN REJECT THE NULL HYPOTHESIS . WE CONCLUDE THAT THERE IS A
ASSOCIATION BETWEEN WORKING SCHEDULE AND AREA IS AFFECTED BY
TRAFFIC JAM OF AUTO RICKSHAW DRIVERS.
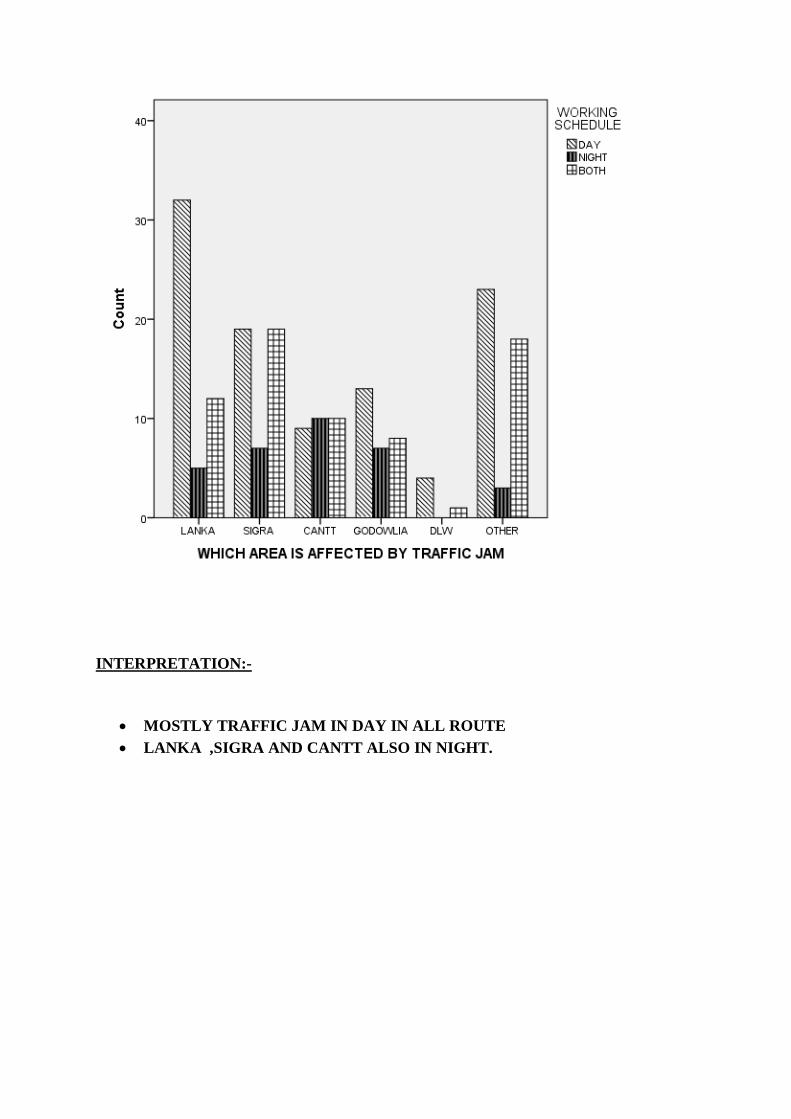
INTERPRETATION:-
MOSTLY TRAFFIC JAM IN DAY IN ALL ROUTE LANKA ,SIGRA AND CANTT ALSO IN NIGHT.
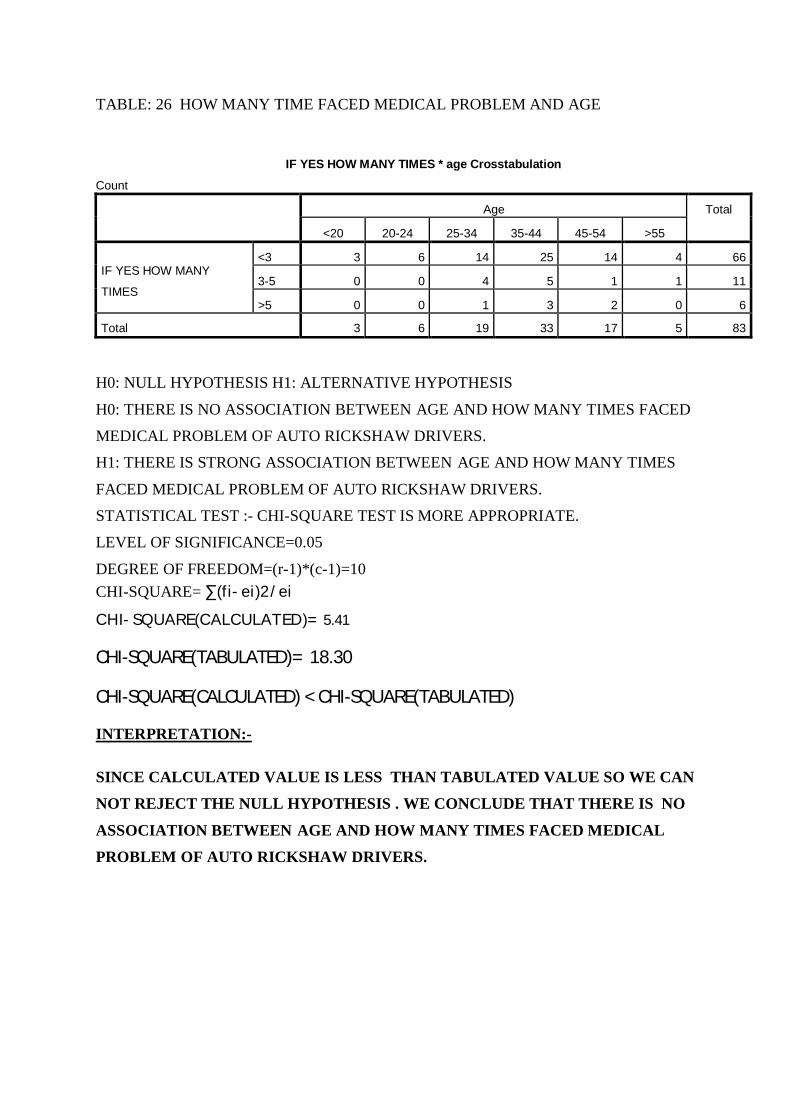
TABLE: 26 HOW MANY TIME FACED MEDICAL PROBLEM AND AGE
IF YES HOW MANY TIMES * age Crosstabulation
Count Age Total
<20 20-24 25-34 35-44 45-54 >55
IF YES HOW MANY
TIMES
<3 3 6 14 25 14 4 66
3-5 0 0 4 5 1 1 11
>5 0 0 1 3 2 0 6
Total 3 6 19 33 17 5 83
H0: NULL HYPOTHESIS H1: ALTERNATIVE HYPOTHESIS
H0: THERE IS NO ASSOCIATION BETWEEN AGE AND HOW MANY TIMES FACED
MEDICAL PROBLEM OF AUTO RICKSHAW DRIVERS.
H1: THERE IS STRONG ASSOCIATION BETWEEN AGE AND HOW MANY TIMES
FACED MEDICAL PROBLEM OF AUTO RICKSHAW DRIVERS.
STATISTICAL TEST :- CHI-SQUARE TEST IS MORE APPROPRIATE.
LEVEL OF SIGNIFICANCE=0.05
DEGREE OF FREEDOM=(r-1)*(c-1)=10 CHI-SQUARE= ∑(fi-ei)2/ei CHI-SQUARE(CALCULATED)= 5.41
CHI-SQUARE(TABULATED)= 18.30
CHI-SQUARE(CALCULATED) < CHI-SQUARE(TABULATED)
INTERPRETATION:-
SINCE CALCULATED VALUE IS LESS THAN TABULATED VALUE SO WE CAN
NOT REJECT THE NULL HYPOTHESIS . WE CONCLUDE THAT THERE IS NO
ASSOCIATION BETWEEN AGE AND HOW MANY TIMES FACED MEDICAL
PROBLEM OF AUTO RICKSHAW DRIVERS.
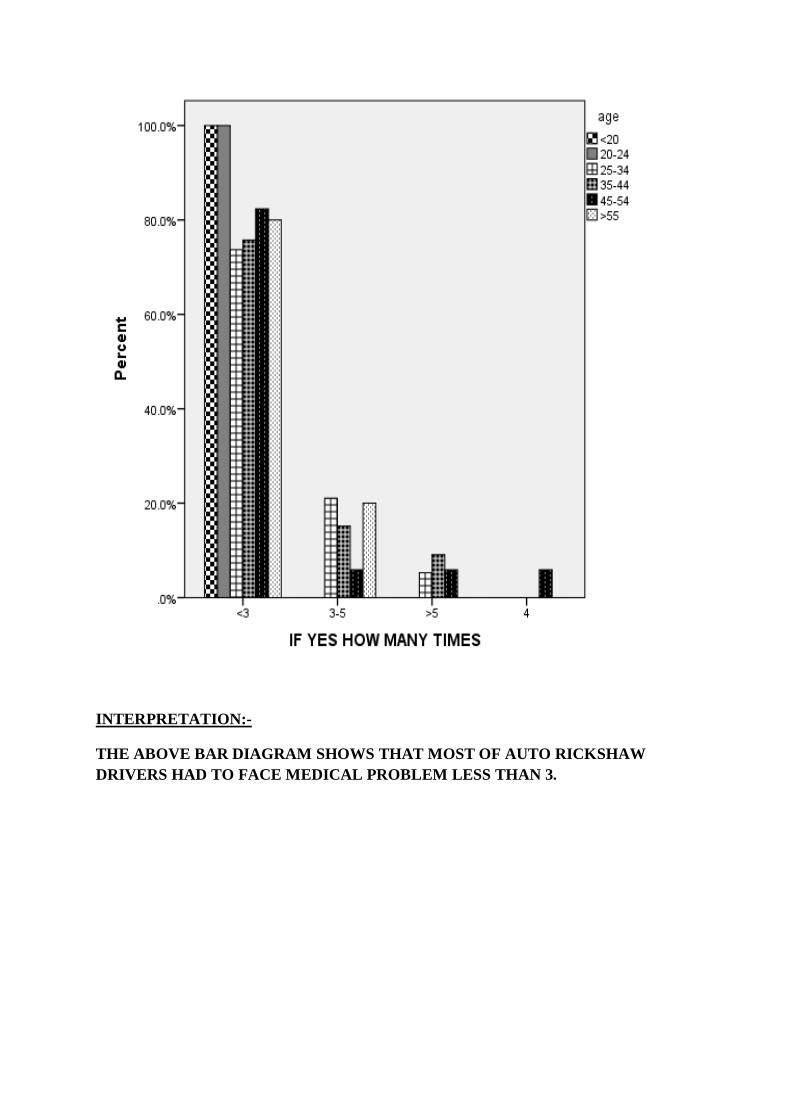
INTERPRETATION:-
THE ABOVE BAR DIAGRAM SHOWS THAT MOST OF AUTO RICKSHAW DRIVERS HAD TO FACE MEDICAL PROBLEM LESS THAN 3.
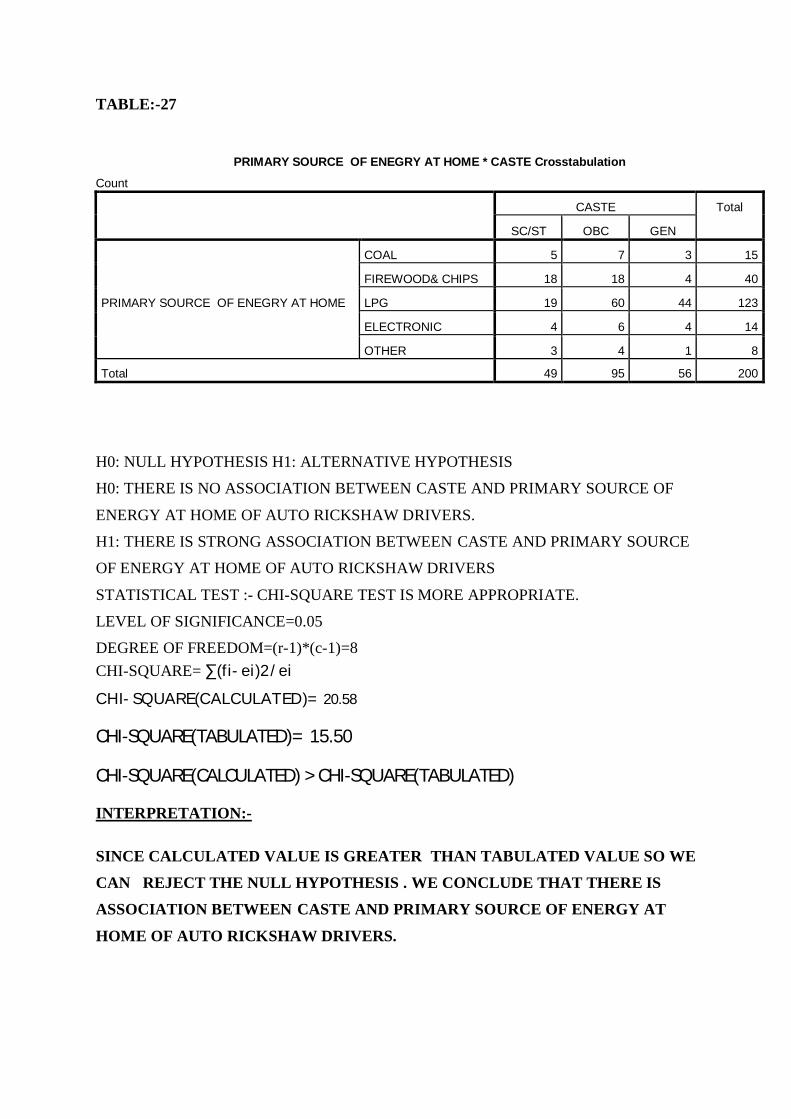
TABLE:-27
PRIMARY SOURCE OF ENEGRY AT HOME * CASTE Crosstabulation
Count CASTE Total
SC/ST OBC GEN
PRIMARY SOURCE OF ENEGRY AT HOME
COAL 5 7 3 15
FIREWOOD& CHIPS 18 18 4 40
LPG 19 60 44 123
ELECTRONIC 4 6 4 14
OTHER 3 4 1 8
Total 49 95 56 200
H0: NULL HYPOTHESIS H1: ALTERNATIVE HYPOTHESIS
H0: THERE IS NO ASSOCIATION BETWEEN CASTE AND PRIMARY SOURCE OF
ENERGY AT HOME OF AUTO RICKSHAW DRIVERS.
H1: THERE IS STRONG ASSOCIATION BETWEEN CASTE AND PRIMARY SOURCE
OF ENERGY AT HOME OF AUTO RICKSHAW DRIVERS
STATISTICAL TEST :- CHI-SQUARE TEST IS MORE APPROPRIATE.
LEVEL OF SIGNIFICANCE=0.05
DEGREE OF FREEDOM=(r-1)*(c-1)=8 CHI-SQUARE= ∑(fi-ei)2/ei CHI-SQUARE(CALCULATED)= 20.58
CHI-SQUARE(TABULATED)= 15.50
CHI-SQUARE(CALCULATED) > CHI-SQUARE(TABULATED)
INTERPRETATION:-
SINCE CALCULATED VALUE IS GREATER THAN TABULATED VALUE SO WE
CAN REJECT THE NULL HYPOTHESIS . WE CONCLUDE THAT THERE IS
ASSOCIATION BETWEEN CASTE AND PRIMARY SOURCE OF ENERGY AT
HOME OF AUTO RICKSHAW DRIVERS.
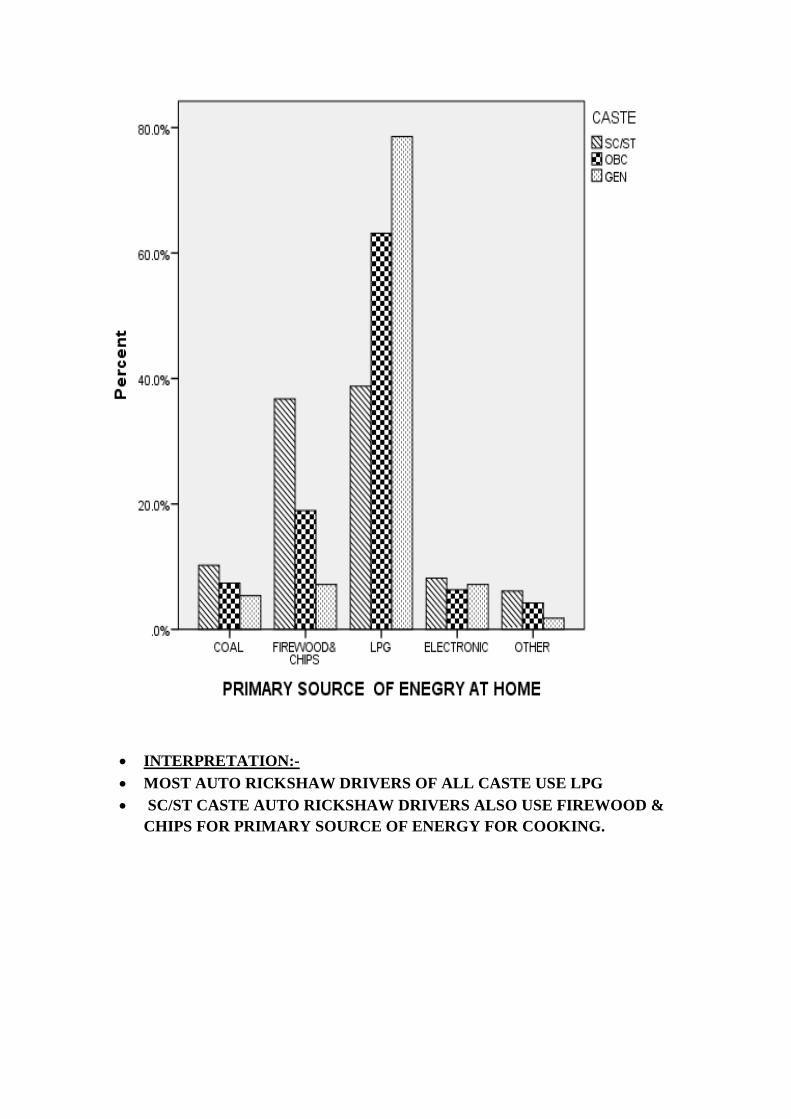
INTERPRETATION:- MOST AUTO RICKSHAW DRIVERS OF ALL CASTE USE LPG SC/ST CASTE AUTO RICKSHAW DRIVERS ALSO USE FIREWOOD &
CHIPS FOR PRIMARY SOURCE OF ENERGY FOR COOKING.
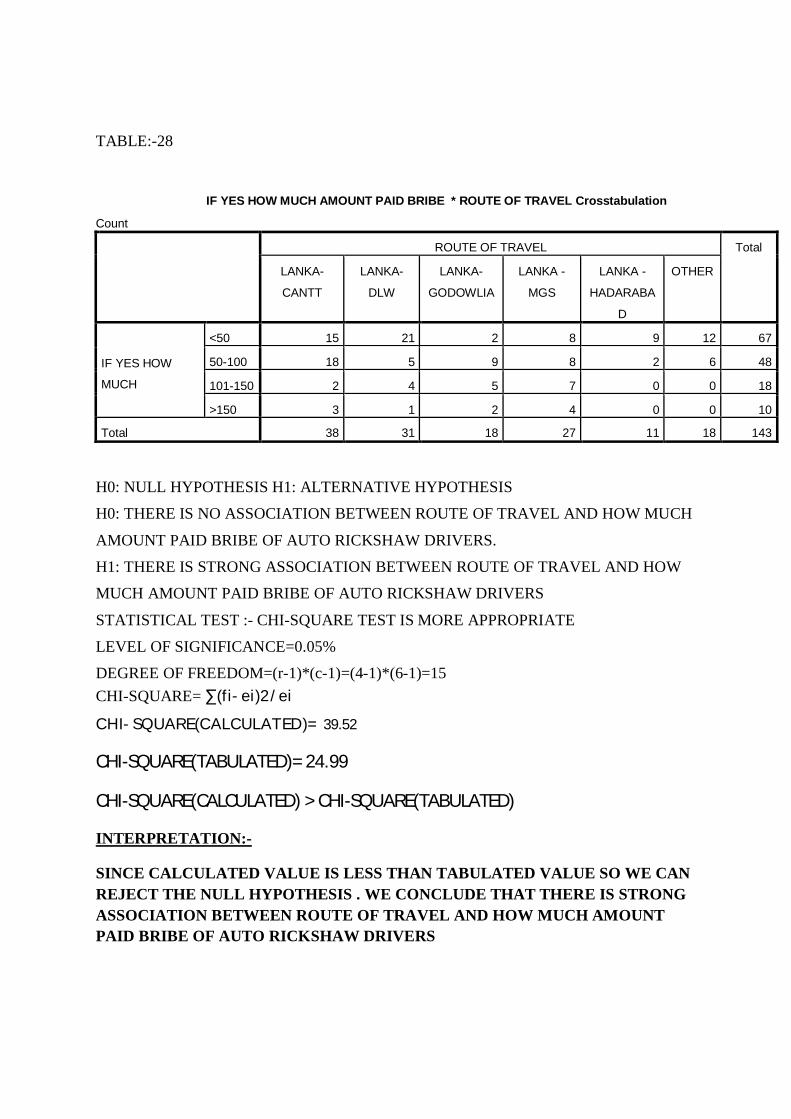
TABLE:-28
IF YES HOW MUCH AMOUNT PAID BRIBE * ROUTE OF TRAVEL Crosstabulation
Count ROUTE OF TRAVEL Total
LANKA-
CANTT
LANKA-
DLW
LANKA-
GODOWLIA
LANKA -
MGS
LANKA -
HADARABA
D
OTHER
IF YES HOW
MUCH
<50 15 21 2 8 9 12 67
50-100 18 5 9 8 2 6 48
101-150 2 4 5 7 0 0 18
>150 3 1 2 4 0 0 10
Total 38 31 18 27 11 18 143
H0: NULL HYPOTHESIS H1: ALTERNATIVE HYPOTHESIS
H0: THERE IS NO ASSOCIATION BETWEEN ROUTE OF TRAVEL AND HOW MUCH
AMOUNT PAID BRIBE OF AUTO RICKSHAW DRIVERS.
H1: THERE IS STRONG ASSOCIATION BETWEEN ROUTE OF TRAVEL AND HOW
MUCH AMOUNT PAID BRIBE OF AUTO RICKSHAW DRIVERS
STATISTICAL TEST :- CHI-SQUARE TEST IS MORE APPROPRIATE
LEVEL OF SIGNIFICANCE=0.05%
DEGREE OF FREEDOM=(r-1)*(c-1)=(4-1)*(6-1)=15 CHI-SQUARE= ∑(fi-ei)2/ei CHI-SQUARE(CALCULATED)= 39.52
CHI-SQUARE(TABULATED)= 24.99
CHI-SQUARE(CALCULATED) > CHI-SQUARE(TABULATED)
INTERPRETATION:-
SINCE CALCULATED VALUE IS LESS THAN TABULATED VALUE SO WE CAN REJECT THE NULL HYPOTHESIS . WE CONCLUDE THAT THERE IS STRONG ASSOCIATION BETWEEN ROUTE OF TRAVEL AND HOW MUCH AMOUNT PAID BRIBE OF AUTO RICKSHAW DRIVERS
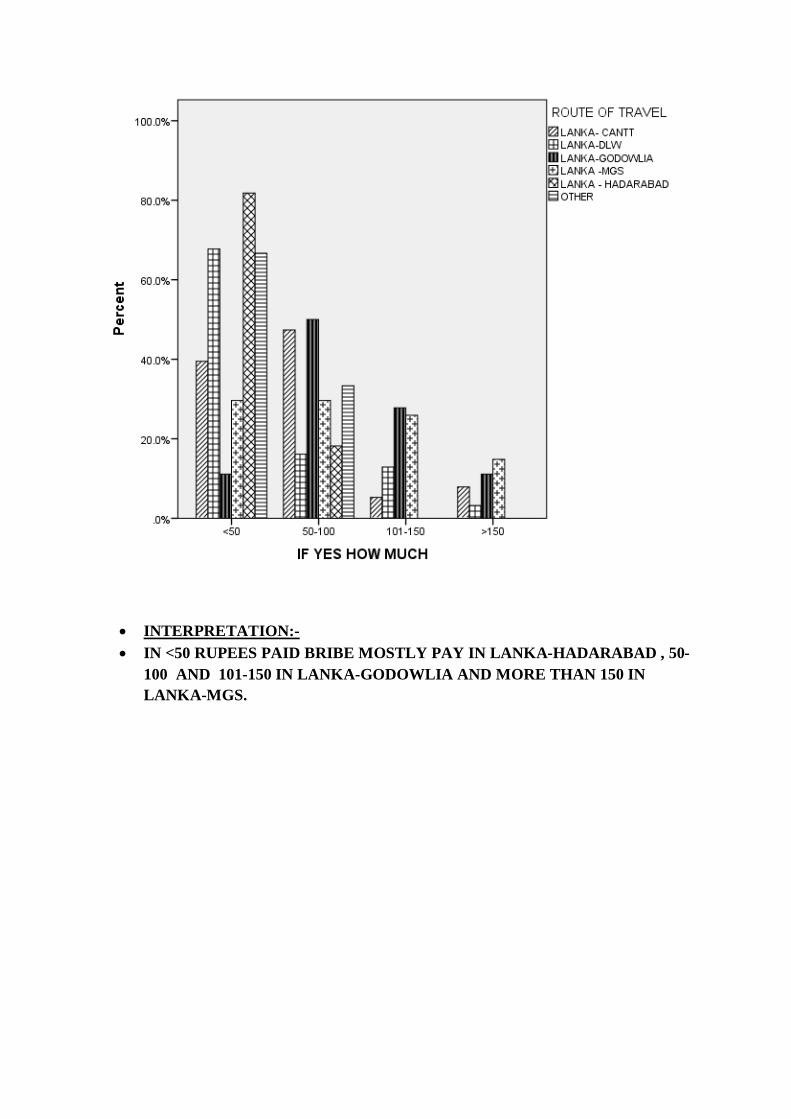
INTERPRETATION:- IN <50 RUPEES PAID BRIBE MOSTLY PAY IN LANKA-HADARABAD , 50-
100 AND 101-150 IN LANKA-GODOWLIA AND MORE THAN 150 IN LANKA-MGS.
CONCLUSION
1. MOST OF AUTO RICKSHAW DRIVERS AGE 35-44 AND SECOND MOST
AGE GROUP IS 45-54.
2. OUT OF 200 AUTO RICKSHAW DRIVERS 167 (83.5%) HINDU , 31
(15.5%) MUSLIM AND OTHER 2(1%) .
3. OUT OF 200 AUTO RICKSHAW DRIVERS 49(24.5%) SC/ST ,95(47.5%)
OBC AND 56(28%) GENRAL.
4. OUT OF 200 AUTO RICKSHAW DRIVERS 102(51%) RURAL AND
98(49%) URBAN.
5. OUT OF 200 AUTO RICKSHAW DRIVERS 164(82%) MARRIED AND
36(18%) UNMARRIED.
6. MOST OF AUTO RICKSHAW DRIVERS HAVE FAMILY MEMBER EITHAR
3-5(83(41.5%)) OR 6-8(83(41.5%))
7. MOST OF AUTO RICKSHAW DRIVERS HAVE QUALIFICATION LESS
THAN MATRIC(62%) , 21% MATRIC ,ONLY 11% INTERMEDIATE AND
5.5% GRADUATION.
8. DIFFERENT ROUTE PERCENT OF AUTO RICKSHAW DRIVERS 32%
LANKA-CANTT , 19.5% LANKA-DLW ,9.5% LANKA-GODOLIA , 14.5%
LANKA-MGS , 11.5% LANKA-HADARABAD AND 13% OTHER .
9. MOST OF AUTO RICKSHAW DRIVERS HAVE BEEN DRIVINGN FOR
MORE THAN 8 YEARS.
10. 41% AUTO RICKSHAW DRIVERS HAD RENTED AUTO RICKSHAW
,56% HAD OWN AUTO RICKSHAW AND 3% HAD SOME OTHER WAYS.
11. MOST OF AUTO RISKSHAW DRIVERS USE LPG GAS BUT SECOND
MOST USE FIREWOOD AND CHIPS .
12. MOST OF AUTO RICKSHAW DRIVERS USE WATER SUPPLY AND
HAND PUMP FOR DRINKING.
13. MOST OF TRAFFIC JAM AREA ARE LANKA,SIGRA AND CANTT.
14. 41% AUTO RICKSHAW DRIVERS HAVE FACED MEDICAL PROBLEM
PREVIOUS SIX MONTHS AND 59% DID NOT FACED ANY MEDICAL
PROBLEM PREVIOUS SIX MONTHS.
15. 72 % AUTO RICKSHAW DRIVERS SAID THAT THEY REGULARY
FACED ANY BRIBE OR FINE TO THE TRAFFIC POLICE.
16. MOSTHLY AUTO RICKSHAW DRIVERS PAY RS 200-300 PER DAY
FOR HIRED AUTO.
17. THERE IS NO ASSOCIATION BETWEEN AUTO RICKSHAW OWNER
AND RESIDENCE OF AUTO RICKSHAW DRIVERS AT 5% LEVEL OF
SIGNIFICANCE.
18. THERE IS NO ASSOCIATION BETWEEN BETWEEN RELIGION AND NO.
OF FAMILY MEMBER OF AUTO RICKSHAW DRIVERS AT 5% LEVEL OF SIGNIFICANCE.
19. MOST OF HINDU AUTO RICKSHAW DRIVERS HAVE LESS THAN 8
FAMILY MEMBERS IN HOUSE BUT IN MUSLIM FAMILY HAVE MORE THAN 8 TH FAMILY MEMBERS. 20. THERE IS ASSOCIATION BETWEEN TYPE OF CAST AND RESIDENCE
OF AUTO RICKSHAW DRIVERS.
21. MOSTHLY ALL CASTE FAMILY HAVE THEIR OWN HOME.
22. THERE IS A ASSOCIATION BETWEEN AVERAGE MONTHLY INCOME
AND CASTE OF AUTO RICKSHAW DRIVERS.
23. THERE IS A ASSOCIATION BETWEEN AVERAGE MONTHLY INCOME
AND CASTE OF AUTO RICKSHAW DRIVERS.
24. MOSTHLY ALL CASTE AVERAGE MONTHLY INCOME ARE RS 5000-
8000 PER MONTH.
25. THERE IS NO ASSOCIATION BETWEEN ROUTE OF TRAVEL AND
AVERAGE MONTHLY INCOME OF AUTO RICKSHAW DRIVERS.
26. MOSTHLY ALL ROUTE MOTHLY INCOME EITHER RS 5000-8000 OR
RS 8000-10000 PER MONTH .
27. THERE IS NO ASSOCIATION BETWEEN CASTE AND WORKING
SCHEDULE OF AUTO RICKSHAW DRIVERS .
28. MOSTHLY ALL CASTE AUTO RICKSHAW DRIVERS DRIVE DAY SHIFT.
29. MOSTLY TRAFFIC JAM IN DAY IN ALL ROUTE BUT ALSO IN LANKA
,SIGRA AND CANTT ALSO IN NIGHT.
30. THERE IS NO ASSOCIATION BETWEEN AGE AND HOW MANY TIMES
FACED MEDICAL PROBLEM OF AUTO RICKSHAW DRIVERS. 31. MOST OF AUTO RICKSHAW DRIVER OF ALL AGES FACED FACED
MEDICAL PROBLEM LESS THAN 3 TIMES .
32. THAT THERE IS ASSOCIATION BETWEEN CASTE AND PRIMARY
SOURCE OF ENERGY AT HOME OF AUTO RICKSHAW DRIVERS AT 5% LEVEL OF SIGNIFICANCE. 33. THERE IS STRONG ASSOCIATION BETWEEN ROUTE OF TRAVEL AND
HOW MUCH AMOUNT PAID BRIBE OF AUTO RICKSHAW DRIVERS.
FIELD EXPERIENCES The success of any survey depends upon the quality and honesty of the surveyor who collects the basic data. The accuracy of the data collected and co-operation of the person depends upon the ability of the investigator in expressing the aim of the survey. Keeping this view I have tried my best to get reliable data and information. I came across a variety of experiences during the project work. The project work is completely new, learning and interesting experience for me. I think it was great golden opportunity for me to learn something new for real life project. DIFFICULTIES:- It is the fact that whenever a new work starts there are some difficulties in completing the work. A brief description of the difficulties which I faced while making survey and analyze the data is given below:- 1) For the completion of project work, I have to start it first and to begin I had to make the questionnaire. The basic need for questionnaire is to have the complete knowledge of the given topic for this I approach my supervisor and as I thought he helped a lot. He gave me the basic knowledge of the topic and helped me in the preparation of questionnaire. 2) I distributed the questionnaire to candidates so that they could fill it but when the time came to collect it, I found that some forms were not
filled, many time when I went to collect the forms they were not present or busy in their own work. Because of this I had to run to their doors many times. 3) Once the data was collected I thought that my project was fairly complete but it was only a beginning. Once the data was collected I had to feed it in new statistical software called Power point, about which I had not complete knowledge . Again I approached my colleagues for help and he gave me the knowledge of power point as much required. 4) Because of them I was able to enter the data and make graphs and tables. 5) Last but not the least I also faced difficulty to get the printouts as well as for binding. Every project has difficulties and to overcome it I had to work together. In this project many times I went blank and did not know how to act but then I approached my supervisor, project mates and my friends. Every time they help me out and at last my project got completed. So this project is not actually mine but is of each and every person who helped me. “So I greatly thank everyone for their contribution in my project
1) BOOKS FOR REFERENCES:-
a) S.C.Gupta and V.K.Kapoor applied statistics.
b) Goon. A.M., Gupta, M.K., Das Gupta. B. (1986):- Fundamentals of Statistics. Vol.-2. World Press, Calcutta.
c) Gupta, S.C., Kapoor, V. K.:-Fundamental of Mathematical Statistics
2) NEWS PAPERS FOR REFERENCES:-
a) The Times Of India
b) The Hindustan Times
c) The Indian express