Project for Formulation of Comprehensive Development ... · Project for Formulation of...
228
JR EI 18-004 County Government of Mombasa In the Republic of Kenya Project for Formulation of Comprehensive Development Master Plan in the Mombasa Gate City in the Republic of Kenya Final Report March 2018 Japan International Cooperation Agency (JICA) Nippon Koei Co., Ltd. PADECO Co., Ltd. Eight-Japan Engineering Consultants Inc.
Transcript of Project for Formulation of Comprehensive Development ... · Project for Formulation of...
JREI
18-004
County Government of MombasaIn the Republic of Kenya
Project for Formulation ofComprehensive Development MasterPlan in the Mombasa Gate City in the
Republic of Kenya
Final Report
March 2018
Japan International Cooperation Agency (JICA)
Nippon Koei Co., Ltd.PADECO Co., Ltd.
Eight-Japan Engineering Consultants Inc.

Project for Formulation of Comprehensive Development Master Plan in the Mombasa Gate City in the Republic of Kenya Final Report
i
Nippon Koei Co., Ltd. / PADECO Co., Ltd. / Eight-Japan Engineering Consultants Inc.
Table of Contents
Part I: Situational Analysis
1. Introduction ............................................................................................................................................ 1-1
1.1 Background and Objective ................................................................................................................ 1-1
1.1.1 Background ....................................................................................................................................... 1-1
1.1.2 Objective ........................................................................................................................................... 1-1
1.1.3 Target Year ........................................................................................................................................ 1-1
1.1.4 Target Area ........................................................................................................................................ 1-1
1.1.5 Overall Scope of Work ...................................................................................................................... 1-2
1.2 Methodology ..................................................................................................................................... 1-2
1.3 Organisational Arrangement.............................................................................................................. 1-3
1.3.1 Overall Organisational Arrangements for Plan Formulation ............................................................. 1-3
1.3.2 Steering Committee ........................................................................................................................... 1-3
1.3.3 Working Group and Lecture .............................................................................................................. 1-4
1.4 Institutional Framework .................................................................................................................. 1-10
1.4.1 Legal Framework ............................................................................................................................. 1-10
1.4.2 Policy and Strategy .......................................................................................................................... 1-11
2. Socio-economy ........................................................................................................................................ 2-1
2.1 Administrative Structure ................................................................................................................... 2-1
2.1.1 Administrative Divisions ................................................................................................................... 2-1
2.2 Natural Condition .............................................................................................................................. 2-1
2.2.1 Topography ....................................................................................................................................... 2-1
2.2.2 Geology, Soil, and Minerals .............................................................................................................. 2-1
2.2.3 Climate .............................................................................................................................................. 2-2
2.3 Population and Demography ............................................................................................................. 2-2
2.3.1 Population Growth ............................................................................................................................. 2-2
2.3.2 Population Distribution ..................................................................................................................... 2-2
2.3.3 Age Distribution ................................................................................................................................ 2-3
2.4 Economy and Employment ............................................................................................................... 2-3
2.4.1 Surrounding Economy ....................................................................................................................... 2-3
2.4.2 Gross Regional Product of Mombasa County ................................................................................... 2-4
2.4.3 Sector Composition ........................................................................................................................... 2-5
Project for Formulation of Comprehensive Development Master Plan in the Mombasa Gate City in the Republic of Kenya Final Report
ii
Nippon Koei Co., Ltd. / PADECO Co., Ltd. / Eight-Japan Engineering Consultants Inc.
2.4.4 Primary Sector ................................................................................................................................... 2-6
2.4.5 Secondary Sector ............................................................................................................................... 2-7
2.4.6 Tertiary Sector ................................................................................................................................... 2-8
2.4.7 Labour Force and Employment ......................................................................................................... 2-8
2.4.8 Income Distribution ........................................................................................................................... 2-8
2.5 Social Conditions and Public Facilities ............................................................................................. 2-9
2.5.1 Overview and Current Situations ...................................................................................................... 2-9
2.5.2 Review of Policy, Legal Framework, and Administrative Structure ................................................. 2-9
2.5.3 Current Social Service and Facilities ............................................................................................... 2-12
2.5.4 Review of Ongoing and Planned Projects ....................................................................................... 2-15
2.5.5 Development Issues, Constraints, and Directions ........................................................................... 2-15
2.6 Housing Conditions ......................................................................................................................... 2-16
2.6.1 Overview and Current Situation ...................................................................................................... 2-16
2.6.2 Review of Policy, Legal Framework, and Administrative Structure ............................................... 2-16
2.6.3 Existing Facilities ............................................................................................................................ 2-18
2.6.4 Review of Ongoing and Planned Projects ....................................................................................... 2-21
2.6.5 Development Issues, Constraints, and Directions ........................................................................... 2-22
2.7 Tourism and Heritage ...................................................................................................................... 2-23
2.7.1 Overview ......................................................................................................................................... 2-23
2.7.2 Current Situation of Tourism Sector in Mombasa County .............................................................. 2-23
2.7.3 Review of Policy, Legal Framework and Administrative Structure ................................................ 2-31
2.7.4 Review of Ongoing and Planned Projects ....................................................................................... 2-34
2.7.5 Development Issues, Constraints and Directions ............................................................................ 2-35
3. Urban Conditions ................................................................................................................................... 3-1
3.1 Development Trend of Mombasa County ......................................................................................... 3-1
3.1.1 History of Urban Growth ................................................................................................................... 3-1
3.1.2 Review of 1971 Urban Development Strategy .................................................................................. 3-2
3.1.3 Urban Growth Since 1971 ................................................................................................................. 3-2
3.2 Urban Characteristics ........................................................................................................................ 3-3
3.2.1 Overview ........................................................................................................................................... 3-3
3.2.2 Characteristics of Each Zone ............................................................................................................. 3-5
3.2.3 Issues and Development Direction of Urban Development .............................................................. 3-7
3.3 Informal Settlements ......................................................................................................................... 3-8
3.3.1 Overview ........................................................................................................................................... 3-8
3.3.2 Definition of Informal Settlements .................................................................................................... 3-9
3.3.3 Location and Characteristics of Informal Settlements ..................................................................... 3-10
Project for Formulation of Comprehensive Development Master Plan in the Mombasa Gate City in the Republic of Kenya Final Report
iii
Nippon Koei Co., Ltd. / PADECO Co., Ltd. / Eight-Japan Engineering Consultants Inc.
3.4 Informal Settlement Improvement by KISIP ................................................................................... 3-13
3.4.2 Issues and Development Direction of Informal Settlements ........................................................... 3-15
3.5 Review of Kenya Municipal Programme (KMP) ............................................................................ 3-16
3.5.1 Overview ......................................................................................................................................... 3-16
3.5.2 Outline of ISUDP-Mombasa ........................................................................................................... 3-17
3.5.3 Outline of Capital Investment Plan ................................................................................................. 3-19
3.5.4 Approach to Review ........................................................................................................................ 3-21
3.5.5 Review in General ........................................................................................................................... 3-22
3.5.6 Review on Road Network................................................................................................................ 3-23
3.5.7 Review on Land Use Plan ............................................................................................................... 3-23
4. Transport and Logistics ......................................................................................................................... 4-1
4.1 Introduction ....................................................................................................................................... 4-1
4.2 Review of Transport Goals, Plans and Studies .................................................................................. 4-1
4.2.1 Vision 2030 – First and Second Transport Sector Plan (2008-2012, 2013-2017) ............................. 4-1
4.2.2 Mombasa Draft Physical Development Plan (1971-2001) ................................................................ 4-2
4.2.3 Integrated Strategic Urban Development Plan: Mombasa Vision 2035 (2016) ................................ 4-2
4.2.4 Non-motorised Transit (NMT) Plan (2013) ...................................................................................... 4-2
4.2.5 KRC Mombasa Commuter Railways Feasibility Study (2011) ......................................................... 4-3
4.2.6 Passenger Water Transport Pre-feasibility Study (2014/Draft), and Feasibility Study (2016) .......... 4-3
4.2.7 Road Sector Improvement Programme (RSIP) (2010-2024) ............................................................ 4-4
4.2.8 JICA Mombasa Port Master Plan (2014-15) ..................................................................................... 4-4
4.2.9 Mombasa Special Economic Zone (Mombasa SEZ) Master Plan (2014-15) .................................... 4-4
4.3 Ongoing and Committed Road Infrastructure Projects ...................................................................... 4-4
4.3.1 Mombasa Southern Bypass Road and Kipevu Link to New Container Terminal ............................. 4-4
4.3.2 Northern Bypass ................................................................................................................................ 4-5
4.3.3 Mombasa Gate Bridge ....................................................................................................................... 4-5
4.3.4 A109 (Mombasa Road), Airport Road, and B8 (New Malindi Road) Widening .............................. 4-6
4.3.5 Second Nyali Bridge .......................................................................................................................... 4-6
4.3.6 Intersection Improvements ................................................................................................................ 4-7
4.3.7 Traffic Management Strategies, Minor Road Improvements ............................................................ 4-7
4.4 Ongoing and Committed Port/Rail Infrastructure Projects ................................................................ 4-8
4.4.1 Port Investment Programme (2013-2030) ......................................................................................... 4-8
4.4.2 Mombasa Port Development Project (Port Extension at Kipevu West) ............................................ 4-8
4.4.3 SEZ at Dongo Kundu ........................................................................................................................ 4-8
4.4.4 Standard Gauge Rail .......................................................................................................................... 4-8
4.5 Road and Transport Related Administrative Structure of Mombasa County .................................... 4-9
Project for Formulation of Comprehensive Development Master Plan in the Mombasa Gate City in the Republic of Kenya Final Report
iv
Nippon Koei Co., Ltd. / PADECO Co., Ltd. / Eight-Japan Engineering Consultants Inc.
4.5.1 Administrative Structure ................................................................................................................... 4-9
4.5.2 Budget ............................................................................................................................................... 4-9
4.6 Characteristics of Road Network and Road Traffic......................................................................... 4-10
4.6.1 Road Network in Mombasa County ................................................................................................ 4-10
4.6.2 Drainage Infrastructure .................................................................................................................... 4-11
4.6.3 Characteristics of Vehicle Traffic on Roads .................................................................................... 4-12
4.6.4 Characteristics of Passenger and Vehicular Traffic ......................................................................... 4-15
4.6.5 Road Safety and Traffic Management ............................................................................................. 4-20
4.7 Public Transport Systems ................................................................................................................ 4-23
4.7.1 Minibuses (Matatus) ........................................................................................................................ 4-23
4.7.2 Tuktuks (Three Wheelers) ............................................................................................................... 4-25
4.7.3 Motorcycle Taxis (Bodabodas) ....................................................................................................... 4-27
4.7.4 Ferry Services .................................................................................................................................. 4-27
4.8 Freight Transport and Logistics in Northern Corridor..................................................................... 4-29
4.8.1 Introduction ..................................................................................................................................... 4-29
4.8.2 Existing Logistics Management ...................................................................................................... 4-29
4.8.3 Single Customs Territory (SCT) Scheme ........................................................................................ 4-32
4.8.4 Improvement in Data Transmission ................................................................................................ 4-32
4.9 Port Facilities and Related Traffic in Mombasa County ................................................................. 4-33
4.9.1 Port and Associated Facilities.......................................................................................................... 4-33
4.9.2 Main Feature of Mombasa Port ....................................................................................................... 4-35
4.9.3 Port-related Cargo Traffic ............................................................................................................... 4-37
4.9.4 Other Major Transport Infrastructure .............................................................................................. 4-41
4.10 Summary of Issues .......................................................................................................................... 4-45
4.10.1 Issues Related to Freight Movement ............................................................................................... 4-45
4.10.2 Issues Related to Passenger Movement ........................................................................................... 4-48
5. Urban Infrastructure and Facilities ..................................................................................................... 5-1
5.1 Water Supply ..................................................................................................................................... 5-1
5.1.1 Overview ........................................................................................................................................... 5-1
5.1.2 Review of Policy, Legal Framework, and Administrative Structure ................................................. 5-1
5.1.3 Current Conditions ............................................................................................................................ 5-2
5.1.4 Analysis of Operation and Maintenance............................................................................................ 5-5
5.1.5 Review of Ongoing and Planned Infrastructure Projects ................................................................... 5-6
5.1.6 Development Issues, Constraints and Directions .............................................................................. 5-9
5.2 Sewerage/Drainage ............................................................................................................................ 5-9
5.2.1 Overview ........................................................................................................................................... 5-9
Project for Formulation of Comprehensive Development Master Plan in the Mombasa Gate City in the Republic of Kenya Final Report
v
Nippon Koei Co., Ltd. / PADECO Co., Ltd. / Eight-Japan Engineering Consultants Inc.
5.2.2 Review of Policy, Legal Framework and Administrative Structure ................................................ 5-10
5.2.3 Current Conditions .......................................................................................................................... 5-10
5.2.4 Analysis of Operation and Maintenance.......................................................................................... 5-12
5.2.5 Review of Ongoing and Planned Infrastructure Projects ................................................................. 5-13
5.2.6 Development Issues, Constraints, and Directions ........................................................................... 5-16
5.3 Solid Waste Management ................................................................................................................ 5-17
5.3.1 Overview ......................................................................................................................................... 5-17
5.3.2 Review of Policy (Including KMP), Legal Framework and Administrative Structure ................... 5-18
5.3.3 Current Conditions .......................................................................................................................... 5-19
5.3.4 Analysis of Operation and Maintenance.......................................................................................... 5-23
5.3.5 Review of Ongoing and Planned Infrastructure Projects ................................................................. 5-24
5.3.6 Development Issues, Constraints, and Directions ........................................................................... 5-25
5.4 Power Supply................................................................................................................................... 5-26
5.4.1 Overview ......................................................................................................................................... 5-26
5.4.2 Review of Policy, Legal Framework and Administrative Structure ................................................ 5-26
5.4.3 Current Conditions .......................................................................................................................... 5-28
5.4.4 Analysis of Operation and Maintenance.......................................................................................... 5-30
5.4.5 Review of Ongoing and Planned Infrastructure Projects ................................................................. 5-32
5.4.6 Development Issues, Constraints, and Directions ........................................................................... 5-32
5.5 Telecommunications ........................................................................................................................ 5-33
5.5.1 Overview ......................................................................................................................................... 5-33
5.5.2 Review of Policy, Legal Framework and Administrative Structure ................................................ 5-34
5.5.3 Current Conditions, Operation and Maintenance ............................................................................ 5-35
5.5.4 Review of Ongoing and Planned Infrastructure Projects ................................................................. 5-40
5.5.5 Development Issues, Constraints and Directions ............................................................................ 5-41
6. Urban Management Conditions ............................................................................................................ 6-1
6.1 Human Resource Development ......................................................................................................... 6-1
6.1.1 Overview ........................................................................................................................................... 6-1
6.1.2 Framework and Practice of Human Resource Development ............................................................. 6-1
6.1.3 Issues of Human Resource Development and Training..................................................................... 6-6
6.2 Urban Development Control ............................................................................................................. 6-8
6.2.1 Overview ........................................................................................................................................... 6-8
6.2.2 Review of Legal Framework of Development Control ..................................................................... 6-8
6.2.3 Organisational Structure and Procedure of Development Control .................................................. 6-13
6.2.4 Human Resource of the Development Control ................................................................................ 6-14
6.2.5 Issues and Constraints of Development Control ............................................................................. 6-15
Project for Formulation of Comprehensive Development Master Plan in the Mombasa Gate City in the Republic of Kenya Final Report
vi
Nippon Koei Co., Ltd. / PADECO Co., Ltd. / Eight-Japan Engineering Consultants Inc.
6.3 Human Resource Development for Public Private Partnership (PPP) ............................................. 6-16
6.3.1 Overview ......................................................................................................................................... 6-16
6.3.2 Framework and Organisation of PPP .............................................................................................. 6-16
6.3.3 Human Resource Development for PPP .......................................................................................... 6-17
7. Planning Issues and Directions ............................................................................................................. 7-1
7.1 General .............................................................................................................................................. 7-1
7.2 Socio-economy .................................................................................................................................. 7-1
7.2.1 Social Service and Facilities .............................................................................................................. 7-1
7.2.2 Housing Condition............................................................................................................................. 7-1
7.2.3 Tourism and Heritage ........................................................................................................................ 7-2
7.3 Urban Development ........................................................................................................................... 7-2
7.3.1 Urban Development in General ......................................................................................................... 7-2
7.3.2 Informal Settlements ......................................................................................................................... 7-3
7.4 Roads, Transport, and Logistics ........................................................................................................ 7-4
7.5 Infrastructure ..................................................................................................................................... 7-5
7.5.1 Water Supply ..................................................................................................................................... 7-5
7.5.2 Sewerage/Drainage ............................................................................................................................ 7-5
7.5.3 Solid Waste Management .................................................................................................................. 7-6
7.5.4 Power Supply..................................................................................................................................... 7-7
7.5.5 Telecommunications .......................................................................................................................... 7-7
7.6 Urban Development Management ..................................................................................................... 7-8
7.6.1 Urban Development Control ............................................................................................................. 7-8
7.6.2 Public Private Partnership (PPP) ....................................................................................................... 7-8
Part II: Master Plan
8. Development Vision and Structure Plan .............................................................................................. 8-1
8.1 Development Vision .......................................................................................................................... 8-1
8.1.1 Development Vision Formulation Procedure .................................................................................... 8-1
8.1.2 Development Vision of Mombasa 2040 ............................................................................................ 8-1
8.2 Structure Plan .................................................................................................................................... 8-3
8.2.1 Structure Plan Formulation Procedure............................................................................................... 8-3
8.2.2 Conditions for Structure Plan Formulation ........................................................................................ 8-3
8.2.3 Structure Plan Development Strategy ................................................................................................ 8-5
Project for Formulation of Comprehensive Development Master Plan in the Mombasa Gate City in the Republic of Kenya Final Report
vii
Nippon Koei Co., Ltd. / PADECO Co., Ltd. / Eight-Japan Engineering Consultants Inc.
8.2.4 Structure Plan Alternatives Analysis ................................................................................................. 8-6
8.2.5 Comparison of Alternatives ............................................................................................................. 8-11
8.2.6 Description of Proposed Structure Plan ........................................................................................... 8-12
8.3 Framework and Development Conditions ....................................................................................... 8-15
8.3.1 Population Framework Review ....................................................................................................... 8-15
8.3.2 Population Framework .................................................................................................................... 8-17
8.3.3 Population Capacity Analysis in Mombasa County ........................................................................ 8-18
8.3.4 Population Allocation by Age ......................................................................................................... 8-19
8.3.5 Economic Framework Review ........................................................................................................ 8-19
8.3.6 Economic Strengths and Weaknesses .............................................................................................. 8-20
8.3.7 Economic Framework ..................................................................................................................... 8-21
8.3.8 Growth in Employment ................................................................................................................... 8-22
9. Land Use Plan ......................................................................................................................................... 9-1
9.1 Method of Land Use Policy Preparation ........................................................................................... 9-1
9.2 Land Conditions Analysis ................................................................................................................. 9-2
9.2.1 Existing Urbanisation Image by Population Density ......................................................................... 9-2
9.2.2 Considered Condition for Urban Development ................................................................................. 9-2
9.2.3 Land Suitable for Development ......................................................................................................... 9-5
9.3 Analysis of Draft Mombasa County Zoning Policy (2015-2025) by County Government of Mombasa (CGM)............................................................................................................................... 9-5
9.3.1 Outline of CGM Zoning Policy ......................................................................................................... 9-5
9.3.2 Objectives of CGM Zoning Policy .................................................................................................... 9-6
9.3.3 Issues on CGM Land Use Zoning ..................................................................................................... 9-6
9.4 Proposed Land Use Policy ................................................................................................................. 9-9
9.4.1 Objectives of Land Use Policy .......................................................................................................... 9-9
9.4.2 Land Use Concept ............................................................................................................................. 9-9
9.4.3 Proposed Land Use Plan .................................................................................................................. 9-11
9.4.4 Regional Development Strategy ...................................................................................................... 9-15
10. Transport Systems Development Strategy ....................................................................................... 10-1
10.1 Introduction ..................................................................................................................................... 10-1
10.2 SWOT Analysis, Strategies for Development ................................................................................. 10-1
10.2.1 SWOT Analysis ............................................................................................................................... 10-1
10.2.2 Strategies ......................................................................................................................................... 10-2
10.2.3 Approaches ...................................................................................................................................... 10-4
10.3 Plans and Projects ............................................................................................................................ 10-5
10.3.1 Structure Plan for Region-wide Road Network ............................................................................... 10-6
Project for Formulation of Comprehensive Development Master Plan in the Mombasa Gate City in the Republic of Kenya Final Report
viii
Nippon Koei Co., Ltd. / PADECO Co., Ltd. / Eight-Japan Engineering Consultants Inc.
10.3.2 Structure Plan for Mombasa Island ................................................................................................. 10-8
10.3.3 Hyper Corridor Coordination Plan for Mombasa Island ............................................................... 10-11
10.3.4 Structure Plan for Mainland Areas ................................................................................................ 10-12
10.3.5 Road Development Management Programme in Mombasa County ............................................. 10-17
10.3.6 Passenger Transport Service Plan .................................................................................................. 10-19
10.3.7 Traffic Management/Traffic Demand Management Projects ........................................................ 10-21
10.3.8 Traffic Management Projects for Freight ...................................................................................... 10-22
10.3.9 Development Scenario ................................................................................................................... 10-24
10.4 Analysis on Development Plan...................................................................................................... 10-25
10.4.1 Scenario Analysis by STRADA .................................................................................................... 10-25
10.5 Thematic Analysis ......................................................................................................................... 10-29
10.5.1 The Nyali Corridor ........................................................................................................................ 10-30
10.5.2 Freight Movements in Mombasa County (As the Gate of Northern Corridor) ............................. 10-32
10.5.3 Combination of Bridges ................................................................................................................ 10-37
10.5.4 Lumumba-Moi Link (M6) and Traffic Calming (M3/M8) ............................................................ 10-38
10.5.5 Mass Transit Operation Alternatives ............................................................................................. 10-39
10.5.6 Institutional Arrangement on Transport Service and Management ............................................... 10-45
10.6 Institutional Arrangement – the Kick-off Coordination ................................................................ 10-46
10.6.1 Kenya Revenue Authority (KRA) or Treasury .............................................................................. 10-46
10.6.2 Kenya Ports Authority (KPA) ....................................................................................................... 10-47
10.6.3 Road and Traffic Authorities (KeNHA, KURA, KeRRA) ............................................................ 10-48
10.6.4 Traffic Management and Regulation Authority (Police, NTSA)................................................... 10-48
10.6.5 Kenya Railways Corporation (KRC) ............................................................................................. 10-48
10.6.6 County Government of Mombasa (CGM) ..................................................................................... 10-49
11. Urban Infrastructure Development Plan ......................................................................................... 11-1
11.1 Water Supply ................................................................................................................................... 11-1
11.1.1 Demand and Gap Analysis .............................................................................................................. 11-1
11.1.2 Development Policy ........................................................................................................................ 11-2
11.1.3 Development Strategy ..................................................................................................................... 11-3
11.2 Sewerage/Drainage .......................................................................................................................... 11-5
11.2.1 Demand and Gap Analysis .............................................................................................................. 11-5
11.2.2 Development Policy ........................................................................................................................ 11-7
11.2.3 Development Strategy ..................................................................................................................... 11-9
11.3 Solid Waste Management .............................................................................................................. 11-12
11.3.1 Demand and Gap Analysis ............................................................................................................ 11-12
11.3.2 Development Policy ...................................................................................................................... 11-13
Project for Formulation of Comprehensive Development Master Plan in the Mombasa Gate City in the Republic of Kenya Final Report
ix
Nippon Koei Co., Ltd. / PADECO Co., Ltd. / Eight-Japan Engineering Consultants Inc.
11.3.3 Management Plan .......................................................................................................................... 11-15
11.3.4 Proposed Projects .......................................................................................................................... 11-20
11.3.5 Challenges for Implementation ..................................................................................................... 11-21
11.4 Power Supply................................................................................................................................. 11-22
11.4.1 Demand and Gap Analysis ............................................................................................................ 11-22
11.4.2 Development Policy ...................................................................................................................... 11-23
11.4.3 Development Strategy ................................................................................................................... 11-24
11.5 Telecommunication ....................................................................................................................... 11-27
11.5.1 Demand and Gap Analysis ............................................................................................................ 11-27
11.5.2 Development Policy ...................................................................................................................... 11-32
11.5.3 Development Strategy ................................................................................................................... 11-33
12. Social and Public Facility Development Plan .................................................................................. 12-1
12.1 Housing ........................................................................................................................................... 12-1
12.1.1 Demand and Gap Analysis .............................................................................................................. 12-1
12.1.2 Development Policy ........................................................................................................................ 12-3
12.1.3 Development Strategy ..................................................................................................................... 12-4
12.1.4 Challenges for Implementation ....................................................................................................... 12-6
12.2 Education ......................................................................................................................................... 12-7
12.2.1 Demand and Gap Analysis .............................................................................................................. 12-7
12.2.2 Development Policy ........................................................................................................................ 12-8
12.2.3 Development Strategy ..................................................................................................................... 12-9
12.2.4 Challenges for Implementation ..................................................................................................... 12-10
12.3 Health ............................................................................................................................................ 12-11
12.3.1 Demand and Gap Analysis ............................................................................................................ 12-11
12.3.2 Development Policy ...................................................................................................................... 12-11
12.3.3 Development Strategy ................................................................................................................... 12-12
12.3.4 Challenges for Implementation ..................................................................................................... 12-13
13. Tourism Development Plan ............................................................................................................... 13-1
13.1 Tourism Development Concept ....................................................................................................... 13-1
13.2 Development Policy ........................................................................................................................ 13-6
13.3 Management Plan ............................................................................................................................ 13-8
13.4 Infrastructure Management Plan ................................................................................................... 13-14
13.5 Proposed Projects .......................................................................................................................... 13-16
14. Urban Management Plan ................................................................................................................... 14-1
14.1 Overview ......................................................................................................................................... 14-1
Project for Formulation of Comprehensive Development Master Plan in the Mombasa Gate City in the Republic of Kenya Final Report
x
Nippon Koei Co., Ltd. / PADECO Co., Ltd. / Eight-Japan Engineering Consultants Inc.
14.2 Regulation and Guideline for Urban Management .......................................................................... 14-2
14.3 Organisation Enhancement Plan ...................................................................................................... 14-2
14.3.1 Implementing Organisation of the Master Plan ............................................................................... 14-2
14.3.2 Items of Capacity Development ...................................................................................................... 14-3
14.3.3 Framework of Organisation Enhancement Plan .............................................................................. 14-4
14.3.4 Proposed Approaches to Enhance the Organisation ........................................................................ 14-4
14.4 Human Resource Development Plan ............................................................................................... 14-7
14.4.1 Framework of Human Resource Development Plan ....................................................................... 14-7
14.4.2 Proposed Approaches to Develop Human Resources...................................................................... 14-8
15. Strategic Environmental Assessment (SEA) and Public Engagement ........................................... 15-1
15.1 Introduction ..................................................................................................................................... 15-1
15.2 Strategic Environmental Assessment Approach .............................................................................. 15-1
15.2.1 Overview ......................................................................................................................................... 15-1
15.2.2 Legal Framework on Strategic Environmental Assessment ............................................................ 15-2
15.2.3 Proposed Strategic Environmental Assessment Approach .............................................................. 15-2
15.2.4 SEA Training Workshop ................................................................................................................. 15-3
15.2.5 Progress of SEA .............................................................................................................................. 15-4
15.3 Public Engagement and Information Disclosure ............................................................................. 15-4
15.3.1 Proposed Design of Stakeholder Engagement ................................................................................. 15-4
15.3.2 Stakeholder and Focused Group Meeting........................................................................................ 15-6
15.3.3 Civic Education ............................................................................................................................. 15-10
15.3.4 Essay and Art Competition ............................................................................................................ 15-11
15.3.5 MGC MP Website ......................................................................................................................... 15-11
15.3.6 Advertisement and Public Notice .................................................................................................. 15-12
15.4 Analysis of Structure Plan Alternatives ......................................................................................... 15-14
15.4.1 Outline ........................................................................................................................................... 15-14
15.4.2 Analysis ......................................................................................................................................... 15-15
15.5 Stakeholder Comment/Input and Integration into Mombasa Gate City Master Plan .................... 15-16
15.5.1 Stakeholder Comment by Sector ................................................................................................... 15-16
15.5.2 Stakeholder Comment by Subcounty ............................................................................................ 15-17
15.5.3 Comment by Key Group ............................................................................................................... 15-18
15.5.4 Integration of Comments into the Master Plan .............................................................................. 15-19
16. Priority Projects and Priority Areas ................................................................................................ 16-1
16.1 Priority Projects ............................................................................................................................... 16-1
16.1.1 Selection of Priority Projects ........................................................................................................... 16-1
16.1.2 Priority Projects for Transport Sector .............................................................................................. 16-3
Project for Formulation of Comprehensive Development Master Plan in the Mombasa Gate City in the Republic of Kenya Final Report
xi
Nippon Koei Co., Ltd. / PADECO Co., Ltd. / Eight-Japan Engineering Consultants Inc.
16.1.3 Priority Projects for Urban Infrastructure ........................................................................................ 16-7
16.1.4 Priority Projects for Social and Public Facility ............................................................................. 16-21
16.1.5 Priority Projects for Tourism ......................................................................................................... 16-24
16.1.6 Priority Projects for Urban Management ....................................................................................... 16-27
16.2 Priority Projects to be Implemented by Public Private Partnership (PPP) .................................... 16-29
16.2.1 Classification of PPP Arrangement under PPP Act No.15 2013 ................................................... 16-29
16.2.2 Qualitative Evaluation and Selection of PPP Arrangement for Priority Projects .......................... 16-32
16.2.3 Classification of Priority Projects by Term ................................................................................... 16-37
16.2.4 Recommendable Key Aspects for the Contracting Authority and PPP Node ............................... 16-37
16.2.5 Suggested Remarkable Aspects for the County Government of Mombasa on PPP Project .......... 16-40
16.3 Priority Areas................................................................................................................................. 16-42
16.3.1 Selection of Priority Areas ............................................................................................................ 16-42
16.3.2 Detailed Plan and Urban Development Project Formulation Method ........................................... 16-42
16.3.3 Detailed Plan and Urban Development Project in the Island ........................................................ 16-43
16.3.4 Detailed Plan and Urban Development Project in Changamwe / Miritini ..................................... 16-47
16.3.5 Mombasa SEZ at Dongo Kundu .................................................................................................... 16-50
16.3.6 Development Standard for Large-scale Development ................................................................... 16-53
16.4 Action Plan .................................................................................................................................... 16-55
16.4.1 Action Plan for Land Use Plan Implementation ............................................................................ 16-55
16.4.2 Action Plan for Transport Sector Implementation ......................................................................... 16-56
17. Conclusion and Recommendation .................................................................................................... 17-1
17.1 Conclusion ....................................................................................................................................... 17-1
17.2 Recommendation ............................................................................................................................. 17-5
APPENDIX
Project for Formulation of Comprehensive Development Master Plan in the Mombasa Gate City in the Republic of Kenya Final Report
xii
Nippon Koei Co., Ltd. / PADECO Co., Ltd. / Eight-Japan Engineering Consultants Inc.
List of Tables
Table 1.3.1: Outline of Steering Committee ................................................................................................ 1-4 Table 1.3.2: Record of Technical Working Group ....................................................................................... 1-5 Table 1.3.3: Record of Lectures ................................................................................................................... 1-9 Table 1.4.1: Legal Framework ................................................................................................................... 1-10 Table 1.4.2: Policy ..................................................................................................................................... 1-11 Table 2.1.1: Administrative Structure of Mombasa County ........................................................................ 2-1 Table 2.2.1: Climate Conditions in Mombasa County ................................................................................. 2-2 Table 2.3.1: Mombasa County Population and Annual Average Growth Rate in Census Years ................. 2-2 Table 2.4.1: Distribution of Establishments by Industries and Distribution of Workers by Industry in
Mombasa County ..................................................................................................................... 2-7 Table 2.5.1: Function of Stakeholders in Education Sector ....................................................................... 2-10 Table 2.5.2: Function of Stakeholders in Health Sector ............................................................................. 2-11 Table 2.5.3: Tertiary Education Facilities in Mombasa County ................................................................. 2-13 Table 2.5.4: Teacher Pupil Ratio in Mombasa County .............................................................................. 2-13 Table 2.5.5: Health Status in Mombasa County ......................................................................................... 2-14 Table 2.5.6: Number of Health Facilities and Beds in Mombasa County .................................................. 2-15 Table 2.5.7: Community and Recreation Facilities in Mombasa County................................................... 2-15 Table 2.6.1: Function of Stakeholders in Housing Sector .......................................................................... 2-17 Table 2.6.2: Rent Amount in Mombasa County by Subcounty.................................................................. 2-20 Table 2.6.3: Number of Units of Public Rental Houses ............................................................................. 2-21 Table 2.6.4: Number of Units of Staff Houses ........................................................................................... 2-21 Table 2.6.5: Number of Units of Institutional Houses ............................................................................... 2-21 Table 2.6.6: Number of Units of Shops/Commercial ................................................................................. 2-21 Table 2.6.7: Planned CGM Housing Projects ............................................................................................ 2-22 Table 2.7.1: International Arrivals in MIAM ............................................................................................. 2-25 Table 2.7.2: Registered/Licensed Tourism-related Services ...................................................................... 2-26 Table 2.7.3: Number of Hotels by Classification in Mombasa, Kilifi, and Kwale..................................... 2-26 Table 2.7.4: Number of Hotels, Rooms, Beds, and Occupancy by Region ................................................ 2-26 Table 2.7.5: Existing Tourism Resources in Mombasa County ................................................................. 2-27 Table 2.7.6: Existing Tourism Resources in Surrounding Counties .......................................................... 2-28 Table 2.7.7: List of Tour Courses for Cruise Passengers ........................................................................... 2-30 Table 2.7.8: International Arrivals by Nationality in MIAM ..................................................................... 2-30 Table 2.7.9: Public Sector (National Apparatus) Legal Framework .......................................................... 2-31 Table 2.7.10: Tourism Management Issues and Comments ....................................................................... 2-33 Table 2.7.11: Cultural and Heritage Conservation and Management ........................................................ 2-33 Table 3.2.1: Current Land Use (Land Mass) in 2015 ................................................................................... 3-4 Table 3.2.2: Characteristics of the Mombasa Island .................................................................................... 3-5 Table 3.2.3: Characteristics of Mainland North ........................................................................................... 3-5 Table 3.2.4: Characteristics of Mainland West ............................................................................................ 3-6 Table 3.2.5: Characteristics of Mainland South ........................................................................................... 3-7 Table 3.3.1: Type of the Informal Settlement in Mombasa County ........................................................... 3-11 Table 3.3.2: Number of Residents and Share in Each Ward ...................................................................... 3-11 Table 3.3.3: Security of Tenure in Each Ward ........................................................................................... 3-12 Table 3.3.4: Type of Informal Settlement in Mombasa County ................................................................. 3-13 Table 3.5.1: Outline of KMP ...................................................................................................................... 3-16 Table 3.5.2: Capital Investment Plan for ISUDP-Mombasa's Priority Projects Covering FY (2016/17,
2017/18, and 2018/19); Three Years Period .......................................................................... 3-19 Table 3.5.3: General Review of ISUDP-Mombasa .................................................................................... 3-22 Table 4.4.1: Summary of Port Infrastructure Projects .................................................................................. 4-8 Table 4.6.1: Types and Extension of Roads in Mombasa County ............................................................. 4-10 Table 4.6.2: Road Coverage Ratio in Mombasa County ............................................................................ 4-11 Table 4.6.3: Comparison of Road Coverage Ratios ................................................................................... 4-11
Project for Formulation of Comprehensive Development Master Plan in the Mombasa Gate City in the Republic of Kenya Final Report
xiii
Nippon Koei Co., Ltd. / PADECO Co., Ltd. / Eight-Japan Engineering Consultants Inc.
Table 4.6.4: Mode Share of Person Trips ................................................................................................... 4-16 Table 4.6.5: PCU Conversion Factors ........................................................................................................ 4-16 Table 4.6.6: Breakdown of Vehicles Involved in Accidents in Mombasa County, 2011 .......................... 4-21 Table 4.6.7: Cause of Accidents in Mombasa County, 2009-2011 ............................................................ 4-21 Table 4.8.1: Transit Time/Cost Reductions (2009-2014) ........................................................................... 4-30 Table 4.8.2: Import Transit Time Survey Results ...................................................................................... 4-30 Table 4.8.3: Export Transit Time Survey Results ...................................................................................... 4-31 Table 4.9.1: Access Road Congestion Alleviation Measures (via April 9, 2015 Summit) ........................ 4-40 Table 4.9.2: Pipeline Throughput of White Petroleum Products (2010-2014) ........................................... 4-41 Table 4.9.3: MGR System Overview ......................................................................................................... 4-43 Table 4.9.4: Freight/Passenger Railways Traffic/Revenue ........................................................................ 4-44 Table 4.9.5: Freight Tariffs on MGR Railway ........................................................................................... 4-45 Table 4.10.1: TEU Increases at Mombasa Port (as per Port Master Plan) ................................................. 4-47 Table 5.1.1: Current Water Demand and Water Resources ......................................................................... 5-6 Table 5.1.2: Selected Development Scenarios of Water Resource .............................................................. 5-6 Table 5.1.3: Contents of the Water Demand Based on the Draft ISUDP-Mombasa .................................... 5-7 Table 5.1.4: Potential Water Supply from BWSS and UCBWSS Sources Based on the Draft ISUDP-
Mombasa .................................................................................................................................. 5-8 Table 5.2.1: Drain Length – Demand and Supply Gap .............................................................................. 5-12 Table 5.2.2: Contents of the Wastewater Master Plan (Under Study)........................................................ 5-13 Table 5.2.3: Estimated Sewage Flows of the Wastewater Master Plan (Under Study) .............................. 5-14 Table 5.2.4: Projects of the Wastewater Master Plan (Under Study) ......................................................... 5-14 Table 5.2.5: Drainage Design Guideline by the Master Plan ..................................................................... 5-14 Table 5.2.6: Storm Water Drainage Projects .............................................................................................. 5-15 Table 5.3.1: Strategies and Projects Proposed by ISUDP-Mombasa ......................................................... 5-18 Table 5.3.2: Number of Staff in SWM Sector (2015) ................................................................................ 5-19 Table 5.3.3: Organisations Implementing Collection and Transportation of Solid Waste ......................... 5-21 Table 5.3.4: Number of Waste Collection Vehicles ................................................................................... 5-22 Table 5.3.5: Solid Waste Collected and Transported to Dumping Sites .................................................... 5-22 Table 5.3.6: Dumping Sites Operated by CGM ......................................................................................... 5-22 Table 5.3.7: Description and Result of Analysis of Dumping Sites Operated by CGM ............................ 5-24 Table 5.4.1: Power Generation Sources and Energy Generated ................................................................. 5-28 Table 5.4.2: Electricity Tariff Structure ..................................................................................................... 5-31 Table 5.4.3: Ongoing and Planned Infrastructure Projects ......................................................................... 5-32 Table 5.5.1: Ongoing and Planned ICT Projects ........................................................................................ 5-40 Table 6.1.1: Job Description of Directorate of Lands, Planning, and Housing ............................................ 6-2 Table 6.1.2: Training Budget Allocation of Each Department of Mombasa County ................................... 6-3 Table 6.1.3: Classification of Training Budget by Budget Items ................................................................. 6-4 Table 6.1.4: Kenya School of Government Course Calendar 2015/2016 .................................................... 6-4 Table 6.3.1: Prospective Projects in Mombasa .......................................................................................... 6-16 Table 6.3.2: Training Stages for PPP ......................................................................................................... 6-18 Table 6.3.3: PPP Seminars Held by PPP Unit After 2014 ......................................................................... 6-18 Table 8.2.1: Structure Plan Alternatives ...................................................................................................... 8-7 Table 8.2.2: Characteristics of Trend Development (Minimum Intervention) ............................................. 8-8 Table 8.2.3: Characteristics of Northwest Corridor Development (Double Ring Road Development) ....... 8-9 Table 8.2.4: Characteristics of Southwest Corridor Development (Logistics Corridor Development) ...... 8-10 Table 8.2.5: Function Image of Subcentres ................................................................................................ 8-11 Table 8.2.6: Characteristics of Subcentres ................................................................................................. 8-13 Table 8.2.7: Function Image of Supporting Urban Areas .......................................................................... 8-15 Table 8.3.1: Population Growth Rate in Kenya ......................................................................................... 8-15 Table 8.3.2: Population Growth Scenarios in ISUDP-Mombasa ............................................................... 8-16 Table 8.3.3: Population Based on Census .................................................................................................. 8-16 Table 8.3.4: Population Projection Based on Census (High Case) ............................................................ 8-17 Table 8.3.5: Population Projection Based on Census (High Case) ............................................................ 8-17 Table 8.3.6: Population Capacity Projection .............................................................................................. 8-18 Table 8.3.7: Estimated Population Distribution for Sublocation ................................................................ 8-18 Table 8.3.8: Future GDP Projection in Kenya 2015-2040 ......................................................................... 8-20
Project for Formulation of Comprehensive Development Master Plan in the Mombasa Gate City in the Republic of Kenya Final Report
xiv
Nippon Koei Co., Ltd. / PADECO Co., Ltd. / Eight-Japan Engineering Consultants Inc.
Table 8.3.9: Future Employment Projection .............................................................................................. 8-20 Table 8.3.10: SWOT Analysis for Mombasa County ................................................................................ 8-20 Table 8.3.11: Future GRP Projection in Mombasa County 2015-2040 ..................................................... 8-21 Table 8.3.12: Future Employment Projection up to 2040 .......................................................................... 8-23 Table 9.3.1: Issues on CGM Land Use Zoning ............................................................................................ 9-6 Table 9.4.1: Proposed Area Classification of Population Density ............................................................. 9-11 Table 9.4.2: Population Allocation by Area ............................................................................................... 9-11 Table 9.4.3: Proposed Land Use Classification.......................................................................................... 9-12 Table 9.4.4: Location and Area of Land Use ............................................................................................. 9-13 Table 10.2.1: SWOT Analysis on Mombasa Transport ............................................................................. 10-1 Table 10.3.1: Major Physical Improvements for Region-wide Road Network Plan .................................. 10-7 Table 10.3.2: Major Physical Improvements for Island Structure Plan ................................................... 10-10 Table 10.3.3: Hyper Corridor Coordination Plan ..................................................................................... 10-11 Table 10.3.4: Major Physical Improvements for Suburban Structure Plan (North) ................................. 10-13 Table 10.3.5: Major Physical Improvements for Suburban Structure Plan (West) .................................. 10-15 Table 10.3.6: Major Physical Improvements for Suburban Structure Plan (South) ................................. 10-16 Table 10.3.7: Major Physical Improvements for Suburban Structure Plan .............................................. 10-18 Table 10.3.8: Plans for Passenger Transport Service ............................................................................... 10-19 Table 10.3.9: Plans for Demand Management ......................................................................................... 10-22 Table 10.3.10: Major Traffic Management Projects for Freight .............................................................. 10-23 Table 10.3.11: Development Plan Scenarios ............................................................................................ 10-24 Table 10.4.1: Cases Used for Scenario Analysis ...................................................................................... 10-25 Table 10.4.2: Evaluative Metrics: 2020 ................................................................................................... 10-26 Table 10.4.3: Evaluative Metrics: 2030 ................................................................................................... 10-27 Table 10.4.4: Evaluative Metrics: 2040 ................................................................................................... 10-29 Table 10.5.1: Nyali Corridor Development Strategy with +MRT Cases ................................................. 10-30 Table 10.5.2: Maritime Import Freight Demand with Classification in the Port of Mombasa ................. 10-33 Table 10.5.3: Freight-related Development Scenario ............................................................................... 10-33 Table 10.5.4: Mass Transit Alignment for Ferry – VOK – City Mall ...................................................... 10-40 Table 10.5.5: Comparison of MRT Systems ............................................................................................ 10-42 Table 10.5.6: Preliminary Cash Flow Analysis (P1) ................................................................................ 10-43 Table 11.1.1: Demand and Gap Analysis of Water Supply........................................................................ 11-1 Table 11.1.2: Development Policy of Water Supply .................................................................................. 11-2 Table 11.1.3: Project List of Water Supply ................................................................................................ 11-3 Table 11.2.1: Demand and Gap Analysis of Sewerage .............................................................................. 11-6 Table 11.2.2: Existing and Implementation of Drainage............................................................................ 11-6 Table 11.2.3: Demand and Gap Analysis of Drainage ............................................................................... 11-7 Table 11.2.4: Development Policy of Sewerage ........................................................................................ 11-7 Table 11.2.5: Development Policy of Drainage ......................................................................................... 11-8 Table 11.2.6: Project List of Sewerage ...................................................................................................... 11-9 Table 11.2.7: Project List of Drainage ..................................................................................................... 11-11 Table 11.3.1: Current Situations of Solid Waste Management and its Gap Between Desirable Situations . 11-
12 Table 11.3.2: Estimation of Waste Generation ........................................................................................ 11-14 Table 11.3.3: Proposed Sector Vision and Development Policy of Solid Waste Management Sector .... 11-14 Table 11.3.4: Goals of Solid Waste Management .................................................................................... 11-14 Table 11.3.5: Outline of New Sanitary Landfill Structure ....................................................................... 11-17 Table 11.3.6: Project List of Solid Waste Management Sector ................................................................ 11-20 Table 11.4.1: Power Demand Forecast of Kenya ..................................................................................... 11-22 Table 11.4.2: Power Demand Forecast of Mombasa County ................................................................... 11-22 Table 11.4.3: List of Projects ................................................................................................................... 11-25 Table 11.5.1: Penetration Ratio of Developed Countries between 2005 and 2015 .................................. 11-28 Table 11.5.2: Mobile Telephone Demand ................................................................................................ 11-28 Table 11.5.3: Internet Use Demand .......................................................................................................... 11-29 Table 11.5.4: Internet Broadband Use Demand ....................................................................................... 11-30 Table 11.5.5: International Available Bandwidth .................................................................................... 11-30 Table 11.5.6: International Communication Bandwidth Capacity Demand ............................................. 11-31
Project for Formulation of Comprehensive Development Master Plan in the Mombasa Gate City in the Republic of Kenya Final Report
xv
Nippon Koei Co., Ltd. / PADECO Co., Ltd. / Eight-Japan Engineering Consultants Inc.
Table 11.5.7: List of Projects ................................................................................................................... 11-33 Table 12.1.1: Proposed Sector Vision and Development Policy of Housing Sector .................................. 12-3 Table 12.1.2: Project List of Housing Sector ............................................................................................. 12-6 Table 12.2.1: Overall Estimated Gap in Educational Facility Numbers in 2040 ....................................... 12-7 Table 12.2.2: Proposed Sector Vision and Development Policy of Education Sector ............................... 12-8 Table 12.2.3: Project List of Education Sector......................................................................................... 12-10 Table 12.3.1: Estimated Gap in Health Facility Numbers in the Future .................................................. 12-11 Table 12.3.2: Proposed Sector Vision and Development Policy of Health Sector ................................... 12-11 Table 12.3.3: Project List of Health Sector .............................................................................................. 12-13 Table 13.1.1: SWOT Analysis ................................................................................................................... 13-1 Table 13.1.2: Target Market (General Direction) ...................................................................................... 13-4 Table 13.3.1: Target Market of Tourism Sector by Term .......................................................................... 13-8 Table 13.3.2: Tourism Management Plan by Term .................................................................................... 13-9 Table 13.5.1: Proposed Projects ............................................................................................................... 13-16 Table 14.3.1: Framework of Organisation Enhancement Plan ................................................................... 14-4 Table 14.4.1: Framework of Human Resource Development Plan ............................................................ 14-8 Table 14.4.2: Job Groups and Promotion Ranges ...................................................................................... 14-8 Table 15.3.1: Purposes of Stakeholder Meetings ....................................................................................... 15-5 Table 15.3.2: Location and Date (SHM completed, to be implemented) ................................................... 15-6 Table 15.3.3: Agenda of SHM #2 (Example)............................................................................................. 15-6 Table 15.3.4: Location and Date of SHMs #3 ............................................................................................ 15-8 Table 15.3.5: Agenda of SHMs #3 (Example) ........................................................................................... 15-9 Table 15.3.6: Summary of Advertisement ............................................................................................... 15-13 Table 15.4.1: Compound Matrix for Structure Plan Alternatives ............................................................ 15-16 Table 16.1.1: List of Priority Projects ........................................................................................................ 16-1 Table 16.1.2: Mombasa Gate Bridge (Likoni Bridge) ............................................................................... 16-3 Table 16.1.3: Second Nyali Bridge ............................................................................................................ 16-4 Table 16.1.4: Northern Bypass Road ......................................................................................................... 16-4 Table 16.1.5: Mombasa Southern Bypass Road ......................................................................................... 16-5 Table 16.1.6: Missing Link Improvement .................................................................................................. 16-5 Table 16.1.7: Shimanzi – Kipevu Link ...................................................................................................... 16-5 Table 16.1.8: Road Development Programme Preparation (2020-40) ....................................................... 16-6 Table 16.1.9: MRT Ferry-VOK-City Mall Line, Loop Line ...................................................................... 16-6 Table 16.1.10: Rehabilitation and Extension Project of Water Supply System ......................................... 16-7 Table 16.1.11: Development of Mwache Multipurpose Dam .................................................................... 16-8 Table 16.1.12: Rehabilitation Project of the Existing Waste Water Treatment Plant ................................ 16-9 Table 16.1.13: Rehabilitation and Extension Project of Sewerage System .............................................. 16-10 Table 16.1.14: Construction of Drainage along the Existing Paved Roads.............................................. 16-11 Table 16.1.15: Provision of Waste Collection and Transportation Vehicle ............................................. 16-12 Table 16.1.16: Capacity Development for Solid Waste Management ..................................................... 16-12 Table 16.1.17: Decommission of Dumping Sites and Construction of New Sanitary Landfill Sites ....... 16-13 Table 16.1.18: Provision of Waste Collection and Transportation Vehicles and Construction of Transfer
Stations ............................................................................................................................. 16-13 Table 16.1.19: Construction of Hazardous Waste Disposal Facility ........................................................ 16-14 Table 16.1.20: Capacity Development for 3R Activities ......................................................................... 16-14 Table 16.1.21: Development of Power Supply ........................................................................................ 16-15 Table 16.1.22: Extension of Power Distribution Coverage ...................................................................... 16-16 Table 16.1.23:Upgrade the Current Distribution Network ....................................................................... 16-17 Table 16.1.24: Development of Optic Trunk Communication Network .................................................. 16-18 Table 16.1.25: Development of Mobile Phone Coverage in Mombasa County ....................................... 16-19 Table 16.1.26: Development of Mombasa ICT Centre with Data Centre ................................................ 16-20 Table 16.1.27: Establishment of a Mombasa County Housing Development Agency (Social Housing) 16-21 Table 16.1.28: Promotion of Efficiency and Transparency in Land Administration ............................... 16-22 Table 16.1.29: Formulation of Zoning Regulation ................................................................................... 16-22 Table 16.1.30: Formulation of Minimum Quality Standard for Private Schools ..................................... 16-23 Table 16.1.31: Development of Specific Training Course for Key Industries in Mombasa County ....... 16-23 Table 16.1.32: Establishment of Referral Hospitals in Each Subcounty with Emergency Services ........ 16-24
Project for Formulation of Comprehensive Development Master Plan in the Mombasa Gate City in the Republic of Kenya Final Report
xvi
Nippon Koei Co., Ltd. / PADECO Co., Ltd. / Eight-Japan Engineering Consultants Inc.
Table 16.1.33: Project of Capacity Development for Marketing and Promotion for Mombasa County and its Surrounding Areas ........................................................................................................... 16-24
Table 16.1.34: Project for Capacity Development on Tourism Statistics in Mombasa County ............... 16-25 Table 16.1.35: Cultural Heritages Restoration ......................................................................................... 16-26 Table 16.1.36: Setting Up a Geographic Information System (GIS) Laboratory ..................................... 16-27 Table 16.1.37: Comprehensive Cooperation with the Universities .......................................................... 16-28 Table 16.1.38: Organisational Strengthening for Urban Management..................................................... 16-29 Table 16.2.1: Conversion of Qualitative Evaluation to Scores ................................................................ 16-34 Table 16.2.2: Classification of Category .................................................................................................. 16-34 Table 16.2.3: Example of Evaluation Methodology by Description ........................................................ 16-35 Table 16.2.4: Score for Qualitative Evaluation ........................................................................................ 16-35 Table 16.2.5: Implementation Plan of Priority Projects (Unit KES in millions) ...................................... 16-36 Table 16.2.6: Implementation Term of Priority Projects (Unit KES in millions) .................................... 16-37 Table 16.2.7: Guidance to Success Three Major Items for Conditions Precedent ................................... 16-40 Table 16.2.8: Revenue Stream of CGM 2015-2035 ................................................................................. 16-41 Table 16.3.1: Urban Management Strategy .............................................................................................. 16-44 Table 16.3.2: Proposed Land Use Classification in the Island ................................................................. 16-45 Table 16.3.3: Urban Development Projects in Mombasa Island .............................................................. 16-46 Table 16.3.4: Urban Management Strategy .............................................................................................. 16-49 Table 16.3.5: Proposed Land Use Classification in Island ....................................................................... 16-49 Table 16.3.6: Urban Development Project in Changamwe/Miritini......................................................... 16-50 Table 16.3.7: Ideas for Development Standard ........................................................................................ 16-54 Table 16.4.1: Comprehensive Action Plan for Transport Infrastructure .................................................. 16-57
Project for Formulation of Comprehensive Development Master Plan in the Mombasa Gate City in the Republic of Kenya Final Report
xvii
Nippon Koei Co., Ltd. / PADECO Co., Ltd. / Eight-Japan Engineering Consultants Inc.
List of Figures
Figure 1.1.1: Location Map .......................................................................................................................... 1-1 Figure 1.1.2: Overall Scope of Works and Schedule ................................................................................... 1-2 Figure 1.2.1: Work Process of Master Plan Formulation ............................................................................. 1-3 Figure 1.3.1: Project Organisation Chart ...................................................................................................... 1-3 Figure 2.3.1: Population Distribution Trend ................................................................................................ 2-3 Figure 2.3.2: Age Distribution (Left: Mombasa County, Right: Kenya) ..................................................... 2-3 Figure 2.4.1: GDP Growth of Kenya and Neighbouring Countries ............................................................. 2-4 Figure 2.4.2: GDP and GNI Growth of Kenya ............................................................................................. 2-4 Figure 2.4.3: GDP by Sector in Kenya (2014) ............................................................................................. 2-5 Figure 2.4.4: Earnings by Sector (Left) and Number of Establishments by Sector in Mombasa County
(Right) ...................................................................................................................................... 2-6 Figure 2.4.5: Location of Agricultural Land Use in Mombasa County (2015) ............................................ 2-6 Figure 2.4.6: Location of Industrial Land Use in Mombasa County (2015) ................................................ 2-7 Figure 2.4.7: Location of Commercial Land Use in Mombasa County (2015) ............................................ 2-8 Figure 2.4.8: Labour Force Participation ..................................................................................................... 2-8 Figure 2.4.9: Distribution of Wage Employment by Income Groups in Mombasa County (2012) ............. 2-9 Figure 2.5.1: Net Enrolment Rate and Transition Rate for Schools in Mombasa County ......................... 2-12 Figure 2.5.2: Number of Students and Schools of Public Schools and Private Schools in Mombasa County
............................................................................................................................................... 2-12 Figure 2.5.3: Number of Schools and School Age Population by Area ..................................................... 2-13 Figure 2.5.4: Comparison between the Share of Health Facilities and Population by Subcounty ............. 2-15 Figure 2.6.1: Current Residential Areas in Mombasa County ................................................................... 2-18 Figure 2.6.2: Trend of Household Numbers ............................................................................................... 2-18 Figure 2.6.3: Housing Production and Demand by Income Categories in Urban Areas of Kenya ............ 2-19 Figure 2.6.4: Composition of Housing Type .............................................................................................. 2-19 Figure 2.6.5: Location of County Government Land where Housing Project is Planned .......................... 2-22 Figure 2.7.1: Map of Tourism Resources in Mombasa County ................................................................. 2-29 Figure 3.1.1: Urbanisation Trend Since 1971 .............................................................................................. 3-3 Figure 3.2.1: Major Zones of Mombasa County .......................................................................................... 3-3 Figure 3.3.1: Location of the Informal Settlements in Mombasa County .................................................. 3-10 Figure 3.4.1: Location of the KISIP Project Sites ...................................................................................... 3-14 Figure 3.5.1: Transportation Use Plan Proposed in ISUDP-Mombasa ...................................................... 3-18 Figure 3.5.2: Land Use Pattern Proposed in ISUDP-Mombasa ................................................................. 3-18 Figure 3.5.3: Proposed Road Network Improvement for Mombasa in ISUDP-MOMBASA .................... 3-23 Figure 4.3.1: Mombasa Northern Bypass Route Options (Route C/Bamburi Link Selected) ...................... 4-5 Figure 4.3.2: Location of the Proposed Second Nyali Bridge ...................................................................... 4-7 Figure 4.5.1: Organisational Structure of the Roads and Transport Directorate, County Government of
Mombasa................................................................................................................................. 4-9 Figure 4.5.2: 2015-2016 Budget for the Roads and Transport Directorate, Mombasa County (KES millions)
................................................................................................................................................. 4-9 Figure 4.6.1: Existing Road Network in Mombasa Island and Mainland Areas ........................................ 4-10 Figure 4.6.2: Location of Traffic Congestion in Mombasa Island ............................................................. 4-12 Figure 4.6.3: Location of Traffic Congestion in Mainland North .............................................................. 4-13 Figure 4.6.4: Location of Traffic Congestion in Mainland West ............................................................... 4-14 Figure 4.6.5: Key Local Market Corridors (Passenger and Goods Movement) ......................................... 4-15 Figure 4.6.6: Area Population and PCU Totals .......................................................................................... 4-17 Figure 4.6.7: Passenger Flow (MV and NMV) and Share of Public Transport (Matatu/Bus) ................... 4-18 Figure 4.6.8: Passenger Flows on Major Corridors by Mode .................................................................... 4-19 Figure 4.6.9: Passenger Internal Zonal Traffic and Major OD Traffic ...................................................... 4-20 Figure 4.6.10: Road Deaths/Injuries in Mombasa County, 2012-2014 ...................................................... 4-21 Figure 4.6.11: On-Street Parking in CBD .................................................................................................. 4-23 Figure 4.7.1: Matatu Routes in Mombasa County ..................................................................................... 4-24
Project for Formulation of Comprehensive Development Master Plan in the Mombasa Gate City in the Republic of Kenya Final Report
xviii
Nippon Koei Co., Ltd. / PADECO Co., Ltd. / Eight-Japan Engineering Consultants Inc.
Figure 4.7.2: Likoni Ferry and Queue ........................................................................................................ 4-28 Figure 4.8.1: Port Dwell Time (2009-2014) ............................................................................................... 4-30 Figure 4.8.2: EAC Customs Data Transaction Process .............................................................................. 4-33 Figure 4.9.1: Mombasa Port and Associated Facilities Functions ............................................................. 4-34 Figure 4.9.2: Container Traffic at Mombasa vs. Dar es Salaam Port (TEU) ............................................. 4-35 Figure 4.9.3: CFS Performance (Tentative Analysis), Mombasa County .................................................. 4-37 Figure 4.9.4: Container Movements in 2014, Mombasa County ............................................................... 4-37 Figure 4.9.5: HV Movements per Day, Mombasa County ......................................................................... 4-38 Figure 4.9.6: Major Bulk Movement in 2014 in Mombasa County (DWT) .............................................. 4-38 Figure 4.9.7: HV Bulk Movements per Day in Mombasa County ............................................................. 4-39 Figure 4.9.8: Daily Heavy Vehicle Movements Related to the Port .......................................................... 4-39 Figure 4.9.9: Desired Lines (OD) – at Gate 18 and at Shimanzi ................................................................ 4-40 Figure 4.9.10: Moi International Airport: Terminal Entry and Tarmac Views .......................................... 4-42 Figure 4.9.11: Map of Railways in Mombasa County ............................................................................... 4-43 Figure 4.9.12: Alignments of SGR and MGR from Mombasa County to Mariakani ................................ 4-43 Figure 4.9.13: Rail Share of Freight Imports/Exports in Kenya ................................................................ 4-44 Figure 4.10.1: Map of ECT and CFS in Mombasa County ........................................................................ 4-46 Figure 4.10.2: Mombasa Port Area (as Planned, 2035) ............................................................................. 4-47 Figure 5.1.1: Existing Representation of Institutional Framework of Water under MWI ............................ 5-2 Figure 5.1.2: Kaya Bombo Reservoir ........................................................................................................... 5-3 Figure 5.1.3: Tiwi Boreholes ........................................................................................................................ 5-3 Figure 5.1.4: Magodzoni Reservoir and Marere Springs ............................................................................. 5-3 Figure 5.1.5: Mazeras Reservoir .................................................................................................................. 5-4 Figure 5.1.6: Nguu Tatu Reservoir ............................................................................................................... 5-4 Figure 5.1.7: Current Situation of Water Supply Facilities of Mombasa ..................................................... 5-5 Figure 5.1.8: Water Supply Trunk Infrastructures for Mombasa County .................................................... 5-9 Figure 5.2.1: Kizingo Wastewater Treatment Plant ................................................................................... 5-11 Figure 5.2.2: Kipevu Wastewater Treatment Plant .................................................................................... 5-11 Figure 5.2.3: Existing Sewer Pipe and Manhole ........................................................................................ 5-11 Figure 5.2.4: Existing Sewerage Systems on Mainland West and Mombasa Island .................................. 5-12 Figure 5.2.5: Rainfall Intensity Curve for Mombasa ................................................................................. 5-15 Figure 5.3.1: Locations of Waste Disposal Facilities ................................................................................. 5-17 Figure 5.3.2: Structure of Organisation of DoWE&NR (Draft) ................................................................. 5-19 Figure 5.3.3: Waste Composition in Kenya ............................................................................................... 5-20 Figure 5.3.4: Flow of Collection and Transportation of Solid Waste ........................................................ 5-20 Figure 5.4.1: Single Line of Power Supply in Mombasa County ............................................................... 5-29 Figure 5.4.2: Coverage of Power Grid in Mombasa County ...................................................................... 5-30 Figure 5.5.1: Mobile Penetration and Subscriptions in Kenya ................................................................... 5-35 Figure 5.5.2: Mobile Network Coverage in Mombasa County .................................................................. 5-36 Figure 5.5.3: Fixed Network Voice Services Subscriptions in Kenya ....................................................... 5-37 Figure 5.5.4: Fixed Telephone Subscriptions in Kenya ............................................................................. 5-38 Figure 6.1.1: Organisational Chart of County Government of Mombasa .................................................... 6-1 Figure 6.2.1: Proposed Mombasa Land Use Plan in the ISUD Plan 2035 ................................................. 6-12 Figure 6.2.2: Organisation Chart of Physical Planning Division ............................................................... 6-13 Figure 6.2.3: Procedure of Building Permission ........................................................................................ 6-14 Figure 6.3.1: General Flow Chart of PPP Project ...................................................................................... 6-17 Figure 8.2.1: Natural and Topographic Condition ....................................................................................... 8-3 Figure 8.2.2: Urbanisation Trend ................................................................................................................. 8-4 Figure 8.2.3: Ongoing and Planned Projects ................................................................................................ 8-5 Figure 8.2.4: Direction of Development Axis .............................................................................................. 8-6 Figure 8.2.5: Urban Expansion Pattern ........................................................................................................ 8-7 Figure 8.2.6: Trend Development (Minimum Intervention) ........................................................................ 8-8 Figure 8.2.7: Northwest Corridor Development (Double Ring Road Development) ................................... 8-9 Figure 8.2.8: Southwest Corridor Development (Logistics Corridor Development) ................................. 8-10 Figure 8.2.9: Structure Plan and Major Subcentres .................................................................................... 8-13 Figure 8.2.10: Structure Plan and Supporting Urban Areas ....................................................................... 8-14 Figure 8.3.1: Mombasa County Population Distribution by Age ............................................................... 8-19
Project for Formulation of Comprehensive Development Master Plan in the Mombasa Gate City in the Republic of Kenya Final Report
xix
Nippon Koei Co., Ltd. / PADECO Co., Ltd. / Eight-Japan Engineering Consultants Inc.
Figure 8.3.2: Scenario of Economic Development .................................................................................... 8-21 Figure 9.2.1: Urbanisation Types of Mombasa County with Population Density ........................................ 9-2 Figure 9.2.2: Mesh Based Slope Analysis .................................................................................................... 9-3 Figure 9.2.3: Contour Based Slope Analysis................................................................................................ 9-3 Figure 9.2.4: Map Showing Natural Environment ....................................................................................... 9-4 Figure 9.2.5: Environmentally Sensitive Areas ............................................................................................ 9-4 Figure 9.2.6: Suitable Land for Development .............................................................................................. 9-5 Figure 9.3.1: Draft Land Use Zoning Map for Mombasa Island .................................................................. 9-7 Figure 9.3.2: Draft Land Use Zoning Map for Mainland North ................................................................... 9-7 Figure 9.3.3: Draft Land Use Zoning Map for Mainland South................................................................... 9-8 Figure 9.3.4: Draft Land Use Zoning Map for Mainland West .................................................................... 9-8 Figure 9.4.1: Proposed Land Use Plan ....................................................................................................... 9-14 Figure 10.2.1: Concept of Infinite Industrial Loop .................................................................................... 10-3 Figure 10.2.2: Concept of Hyper Corridor ................................................................................................. 10-4 Figure 10.2.3: Concept of Trident Approach ............................................................................................. 10-5 Figure 10.3.1: Region-wide Road Network Structure Plan ........................................................................ 10-6 Figure 10.3.2: Transport Structure Plan Proposal for Island ...................................................................... 10-9 Figure 10.3.3: Hyper Corridor Coordination Plan .................................................................................... 10-11 Figure 10.3.4: Transport Structure Plan Proposal for Mainland Areas (North) ....................................... 10-13 Figure 10.3.5: Transport Structure Plan Proposal for Mainland Areas (West) ........................................ 10-15 Figure 10.3.6: Transport Structure Plan Proposal for Mainland Areas (South) ....................................... 10-16 Figure 10.3.7: Suburb Road Development Programme (RDP) ................................................................ 10-17 Figure 10.3.8: PDCA Mechanism in the RDP 2020-2030 ....................................................................... 10-18 Figure 10.3.9: Plans for Passenger Transport Service .............................................................................. 10-19 Figure 10.4.1: Assignment Results: 2020 (left: without; right: with) ...................................................... 10-26 Figure 10.4.2: Assignment Results: 2030 (left: without; right: +MRT Case) .......................................... 10-27 Figure 10.4.3: Assignment Results: 2040 (left: without; right: +MRT Case) .......................................... 10-28 Figure 10.5.1: Nyali Corridor Traffic Demand (in PCU x 100) – Left: 2030, Right: 2040 ..................... 10-31 Figure 10.5.2: Maritime Import Freight Distribution Scenario for 2020, 2030 and 2040 ........................ 10-32 Figure 10.5.3: BAU Situation in Short-Medium Term ............................................................................ 10-34 Figure 10.5.4: Trident Strategy Situation in Short-Medium Term ........................................................... 10-34 Figure 10.5.5: Trident + CFS Scenario in Short-Medium Term .............................................................. 10-35 Figure 10.5.6: Trident + CFS Scenario in Medium-Long Term .............................................................. 10-36 Figure 10.5.7: Harmonised Situation between Freight and Passenger Traffic in Medium Term Period . 10-37 Figure 10.5.8: Proposed Shimanzi-Kipevu Link Connecting to the Ongoing Kipevu Link Construction ... 10-
37 Figure 10.5.9: Application of Lumumba-Moi Link to the 2015 Network ................................................ 10-38 Figure 10.5.10: Example; Traffic Calming Application .......................................................................... 10-39 Figure 10.5.11: Mass Transit Alignment for Prioritised Section (P1) ...................................................... 10-40 Figure 10.5.12: Bird’s Eye View of the Mass Transit Alignment (P1) .................................................... 10-41 Figure 10.5.13: Passenger Service Demand Projection (P1/P2, in Person x 100) .................................... 10-41 Figure 10.5.14: Public Regulator vs Private Operator ............................................................................. 10-45 Figure 10.5.15: Concept of P7 “Matatu Route Revision and Employment Pool” ................................... 10-45 Figure 10.6.1: Proposed Shimanzi-Kipevu Link Connecting to Ongoing Kipevu Link Construction ..... 10-47 Figure 11.1.1: Demand and Gap Analysis of Water Supply ...................................................................... 11-2 Figure 11.1.2: Rehabilitation and Extension Project of Water Supply System .......................................... 11-4 Figure 11.1.3: Development of Mwache Multipurpose Dam ..................................................................... 11-4 Figure 11.2.1: Demand and Gap Analysis of Water Supply ...................................................................... 11-6 Figure 11.2.2: Rehabilitation Project of the Existing Wastewater Treatment Plant ................................. 11-10 Figure 11.2.3: Construction of Drainage Along the Existing Paved Road ............................................... 11-11 Figure 11.3.1: Structure of Transfer Station ............................................................................................. 11-15 Figure 11.3.2: Location of Landfill Sites and Restricted Area for Landfill Sites..................................... 11-18 Figure 11.3.3: Proposed Intermediary Treatment through MRF .............................................................. 11-19 Figure 11.3.4: Proposed Intermediary Treatment Through Composting Plant ........................................ 11-19 Figure 11.4.1: Power Demand Forecast of Mombasa County ................................................................. 11-23 Figure 11.5.1: Mobile Phone Penetration Ratio of Some Typical African Countries .............................. 11-27 Figure 11.5.2: Penetration of Internet Use of Developed Countries ........................................................ 11-29
Project for Formulation of Comprehensive Development Master Plan in the Mombasa Gate City in the Republic of Kenya Final Report
xx
Nippon Koei Co., Ltd. / PADECO Co., Ltd. / Eight-Japan Engineering Consultants Inc.
Figure 11.5.3: Penetration of Internet Use of Nordic Countries .............................................................. 11-29 Figure 11.5.4: Penetration of Internet Broadband of Developed Countries ............................................. 11-30 Figure 11.5.5: Penetration of Internet Broadband of Some Typical African Countries ........................... 11-30 Figure 11.5.6: International Communication Bandwidth Capacity Demand ........................................... 11-32 Figure 12.1.1: Calculation of Forecasted Housing Demand and Population Density in 2040 ................... 12-1 Figure 12.1.2: Future Housing Demand and Population Density ............................................................... 12-1 Figure 12.1.3: Number of Future Housing Demand by Area ..................................................................... 12-2 Figure 12.1.4: Population Density in Major Cities ..................................................................................... 12-2 Figure 12.1.5: Monthly Expenditure of Household in Mombasa County .................................................. 12-2 Figure 12.1.6: Proposed Scheme of the Mombasa County Housing Development Agency (Social Housing)
............................................................................................................................................... 12-5 Figure 12.2.1: Gap of Education Facility Numbers by Phase .................................................................... 12-7 Figure 12.2.2: Gap of Basic Education Facility Numbers by Area and Phase ........................................... 12-8 Figure 12.2.3: Proposed Location of New Colleges ................................................................................... 12-9 Figure 12.3.1: Proposed Location of Referral Hospitals .......................................................................... 12-12 Figure 13.1.1: Proposed Development Concept by Term .......................................................................... 13-5 Figure 13.1.2: Proposed Spatial Development Concept in Mvita .............................................................. 13-5 Figure 13.3.1: Map of Tourism Management Plan until 2020 (Short Term) ........................................... 13-11 Figure 13.3.2: Map of Tourism Management Plan until 2030 (Middle Term) ........................................ 13-12 Figure 13.3.3: Map of Tourism Management Plan until 2040 (Long Term) ........................................... 13-13 Figure 14.1.1: Component and Approaches of Master Plan Implementation ............................................ 14-1 Figure 14.3.1: Flow Chart to Examine Privatisation and Outsourcing....................................................... 14-7 Figure 15.2.1: Implementation Procedure of SEA in Kenya ...................................................................... 15-3 Figure 15.3.1: Photographs of SHMs #2 .................................................................................................... 15-7 Figure 15.3.2: Photographs of SHMs #3 .................................................................................................... 15-9 Figure 15.3.3: Photographs of SHM for Other County/Key Stakeholders ............................................... 15-10 Figure 15.4.1: Structure Plan Alternatives ............................................................................................... 15-15 Figure 16.2.1: Classification of PPP Arrangement Under PPP Act No. 2013 ......................................... 16-30 Figure 16.2.2: Joint Venture Scheme for Housing Project ....................................................................... 16-31 Figure 16.2.3: Guidance for Successful PPP Project Agreement ............................................................. 16-38 Figure 16.2.4: Recommended Key Factors for the Contracting Authority and PPP Node ...................... 16-38 Figure 16.3.1: Priority Areas .................................................................................................................... 16-42 Figure 16.3.2: Urban Factor (Transportation) .......................................................................................... 16-43 Figure 16.3.3: Urban Factor (Spatial Development) ................................................................................ 16-43 Figure 16.3.4: Detailed Plan for Mombasa Island .................................................................................... 16-45 Figure 16.3.5: Urban Development Projects in the Island ....................................................................... 16-47 Figure 16.3.6: Urban Factor (Transportation) .......................................................................................... 16-48 Figure 16.3.7: Urban Factor (Spatial Development) ................................................................................ 16-48 Figure 16.3.8: Detailed Plan for Changamwe/Miritini ............................................................................. 16-50 Figure 16.3.9: Location of the DongoKundu-SEZ ................................................................................... 16-51 Figure 16.3.10: Component of the SEZ Development ............................................................................. 16-51 Figure 16.3.11: Land Use Plan of Mombasa SEZ (Alternative 1) ........................................................... 16-52
Project for Formulation of Comprehensive Development Master Plan in the Mombasa Gate City in the Republic of Kenya Final Report
xxi
Nippon Koei Co., Ltd. / PADECO Co., Ltd. / Eight-Japan Engineering Consultants Inc.
List of Abbreviations
ACA Athi Catchment Area AEO Authorized Economic Operator AFDB Africa Development Bank AFFA Agriculture, Fisheries & Food Authority. ASYCUDA Automated System for Customs Data BIDCO Business & Industrial Corporation BL Binary Logic BLT Build-Lease-and-Transfer BOO Build-Own-Operate BOOT Build-Own-Operate-Transfer BOT Build-Operate-Transfer BPS Budget Policy Statement BRICS Brazil, Russia, India, and China BRT Bus Rapid Transit BTO Build-Transfer-Operate BWSS Bulk Water Supply System CA Communication Authority CBFT Cubic Feet CBM Cross Border Market CBO Community Based Organization CCTV Closed Circuit Television CDF Constituency Development Fund CECM County Executive Committee Member CFS Container Freight Station CGM County Government of Mombasa CM Common Market CoK Constitution of Kenya COMESA Common Market for Eastern and Southern Africa CU Custom Union CWSB Coast Water Services Board CY Container Yard D/O Delivery Order DBFO Design Build Finance Operate DFR Draft Final Report DK Dongo Kundu DOT Develop-Operate-and-Transfer DoT&I Department of Transport and Infrastructure DoTDC Department of Tourism Development and Culture DOWE&NR Department of Water, Environment and Natural Resources DPC Data Processing Centre DRC Democratic Republic of Congo DRCM Disaster Recovery Centre Management DRIMS Dynamic Response Intelligence Monitoring System DTM Digital Terrain Model DWP Department of Water for Production DWRM Directorate of Water Resources Management EA Environment Auditor EAC East Africa Community EAR&H East African Railways and Harbors Corporation EARNP East Africa Road Network Project
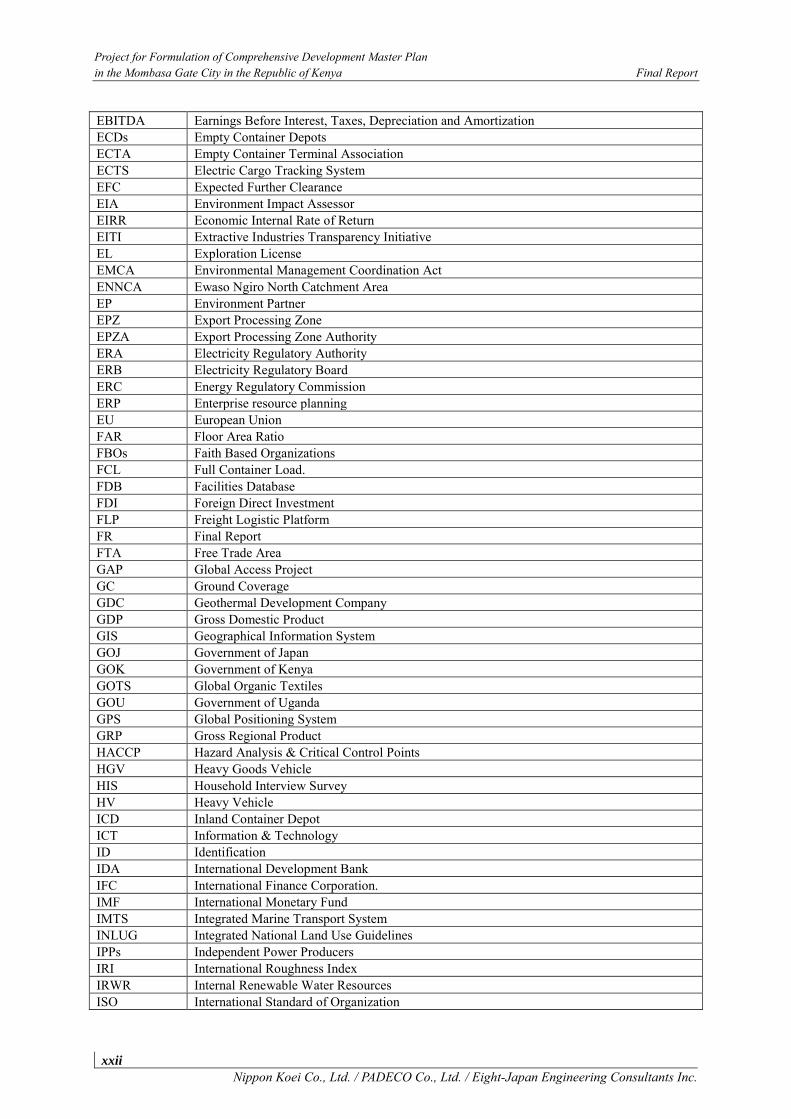
Project for Formulation of Comprehensive Development Master Plan in the Mombasa Gate City in the Republic of Kenya Final Report
xxii
Nippon Koei Co., Ltd. / PADECO Co., Ltd. / Eight-Japan Engineering Consultants Inc.
EBITDA Earnings Before Interest, Taxes, Depreciation and Amortization ECDs Empty Container Depots ECTA Empty Container Terminal Association ECTS Electric Cargo Tracking System EFC Expected Further Clearance EIA Environment Impact Assessor EIRR Economic Internal Rate of Return EITI Extractive Industries Transparency Initiative EL Exploration License EMCA Environmental Management Coordination Act ENNCA Ewaso Ngiro North Catchment Area EP Environment Partner EPZ Export Processing Zone EPZA Export Processing Zone Authority ERA Electricity Regulatory Authority ERB Electricity Regulatory Board ERC Energy Regulatory Commission ERP Enterprise resource planning EU European Union FAR Floor Area Ratio FBOs Faith Based Organizations FCL Full Container Load. FDB Facilities Database FDI Foreign Direct Investment FLP Freight Logistic Platform FR Final Report FTA Free Trade Area GAP Global Access Project GC Ground Coverage GDC Geothermal Development Company GDP Gross Domestic Product GIS Geographical Information System GOJ Government of Japan GOK Government of Kenya GOTS Global Organic Textiles GOU Government of Uganda GPS Global Positioning System GRP Gross Regional Product HACCP Hazard Analysis & Critical Control Points HGV Heavy Goods Vehicle HIS Household Interview Survey HV Heavy Vehicle ICD Inland Container Depot ICT Information & Technology ID Identification IDA International Development Bank IFC International Finance Corporation. IMF International Monetary Fund IMTS Integrated Marine Transport System INLUG Integrated National Land Use Guidelines IPPs Independent Power Producers IRI International Roughness Index IRWR Internal Renewable Water Resources ISO International Standard of Organization
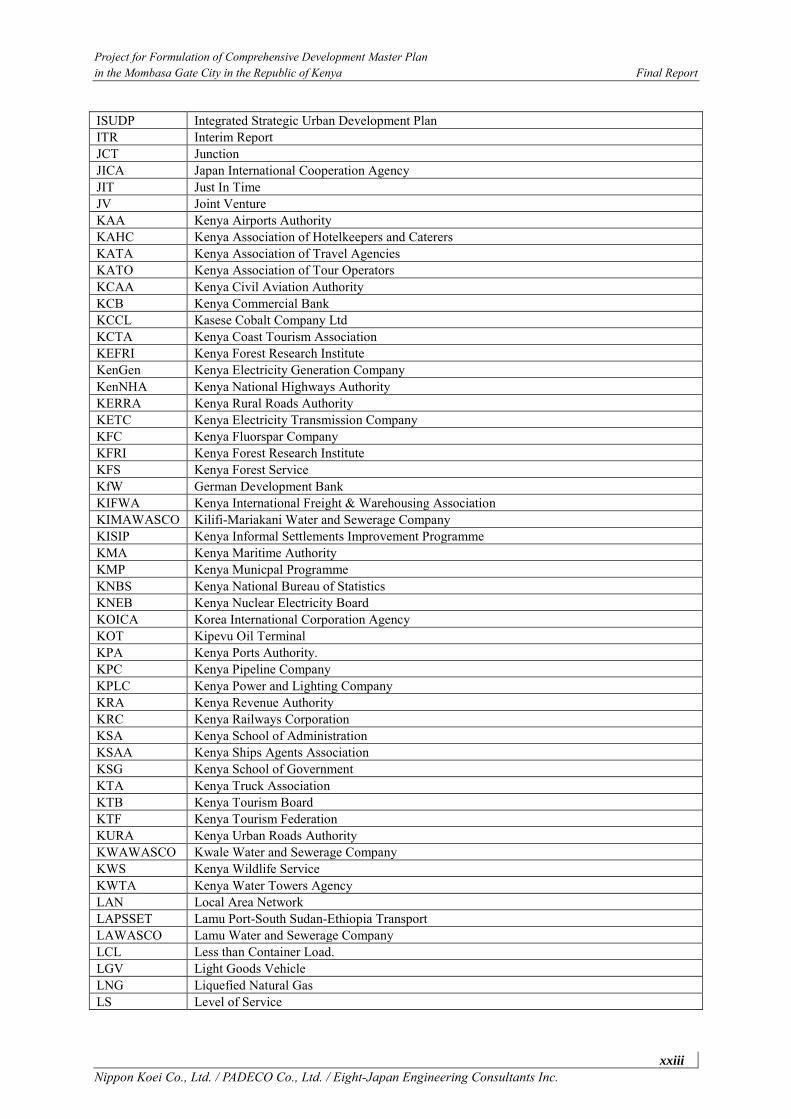
Project for Formulation of Comprehensive Development Master Plan in the Mombasa Gate City in the Republic of Kenya Final Report
xxiii
Nippon Koei Co., Ltd. / PADECO Co., Ltd. / Eight-Japan Engineering Consultants Inc.
ISUDP Integrated Strategic Urban Development Plan ITR Interim Report JCT Junction JICA Japan International Cooperation Agency JIT Just In Time JV Joint Venture KAA Kenya Airports Authority KAHC Kenya Association of Hotelkeepers and Caterers KATA Kenya Association of Travel Agencies KATO Kenya Association of Tour Operators KCAA Kenya Civil Aviation Authority KCB Kenya Commercial Bank KCCL Kasese Cobalt Company Ltd KCTA Kenya Coast Tourism Association KEFRI Kenya Forest Research Institute KenGen Kenya Electricity Generation Company KenNHA Kenya National Highways Authority KERRA Kenya Rural Roads Authority KETC Kenya Electricity Transmission Company KFC Kenya Fluorspar Company KFRI Kenya Forest Research Institute KFS Kenya Forest Service KfW German Development Bank KIFWA Kenya International Freight & Warehousing Association KIMAWASCO Kilifi-Mariakani Water and Sewerage Company KISIP Kenya Informal Settlements Improvement Programme KMA Kenya Maritime Authority KMP Kenya Municpal Programme KNBS Kenya National Bureau of Statistics KNEB Kenya Nuclear Electricity Board KOICA Korea International Corporation Agency KOT Kipevu Oil Terminal KPA Kenya Ports Authority. KPC Kenya Pipeline Company KPLC Kenya Power and Lighting Company KRA Kenya Revenue Authority KRC Kenya Railways Corporation KSA Kenya School of Administration KSAA Kenya Ships Agents Association KSG Kenya School of Government KTA Kenya Truck Association KTB Kenya Tourism Board KTF Kenya Tourism Federation KURA Kenya Urban Roads Authority KWAWASCO Kwale Water and Sewerage Company KWS Kenya Wildlife Service KWTA Kenya Water Towers Agency LAN Local Area Network LAPSSET Lamu Port-South Sudan-Ethiopia Transport LAWASCO Lamu Water and Sewerage Company LCL Less than Container Load. LGV Light Goods Vehicle LNG Liquefied Natural Gas LS Level of Service
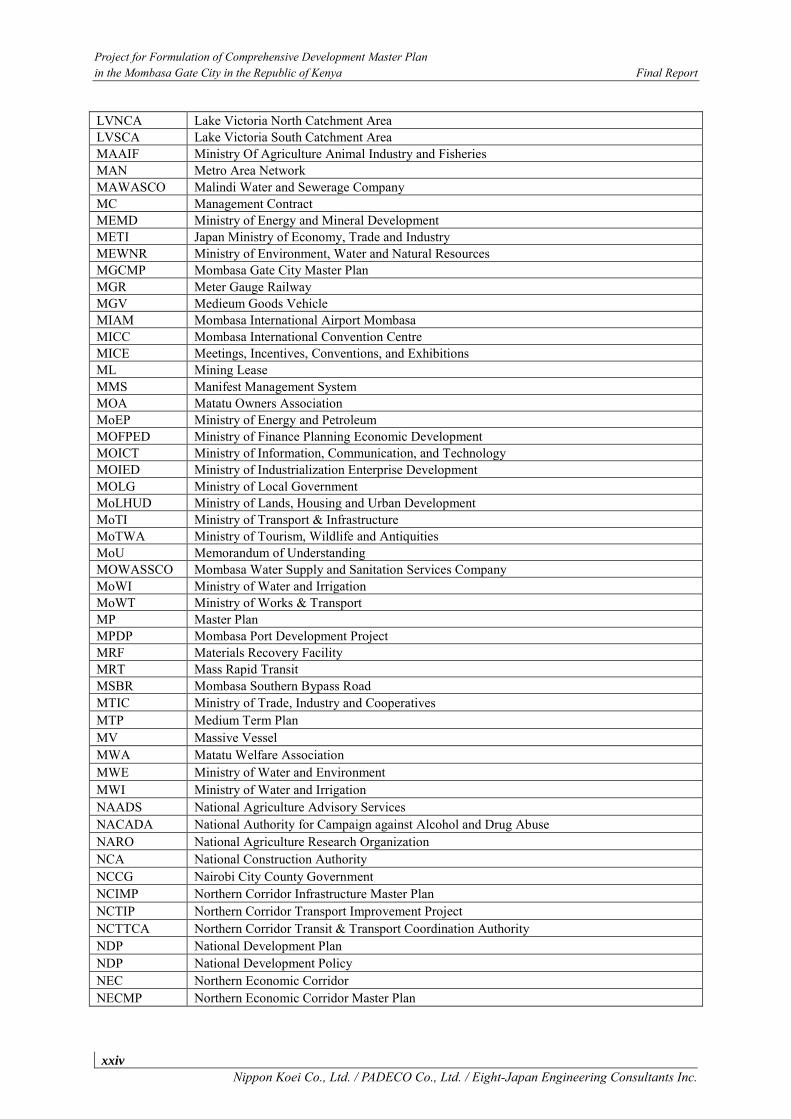
Project for Formulation of Comprehensive Development Master Plan in the Mombasa Gate City in the Republic of Kenya Final Report
xxiv
Nippon Koei Co., Ltd. / PADECO Co., Ltd. / Eight-Japan Engineering Consultants Inc.
LVNCA Lake Victoria North Catchment Area LVSCA Lake Victoria South Catchment Area MAAIF Ministry Of Agriculture Animal Industry and Fisheries MAN Metro Area Network MAWASCO Malindi Water and Sewerage Company MC Management Contract MEMD Ministry of Energy and Mineral Development METI Japan Ministry of Economy, Trade and Industry MEWNR Ministry of Environment, Water and Natural Resources MGCMP Mombasa Gate City Master Plan MGR Meter Gauge Railway MGV Medieum Goods Vehicle MIAM Mombasa International Airport Mombasa MICC Mombasa International Convention Centre MICE Meetings, Incentives, Conventions, and Exhibitions ML Mining Lease MMS Manifest Management System MOA Matatu Owners Association MoEP Ministry of Energy and Petroleum MOFPED Ministry of Finance Planning Economic Development MOICT Ministry of Information, Communication, and Technology MOIED Ministry of Industrialization Enterprise Development MOLG Ministry of Local Government MoLHUD Ministry of Lands, Housing and Urban Development MoTI Ministry of Transport & Infrastructure MoTWA Ministry of Tourism, Wildlife and Antiquities MoU Memorandum of Understanding MOWASSCO Mombasa Water Supply and Sanitation Services Company MoWI Ministry of Water and Irrigation MoWT Ministry of Works & Transport MP Master Plan MPDP Mombasa Port Development Project MRF Materials Recovery Facility MRT Mass Rapid Transit MSBR Mombasa Southern Bypass Road MTIC Ministry of Trade, Industry and Cooperatives MTP Medium Term Plan MV Massive Vessel MWA Matatu Welfare Association MWE Ministry of Water and Environment MWI Ministry of Water and Irrigation NAADS National Agriculture Advisory Services NACADA National Authority for Campaign against Alcohol and Drug Abuse NARO National Agriculture Research Organization NCA National Construction Authority NCCG Nairobi City County Government NCIMP Northern Corridor Infrastructure Master Plan NCTIP Northern Corridor Transport Improvement Project NCTTCA Northern Corridor Transit & Transport Coordination Authority NDP National Development Plan NDP National Development Policy NEC Northern Economic Corridor NECMP Northern Economic Corridor Master Plan
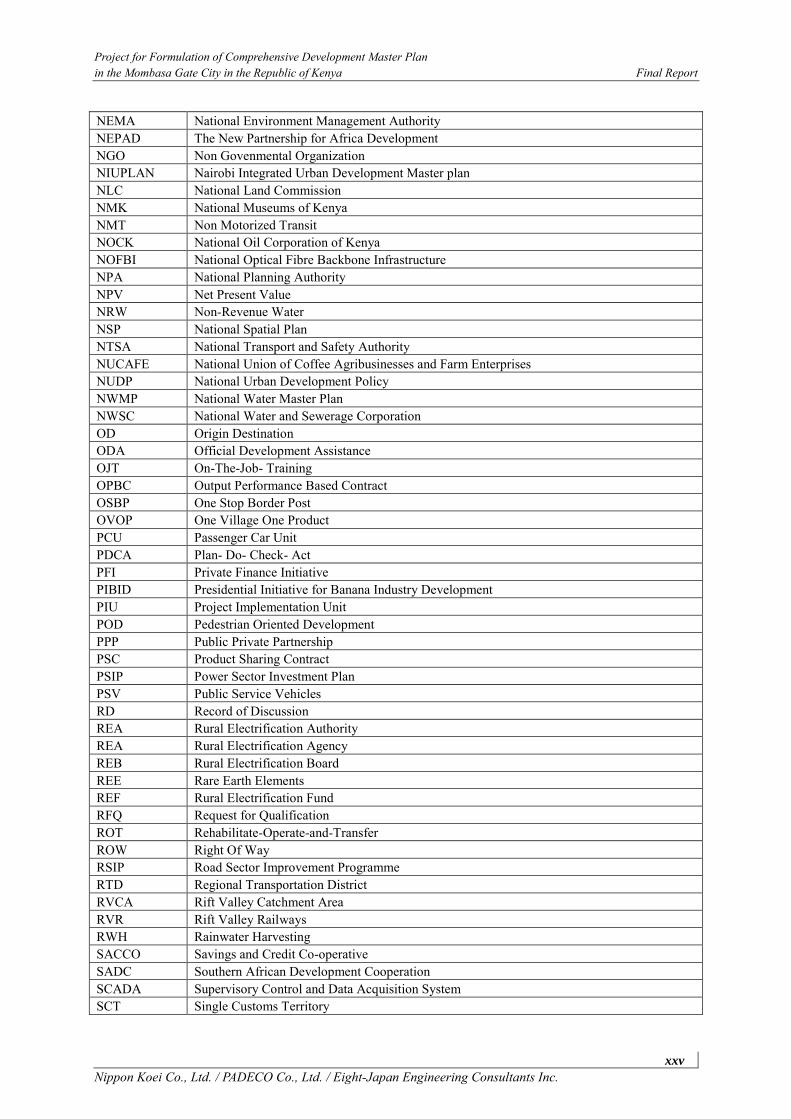
Project for Formulation of Comprehensive Development Master Plan in the Mombasa Gate City in the Republic of Kenya Final Report
xxv
Nippon Koei Co., Ltd. / PADECO Co., Ltd. / Eight-Japan Engineering Consultants Inc.
NEMA National Environment Management Authority NEPAD The New Partnership for Africa Development NGO Non Govenmental Organization NIUPLAN Nairobi Integrated Urban Development Master plan NLC National Land Commission NMK National Museums of Kenya NMT Non Motorized Transit NOCK National Oil Corporation of Kenya NOFBI National Optical Fibre Backbone Infrastructure NPA National Planning Authority NPV Net Present Value NRW Non-Revenue Water NSP National Spatial Plan NTSA National Transport and Safety Authority NUCAFE National Union of Coffee Agribusinesses and Farm Enterprises NUDP National Urban Development Policy NWMP National Water Master Plan NWSC National Water and Sewerage Corporation OD Origin Destination ODA Official Development Assistance OJT On-The-Job- Training OPBC Output Performance Based Contract OSBP One Stop Border Post OVOP One Village One Product PCU Passenger Car Unit PDCA Plan- Do- Check- Act PFI Private Finance Initiative PIBID Presidential Initiative for Banana Industry Development PIU Project Implementation Unit POD Pedestrian Oriented Development PPP Public Private Partnership PSC Product Sharing Contract PSIP Power Sector Investment Plan PSV Public Service Vehicles RD Record of Discussion REA Rural Electrification Authority REA Rural Electrification Agency REB Rural Electrification Board REE Rare Earth Elements REF Rural Electrification Fund RFQ Request for Qualification ROT Rehabilitate-Operate-and-Transfer ROW Right Of Way RSIP Road Sector Improvement Programme RTD Regional Transportation District RVCA Rift Valley Catchment Area RVR Rift Valley Railways RWH Rainwater Harvesting SACCO Savings and Credit Co-operative SADC Southern African Development Cooperation SCADA Supervisory Control and Data Acquisition System SCT Single Customs Territory
Project for Formulation of Comprehensive Development Master Plan in the Mombasa Gate City in the Republic of Kenya Final Report
xxvi
Nippon Koei Co., Ltd. / PADECO Co., Ltd. / Eight-Japan Engineering Consultants Inc.
SEA Strategic Environmental Assessment SEZs Special Economic Zones SGR Standard Gauge Railway SME’s Small Medium Enterprises SOT Shimanzi Oil Terminal SPC Special Purpose Company SPV Special Purpose Vehicle SW South West SWM Solid Waste Management SWOT Strength Weakness Opportunity and Threats TA Transaction Advisor TAWASCO Tana Water and Sewerage Company TBD To Be Determined TCA Tana Catchment Area TF Tourism Fund TFC Tourism Finance Corporation TFTA Tripartite Free Trade Area TMP Transport Master Plan TMWDP Thwake Multi-purpose Water Development Program TNA Training Needs Assessment TOD Transit Oriented Development TOR Terms of Reference TRA Tourism Regulatory Authority TRS Time Released Survey TSA Tourism Satellite Account TV Television TSC Teachers Service Commission TVS Traffic Volume Survey TWG Technical Working Group UAE United Arab Emirates UBOS Uganda Bureau of Statistics UCBWSS Unconnected to Bulk Water Supply System UDC University of the District of Columbia UEDCL Uganda Electricity Distributing Company Ltd UEGCL Uganda Electricity Generating Company Ltd UETCL Uganda Electricity Transmission Company Ltd UfW Unaccounted for Water UIA Uganda Investment Authority UMA Uganda Manufactures Association UNBS Uganda National Bureau of Standards UNESCO United Nations Educational, Scientific and Cultural Organization UNRA Uganda National Roads Authority UNWTO United Nations World Tourism Organization URA Uganda Revenue Authority URC Uganda Railways Corporation VAT Value Added Tax VCS Value Chain Survey VEI Vitens Evides International VOK Voice of Kenya WAN Wide Area Network WASREB Water Services Regulatory Board WaSSIP Water and Sanitation Service Improvement Project
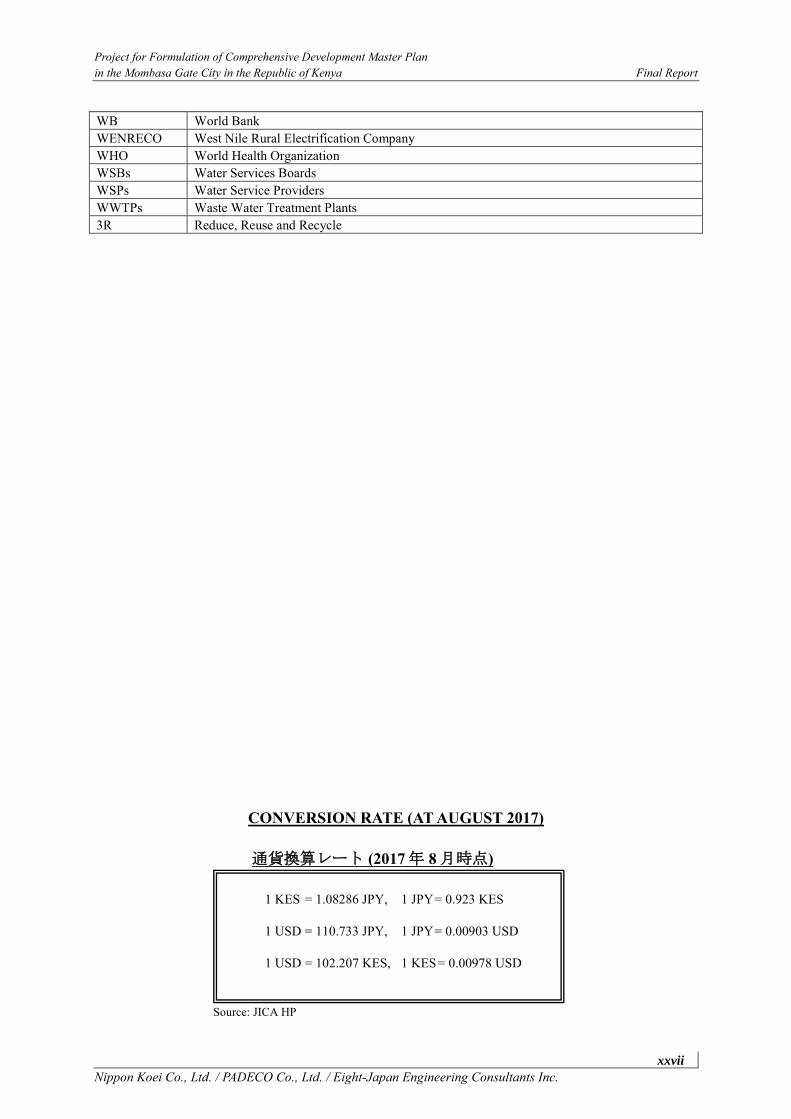
Project for Formulation of Comprehensive Development Master Plan in the Mombasa Gate City in the Republic of Kenya Final Report
xxvii
Nippon Koei Co., Ltd. / PADECO Co., Ltd. / Eight-Japan Engineering Consultants Inc.
WB World Bank WENRECO West Nile Rural Electrification Company WHO World Health Organization WSBs Water Services Boards WSPs Water Service Providers WWTPs Waste Water Treatment Plants 3R Reduce, Reuse and Recycle
CONVERSION RATE (AT AUGUST 2017)
通貨換算レート (2017年 8月時点)
Source: JICA HP
1 KES = 1.08286 JPY, 1 JPY = 0.923 KES
1 USD = 110.733 JPY, 1 JPY = 0.00903 USD 1 USD = 102.207 KES, 1 KES = 0.00978 USD

Part I: Situational Analysis

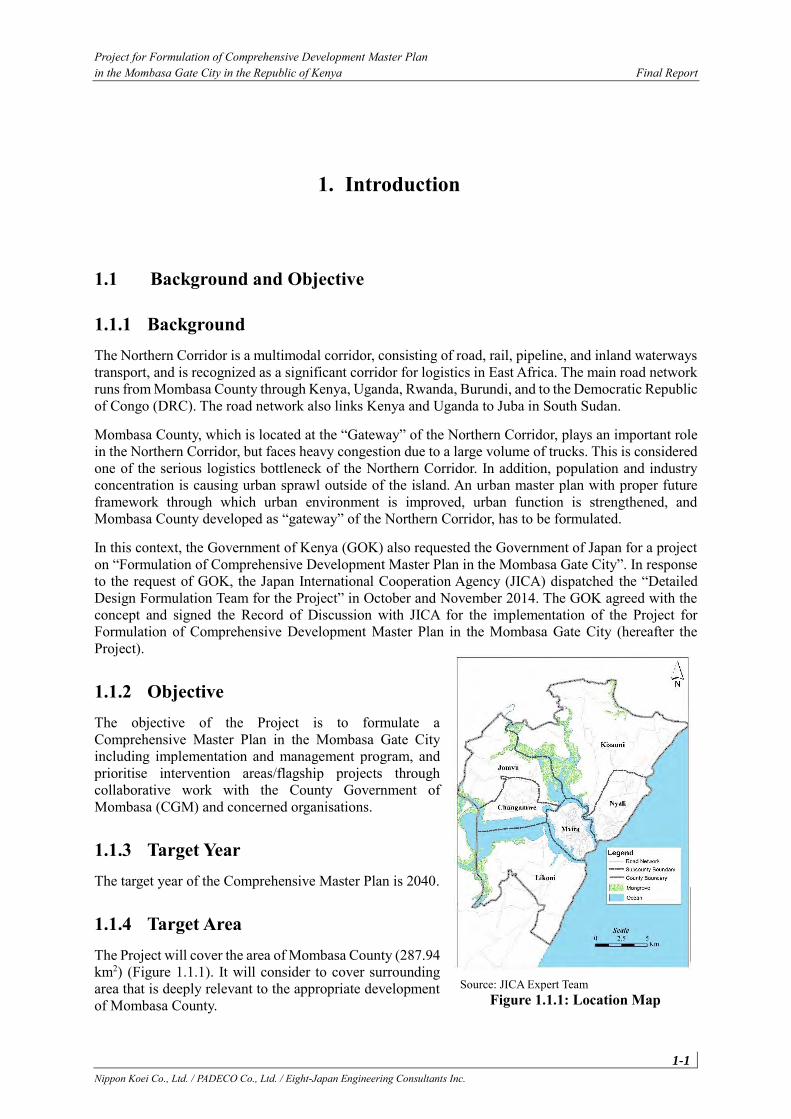
Project for Formulation of Comprehensive Development Master Plan in the Mombasa Gate City in the Republic of Kenya Final Report
1-1 Nippon Koei Co., Ltd. / PADECO Co., Ltd. / Eight-Japan Engineering Consultants Inc.
1. Introduction
1.1 Background and Objective
1.1.1 Background The Northern Corridor is a multimodal corridor, consisting of road, rail, pipeline, and inland waterways transport, and is recognized as a significant corridor for logistics in East Africa. The main road network runs from Mombasa County through Kenya, Uganda, Rwanda, Burundi, and to the Democratic Republic of Congo (DRC). The road network also links Kenya and Uganda to Juba in South Sudan.
Mombasa County, which is located at the “Gateway” of the Northern Corridor, plays an important role in the Northern Corridor, but faces heavy congestion due to a large volume of trucks. This is considered one of the serious logistics bottleneck of the Northern Corridor. In addition, population and industry concentration is causing urban sprawl outside of the island. An urban master plan with proper future framework through which urban environment is improved, urban function is strengthened, and Mombasa County developed as “gateway” of the Northern Corridor, has to be formulated.
In this context, the Government of Kenya (GOK) also requested the Government of Japan for a project on “Formulation of Comprehensive Development Master Plan in the Mombasa Gate City”. In response to the request of GOK, the Japan International Cooperation Agency (JICA) dispatched the “Detailed Design Formulation Team for the Project” in October and November 2014. The GOK agreed with the concept and signed the Record of Discussion with JICA for the implementation of the Project for Formulation of Comprehensive Development Master Plan in the Mombasa Gate City (hereafter the Project).
1.1.2 Objective The objective of the Project is to formulate a Comprehensive Master Plan in the Mombasa Gate City including implementation and management program, and prioritise intervention areas/flagship projects through collaborative work with the County Government of Mombasa (CGM) and concerned organisations.
1.1.3 Target Year The target year of the Comprehensive Master Plan is 2040.
1.1.4 Target Area The Project will cover the area of Mombasa County (287.94 km2) (Figure 1.1.1). It will consider to cover surrounding area that is deeply relevant to the appropriate development of Mombasa County.
Source: JICA Expert Team Figure 1.1.1: Location Map
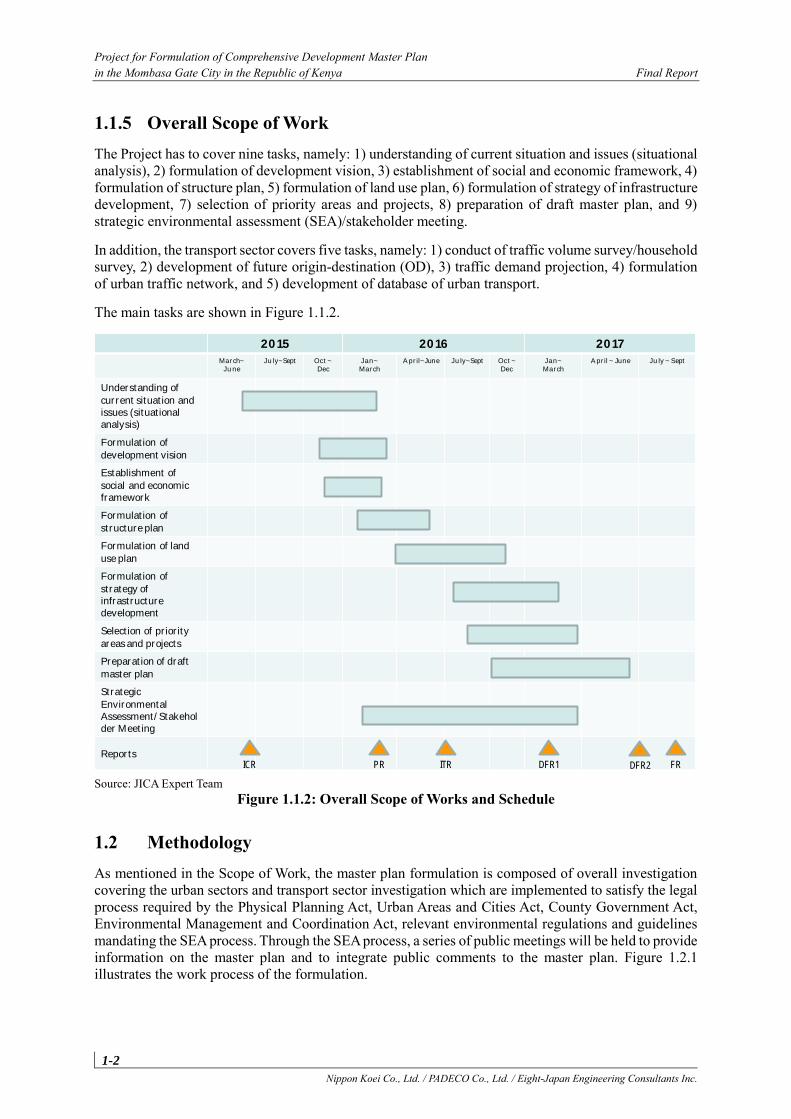
Project for Formulation of Comprehensive Development Master Plan in the Mombasa Gate City in the Republic of Kenya Final Report
1-2 Nippon Koei Co., Ltd. / PADECO Co., Ltd. / Eight-Japan Engineering Consultants Inc.
1.1.5 Overall Scope of Work The Project has to cover nine tasks, namely: 1) understanding of current situation and issues (situational analysis), 2) formulation of development vision, 3) establishment of social and economic framework, 4) formulation of structure plan, 5) formulation of land use plan, 6) formulation of strategy of infrastructure development, 7) selection of priority areas and projects, 8) preparation of draft master plan, and 9) strategic environmental assessment (SEA)/stakeholder meeting.
In addition, the transport sector covers five tasks, namely: 1) conduct of traffic volume survey/household survey, 2) development of future origin-destination (OD), 3) traffic demand projection, 4) formulation of urban traffic network, and 5) development of database of urban transport.
The main tasks are shown in Figure 1.1.2.
Source: JICA Expert Team
Figure 1.1.2: Overall Scope of Works and Schedule
1.2 Methodology As mentioned in the Scope of Work, the master plan formulation is composed of overall investigation covering the urban sectors and transport sector investigation which are implemented to satisfy the legal process required by the Physical Planning Act, Urban Areas and Cities Act, County Government Act, Environmental Management and Coordination Act, relevant environmental regulations and guidelines mandating the SEA process. Through the SEA process, a series of public meetings will be held to provide information on the master plan and to integrate public comments to the master plan. Figure 1.2.1 illustrates the work process of the formulation.
2015 2016 2017
Ma rch~Ju ne
Ju ly~Sept Oct ~ Dec
Ja n~Ma rch
A pril~June Ju ly~Sept Oct ~ Dec
Ja n~Ma rch
A pril ~ June Ju ly ~ Sept
Understanding of
current situation and issues (situational analysis)
Formulation of
development vision
Establishment of
social and economic framework
Formulation of
structure plan
Formulation of land
use plan
Formulation of
strategy of infrastructure development
Selection of priority
areas and projects
Preparation of draft
master plan
Strategic
Environmental Assessment/Stakeholder Meeting
ReportsICR PR ITR DFR1 FRDFR2
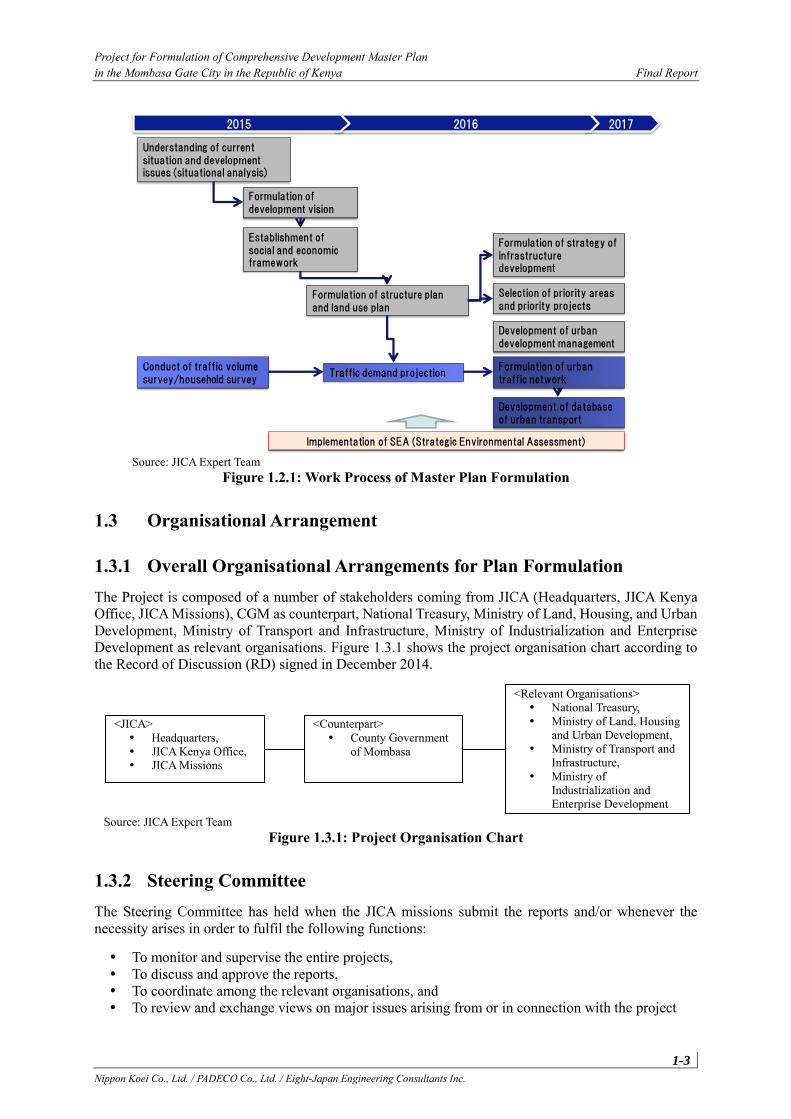
Project for Formulation of Comprehensive Development Master Plan in the Mombasa Gate City in the Republic of Kenya Final Report
1-3 Nippon Koei Co., Ltd. / PADECO Co., Ltd. / Eight-Japan Engineering Consultants Inc.
Source: JICA Expert Team
Figure 1.2.1: Work Process of Master Plan Formulation
1.3 Organisational Arrangement
1.3.1 Overall Organisational Arrangements for Plan Formulation The Project is composed of a number of stakeholders coming from JICA (Headquarters, JICA Kenya Office, JICA Missions), CGM as counterpart, National Treasury, Ministry of Land, Housing, and Urban Development, Ministry of Transport and Infrastructure, Ministry of Industrialization and Enterprise Development as relevant organisations. Figure 1.3.1 shows the project organisation chart according to the Record of Discussion (RD) signed in December 2014.
Source: JICA Expert Team
Figure 1.3.1: Project Organisation Chart
1.3.2 Steering Committee The Steering Committee has held when the JICA missions submit the reports and/or whenever the necessity arises in order to fulfil the following functions:
To monitor and supervise the entire projects, To discuss and approve the reports, To coordinate among the relevant organisations, and To review and exchange views on major issues arising from or in connection with the project
Understanding of current situation and development issues (situational analysis)
Formulation of development vision
Establishment of social and economic framework
Implementation of SEA (Strategic Environmental Assessment)
Formulation of structure plan and land use plan
Formulation of strategy of infrastructure development
Selection of priority areas and priority projects
Development of urban development management
Conduct of traffic volume survey/household survey
Traffic demand projectionFormulation of urban traffic network
Development of database of urban transport
201720162015
<JICA> Headquarters, JICA Kenya Office, JICA Missions
<Counterpart> County Government
of Mombasa
<Relevant Organisations> National Treasury, Ministry of Land, Housing
and Urban Development, Ministry of Transport and
Infrastructure, Ministry of
Industrialization and Enterprise Development
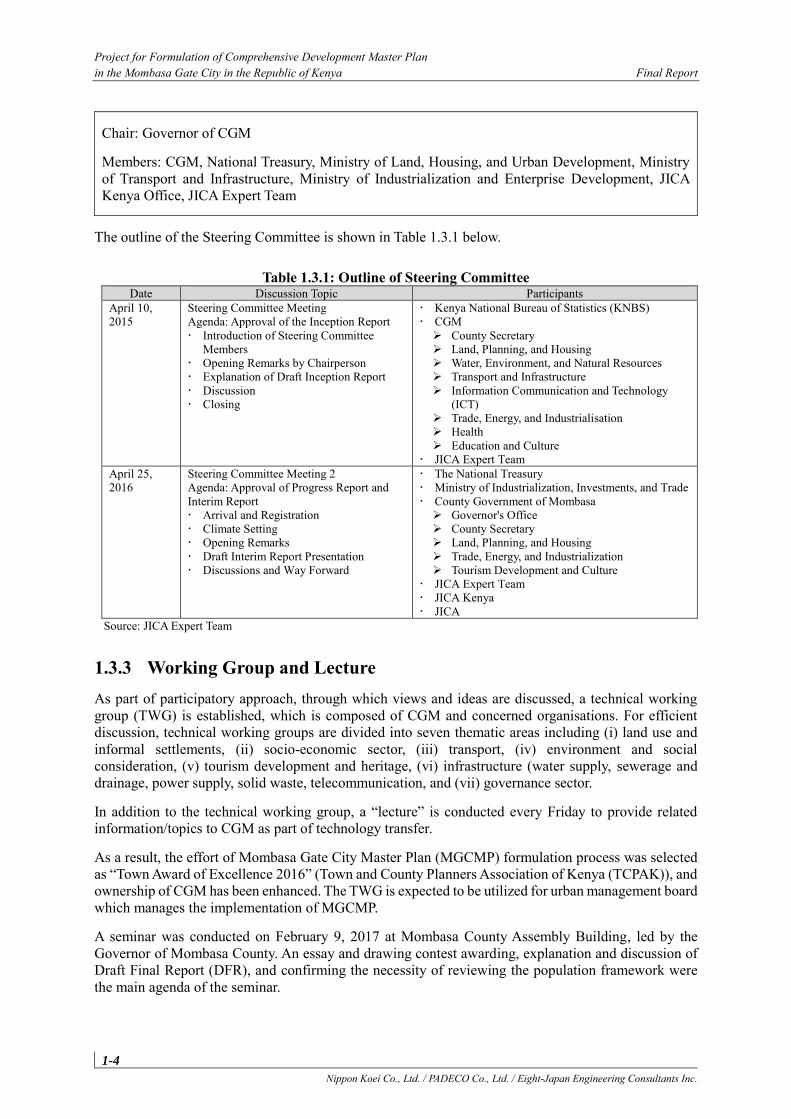
Project for Formulation of Comprehensive Development Master Plan in the Mombasa Gate City in the Republic of Kenya Final Report
1-4 Nippon Koei Co., Ltd. / PADECO Co., Ltd. / Eight-Japan Engineering Consultants Inc.
Chair: Governor of CGM
Members: CGM, National Treasury, Ministry of Land, Housing, and Urban Development, Ministry of Transport and Infrastructure, Ministry of Industrialization and Enterprise Development, JICA Kenya Office, JICA Expert Team
The outline of the Steering Committee is shown in Table 1.3.1 below.
Table 1.3.1: Outline of Steering Committee Date Discussion Topic Participants
April 10, 2015
Steering Committee Meeting Agenda: Approval of the Inception Report Introduction of Steering Committee
Members Opening Remarks by Chairperson Explanation of Draft Inception Report Discussion Closing
Kenya National Bureau of Statistics (KNBS) CGM
➢ County Secretary ➢ Land, Planning, and Housing ➢ Water, Environment, and Natural Resources ➢ Transport and Infrastructure ➢ Information Communication and Technology
(ICT) ➢ Trade, Energy, and Industrialisation ➢ Health ➢ Education and Culture
JICA Expert Team April 25, 2016
Steering Committee Meeting 2 Agenda: Approval of Progress Report and Interim Report Arrival and Registration Climate Setting Opening Remarks Draft Interim Report Presentation Discussions and Way Forward
The National Treasury Ministry of Industrialization, Investments, and Trade County Government of Mombasa
➢ Governor's Office ➢ County Secretary ➢ Land, Planning, and Housing ➢ Trade, Energy, and Industrialization ➢ Tourism Development and Culture
JICA Expert Team JICA Kenya JICA
Source: JICA Expert Team
1.3.3 Working Group and Lecture As part of participatory approach, through which views and ideas are discussed, a technical working group (TWG) is established, which is composed of CGM and concerned organisations. For efficient discussion, technical working groups are divided into seven thematic areas including (i) land use and informal settlements, (ii) socio-economic sector, (iii) transport, (iv) environment and social consideration, (v) tourism development and heritage, (vi) infrastructure (water supply, sewerage and drainage, power supply, solid waste, telecommunication, and (vii) governance sector.
In addition to the technical working group, a “lecture” is conducted every Friday to provide related information/topics to CGM as part of technology transfer.
As a result, the effort of Mombasa Gate City Master Plan (MGCMP) formulation process was selected as “Town Award of Excellence 2016” (Town and County Planners Association of Kenya (TCPAK)), and ownership of CGM has been enhanced. The TWG is expected to be utilized for urban management board which manages the implementation of MGCMP.
A seminar was conducted on February 9, 2017 at Mombasa County Assembly Building, led by the Governor of Mombasa County. An essay and drawing contest awarding, explanation and discussion of Draft Final Report (DFR), and confirming the necessity of reviewing the population framework were the main agenda of the seminar.
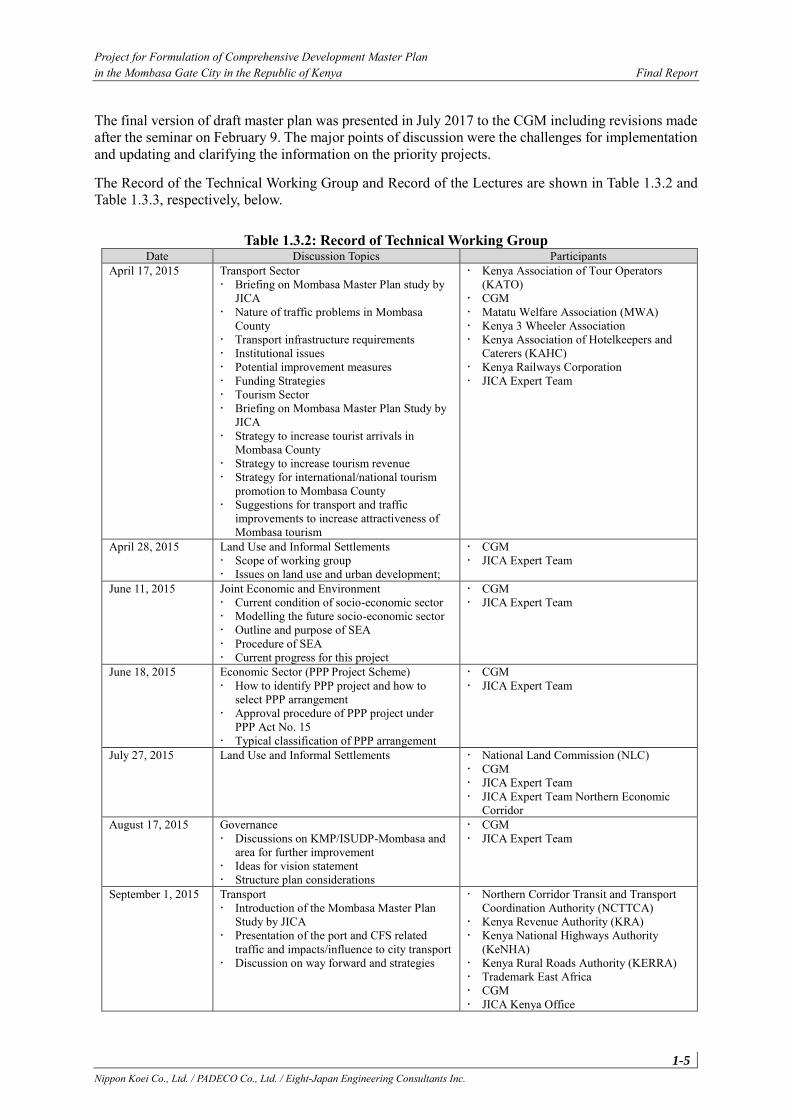
Project for Formulation of Comprehensive Development Master Plan in the Mombasa Gate City in the Republic of Kenya Final Report
1-5 Nippon Koei Co., Ltd. / PADECO Co., Ltd. / Eight-Japan Engineering Consultants Inc.
The final version of draft master plan was presented in July 2017 to the CGM including revisions made after the seminar on February 9. The major points of discussion were the challenges for implementation and updating and clarifying the information on the priority projects.
The Record of the Technical Working Group and Record of the Lectures are shown in Table 1.3.2 and Table 1.3.3, respectively, below.
Table 1.3.2: Record of Technical Working Group Date Discussion Topics Participants
April 17, 2015 Transport Sector Briefing on Mombasa Master Plan study by
JICA Nature of traffic problems in Mombasa
County Transport infrastructure requirements Institutional issues Potential improvement measures Funding Strategies Tourism Sector Briefing on Mombasa Master Plan Study by
JICA Strategy to increase tourist arrivals in
Mombasa County Strategy to increase tourism revenue Strategy for international/national tourism
promotion to Mombasa County Suggestions for transport and traffic
improvements to increase attractiveness of Mombasa tourism
Kenya Association of Tour Operators (KATO)
CGM Matatu Welfare Association (MWA) Kenya 3 Wheeler Association Kenya Association of Hotelkeepers and
Caterers (KAHC) Kenya Railways Corporation JICA Expert Team
April 28, 2015 Land Use and Informal Settlements Scope of working group Issues on land use and urban development;
CGM JICA Expert Team
June 11, 2015 Joint Economic and Environment Current condition of socio-economic sector Modelling the future socio-economic sector Outline and purpose of SEA Procedure of SEA Current progress for this project
CGM JICA Expert Team
June 18, 2015 Economic Sector (PPP Project Scheme) How to identify PPP project and how to
select PPP arrangement Approval procedure of PPP project under
PPP Act No. 15 Typical classification of PPP arrangement
CGM JICA Expert Team
July 27, 2015 Land Use and Informal Settlements National Land Commission (NLC) CGM JICA Expert Team JICA Expert Team Northern Economic
Corridor August 17, 2015 Governance
Discussions on KMP/ISUDP-Mombasa and area for further improvement
Ideas for vision statement Structure plan considerations
CGM JICA Expert Team
September 1, 2015 Transport Introduction of the Mombasa Master Plan
Study by JICA Presentation of the port and CFS related
traffic and impacts/influence to city transport Discussion on way forward and strategies
Northern Corridor Transit and Transport Coordination Authority (NCTTCA)
Kenya Revenue Authority (KRA) Kenya National Highways Authority
(KeNHA) Kenya Rural Roads Authority (KERRA) Trademark East Africa CGM JICA Kenya Office
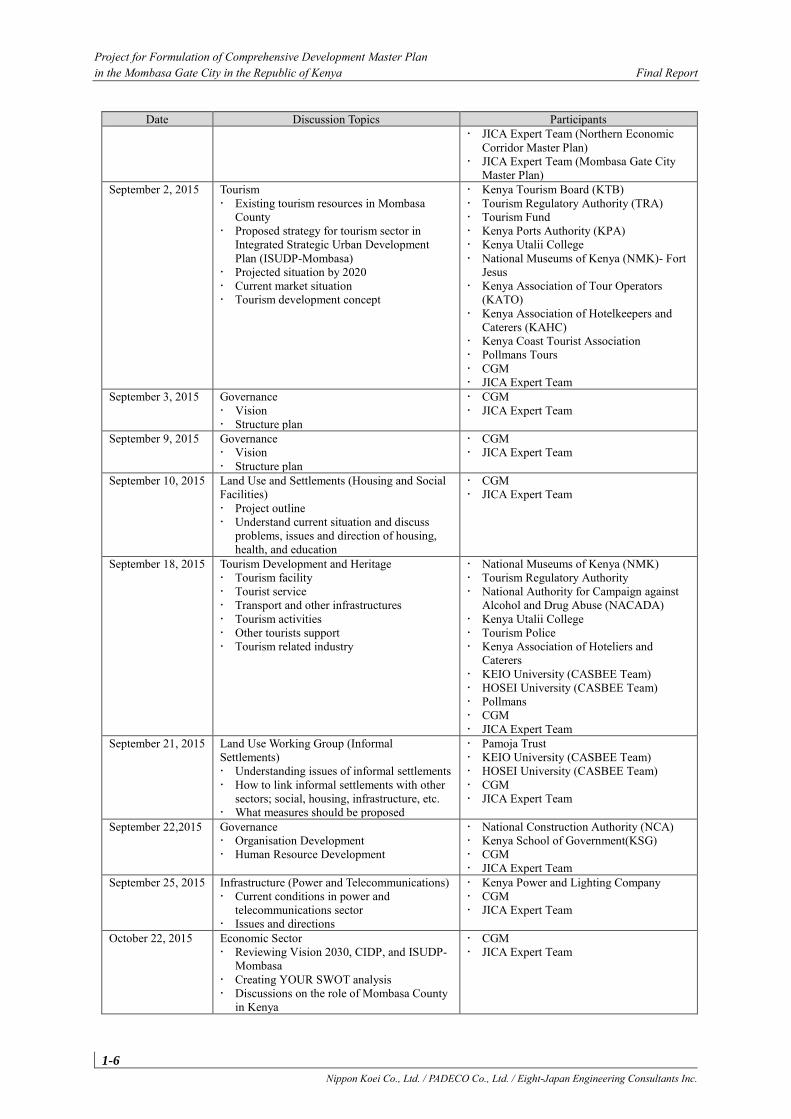
Project for Formulation of Comprehensive Development Master Plan in the Mombasa Gate City in the Republic of Kenya Final Report
1-6 Nippon Koei Co., Ltd. / PADECO Co., Ltd. / Eight-Japan Engineering Consultants Inc.
Date Discussion Topics Participants JICA Expert Team (Northern Economic
Corridor Master Plan) JICA Expert Team (Mombasa Gate City
Master Plan) September 2, 2015 Tourism
Existing tourism resources in Mombasa County
Proposed strategy for tourism sector in Integrated Strategic Urban Development Plan (ISUDP-Mombasa)
Projected situation by 2020 Current market situation Tourism development concept
Kenya Tourism Board (KTB) Tourism Regulatory Authority (TRA) Tourism Fund Kenya Ports Authority (KPA) Kenya Utalii College National Museums of Kenya (NMK)- Fort
Jesus Kenya Association of Tour Operators
(KATO) Kenya Association of Hotelkeepers and
Caterers (KAHC) Kenya Coast Tourist Association Pollmans Tours CGM JICA Expert Team
September 3, 2015 Governance Vision Structure plan
CGM JICA Expert Team
September 9, 2015 Governance Vision Structure plan
CGM JICA Expert Team
September 10, 2015 Land Use and Settlements (Housing and Social Facilities) Project outline Understand current situation and discuss
problems, issues and direction of housing, health, and education
CGM JICA Expert Team
September 18, 2015 Tourism Development and Heritage Tourism facility Tourist service Transport and other infrastructures Tourism activities Other tourists support Tourism related industry
National Museums of Kenya (NMK) Tourism Regulatory Authority National Authority for Campaign against
Alcohol and Drug Abuse (NACADA) Kenya Utalii College Tourism Police Kenya Association of Hoteliers and
Caterers KEIO University (CASBEE Team) HOSEI University (CASBEE Team) Pollmans CGM JICA Expert Team
September 21, 2015 Land Use Working Group (Informal Settlements) Understanding issues of informal settlements How to link informal settlements with other
sectors; social, housing, infrastructure, etc. What measures should be proposed
Pamoja Trust KEIO University (CASBEE Team) HOSEI University (CASBEE Team) CGM JICA Expert Team
September 22,2015 Governance Organisation Development Human Resource Development
National Construction Authority (NCA) Kenya School of Government(KSG) CGM JICA Expert Team
September 25, 2015 Infrastructure (Power and Telecommunications) Current conditions in power and
telecommunications sector Issues and directions
Kenya Power and Lighting Company CGM JICA Expert Team
October 22, 2015 Economic Sector Reviewing Vision 2030, CIDP, and ISUDP-
Mombasa Creating YOUR SWOT analysis Discussions on the role of Mombasa County
in Kenya
CGM JICA Expert Team
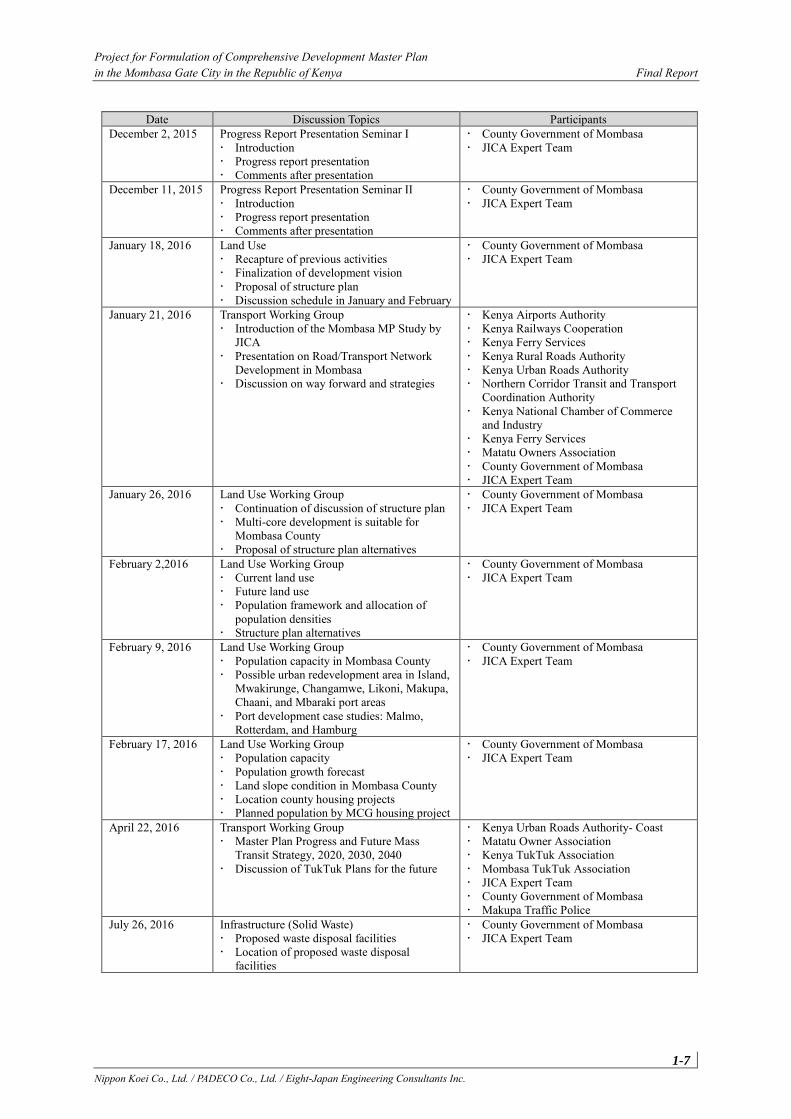
Project for Formulation of Comprehensive Development Master Plan in the Mombasa Gate City in the Republic of Kenya Final Report
1-7 Nippon Koei Co., Ltd. / PADECO Co., Ltd. / Eight-Japan Engineering Consultants Inc.
Date Discussion Topics Participants December 2, 2015 Progress Report Presentation Seminar I
Introduction Progress report presentation Comments after presentation
County Government of Mombasa JICA Expert Team
December 11, 2015 Progress Report Presentation Seminar II Introduction Progress report presentation Comments after presentation
County Government of Mombasa JICA Expert Team
January 18, 2016 Land Use Recapture of previous activities Finalization of development vision Proposal of structure plan Discussion schedule in January and February
County Government of Mombasa JICA Expert Team
January 21, 2016 Transport Working Group Introduction of the Mombasa MP Study by
JICA Presentation on Road/Transport Network
Development in Mombasa Discussion on way forward and strategies
Kenya Airports Authority Kenya Railways Cooperation Kenya Ferry Services Kenya Rural Roads Authority Kenya Urban Roads Authority Northern Corridor Transit and Transport
Coordination Authority Kenya National Chamber of Commerce
and Industry Kenya Ferry Services Matatu Owners Association County Government of Mombasa JICA Expert Team
January 26, 2016 Land Use Working Group Continuation of discussion of structure plan Multi-core development is suitable for
Mombasa County Proposal of structure plan alternatives
County Government of Mombasa JICA Expert Team
February 2,2016 Land Use Working Group Current land use Future land use Population framework and allocation of
population densities Structure plan alternatives
County Government of Mombasa JICA Expert Team
February 9, 2016 Land Use Working Group Population capacity in Mombasa County Possible urban redevelopment area in Island,
Mwakirunge, Changamwe, Likoni, Makupa, Chaani, and Mbaraki port areas
Port development case studies: Malmo, Rotterdam, and Hamburg
County Government of Mombasa JICA Expert Team
February 17, 2016 Land Use Working Group Population capacity Population growth forecast Land slope condition in Mombasa County Location county housing projects Planned population by MCG housing project
County Government of Mombasa JICA Expert Team
April 22, 2016 Transport Working Group Master Plan Progress and Future Mass
Transit Strategy, 2020, 2030, 2040 Discussion of TukTuk Plans for the future
Kenya Urban Roads Authority- Coast Matatu Owner Association Kenya TukTuk Association Mombasa TukTuk Association JICA Expert Team County Government of Mombasa Makupa Traffic Police
July 26, 2016 Infrastructure (Solid Waste) Proposed waste disposal facilities Location of proposed waste disposal
facilities
County Government of Mombasa JICA Expert Team
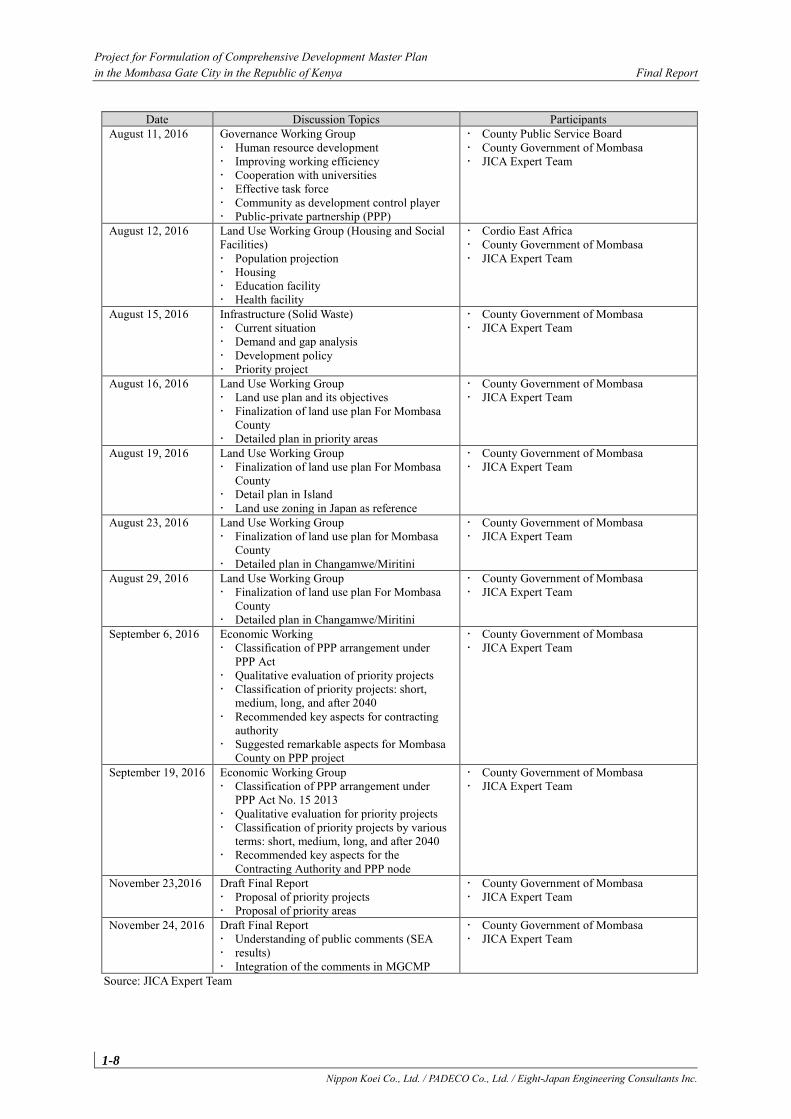
Project for Formulation of Comprehensive Development Master Plan in the Mombasa Gate City in the Republic of Kenya Final Report
1-8 Nippon Koei Co., Ltd. / PADECO Co., Ltd. / Eight-Japan Engineering Consultants Inc.
Date Discussion Topics Participants August 11, 2016 Governance Working Group
Human resource development Improving working efficiency Cooperation with universities Effective task force Community as development control player Public-private partnership (PPP)
County Public Service Board County Government of Mombasa JICA Expert Team
August 12, 2016 Land Use Working Group (Housing and Social Facilities) Population projection Housing Education facility Health facility
Cordio East Africa County Government of Mombasa JICA Expert Team
August 15, 2016 Infrastructure (Solid Waste) Current situation Demand and gap analysis Development policy Priority project
County Government of Mombasa JICA Expert Team
August 16, 2016 Land Use Working Group Land use plan and its objectives Finalization of land use plan For Mombasa
County Detailed plan in priority areas
County Government of Mombasa JICA Expert Team
August 19, 2016 Land Use Working Group Finalization of land use plan For Mombasa
County Detail plan in Island Land use zoning in Japan as reference
County Government of Mombasa JICA Expert Team
August 23, 2016 Land Use Working Group Finalization of land use plan for Mombasa
County Detailed plan in Changamwe/Miritini
County Government of Mombasa JICA Expert Team
August 29, 2016 Land Use Working Group Finalization of land use plan For Mombasa
County Detailed plan in Changamwe/Miritini
County Government of Mombasa JICA Expert Team
September 6, 2016 Economic Working Classification of PPP arrangement under
PPP Act Qualitative evaluation of priority projects Classification of priority projects: short,
medium, long, and after 2040 Recommended key aspects for contracting
authority Suggested remarkable aspects for Mombasa
County on PPP project
County Government of Mombasa JICA Expert Team
September 19, 2016 Economic Working Group Classification of PPP arrangement under
PPP Act No. 15 2013 Qualitative evaluation for priority projects Classification of priority projects by various
terms: short, medium, long, and after 2040 Recommended key aspects for the
Contracting Authority and PPP node
County Government of Mombasa JICA Expert Team
November 23,2016 Draft Final Report Proposal of priority projects Proposal of priority areas
County Government of Mombasa JICA Expert Team
November 24, 2016 Draft Final Report Understanding of public comments (SEA results) Integration of the comments in MGCMP
County Government of Mombasa JICA Expert Team
Source: JICA Expert Team
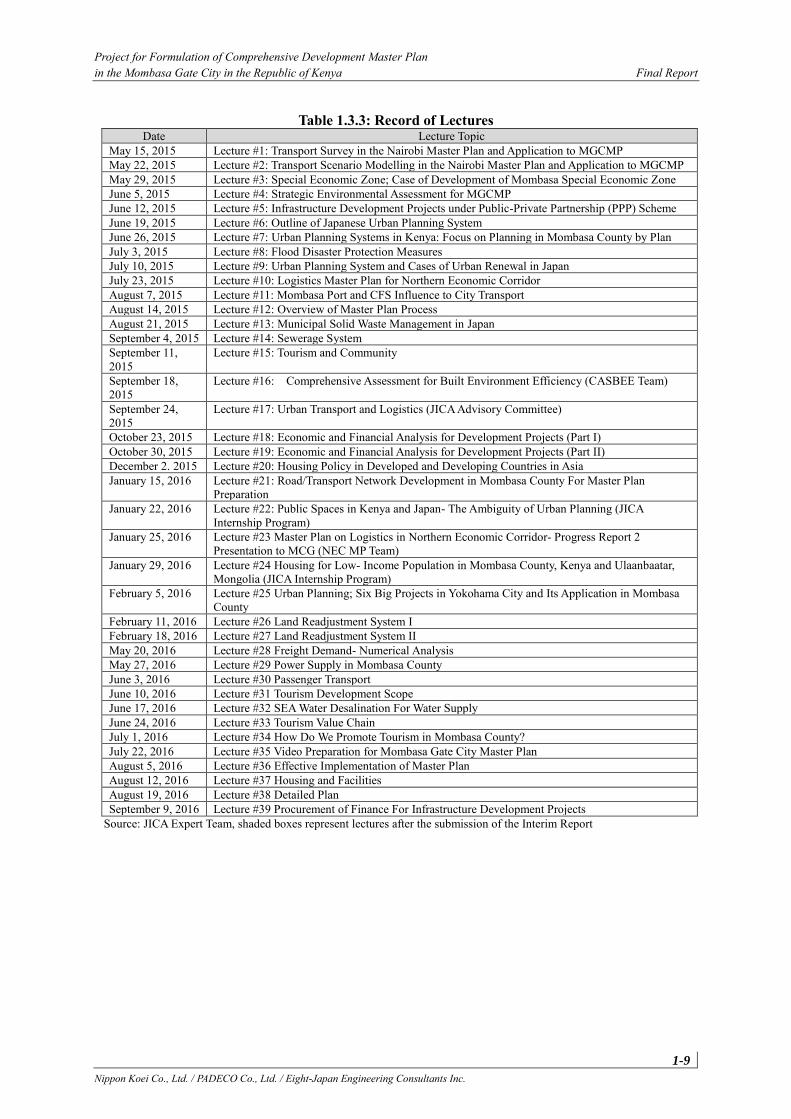
Project for Formulation of Comprehensive Development Master Plan in the Mombasa Gate City in the Republic of Kenya Final Report
1-9 Nippon Koei Co., Ltd. / PADECO Co., Ltd. / Eight-Japan Engineering Consultants Inc.
Table 1.3.3: Record of Lectures Date Lecture Topic
May 15, 2015 Lecture #1: Transport Survey in the Nairobi Master Plan and Application to MGCMP May 22, 2015 Lecture #2: Transport Scenario Modelling in the Nairobi Master Plan and Application to MGCMP May 29, 2015 Lecture #3: Special Economic Zone; Case of Development of Mombasa Special Economic Zone June 5, 2015 Lecture #4: Strategic Environmental Assessment for MGCMP June 12, 2015 Lecture #5: Infrastructure Development Projects under Public-Private Partnership (PPP) Scheme June 19, 2015 Lecture #6: Outline of Japanese Urban Planning System June 26, 2015 Lecture #7: Urban Planning Systems in Kenya: Focus on Planning in Mombasa County by Plan July 3, 2015 Lecture #8: Flood Disaster Protection Measures July 10, 2015 Lecture #9: Urban Planning System and Cases of Urban Renewal in Japan July 23, 2015 Lecture #10: Logistics Master Plan for Northern Economic Corridor August 7, 2015 Lecture #11: Mombasa Port and CFS Influence to City Transport August 14, 2015 Lecture #12: Overview of Master Plan Process August 21, 2015 Lecture #13: Municipal Solid Waste Management in Japan September 4, 2015 Lecture #14: Sewerage System September 11, 2015
Lecture #15: Tourism and Community
September 18, 2015
Lecture #16: Comprehensive Assessment for Built Environment Efficiency (CASBEE Team)
September 24, 2015
Lecture #17: Urban Transport and Logistics (JICA Advisory Committee)
October 23, 2015 Lecture #18: Economic and Financial Analysis for Development Projects (Part I) October 30, 2015 Lecture #19: Economic and Financial Analysis for Development Projects (Part II) December 2. 2015 Lecture #20: Housing Policy in Developed and Developing Countries in Asia January 15, 2016 Lecture #21: Road/Transport Network Development in Mombasa County For Master Plan
Preparation January 22, 2016 Lecture #22: Public Spaces in Kenya and Japan- The Ambiguity of Urban Planning (JICA
Internship Program) January 25, 2016 Lecture #23 Master Plan on Logistics in Northern Economic Corridor- Progress Report 2
Presentation to MCG (NEC MP Team) January 29, 2016 Lecture #24 Housing for Low- Income Population in Mombasa County, Kenya and Ulaanbaatar,
Mongolia (JICA Internship Program) February 5, 2016 Lecture #25 Urban Planning; Six Big Projects in Yokohama City and Its Application in Mombasa
County February 11, 2016 Lecture #26 Land Readjustment System I February 18, 2016 Lecture #27 Land Readjustment System II May 20, 2016 Lecture #28 Freight Demand- Numerical Analysis May 27, 2016 Lecture #29 Power Supply in Mombasa County June 3, 2016 Lecture #30 Passenger Transport June 10, 2016 Lecture #31 Tourism Development Scope June 17, 2016 Lecture #32 SEA Water Desalination For Water Supply June 24, 2016 Lecture #33 Tourism Value Chain July 1, 2016 Lecture #34 How Do We Promote Tourism in Mombasa County? July 22, 2016 Lecture #35 Video Preparation for Mombasa Gate City Master Plan August 5, 2016 Lecture #36 Effective Implementation of Master Plan August 12, 2016 Lecture #37 Housing and Facilities August 19, 2016 Lecture #38 Detailed Plan September 9, 2016 Lecture #39 Procurement of Finance For Infrastructure Development Projects
Source: JICA Expert Team, shaded boxes represent lectures after the submission of the Interim Report
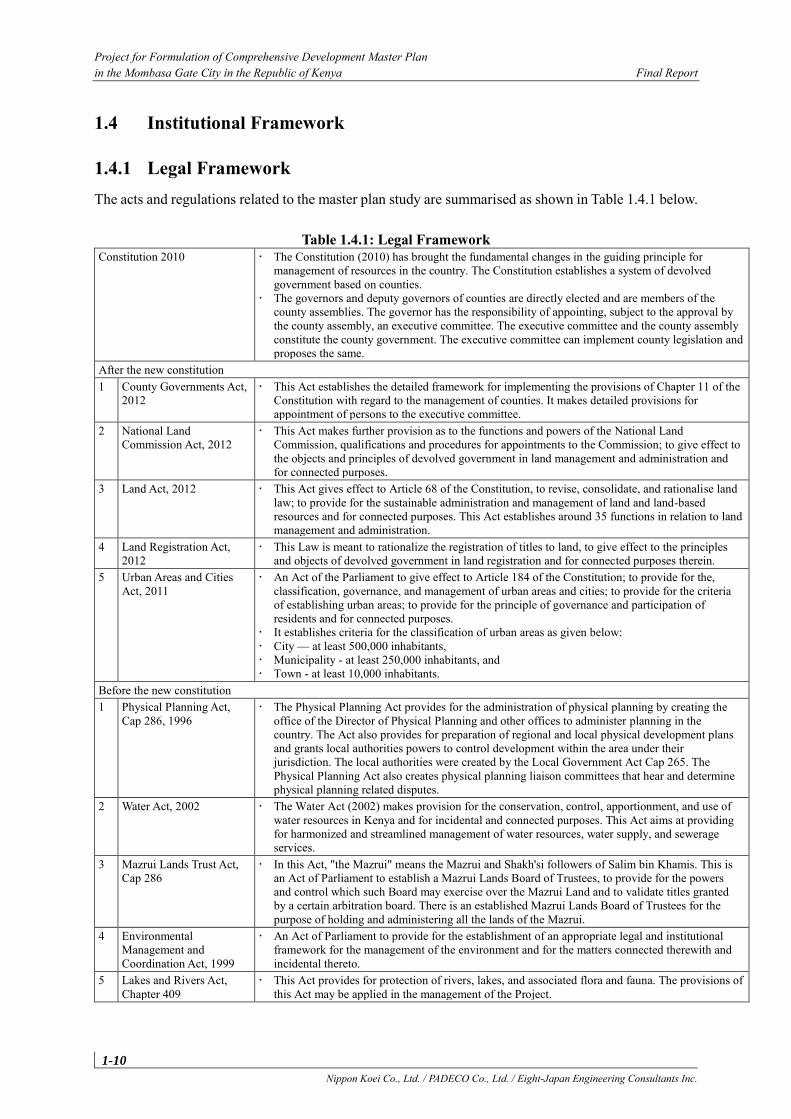
Project for Formulation of Comprehensive Development Master Plan in the Mombasa Gate City in the Republic of Kenya Final Report
1-10 Nippon Koei Co., Ltd. / PADECO Co., Ltd. / Eight-Japan Engineering Consultants Inc.
1.4 Institutional Framework
1.4.1 Legal Framework The acts and regulations related to the master plan study are summarised as shown in Table 1.4.1 below.
Table 1.4.1: Legal Framework Constitution 2010 The Constitution (2010) has brought the fundamental changes in the guiding principle for
management of resources in the country. The Constitution establishes a system of devolved government based on counties.
The governors and deputy governors of counties are directly elected and are members of the county assemblies. The governor has the responsibility of appointing, subject to the approval by the county assembly, an executive committee. The executive committee and the county assembly constitute the county government. The executive committee can implement county legislation and proposes the same.
After the new constitution 1 County Governments Act,
2012 This Act establishes the detailed framework for implementing the provisions of Chapter 11 of the
Constitution with regard to the management of counties. It makes detailed provisions for appointment of persons to the executive committee.
2 National Land Commission Act, 2012
This Act makes further provision as to the functions and powers of the National Land Commission, qualifications and procedures for appointments to the Commission; to give effect to the objects and principles of devolved government in land management and administration and for connected purposes.
3 Land Act, 2012 This Act gives effect to Article 68 of the Constitution, to revise, consolidate, and rationalise land law; to provide for the sustainable administration and management of land and land-based resources and for connected purposes. This Act establishes around 35 functions in relation to land management and administration.
4 Land Registration Act, 2012
This Law is meant to rationalize the registration of titles to land, to give effect to the principles and objects of devolved government in land registration and for connected purposes therein.
5 Urban Areas and Cities Act, 2011
An Act of the Parliament to give effect to Article 184 of the Constitution; to provide for the, classification, governance, and management of urban areas and cities; to provide for the criteria of establishing urban areas; to provide for the principle of governance and participation of residents and for connected purposes.
It establishes criteria for the classification of urban areas as given below: City — at least 500,000 inhabitants, Municipality - at least 250,000 inhabitants, and Town - at least 10,000 inhabitants.
Before the new constitution 1 Physical Planning Act,
Cap 286, 1996 The Physical Planning Act provides for the administration of physical planning by creating the
office of the Director of Physical Planning and other offices to administer planning in the country. The Act also provides for preparation of regional and local physical development plans and grants local authorities powers to control development within the area under their jurisdiction. The local authorities were created by the Local Government Act Cap 265. The Physical Planning Act also creates physical planning liaison committees that hear and determine physical planning related disputes.
2 Water Act, 2002 The Water Act (2002) makes provision for the conservation, control, apportionment, and use of water resources in Kenya and for incidental and connected purposes. This Act aims at providing for harmonized and streamlined management of water resources, water supply, and sewerage services.
3 Mazrui Lands Trust Act, Cap 286
In this Act, "the Mazrui" means the Mazrui and Shakh'si followers of Salim bin Khamis. This is an Act of Parliament to establish a Mazrui Lands Board of Trustees, to provide for the powers and control which such Board may exercise over the Mazrui Land and to validate titles granted by a certain arbitration board. There is an established Mazrui Lands Board of Trustees for the purpose of holding and administering all the lands of the Mazrui.
4 Environmental Management and Coordination Act, 1999
An Act of Parliament to provide for the establishment of an appropriate legal and institutional framework for the management of the environment and for the matters connected therewith and incidental thereto.
5 Lakes and Rivers Act, Chapter 409
This Act provides for protection of rivers, lakes, and associated flora and fauna. The provisions of this Act may be applied in the management of the Project.
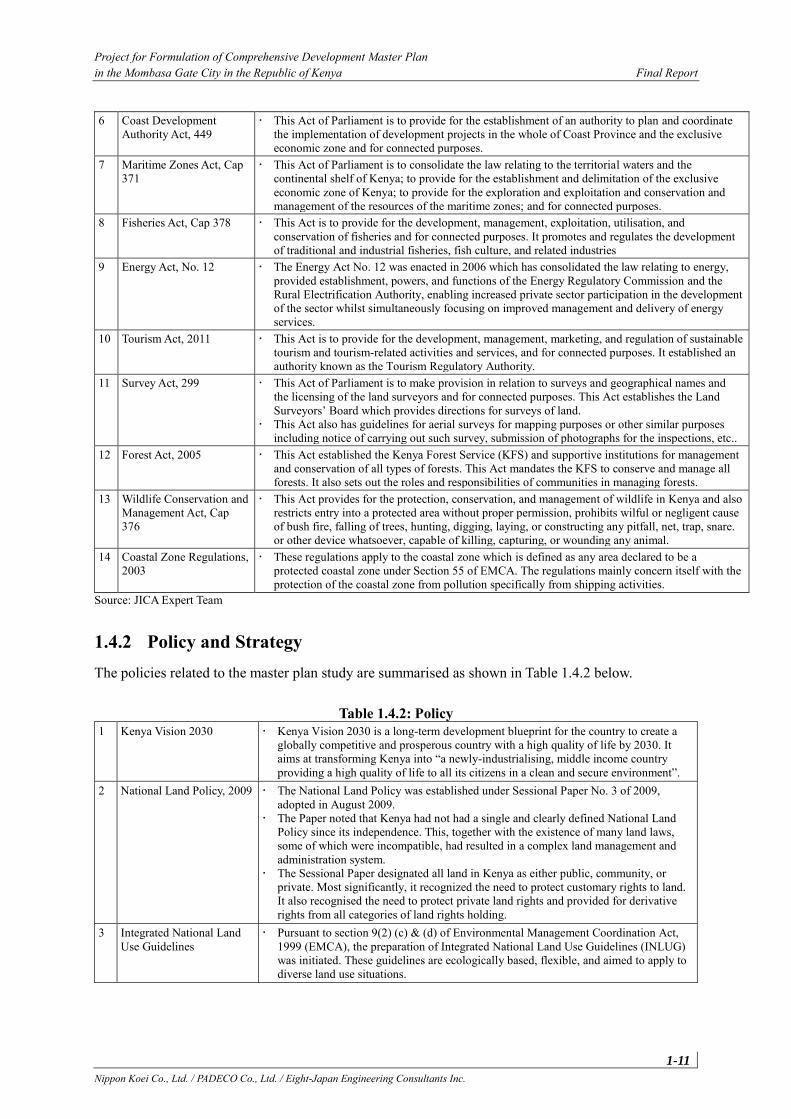
Project for Formulation of Comprehensive Development Master Plan in the Mombasa Gate City in the Republic of Kenya Final Report
1-11 Nippon Koei Co., Ltd. / PADECO Co., Ltd. / Eight-Japan Engineering Consultants Inc.
6 Coast Development Authority Act, 449
This Act of Parliament is to provide for the establishment of an authority to plan and coordinate the implementation of development projects in the whole of Coast Province and the exclusive economic zone and for connected purposes.
7 Maritime Zones Act, Cap 371
This Act of Parliament is to consolidate the law relating to the territorial waters and the continental shelf of Kenya; to provide for the establishment and delimitation of the exclusive economic zone of Kenya; to provide for the exploration and exploitation and conservation and management of the resources of the maritime zones; and for connected purposes.
8 Fisheries Act, Cap 378 This Act is to provide for the development, management, exploitation, utilisation, and conservation of fisheries and for connected purposes. It promotes and regulates the development of traditional and industrial fisheries, fish culture, and related industries
9 Energy Act, No. 12 The Energy Act No. 12 was enacted in 2006 which has consolidated the law relating to energy, provided establishment, powers, and functions of the Energy Regulatory Commission and the Rural Electrification Authority, enabling increased private sector participation in the development of the sector whilst simultaneously focusing on improved management and delivery of energy services.
10 Tourism Act, 2011 This Act is to provide for the development, management, marketing, and regulation of sustainable tourism and tourism-related activities and services, and for connected purposes. It established an authority known as the Tourism Regulatory Authority.
11 Survey Act, 299 This Act of Parliament is to make provision in relation to surveys and geographical names and the licensing of the land surveyors and for connected purposes. This Act establishes the Land Surveyors’ Board which provides directions for surveys of land.
This Act also has guidelines for aerial surveys for mapping purposes or other similar purposes including notice of carrying out such survey, submission of photographs for the inspections, etc..
12 Forest Act, 2005 This Act established the Kenya Forest Service (KFS) and supportive institutions for management and conservation of all types of forests. This Act mandates the KFS to conserve and manage all forests. It also sets out the roles and responsibilities of communities in managing forests.
13 Wildlife Conservation and Management Act, Cap 376
This Act provides for the protection, conservation, and management of wildlife in Kenya and also restricts entry into a protected area without proper permission, prohibits wilful or negligent cause of bush fire, falling of trees, hunting, digging, laying, or constructing any pitfall, net, trap, snare. or other device whatsoever, capable of killing, capturing, or wounding any animal.
14 Coastal Zone Regulations, 2003
These regulations apply to the coastal zone which is defined as any area declared to be a protected coastal zone under Section 55 of EMCA. The regulations mainly concern itself with the protection of the coastal zone from pollution specifically from shipping activities.
Source: JICA Expert Team
1.4.2 Policy and Strategy The policies related to the master plan study are summarised as shown in Table 1.4.2 below.
Table 1.4.2: Policy 1 Kenya Vision 2030 Kenya Vision 2030 is a long-term development blueprint for the country to create a
globally competitive and prosperous country with a high quality of life by 2030. It aims at transforming Kenya into “a newly-industrialising, middle income country providing a high quality of life to all its citizens in a clean and secure environment”.
2 National Land Policy, 2009 The National Land Policy was established under Sessional Paper No. 3 of 2009, adopted in August 2009.
The Paper noted that Kenya had not had a single and clearly defined National Land Policy since its independence. This, together with the existence of many land laws, some of which were incompatible, had resulted in a complex land management and administration system.
The Sessional Paper designated all land in Kenya as either public, community, or private. Most significantly, it recognized the need to protect customary rights to land. It also recognised the need to protect private land rights and provided for derivative rights from all categories of land rights holding.
3 Integrated National Land Use Guidelines
Pursuant to section 9(2) (c) & (d) of Environmental Management Coordination Act, 1999 (EMCA), the preparation of Integrated National Land Use Guidelines (INLUG) was initiated. These guidelines are ecologically based, flexible, and aimed to apply to diverse land use situations.

Project for Formulation of Comprehensive Development Master Plan in the Mombasa Gate City in the Republic of Kenya Final Report
1-12 Nippon Koei Co., Ltd. / PADECO Co., Ltd. / Eight-Japan Engineering Consultants Inc.
4 Draft National Urban Development Policy 2013
A National Urban Development Policy has been drafted and is awaiting Cabinet approval. The key points, as indicated in the Draft Policy, is to secure a well governed, competitive, and sustainable urban development in Kenya for the benefit of all by addressing the challenge of urban finance, economy, governance, housing, physical infrastructure, and facilities, amongst others. The draft urban policy also covers issues of safety and disaster risk management, marginalised and vulnerable groups, and key cross cutting issues.
5 Physical Planning Handbook 2007 (Draft)
The purpose of this handbook, which was drafted in 2007, was to provide clear and digestible user-friendly guidelines and minimum standards on the process and practise of physical planning.
Its aim was to rationalise the rules, regulations, guidelines and performance standards that existed in various statutes, relevant subsidiary legislation, technical standards, and principles that applied under relevant professional and technical disciplines.
6 National Environment Policy 2013 and Guideline
Upon the promulgation of the Constitution of Kenya 2010, it was found necessary to review the draft policy of 2008 to accommodate any new developments due to time lapse and to align it to the Constitution. The National Environment Policy of 2013 was therefore a product of a wide participation and consultation with various stakeholders.
7 National Housing Policy 2004
The National Housing Policy for Kenya was published by the Ministry of Housing as Sessional Paper No. 3 of 2004. The main policy thrusts are:
Land Use Planning and Management Infrastructure Financial Resources for Housing
8 Building By-laws The Kenya Standards Building Code (2009) is probably the most comprehensive and up-to-date code on the continent. It covers all aspects of construction and on-site planning.
9 National Energy Policy 2004
The Sessional Paper No. 4 of 2004 governed the policy direction of the energy sector for the past eight years, which has been aligned to the new Constitution 2010 and made tandem with Vision 2030. The overall objective of the energy policy is to ensure affordable, sustainable, and reliable supply to meet national and county development needs, while protecting and consenting the environment.
10 National Tourism Strategy 2013-2018
The national tourism strategy is a culmination of extensive stakeholders’ involvement and participation besides the fulfilment of the Tourism Act 2011, Section 3. The main aim of this strategy is to address national issues confronting the Kenya tourism sector and focus the players in the sector on sustainable tourism.
11 Kenya Vision 2030 and Flagship Projects for Mombasa City
In order to achieve an integrated infrastructure, flagship projects have been proposed to complement Vision 2030's priorities
12 Second Medium Term Plan (2013 and 2017) and Projects for Mombasa City
The second medium-term plan (MTP) of Vision 2030 identified key policy actions, reforms, programs, and projects the Government will implement in the 2013-2017 period in line with its priorities, the Kenyan 2010 Constitution, and the long-term objectives of Vision 2030.
Source: JICA Expert Team
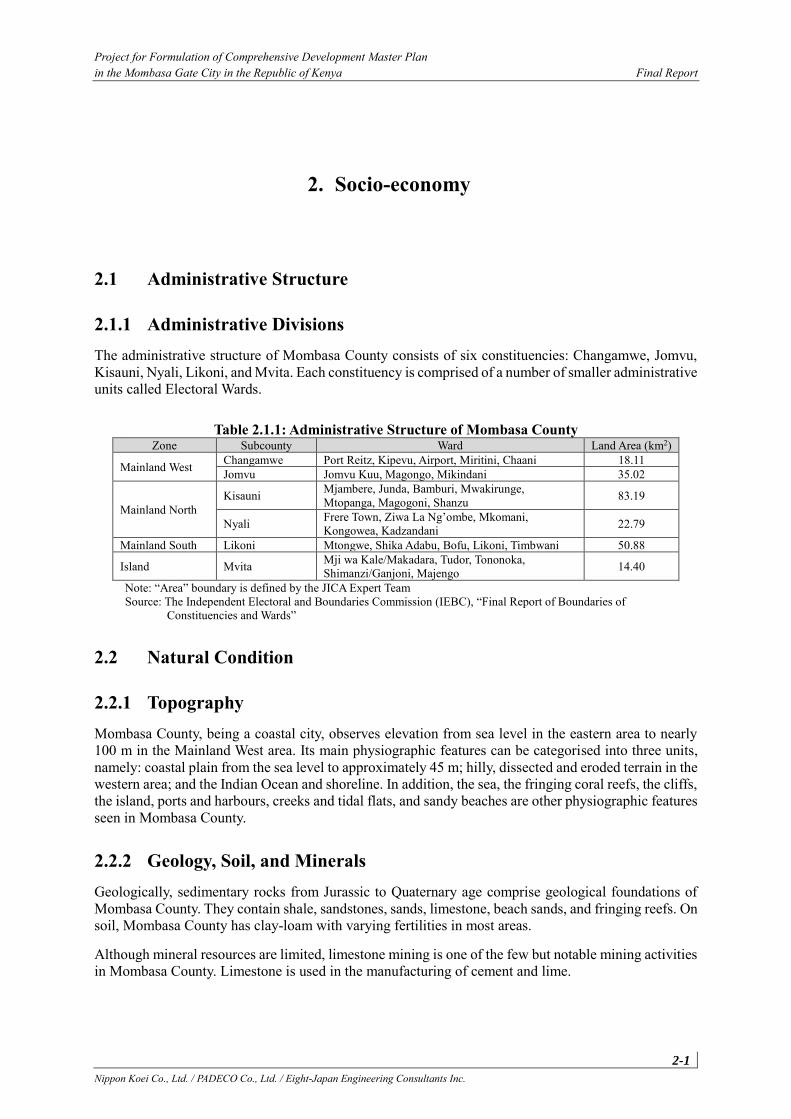
Project for Formulation of Comprehensive Development Master Plan in the Mombasa Gate City in the Republic of Kenya Final Report
2-1 Nippon Koei Co., Ltd. / PADECO Co., Ltd. / Eight-Japan Engineering Consultants Inc.
2. Socio-economy
2.1 Administrative Structure
2.1.1 Administrative Divisions The administrative structure of Mombasa County consists of six constituencies: Changamwe, Jomvu, Kisauni, Nyali, Likoni, and Mvita. Each constituency is comprised of a number of smaller administrative units called Electoral Wards.
Table 2.1.1: Administrative Structure of Mombasa County Zone Subcounty Ward Land Area (km2)
Mainland West Changamwe Port Reitz, Kipevu, Airport, Miritini, Chaani 18.11 Jomvu Jomvu Kuu, Magongo, Mikindani 35.02
Mainland North Kisauni Mjambere, Junda, Bamburi, Mwakirunge,
Mtopanga, Magogoni, Shanzu 83.19
Nyali Frere Town, Ziwa La Ng’ombe, Mkomani, Kongowea, Kadzandani 22.79
Mainland South Likoni Mtongwe, Shika Adabu, Bofu, Likoni, Timbwani 50.88
Island Mvita Mji wa Kale/Makadara, Tudor, Tononoka, Shimanzi/Ganjoni, Majengo 14.40
Note: “Area” boundary is defined by the JICA Expert Team Source: The Independent Electoral and Boundaries Commission (IEBC), “Final Report of Boundaries of
Constituencies and Wards”
2.2 Natural Condition
2.2.1 Topography Mombasa County, being a coastal city, observes elevation from sea level in the eastern area to nearly 100 m in the Mainland West area. Its main physiographic features can be categorised into three units, namely: coastal plain from the sea level to approximately 45 m; hilly, dissected and eroded terrain in the western area; and the Indian Ocean and shoreline. In addition, the sea, the fringing coral reefs, the cliffs, the island, ports and harbours, creeks and tidal flats, and sandy beaches are other physiographic features seen in Mombasa County.
2.2.2 Geology, Soil, and Minerals Geologically, sedimentary rocks from Jurassic to Quaternary age comprise geological foundations of Mombasa County. They contain shale, sandstones, sands, limestone, beach sands, and fringing reefs. On soil, Mombasa County has clay-loam with varying fertilities in most areas.
Although mineral resources are limited, limestone mining is one of the few but notable mining activities in Mombasa County. Limestone is used in the manufacturing of cement and lime.
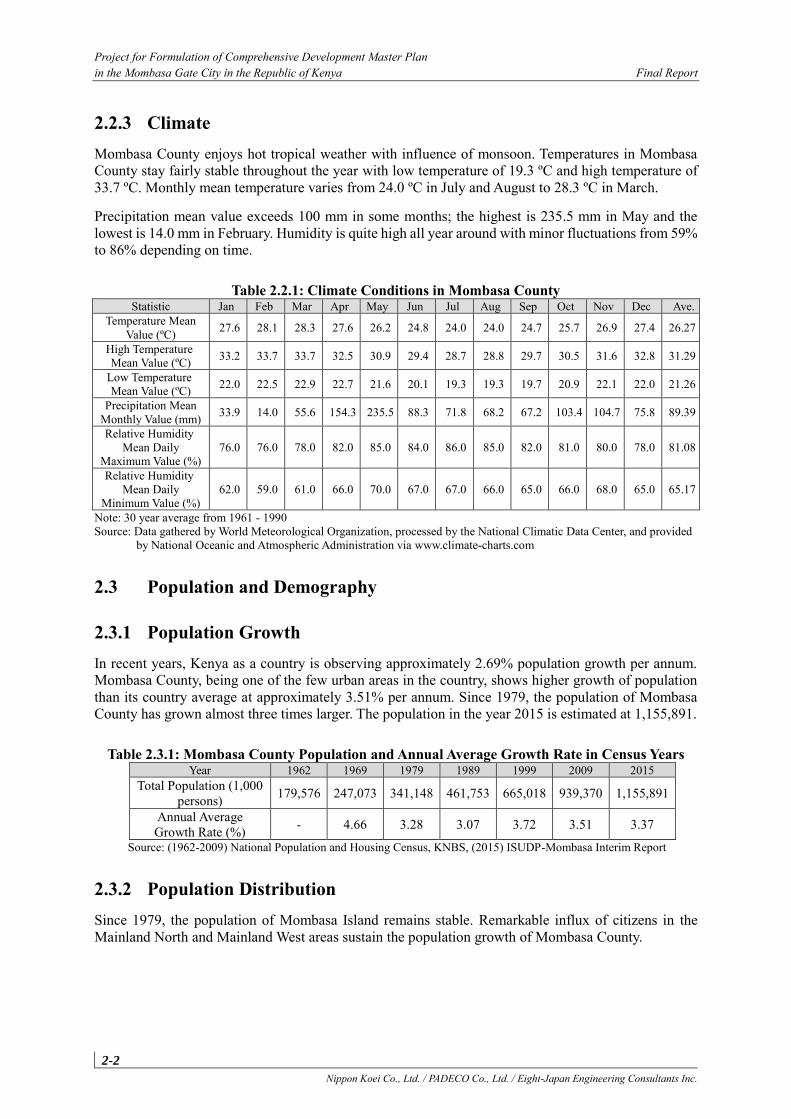
Project for Formulation of Comprehensive Development Master Plan in the Mombasa Gate City in the Republic of Kenya Final Report
2-2 Nippon Koei Co., Ltd. / PADECO Co., Ltd. / Eight-Japan Engineering Consultants Inc.
2.2.3 Climate Mombasa County enjoys hot tropical weather with influence of monsoon. Temperatures in Mombasa County stay fairly stable throughout the year with low temperature of 19.3 ºC and high temperature of 33.7 ºC. Monthly mean temperature varies from 24.0 ºC in July and August to 28.3 ºC in March.
Precipitation mean value exceeds 100 mm in some months; the highest is 235.5 mm in May and the lowest is 14.0 mm in February. Humidity is quite high all year around with minor fluctuations from 59% to 86% depending on time.
Table 2.2.1: Climate Conditions in Mombasa County Statistic Jan Feb Mar Apr May Jun Jul Aug Sep Oct Nov Dec Ave.
Temperature Mean Value (ºC) 27.6 28.1 28.3 27.6 26.2 24.8 24.0 24.0 24.7 25.7 26.9 27.4 26.27
High Temperature Mean Value (ºC) 33.2 33.7 33.7 32.5 30.9 29.4 28.7 28.8 29.7 30.5 31.6 32.8 31.29
Low Temperature Mean Value (ºC) 22.0 22.5 22.9 22.7 21.6 20.1 19.3 19.3 19.7 20.9 22.1 22.0 21.26
Precipitation Mean Monthly Value (mm) 33.9 14.0 55.6 154.3 235.5 88.3 71.8 68.2 67.2 103.4 104.7 75.8 89.39
Relative Humidity Mean Daily
Maximum Value (%) 76.0 76.0 78.0 82.0 85.0 84.0 86.0 85.0 82.0 81.0 80.0 78.0 81.08
Relative Humidity Mean Daily
Minimum Value (%) 62.0 59.0 61.0 66.0 70.0 67.0 67.0 66.0 65.0 66.0 68.0 65.0 65.17
Note: 30 year average from 1961 - 1990 Source: Data gathered by World Meteorological Organization, processed by the National Climatic Data Center, and provided
by National Oceanic and Atmospheric Administration via www.climate-charts.com
2.3 Population and Demography
2.3.1 Population Growth In recent years, Kenya as a country is observing approximately 2.69% population growth per annum. Mombasa County, being one of the few urban areas in the country, shows higher growth of population than its country average at approximately 3.51% per annum. Since 1979, the population of Mombasa County has grown almost three times larger. The population in the year 2015 is estimated at 1,155,891.
Table 2.3.1: Mombasa County Population and Annual Average Growth Rate in Census Years Year 1962 1969 1979 1989 1999 2009 2015
Total Population (1,000 persons) 179,576 247,073 341,148 461,753 665,018 939,370 1,155,891
Annual Average Growth Rate (%) - 4.66 3.28 3.07 3.72 3.51 3.37
Source: (1962-2009) National Population and Housing Census, KNBS, (2015) ISUDP-Mombasa Interim Report
2.3.2 Population Distribution Since 1979, the population of Mombasa Island remains stable. Remarkable influx of citizens in the Mainland North and Mainland West areas sustain the population growth of Mombasa County.
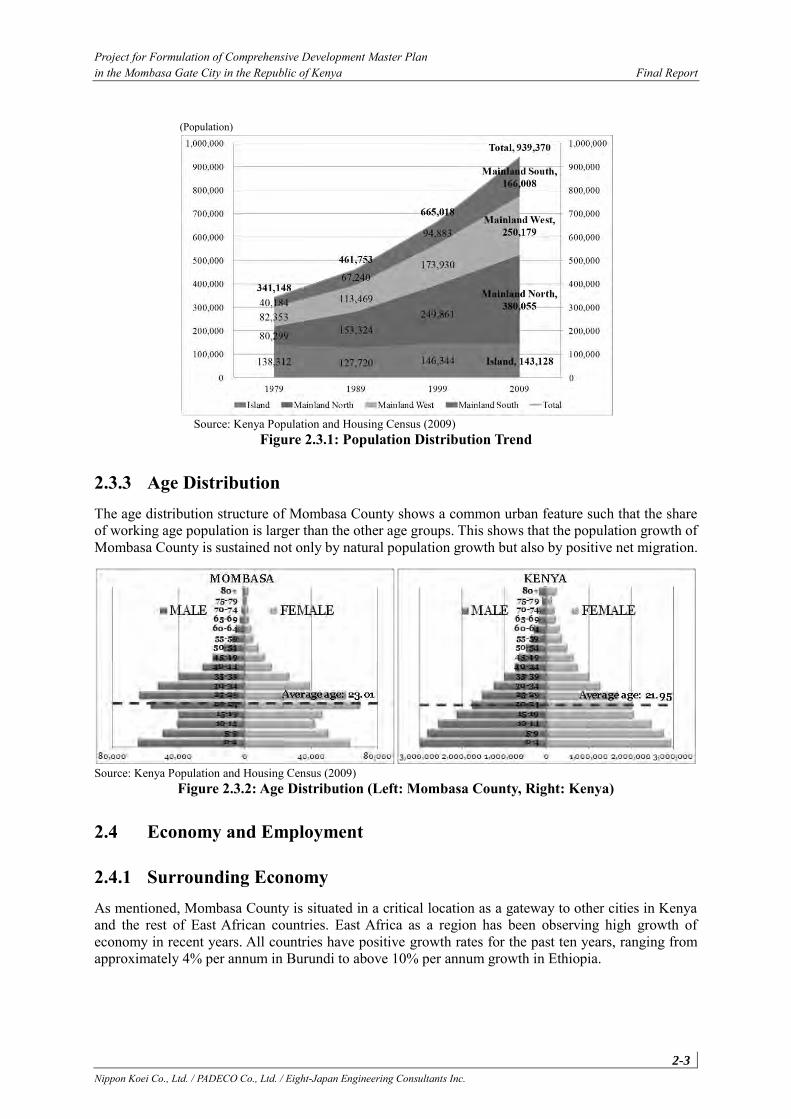
Project for Formulation of Comprehensive Development Master Plan in the Mombasa Gate City in the Republic of Kenya Final Report
2-3 Nippon Koei Co., Ltd. / PADECO Co., Ltd. / Eight-Japan Engineering Consultants Inc.
Source: Kenya Population and Housing Census (2009)
Figure 2.3.1: Population Distribution Trend
2.3.3 Age Distribution The age distribution structure of Mombasa County shows a common urban feature such that the share of working age population is larger than the other age groups. This shows that the population growth of Mombasa County is sustained not only by natural population growth but also by positive net migration.
Source: Kenya Population and Housing Census (2009)
Figure 2.3.2: Age Distribution (Left: Mombasa County, Right: Kenya)
2.4 Economy and Employment
2.4.1 Surrounding Economy As mentioned, Mombasa County is situated in a critical location as a gateway to other cities in Kenya and the rest of East African countries. East Africa as a region has been observing high growth of economy in recent years. All countries have positive growth rates for the past ten years, ranging from approximately 4% per annum in Burundi to above 10% per annum growth in Ethiopia.
(Population)
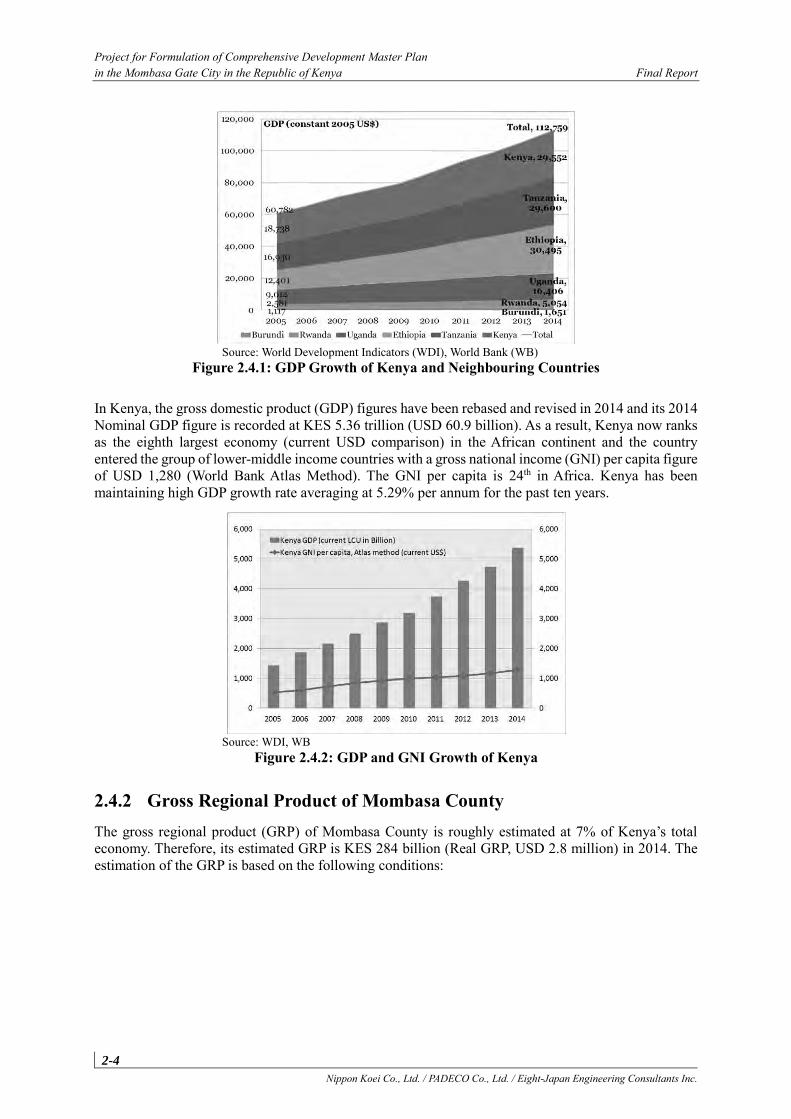
Project for Formulation of Comprehensive Development Master Plan in the Mombasa Gate City in the Republic of Kenya Final Report
2-4 Nippon Koei Co., Ltd. / PADECO Co., Ltd. / Eight-Japan Engineering Consultants Inc.
Source: World Development Indicators (WDI), World Bank (WB)
Figure 2.4.1: GDP Growth of Kenya and Neighbouring Countries
In Kenya, the gross domestic product (GDP) figures have been rebased and revised in 2014 and its 2014 Nominal GDP figure is recorded at KES 5.36 trillion (USD 60.9 billion). As a result, Kenya now ranks as the eighth largest economy (current USD comparison) in the African continent and the country entered the group of lower-middle income countries with a gross national income (GNI) per capita figure of USD 1,280 (World Bank Atlas Method). The GNI per capita is 24th in Africa. Kenya has been maintaining high GDP growth rate averaging at 5.29% per annum for the past ten years.
Source: WDI, WB
Figure 2.4.2: GDP and GNI Growth of Kenya
2.4.2 Gross Regional Product of Mombasa County The gross regional product (GRP) of Mombasa County is roughly estimated at 7% of Kenya’s total economy. Therefore, its estimated GRP is KES 284 billion (Real GRP, USD 2.8 million) in 2014. The estimation of the GRP is based on the following conditions:
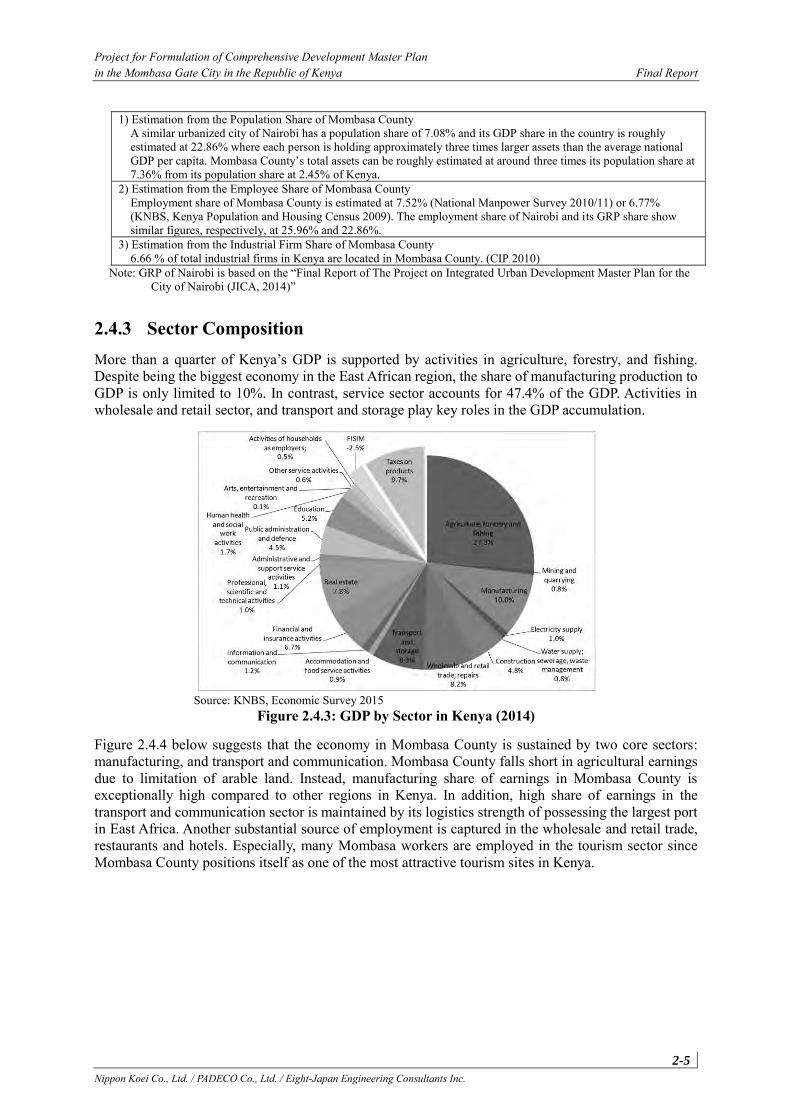
Project for Formulation of Comprehensive Development Master Plan in the Mombasa Gate City in the Republic of Kenya Final Report
2-5 Nippon Koei Co., Ltd. / PADECO Co., Ltd. / Eight-Japan Engineering Consultants Inc.
1) Estimation from the Population Share of Mombasa County A similar urbanized city of Nairobi has a population share of 7.08% and its GDP share in the country is roughly
estimated at 22.86% where each person is holding approximately three times larger assets than the average national GDP per capita. Mombasa County’s total assets can be roughly estimated at around three times its population share at 7.36% from its population share at 2.45% of Kenya.
2) Estimation from the Employee Share of Mombasa County Employment share of Mombasa County is estimated at 7.52% (National Manpower Survey 2010/11) or 6.77%
(KNBS, Kenya Population and Housing Census 2009). The employment share of Nairobi and its GRP share show similar figures, respectively, at 25.96% and 22.86%.
3) Estimation from the Industrial Firm Share of Mombasa County 6.66 % of total industrial firms in Kenya are located in Mombasa County. (CIP 2010)
Note: GRP of Nairobi is based on the “Final Report of The Project on Integrated Urban Development Master Plan for the City of Nairobi (JICA, 2014)”
2.4.3 Sector Composition More than a quarter of Kenya’s GDP is supported by activities in agriculture, forestry, and fishing. Despite being the biggest economy in the East African region, the share of manufacturing production to GDP is only limited to 10%. In contrast, service sector accounts for 47.4% of the GDP. Activities in wholesale and retail sector, and transport and storage play key roles in the GDP accumulation.
Source: KNBS, Economic Survey 2015
Figure 2.4.3: GDP by Sector in Kenya (2014)
Figure 2.4.4 below suggests that the economy in Mombasa County is sustained by two core sectors: manufacturing, and transport and communication. Mombasa County falls short in agricultural earnings due to limitation of arable land. Instead, manufacturing share of earnings in Mombasa County is exceptionally high compared to other regions in Kenya. In addition, high share of earnings in the transport and communication sector is maintained by its logistics strength of possessing the largest port in East Africa. Another substantial source of employment is captured in the wholesale and retail trade, restaurants and hotels. Especially, many Mombasa workers are employed in the tourism sector since Mombasa County positions itself as one of the most attractive tourism sites in Kenya.
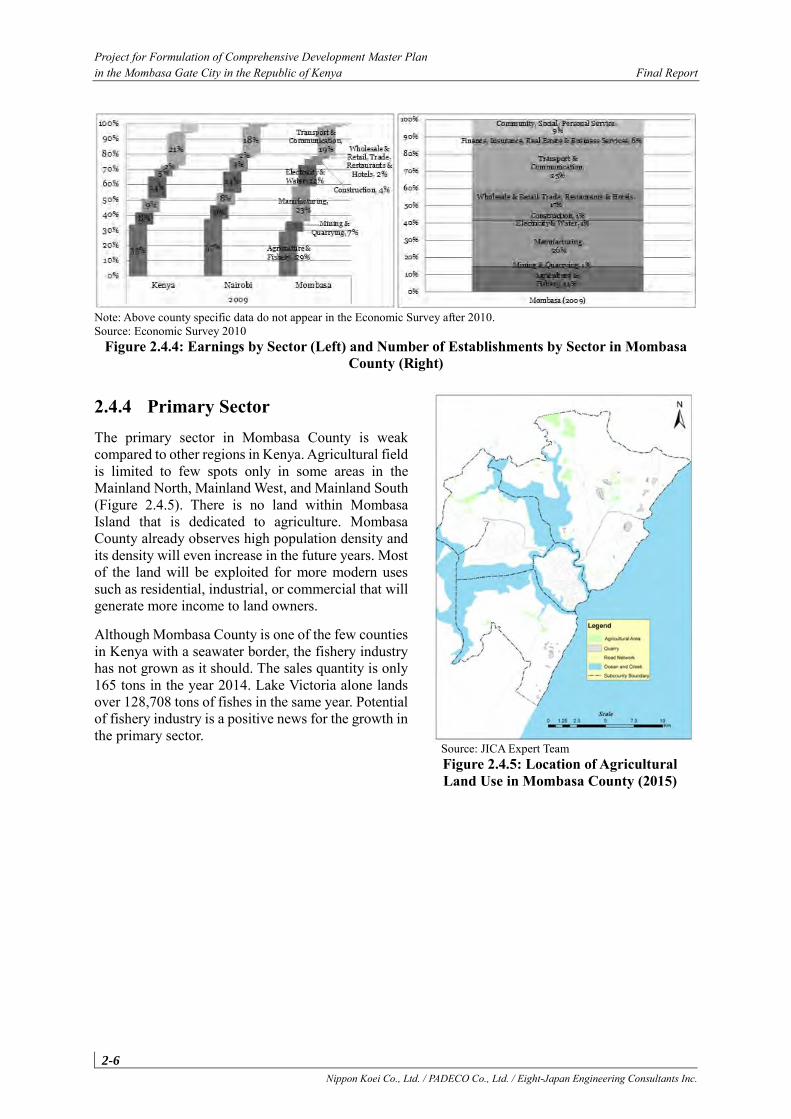
Project for Formulation of Comprehensive Development Master Plan in the Mombasa Gate City in the Republic of Kenya Final Report
2-6 Nippon Koei Co., Ltd. / PADECO Co., Ltd. / Eight-Japan Engineering Consultants Inc.
Note: Above county specific data do not appear in the Economic Survey after 2010. Source: Economic Survey 2010
Figure 2.4.4: Earnings by Sector (Left) and Number of Establishments by Sector in Mombasa County (Right)
2.4.4 Primary Sector The primary sector in Mombasa County is weak compared to other regions in Kenya. Agricultural field is limited to few spots only in some areas in the Mainland North, Mainland West, and Mainland South (Figure 2.4.5). There is no land within Mombasa Island that is dedicated to agriculture. Mombasa County already observes high population density and its density will even increase in the future years. Most of the land will be exploited for more modern uses such as residential, industrial, or commercial that will generate more income to land owners.
Although Mombasa County is one of the few counties in Kenya with a seawater border, the fishery industry has not grown as it should. The sales quantity is only 165 tons in the year 2014. Lake Victoria alone lands over 128,708 tons of fishes in the same year. Potential of fishery industry is a positive news for the growth in the primary sector.
Source: JICA Expert Team Figure 2.4.5: Location of Agricultural Land Use in Mombasa County (2015)
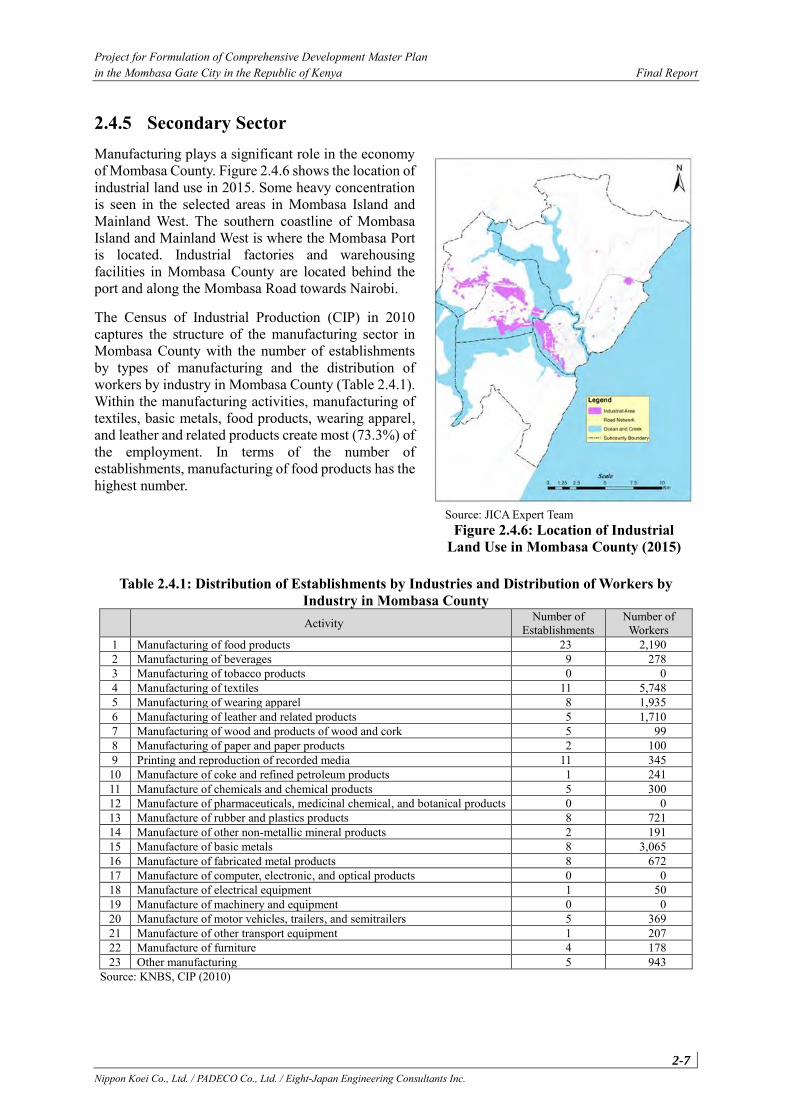
Project for Formulation of Comprehensive Development Master Plan in the Mombasa Gate City in the Republic of Kenya Final Report
2-7 Nippon Koei Co., Ltd. / PADECO Co., Ltd. / Eight-Japan Engineering Consultants Inc.
2.4.5 Secondary Sector Manufacturing plays a significant role in the economy of Mombasa County. Figure 2.4.6 shows the location of industrial land use in 2015. Some heavy concentration is seen in the selected areas in Mombasa Island and Mainland West. The southern coastline of Mombasa Island and Mainland West is where the Mombasa Port is located. Industrial factories and warehousing facilities in Mombasa County are located behind the port and along the Mombasa Road towards Nairobi.
The Census of Industrial Production (CIP) in 2010 captures the structure of the manufacturing sector in Mombasa County with the number of establishments by types of manufacturing and the distribution of workers by industry in Mombasa County (Table 2.4.1). Within the manufacturing activities, manufacturing of textiles, basic metals, food products, wearing apparel, and leather and related products create most (73.3%) of the employment. In terms of the number of establishments, manufacturing of food products has the highest number.
Table 2.4.1: Distribution of Establishments by Industries and Distribution of Workers by Industry in Mombasa County
Activity Number of Establishments
Number of Workers
1 Manufacturing of food products 23 2,190 2 Manufacturing of beverages 9 278 3 Manufacturing of tobacco products 0 0 4 Manufacturing of textiles 11 5,748 5 Manufacturing of wearing apparel 8 1,935 6 Manufacturing of leather and related products 5 1,710 7 Manufacturing of wood and products of wood and cork 5 99 8 Manufacturing of paper and paper products 2 100 9 Printing and reproduction of recorded media 11 345 10 Manufacture of coke and refined petroleum products 1 241 11 Manufacture of chemicals and chemical products 5 300 12 Manufacture of pharmaceuticals, medicinal chemical, and botanical products 0 0 13 Manufacture of rubber and plastics products 8 721 14 Manufacture of other non-metallic mineral products 2 191 15 Manufacture of basic metals 8 3,065 16 Manufacture of fabricated metal products 8 672 17 Manufacture of computer, electronic, and optical products 0 0 18 Manufacture of electrical equipment 1 50 19 Manufacture of machinery and equipment 0 0 20 Manufacture of motor vehicles, trailers, and semitrailers 5 369 21 Manufacture of other transport equipment 1 207 22 Manufacture of furniture 4 178 23 Other manufacturing 5 943
Source: KNBS, CIP (2010)
Source: JICA Expert Team Figure 2.4.6: Location of Industrial
Land Use in Mombasa County (2015)
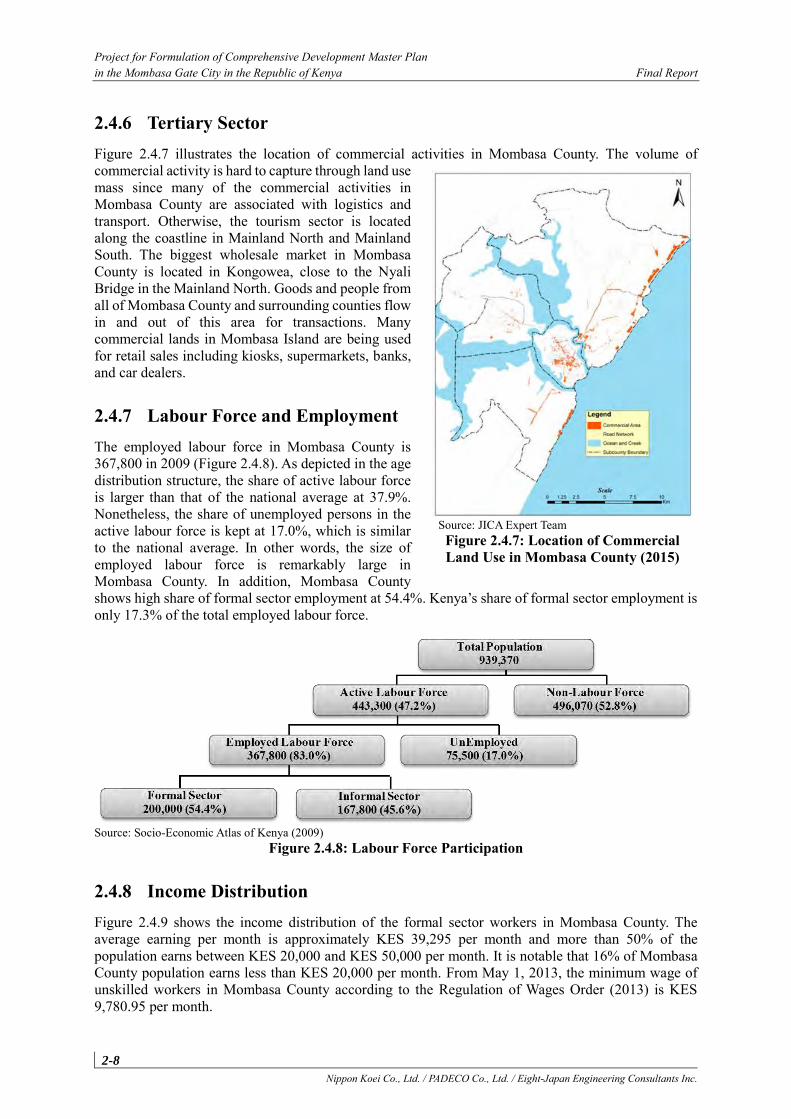
Project for Formulation of Comprehensive Development Master Plan in the Mombasa Gate City in the Republic of Kenya Final Report
2-8 Nippon Koei Co., Ltd. / PADECO Co., Ltd. / Eight-Japan Engineering Consultants Inc.
2.4.6 Tertiary Sector Figure 2.4.7 illustrates the location of commercial activities in Mombasa County. The volume of commercial activity is hard to capture through land use mass since many of the commercial activities in Mombasa County are associated with logistics and transport. Otherwise, the tourism sector is located along the coastline in Mainland North and Mainland South. The biggest wholesale market in Mombasa County is located in Kongowea, close to the Nyali Bridge in the Mainland North. Goods and people from all of Mombasa County and surrounding counties flow in and out of this area for transactions. Many commercial lands in Mombasa Island are being used for retail sales including kiosks, supermarkets, banks, and car dealers.
2.4.7 Labour Force and Employment The employed labour force in Mombasa County is 367,800 in 2009 (Figure 2.4.8). As depicted in the age distribution structure, the share of active labour force is larger than that of the national average at 37.9%. Nonetheless, the share of unemployed persons in the active labour force is kept at 17.0%, which is similar to the national average. In other words, the size of employed labour force is remarkably large in Mombasa County. In addition, Mombasa County shows high share of formal sector employment at 54.4%. Kenya’s share of formal sector employment is only 17.3% of the total employed labour force.
Source: Socio-Economic Atlas of Kenya (2009)
Figure 2.4.8: Labour Force Participation
2.4.8 Income Distribution Figure 2.4.9 shows the income distribution of the formal sector workers in Mombasa County. The average earning per month is approximately KES 39,295 per month and more than 50% of the population earns between KES 20,000 and KES 50,000 per month. It is notable that 16% of Mombasa County population earns less than KES 20,000 per month. From May 1, 2013, the minimum wage of unskilled workers in Mombasa County according to the Regulation of Wages Order (2013) is KES 9,780.95 per month.
Source: JICA Expert Team Figure 2.4.7: Location of Commercial Land Use in Mombasa County (2015)
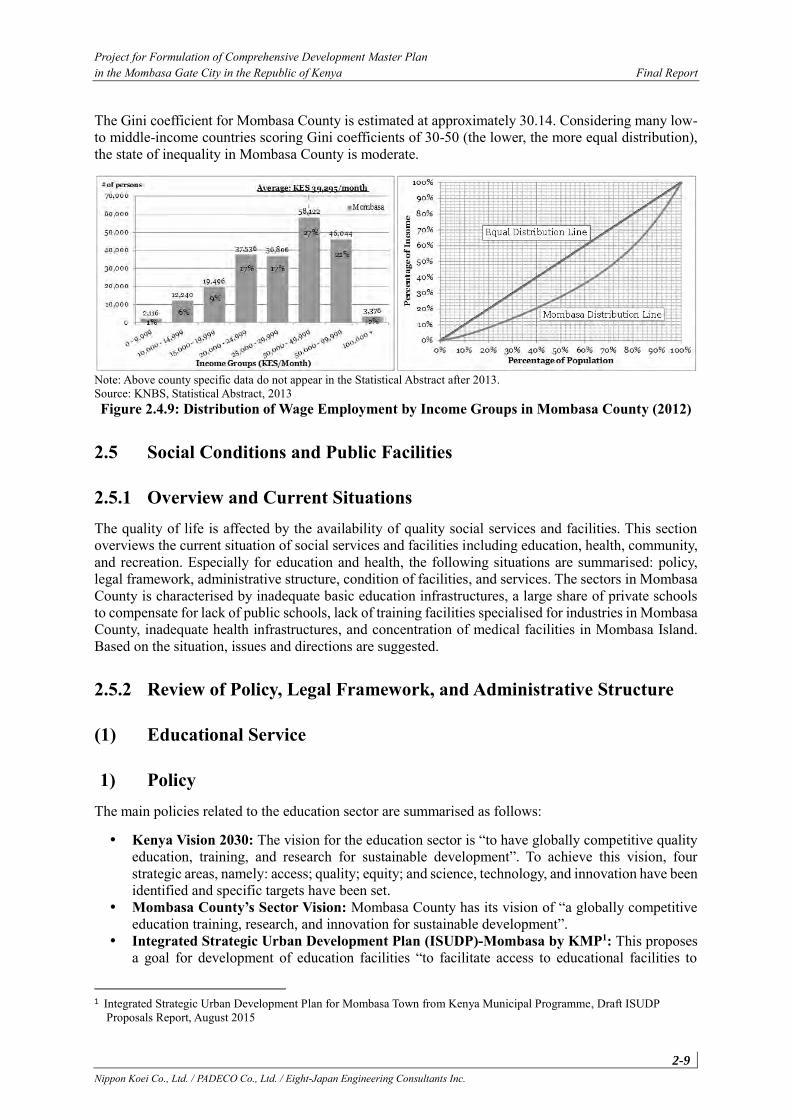
Project for Formulation of Comprehensive Development Master Plan in the Mombasa Gate City in the Republic of Kenya Final Report
2-9 Nippon Koei Co., Ltd. / PADECO Co., Ltd. / Eight-Japan Engineering Consultants Inc.
The Gini coefficient for Mombasa County is estimated at approximately 30.14. Considering many low- to middle-income countries scoring Gini coefficients of 30-50 (the lower, the more equal distribution), the state of inequality in Mombasa County is moderate.
Note: Above county specific data do not appear in the Statistical Abstract after 2013. Source: KNBS, Statistical Abstract, 2013 Figure 2.4.9: Distribution of Wage Employment by Income Groups in Mombasa County (2012)
2.5 Social Conditions and Public Facilities
2.5.1 Overview and Current Situations The quality of life is affected by the availability of quality social services and facilities. This section overviews the current situation of social services and facilities including education, health, community, and recreation. Especially for education and health, the following situations are summarised: policy, legal framework, administrative structure, condition of facilities, and services. The sectors in Mombasa County is characterised by inadequate basic education infrastructures, a large share of private schools to compensate for lack of public schools, lack of training facilities specialised for industries in Mombasa County, inadequate health infrastructures, and concentration of medical facilities in Mombasa Island. Based on the situation, issues and directions are suggested.
2.5.2 Review of Policy, Legal Framework, and Administrative Structure
(1) Educational Service
1) Policy The main policies related to the education sector are summarised as follows:
Kenya Vision 2030: The vision for the education sector is “to have globally competitive quality education, training, and research for sustainable development”. To achieve this vision, four strategic areas, namely: access; quality; equity; and science, technology, and innovation have been identified and specific targets have been set.
Mombasa County’s Sector Vision: Mombasa County has its vision of “a globally competitive education training, research, and innovation for sustainable development”.
Integrated Strategic Urban Development Plan (ISUDP)-Mombasa by KMP1: This proposes a goal for development of education facilities “to facilitate access to educational facilities to
1 Integrated Strategic Urban Development Plan for Mombasa Town from Kenya Municipal Programme, Draft ISUDP
Proposals Report, August 2015
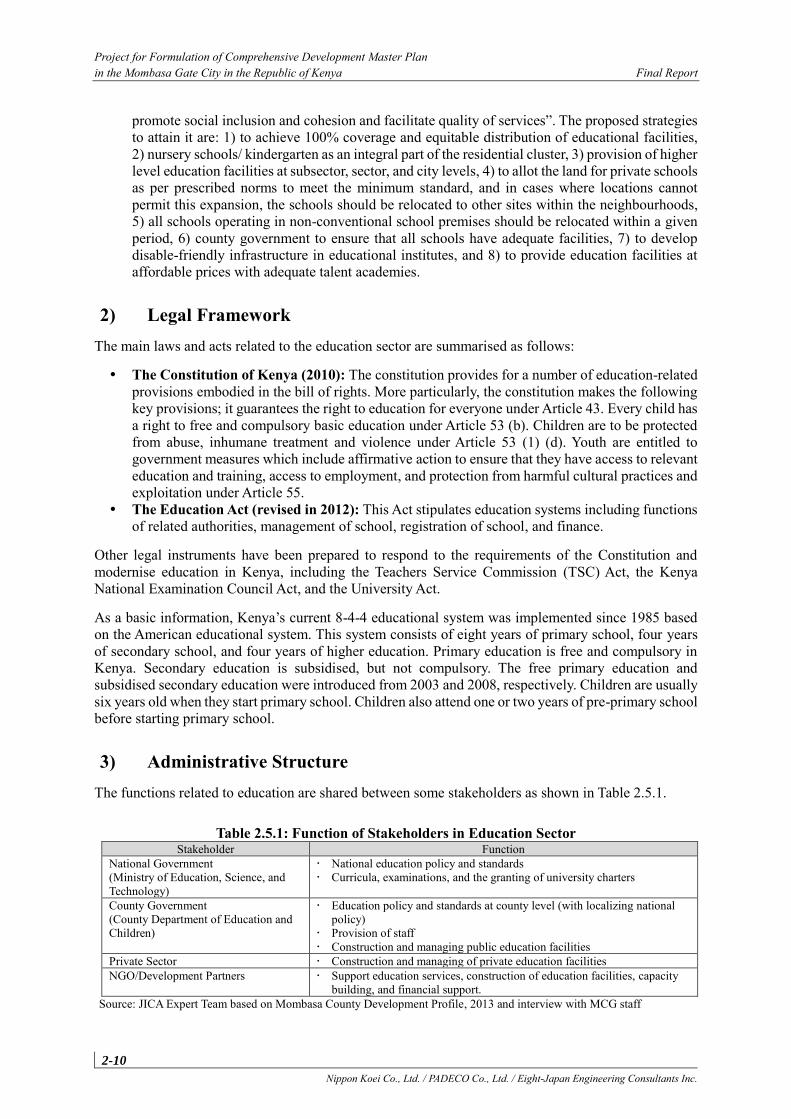
Project for Formulation of Comprehensive Development Master Plan in the Mombasa Gate City in the Republic of Kenya Final Report
2-10 Nippon Koei Co., Ltd. / PADECO Co., Ltd. / Eight-Japan Engineering Consultants Inc.
promote social inclusion and cohesion and facilitate quality of services”. The proposed strategies to attain it are: 1) to achieve 100% coverage and equitable distribution of educational facilities, 2) nursery schools/ kindergarten as an integral part of the residential cluster, 3) provision of higher level education facilities at subsector, sector, and city levels, 4) to allot the land for private schools as per prescribed norms to meet the minimum standard, and in cases where locations cannot permit this expansion, the schools should be relocated to other sites within the neighbourhoods, 5) all schools operating in non-conventional school premises should be relocated within a given period, 6) county government to ensure that all schools have adequate facilities, 7) to develop disable-friendly infrastructure in educational institutes, and 8) to provide education facilities at affordable prices with adequate talent academies.
2) Legal Framework The main laws and acts related to the education sector are summarised as follows:
The Constitution of Kenya (2010): The constitution provides for a number of education-related provisions embodied in the bill of rights. More particularly, the constitution makes the following key provisions; it guarantees the right to education for everyone under Article 43. Every child has a right to free and compulsory basic education under Article 53 (b). Children are to be protected from abuse, inhumane treatment and violence under Article 53 (1) (d). Youth are entitled to government measures which include affirmative action to ensure that they have access to relevant education and training, access to employment, and protection from harmful cultural practices and exploitation under Article 55.
The Education Act (revised in 2012): This Act stipulates education systems including functions of related authorities, management of school, registration of school, and finance.
Other legal instruments have been prepared to respond to the requirements of the Constitution and modernise education in Kenya, including the Teachers Service Commission (TSC) Act, the Kenya National Examination Council Act, and the University Act.
As a basic information, Kenya’s current 8-4-4 educational system was implemented since 1985 based on the American educational system. This system consists of eight years of primary school, four years of secondary school, and four years of higher education. Primary education is free and compulsory in Kenya. Secondary education is subsidised, but not compulsory. The free primary education and subsidised secondary education were introduced from 2003 and 2008, respectively. Children are usually six years old when they start primary school. Children also attend one or two years of pre-primary school before starting primary school.
3) Administrative Structure The functions related to education are shared between some stakeholders as shown in Table 2.5.1.
Table 2.5.1: Function of Stakeholders in Education Sector Stakeholder Function
National Government (Ministry of Education, Science, and Technology)
National education policy and standards Curricula, examinations, and the granting of university charters
County Government (County Department of Education and Children)
Education policy and standards at county level (with localizing national policy)
Provision of staff Construction and managing public education facilities
Private Sector Construction and managing of private education facilities NGO/Development Partners Support education services, construction of education facilities, capacity
building, and financial support. Source: JICA Expert Team based on Mombasa County Development Profile, 2013 and interview with MCG staff
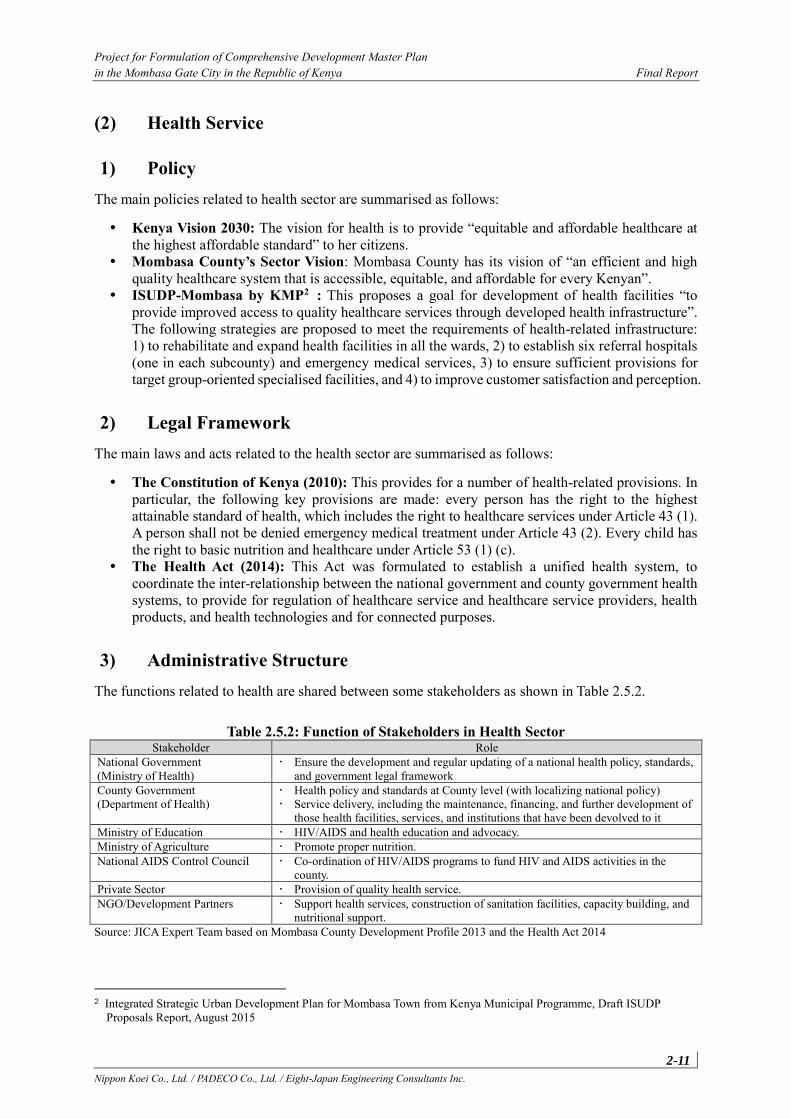
Project for Formulation of Comprehensive Development Master Plan in the Mombasa Gate City in the Republic of Kenya Final Report
2-11 Nippon Koei Co., Ltd. / PADECO Co., Ltd. / Eight-Japan Engineering Consultants Inc.
(2) Health Service
1) Policy The main policies related to health sector are summarised as follows:
Kenya Vision 2030: The vision for health is to provide “equitable and affordable healthcare at the highest affordable standard” to her citizens.
Mombasa County’s Sector Vision: Mombasa County has its vision of “an efficient and high quality healthcare system that is accessible, equitable, and affordable for every Kenyan”.
ISUDP-Mombasa by KMP2 : This proposes a goal for development of health facilities “to provide improved access to quality healthcare services through developed health infrastructure”. The following strategies are proposed to meet the requirements of health-related infrastructure: 1) to rehabilitate and expand health facilities in all the wards, 2) to establish six referral hospitals (one in each subcounty) and emergency medical services, 3) to ensure sufficient provisions for target group-oriented specialised facilities, and 4) to improve customer satisfaction and perception.
2) Legal Framework The main laws and acts related to the health sector are summarised as follows:
The Constitution of Kenya (2010): This provides for a number of health-related provisions. In particular, the following key provisions are made: every person has the right to the highest attainable standard of health, which includes the right to healthcare services under Article 43 (1). A person shall not be denied emergency medical treatment under Article 43 (2). Every child has the right to basic nutrition and healthcare under Article 53 (1) (c).
The Health Act (2014): This Act was formulated to establish a unified health system, to coordinate the inter-relationship between the national government and county government health systems, to provide for regulation of healthcare service and healthcare service providers, health products, and health technologies and for connected purposes.
3) Administrative Structure The functions related to health are shared between some stakeholders as shown in Table 2.5.2.
Table 2.5.2: Function of Stakeholders in Health Sector Stakeholder Role
National Government (Ministry of Health)
Ensure the development and regular updating of a national health policy, standards, and government legal framework
County Government (Department of Health)
Health policy and standards at County level (with localizing national policy) Service delivery, including the maintenance, financing, and further development of
those health facilities, services, and institutions that have been devolved to it Ministry of Education HIV/AIDS and health education and advocacy. Ministry of Agriculture Promote proper nutrition. National AIDS Control Council Co-ordination of HIV/AIDS programs to fund HIV and AIDS activities in the
county. Private Sector Provision of quality health service. NGO/Development Partners Support health services, construction of sanitation facilities, capacity building, and
nutritional support. Source: JICA Expert Team based on Mombasa County Development Profile 2013 and the Health Act 2014
2 Integrated Strategic Urban Development Plan for Mombasa Town from Kenya Municipal Programme, Draft ISUDP
Proposals Report, August 2015
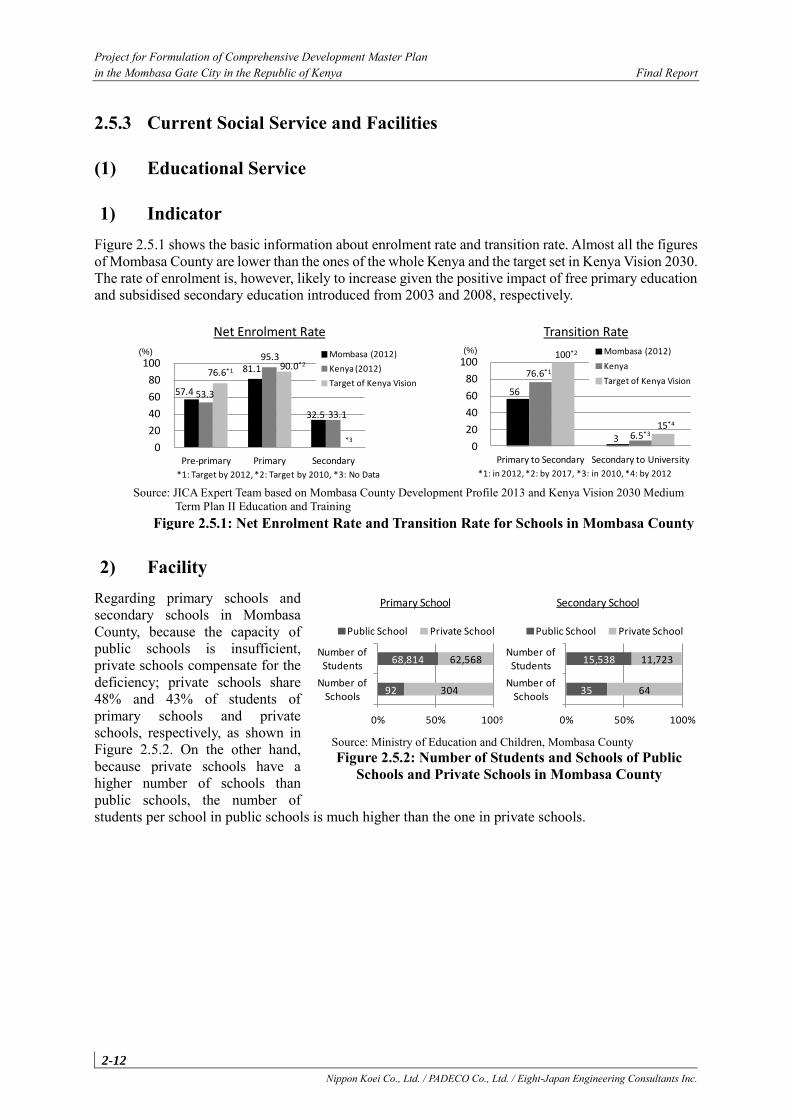
Project for Formulation of Comprehensive Development Master Plan in the Mombasa Gate City in the Republic of Kenya Final Report
2-12 Nippon Koei Co., Ltd. / PADECO Co., Ltd. / Eight-Japan Engineering Consultants Inc.
2.5.3 Current Social Service and Facilities
(1) Educational Service
1) Indicator Figure 2.5.1 shows the basic information about enrolment rate and transition rate. Almost all the figures of Mombasa County are lower than the ones of the whole Kenya and the target set in Kenya Vision 2030. The rate of enrolment is, however, likely to increase given the positive impact of free primary education and subsidised secondary education introduced from 2003 and 2008, respectively.
2) Facility Regarding primary schools and secondary schools in Mombasa County, because the capacity of public schools is insufficient, private schools compensate for the deficiency; private schools share 48% and 43% of students of primary schools and private schools, respectively, as shown in Figure 2.5.2. On the other hand, because private schools have a higher number of schools than public schools, the number of students per school in public schools is much higher than the one in private schools.
57.4
81.1
32.5
53.3
95.3
33.1
76.6*190.0*2
*3
0
20
40
60
80
100
Pre-primary Primary Secondary
Mombasa (2012)
Kenya (2012)
Target of Kenya Vision
*1: Target by 2012, *2: Target by 2010, *3: No Data
(%)
56
3
76.6*1
6.5*3
100*2
15*4
0
20
40
60
80
100
Primary to Secondary Secondary to University
Mombasa (2012)
Kenya
Target of Kenya Vision
*1: in 2012, *2: by 2017, *3: in 2010, *4: by 2012
(%)
Figure 2.5.1: Net Enrolment Rate and Transition Rate for Schools in Mombasa County
Net Enrolment Rate Transition Rate
Source: JICA Expert Team based on Mombasa County Development Profile 2013 and Kenya Vision 2030 Medium Term Plan II Education and Training
92
68,814
304
62,568
0% 50% 100%
Number of Schools
Number of Students
Public School Private School
Primary School
Source: Ministry of Education and Children, Mombasa County Figure 2.5.2: Number of Students and Schools of Public
Schools and Private Schools in Mombasa County
35
15,538
64
11,723
0% 50% 100%
Number of Schools
Number of Students
Public School Private School
Secondary School
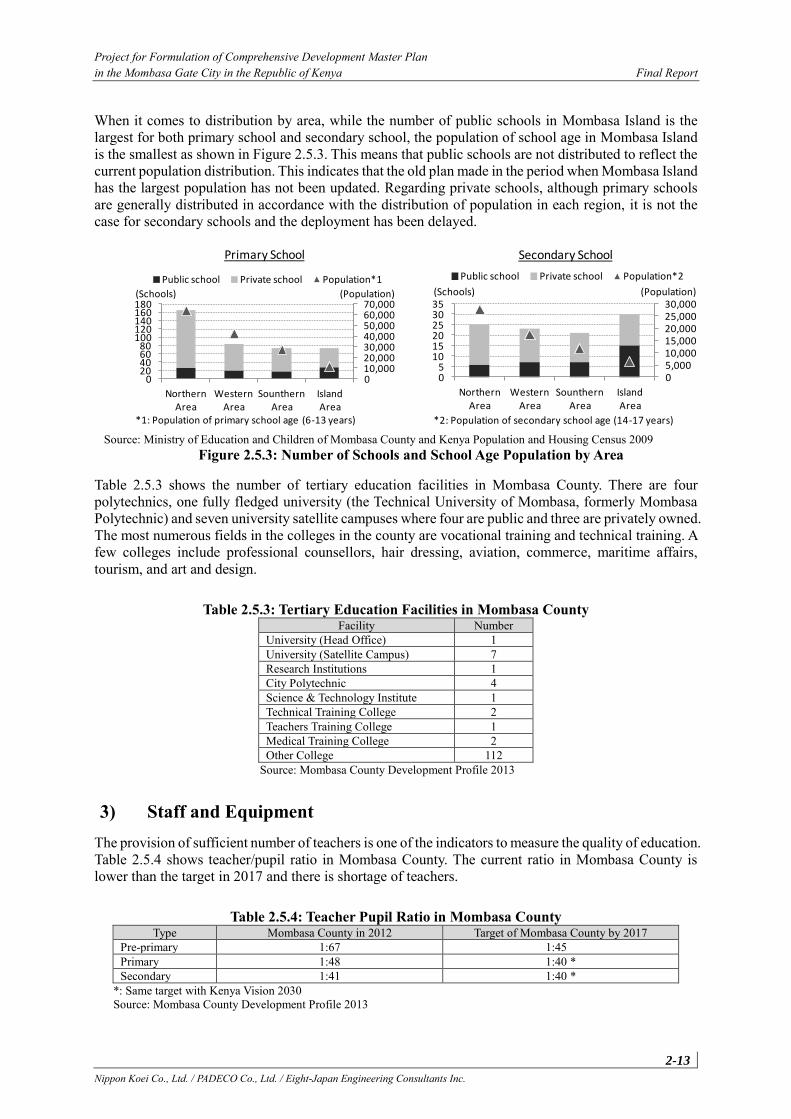
Project for Formulation of Comprehensive Development Master Plan in the Mombasa Gate City in the Republic of Kenya Final Report
2-13 Nippon Koei Co., Ltd. / PADECO Co., Ltd. / Eight-Japan Engineering Consultants Inc.
When it comes to distribution by area, while the number of public schools in Mombasa Island is the largest for both primary school and secondary school, the population of school age in Mombasa Island is the smallest as shown in Figure 2.5.3. This means that public schools are not distributed to reflect the current population distribution. This indicates that the old plan made in the period when Mombasa Island has the largest population has not been updated. Regarding private schools, although primary schools are generally distributed in accordance with the distribution of population in each region, it is not the case for secondary schools and the deployment has been delayed.
Table 2.5.3 shows the number of tertiary education facilities in Mombasa County. There are four polytechnics, one fully fledged university (the Technical University of Mombasa, formerly Mombasa Polytechnic) and seven university satellite campuses where four are public and three are privately owned. The most numerous fields in the colleges in the county are vocational training and technical training. A few colleges include professional counsellors, hair dressing, aviation, commerce, maritime affairs, tourism, and art and design.
Table 2.5.3: Tertiary Education Facilities in Mombasa County Facility Number
University (Head Office) 1 University (Satellite Campus) 7 Research Institutions 1 City Polytechnic 4 Science & Technology Institute 1 Technical Training College 2 Teachers Training College 1 Medical Training College 2 Other College 112
Source: Mombasa County Development Profile 2013
3) Staff and Equipment The provision of sufficient number of teachers is one of the indicators to measure the quality of education. Table 2.5.4 shows teacher/pupil ratio in Mombasa County. The current ratio in Mombasa County is lower than the target in 2017 and there is shortage of teachers.
Table 2.5.4: Teacher Pupil Ratio in Mombasa County Type Mombasa County in 2012 Target of Mombasa County by 2017
Pre-primary 1:67 1:45 * Primary 1:48 1:40 * Secondary 1:41 1:40 *
*: Same target with Kenya Vision 2030 Source: Mombasa County Development Profile 2013
Source: Ministry of Education and Children of Mombasa County and Kenya Population and Housing Census 2009 Figure 2.5.3: Number of Schools and School Age Population by Area
010,00020,00030,00040,00050,00060,00070,000
020406080
100120140160180
Northern Area
Western Area
Sounthern Area
Island Area
Public school Private school Population*1
*1: Population of primary school age (6-13 years)
Primary School
(Schools) (Population)
05,00010,00015,00020,00025,00030,000
05
101520253035
Northern Area
Western Area
Sounthern Area
Island Area
Public school Private school Population*2
Secondary School
*2: Population of secondary school age (14-17 years)
(Schools) (Population)
Project for Formulation of Comprehensive Development Master Plan in the Mombasa Gate City in the Republic of Kenya Final Report
2-14 Nippon Koei Co., Ltd. / PADECO Co., Ltd. / Eight-Japan Engineering Consultants Inc.
Public and private schools face different situation; public schools are facing over enrolment and therefore, they are suffering shortage of teachers, education facilities including classrooms, desks, and laboratories. As for private schools, although they have basically higher teacher/pupil ratio than public ones, the size of some schools is very small and their education service focuses only on study without any other activities.
(2) Health Service
1) Indicator Table 2.5.5 shows the basic health status in Mombasa County. The infant mortality rate and maternal mortality rate in Mombasa County are better than the national level, although life expectancy, under-five mortality rate, and HIV prevalence are worse than the national level.
The five most prevalent diseases in Mombasa County are malaria/fever (48%), flu (18.7%), stomach ache (5.2%), respiratory diseases (upper: 0.7%, lower: 3.3%) and diarrhea (2.3%).
Table 2.5.5: Health Status in Mombasa County Indicator Mombasa County National
Life expectancy (years) Male:57, Female: 56 Male:58, Female: 61 Infant mortality rate (/1,000) 12 39 * Under-five mortality rate (/1,000) 87 52 * Maternal mortality rate (/100,000) 223 485 HIV prevalence (%) 11.1 5.6
Note: Data with “*” is in 2014 and the others are in 2012. Source: Mombasa County Development Profile 2013, Kenya Demographic and Health Survey 2014, and Kenya
AIDS Response Progress Report 2014
2) Facility There are 23 hospitals and 260 primary health facilities in Mombasa County (Table 2.5.6). The largest hospital in the county is Coast Province General Hospital, which is a referral facility serving the entire coast region and located in Mombasa Island. Other notable private hospitals include the Aga Khan Hospital, the Mombasa Hospital, and the Pandya Memorial Hospital. Other lower level hospitals are the Tudor District Hospital and the Port Reitz District Hospital.
When it comes to distribution by area, however, there is a bias in the number of health infrastructure to the population; Whilst Mvita Subcounty has only 15% of the population, the subcounty has 30% of primary health facilities, 61% of hospitals, and 75% of beds in Mombasa County (Figure 2.5.4).
It indicates that the Mvita Subcounty works as a core area of major medical functions, whilst the other subcounties have lower health facilities. Actually, some subcounties have few or no hospitals. Regarding emergency medical service, there are only four hospitals with ambulance in Mombasa County, namely: Coast Provincial General Hospital, Tudor District Hospital, Port Reitz District Hospital, and Likoni District Hospital. There is no hospital with ambulance in the northern area.
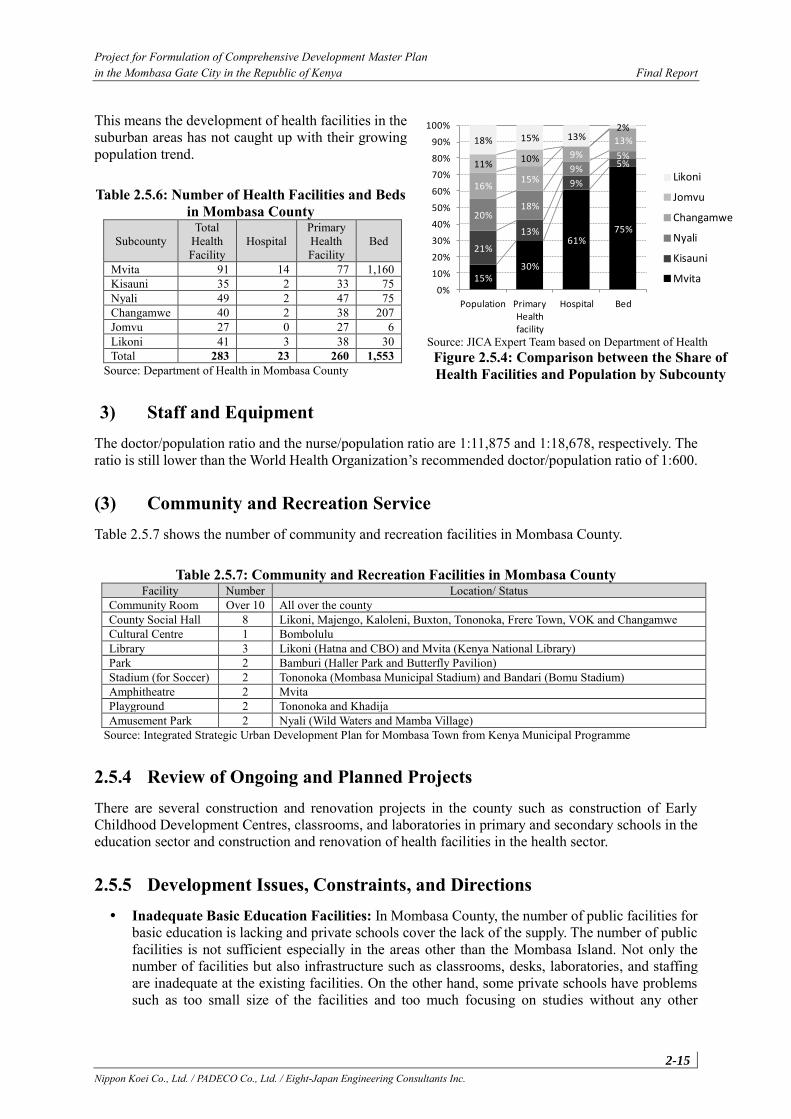
Project for Formulation of Comprehensive Development Master Plan in the Mombasa Gate City in the Republic of Kenya Final Report
2-15 Nippon Koei Co., Ltd. / PADECO Co., Ltd. / Eight-Japan Engineering Consultants Inc.
This means the development of health facilities in the suburban areas has not caught up with their growing population trend.
Table 2.5.6: Number of Health Facilities and Beds in Mombasa County
Subcounty Total
Health Facility
Hospital Primary Health Facility
Bed
Mvita 91 14 77 1,160 Kisauni 35 2 33 75 Nyali 49 2 47 75 Changamwe 40 2 38 207 Jomvu 27 0 27 6 Likoni 41 3 38 30 Total 283 23 260 1,553
Source: Department of Health in Mombasa County
3) Staff and Equipment The doctor/population ratio and the nurse/population ratio are 1:11,875 and 1:18,678, respectively. The ratio is still lower than the World Health Organization’s recommended doctor/population ratio of 1:600.
(3) Community and Recreation Service Table 2.5.7 shows the number of community and recreation facilities in Mombasa County.
Table 2.5.7: Community and Recreation Facilities in Mombasa County Facility Number Location/ Status
Community Room Over 10 All over the county County Social Hall 8 Likoni, Majengo, Kaloleni, Buxton, Tononoka, Frere Town, VOK and Changamwe Cultural Centre 1 Bombolulu Library 3 Likoni (Hatna and CBO) and Mvita (Kenya National Library) Park 2 Bamburi (Haller Park and Butterfly Pavilion) Stadium (for Soccer) 2 Tononoka (Mombasa Municipal Stadium) and Bandari (Bomu Stadium) Amphitheatre 2 Mvita Playground 2 Tononoka and Khadija Amusement Park 2 Nyali (Wild Waters and Mamba Village)
Source: Integrated Strategic Urban Development Plan for Mombasa Town from Kenya Municipal Programme
2.5.4 Review of Ongoing and Planned Projects There are several construction and renovation projects in the county such as construction of Early Childhood Development Centres, classrooms, and laboratories in primary and secondary schools in the education sector and construction and renovation of health facilities in the health sector.
2.5.5 Development Issues, Constraints, and Directions Inadequate Basic Education Facilities: In Mombasa County, the number of public facilities for
basic education is lacking and private schools cover the lack of the supply. The number of public facilities is not sufficient especially in the areas other than the Mombasa Island. Not only the number of facilities but also infrastructure such as classrooms, desks, laboratories, and staffing are inadequate at the existing facilities. On the other hand, some private schools have problems such as too small size of the facilities and too much focusing on studies without any other
15%30%
61%75%
21%
13%
9%
5%
20%18%
9%
5%
16%15%
9%
13%
11%10%
18% 15% 13%2%
0%
10%
20%
30%
40%
50%
60%
70%
80%
90%
100%
Population Primary Health facility
Hospital Bed
Likoni
Jomvu
Changamwe
Nyali
Kisauni
Mvita
Source: JICA Expert Team based on Department of Health Figure 2.5.4: Comparison between the Share of Health Facilities and Population by Subcounty
Project for Formulation of Comprehensive Development Master Plan in the Mombasa Gate City in the Republic of Kenya Final Report
2-16 Nippon Koei Co., Ltd. / PADECO Co., Ltd. / Eight-Japan Engineering Consultants Inc.
activities. Considering the growth of population in the future, it is difficult to increase the share of students of public schools, since the capacity of existing facilities cannot anymore accommodate new students and it will be difficult to get enough budget to construct new facilities and expand existing facilities. Therefore, in addition to the development of public schools, it is necessary to make effective use of the resources of the private sector by ensuring the quality of education and therefore, the county should focus on how to make regulation and management of private schools.
Connection between Education and Labour Market: Since both visions of the education sector of Kenya Vision 2030 and Mombasa County place great emphasis on the need to create entrepreneurial skills and competencies and the link between education and labour market, there is also a need of more higher education and training courses which connect students and trainees directly with the industries the county plans to focus on such as tourism, port and shipping, and industries.
Inadequate Health Service Delivery Points: Whilst the county has emphasis on efficiency, high quality, accessibility, equitability, and affordability of healthcare service, the number of facilities is inadequate in relation to the total population of the county. Furthermore, the suburban areas other than Mombasa Island have larger degree of shortages. Not only the number but also the quality is not developed especially in the suburban area. To attain the vision and improve such situation, firstly, the county should establish referral hospitals and emergency medical services in each subcounty.
2.6 Housing Conditions
2.6.1 Overview and Current Situation Housing is critical in people’s lives and the Constitution of Kenya guarantees every person in Kenya the right to accessible and adequate housing. The housing sector in Mombasa County is characterised by the spread of residential area to northern, southern, and western mainland, inadequacy of affordable and decent housing especially for lower income, dominant share of housing provider by the private sector, little use of construction loans, and inadequate management of development approval system.
This section overviews the current situation of the housing sector including policy, legal framework, administrative structure, condition of facilities and services, and planned projects. Based on the situation, issues and directions are suggested.
2.6.2 Review of Policy, Legal Framework, and Administrative Structure
(1) Policy The main policies related to the housing sector are summarised as follows:
National Housing Policy (2004): This policy was formulated to facilitate the provision of adequate shelter and a healthy living environment at affordable cost to all socio-economic groups in Kenya. This goal is based on Kenya's situation where demand for housing far outstrips the supply. The policy inputs about housing include: i) land use planning and management, ii) infrastructure, iii) building materials and research, iv) financial resources for housing, v) management, and vi) legislative and institutional framework.
Kenya Vision 2030: The vision for housing is “an adequately and decently-housed nation in a sustainable environment”. The strategies to attain the vision are: i) to facilitate the development and access to affordable and adequate housing, ii) to enhance access to adequate finance for developers and buyers, and iii) to reform the legislative, institutional, and regulatory framework.
Project for Formulation of Comprehensive Development Master Plan in the Mombasa Gate City in the Republic of Kenya Final Report
2-17 Nippon Koei Co., Ltd. / PADECO Co., Ltd. / Eight-Japan Engineering Consultants Inc.
Mombasa County’s Sector Vision: Housing is one of the subsectors in the environmental protection, water, and housing sector. The sector’s vision is “sustainable access to adequate water and housing in a clean and secure environment”. In the housing subsector, the county’s role is set so as to ensure decent housing for all by training the community on appropriate building materials, creating public awareness on the Rent Restriction Act, and maintenance of government houses.
ISUDP-Mombasa by KMP3 : The policy of the plan for housing is to ensure shelter for all. According to the projected population growth, the number of residential units required in 2035 is estimated to be double that of the existing units in 2015 and it is estimated that about 329,000 units shall be added. To accommodate the additional demand, the plan proposes to develop greenfield extension area to accommodate 65% of the additional housing demand and 35% will be accommodated as brownfield in fill densification. It proposed that the new development area would be mixed use, high density, and medium and high rise. Considering the family income and affordability of the urban poor, the plan envisages providing affordable dwelling units to the urban poor population; out of the total housing stock, it proposes 25% housing for economically weaker sections in addition to 35% for low-income group people.
(2) Legal Framework The main laws and acts related to housing sector are summarised as follows:
The Constitution of Kenya (2010): Article 43 guarantees every person in Kenya the right to adequate and accessible housing and to reasonable standards of sanitation and the Constitution gives the national government the function to formulate national housing policy and county government the function of county planning and housing development.
The Housing Act (revised in 2012): The objective of the Act is to provide for loans and grants from public monies for the construction of dwellings and establish a housing fund and a housing board. Under the objective, the Act gives the National Housing Corporation the power to lend or grant money to any local authority and to make loans to any company, society, or individual person.
The Rent Restriction Act (revised in 2012): This Act provides for restricting the increase of rent, the right to possession, and the exaction of premiums, and for fixing standard rents, in relation to dwelling houses, and for other purposes incidental to or connected with the relationship of landlord and tenant of a dwelling house.
The Sectional Properties Act (1987): It provides for the ownership of property horizontally and the common units in those areas being held in common by the owners.
The Registered Lands Act (revised in 2010): This Act provides registration system of titles to land and give effect to the principles and objects of devolved government in land registration.
(3) Administrative Structure The functions related to housing are shared between some stakeholders as shown in Table 2.6.1.
Table 2.6.1: Function of Stakeholders in Housing Sector Stakeholder Role
National Government (Ministry of Land, Housing, and Urban Development)
Formulation of national housing policies and legislation Improving the living environment in slums and informal settlements Promotion of low cost housing development Facilitation of housing finance
National Housing Corporation Implementation of the national housing policies and programs County Government Formulation of county housing and settlement policies and legislations
Planning and construction of housing in County
3 Integrated Strategic Urban Development Plan for Mombasa Town from Kenya Municipal Programme, Draft ISUDP
Proposal Report, August 2015
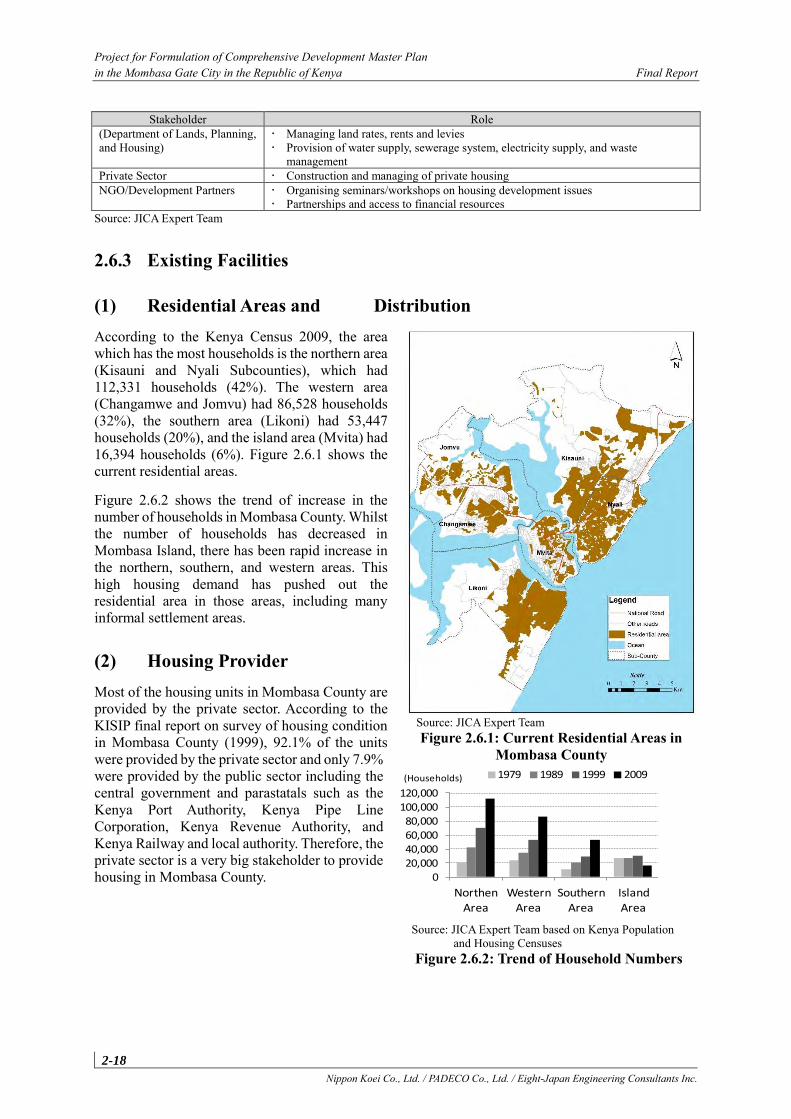
Project for Formulation of Comprehensive Development Master Plan in the Mombasa Gate City in the Republic of Kenya Final Report
2-18 Nippon Koei Co., Ltd. / PADECO Co., Ltd. / Eight-Japan Engineering Consultants Inc.
Stakeholder Role (Department of Lands, Planning, and Housing)
Managing land rates, rents and levies Provision of water supply, sewerage system, electricity supply, and waste
management Private Sector Construction and managing of private housing NGO/Development Partners Organising seminars/workshops on housing development issues
Partnerships and access to financial resources Source: JICA Expert Team
2.6.3 Existing Facilities
(1) Residential Areas and Distribution According to the Kenya Census 2009, the area which has the most households is the northern area (Kisauni and Nyali Subcounties), which had 112,331 households (42%). The western area (Changamwe and Jomvu) had 86,528 households (32%), the southern area (Likoni) had 53,447 households (20%), and the island area (Mvita) had 16,394 households (6%). Figure 2.6.1 shows the current residential areas.
Figure 2.6.2 shows the trend of increase in the number of households in Mombasa County. Whilst the number of households has decreased in Mombasa Island, there has been rapid increase in the northern, southern, and western areas. This high housing demand has pushed out the residential area in those areas, including many informal settlement areas.
(2) Housing Provider Most of the housing units in Mombasa County are provided by the private sector. According to the KISIP final report on survey of housing condition in Mombasa County (1999), 92.1% of the units were provided by the private sector and only 7.9% were provided by the public sector including the central government and parastatals such as the Kenya Port Authority, Kenya Pipe Line Corporation, Kenya Revenue Authority, and Kenya Railway and local authority. Therefore, the private sector is a very big stakeholder to provide housing in Mombasa County. 0
20,00040,00060,00080,000
100,000120,000
Northen
Area
Western
Area
Southern
Area
Island
Area
1979 1989 1999 2009(Households)
Source: JICA Expert Team based on Kenya Population and Housing Censuses
Figure 2.6.2: Trend of Household Numbers
Source: JICA Expert Team Figure 2.6.1: Current Residential Areas in
Mombasa County
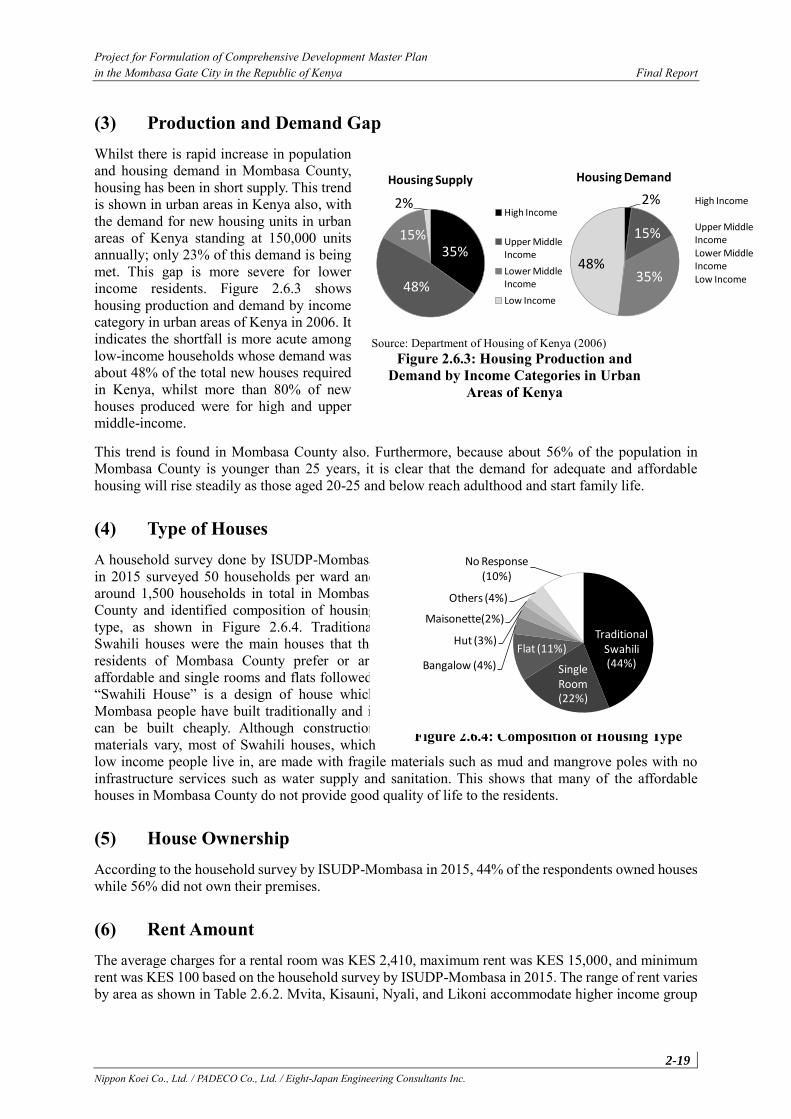
Project for Formulation of Comprehensive Development Master Plan in the Mombasa Gate City in the Republic of Kenya Final Report
2-19 Nippon Koei Co., Ltd. / PADECO Co., Ltd. / Eight-Japan Engineering Consultants Inc.
(3) Production and Demand Gap Whilst there is rapid increase in population and housing demand in Mombasa County, housing has been in short supply. This trend is shown in urban areas in Kenya also, with the demand for new housing units in urban areas of Kenya standing at 150,000 units annually; only 23% of this demand is being met. This gap is more severe for lower income residents. Figure 2.6.3 shows housing production and demand by income category in urban areas of Kenya in 2006. It indicates the shortfall is more acute among low-income households whose demand was about 48% of the total new houses required in Kenya, whilst more than 80% of new houses produced were for high and upper middle-income.
This trend is found in Mombasa County also. Furthermore, because about 56% of the population in Mombasa County is younger than 25 years, it is clear that the demand for adequate and affordable housing will rise steadily as those aged 20-25 and below reach adulthood and start family life.
(4) Type of Houses A household survey done by ISUDP-Mombasa in 2015 surveyed 50 households per ward and around 1,500 households in total in Mombasa County and identified composition of housing type, as shown in Figure 2.6.4. Traditional Swahili houses were the main houses that the residents of Mombasa County prefer or are affordable and single rooms and flats followed. “Swahili House” is a design of house which Mombasa people have built traditionally and it can be built cheaply. Although construction materials vary, most of Swahili houses, which low income people live in, are made with fragile materials such as mud and mangrove poles with no infrastructure services such as water supply and sanitation. This shows that many of the affordable houses in Mombasa County do not provide good quality of life to the residents.
(5) House Ownership According to the household survey by ISUDP-Mombasa in 2015, 44% of the respondents owned houses while 56% did not own their premises.
(6) Rent Amount The average charges for a rental room was KES 2,410, maximum rent was KES 15,000, and minimum rent was KES 100 based on the household survey by ISUDP-Mombasa in 2015. The range of rent varies by area as shown in Table 2.6.2. Mvita, Kisauni, Nyali, and Likoni accommodate higher income group
Source: ISUDP-Mombasa Household Survey Data (2015) Figure 2.6.4: Composition of Housing Type
Traditional Swahili (44%)Single
Room (22%)
Flat (11%)
Bangalow (4%)
Hut (3%)
Maisonette(2%)
Others (4%)
No Response (10%)
Source: Department of Housing of Kenya (2006) Figure 2.6.3: Housing Production and
Demand by Income Categories in Urban Areas of Kenya
2%
15%
35%48%
High Income
Upper Middle IncomeLower Middle IncomeLow Income
Housing Demand
35%
48%
15%
2%High Income
Upper Middle Income
Lower Middle Income
Low Income
Housing Supply
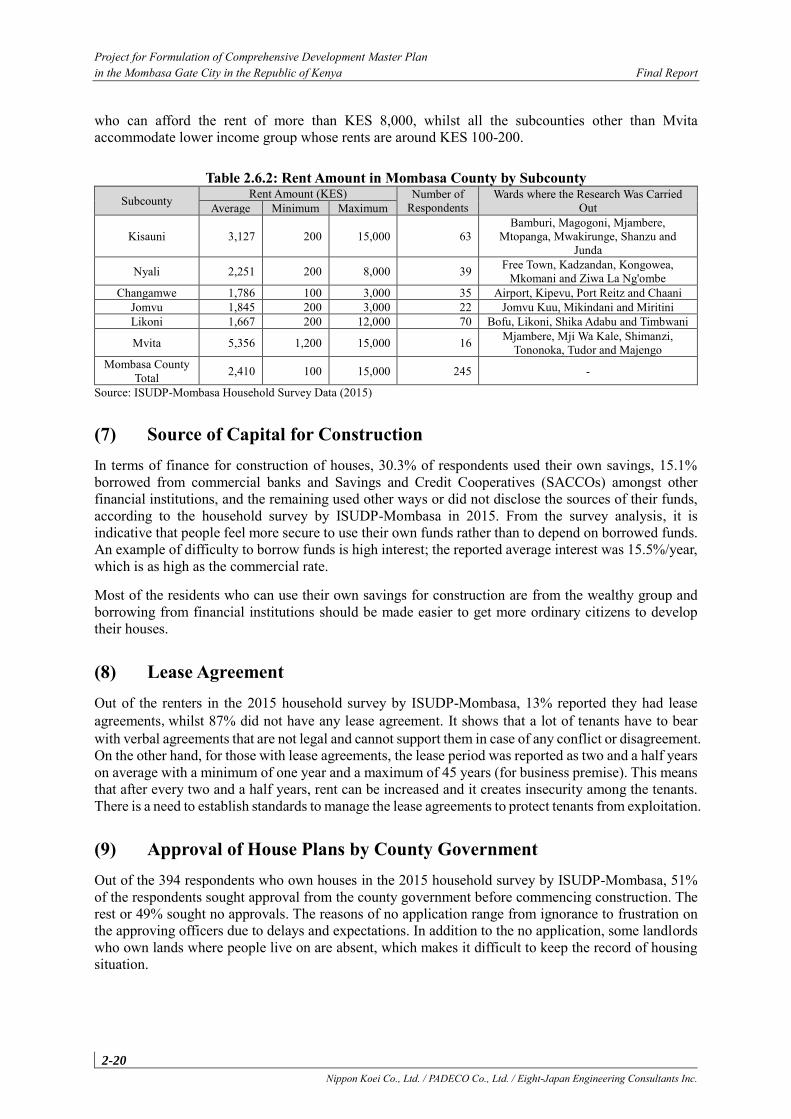
Project for Formulation of Comprehensive Development Master Plan in the Mombasa Gate City in the Republic of Kenya Final Report
2-20 Nippon Koei Co., Ltd. / PADECO Co., Ltd. / Eight-Japan Engineering Consultants Inc.
who can afford the rent of more than KES 8,000, whilst all the subcounties other than Mvita accommodate lower income group whose rents are around KES 100-200.
Table 2.6.2: Rent Amount in Mombasa County by Subcounty Subcounty Rent Amount (KES) Number of
Respondents Wards where the Research Was Carried
Out Average Minimum Maximum
Kisauni 3,127 200 15,000 63 Bamburi, Magogoni, Mjambere,
Mtopanga, Mwakirunge, Shanzu and Junda
Nyali 2,251 200 8,000 39 Free Town, Kadzandan, Kongowea, Mkomani and Ziwa La Ng'ombe
Changamwe 1,786 100 3,000 35 Airport, Kipevu, Port Reitz and Chaani Jomvu 1,845 200 3,000 22 Jomvu Kuu, Mikindani and Miritini Likoni 1,667 200 12,000 70 Bofu, Likoni, Shika Adabu and Timbwani
Mvita 5,356 1,200 15,000 16 Mjambere, Mji Wa Kale, Shimanzi, Tononoka, Tudor and Majengo
Mombasa County Total 2,410 100 15,000 245 -
Source: ISUDP-Mombasa Household Survey Data (2015)
(7) Source of Capital for Construction In terms of finance for construction of houses, 30.3% of respondents used their own savings, 15.1% borrowed from commercial banks and Savings and Credit Cooperatives (SACCOs) amongst other financial institutions, and the remaining used other ways or did not disclose the sources of their funds, according to the household survey by ISUDP-Mombasa in 2015. From the survey analysis, it is indicative that people feel more secure to use their own funds rather than to depend on borrowed funds. An example of difficulty to borrow funds is high interest; the reported average interest was 15.5%/year, which is as high as the commercial rate.
Most of the residents who can use their own savings for construction are from the wealthy group and borrowing from financial institutions should be made easier to get more ordinary citizens to develop their houses.
(8) Lease Agreement Out of the renters in the 2015 household survey by ISUDP-Mombasa, 13% reported they had lease agreements,whilst 87% did not have any lease agreement. It shows that a lot of tenants have to bear with verbal agreements that are not legal and cannot support them in case of any conflict or disagreement. On the other hand, for those with lease agreements, the lease period was reported as two and a half years on average with a minimum of one year and a maximum of 45 years (for business premise). This means that after every two and a half years, rent can be increased and it creates insecurity among the tenants. There is a need to establish standards to manage the lease agreements to protect tenants from exploitation.
(9) Approval of House Plans by County Government Out of the 394 respondents who own houses in the 2015 household survey by ISUDP-Mombasa, 51% of the respondents sought approval from the county government before commencing construction. The rest or 49% sought no approvals. The reasons of no application range from ignorance to frustration on the approving officers due to delays and expectations. In addition to the no application, some landlords who own lands where people live on are absent, which makes it difficult to keep the record of housing situation.
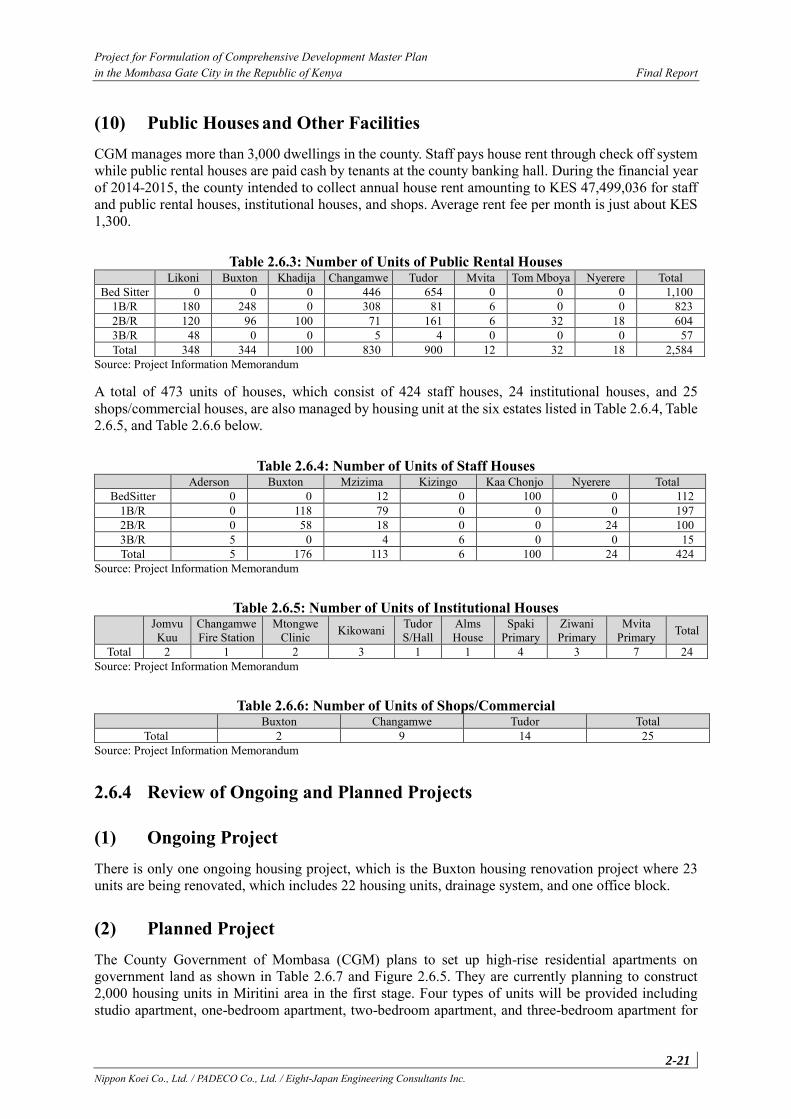
Project for Formulation of Comprehensive Development Master Plan in the Mombasa Gate City in the Republic of Kenya Final Report
2-21 Nippon Koei Co., Ltd. / PADECO Co., Ltd. / Eight-Japan Engineering Consultants Inc.
(10) Public Houses and Other Facilities CGM manages more than 3,000 dwellings in the county. Staff pays house rent through check off system while public rental houses are paid cash by tenants at the county banking hall. During the financial year of 2014-2015, the county intended to collect annual house rent amounting to KES 47,499,036 for staff and public rental houses, institutional houses, and shops. Average rent fee per month is just about KES 1,300.
Table 2.6.3: Number of Units of Public Rental Houses Likoni Buxton Khadija Changamwe Tudor Mvita Tom Mboya Nyerere Total
Bed Sitter 0 0 0 446 654 0 0 0 1,100 1B/R 180 248 0 308 81 6 0 0 823 2B/R 120 96 100 71 161 6 32 18 604 3B/R 48 0 0 5 4 0 0 0 57 Total 348 344 100 830 900 12 32 18 2,584
Source: Project Information Memorandum
A total of 473 units of houses, which consist of 424 staff houses, 24 institutional houses, and 25 shops/commercial houses, are also managed by housing unit at the six estates listed in Table 2.6.4, Table 2.6.5, and Table 2.6.6 below.
Table 2.6.4: Number of Units of Staff Houses Aderson Buxton Mzizima Kizingo Kaa Chonjo Nyerere Total
BedSitter 0 0 12 0 100 0 112 1B/R 0 118 79 0 0 0 197 2B/R 0 58 18 0 0 24 100 3B/R 5 0 4 6 0 0 15 Total 5 176 113 6 100 24 424
Source: Project Information Memorandum
Table 2.6.5: Number of Units of Institutional Houses Jomvu
Kuu Changamwe Fire Station
Mtongwe Clinic Kikowani Tudor
S/Hall Alms House
Spaki Primary
Ziwani Primary
Mvita Primary Total
Total 2 1 2 3 1 1 4 3 7 24 Source: Project Information Memorandum
Table 2.6.6: Number of Units of Shops/Commercial Buxton Changamwe Tudor Total
Total 2 9 14 25 Source: Project Information Memorandum
2.6.4 Review of Ongoing and Planned Projects
(1) Ongoing Project There is only one ongoing housing project, which is the Buxton housing renovation project where 23 units are being renovated, which includes 22 housing units, drainage system, and one office block.
(2) Planned Project The County Government of Mombasa (CGM) plans to set up high-rise residential apartments on government land as shown in Table 2.6.7 and Figure 2.6.5. They are currently planning to construct 2,000 housing units in Miritini area in the first stage. Four types of units will be provided including studio apartment, one-bedroom apartment, two-bedroom apartment, and three-bedroom apartment for
Project for Formulation of Comprehensive Development Master Plan in the Mombasa Gate City in the Republic of Kenya Final Report
2-22 Nippon Koei Co., Ltd. / PADECO Co., Ltd. / Eight-Japan Engineering Consultants Inc.
low to high income. The site will include not only residential zone, but also commercial zone, industrial zone, and institutions and recreation zone including hospitals, schools, and parks. Although the intended beneficiary of the Miritini housing units are the county government staff, this proposed housing scheme will be developed for the next housing projects for the public people in Mombasa County. Other probable areas where such projects are planned are Khadija, Changamwe, Mzizima, and Tudor Estate.
Table 2.6.7: Planned CGM Housing Projects
Source: Project Information Memorandum
Source: ISUDP-Mombasa Draft Report
Figure 2.6.5: Location of County Government Land where Housing Project is Planned
2.6.5 Development Issues, Constraints, and Directions Shortage of Affordable and Quality Housing, Especially for Lower Income Households:
Affordable and quality housing is in short supply, especially for lower income households. Since the predominant housing provider is the private sector and the county government does not have enough budget to provide housing to cover the population, it is key to promote private sector dynamism and the county government should support developing housing especially for lower income groups because the private sector benefits more easily from higher incomes. To promote the private sector’s supply and to make use of government funds efficiently, the main measures the county government should carry out are proposed as follows:
Public Private Partnership for Housing Supply: There are some government lands in the county and therefore the most promising approach is the partnership in which the county
Estate acre ha fl Studio 1B/R 2B/R 3B/RTotalUnit
Approx.Total Pop
Pop den(ha)
Lot 1 KHADIJA 18 7.3 15 256 1,024 1,408 1,536 4,224 12,672 1,740
Lot 2 MIRITINI 179 72.4 12 0 1,344 2,352 576 4,272 12,048 166Lot 3 SHIMO LA TEWA 523 211.7 - 0 0 0 0Lot 4 CHANGAMWE 32 12.9 15 446 660 960 1,080 3,146 8,966 692Lot 5 TUDOR 21 8.5 17 600 760 1,664 896 3,920 10,696 1,259Lot 6 MZIZIMA 16 6.5 12 0 192 336 288 816 2,544 393Lot 7 BUXTON 14 5.7 - 0 0 0 0Lot 8 LIKONI 20 8.1 15 1,440 1,440 1,320 1,320 5,520 13,560 1,675Lot 9 NYERERE
823 333.1 2,742 5,420 8,040 5,696 21,898 60,486
Project for Formulation of Comprehensive Development Master Plan in the Mombasa Gate City in the Republic of Kenya Final Report
2-23 Nippon Koei Co., Ltd. / PADECO Co., Ltd. / Eight-Japan Engineering Consultants Inc.
government provides the lands and promotes the private sector to build housing and necessary facilities including units for lower income groups.
Developing Infrastructures for Residential Areas Developed by Private Developers: The county government should develop infrastructures including access roads, water supply, and sewerage system for the private lands if the private developer meets government requests, for example, to include units not only for higher income, but also for lower income groups.
Inadequate Management of Development Approval System: Mombasa County has witnessed growth of unplanned settlements, which are characterised as development without a plan. This is a result of inadequate management of development approval system; according to a survey, as much as half of the respondents who own houses did not seek approvals to the county government before commencing construction. Some landlords have agreements with tenants without validation for change of user. As a result, many housing estates have come up without access roads, proper drainage systems, water and provisions for social amenities such as schools, playgrounds, and recreational facilities. The current system should be improved so that the county government can make adequate infrastructure plans in accordance with the actual situation of population distribution.
2.7 Tourism and Heritage
2.7.1 Overview Kenya Vision 2030 has identified the tourism sector as one of the six economic pillars which is expected to deliver 10% economic growth rate per annum and determined its vision “to be among the top ten long-haul tourist destinations globally”. In Africa, South Africa and Egypt are the leading long-haul destinations accounting for 14 million and 9.5 million tourists in 2013, respectively. On the other hand, Kenya received 1.5 million in 2013, although it targeted to achieve 3 million in 2012. It was even lower than Mozambique, whose international arrivals were almost 2 million in 2013. It declined to 1.35 million in 2014 due to security issues, adverse travel advisories, and Ebola spread in Africa. Similarly, international arrivals in Moi International Airport in Mombasa (MIAM) decreased from 190,000 in 2013 to 118,000 in 2014.
Kenya has abundant tourism resources and is famous for its national parks and wildlife. In addition to her wildlife, Mombasa County and surrounding areas are originally famous for beautiful beaches, marine resources, and activities. The United Nations Educational, Scientific, and Cultural Organization (UNESCO) registered six world heritage sites in Kenya, namely, three cultural and three natural sites. The three cultural world heritage sites are located along the coastal region. One is Lamu Old Town, the other is Fort Jesus in Mombasa County, and the rest is Sacred Mijikenda Kaya Forests which consist of 11 separate forest sites spread over some 200 km along the coast. Some of them are located around Mombasa County such as Kilifi and Kwale counties. Consequently, Mombasa County and surrounding areas are endowed with diversified tourism resources such as natural, cultural, tangible, and intangible resources. However, it has not been well utilised to enhance the tourism sector and contribute to the economic growth in Mombasa County as well as Kenya.
2.7.2 Current Situation of Tourism Sector in Mombasa County Tourism has an economic ripple effect. It has become widely recognised through the decline of the economy such as in the agricultural and fishery sectors as side effects of the sharp decline of tourism in Mombasa County.
In order to fill in the gap caused by the decline of international arrivals in Mombasa County in 2012, the government adopted the policy of promoting domestic tourism, especially holding conferences in hotels, focusing on the coastal region. In addition to this, another policy allowed all corporate and business
Project for Formulation of Comprehensive Development Master Plan in the Mombasa Gate City in the Republic of Kenya Final Report
2-24 Nippon Koei Co., Ltd. / PADECO Co., Ltd. / Eight-Japan Engineering Consultants Inc.
entities to pay vacation expenses for their staffs who wish to go for holidays in the country and deduct such expenditures from their institution's taxes. Kenyans have emerged and recognised as potential market as the result of the abovementioned newly taken strategies to promote domestic tourism.
Observing the potential of regional tourism, the policy to allow passing borders with national ID amongst Kenya, Rwanda, and Uganda has been agreed and started operation. Mombasa County can be one of the most attractive destinations for the people from landlocked countries because of its white sandy beach and marine activities. Wedding and honeymoon market can also be investigated. Moreover, single visa policy has taken effect amongst Kenya, Rwanda, and Uganda. It allows international tourists to travel to these three countries with a single visa. It enables tour operators to develop new tourism products, combining beach with wide range of wildlife including gorillas.
The process of devolution has also commenced. Previously, the Kenya Tourism Board (KTB) took responsibility to promote Kenya as a whole, but not specific to the coastal region. Consequently, Mombasa County and surrounding coastal region had grown relying on chartered flights and specific market. Since business was going well, the necessity to diversify the market and tourism products was not significant. However, the risk relying on specific market and newly emerging potentials have become visible. Currently, the Department of Tourism Development and Culture in Mombasa County has a mandate to promote the destination, maximising its strength and minimising its weakness. It is a great opportunity for Mombasa County to transform from mass tourism destination to sustainable tourism destination and to contribute to economic growth for both Mombasa County and Kenya.
Observing the tourism earnings during the last five years, it accounted for KES 97.9 billion in 2011 and gradually decreased by 7.3% from KES 94.0 billion in 2013 to KES 87.1 billion in 2014 (Economic Overview 2015). This was attributed to a decrease of 11.1% in the number of international visitor arrivals between 2013 and 2014. The Moi International Airport in Mombasa (MIAM) faced a sharp decline of 37.9% from 189,623 in 2013 to 117,796 in 2014 (Kenya Tourism Board).
The number of bed-nights occupied in hotels in Kenya decreased by 4.8% from 6,596,700 in 2013 to 6,281,600 in 2014. Consequently, the overall rate of bed-nights occupancy decreased from 36.1% in 2013 to 31.6% in 2014. The number of bed-nights occupied at the Kenyan coastal beach area decreased by 8.1% from 2,750,300 in 2013 to 2,527,700 in 2014 (Economic Overview 2015). This proportion of bed-nights remains slightly over 40% of the total number of bed-nights for the whole country, even though coastal beaches lost their clients due to adverse travel advisories. This was attributed to the new strategies which have been taken by the government in 2014 as mentioned above. Since the adverse travel advisories were released in June 2015, the accommodation facilities expected that their clients will come back during the next peak season.
The number of visitors to national parks, game reserves, and museums in Kenya was highest in 2010 during the last five years; however, the number of visitors also declined in the succeeding years. The visitors to national parks and game reserves decreased by 7.4% from 2,337,700 in 2013 to 2,164,600 in 2014. The visitors to museums and historical sites were also down by 10.3% from 770,800 in 2013 to 690,900 in 2014 (Economic Overview 2015). Observing the situation of Mombasa County, the number of visitors to Fort Jesus accounted for 208,800 in 2011, which was the highest during the last five years; however, it declined to 97,800 in 2013 and 116,300 in 2014. The number of visitors to national parks in the coastal region, Malindi, Watamu, Mombasa, Shimba Hills, and Kisite Mpunguti was high, accounting for 190,615 in 2011. However, it also declined to 156,975 in 2013 and 106,295 in 2014.
(1) Accessibility
1) Air Transport MIAM is the second biggest international airport in Kenya and received the highest international arrivals in 2011 during the last five years accounting for 242,300. However, it dropped by 22.7% to 187,200 in
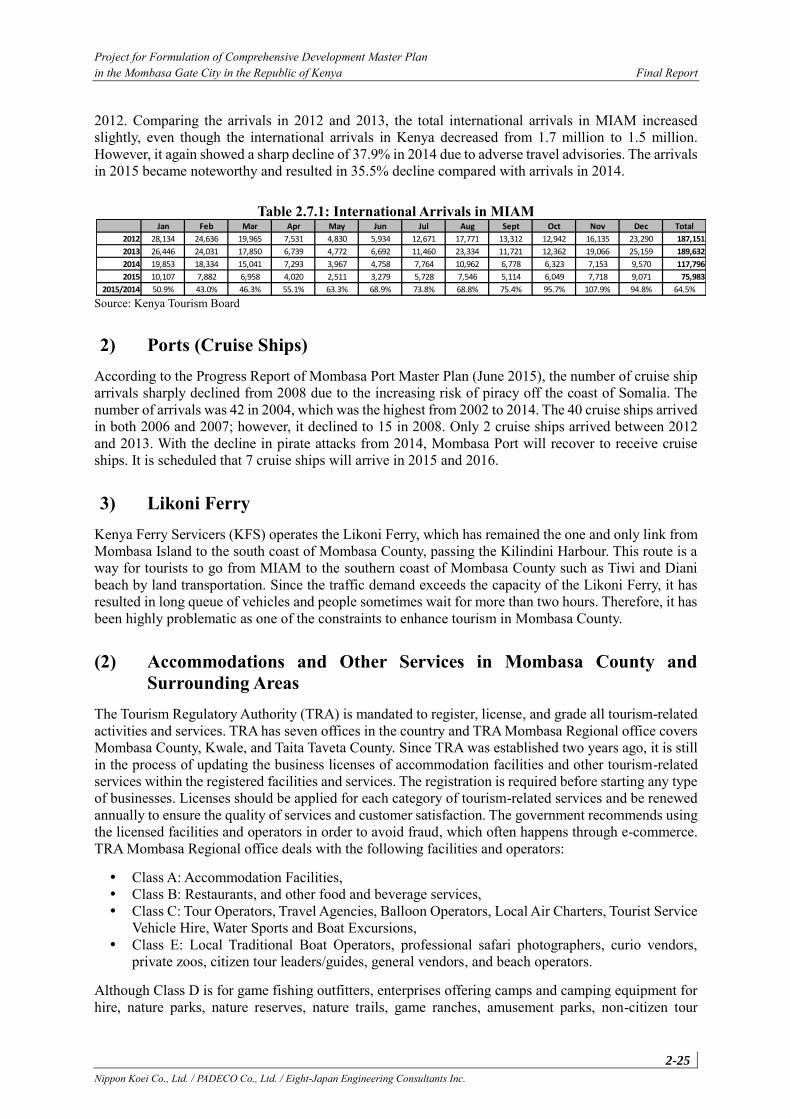
Project for Formulation of Comprehensive Development Master Plan in the Mombasa Gate City in the Republic of Kenya Final Report
2-25 Nippon Koei Co., Ltd. / PADECO Co., Ltd. / Eight-Japan Engineering Consultants Inc.
2012. Comparing the arrivals in 2012 and 2013, the total international arrivals in MIAM increased slightly, even though the international arrivals in Kenya decreased from 1.7 million to 1.5 million. However, it again showed a sharp decline of 37.9% in 2014 due to adverse travel advisories. The arrivals in 2015 became noteworthy and resulted in 35.5% decline compared with arrivals in 2014.
Table 2.7.1: International Arrivals in MIAM
Source: Kenya Tourism Board
2) Ports (Cruise Ships) According to the Progress Report of Mombasa Port Master Plan (June 2015), the number of cruise ship arrivals sharply declined from 2008 due to the increasing risk of piracy off the coast of Somalia. The number of arrivals was 42 in 2004, which was the highest from 2002 to 2014. The 40 cruise ships arrived in both 2006 and 2007; however, it declined to 15 in 2008. Only 2 cruise ships arrived between 2012 and 2013. With the decline in pirate attacks from 2014, Mombasa Port will recover to receive cruise ships. It is scheduled that 7 cruise ships will arrive in 2015 and 2016.
3) Likoni Ferry Kenya Ferry Servicers (KFS) operates the Likoni Ferry, which has remained the one and only link from Mombasa Island to the south coast of Mombasa County, passing the Kilindini Harbour. This route is a way for tourists to go from MIAM to the southern coast of Mombasa County such as Tiwi and Diani beach by land transportation. Since the traffic demand exceeds the capacity of the Likoni Ferry, it has resulted in long queue of vehicles and people sometimes wait for more than two hours. Therefore, it has been highly problematic as one of the constraints to enhance tourism in Mombasa County.
(2) Accommodations and Other Services in Mombasa County and Surrounding Areas
The Tourism Regulatory Authority (TRA) is mandated to register, license, and grade all tourism-related activities and services. TRA has seven offices in the country and TRA Mombasa Regional office covers Mombasa County, Kwale, and Taita Taveta County. Since TRA was established two years ago, it is still in the process of updating the business licenses of accommodation facilities and other tourism-related services within the registered facilities and services. The registration is required before starting any type of businesses. Licenses should be applied for each category of tourism-related services and be renewed annually to ensure the quality of services and customer satisfaction. The government recommends using the licensed facilities and operators in order to avoid fraud, which often happens through e-commerce. TRA Mombasa Regional office deals with the following facilities and operators:
Class A: Accommodation Facilities, Class B: Restaurants, and other food and beverage services, Class C: Tour Operators, Travel Agencies, Balloon Operators, Local Air Charters, Tourist Service
Vehicle Hire, Water Sports and Boat Excursions, Class E: Local Traditional Boat Operators, professional safari photographers, curio vendors,
private zoos, citizen tour leaders/guides, general vendors, and beach operators.
Although Class D is for game fishing outfitters, enterprises offering camps and camping equipment for hire, nature parks, nature reserves, nature trails, game ranches, amusement parks, non-citizen tour
Jan Feb Mar Apr May Jun Jul Aug Sept Oct Nov Dec Total
2012 28,134 24,636 19,965 7,531 4,830 5,934 12,671 17,771 13,312 12,942 16,135 23,290 187,151
2013 26,446 24,031 17,850 6,739 4,772 6,692 11,460 23,334 11,721 12,362 19,066 25,159 189,632
2014 19,853 18,334 15,041 7,293 3,967 4,758 7,764 10,962 6,778 6,323 7,153 9,570 117,796
2015 10,107 7,882 6,958 4,020 2,511 3,279 5,728 7,546 5,114 6,049 7,718 9,071 75,983
2015/2014 50.9% 43.0% 46.3% 55.1% 63.3% 68.9% 73.8% 68.8% 75.4% 95.7% 107.9% 94.8% 64.5%
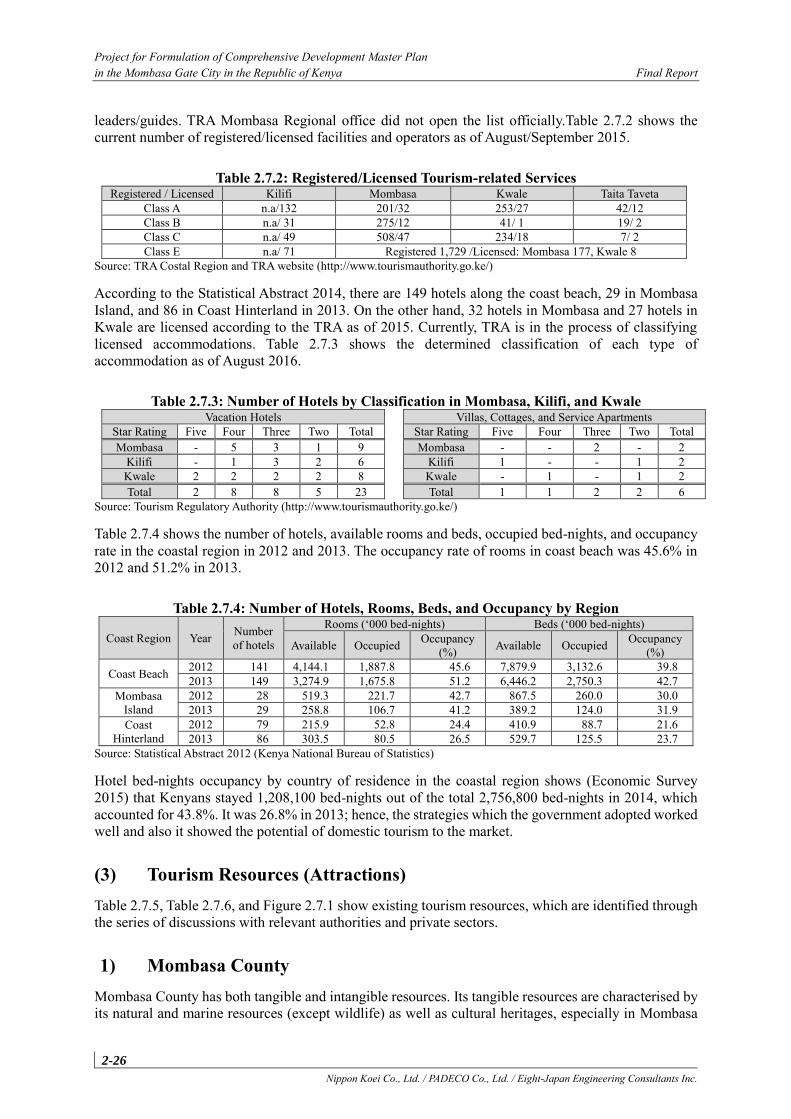
Project for Formulation of Comprehensive Development Master Plan in the Mombasa Gate City in the Republic of Kenya Final Report
2-26 Nippon Koei Co., Ltd. / PADECO Co., Ltd. / Eight-Japan Engineering Consultants Inc.
leaders/guides. TRA Mombasa Regional office did not open the list officially.Table 2.7.2 shows the current number of registered/licensed facilities and operators as of August/September 2015.
Table 2.7.2: Registered/Licensed Tourism-related Services Registered / Licensed Kilifi Mombasa Kwale Taita Taveta
Class A n.a/132 201/32 253/27 42/12 Class B n.a/ 31 275/12 41/ 1 19/ 2 Class C n.a/ 49 508/47 234/18 7/ 2 Class E n.a/ 71 Registered 1,729 /Licensed: Mombasa 177, Kwale 8
Source: TRA Costal Region and TRA website (http://www.tourismauthority.go.ke/)
According to the Statistical Abstract 2014, there are 149 hotels along the coast beach, 29 in Mombasa Island, and 86 in Coast Hinterland in 2013. On the other hand, 32 hotels in Mombasa and 27 hotels in Kwale are licensed according to the TRA as of 2015. Currently, TRA is in the process of classifying licensed accommodations. Table 2.7.3 shows the determined classification of each type of accommodation as of August 2016.
Table 2.7.3: Number of Hotels by Classification in Mombasa, Kilifi, and Kwale Vacation Hotels Villas, Cottages, and Service Apartments
Star Rating Five Four Three Two Total Star Rating Five Four Three Two Total Mombasa - 5 3 1 9 Mombasa - - 2 - 2
Kilifi - 1 3 2 6 Kilifi 1 - - 1 2 Kwale 2 2 2 2 8 Kwale - 1 - 1 2 Total 2 8 8 5 23 Total 1 1 2 2 6
Source: Tourism Regulatory Authority (http://www.tourismauthority.go.ke/)
Table 2.7.4 shows the number of hotels, available rooms and beds, occupied bed-nights, and occupancy rate in the coastal region in 2012 and 2013. The occupancy rate of rooms in coast beach was 45.6% in 2012 and 51.2% in 2013.
Table 2.7.4: Number of Hotels, Rooms, Beds, and Occupancy by Region
Coast Region Year Number of hotels
Rooms (‘000 bed-nights) Beds (‘000 bed-nights)
Available Occupied Occupancy (%) Available Occupied Occupancy
(%)
Coast Beach 2012 141 4,144.1 1,887.8 45.6 7,879.9 3,132.6 39.8 2013 149 3,274.9 1,675.8 51.2 6,446.2 2,750.3 42.7
Mombasa Island
2012 28 519.3 221.7 42.7 867.5 260.0 30.0 2013 29 258.8 106.7 41.2 389.2 124.0 31.9
Coast Hinterland
2012 79 215.9 52.8 24.4 410.9 88.7 21.6 2013 86 303.5 80.5 26.5 529.7 125.5 23.7
Source: Statistical Abstract 2012 (Kenya National Bureau of Statistics)
Hotel bed-nights occupancy by country of residence in the coastal region shows (Economic Survey 2015) that Kenyans stayed 1,208,100 bed-nights out of the total 2,756,800 bed-nights in 2014, which accounted for 43.8%. It was 26.8% in 2013; hence, the strategies which the government adopted worked well and also it showed the potential of domestic tourism to the market.
(3) Tourism Resources (Attractions) Table 2.7.5, Table 2.7.6, and Figure 2.7.1 show existing tourism resources, which are identified through the series of discussions with relevant authorities and private sectors.
1) Mombasa County Mombasa County has both tangible and intangible resources. Its tangible resources are characterised by its natural and marine resources (except wildlife) as well as cultural heritages, especially in Mombasa
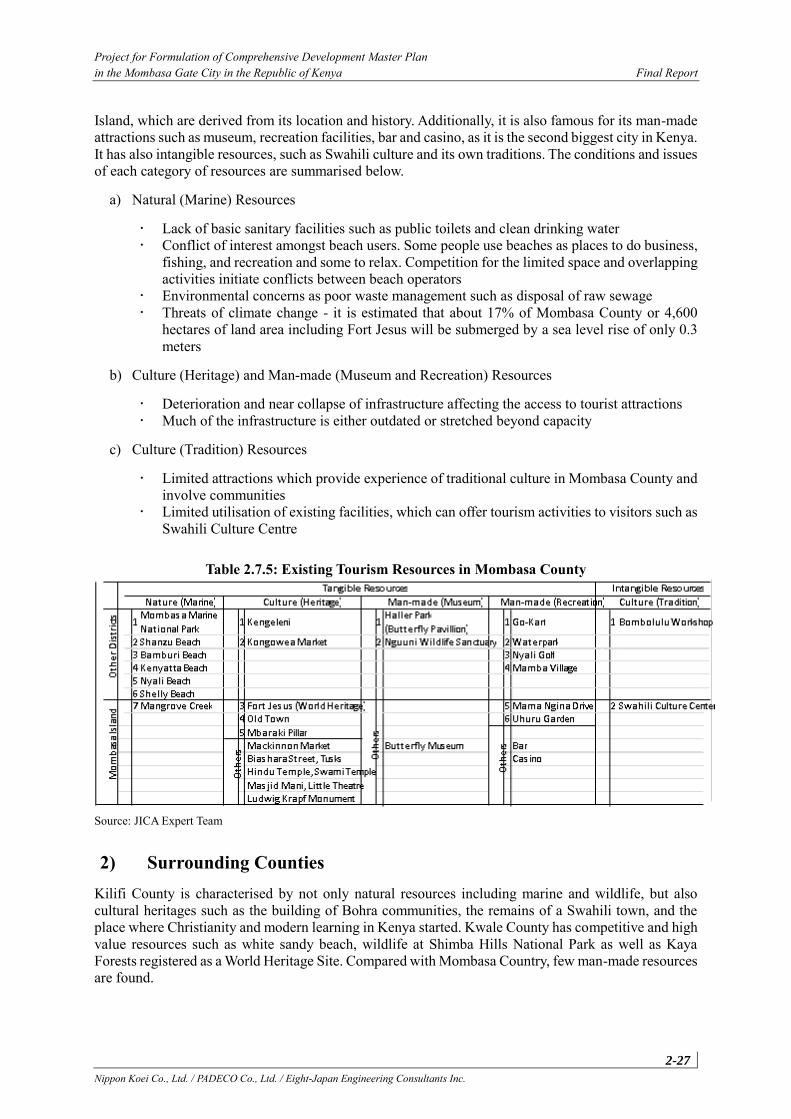
Project for Formulation of Comprehensive Development Master Plan in the Mombasa Gate City in the Republic of Kenya Final Report
2-27 Nippon Koei Co., Ltd. / PADECO Co., Ltd. / Eight-Japan Engineering Consultants Inc.
Island, which are derived from its location and history. Additionally, it is also famous for its man-made attractions such as museum, recreation facilities, bar and casino, as it is the second biggest city in Kenya. It has also intangible resources, such as Swahili culture and its own traditions. The conditions and issues of each category of resources are summarised below.
a) Natural (Marine) Resources
Lack of basic sanitary facilities such as public toilets and clean drinking water Conflict of interest amongst beach users. Some people use beaches as places to do business,
fishing, and recreation and some to relax. Competition for the limited space and overlapping activities initiate conflicts between beach operators
Environmental concerns as poor waste management such as disposal of raw sewage Threats of climate change - it is estimated that about 17% of Mombasa County or 4,600
hectares of land area including Fort Jesus will be submerged by a sea level rise of only 0.3 meters
b) Culture (Heritage) and Man-made (Museum and Recreation) Resources
Deterioration and near collapse of infrastructure affecting the access to tourist attractions Much of the infrastructure is either outdated or stretched beyond capacity
c) Culture (Tradition) Resources
Limited attractions which provide experience of traditional culture in Mombasa County and involve communities
Limited utilisation of existing facilities, which can offer tourism activities to visitors such as Swahili Culture Centre
Table 2.7.5: Existing Tourism Resources in Mombasa County
Source: JICA Expert Team
2) Surrounding Counties Kilifi County is characterised by not only natural resources including marine and wildlife, but also cultural heritages such as the building of Bohra communities, the remains of a Swahili town, and the place where Christianity and modern learning in Kenya started. Kwale County has competitive and high value resources such as white sandy beach, wildlife at Shimba Hills National Park as well as Kaya Forests registered as a World Heritage Site. Compared with Mombasa Country, few man-made resources are found.
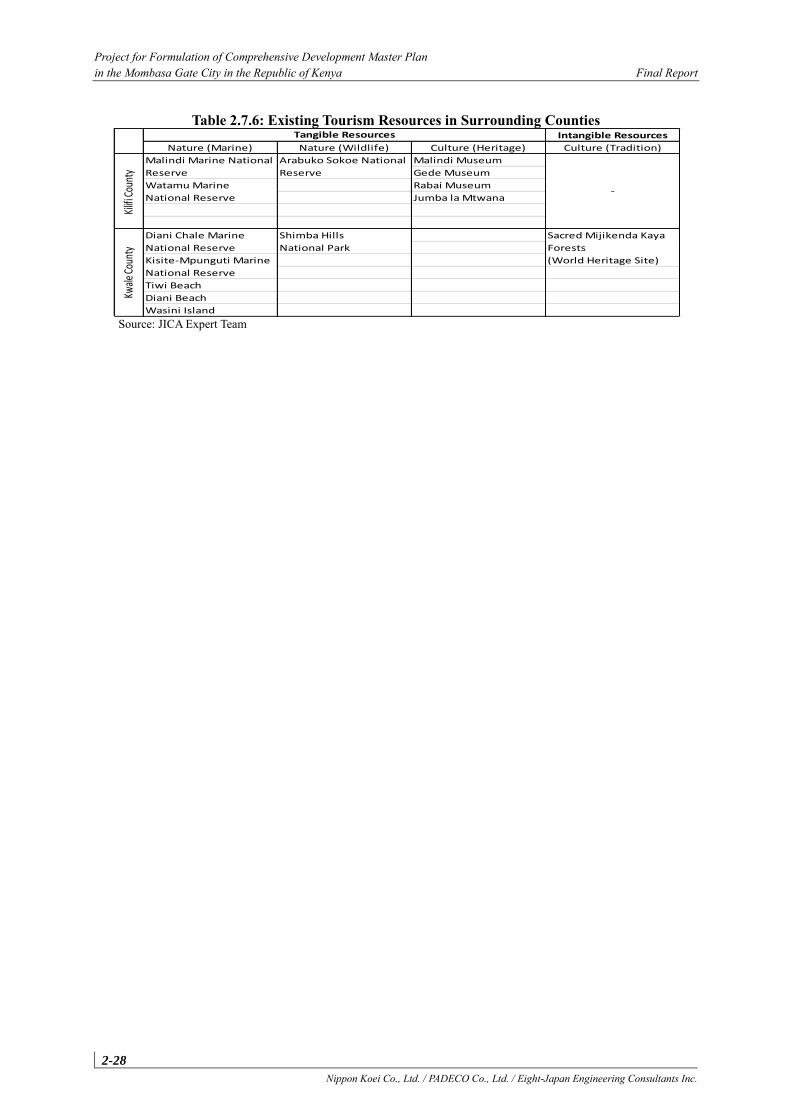
Project for Formulation of Comprehensive Development Master Plan in the Mombasa Gate City in the Republic of Kenya Final Report
2-28 Nippon Koei Co., Ltd. / PADECO Co., Ltd. / Eight-Japan Engineering Consultants Inc.
Table 2.7.6: Existing Tourism Resources in Surrounding Counties
Source: JICA Expert Team
Intangible Resources
Nature (Marine) Nature (Wildlife) Culture (Heritage) Culture (Tradition)
Malindi Museum
Gede Museum
Rabai Museum
Jumba la Mtwana
Tiwi Beach
Diani Beach
Wasini Island
Arabuko Sokoe National
Reserve
Watamu Marine
National Reserve-
Diani Chale Marine
National Reserve
Kisite-Mpunguti Marine
National Reserve
Shimba Hills
National Park
Sacred Mijikenda Kaya
Forests
(World Heritage Site)
Kilif
i Cou
nty
Kwale
Cou
nty
Malindi Marine National
Reserve
Tangible Resources
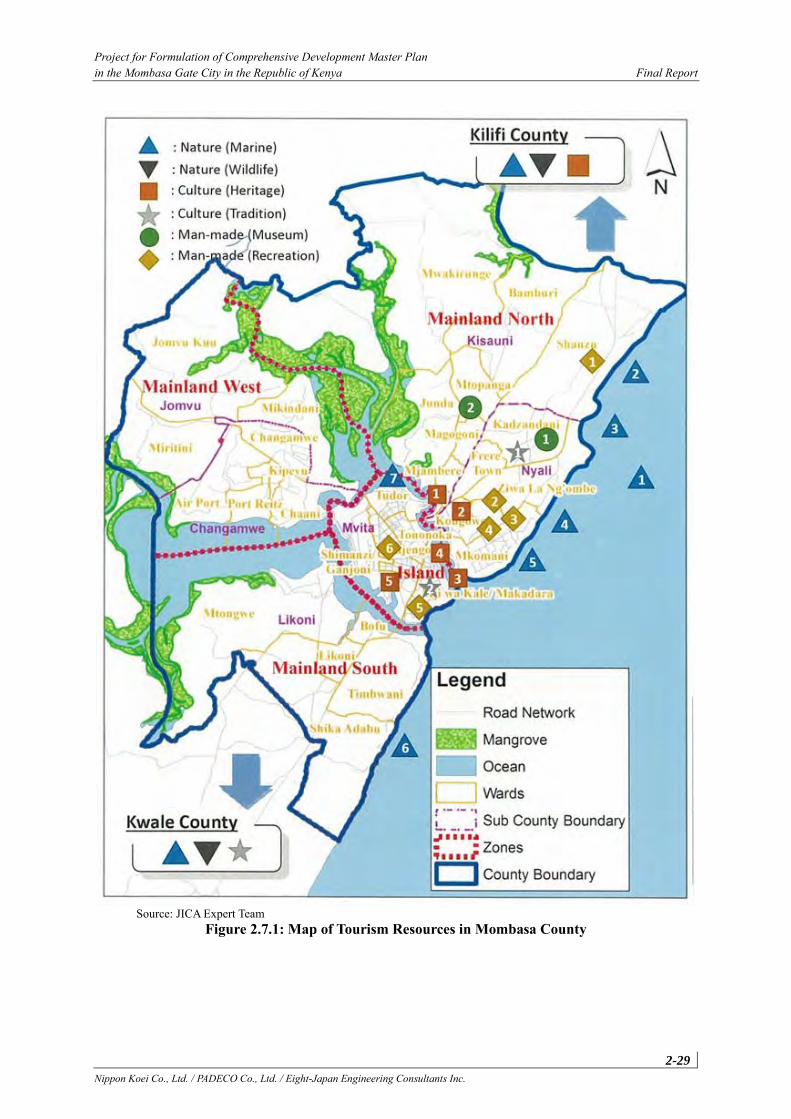
Project for Formulation of Comprehensive Development Master Plan in the Mombasa Gate City in the Republic of Kenya Final Report
2-29 Nippon Koei Co., Ltd. / PADECO Co., Ltd. / Eight-Japan Engineering Consultants Inc.
Source: JICA Expert Team Figure 2.7.1: Map of Tourism Resources in Mombasa County
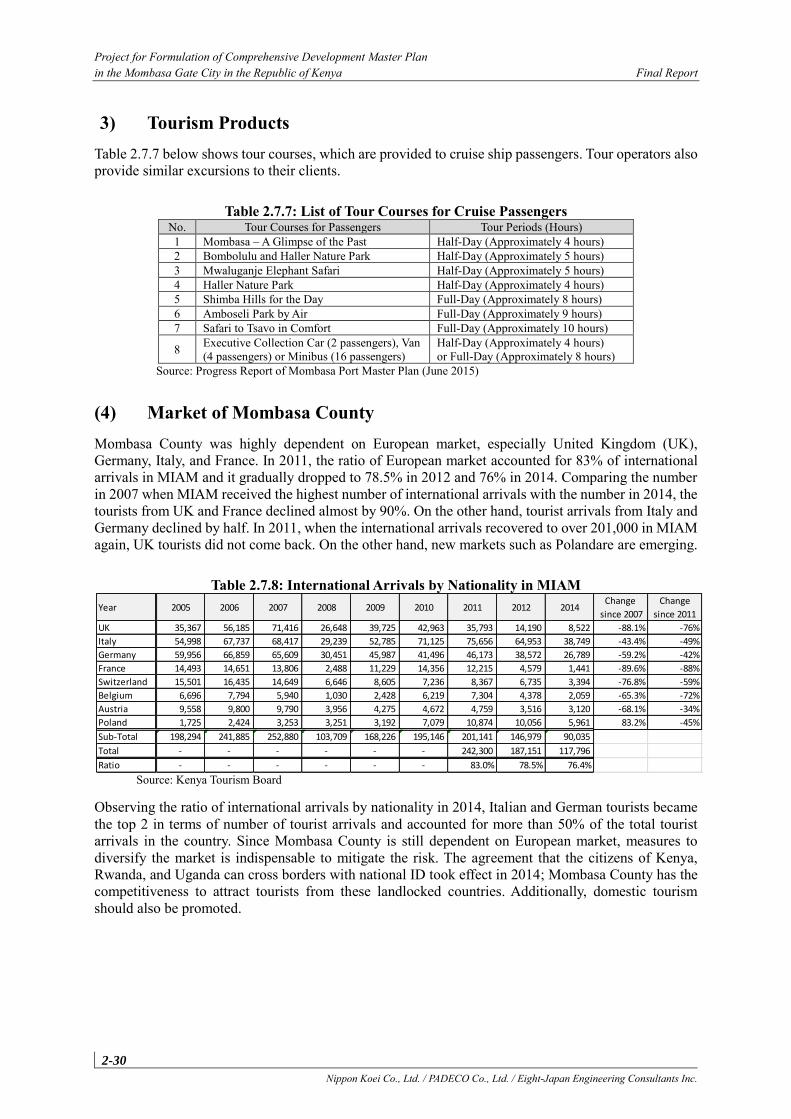
Project for Formulation of Comprehensive Development Master Plan in the Mombasa Gate City in the Republic of Kenya Final Report
2-30 Nippon Koei Co., Ltd. / PADECO Co., Ltd. / Eight-Japan Engineering Consultants Inc.
3) Tourism Products Table 2.7.7 below shows tour courses, which are provided to cruise ship passengers. Tour operators also provide similar excursions to their clients.
Table 2.7.7: List of Tour Courses for Cruise Passengers No. Tour Courses for Passengers Tour Periods (Hours) 1 Mombasa – A Glimpse of the Past Half-Day (Approximately 4 hours) 2 Bombolulu and Haller Nature Park Half-Day (Approximately 5 hours) 3 Mwaluganje Elephant Safari Half-Day (Approximately 5 hours) 4 Haller Nature Park Half-Day (Approximately 4 hours) 5 Shimba Hills for the Day Full-Day (Approximately 8 hours) 6 Amboseli Park by Air Full-Day (Approximately 9 hours) 7 Safari to Tsavo in Comfort Full-Day (Approximately 10 hours)
8 Executive Collection Car (2 passengers), Van (4 passengers) or Minibus (16 passengers)
Half-Day (Approximately 4 hours) or Full-Day (Approximately 8 hours)
Source: Progress Report of Mombasa Port Master Plan (June 2015)
(4) Market of Mombasa County Mombasa County was highly dependent on European market, especially United Kingdom (UK), Germany, Italy, and France. In 2011, the ratio of European market accounted for 83% of international arrivals in MIAM and it gradually dropped to 78.5% in 2012 and 76% in 2014. Comparing the number in 2007 when MIAM received the highest number of international arrivals with the number in 2014, the tourists from UK and France declined almost by 90%. On the other hand, tourist arrivals from Italy and Germany declined by half. In 2011, when the international arrivals recovered to over 201,000 in MIAM again, UK tourists did not come back. On the other hand, new markets such as Polandare are emerging.
Table 2.7.8: International Arrivals by Nationality in MIAM
Source: Kenya Tourism Board
Observing the ratio of international arrivals by nationality in 2014, Italian and German tourists became the top 2 in terms of number of tourist arrivals and accounted for more than 50% of the total tourist arrivals in the country. Since Mombasa County is still dependent on European market, measures to diversify the market is indispensable to mitigate the risk. The agreement that the citizens of Kenya, Rwanda, and Uganda can cross borders with national ID took effect in 2014; Mombasa County has the competitiveness to attract tourists from these landlocked countries. Additionally, domestic tourism should also be promoted.
Year 2005 2006 2007 2008 2009 2010 2011 2012 2014Change
since 2007
Change
since 2011
UK 35,367 56,185 71,416 26,648 39,725 42,963 35,793 14,190 8,522 -88.1% -76%
Italy 54,998 67,737 68,417 29,239 52,785 71,125 75,656 64,953 38,749 -43.4% -49%
Germany 59,956 66,859 65,609 30,451 45,987 41,496 46,173 38,572 26,789 -59.2% -42%
France 14,493 14,651 13,806 2,488 11,229 14,356 12,215 4,579 1,441 -89.6% -88%
Switzerland 15,501 16,435 14,649 6,646 8,605 7,236 8,367 6,735 3,394 -76.8% -59%
Belgium 6,696 7,794 5,940 1,030 2,428 6,219 7,304 4,378 2,059 -65.3% -72%
Austria 9,558 9,800 9,790 3,956 4,275 4,672 4,759 3,516 3,120 -68.1% -34%
Poland 1,725 2,424 3,253 3,251 3,192 7,079 10,874 10,056 5,961 83.2% -45%
Sub-Total 198,294 241,885 252,880 103,709 168,226 195,146 201,141 146,979 90,035
Total - - - - - - 242,300 187,151 117,796
Ratio - - - - - - 83.0% 78.5% 76.4%
Project for Formulation of Comprehensive Development Master Plan in the Mombasa Gate City in the Republic of Kenya Final Report
2-31 Nippon Koei Co., Ltd. / PADECO Co., Ltd. / Eight-Japan Engineering Consultants Inc.
2.7.3 Review of Policy, Legal Framework and Administrative Structure
(1) Administrative Structure Kenyan devolution process has commenced after the first general election held under the Constitution of Kenya, 2010, in March 2013. Mombasa County was established as one of the 47 county governments. The Department of Tourism Development and Culture was organised accordingly.
Since the department is newly organised, two directors for county director of tourism are optimal; however, no directors are allocated as of September 2015 and there is one acting director. Similarly, two directors for county director of culture are planned to be assigned; however, one director for culture is allocated.
The mandate of the director of tourism is listed as follows:
Implementation of tourism policies at the county level; Integration of policies at county and national levels; Development of community-based tourism projects and programmes; Coordinating and consolidating county tourism database and dissemination of information
henceforth; Coordinating and facilitating the management and control of county specific tourism activities; Coordinating in maintaining standards of tourism products and services in liaison with other
relevant government departments and industry players, and Tourism promotion and marketing
(2) Legal Framework
1) Public Sector The Tourism Act 2011 determines the establishment of relevant authorities in order to provide for the development, management, marketing, and regulation of sustainable tourism and tourism-related activities and services, and for connected purposes. The National Museum and Heritage Act 2006 determines the establishment of National Museum of Kenya (NMK), and the Wildlife Conservation and Management Act, Cap 376 establishes the Kenya Wildlife Services (KWS). The NMK and KWS are key players for tourism product development in the public sector. Table 2.7.9 below shows the authorities located in Mombasa County.
Table 2.7.9: Public Sector (National Apparatus) Legal Framework Authority Coverage Areas Main Roles and Functions
Tourism Act 2011 Tourism Regulatory Authority (TRA) Mombasa Regional Office
Mombasa, Kwale, Taita Taveta
Regulate tourism services and facilities in the region
Tourism Fund (TF) Coast Region
Lamu, Tana River, Kilifi, Mombasa, Kwale, Taita Taveta
Collect the levy from hotel sector and, food and beverage service operators
Finance the marketing of Kenya and the training and capacity development
Kenya Tourism Board (KTB) Airport Office
Moi International Airport Collect and compile the statistics and send them to KTB headquarters
Kenya Utalii College Mombasa campus
Mombasa and surrounding areas
Undertake tourism hospitality and training, capacity building for tourism sector
Project for Formulation of Comprehensive Development Master Plan in the Mombasa Gate City in the Republic of Kenya Final Report
2-32 Nippon Koei Co., Ltd. / PADECO Co., Ltd. / Eight-Japan Engineering Consultants Inc.
Authority Coverage Areas Main Roles and Functions National Museum and Heritage Act 2006 National Museum of Kenya (NMK) Coast Region
Coast Region Lamu, Kilifi, Mombasa, Kwale
Identify cultural and natural heritages Promote conservation and sustainable utilisation of
natural heritages Wildlife Conservation and Management Act Kenya Wildlife Service (KWS) Coast Region
Coast Region Lamu, Kilifi, Mombasa, Kwale
Establish national parks and national reserves Promote conservation and sustainable utilisation of
wildlife Source: JICA Expert Team
2) Private Sector in Mombasa County The Kenya Tourism Federation (KTF) is an umbrella organisation at the national level that unites the different bodies and lobbies for a better business environment. It consists of seven organisations: Kenya Association of Air Operators, Kenya Association of Travel Agencies (KATA), Kenya Association of Tour Operators (KATO), Kenya Association of Hotel Keepers and Caterers (KAHC), Kenya Coast Tourism Association (KCTA), Ecotourism Kenya, and Pubs, Entertainment, and Restaurants Association of Kenya. KATA Coast, KATO Coast, KAHC Coast, and KCTA are key players in Mombasa County. The Department of Tourism Development and Culture has a mandate to coordinate these players and to solve issues raised on the ground to enhance tourism in Mombasa County.
(3) Review of Policy
1) Kenya Vision 2030 The vision of the tourism sector is “to be a top ten tourist destination offering high-end, diverse, and distinctive visit experiences”. To be ranked amongst the top ten, Kenya must expand her global and African market share by offering new products, expanding tourist expenditure per capita, and by improving her international marketing strategies.
2) National Tourism Strategy 2013 – 2018 National Tourism Strategy 2013 – 2018 was developed along the Tourism Act 2011 and set up the following objectives:
a) Mainstream domestic tourism, followed by regional tourism and international b) Increase international arrivals from 1.8 million per year to 3 million per year c) Encourage local/women/youth involvement and management of travel and tourism facilities and
services d) Increase Kenya’s competitiveness in the tourism sector e) Provide a platform for development and sustenance of quality standard/regulations of products
and services in the tourism sector
To achieve the abovementioned objectives, the following key strategic theme was determined:
a) Effective product development and deployment approach, which promotes responsible tourism4. b) Enhance the marketing of Kenya tourism products, which determines the strategic market 1)
domestic, 2) East Africa, 3) emerging market such as BRICS5, and 4) Europe and America as defend market.
4 Responsible tourism is defined as “Tourism that maximises the benefits of local communities, minimises negative social or
environmental impacts, and helps local people conserve fragile cultures and habitats and spices” by Cape Town Declaration.
5 Brazil, Russia, India, and China
Project for Formulation of Comprehensive Development Master Plan in the Mombasa Gate City in the Republic of Kenya Final Report
2-33 Nippon Koei Co., Ltd. / PADECO Co., Ltd. / Eight-Japan Engineering Consultants Inc.
c) Address inadequate financing and improve the investment management, which emphasises the ripple effect of tourism industry toward other industries to receive the adequate finance from treasury and at the same time, seek for other source of finance.
d) Be more scientific through research and information management, in which the Department of Tourism should collect and compile scientifically-researched information and distribute them to stakeholders in a timely and effective manner.
e) Focus on human capital, legal, policy, and institutional framework, which expects that institutions in charge of training professionals in the sector should review their curriculum and incorporate modern training approach. Moreover, policy transparency and an effective integration of institutional framework are required.
3) Integrated Strategic Urban Development Plans, Mombasa County (ISUDP-Mombasa/KMP Plan)
The ISUDP-Mombasa proposed a Tourism Management Plan and a Cultural and Heritage Conservation and Management Plan in the tourism sector in August 2015. Table 2.7.10 shows the recognised issues, proposals which are shown in the ISUDP-Mombasa, as well as comments and necessary actions by the JICA Expert Team.
Table 2.7.10: Tourism Management Issues and Comments Subject Recognized Issues / Proposals Comments / Necessary Actions
Infrastructure
Deterioration / lack of key infrastructure affecting the access to tourist facilities and attraction sites.
The plan proposed entire possibilities to enhance/maintain existing tourism sites / infrastructure.
The plan lacks the perspective of tourist demands and priorities for improvement.
To develop a strategy based on the needs of prioritized market, considering the perspective of short term, medium term, and long term
Safety and Security
The decline of international arrivals resulted from the fear of safety and security conditions.
The plan proposed public campaigns against crime, patrols, technology (CCTV), and the construction of watch-towers.
To install facilities and to organise domestic campaigns are not enough actions to attract international tourists.
To organise international campaigns of changing the image of the destination.
Product Competitiveness
The new policy of levying value added tax (VAT), increase of admission fee of national parks and museum, as well as relative monopoly of sky policy affects total price of the tourism products.
To conduct market research to observe the situation of competitors such as Zanzibar and Madagascar to strengthen the product competitiveness
To organise training of human resources to improve the quality of services
Product Development
Mombasa County had been growing as typical mass tourism market, highly dependent on package of chartered flights, and accommodation with full-board basis.
The necessity to diversify tourism products has been ignored for a long time.
To conduct market research to realize the paradigm shift from international to domestic and regional market
To diversify tourism products which attract targeted market.
Environment
Conflicts between wildlife and human and poor waste management have led to environmental degradation and the threats of climate change.
The plan proposed zoning between wildlife and human activities and the development of ecotourism sites.
Only zoning does not solve the recognized issues.
To develop new tourism products such as ecotourism sites to educate Kenyan students.
To upgrade knowledge and skills of professional guides.
Source: JICA Expert Team
Table 2.7.11: Cultural and Heritage Conservation and Management Subject Recognized Issues / Proposals Comments / Necessary Actions
Value of Heritages
The root cause of heritages degradation comes from the lack of the knowledge of heritage property owners.
Heritage management plan itself is not sufficient to protect the value of heritages.
Project for Formulation of Comprehensive Development Master Plan in the Mombasa Gate City in the Republic of Kenya Final Report
2-34 Nippon Koei Co., Ltd. / PADECO Co., Ltd. / Eight-Japan Engineering Consultants Inc.
Subject Recognized Issues / Proposals Comments / Necessary Actions The plan proposed built heritage management plan
for Mombasa County to protect the value of heritages.
To educate property owners to teach the value of heritages as well as to develop a mechanism for those owners to benefit from the value of heritages.
Environments Surrounding Heritages
Over population and general congestion in historic neighbourhoods.
Non-motor such as cycling and walking and parking regulation can be considered.
Conservation Policy
Lack of institutional coordination between NMK and county over development control in the conservation area is problematic.
To balance between economic/financial gains and preservation of history and heritages is difficult.
Community awareness and the establishment of a mechanism to benefit from the heritages should be promoted.
Source: JICA Expert Team
2.7.4 Review of Ongoing and Planned Projects
(1) Infrastructure
1) Construction of Mombasa Gate Bridge (Likoni Bridge) A construction of a bridge over Kilindini Harbour has been proposed by several contractors in order to solve the heavy congestion and long queue of vehicles and people caused by Likoni Ferry. Since these current plans deteriorate Mama Ngina Drive, which is one of the most important sites that can be utilised for tourism and few open spaces for citizens in Mombasa County. More discussions before implementation would be advisable. JICA received a request for the Mombasa Gate Bridge from the GOK, and now considering assistance with tourism aspect in mind.
In addition to the above project, there are projects such as Mombasa Port Development Project which can accommodate bigger cruise ship as well as Mombasa Port Area Road Development Project which will enable tourists to easily access both south and north coast of Mombasa County, avoiding heavy congestion within Mombasa Island.
(2) Tourism Facilities
1) International Convention Centre Ken Invest, Kenya Investment Authority, has announced a project in Mombasa County under the scheme of Public Private Partnership (PPP). The site is located within Haller Park, south of the Bamburi Cement along the Mombasa-Malindi Highway, along the coast. This project entails the development of a multi-purpose convention centre, with a contemporary design to ensure that large-scale meetings, events and conferences can be facilitated in Kenya.
2) Tourism Information Centre The Department of Tourism Development and Culture has a plan of constructing tourism information centre in Uhuru Garden in Mombasa Island, Nyali and Shanzu in the North Coast of Mombasa County. Since the Department already obtained the land for the information centre, it started the procurement process.
Project for Formulation of Comprehensive Development Master Plan in the Mombasa Gate City in the Republic of Kenya Final Report
2-35 Nippon Koei Co., Ltd. / PADECO Co., Ltd. / Eight-Japan Engineering Consultants Inc.
3) Construction of Cultural Centre Each county is mandated to construct community cultural centre as focal points of preserving and promoting Kenyan diverse positive culture and heritages for enhancing socio-economic development.
2.7.5 Development Issues, Constraints and Directions
(1) Development Issues and Constraints The following issues, which the tourism sector has faced in Mombasa County, are identified through the series of discussions with relevant authorities and private sectors. It is necessary to clarify roles between the public and private sector and to collaborate within the stakeholders in order to tackle the issues.
a) Lack of consideration for tourists’ preference in tourism product development: It was observed that current service providers do not take tourists’ needs into consideration. In other words, they offer their tourism products and services based on their own needs rather than the tourists’ needs. For example, if service providers offer their products and services with fixed prices, tourists can easily have access to them; however, service providers are reluctant to show fixed prices and prefer negotiation which cause tourists to avoid availing their services.
b) Under exploitation of tourism resources/heritages: Mombasa County itself offers various kinds of tourism resources such as beach, cultural heritages as tangible resources, traditional culture as intangible resources, and man-made attractions as urban tourism resources. In collaboration with the surrounding areas such as Kilifi and Kwale counties, it can offer more diversified and competitive tourism products; however, those have not been well utilised.
c) Limited tourism products: Even though tourism resources exist in Mombasa County, their value is being deteriorated without proper maintenance. The county has to take up the role of maintenance to add value on the tourism resources. The private sector can make circuit by combining these value-added resources and develop tourism products.
d) Limited capacity of service providers: In order to promote eco-tourism and responsible tourism, which supports to diversify tourism products, professional guides are one of the key factors. Therefore, it is important to develop and upgrade professional skills of existing service providers.
e) Unstructured interaction between tourists and local communities: There were lots of initiatives of communities’ involvement with the tourism industry some decades ago; however, they could not maintain the value of their products. The county should provide necessary training for capacity building of local communities.
f) Environmental degradation: Environmental degradation such as shoreline erosion and poor waste management is a concern. A pile of garbage has also been problematic. Tourism awareness should be incorporated into the school curriculum to enhance the awareness on environmental conservation and to improve tourism environments.
g) Limited capacity of tourism-related organisations: The Department of Tourism Development and Culture in Mombasa County is newly established and apparently, they suffer from shortage of manpower. The urgent issue is to recruit necessary staffs to plan and implement mandated activities.
h) Lack of effective coordination between public and private sector: This has resulted from the limited capacity of the Department of Tourism Development and Culture. The county has to fulfil the role of developing a marketing strategy for the destination and to provide effective and efficient information on market trend and analysis to support the private sector who is the main actor of tourism product development. The department should also fulfil a role to distribute information on developed tourism products through various channels such as tourist information centre and Kenya Tourism Board.
Project for Formulation of Comprehensive Development Master Plan in the Mombasa Gate City in the Republic of Kenya Final Report
2-36 Nippon Koei Co., Ltd. / PADECO Co., Ltd. / Eight-Japan Engineering Consultants Inc.
(2) Directions In order to tackle the recognised issues mentioned above, the following pillars to make Mombasa County and surrounding areas a vibrant and viable tourism destination are proposed:
a) Proper marketing of Mombasa County as gate city and surrounding areas: The Department of Tourism Development and Culture should fulfil the role of marketing Mombasa County and surrounding areas as gate city. Since Mombasa County has an international airport and ports, visitors arrive and pass in Mombasa County. Mombasa County has a key role of disseminating tourism information to enhance tourism not only in Mombasa County but also in surrounding areas such as Kilifi and Kwale. Additionally, in order to access the international market, it is indispensable to collaborate with KTB to provide proper information on tourism products.
b) Tourism product development strategy: One of the short-term plans can be to enhance/maintain existing tourism sites/infrastructure, taking into consideration the market value of resources, accessibility, and link with other resources. It is necessary to develop a strategy of tourism product development based on the needs of prioritised market, considering the perspective of short term, medium term, and long term.
c) Upgrading skills of tourism service providers: Service providers should know the tourists’ psychology and behaviour and update their skills. This will enable them to offer products and services in sustainable manner and to satisfy tourists’ expectations. The satisfaction will motivate tourists to spend more, to visit the destination again, and to promote it by word of mouth.
d) Local communities’ involvement in tourism directly and indirectly: Local communities’ direct involvement in tourism business contributes not only to generate direct income but also to empower the community and build their pride and confidence on their own tradition and lifestyle. This helps to conserve indigenous culture. Knowing tourists through interaction helps develop a welcoming mindset and friendly tourism destination. It also contributes to diversify tourism products. Since developing culture tourism or community-based tourism, which is a form of responsible tourism, is part of the policy, it should be included in the plan.
e) Inter-county collaboration for enhancing tourism resources/products as Swahili Coast: The variation of tourism products within Mombasa County itself is quite limited. Each neighbouring county has its own strengths of tourism resources; therefore, combining the different and diversified tourism resources add more value on the products and offer the real taste of Swahili Coast to customers.
f) Collaboration between public and private sectors: The public sector should support the private sector to develop better tourism products through activities such as improvement of basic infrastructure, proper marketing and training for service providers. It is indispensable to develop a mechanism to collaborate and coordinate between public and private sectors.
Project for Formulation of Comprehensive Development Master Plan in the Mombasa Gate City in the Republic of Kenya Final Report
3-1 Nippon Koei Co., Ltd. / PADECO Co., Ltd. / Eight-Japan Engineering Consultants Inc.
3. Urban Conditions
3.1 Development Trend of Mombasa County
3.1.1 History of Urban Growth Mombasa County is located on Kenya's eastern coastline bordering the Indian Ocean. Mombasa’s original Arabic name was Manbasa. In Kiswahili, it is called Kisiwa Cha Mvita, which means "Island of War" due to the many changes in its ownership.
The history of the city is a mixture of African, Persian, Arab, Portuguese, and British influences which contributed to the rich cultures found in the city today. Mombasa was originally inhabited by the African Bantu people. The city was then visited by Jordanians in the 6th century, Persians in the 9th and 10th century and thereafter Arabs (Oman and others). The Arabs and Persians developed trading routes, commercial centres, and contributed to a flowering of civilisation reflected in the glorious architecture of their grand houses, monuments, and mosques.
After Vasco da Gama discovered the city in 1498, both Omani and Portuguese had been scrambling to capture Fort Jesus to secure a trade route via the Old Port until the British set up the headquarters of the East African Company in 1887. The Sultan of Zanzibar formally presented the town to the British in 1898. The British started the construction of the Uganda Railway in 1896, which started its operation from Mombasa to Kisumu in 1901. It was the springboard for the colonisation of Kenya and the development of the industry in Mombasa. Population on the island was around 20,000 in 1896.
The island and Kisauni area are basically flat alluvial plains, whilest Changamwe Region consists of jurassic plains. Near the sea, the land is composed of coral reefs which is commercially exploited as a source of limestone for the cement industry, and also as a source of building stone.
Old Nyali Bridge was built in 1931, which was a floating bridge to connect the island and the Mainland North. The New Nyali Bridge was built in 1980. Likoni Ferry started operating in 1937, and this was used to connect Mainland South with the island by the Kenya Ferry Services (KFS).
Prior to the 1971 Urban Development Strategy, the population of the town has increased from 247,073 in 1969 to 461,753 in 1989; a growth rate ranging from 3.5% to 3.8%. This fast growth is attributed both to natural and rural-urban migration. It is the second largest industrial centre after the capital city, Nairobi. Major industries include oil refineries at Kipevu and Changamwe, cement factories at Bamburi, with tourist related industries, textile and engineering work spread through the urban area in the island. The industries attract a labour force from the entire coastal region and the hinterland, thus, increasing the population growth.
With a population of around one million inhabitants (2015), the city is located on Mombasa Island, which is separated from the mainland by two creeks; Tudor Creek and Kilindini Harbour. The island is connected to the Mainland North by the Nyali Bridge, to the southern part by the Likoni Ferry, and to the western side by the Makupa Causeway.
Project for Formulation of Comprehensive Development Master Plan in the Mombasa Gate City in the Republic of Kenya Final Report
3-2 Nippon Koei Co., Ltd. / PADECO Co., Ltd. / Eight-Japan Engineering Consultants Inc.
3.1.2 Review of 1971 Urban Development Strategy The first comprehensive long-term physical development plan covering the whole of the Mombasa municipal area was adopted by the council in 1962.
Subsequently, 1971 Urban Development Strategy was carried out which dealt with the background of the planning in Mombasa with reference to its historical background, role, and functions that it would continue to play in the future. The physical pre-conditions were also described, and attention was given to the problems of land ownership and planning legislation. This plan also analysed the characteristics of the population and its dynamics, emphasised on the transportation requirements, different land uses and discussed future pattern of urban growth. The population of the town was 247,070 in year 1969 and was projected to be 1,330,000 in year 2000.
The main proposals of the Urban Development Strategy are as suggested below.
Decentralisation through construction of transportation network to knit the separate areas of the municipality into an integrated urban complex.
Expand port with rail access on the Mainland South where government owns a large part of land available to enable it to accommodate growth and counter act the pull of island/Mainland West.
Improve municipal and government services on the Mainland North and Mainland South to encourage people to live there.
Provisions of social facilities in the Mainland North and Mainland South. Direct transport linkages between mainland areas (excluding island) through bridges, causeways
and ferries. A need of a by-pass route over the island and Mainland West. Need of strict development control to prevent excessive residential development in the island and
Mainland West to check developments of squatters. Considered Swahili housing would remain to meet the future requirements because of its inherent
cost advantages and proposed gross densities which was suggested to be around 300 persons per hectare. The possible residential development was considered for an area of 2,200 ha.
Estimated around 450 ha of land for 150 new primary schools and 250 ha of land for 40 new secondary schools would be required.
The plan estimated around 5,500 ha of land would be required till 1995 for different uses including residential, industrial, educational, recreational, public purposes, commercial, utilities and transportation. Similarly, with different growth prospect (from 1% to 4%) the requirement of land for industrial uses was estimated in the range of 365 ha to 880 ha.
Most of the proposals in the 1971 Urban Development Strategy have not been realized, yet many of these proposals are applicable to the existing situation. Some of the ideas proposed in the 1971 Urban Development Strategy will be integrated in the Mombasa Gate City Master Plan (MGCMP).
3.1.3 Urban Growth Since 1971 Urban growth since 1971 is illustrated in Figure 3.1.1. As shown in the figure, urban area in 1971 was limited in the island and some small settlements in the mainland. Since then, urban area has expanded to the mainland, particularly in the north and west areas. Details of the urban characteristics are illustrated in Section 3.2.
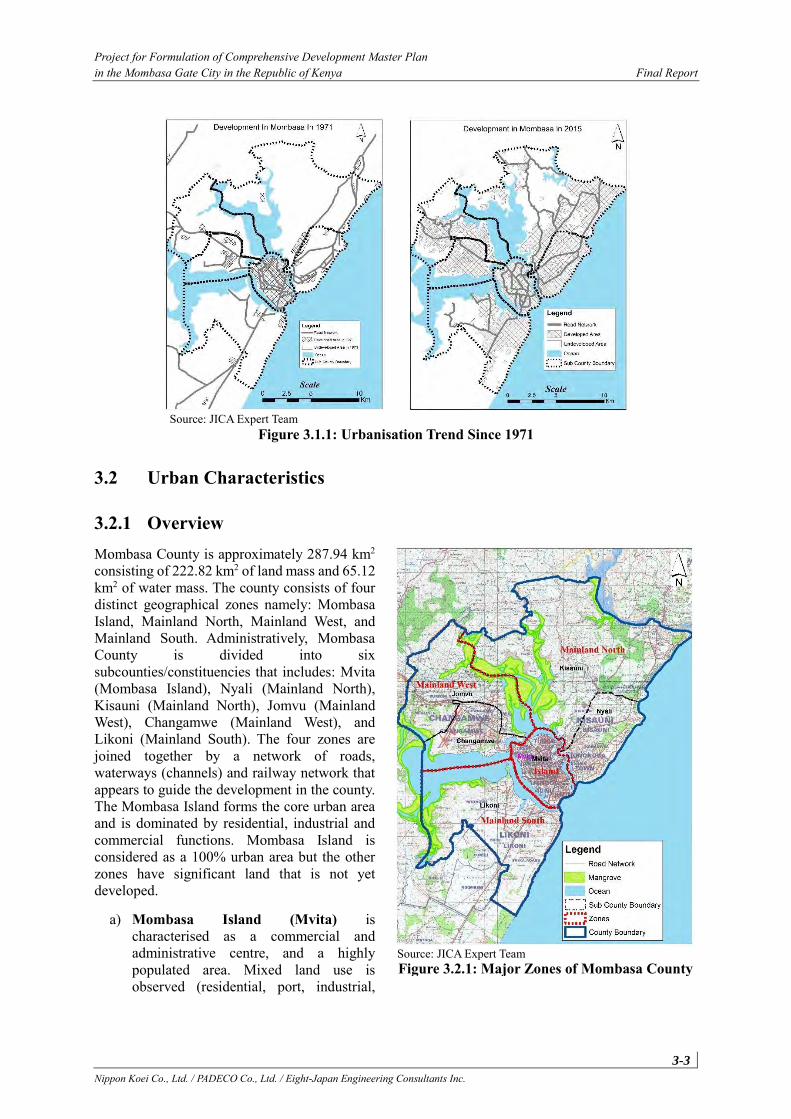
Project for Formulation of Comprehensive Development Master Plan in the Mombasa Gate City in the Republic of Kenya Final Report
3-3 Nippon Koei Co., Ltd. / PADECO Co., Ltd. / Eight-Japan Engineering Consultants Inc.
Source: JICA Expert Team
Figure 3.1.1: Urbanisation Trend Since 1971
3.2 Urban Characteristics
3.2.1 Overview Mombasa County is approximately 287.94 km2 consisting of 222.82 km2 of land mass and 65.12 km2 of water mass. The county consists of four distinct geographical zones namely: Mombasa Island, Mainland North, Mainland West, and Mainland South. Administratively, Mombasa County is divided into six subcounties/constituencies that includes: Mvita (Mombasa Island), Nyali (Mainland North), Kisauni (Mainland North), Jomvu (Mainland West), Changamwe (Mainland West), and Likoni (Mainland South). The four zones are joined together by a network of roads, waterways (channels) and railway network that appears to guide the development in the county. The Mombasa Island forms the core urban area and is dominated by residential, industrial and commercial functions. Mombasa Island is considered as a 100% urban area but the other zones have significant land that is not yet developed.
a) Mombasa Island (Mvita) is characterised as a commercial and administrative centre, and a highly populated area. Mixed land use is observed (residential, port, industrial,
Figure 3.2.1: Major Zones of Mombasa County Source: JICA Expert Team
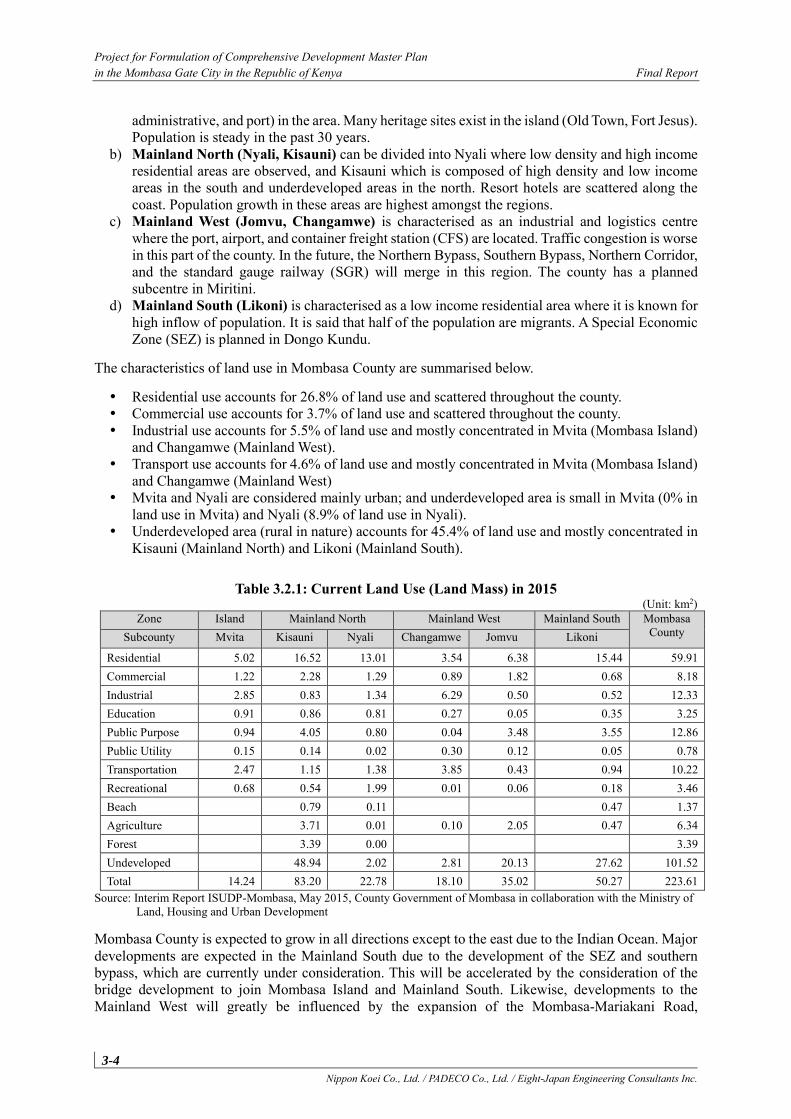
Project for Formulation of Comprehensive Development Master Plan in the Mombasa Gate City in the Republic of Kenya Final Report
3-4 Nippon Koei Co., Ltd. / PADECO Co., Ltd. / Eight-Japan Engineering Consultants Inc.
administrative, and port) in the area. Many heritage sites exist in the island (Old Town, Fort Jesus). Population is steady in the past 30 years.
b) Mainland North (Nyali, Kisauni) can be divided into Nyali where low density and high income residential areas are observed, and Kisauni which is composed of high density and low income areas in the south and underdeveloped areas in the north. Resort hotels are scattered along the coast. Population growth in these areas are highest amongst the regions.
c) Mainland West (Jomvu, Changamwe) is characterised as an industrial and logistics centre where the port, airport, and container freight station (CFS) are located. Traffic congestion is worse in this part of the county. In the future, the Northern Bypass, Southern Bypass, Northern Corridor, and the standard gauge railway (SGR) will merge in this region. The county has a planned subcentre in Miritini.
d) Mainland South (Likoni) is characterised as a low income residential area where it is known for high inflow of population. It is said that half of the population are migrants. A Special Economic Zone (SEZ) is planned in Dongo Kundu.
The characteristics of land use in Mombasa County are summarised below.
Residential use accounts for 26.8% of land use and scattered throughout the county. Commercial use accounts for 3.7% of land use and scattered throughout the county. Industrial use accounts for 5.5% of land use and mostly concentrated in Mvita (Mombasa Island)
and Changamwe (Mainland West). Transport use accounts for 4.6% of land use and mostly concentrated in Mvita (Mombasa Island)
and Changamwe (Mainland West) Mvita and Nyali are considered mainly urban; and underdeveloped area is small in Mvita (0% in
land use in Mvita) and Nyali (8.9% of land use in Nyali). Underdeveloped area (rural in nature) accounts for 45.4% of land use and mostly concentrated in
Kisauni (Mainland North) and Likoni (Mainland South).
Table 3.2.1: Current Land Use (Land Mass) in 2015 (Unit: km2)
Zone Island Mainland North Mainland West Mainland South Mombasa County Subcounty Mvita Kisauni Nyali Changamwe Jomvu Likoni
Residential 5.02 16.52 13.01 3.54 6.38 15.44 59.91
Commercial 1.22 2.28 1.29 0.89 1.82 0.68 8.18
Industrial 2.85 0.83 1.34 6.29 0.50 0.52 12.33
Education 0.91 0.86 0.81 0.27 0.05 0.35 3.25
Public Purpose 0.94 4.05 0.80 0.04 3.48 3.55 12.86
Public Utility 0.15 0.14 0.02 0.30 0.12 0.05 0.78
Transportation 2.47 1.15 1.38 3.85 0.43 0.94 10.22
Recreational 0.68 0.54 1.99 0.01 0.06 0.18 3.46
Beach 0.79 0.11 0.47 1.37
Agriculture 3.71 0.01 0.10 2.05 0.47 6.34
Forest 3.39 0.00 3.39
Undeveloped 48.94 2.02 2.81 20.13 27.62 101.52
Total 14.24 83.20 22.78 18.10 35.02 50.27 223.61
Source: Interim Report ISUDP-Mombasa, May 2015, County Government of Mombasa in collaboration with the Ministry of Land, Housing and Urban Development
Mombasa County is expected to grow in all directions except to the east due to the Indian Ocean. Major developments are expected in the Mainland South due to the development of the SEZ and southern bypass, which are currently under consideration. This will be accelerated by the consideration of the bridge development to join Mombasa Island and Mainland South. Likewise, developments to the Mainland West will greatly be influenced by the expansion of the Mombasa-Mariakani Road,
Project for Formulation of Comprehensive Development Master Plan in the Mombasa Gate City in the Republic of Kenya Final Report
3-5 Nippon Koei Co., Ltd. / PADECO Co., Ltd. / Eight-Japan Engineering Consultants Inc.
development of northern bypass and completion of standard gauge railway. In the Mainland North, the residential function is expected to influence much of the development with areas currently undeveloped changing the use to accommodate the increasing population. There is also increasing pressure to develop middle to high-density developments in previously low-density neighbourhoods in Mainland North.
3.2.2 Characteristics of Each Zone Regionally, Mombasa County is expected to play an important role as a gateway to the Northern Economic Corridor and influence the developments in the inland of Kenya and its neighbouring corridor states. The table below shows the regional profile of Mombasa County.
Table 3.2.2: Characteristics of the Mombasa Island Items Description
Administration Constituency/Subcounty: Mvita Ward: Mjiwa Kale/Makadara, Tudor, Tononoka, Shimanzi/Ganjoni, Majengo
Population 143,128 (2009), 143,128 (2015 (estimated)) Population share (2015 (estimated)): 12% Annual population growth rate (1979~2009): 0.1%
Area (km2) 14.16 Geography Surrounded by ocean and is relatively flat. Urban Characteristics
Land use: Residential use (35.3%), Industrial use (20.0%), Transport (17.3%), Commercial use (8.6%), Undeveloped (0%), and Others (18.8%) ➢ Main residential areas in the northwest: Majengo, Kingorani, Makupa, and Makande ➢ Main residential areas in the southeast: Makadara, Kibokoni, and Kizingo ➢ Main residential areas in the north: Bondeni, Buxton, and Tudor ➢ Main residential areas in the inner south: Ganjoni and M'baraki ➢ Kizingo area is a prime residential area in Mombasa County. ➢ Kibokoni adopts the Swahili architecture. ➢ Makadara is part of the Old Town consisting of a high number of descendants of Baluchi (from
Arabic word, 'quadr-ur-Rahman). ➢ Ganjoni is a residential zone mainly of middle income. ➢ Tudor has a mixed characteristics of a residential and commercial use. ➢ Land use in Kilindini at the west is port facility. ➢ Shimanzi is a large industrial zone in the Mombasa Island (between port and railway station).
Business core is defined by corridors such as Jomo Kenyatta Avenue as the main corridor, Digo Road, Nyerere Avenue, Haile Selassie Avenue, and Nkrumah Road (links treasury square and old port).
Because land use was not efficiently controlled, it resulted to a mix in land use, which created a mix in transport modes such as cars, trucks, matatu, tuk-tuk, and the pedestrian.
Transport network or hierarchy of roads is not clearly defined, which is causing the mix in transport mode and traffic congestion.
Development Issues
Efficient land use has to be proposed and utilised in the existing conditions including in the Old Town, heritage, Mama Ngina Drive, port, industrial and commercial areas.
New transport network for efficient transport flow has to be proposed for the traffic inside the island.
There is a need to conserve the rich historical and cultural heritage of Mombasa County, and such areas include the Old Town, Fort Jesus, Mama Ngina, and Mbaraki Pillar.
Source: JICA Expert Team
Table 3.2.3: Characteristics of Mainland North Items Description
Administration Constituency/Subcounty: Kisauni, Nyali Ward: Kisauni: Mjambere, Junda, Bamburi, Mwakirunge, Mtopanga, Magogoni, Shanzu Nyali: Frere Town, Ziwa La Ng'ombe, Mkomani, Kongowea, and Kadzandani.
Population 380,055 (2009), 490,543 (2015 (estimated)) Population share (2015 (estimated)): 42% Annual population growth rate (1979~2009): 5.3% One of the highest population growth areas
Project for Formulation of Comprehensive Development Master Plan in the Mombasa Gate City in the Republic of Kenya Final Report
3-6 Nippon Koei Co., Ltd. / PADECO Co., Ltd. / Eight-Japan Engineering Consultants Inc.
Items Description Area (km2) 104.78 Geography Eastern part is facing the Indian Ocean and land is relatively flat.
West and Northwest parts are facing the Tudor River. Northeast part is hilly with some scattered settlements including an encroachment.
Urban Characteristics
Nyali: Residential use (57.1%), Commercial use (8.6%), Industrial use (5.9%), Undeveloped (8.9%), and
Others (19.5%). Mainly composed of low rise residential areas for high income population, with a high demand for
development. High rise building construction is observed (hotels, apartment, and offices). Numerous commercial complexes and shopping malls serving a high-end population/market.
Examples: Nyali Cinemax Complex, Nyali Golf Club, Oshwal Academy, and Mombasa Academy Numerous beach front hotels in the North Coast. Market area consisting of the Old Nyali, which is a low density and developed on plot basis, and
the New Nyali featuring multiple unit developments. Kisauni: Residential use (19.9%), Agricultural (4.5%), Forest (4.1%), Undeveloped (58.8%), and Others
(12.7%) South part of Kisauni has a large concentration of low income population where social problems,
such as drugs, are observed. Bamburi is mainly defined by a cement factory, Mijikenda Public Beach and Haller Park, as well as
a wildlife conservatory facility. There are numerous high density and low-income areas organised into villages and include Kisauni,
Bombolulu, Bamburi, Shanzu, Utange,and Mwakirunge. There are also informal settlements such as in the place of Ziwa La Ng'ombe in Bombolulu. Northern part of Kisauni is still undeveloped. Because of its hilly geography and poor access, it may not be suitable for development.
Development Issues
Urban sprawl is evident. Encroachment is seen in many areas which may cause land dispute for the future developments. Urban sprawl has to be controlled to the undeveloped areas.
Nyali should be kept as a comfortable residential area. Some developments should be controlled (industrial activity, high-rise building). And, can be considered self-contained in terms of work, recreation, and residential places.
Kongowea Market exists in the area where Nyali Road, Old Malindi Road, and Kengelani Road intersect making it congested. Transport condition has to be improved through urban development.
Infrastructure and public services has to be upgraded in the urbanised area. Control measure for coastal area has to be considered.
Source: JICA Expert Team
Table 3.2.4: Characteristics of Mainland West Items Description
Administration Constituency/Subcounty: Changamwe, Jomvu Ward: Changamwe: Port Reitz, Kipevu, Airport, Miritini, Chaani Jomvu:Jomvu Kuu, Magongo, Mikindani
Population 250,179 (2009), 305,285 (2015 (estimated)) Population share (2015 (estimated)): 26% Annual population growth rate (1979~2009): 3.8%
Area (km2) 53.37 (Changamwe: 18.56, Jomvu: 24.81) Geography Surrounded by the Tudor River and Reitz Port
Flat area is limited Urban Characteristics
Changamwe: Industrial use (34.8%), Transport use (21.3%), Residential use (19.6%), Undeveloped (15.5%), and Others (8.8%)
Jomvu: Residential use (18.2%), Public use (9.9%), Agricultural use (5.9%), Undeveloped (57.5%), and Others (8.5%)
The Mainland West is mainly a heavy industrial zone. It also serves as a commercial node although it is not well serviced, and the sewerage (used mainly for septic tanks and pit latrines) is an example. There are numerous CFSs for freight services, and local and regional traffic are mixed.
Magongo is predominantly a low class neighbourhood characterised by poor housing and generally lack in infrastructures such as electricity, water, and sewerage.
Miritini is mainly an industrial district along the Mombasa-Nairobi Highway. Mikindani is a heavy industrial district. There are two high density residential zones, namely, Changamwe-Magongo and Mikindani areas. Low density clusters are Jomvu, Miritini, and Port Reitz.
Project for Formulation of Comprehensive Development Master Plan in the Mombasa Gate City in the Republic of Kenya Final Report
3-7 Nippon Koei Co., Ltd. / PADECO Co., Ltd. / Eight-Japan Engineering Consultants Inc.
Items Description Changamwe and Magongo have public (county government) and company housing; Kenya Pipeline
and Kenya Revenue Authority/Customs. Moi International Airport and Mombasa Oil Refinery key national installations are in this zone. Because of the existence of the logistic facilities, traffic congestion is worst in Mombasa County
and disturbs the local traffic. Development Issues
Due to the expansion of port, traffic congestion is expected to worsen even after the development of the SGR and Kipevu Link.
Northern Bypass, Southern Bypass, Northern Corridor, and SGR will connect in this area. Proper urban development (land use) with transport network has to be considered to solve the traffic problem. Local and regional traffic have to be separated.
Controlled urban development and development of commuter train to separate local and regional traffic are needed.
Source: JICA Expert Team
Table 3.2.5: Characteristics of Mainland South Items Description
Administration Constituency/Subcounty: Likoni Ward: Mtongwe, ShikaAdabu, Bofu, Likoni,Timbwani
Population 166,008 (2009), 224,111 (2015 (estimated)) Population share (2015 (estimated)): 19% Annual population growth rate (1979~2009): 4.8%
Area (km2) 50.51 Geography Eastern part is rather flat and western part is hilly. Urban Characteristics
Residential use (30.7%), Public use (7.1%), Undeveloped (54.9%) and Others (7.3%) Low income settlements inhabited by natives and a significant population of migrants. High
prevalence of high informal settlements in the area. Most dwellings in Likoni multi-dwelling, Swahili houses, or apartments. There are isolated areas for middle to high income in Shelly Beach and Mtongwe. It is the cluster closest to the central business district (Central Business District (CBD)) but Likoni
Channel is a major obstacle. People use ferry to commute to the island. Area lacks sewer and relies heavily on septic tanks and pit latrines. The area is isolated due to poor access to economic centres. SEZ is expected to contribute to employment in the area.
Development Issues
Connection with SEZ in terms of transport and land use has to be proposed to accommodate expected employment and increase traffic after operation of SEZ.
Southern Bypass and SEZ are expected to change the socioeconomic condition. Proper land use and transport network have to be proposed.
Infrastructure and public service have to be improved. Source: JICA Expert Team
3.2.3 Issues and Development Direction of Urban Development The issues and development direction of urban development are summarised below.
(1) Sprawl and Expansion of Uncontrolled Urban Development The sprawl and expansion of uncontrolled urban development occur for several reasons, and the main reasons are that in 1971, plans did not materialise mainly because the 1971 Strategic Plan was not approved, the detailed plan has not been developed, and development control was not effectively executed. In order to stop the sprawl, the master plan has to be updated to match the development trend and to clarify development direction including development promotion area and controlled area for effective control.
(2) Insufficient Provision of Infrastructure and Urban Services Because of the population increase and expansion of urbanised area, infrastructure and urban services are inadequate in terms of quantity and quality. Urban infrastructure is poor in the urban area and mostly aged and not functioning optimally. In suburban areas, infrastructure development is unable to catch up
Project for Formulation of Comprehensive Development Master Plan in the Mombasa Gate City in the Republic of Kenya Final Report
3-8 Nippon Koei Co., Ltd. / PADECO Co., Ltd. / Eight-Japan Engineering Consultants Inc.
with the population growth and urbanisation. Similar condition can be observed for urban services such as education and health. Both quality and quantity of the service is poor.
Infrastructure and urban services have to be improved for the serving population in Mombasa County and for Mombasa County to function as a “Gateway City” for the Northern Economic Corridor.
(3) Poor Linkage of Road Network and Land Use Mombasa County is composed of mainland and island. Thus, there are some constraints in urbanisation and road network. Urbanisation is concentrated in the area where transport connects the island and mainland. Kongowea is located at the area where Nyali Bridge connects the island and the mainland, and where markets and some other commercial functions are developed. Due to the poor intersection design and poor urban development plan, the area is congested with vehicles and pedestrians. Such type of areas can be seen at many locations in Mombasa County. Proper urban development has to be adopted to improve the conditions.
(4) Mixture of Urban Function and Logistic Function One of the main urban characteristics of Mombasa County is the mixture of urban function and logistic function, particularly in the areas of Changamwe and Jomvu, where airport, port, CFS, industrial, warehouse and residential functions are mixed. Heavy traffic generated from and to the port is the main cause of traffic congestion and air pollution, which is considered as a disturbing factor for the local people.
Regional traffic and local traffic have to be separated to minimise the impact on local people, transport and land use have to be considered together to avoid further congestion expected from the expansion of port and development of subcentres.
(5) Excessive Concentration and Deteriorated Infrastructure in the Island
One of the major issues in Mombasa County is the congestion in the island, which is caused by mixed functions, including residential function, commercial function, industrial function, and port function. Mixed function (port and industrial) is causing inflow of Northern Corridor related traffic. Road network or artery traffic flow is also not clearly defined, which is creating mixed transport mode. In addition, most of the infrastructure were developed during the colonial period and most of which are now in poor condition. The wastewater treatment plant, for example, is not functioning anymore.
The condition of the island has to be improved through proper land use and proper traffic flow, including the installation of the new public transport system and rehabilitation of infrastructure.
3.3 Informal Settlements
3.3.1 Overview1 As per the Department of Planning, Land and Housing, and Mombasa County Government, about 65% of the residents of Mombasa County are housed in informal settlements, which is characterised as settlements without guaranteed land titles.
1“Mombasa County Informal Settlements Inventory Report” 2014
Project for Formulation of Comprehensive Development Master Plan in the Mombasa Gate City in the Republic of Kenya Final Report
3-9 Nippon Koei Co., Ltd. / PADECO Co., Ltd. / Eight-Japan Engineering Consultants Inc.
Mombasa County was developed as a trading centre, which was vibrant for its trade in items such as glass, brass, copper, iron rhino horn and the infamous slave trade passing through the coast. There were many immigrants from the countries of the Middle East and Indian subcontinent who came in as traders. The trading links did not only leave their mark on the city’s social and religious composition but also on its land tenure system.
For instance, before its independence, the whole of the coastal strip was under the rule of the Sultanate of Zanzibar. In 1963, the government made an agreement with the Sultan of Zanzibar to have the strip taken over by the Kenyan government. By then, only the Arab inhabitants had the title deeds, whilest the locals who comprised the Mijikenda community lived on the lands without any documents indicating the amount of land they owned. Immediately after Kenya's independence in 1963 and the years that followed, most of the land in the area was allocated without considering those who will be disinherited, creating a class of beneficiaries who were not living in Mombasa County and turning the natives into squatters or illegal settlers. In some areas, people were allowed to squat but with a fee, which was given to the owners. This created a scenario of absentee landlords who continue to control many parts of the city up to date.
Generally, given the fact that majority of the land in Mombasa County is held under the freehold form of ownership with the privately-owned land having been lent to tenants most of whom have for generations rented the land upon which their temporary houses are built, this kind of land ownership system has continued to hamper the planning and urban management efforts in the settlements. This system of ownership complicates the planning efforts since spatial planning, infrastructure development and provision of public facilities are only possible with the consent of the landowners, many of whom are absentee landlords living elsewhere in the country and even overseas.
3.3.2 Definition of Informal Settlements The United Nations (UN)-Habitat defines a slum household as a group of individuals living under the same roof in an urban area who lack one or more of the following:
Durable housing of a permanent nature that protects against extreme climate conditions. Sufficient living space which means not more than three people sharing the same room. Easy access to safe water in sufficient amounts at affordable price. Access to adequate sanitation in the form of a private or public toilet shared by a reasonable
number of people. Security of tenure that prevents forced eviction.
The Kenya Informal Settlements Improvement Programme (KISIP) also defines informal settlement as an unplanned settlement or area where housing is not in compliance with the current planning and building regulations (unauthorised housing). Such settlement lacks basic infrastructure and service delivery.
The land tenure arrangements prevalent in informal settlements in Mombasa County include:
Unofficial allocation of government land to private individuals (formally done by provincial administration or politicians).
Temporary occupation of private land with permission from the landowners. Land originally occupied under customary tenure on which adjudication and issue of title is
completed or in progress. Land temporarily allocated to specific groups of people, such as customary owners displaced by
government projects, and occupied by their descendants. Tenancy-at-will in privately-owned areas, some with approved layouts (this is the most prevalent form of occupation in informal settlements in Mombasa County). Many of the owners are absent and construction increasingly utilises permanent materials, although prohibited by the regulations.
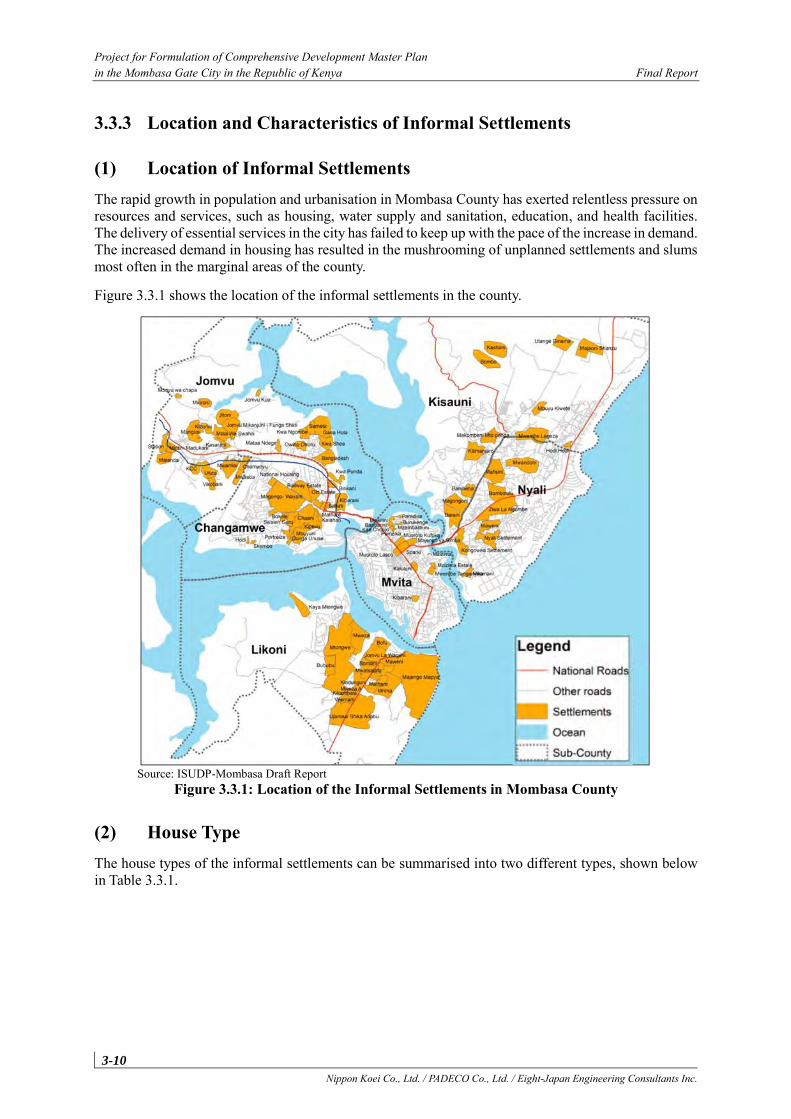
Project for Formulation of Comprehensive Development Master Plan in the Mombasa Gate City in the Republic of Kenya Final Report
3-10 Nippon Koei Co., Ltd. / PADECO Co., Ltd. / Eight-Japan Engineering Consultants Inc.
3.3.3 Location and Characteristics of Informal Settlements
(1) Location of Informal Settlements The rapid growth in population and urbanisation in Mombasa County has exerted relentless pressure on resources and services, such as housing, water supply and sanitation, education, and health facilities. The delivery of essential services in the city has failed to keep up with the pace of the increase in demand. The increased demand in housing has resulted in the mushrooming of unplanned settlements and slums most often in the marginal areas of the county.
Figure 3.3.1 shows the location of the informal settlements in the county.
Source: ISUDP-Mombasa Draft Report
Figure 3.3.1: Location of the Informal Settlements in Mombasa County
(2) House Type The house types of the informal settlements can be summarised into two different types, shown below in Table 3.3.1.
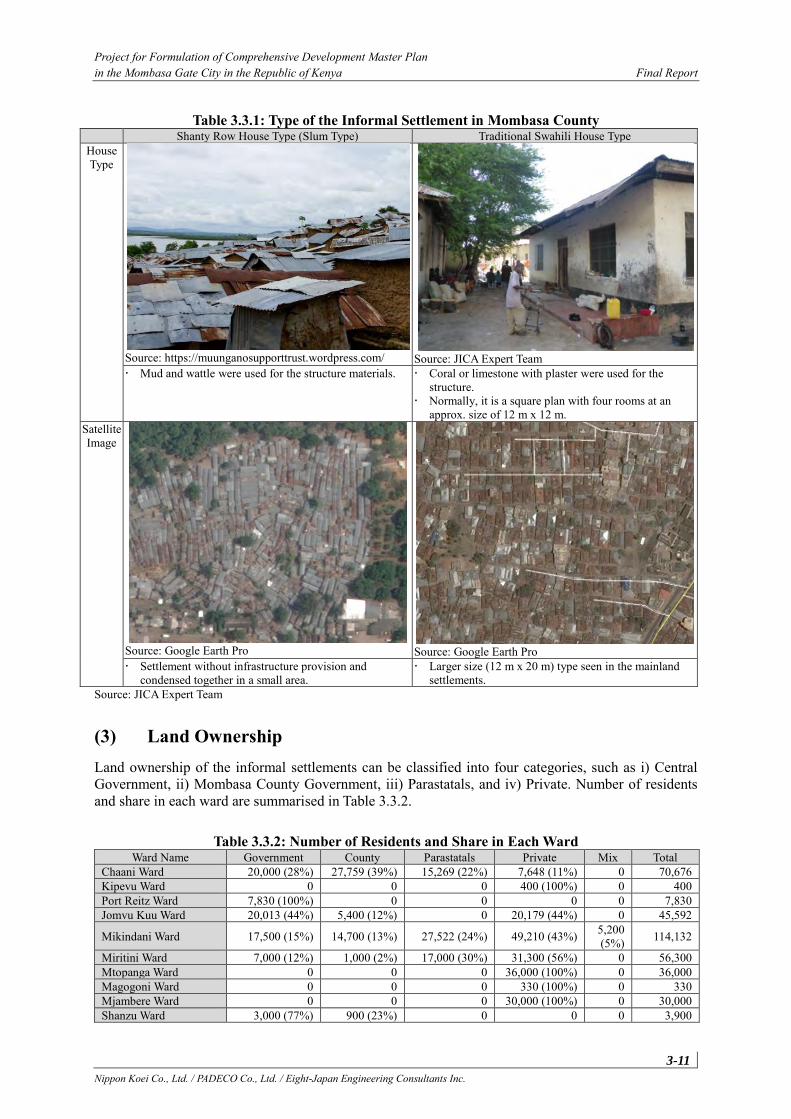
Project for Formulation of Comprehensive Development Master Plan in the Mombasa Gate City in the Republic of Kenya Final Report
3-11 Nippon Koei Co., Ltd. / PADECO Co., Ltd. / Eight-Japan Engineering Consultants Inc.
Table 3.3.1: Type of the Informal Settlement in Mombasa County Shanty Row House Type (Slum Type) Traditional Swahili House Type
House Type
Source: https://muunganosupporttrust.wordpress.com/
Source: JICA Expert Team
Mud and wattle were used for the structure materials. Coral or limestone with plaster were used for the structure.
Normally, it is a square plan with four rooms at an approx. size of 12 m x 12 m.
Satellite Image
Source: Google Earth Pro
Source: Google Earth Pro
Settlement without infrastructure provision and condensed together in a small area.
Larger size (12 m x 20 m) type seen in the mainland settlements.
Source: JICA Expert Team
(3) Land Ownership Land ownership of the informal settlements can be classified into four categories, such as i) Central Government, ii) Mombasa County Government, iii) Parastatals, and iv) Private. Number of residents and share in each ward are summarised in Table 3.3.2.
Table 3.3.2: Number of Residents and Share in Each Ward Ward Name Government County Parastatals Private Mix Total
Chaani Ward 20,000 (28%) 27,759 (39%) 15,269 (22%) 7,648 (11%) 0 70,676 Kipevu Ward 0 0 0 400 (100%) 0 400 Port Reitz Ward 7,830 (100%) 0 0 0 0 7,830 Jomvu Kuu Ward 20,013 (44%) 5,400 (12%) 0 20,179 (44%) 0 45,592
Mikindani Ward 17,500 (15%) 14,700 (13%) 27,522 (24%) 49,210 (43%) 5,200 (5%) 114,132
Miritini Ward 7,000 (12%) 1,000 (2%) 17,000 (30%) 31,300 (56%) 0 56,300 Mtopanga Ward 0 0 0 36,000 (100%) 0 36,000 Magogoni Ward 0 0 0 330 (100%) 0 330 Mjambere Ward 0 0 0 30,000 (100%) 0 30,000 Shanzu Ward 3,000 (77%) 900 (23%) 0 0 0 3,900
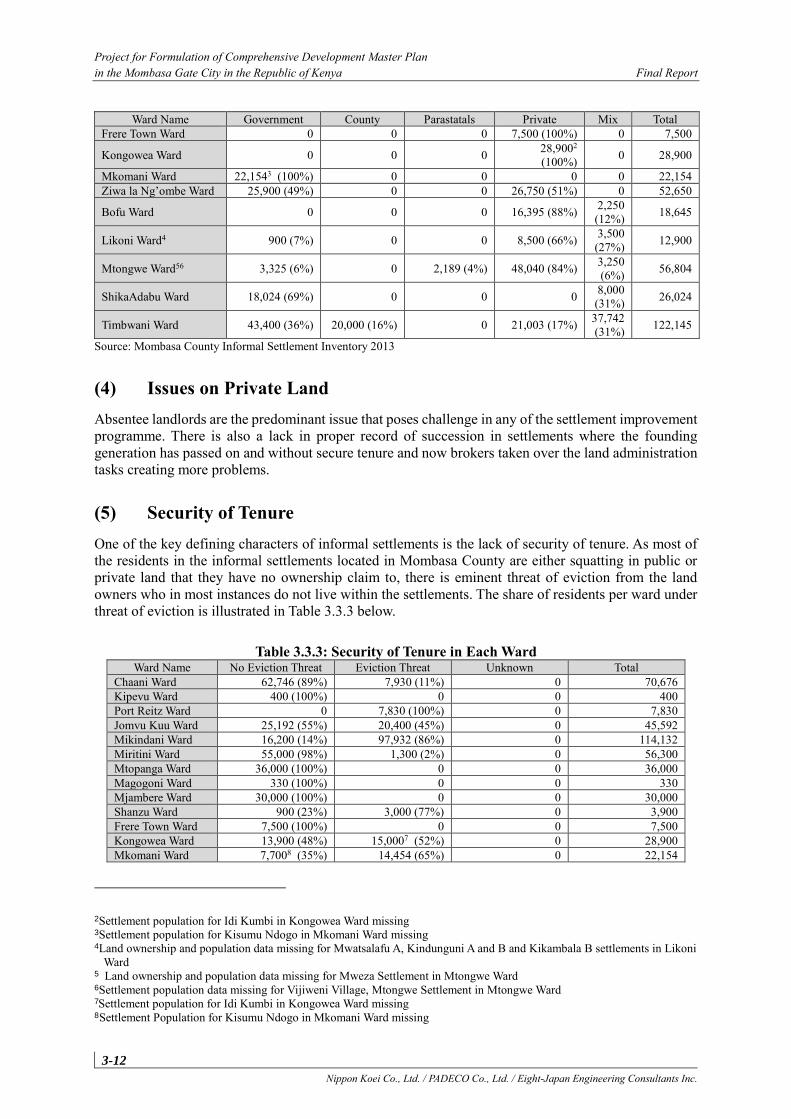
Project for Formulation of Comprehensive Development Master Plan in the Mombasa Gate City in the Republic of Kenya Final Report
3-12 Nippon Koei Co., Ltd. / PADECO Co., Ltd. / Eight-Japan Engineering Consultants Inc.
Ward Name Government County Parastatals Private Mix Total Frere Town Ward 0 0 0 7,500 (100%) 0 7,500
Kongowea Ward 0 0 0 28,9002 (100%) 0 28,900
Mkomani Ward 22,1543 (100%) 0 0 0 0 22,154 Ziwa la Ng’ombe Ward 25,900 (49%) 0 0 26,750 (51%) 0 52,650
Bofu Ward 0 0 0 16,395 (88%) 2,250 (12%) 18,645
Likoni Ward4 900 (7%) 0 0 8,500 (66%) 3,500 (27%) 12,900
Mtongwe Ward56 3,325 (6%) 0 2,189 (4%) 48,040 (84%) 3,250 (6%) 56,804
ShikaAdabu Ward 18,024 (69%) 0 0 0 8,000 (31%) 26,024
Timbwani Ward 43,400 (36%) 20,000 (16%) 0 21,003 (17%) 37,742 (31%) 122,145
Source: Mombasa County Informal Settlement Inventory 2013
(4) Issues on Private Land Absentee landlords are the predominant issue that poses challenge in any of the settlement improvement programme. There is also a lack in proper record of succession in settlements where the founding generation has passed on and without secure tenure and now brokers taken over the land administration tasks creating more problems.
(5) Security of Tenure One of the key defining characters of informal settlements is the lack of security of tenure. As most of the residents in the informal settlements located in Mombasa County are either squatting in public or private land that they have no ownership claim to, there is eminent threat of eviction from the land owners who in most instances do not live within the settlements. The share of residents per ward under threat of eviction is illustrated in Table 3.3.3 below.
Table 3.3.3: Security of Tenure in Each Ward Ward Name No Eviction Threat Eviction Threat Unknown Total
Chaani Ward 62,746 (89%) 7,930 (11%) 0 70,676 Kipevu Ward 400 (100%) 0 0 400 Port Reitz Ward 0 7,830 (100%) 0 7,830 Jomvu Kuu Ward 25,192 (55%) 20,400 (45%) 0 45,592 Mikindani Ward 16,200 (14%) 97,932 (86%) 0 114,132 Miritini Ward 55,000 (98%) 1,300 (2%) 0 56,300 Mtopanga Ward 36,000 (100%) 0 0 36,000 Magogoni Ward 330 (100%) 0 0 330 Mjambere Ward 30,000 (100%) 0 0 30,000 Shanzu Ward 900 (23%) 3,000 (77%) 0 3,900 Frere Town Ward 7,500 (100%) 0 0 7,500 Kongowea Ward 13,900 (48%) 15,0007 (52%) 0 28,900 Mkomani Ward 7,7008 (35%) 14,454 (65%) 0 22,154
2Settlement population for Idi Kumbi in Kongowea Ward missing 3Settlement population for Kisumu Ndogo in Mkomani Ward missing 4Land ownership and population data missing for Mwatsalafu A, Kindunguni A and B and Kikambala B settlements in Likoni
Ward 5 Land ownership and population data missing for Mweza Settlement in Mtongwe Ward 6Settlement population data missing for Vijiweni Village, Mtongwe Settlement in Mtongwe Ward 7Settlement population for Idi Kumbi in Kongowea Ward missing 8Settlement Population for Kisumu Ndogo in Mkomani Ward missing
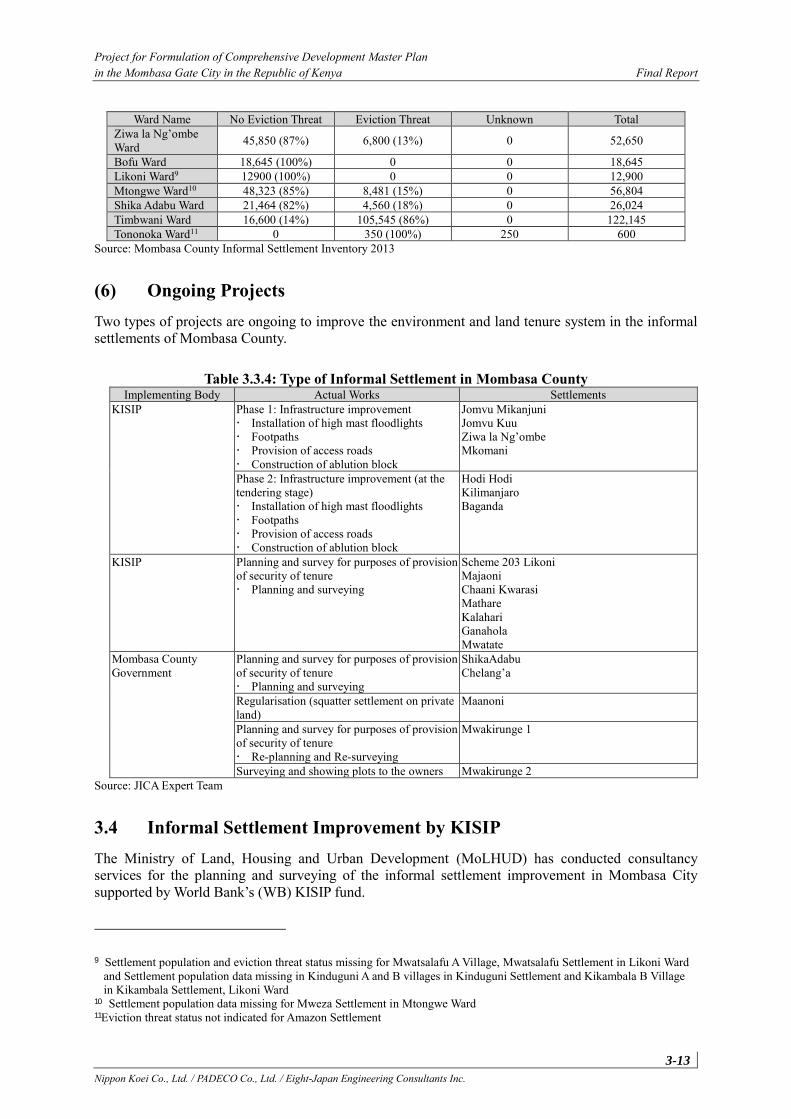
Project for Formulation of Comprehensive Development Master Plan in the Mombasa Gate City in the Republic of Kenya Final Report
3-13 Nippon Koei Co., Ltd. / PADECO Co., Ltd. / Eight-Japan Engineering Consultants Inc.
Ward Name No Eviction Threat Eviction Threat Unknown Total Ziwa la Ng’ombe Ward 45,850 (87%) 6,800 (13%) 0 52,650
Bofu Ward 18,645 (100%) 0 0 18,645 Likoni Ward9 12900 (100%) 0 0 12,900 Mtongwe Ward10 48,323 (85%) 8,481 (15%) 0 56,804 Shika Adabu Ward 21,464 (82%) 4,560 (18%) 0 26,024 Timbwani Ward 16,600 (14%) 105,545 (86%) 0 122,145 Tononoka Ward11 0 350 (100%) 250 600
Source: Mombasa County Informal Settlement Inventory 2013
(6) Ongoing Projects Two types of projects are ongoing to improve the environment and land tenure system in the informal settlements of Mombasa County.
Table 3.3.4: Type of Informal Settlement in Mombasa County Implementing Body Actual Works Settlements
KISIP Phase 1: Infrastructure improvement Installation of high mast floodlights Footpaths Provision of access roads Construction of ablution block
Jomvu Mikanjuni Jomvu Kuu Ziwa la Ng’ombe Mkomani
Phase 2: Infrastructure improvement (at the tendering stage) Installation of high mast floodlights Footpaths Provision of access roads Construction of ablution block
Hodi Hodi Kilimanjaro Baganda
KISIP Planning and survey for purposes of provision of security of tenure Planning and surveying
Scheme 203 Likoni Majaoni Chaani Kwarasi Mathare Kalahari Ganahola Mwatate
Mombasa County Government
Planning and survey for purposes of provision of security of tenure Planning and surveying
ShikaAdabu Chelang’a
Regularisation (squatter settlement on private land)
Maanoni
Planning and survey for purposes of provision of security of tenure Re-planning and Re-surveying
Mwakirunge 1
Surveying and showing plots to the owners Mwakirunge 2 Source: JICA Expert Team
3.4 Informal Settlement Improvement by KISIP The Ministry of Land, Housing and Urban Development (MoLHUD) has conducted consultancy services for the planning and surveying of the informal settlement improvement in Mombasa City supported by World Bank’s (WB) KISIP fund.
9 Settlement population and eviction threat status missing for Mwatsalafu A Village, Mwatsalafu Settlement in Likoni Ward
and Settlement population data missing in Kinduguni A and B villages in Kinduguni Settlement and Kikambala B Village in Kikambala Settlement, Likoni Ward
10 Settlement population data missing for Mweza Settlement in Mtongwe Ward 11Eviction threat status not indicated for Amazon Settlement
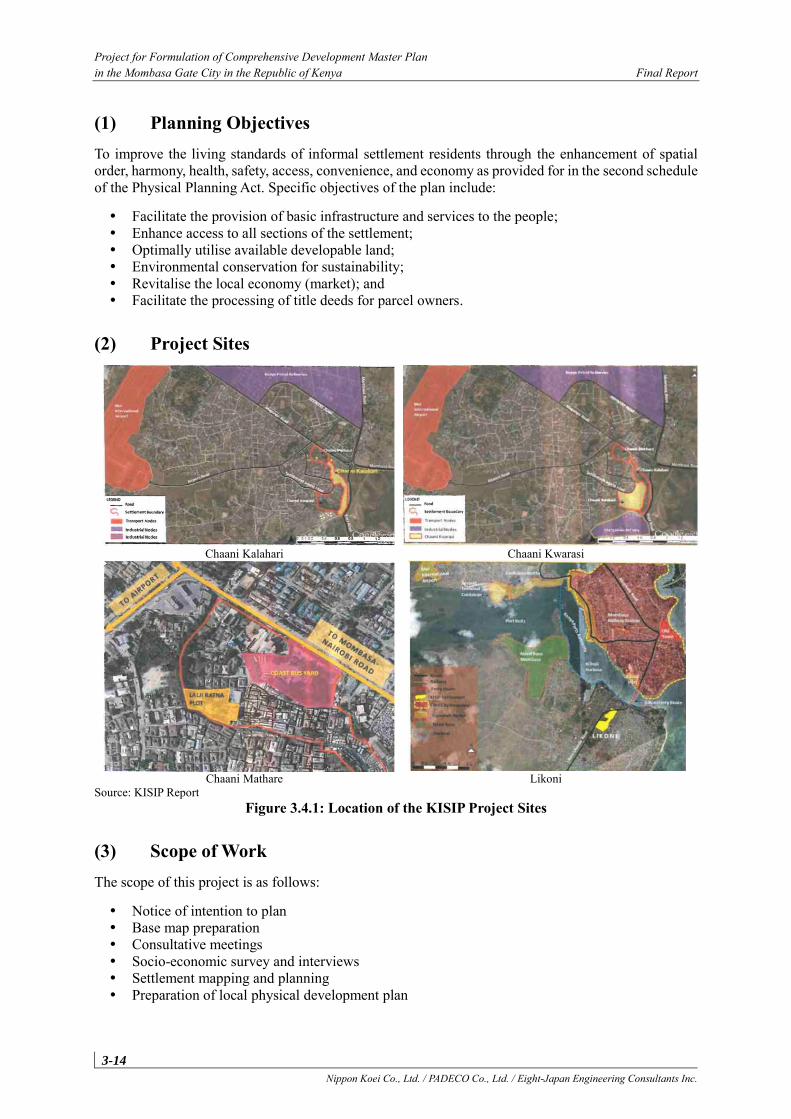
Project for Formulation of Comprehensive Development Master Plan in the Mombasa Gate City in the Republic of Kenya Final Report
3-14 Nippon Koei Co., Ltd. / PADECO Co., Ltd. / Eight-Japan Engineering Consultants Inc.
(1) Planning Objectives To improve the living standards of informal settlement residents through the enhancement of spatial order, harmony, health, safety, access, convenience, and economy as provided for in the second schedule of the Physical Planning Act. Specific objectives of the plan include:
Facilitate the provision of basic infrastructure and services to the people; Enhance access to all sections of the settlement; Optimally utilise available developable land; Environmental conservation for sustainability; Revitalise the local economy (market); and Facilitate the processing of title deeds for parcel owners.
(2) Project Sites
Chaani Kalahari Chaani Kwarasi
Chaani Mathare Likoni
Source: KISIP Report Figure 3.4.1: Location of the KISIP Project Sites
(3) Scope of Work The scope of this project is as follows:
Notice of intention to plan Base map preparation Consultative meetings Socio-economic survey and interviews Settlement mapping and planning Preparation of local physical development plan
Project for Formulation of Comprehensive Development Master Plan in the Mombasa Gate City in the Republic of Kenya Final Report
3-15 Nippon Koei Co., Ltd. / PADECO Co., Ltd. / Eight-Japan Engineering Consultants Inc.
3.4.2 Issues and Development Direction of Informal Settlements
(1) Formalisation of Informal Settlements It refers to a legal process where improved residential areas are created with formal services through which residents obtain formal security of tenure. This can be achieved through in-situ upgrades (instances where governments build houses in the same area where there is an informal settlement), through relocation (the informal settlements are cleared and people are moved to a new development area) and also through having the informal settlement declared as a formal residential area, bringing about clearly demarcated land parcels and provision of services such as water and sanitation and residents obtaining formal security of tenure (issuance of an ownership document).
The aim of the formalisation of informal settlements is, amongst others, to provide certainty to people living in these areas. Once settlements have been formally recognised and infrastructure is put in place, people will feel secured enough to start investing in their dwellings.
(2) Upgrading Slum upgrading is a process through which informal areas are gradually improved, formalised, and incorporated into the city itself, through extending land, services, and citizenship to slum dwellers. It involves providing slum dwellers with the economic, social, institutional, and community services available to other citizens. These services include legal (land tenure), physical (infrastructure), social (e.g., health care or education), or economic.
Slum upgrading is not simply about water drainage or housing, but involves putting into motion the economic, social, institutional, and community activities that are needed to turn around the downward trends in the areas. These activities should be undertaken collaboratively amongst all parties involved—residents, community groups, businesses, as well as local and national authorities where applicable.
The activities often include the provision of basic services such as housing, streets, footpaths, drainage, clean water, sanitation, and sewage disposal. Also, access to education and health care are for upgrading.
In addition to the basic services, one of the key elements of slum upgrading is legalising or regularising properties and bringing secure land tenure to the residents.
Ultimately, upgrading efforts aim to create a dynamic in the community where there is a sense of ownership, entitlement, and inward investment in the area.
(3) Redevelopment (Conversion of Mid-rise Building) Slum redevelopment entails the acquisition of the area occupied by the informal settlement, demolition and removal of buildings, and improvements and re-planning the area. This is to allow the construction of high-rise structures and make use of the freed-up land for the provision of support infrastructure and public facilities. There is a need to consider temporary shelter during the construction and property management after the provision of the facilities.
(4) Relocation Slum relocation entails the clearing of the informal settlement in its current location and moving the residents to a new development in another location. This may be done so as to move the communities that are settled in vulnerable disaster-prone areas such as flood prone areas or those residing close to the ocean. Also, these communities can be relocated so as to protect the fragile marine ecosystems. Usually, strategies employed tend to ignore several dimensions of the lives of the dwellers. There is a need to
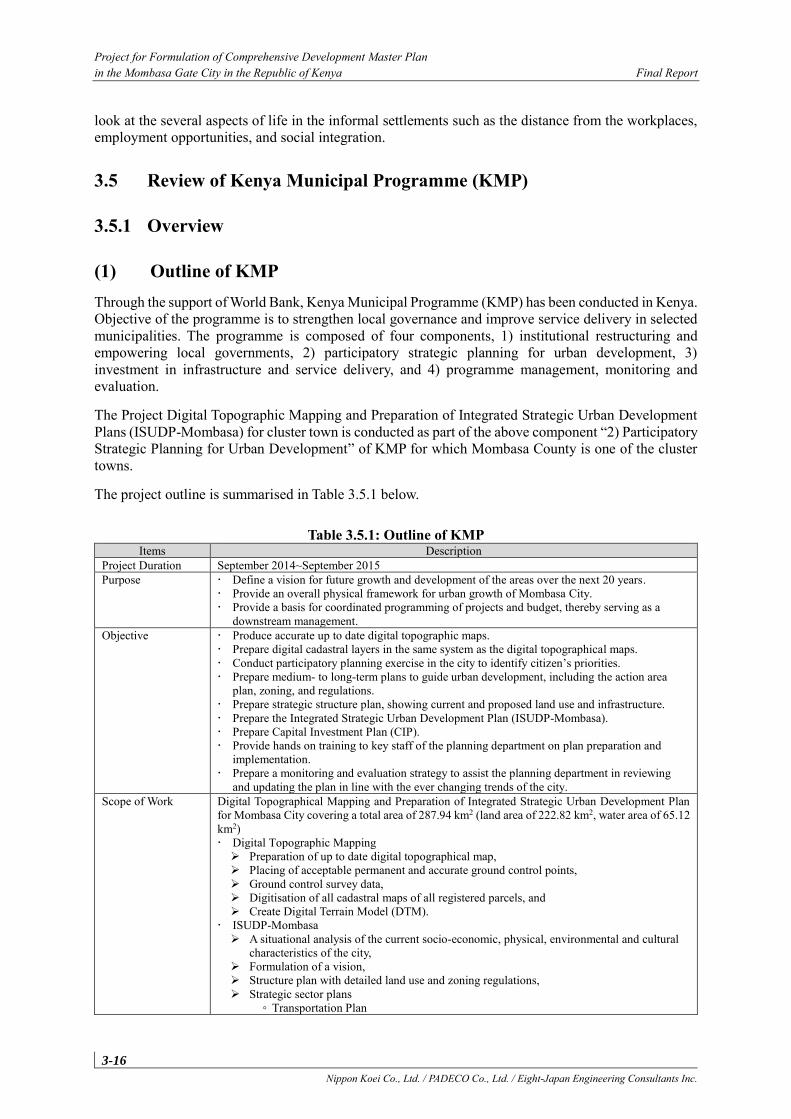
Project for Formulation of Comprehensive Development Master Plan in the Mombasa Gate City in the Republic of Kenya Final Report
3-16 Nippon Koei Co., Ltd. / PADECO Co., Ltd. / Eight-Japan Engineering Consultants Inc.
look at the several aspects of life in the informal settlements such as the distance from the workplaces, employment opportunities, and social integration.
3.5 Review of Kenya Municipal Programme (KMP)
3.5.1 Overview
(1) Outline of KMP Through the support of World Bank, Kenya Municipal Programme (KMP) has been conducted in Kenya. Objective of the programme is to strengthen local governance and improve service delivery in selected municipalities. The programme is composed of four components, 1) institutional restructuring and empowering local governments, 2) participatory strategic planning for urban development, 3) investment in infrastructure and service delivery, and 4) programme management, monitoring and evaluation.
The Project Digital Topographic Mapping and Preparation of Integrated Strategic Urban Development Plans (ISUDP-Mombasa) for cluster town is conducted as part of the above component “2) Participatory Strategic Planning for Urban Development” of KMP for which Mombasa County is one of the cluster towns.
The project outline is summarised in Table 3.5.1 below.
Table 3.5.1: Outline of KMP Items Description
Project Duration September 2014~September 2015 Purpose Define a vision for future growth and development of the areas over the next 20 years.
Provide an overall physical framework for urban growth of Mombasa City. Provide a basis for coordinated programming of projects and budget, thereby serving as a
downstream management. Objective Produce accurate up to date digital topographic maps.
Prepare digital cadastral layers in the same system as the digital topographical maps. Conduct participatory planning exercise in the city to identify citizen’s priorities. Prepare medium- to long-term plans to guide urban development, including the action area
plan, zoning, and regulations. Prepare strategic structure plan, showing current and proposed land use and infrastructure. Prepare the Integrated Strategic Urban Development Plan (ISUDP-Mombasa). Prepare Capital Investment Plan (CIP). Provide hands on training to key staff of the planning department on plan preparation and
implementation. Prepare a monitoring and evaluation strategy to assist the planning department in reviewing
and updating the plan in line with the ever changing trends of the city. Scope of Work Digital Topographical Mapping and Preparation of Integrated Strategic Urban Development Plan
for Mombasa City covering a total area of 287.94 km2 (land area of 222.82 km2, water area of 65.12 km2) Digital Topographic Mapping
➢ Preparation of up to date digital topographical map, ➢ Placing of acceptable permanent and accurate ground control points, ➢ Ground control survey data, ➢ Digitisation of all cadastral maps of all registered parcels, and ➢ Create Digital Terrain Model (DTM).
ISUDP-Mombasa ➢ A situational analysis of the current socio-economic, physical, environmental and cultural
characteristics of the city, ➢ Formulation of a vision, ➢ Structure plan with detailed land use and zoning regulations, ➢ Strategic sector plans
◦ Transportation Plan
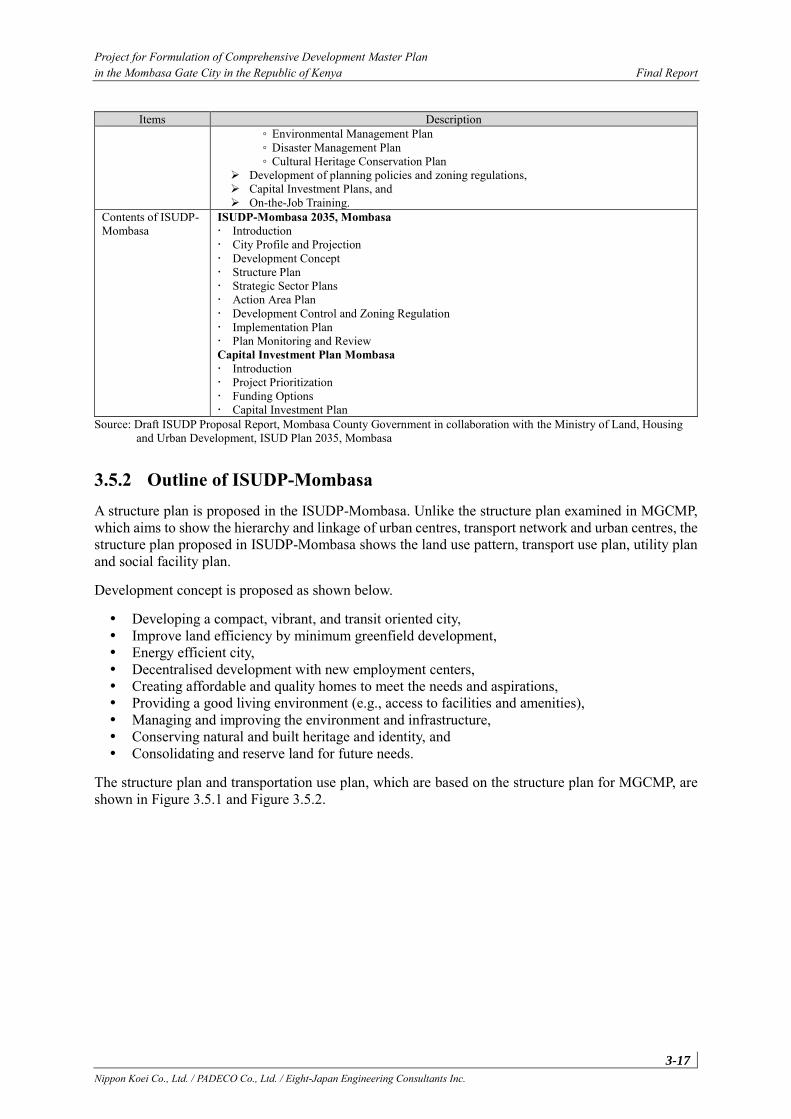
Project for Formulation of Comprehensive Development Master Plan in the Mombasa Gate City in the Republic of Kenya Final Report
3-17 Nippon Koei Co., Ltd. / PADECO Co., Ltd. / Eight-Japan Engineering Consultants Inc.
Items Description ◦ Environmental Management Plan ◦ Disaster Management Plan ◦ Cultural Heritage Conservation Plan
➢ Development of planning policies and zoning regulations, ➢ Capital Investment Plans, and ➢ On-the-Job Training.
Contents of ISUDP-Mombasa
ISUDP-Mombasa 2035, Mombasa Introduction City Profile and Projection Development Concept Structure Plan Strategic Sector Plans Action Area Plan Development Control and Zoning Regulation Implementation Plan Plan Monitoring and Review Capital Investment Plan Mombasa Introduction Project Prioritization Funding Options Capital Investment Plan
Source: Draft ISUDP Proposal Report, Mombasa County Government in collaboration with the Ministry of Land, Housing and Urban Development, ISUD Plan 2035, Mombasa
3.5.2 Outline of ISUDP-Mombasa A structure plan is proposed in the ISUDP-Mombasa. Unlike the structure plan examined in MGCMP, which aims to show the hierarchy and linkage of urban centres, transport network and urban centres, the structure plan proposed in ISUDP-Mombasa shows the land use pattern, transport use plan, utility plan and social facility plan.
Development concept is proposed as shown below.
Developing a compact, vibrant, and transit oriented city, Improve land efficiency by minimum greenfield development, Energy efficient city, Decentralised development with new employment centers, Creating affordable and quality homes to meet the needs and aspirations, Providing a good living environment (e.g., access to facilities and amenities), Managing and improving the environment and infrastructure, Conserving natural and built heritage and identity, and Consolidating and reserve land for future needs.
The structure plan and transportation use plan, which are based on the structure plan for MGCMP, are shown in Figure 3.5.1 and Figure 3.5.2.
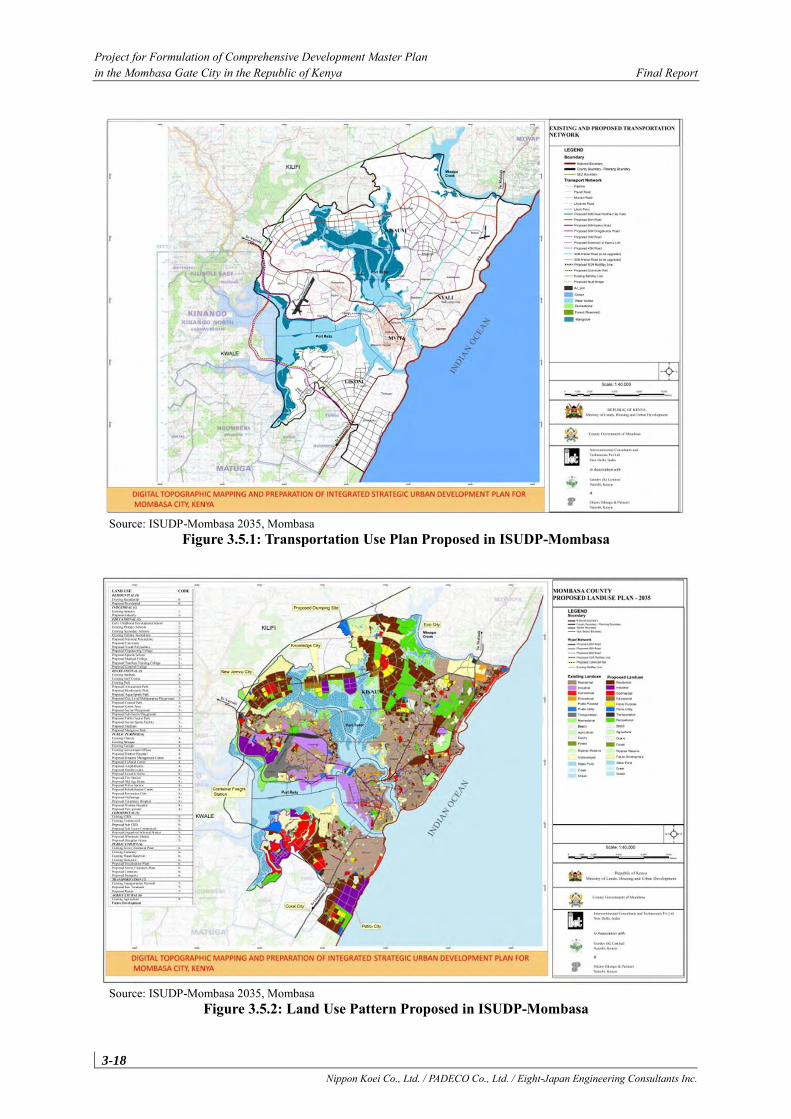
Project for Formulation of Comprehensive Development Master Plan in the Mombasa Gate City in the Republic of Kenya Final Report
3-18 Nippon Koei Co., Ltd. / PADECO Co., Ltd. / Eight-Japan Engineering Consultants Inc.
Source: ISUDP-Mombasa 2035, Mombasa
Figure 3.5.1: Transportation Use Plan Proposed in ISUDP-Mombasa
Source: ISUDP-Mombasa 2035, Mombasa
Figure 3.5.2: Land Use Pattern Proposed in ISUDP-Mombasa
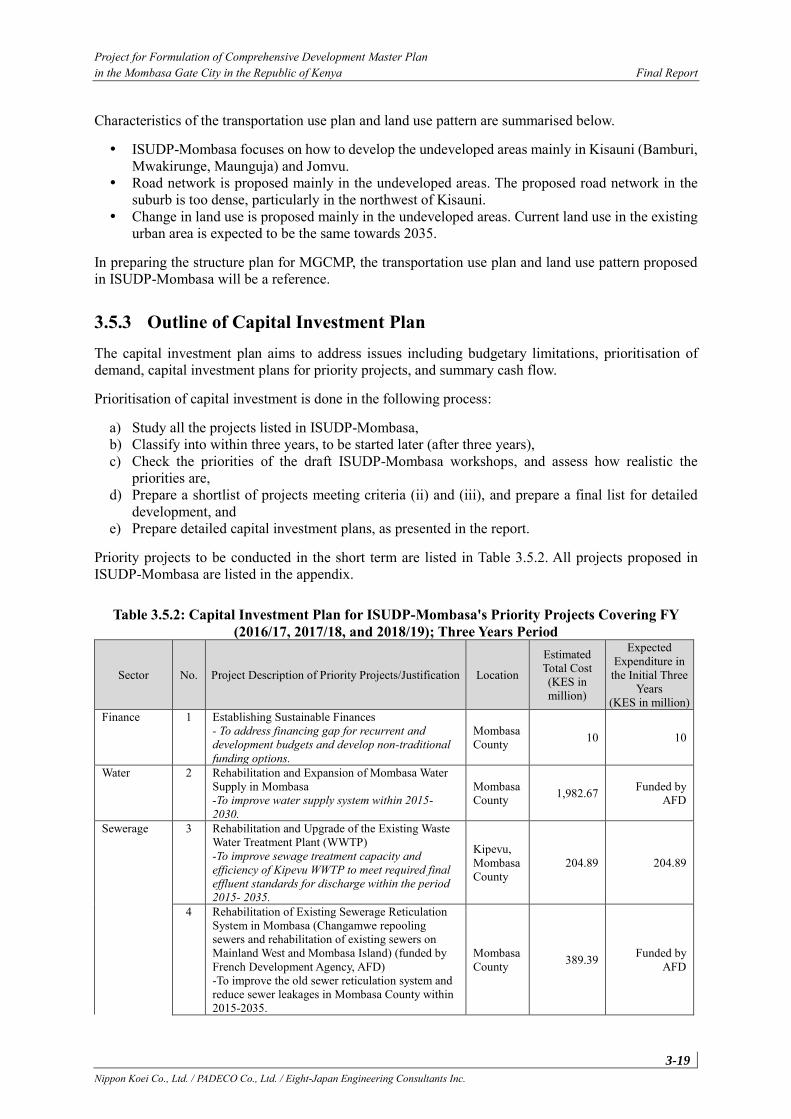
Project for Formulation of Comprehensive Development Master Plan in the Mombasa Gate City in the Republic of Kenya Final Report
3-19 Nippon Koei Co., Ltd. / PADECO Co., Ltd. / Eight-Japan Engineering Consultants Inc.
Characteristics of the transportation use plan and land use pattern are summarised below.
ISUDP-Mombasa focuses on how to develop the undeveloped areas mainly in Kisauni (Bamburi, Mwakirunge, Maunguja) and Jomvu.
Road network is proposed mainly in the undeveloped areas. The proposed road network in the suburb is too dense, particularly in the northwest of Kisauni.
Change in land use is proposed mainly in the undeveloped areas. Current land use in the existing urban area is expected to be the same towards 2035.
In preparing the structure plan for MGCMP, the transportation use plan and land use pattern proposed in ISUDP-Mombasa will be a reference.
3.5.3 Outline of Capital Investment Plan The capital investment plan aims to address issues including budgetary limitations, prioritisation of demand, capital investment plans for priority projects, and summary cash flow.
Prioritisation of capital investment is done in the following process:
a) Study all the projects listed in ISUDP-Mombasa, b) Classify into within three years, to be started later (after three years), c) Check the priorities of the draft ISUDP-Mombasa workshops, and assess how realistic the
priorities are, d) Prepare a shortlist of projects meeting criteria (ii) and (iii), and prepare a final list for detailed
development, and e) Prepare detailed capital investment plans, as presented in the report.
Priority projects to be conducted in the short term are listed in Table 3.5.2. All projects proposed in ISUDP-Mombasa are listed in the appendix.
Table 3.5.2: Capital Investment Plan for ISUDP-Mombasa's Priority Projects Covering FY (2016/17, 2017/18, and 2018/19); Three Years Period
Sector No. Project Description of Priority Projects/Justification Location
Estimated Total Cost (KES in million)
Expected Expenditure in
the Initial Three Years
(KES in million) Finance 1 Establishing Sustainable Finances
- To address financing gap for recurrent and development budgets and develop non-traditional funding options.
Mombasa County 10 10
Water 2 Rehabilitation and Expansion of Mombasa Water Supply in Mombasa -To improve water supply system within 2015-2030.
Mombasa County 1,982.67 Funded by
AFD
Sewerage 3 Rehabilitation and Upgrade of the Existing Waste Water Treatment Plant (WWTP) -To improve sewage treatment capacity and efficiency of Kipevu WWTP to meet required final effluent standards for discharge within the period 2015- 2035.
Kipevu, Mombasa County
204.89 204.89
4 Rehabilitation of Existing Sewerage Reticulation System in Mombasa (Changamwe repooling sewers and rehabilitation of existing sewers on Mainland West and Mombasa Island) (funded by French Development Agency, AFD) -To improve the old sewer reticulation system and reduce sewer leakages in Mombasa County within 2015-2035.
Mombasa County 389.39 Funded by
AFD
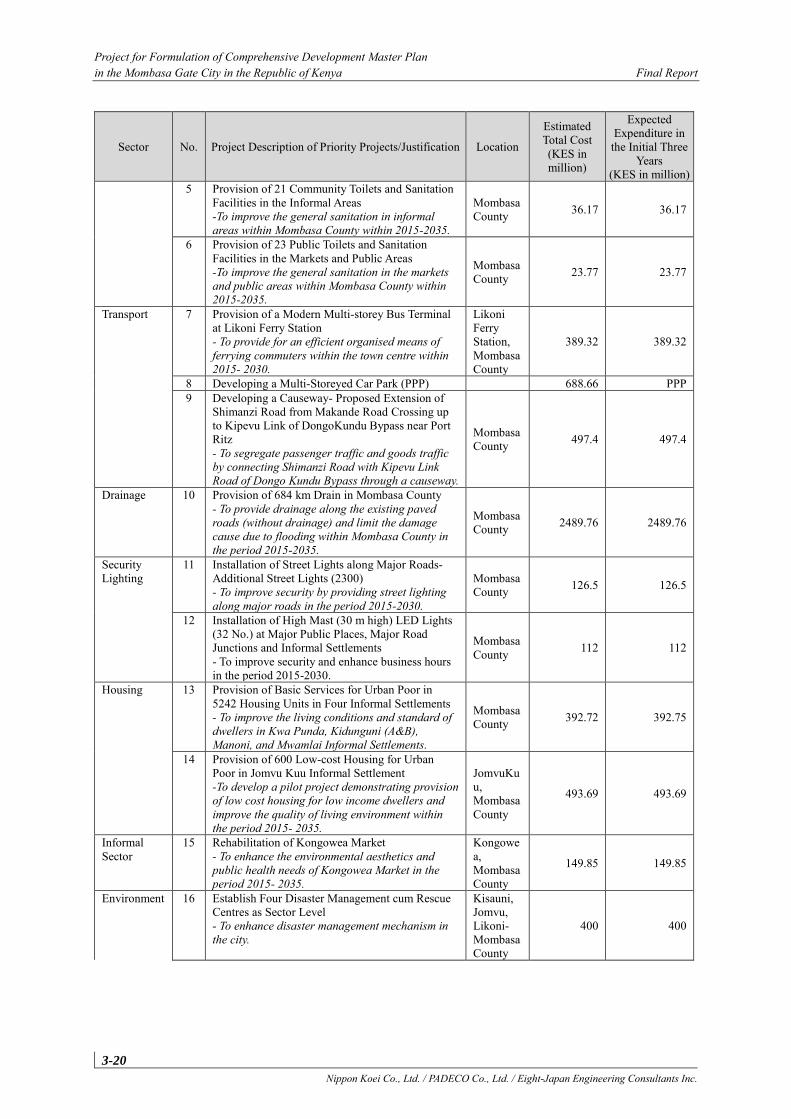
Project for Formulation of Comprehensive Development Master Plan in the Mombasa Gate City in the Republic of Kenya Final Report
3-20 Nippon Koei Co., Ltd. / PADECO Co., Ltd. / Eight-Japan Engineering Consultants Inc.
Sector No. Project Description of Priority Projects/Justification Location
Estimated Total Cost (KES in million)
Expected Expenditure in
the Initial Three Years
(KES in million) 5 Provision of 21 Community Toilets and Sanitation
Facilities in the Informal Areas -To improve the general sanitation in informal areas within Mombasa County within 2015-2035.
Mombasa County 36.17 36.17
6 Provision of 23 Public Toilets and Sanitation Facilities in the Markets and Public Areas -To improve the general sanitation in the markets and public areas within Mombasa County within 2015-2035.
Mombasa County 23.77 23.77
Transport 7 Provision of a Modern Multi-storey Bus Terminal at Likoni Ferry Station - To provide for an efficient organised means of ferrying commuters within the town centre within 2015- 2030.
Likoni Ferry Station, Mombasa County
389.32 389.32
8 Developing a Multi-Storeyed Car Park (PPP) 688.66 PPP 9 Developing a Causeway- Proposed Extension of
Shimanzi Road from Makande Road Crossing up to Kipevu Link of DongoKundu Bypass near Port Ritz - To segregate passenger traffic and goods traffic by connecting Shimanzi Road with Kipevu Link Road of Dongo Kundu Bypass through a causeway.
Mombasa County 497.4 497.4
Drainage 10 Provision of 684 km Drain in Mombasa County - To provide drainage along the existing paved roads (without drainage) and limit the damage cause due to flooding within Mombasa County in the period 2015-2035.
Mombasa County 2489.76 2489.76
Security Lighting
11 Installation of Street Lights along Major Roads- Additional Street Lights (2300) - To improve security by providing street lighting along major roads in the period 2015-2030.
Mombasa County 126.5 126.5
12 Installation of High Mast (30 m high) LED Lights (32 No.) at Major Public Places, Major Road Junctions and Informal Settlements - To improve security and enhance business hours in the period 2015-2030.
Mombasa County 112 112
Housing 13 Provision of Basic Services for Urban Poor in 5242 Housing Units in Four Informal Settlements - To improve the living conditions and standard of dwellers in Kwa Punda, Kidunguni (A&B), Manoni, and Mwamlai Informal Settlements.
Mombasa County 392.72 392.75
14 Provision of 600 Low-cost Housing for Urban Poor in Jomvu Kuu Informal Settlement -To develop a pilot project demonstrating provision of low cost housing for low income dwellers and improve the quality of living environment within the period 2015- 2035.
JomvuKuu, Mombasa County
493.69 493.69
Informal Sector
15 Rehabilitation of Kongowea Market - To enhance the environmental aesthetics and public health needs of Kongowea Market in the period 2015- 2035.
Kongowea, Mombasa County
149.85 149.85
Environment 16 Establish Four Disaster Management cum Rescue Centres as Sector Level - To enhance disaster management mechanism in the city.
Kisauni, Jomvu, Likoni- Mombasa County
400 400
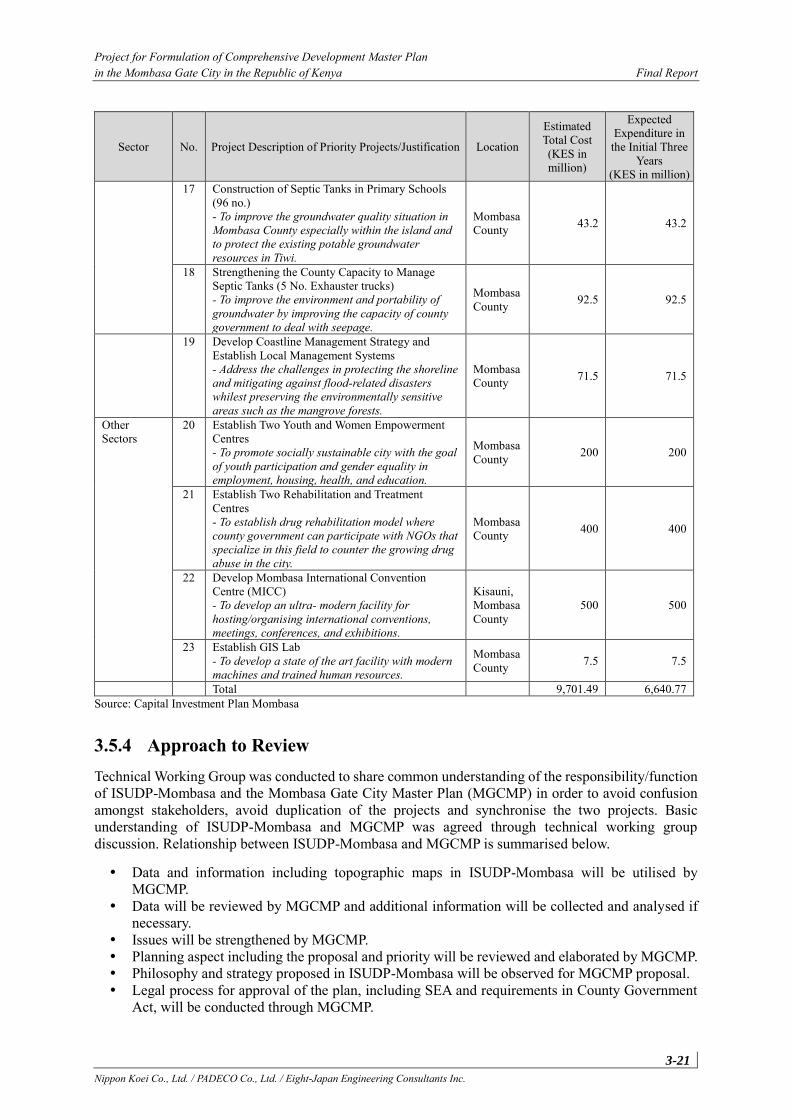
Project for Formulation of Comprehensive Development Master Plan in the Mombasa Gate City in the Republic of Kenya Final Report
3-21 Nippon Koei Co., Ltd. / PADECO Co., Ltd. / Eight-Japan Engineering Consultants Inc.
Sector No. Project Description of Priority Projects/Justification Location
Estimated Total Cost (KES in million)
Expected Expenditure in
the Initial Three Years
(KES in million) 17 Construction of Septic Tanks in Primary Schools
(96 no.) - To improve the groundwater quality situation in Mombasa County especially within the island and to protect the existing potable groundwater resources in Tiwi.
Mombasa County 43.2 43.2
18 Strengthening the County Capacity to Manage Septic Tanks (5 No. Exhauster trucks) - To improve the environment and portability of groundwater by improving the capacity of county government to deal with seepage.
Mombasa County 92.5 92.5
19 Develop Coastline Management Strategy and Establish Local Management Systems - Address the challenges in protecting the shoreline and mitigating against flood-related disasters whilest preserving the environmentally sensitive areas such as the mangrove forests.
Mombasa County 71.5 71.5
Other Sectors
20 Establish Two Youth and Women Empowerment Centres - To promote socially sustainable city with the goal of youth participation and gender equality in employment, housing, health, and education.
Mombasa County 200 200
21 Establish Two Rehabilitation and Treatment Centres - To establish drug rehabilitation model where county government can participate with NGOs that specialize in this field to counter the growing drug abuse in the city.
Mombasa County 400 400
22 Develop Mombasa International Convention Centre (MICC) - To develop an ultra- modern facility for hosting/organising international conventions, meetings, conferences, and exhibitions.
Kisauni, Mombasa County
500 500
23 Establish GIS Lab - To develop a state of the art facility with modern machines and trained human resources.
Mombasa County 7.5 7.5
Total 9,701.49 6,640.77 Source: Capital Investment Plan Mombasa
3.5.4 Approach to Review Technical Working Group was conducted to share common understanding of the responsibility/function of ISUDP-Mombasa and the Mombasa Gate City Master Plan (MGCMP) in order to avoid confusion amongst stakeholders, avoid duplication of the projects and synchronise the two projects. Basic understanding of ISUDP-Mombasa and MGCMP was agreed through technical working group discussion. Relationship between ISUDP-Mombasa and MGCMP is summarised below.
Data and information including topographic maps in ISUDP-Mombasa will be utilised by MGCMP.
Data will be reviewed by MGCMP and additional information will be collected and analysed if necessary.
Issues will be strengthened by MGCMP. Planning aspect including the proposal and priority will be reviewed and elaborated by MGCMP. Philosophy and strategy proposed in ISUDP-Mombasa will be observed for MGCMP proposal. Legal process for approval of the plan, including SEA and requirements in County Government
Act, will be conducted through MGCMP.
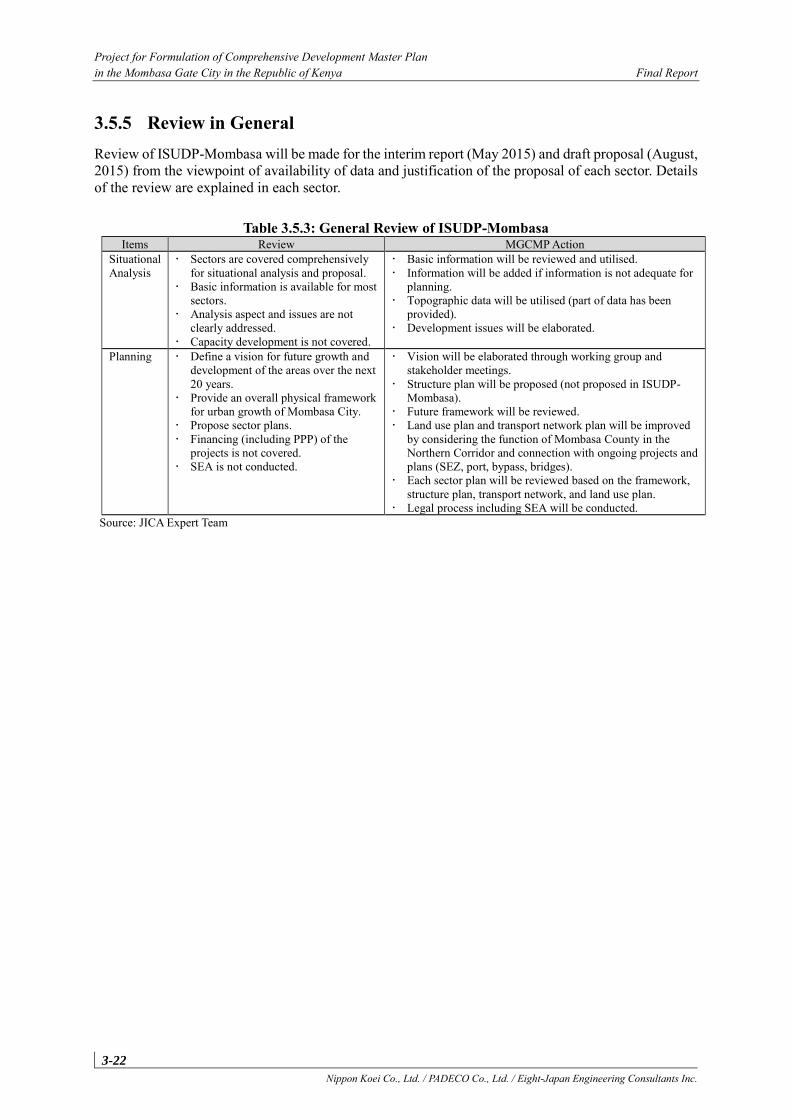
Project for Formulation of Comprehensive Development Master Plan in the Mombasa Gate City in the Republic of Kenya Final Report
3-22 Nippon Koei Co., Ltd. / PADECO Co., Ltd. / Eight-Japan Engineering Consultants Inc.
3.5.5 Review in General Review of ISUDP-Mombasa will be made for the interim report (May 2015) and draft proposal (August, 2015) from the viewpoint of availability of data and justification of the proposal of each sector. Details of the review are explained in each sector.
Table 3.5.3: General Review of ISUDP-Mombasa Items Review MGCMP Action
Situational Analysis
Sectors are covered comprehensively for situational analysis and proposal.
Basic information is available for most sectors.
Analysis aspect and issues are not clearly addressed.
Capacity development is not covered.
Basic information will be reviewed and utilised. Information will be added if information is not adequate for
planning. Topographic data will be utilised (part of data has been
provided). Development issues will be elaborated.
Planning Define a vision for future growth and development of the areas over the next 20 years.
Provide an overall physical framework for urban growth of Mombasa City.
Propose sector plans. Financing (including PPP) of the
projects is not covered. SEA is not conducted.
Vision will be elaborated through working group and stakeholder meetings.
Structure plan will be proposed (not proposed in ISUDP-Mombasa).
Future framework will be reviewed. Land use plan and transport network plan will be improved
by considering the function of Mombasa County in the Northern Corridor and connection with ongoing projects and plans (SEZ, port, bypass, bridges).
Each sector plan will be reviewed based on the framework, structure plan, transport network, and land use plan.
Legal process including SEA will be conducted. Source: JICA Expert Team
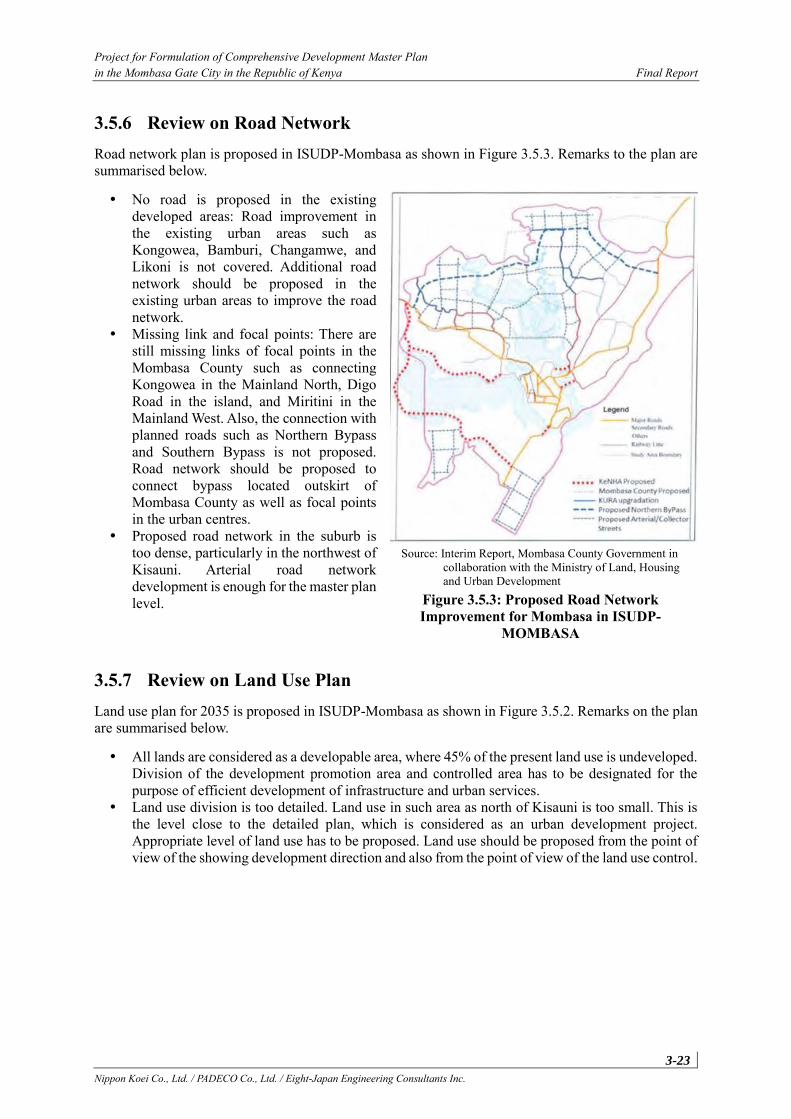
Project for Formulation of Comprehensive Development Master Plan in the Mombasa Gate City in the Republic of Kenya Final Report
3-23 Nippon Koei Co., Ltd. / PADECO Co., Ltd. / Eight-Japan Engineering Consultants Inc.
3.5.6 Review on Road Network Road network plan is proposed in ISUDP-Mombasa as shown in Figure 3.5.3. Remarks to the plan are summarised below.
No road is proposed in the existing developed areas: Road improvement in the existing urban areas such as Kongowea, Bamburi, Changamwe, and Likoni is not covered. Additional road network should be proposed in the existing urban areas to improve the road network.
Missing link and focal points: There are still missing links of focal points in the Mombasa County such as connecting Kongowea in the Mainland North, Digo Road in the island, and Miritini in the Mainland West. Also, the connection with planned roads such as Northern Bypass and Southern Bypass is not proposed. Road network should be proposed to connect bypass located outskirt of Mombasa County as well as focal points in the urban centres.
Proposed road network in the suburb is too dense, particularly in the northwest of Kisauni. Arterial road network development is enough for the master plan level.
3.5.7 Review on Land Use Plan Land use plan for 2035 is proposed in ISUDP-Mombasa as shown in Figure 3.5.2. Remarks on the plan are summarised below.
All lands are considered as a developable area, where 45% of the present land use is undeveloped. Division of the development promotion area and controlled area has to be designated for the purpose of efficient development of infrastructure and urban services.
Land use division is too detailed. Land use in such area as north of Kisauni is too small. This is the level close to the detailed plan, which is considered as an urban development project. Appropriate level of land use has to be proposed. Land use should be proposed from the point of view of the showing development direction and also from the point of view of the land use control.
Figure 3.5.3: Proposed Road Network Improvement for Mombasa in ISUDP-
MOMBASA
Source: Interim Report, Mombasa County Government in collaboration with the Ministry of Land, Housing and Urban Development

Project for Formulation of Comprehensive Development Master Plan in the Mombasa Gate City in the Republic of Kenya Final Report
4-1 Nippon Koei Co., Ltd. / PADECO Co., Ltd. / Eight-Japan Engineering Consultants Inc.
4. Transport and Logistics
4.1 Introduction Transport systems include both physical infrastructure (road network, rail network, public transport network, NMT1 network, and pipelines) and traffic systems (freight movement, passenger movement). In Mombasa County, traffic problems are a result of various deficiencies in the physical infrastructure. Freight movement is not isolated to the port; it is responsible for severe congestion outside its boundaries, as various support industries coexist alongside it, and the lack of infrastructure (such as marshalling yards) and effective traffic management worsen the problem. Currently, heavy vehicles face few if any road access restrictions.
Public transport in Mombasa County also faces a variety of problems, e.g., lack of high-capacity vehicles, no dedicated lanes or priority measures, and relatively low level of service with respect to the quality of service provided and the ability to meet passenger demand.
This chapter describes the existing situation and issues of freight and passenger transport in Mombasa County and logistics management in the Northern Corridor. The first three sections (Sections 4.2-4.4) review existing plans and pipeline projects in Mombasa County. The next two sections (Sections 4.5-4.7) describe the administrative, road network/traffic, and public transport systems. The following two sections (Sections 4.8-4.9) explain the Mombasa Port facilities, functions, issues, and relationship to the Northern Economic Corridor. Finally, the last section (Section 4.10) presents a summary of issues.
4.2 Review of Transport Goals, Plans and Studies
4.2.1 Vision 2030 – First and Second Transport Sector Plan (2008-2012, 2013-2017)
There are several transport goals and strategies, which have been presented as national-level policies, in which ‘Vision 2030 – First and Second Transport Sector Plan (2008-2012, 2013-2017)’ is one of the most important policies.
Vision 2030 presented the goal of transforming Kenya into “a globally competitive and prosperous nation with a high quality of life by the year 2030”. With respect to transport in Mombasa County, the following issues were identified:
Due to its shallow channel, Mombasa Port is not equipped to handle post-Panamax sized container ships, which will gradually become the dominant fleet of container ships in the world.
Ferry vessels are old, under capacity, and face safety concerns. Railway track is of one-meter gauge, which has a limited capacity. Overall, transport systems are fragmented and have received low investment over the years. The
system will be unable to support the economic activities envisioned in Vision 2030. There are conflicts of interest as some government agencies are responsible for both the provision
of transport services/infrastructure as well as the regulation of those services.
1 Including walkers, bicycles, handcarts, pushcarts and so on.
Project for Formulation of Comprehensive Development Master Plan in the Mombasa Gate City in the Republic of Kenya Final Report
4-2 Nippon Koei Co., Ltd. / PADECO Co., Ltd. / Eight-Japan Engineering Consultants Inc.
Alongside the development of vision-level policies, there have also been conceptual master plans developed for Mombasa County. As with Vision 2030, some of the following plans are explained in detail in other sections of this report. However, the elements of each plan which are specific to transport issues will be mentioned here.
4.2.2 Mombasa Draft Physical Development Plan (1971-2001) The Mombasa Draft Physical Development Plan (“the 1971 Master Plan”) was actually expansive and impressive in its scope and specificity with regards to transport planning. It is unfortunate that very little of the plan came to fruition. However, the growth projections for Mombasa County proved to be so far below the actual growth that even the planned capacity from road projects was arguably under what would be, and still is, needed.
4.2.3 Integrated Strategic Urban Development Plan: Mombasa Vision 2035 (2016)
The Integrated Strategic Urban Development Plan (ISUDP-Mombasa) was prepared under the Kenya Municipal Programme (KMP). The ISUDP-Mombasa includes: analysis of the current socio-economic, physical, environmental, and cultural characteristics of the city; formulation of a vision; land use and zoning regulations; strategic sector plans including urban transport; capital investment plan; and training. The concept related to transport in the ISUDP-Mombasa is “Seamless Connectivity,” and conceptual recommendations regarding infrastructure were made as follows:
Road Network Improvements and “Complete Streets” Concept
Bypass roads (60 m) and radial roads (45 m) development Development of a road network of additional link roads and collector streets “Complete Streets”: cycle tracks and pedestrian walkways
New Transport Facilities
Mass transit systems Integrated bus terminal Truck terminals Container freight station Logistics park Matatu stations Tuktuk (3W) stands
Airport Connectivity
Ensuring a 10-minute connection between the airport and central business district (CBD) [note: the distance is 11 km, so this necessitates an average speed of 65 km/h]
Beyond these concepts, more detailed projects have been proposed by the ISUDP-Mombasa team (specific ring roads, development areas/access roads, etc.).
4.2.4 Non-motorised Transit (NMT) Plan (2013) As part of the KMP, five towns were selected to promote non-motorised transit and increase overall safety in the shared transport environment, namely: Kakamega, Eldoret, Thika, Nakuru, and Mombasa County. Following the surveys and site analyses, the following concerns were identified:
Segregation of NMT modes and motorised modes to ensure safety Application of intense traffic calming measures
Project for Formulation of Comprehensive Development Master Plan in the Mombasa Gate City in the Republic of Kenya Final Report
4-3 Nippon Koei Co., Ltd. / PADECO Co., Ltd. / Eight-Japan Engineering Consultants Inc.
Sensitisation of drivers of motorised modes about the rights of pedestrians and NMT users Need for parking and other facilities for the NMT modes and operators Need for empathy in regulation Access to finance on soft terms for NMT operators, etc.
NMT-promotion strategies and specific projects were detailed, totalling KES 640 million.
4.2.5 KRC Mombasa Commuter Railways Feasibility Study (2011) Kenya Railways Corporation (KRC) awarded a consultancy to Poyry of Switzerland to conduct relevant transportation surveys and determine the location of routes for intracity and intercity commuter rail services (as well as conduct associated preliminary environmental and social impact analyses), analyse their technical viability, and conduct cost estimation and financial/economic analyses.
Ultimately, the six corridors below were selected. Corridors 1-4 were proposed for Phase I, with Corridors 5 and 6 coming at a later time.
Corridor 1: Mombasa – Airport – Likoni – Ramisi Corridor (15 stations, 87.9 km) Corridor 2: Mombasa – Mtwapa – Kilifi – Malindi Corridor (17 stations, 113.7 km,) Corridor 3: Mombasa – Mazeras – Voi Corridor (14 stations, 152.7 km) Corridor 4: Likoni Ferry – Panga Corridor (Mombasa Ring Corridor) (7 stations, 14.8 km) Corridor 5: Mazeras – Kaloleni – Takaungu Corridor (6 stations, 51.7 km) Corridor 6: Malindi – Lamu Corridor (6 stations, 204.9 km)
The scope of this plan is to connect very long distances (up to 200 km) by rail. Whilst the initial stops are in the city proper (e.g., Airport, Likoni, Mtwapa, etc.), the majority of the corridor lies well beyond it. Thus, whilst it is technically possible for intracity commuters to take the train, train departures will be infrequent and are not appropriate for mass urban transport, and suitable only for long-distance trips (intercity).
4.2.6 Passenger Water Transport Pre-feasibility Study (2014/Draft), and Feasibility Study (2016)
In response to the Mombasa County governor’s interest in studying opportunities for public transit over water, a privately-funded pre-feasibility (pre-F/S) study for Mombasa County and other coastal towns was investigated (released as a draft, not a final report). Every day, it is estimated that 1 million people enter and leave Mombasa Island, and therefore any means of egress from Mombasa Island should be considered. The primary research questions of the pre-F/S were as follows:
Is it likely that development of passenger water transport will contribute to reducing the problem of traffic congestion in Mombasa County?
Could passenger water transport services around Mombasa Island (“the Island Line”) be technically and financially viable?
Could passenger water transport services between Mombasa County and the towns on the South and North Coast (“the Coastal Line”) be technically and financially viable?
As a follow up to this study, a feasibility study was commissioned by Mombasa County, partially financed by the Netherlands. The objective of the follow-up study is to investigate in a more detailed feasibility of the technical, economic, ecological, and financial aspects of the Island Line (between the east side of Mombasa Island and the Mainland North), in particular.
Project for Formulation of Comprehensive Development Master Plan in the Mombasa Gate City in the Republic of Kenya Final Report
4-4 Nippon Koei Co., Ltd. / PADECO Co., Ltd. / Eight-Japan Engineering Consultants Inc.
4.2.7 Road Sector Improvement Programme (RSIP) (2010-2024) The main purpose of the RSIP was “to provide good roads for a globally competitive and prosperous Kenya.” Its specific objective was to detail the country’s road network infrastructure development and maintenance needs for the medium and long terms in order to facilitate guided, secure, aggressive, timely, and quality investments for maximum benefits to the overall economy. The RSIP included:
An outline 15-year investment plan; and A detailed 5-year implementation programme.
The RSIP covered all roadworks, from the construction of new roads to the rehabilitation and maintenance of existing ones, utilising all resources that were expected to be made available.
4.2.8 JICA Mombasa Port Master Plan (2014-15) The “Project for Technical Assistance to Kenya Ports Authority on Dongo Kundu Port, Mombasa Master Plan” is a project by the Japan International Cooperation Agency (JICA) for the Kenya Ports Authority (KPA) and the Ministry of Transport and Infrastructure which has the following intended outputs:
The Mombasa Port Master Plan (by Royal Haskoning) is reviewed and revised. Strategic planning and management systems of KPA are improved. Future capacity and forecast methods of KPA are improved. A comprehensive Mombasa Port development implementation/investment plan is prepared.
The long-term demand forecast of freight volume in the JICA Expert Team’s Master Plan is attributed to this Mombasa Port Master Plan.
4.2.9 Mombasa Special Economic Zone (Mombasa SEZ) Master Plan (2014-15)
The Mombasa Special Economic Zone (SEZ) Master Plan is a JICA-funded study to develop a 12 km2 (1,200 ha) logistics and industrial park in Dongo Kundu in the Mainland South area, on both sides of the Mombasa Southern Bypass Road (MSBR, see Section 4.3.1) and spanning north to Port Reitz Harbor, with a planned Free Trade Zone and new port facilities (Section 4.4.3).
4.3 Ongoing and Committed Road Infrastructure Projects
4.3.1 Mombasa Southern Bypass Road and Kipevu Link to New Container Terminal
The 19.8 km Mombasa Southern Bypass Road (MSBR) and the 5.7 km Kipevu Link to the new container terminal (Berths 20-21) are road construction projects being developed in tandem. Both projects are being implemented by the Kenya National Highways Authority (KeNHA).
The MSBR starts at Miritini (A109), passes through to Mwache, Tsunza, through Dongo Kundu, and then Kibundani (A14). As it passes directly through it, the MSBR is often discussed in relation to the Mombasa SEZ. However, it is important on its own merits. At present, traffic intended for A14/southwards toward Tanzania unnecessarily passes through Mombasa Island. Traffic buildups going into Mombasa Island can start at Miritini, Mazeras, or even farther out.
The Kipevu Link Road would branch off of the MSBR at Mwache and run along the coast before reaching the site of the new container terminal. Especially with, but even without, the construction of the new container terminal, the Kipevu Link is important because the existing port access infrastructure
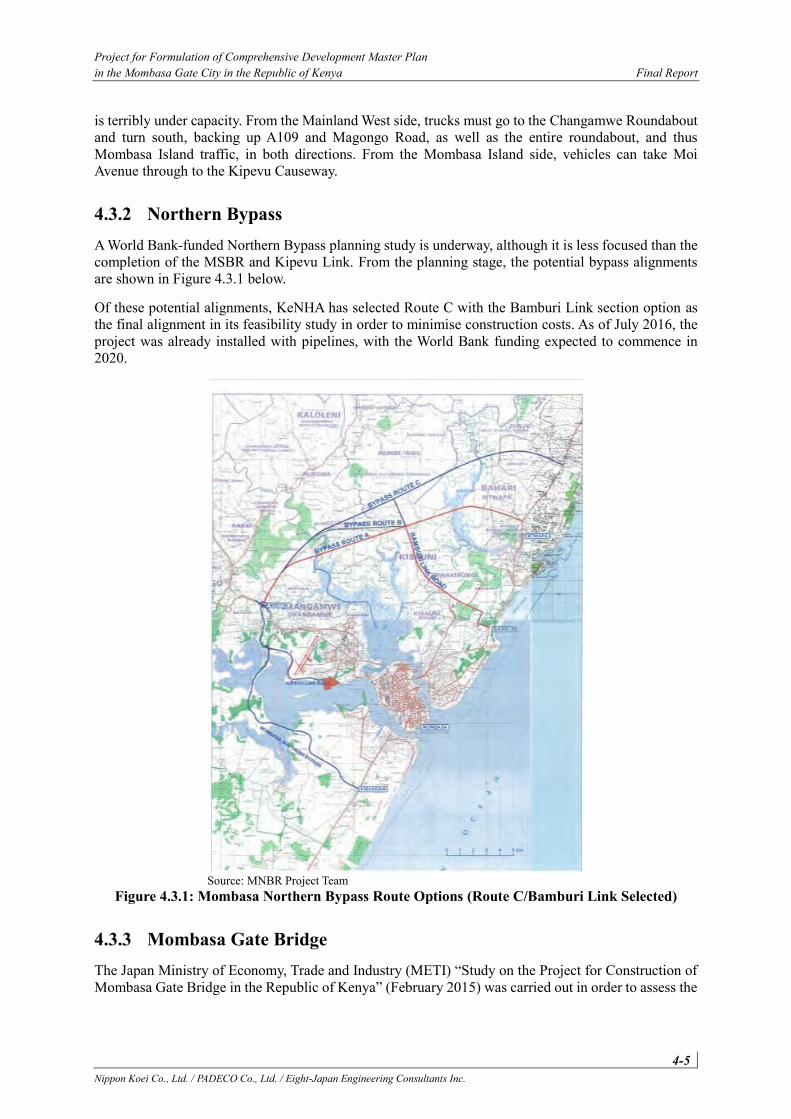
Project for Formulation of Comprehensive Development Master Plan in the Mombasa Gate City in the Republic of Kenya Final Report
4-5 Nippon Koei Co., Ltd. / PADECO Co., Ltd. / Eight-Japan Engineering Consultants Inc.
is terribly under capacity. From the Mainland West side, trucks must go to the Changamwe Roundabout and turn south, backing up A109 and Magongo Road, as well as the entire roundabout, and thus Mombasa Island traffic, in both directions. From the Mombasa Island side, vehicles can take Moi Avenue through to the Kipevu Causeway.
4.3.2 Northern Bypass A World Bank-funded Northern Bypass planning study is underway, although it is less focused than the completion of the MSBR and Kipevu Link. From the planning stage, the potential bypass alignments are shown in Figure 4.3.1 below.
Of these potential alignments, KeNHA has selected Route C with the Bamburi Link section option as the final alignment in its feasibility study in order to minimise construction costs. As of July 2016, the project was already installed with pipelines, with the World Bank funding expected to commence in 2020.
Source: MNBR Project Team
Figure 4.3.1: Mombasa Northern Bypass Route Options (Route C/Bamburi Link Selected)
4.3.3 Mombasa Gate Bridge The Japan Ministry of Economy, Trade and Industry (METI) “Study on the Project for Construction of Mombasa Gate Bridge in the Republic of Kenya” (February 2015) was carried out in order to assess the
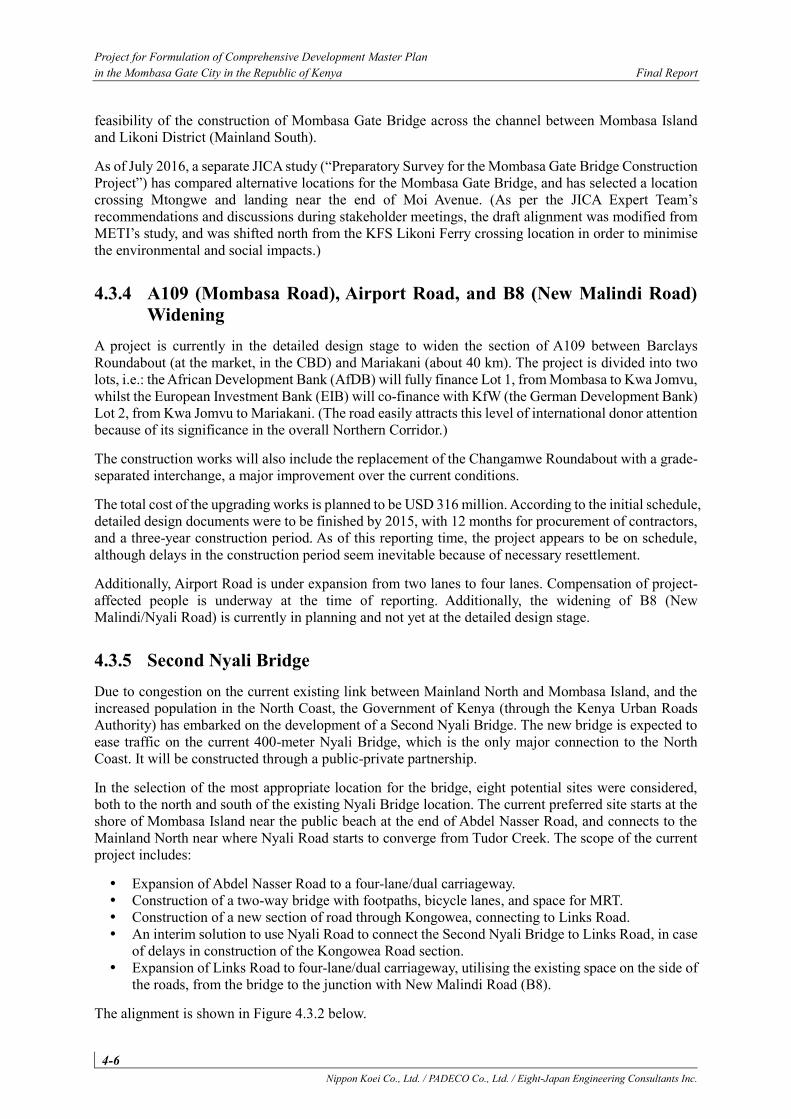
Project for Formulation of Comprehensive Development Master Plan in the Mombasa Gate City in the Republic of Kenya Final Report
4-6 Nippon Koei Co., Ltd. / PADECO Co., Ltd. / Eight-Japan Engineering Consultants Inc.
feasibility of the construction of Mombasa Gate Bridge across the channel between Mombasa Island and Likoni District (Mainland South).
As of July 2016, a separate JICA study (“Preparatory Survey for the Mombasa Gate Bridge Construction Project”) has compared alternative locations for the Mombasa Gate Bridge, and has selected a location crossing Mtongwe and landing near the end of Moi Avenue. (As per the JICA Expert Team’s recommendations and discussions during stakeholder meetings, the draft alignment was modified from METI’s study, and was shifted north from the KFS Likoni Ferry crossing location in order to minimise the environmental and social impacts.)
4.3.4 A109 (Mombasa Road), Airport Road, and B8 (New Malindi Road) Widening
A project is currently in the detailed design stage to widen the section of A109 between Barclays Roundabout (at the market, in the CBD) and Mariakani (about 40 km). The project is divided into two lots, i.e.: the African Development Bank (AfDB) will fully finance Lot 1, from Mombasa to Kwa Jomvu, whilst the European Investment Bank (EIB) will co-finance with KfW (the German Development Bank) Lot 2, from Kwa Jomvu to Mariakani. (The road easily attracts this level of international donor attention because of its significance in the overall Northern Corridor.)
The construction works will also include the replacement of the Changamwe Roundabout with a grade-separated interchange, a major improvement over the current conditions.
The total cost of the upgrading works is planned to be USD 316 million. According to the initial schedule, detailed design documents were to be finished by 2015, with 12 months for procurement of contractors, and a three-year construction period. As of this reporting time, the project appears to be on schedule, although delays in the construction period seem inevitable because of necessary resettlement.
Additionally, Airport Road is under expansion from two lanes to four lanes. Compensation of project-affected people is underway at the time of reporting. Additionally, the widening of B8 (New Malindi/Nyali Road) is currently in planning and not yet at the detailed design stage.
4.3.5 Second Nyali Bridge Due to congestion on the current existing link between Mainland North and Mombasa Island, and the increased population in the North Coast, the Government of Kenya (through the Kenya Urban Roads Authority) has embarked on the development of a Second Nyali Bridge. The new bridge is expected to ease traffic on the current 400-meter Nyali Bridge, which is the only major connection to the North Coast. It will be constructed through a public-private partnership.
In the selection of the most appropriate location for the bridge, eight potential sites were considered, both to the north and south of the existing Nyali Bridge location. The current preferred site starts at the shore of Mombasa Island near the public beach at the end of Abdel Nasser Road, and connects to the Mainland North near where Nyali Road starts to converge from Tudor Creek. The scope of the current project includes:
Expansion of Abdel Nasser Road to a four-lane/dual carriageway. Construction of a two-way bridge with footpaths, bicycle lanes, and space for MRT. Construction of a new section of road through Kongowea, connecting to Links Road. An interim solution to use Nyali Road to connect the Second Nyali Bridge to Links Road, in case
of delays in construction of the Kongowea Road section. Expansion of Links Road to four-lane/dual carriageway, utilising the existing space on the side of
the roads, from the bridge to the junction with New Malindi Road (B8).
The alignment is shown in Figure 4.3.2 below.
Project for Formulation of Comprehensive Development Master Plan in the Mombasa Gate City in the Republic of Kenya Final Report
4-7 Nippon Koei Co., Ltd. / PADECO Co., Ltd. / Eight-Japan Engineering Consultants Inc.
Source: Deloitte Study on Second Nyali Bridge
Figure 4.3.2: Location of the Proposed Second Nyali Bridge
4.3.6 Intersection Improvements The most critical points of a road network are its intersections. In addition to the road infrastructure projects in the previous sections, various direct intersection improvements are proposed.
As previously mentioned in Section 4.3.4, Changamwe Roundabout will be replaced with a grade-separated flyover. However, in addition to this, the Airport Road/Magongo Road intersection will also be replaced with flyovers, securing accessibility between the city and Moi Airport. This will be funded by KeNHA, and delivered by 2017.
Additionally, intersection improvements along Links Road and Beach Road (in/near Kongowea) will be conducted by the County Government of Mombasa (CGM). The improvements include widening into four-lane roads (from two/three at present), and widening of roundabout areas to facilitate faster turning movements.
4.3.7 Traffic Management Strategies, Minor Road Improvements Finally, the CGM executed its powers in traffic enforcement/routing to implement the following traffic management changes:
Matatu route regulation along Digo Road. Tuktuk entry regulations along Digo Road at Market/Posta. Regulation of trailers/heavy vehicles to use outside lane of Changamwe Roundabout. Banning of heavy vehicles from Magongo Road between Changamwe Roundabout and Airport
Road intersection. One-way operations along Lumumba-Mijikenda Road, Kisauni Road, and Nyali Road/Links
Road (during rush hour).
Generally speaking, these regulations have been effective in alleviating traffic. However, problems of enforcement still persist.
In addition to these traffic management strategies, the CGM has conducted minor road improvements in residential areas, and through the construction of pedestrian bridges (through the NMT Plan, Section 4.2.4). Some areas have been outfitted with Cabro pavement – special paving blocks originally made by Bamburi Cement that are more resistant to heavy vehicle traffic.
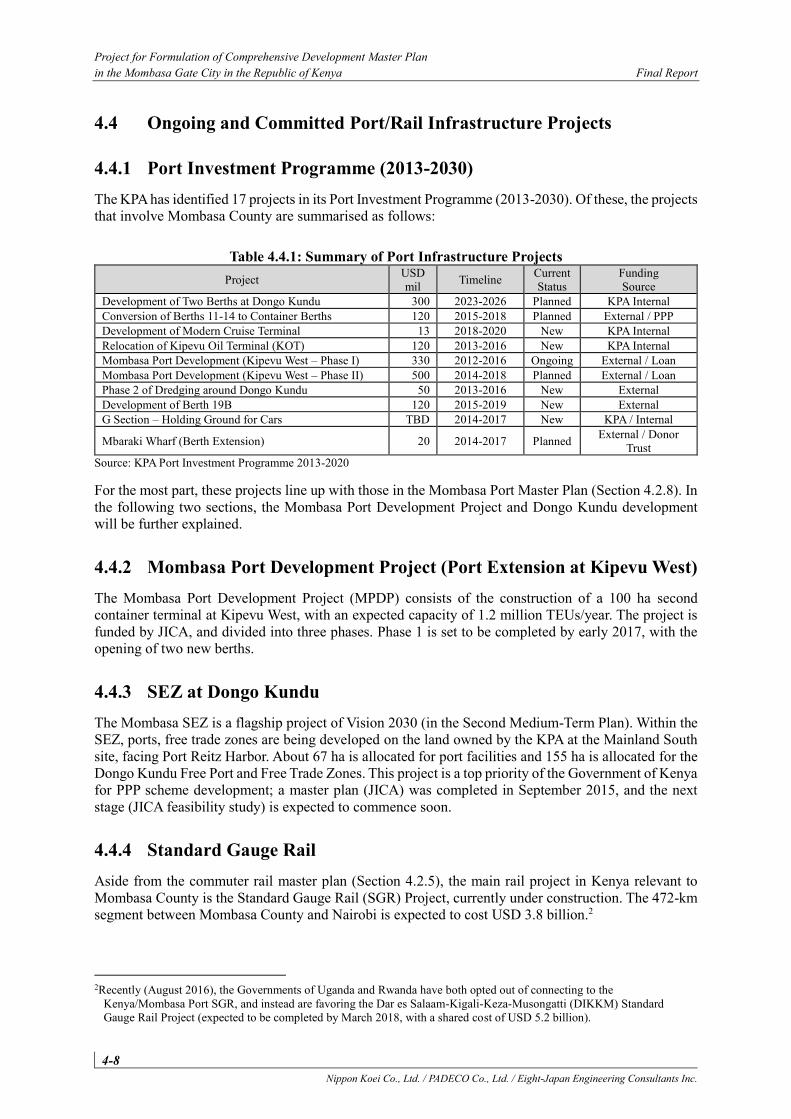
Project for Formulation of Comprehensive Development Master Plan in the Mombasa Gate City in the Republic of Kenya Final Report
4-8 Nippon Koei Co., Ltd. / PADECO Co., Ltd. / Eight-Japan Engineering Consultants Inc.
4.4 Ongoing and Committed Port/Rail Infrastructure Projects
4.4.1 Port Investment Programme (2013-2030) The KPA has identified 17 projects in its Port Investment Programme (2013-2030). Of these, the projects that involve Mombasa County are summarised as follows:
Table 4.4.1: Summary of Port Infrastructure Projects Project USD
mil Timeline Current Status
Funding Source
Development of Two Berths at Dongo Kundu 300 2023-2026 Planned KPA Internal Conversion of Berths 11-14 to Container Berths 120 2015-2018 Planned External / PPP Development of Modern Cruise Terminal 13 2018-2020 New KPA Internal Relocation of Kipevu Oil Terminal (KOT) 120 2013-2016 New KPA Internal Mombasa Port Development (Kipevu West – Phase I) 330 2012-2016 Ongoing External / Loan Mombasa Port Development (Kipevu West – Phase II) 500 2014-2018 Planned External / Loan Phase 2 of Dredging around Dongo Kundu 50 2013-2016 New External Development of Berth 19B 120 2015-2019 New External G Section – Holding Ground for Cars TBD 2014-2017 New KPA / Internal
Mbaraki Wharf (Berth Extension) 20 2014-2017 Planned External / Donor Trust
Source: KPA Port Investment Programme 2013-2020
For the most part, these projects line up with those in the Mombasa Port Master Plan (Section 4.2.8). In the following two sections, the Mombasa Port Development Project and Dongo Kundu development will be further explained.
4.4.2 Mombasa Port Development Project (Port Extension at Kipevu West) The Mombasa Port Development Project (MPDP) consists of the construction of a 100 ha second container terminal at Kipevu West, with an expected capacity of 1.2 million TEUs/year. The project is funded by JICA, and divided into three phases. Phase 1 is set to be completed by early 2017, with the opening of two new berths.
4.4.3 SEZ at Dongo Kundu The Mombasa SEZ is a flagship project of Vision 2030 (in the Second Medium-Term Plan). Within the SEZ, ports, free trade zones are being developed on the land owned by the KPA at the Mainland South site, facing Port Reitz Harbor. About 67 ha is allocated for port facilities and 155 ha is allocated for the Dongo Kundu Free Port and Free Trade Zones. This project is a top priority of the Government of Kenya for PPP scheme development; a master plan (JICA) was completed in September 2015, and the next stage (JICA feasibility study) is expected to commence soon.
4.4.4 Standard Gauge Rail Aside from the commuter rail master plan (Section 4.2.5), the main rail project in Kenya relevant to Mombasa County is the Standard Gauge Rail (SGR) Project, currently under construction. The 472-km segment between Mombasa County and Nairobi is expected to cost USD 3.8 billion.2
2Recently (August 2016), the Governments of Uganda and Rwanda have both opted out of connecting to the
Kenya/Mombasa Port SGR, and instead are favoring the Dar es Salaam-Kigali-Keza-Musongatti (DIKKM) Standard Gauge Rail Project (expected to be completed by March 2018, with a shared cost of USD 5.2 billion).
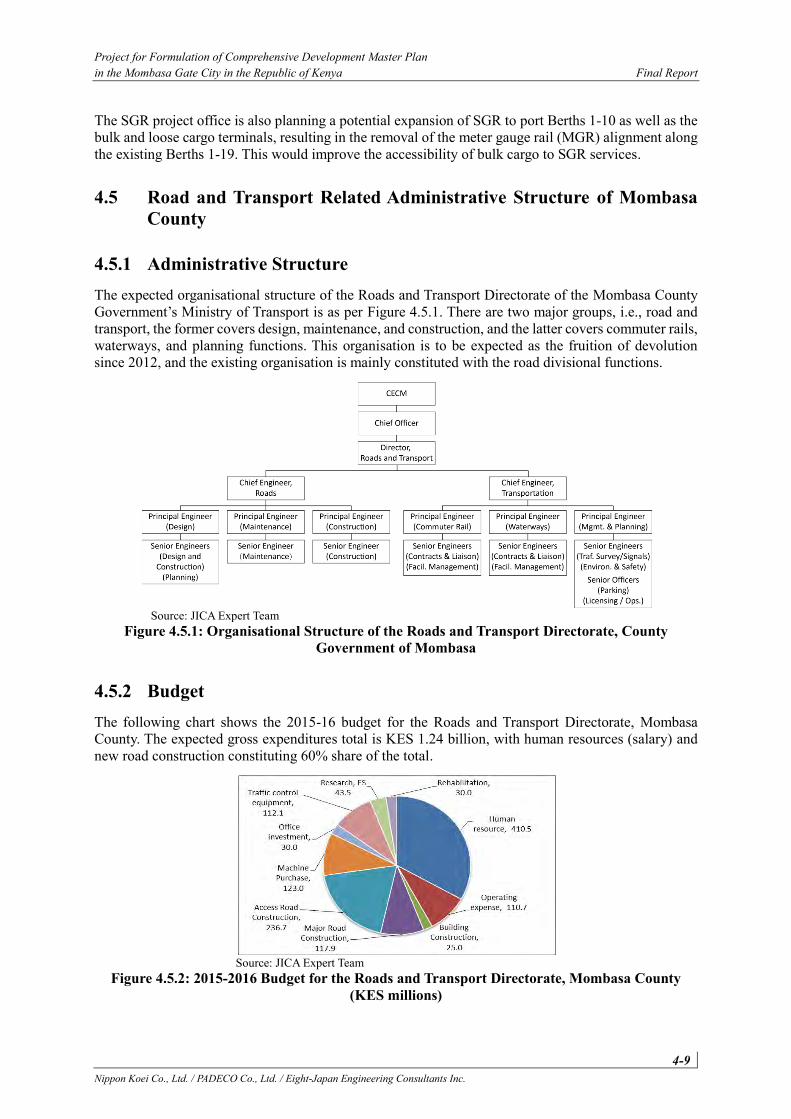
Project for Formulation of Comprehensive Development Master Plan in the Mombasa Gate City in the Republic of Kenya Final Report
4-9 Nippon Koei Co., Ltd. / PADECO Co., Ltd. / Eight-Japan Engineering Consultants Inc.
The SGR project office is also planning a potential expansion of SGR to port Berths 1-10 as well as the bulk and loose cargo terminals, resulting in the removal of the meter gauge rail (MGR) alignment along the existing Berths 1-19. This would improve the accessibility of bulk cargo to SGR services.
4.5 Road and Transport Related Administrative Structure of Mombasa County
4.5.1 Administrative Structure The expected organisational structure of the Roads and Transport Directorate of the Mombasa County Government’s Ministry of Transport is as per Figure 4.5.1. There are two major groups, i.e., road and transport, the former covers design, maintenance, and construction, and the latter covers commuter rails, waterways, and planning functions. This organisation is to be expected as the fruition of devolution since 2012, and the existing organisation is mainly constituted with the road divisional functions.
Source: JICA Expert Team
Figure 4.5.1: Organisational Structure of the Roads and Transport Directorate, County Government of Mombasa
4.5.2 Budget The following chart shows the 2015-16 budget for the Roads and Transport Directorate, Mombasa County. The expected gross expenditures total is KES 1.24 billion, with human resources (salary) and new road construction constituting 60% share of the total.
Source: JICA Expert Team
Figure 4.5.2: 2015-2016 Budget for the Roads and Transport Directorate, Mombasa County (KES millions)
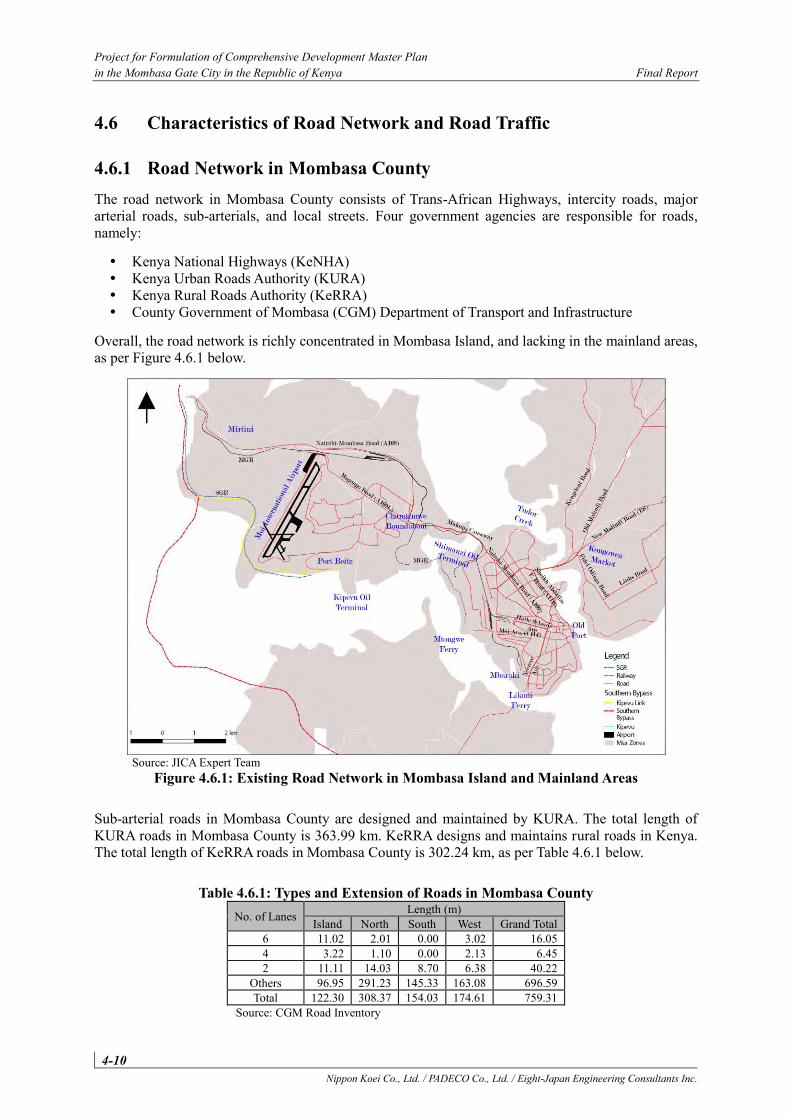
Project for Formulation of Comprehensive Development Master Plan in the Mombasa Gate City in the Republic of Kenya Final Report
4-10 Nippon Koei Co., Ltd. / PADECO Co., Ltd. / Eight-Japan Engineering Consultants Inc.
4.6 Characteristics of Road Network and Road Traffic
4.6.1 Road Network in Mombasa County The road network in Mombasa County consists of Trans-African Highways, intercity roads, major arterial roads, sub-arterials, and local streets. Four government agencies are responsible for roads, namely:
Kenya National Highways (KeNHA) Kenya Urban Roads Authority (KURA) Kenya Rural Roads Authority (KeRRA) County Government of Mombasa (CGM) Department of Transport and Infrastructure
Overall, the road network is richly concentrated in Mombasa Island, and lacking in the mainland areas, as per Figure 4.6.1 below.
Source: JICA Expert Team
Figure 4.6.1: Existing Road Network in Mombasa Island and Mainland Areas
Sub-arterial roads in Mombasa County are designed and maintained by KURA. The total length of KURA roads in Mombasa County is 363.99 km. KeRRA designs and maintains rural roads in Kenya. The total length of KeRRA roads in Mombasa County is 302.24 km, as per Table 4.6.1 below.
Table 4.6.1: Types and Extension of Roads in Mombasa County No. of Lanes Length (m)
Island North South West Grand Total 6 11.02 2.01 0.00 3.02 16.05 4 3.22 1.10 0.00 2.13 6.45 2 11.11 14.03 8.70 6.38 40.22
Others 96.95 291.23 145.33 163.08 696.59 Total 122.30 308.37 154.03 174.61 759.31
Source: CGM Road Inventory
Project for Formulation of Comprehensive Development Master Plan in the Mombasa Gate City in the Republic of Kenya Final Report
4-11 Nippon Koei Co., Ltd. / PADECO Co., Ltd. / Eight-Japan Engineering Consultants Inc.
The road area/total area ratio in Mombasa County varies greatly when comparing Mombasa Island to the mainland areas, as per Table 4.6.2 below. Table 4.6.3 shows the road ratio in other international cities for comparison, showing that Mombasa Island compares favorably, but Mombasa County as a whole trails behind. This suggests that the road development strategy (intensity of road development) should be different amongst the island and mainland areas – there is no “one-size-fits-all” strategy for Mombasa County as a whole; each area must be examined separately.
Table 4.6.2: Road Coverage Ratio in Mombasa County
Area Land Area (km2) (S)
Road Area (km2) (A)
Road Length (km)
Coverage (A) / (S)
Mombasa Island 13.9 2.8 122.30 20.3%
North (Nyali, Kisauni) 102.1 2.7 308.44 2.7% West (Changamwe, Jomvu) 50.0 1.7 174.61 3.4%
South (Likoni) 46.6 1.1 154.03 2.3% Total 212.6 8.3 759.38 3.9%
Source: Road area (km2): calculated by the JICA Expert Team, assuming 26 m width for six lanes, 17 m for four lanes, 9 m width for two arterial lanes, and 6 m for others, for all category roads including national and county. Totals derived from paved areas only for two, four, and six lanes, not including ROW
Land area (km2): County Road Infrastructure Rehabilitation Study, 2011 (Road Inventory Study) Road Length (km): calculated by the JICA Expert Team based on the Rehabilitation Study, 2011, and KeNHA
materials Road ratio: calculated by the JICA Expert Team
Table 4.6.3: Comparison of Road Coverage Ratios City Road Area
(A) (km2) Land Area (S) (km2)
Coverage (A) / (S)
Paris 27.0 105.0 25.7% Tokyo CBD 24.0 110.0 21.8%
Mombasa Island 2.8 13.9 20.3% Taipei 20.0 134.0 14.9% Jakarta 48.0 656.0 7.3%
All Mombasa County 8.3 212.6 3.9% Source: S. Hanaoka, STREAM Project, Data for Mombasa; JICA Expert Team.
4.6.2 Drainage Infrastructure Poor road drainage is one of the reasons for traffic congestion in Mombasa County, and this section describes the condition of drainage in Mombasa County. The drainage infrastructure in Mombasa County consists of closed buried drains, open drains, and drains along the roads.
Closed buried drains exist throughout the county but are mainly concentrated in Mombasa Island. Mombasa Island has a network of 50 km of closed pipe drains ranging from 150 mm to 1,250 mm in diameter. A small section of the drains serving the oil refinery (1 km) is a 1,200 mm diameter closed drain pipe, connecting to the main open drain serving the Changamwe area near the junction with Airport Road. The main drain existing in Mainland South is 1.2 km of 900 mm closed pipe drain along Tanga Road, with an open lined outfall at Kilindini Harbor. The length of the closed drain is approximately 1.7 km. In Mainland North, closed drains exist only along parts of Links Road. Generally speaking, closed drains are only installed in areas that are fully developed and with little space for open drains.
The open drain network interlinks with the closed drain network, and they exist throughout all areas of Mombasa County. In Mainland North, open drains run along New Malindi Road at Bombolulu and along the access road serving Khadija Estate. The main drain trunk serving Changamwe in Mainland West is a lined open drain. Other drains in Mikindani, Chaani, and Miritini are open drains. In Mainland South,
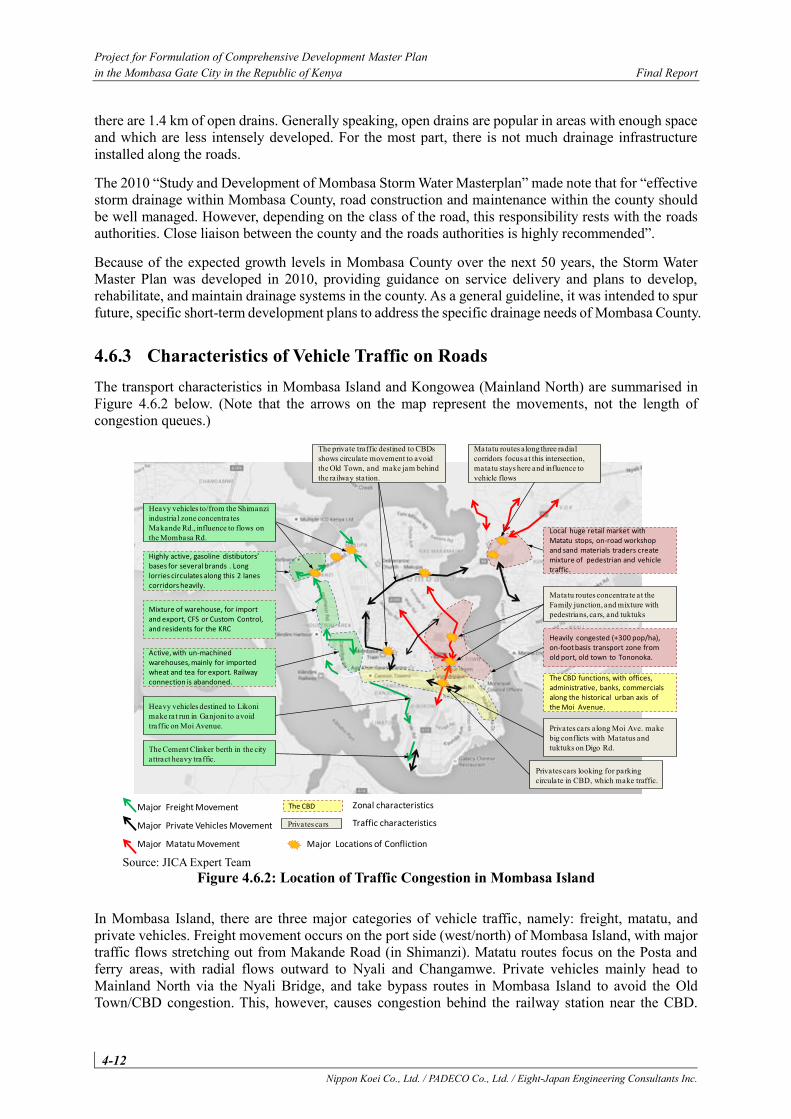
Project for Formulation of Comprehensive Development Master Plan in the Mombasa Gate City in the Republic of Kenya Final Report
4-12 Nippon Koei Co., Ltd. / PADECO Co., Ltd. / Eight-Japan Engineering Consultants Inc.
there are 1.4 km of open drains. Generally speaking, open drains are popular in areas with enough space and which are less intensely developed. For the most part, there is not much drainage infrastructure installed along the roads.
The 2010 “Study and Development of Mombasa Storm Water Masterplan” made note that for “effective storm drainage within Mombasa County, road construction and maintenance within the county should be well managed. However, depending on the class of the road, this responsibility rests with the roads authorities. Close liaison between the county and the roads authorities is highly recommended”.
Because of the expected growth levels in Mombasa County over the next 50 years, the Storm Water Master Plan was developed in 2010, providing guidance on service delivery and plans to develop, rehabilitate, and maintain drainage systems in the county. As a general guideline, it was intended to spur future, specific short-term development plans to address the specific drainage needs of Mombasa County.
4.6.3 Characteristics of Vehicle Traffic on Roads The transport characteristics in Mombasa Island and Kongowea (Mainland North) are summarised in Figure 4.6.2 below. (Note that the arrows on the map represent the movements, not the length of congestion queues.)
Source: JICA Expert Team
Figure 4.6.2: Location of Traffic Congestion in Mombasa Island
In Mombasa Island, there are three major categories of vehicle traffic, namely: freight, matatu, and private vehicles. Freight movement occurs on the port side (west/north) of Mombasa Island, with major traffic flows stretching out from Makande Road (in Shimanzi). Matatu routes focus on the Posta and ferry areas, with radial flows outward to Nyali and Changamwe. Private vehicles mainly head to Mainland North via the Nyali Bridge, and take bypass routes in Mombasa Island to avoid the Old Town/CBD congestion. This, however, causes congestion behind the railway station near the CBD.
Heavily congested (+300 pop/ha), on-foot basis transport zone from old port, old town to Tononoka.
The CBD functions, with offices, administrative, banks, commercials along the historical urban axis of the Moi Avenue.
Active, with un-machined warehouses, mainly for imported wheat and tea for export. Railway connection is abandoned.
Highly active, gasoline distibutors’ bases for several brands . Long lorries circulates along this 2 lanes corridors heavily.
Mixture of warehouse, for import and export, CFS or Custom Control, and residents for the KRC
The private traffic destined to CBDs shows circulate movement to avoid the Old Town, and make jam behind the railway station.
Privates cars along Moi Ave. make big conflicts with Matatus and tuktuks on Digo Rd.
Heavy vehicles destined to Likonimake rat run in Ganjoni to avoid traffic on Moi Avenue.
Matatu routes concentrate at the Family junction, and mixture with pedestrians, cars, and tuktuks
Heavy vehicles to/from the Shimanziindustrial zone concentrates Makande Rd., influence to flows on the Mombasa Rd.
Local huge retail market with Matatu stops, on-road workshop and sand materials traders create mixture of pedestrian and vehicle traffic.
Matatu routes along three radial corridors focus at this intersection, matatu stays here and influence to vehicle flows
Major Freight Movement
Major Private Vehicles Movement
Major Matatu Movement
The CBD Zonal characteristics
Privates cars Traffic characteristics
The Cement Clinker berth in the city attract heavy traffic.
Privates cars looking for parking circulate in CBD, which make traffic.
Major Locations of Confliction
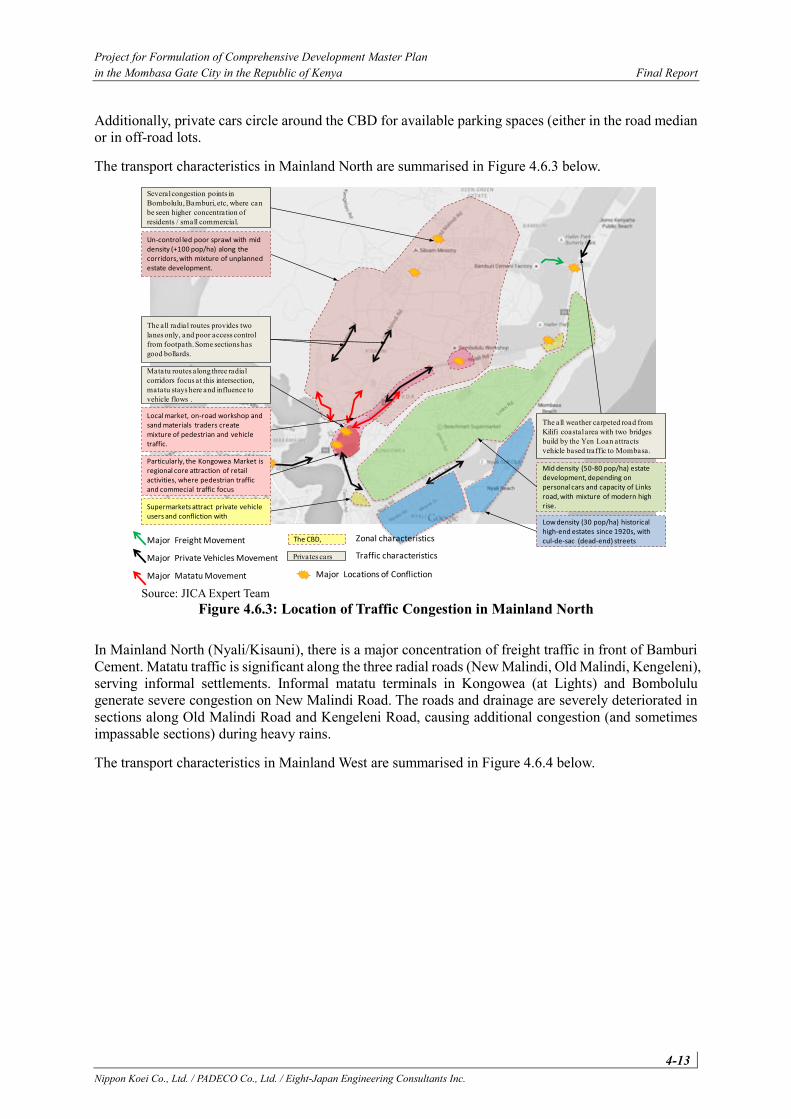
Project for Formulation of Comprehensive Development Master Plan in the Mombasa Gate City in the Republic of Kenya Final Report
4-13 Nippon Koei Co., Ltd. / PADECO Co., Ltd. / Eight-Japan Engineering Consultants Inc.
Additionally, private cars circle around the CBD for available parking spaces (either in the road median or in off-road lots.
The transport characteristics in Mainland North are summarised in Figure 4.6.3 below.
Source: JICA Expert Team
Figure 4.6.3: Location of Traffic Congestion in Mainland North
In Mainland North (Nyali/Kisauni), there is a major concentration of freight traffic in front of Bamburi Cement. Matatu traffic is significant along the three radial roads (New Malindi, Old Malindi, Kengeleni), serving informal settlements. Informal matatu terminals in Kongowea (at Lights) and Bombolulu generate severe congestion on New Malindi Road. The roads and drainage are severely deteriorated in sections along Old Malindi Road and Kengeleni Road, causing additional congestion (and sometimes impassable sections) during heavy rains.
The transport characteristics in Mainland West are summarised in Figure 4.6.4 below.
Local market, on-road workshop and sand materials traders create mixture of pedestrian and vehicle traffic.
Matatu routes along three radial corridors focus at this intersection, matatu stays here and influence to vehicle flows .
Several congestion points in Bombolulu, Bamburi, etc, where can be seen higher concentration of residents / small commercial.
The all radial routes provides two lanes only, and poor access control from footpath. Some sections has good bollards.
Un-control led poor sprawl with mid density (+100 pop/ha) along the corridors, with mixture of unplanned estate development.
Particularly, the Kongowea Market is regional core attraction of retail activities, where pedestrian traffic and commecial traffic focus
Mid density (50-80 pop/ha) estate development, depending on personal cars and capacity of Links road, with mixture of modern high rise.
Low density (30 pop/ha) historical high-end estates since 1920s, with cul-de-sac (dead-end) streets
Supermarkets attract private vehicle users and confliction with
Major Freight Movement
Major Private Vehicles Movement
Major Matatu Movement
The CBD, Zonal characteristics
Privates cars Traffic characteristics
The all weather carpeted road from Kilifi coastal area with two bridges build by the Yen Loan attracts vehicle based traffic to Mombasa.
Major Locations of Confliction
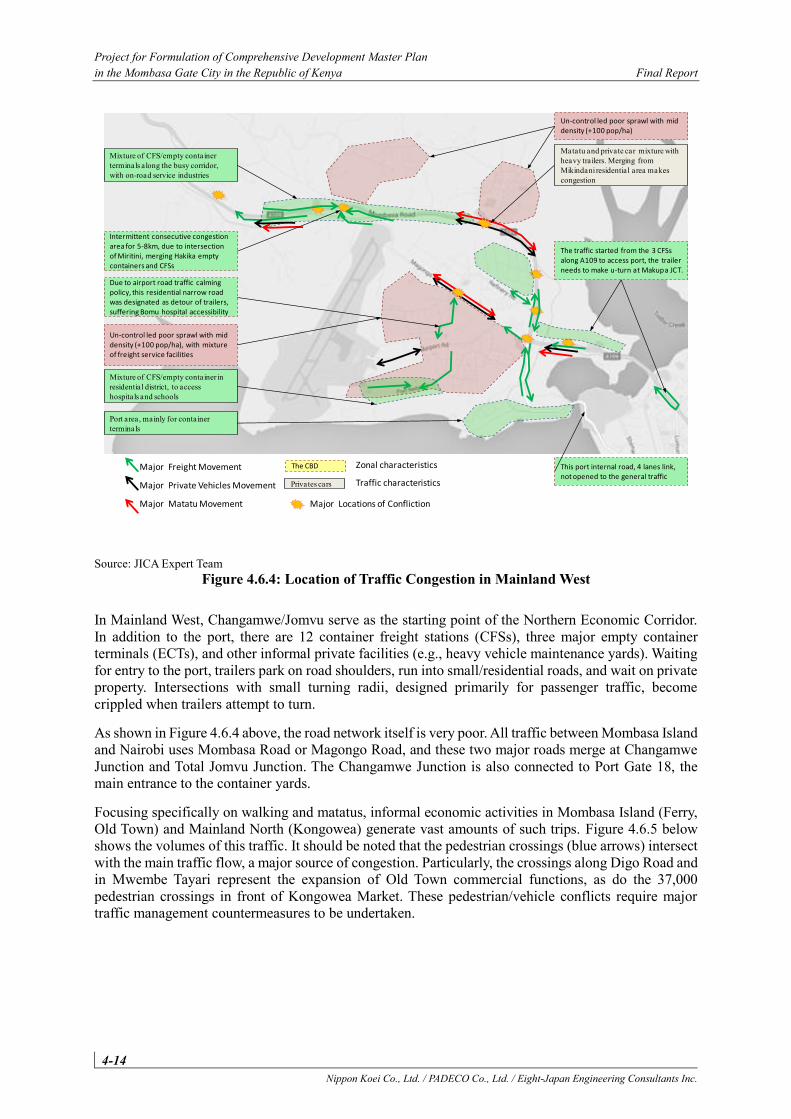
Project for Formulation of Comprehensive Development Master Plan in the Mombasa Gate City in the Republic of Kenya Final Report
4-14 Nippon Koei Co., Ltd. / PADECO Co., Ltd. / Eight-Japan Engineering Consultants Inc.
Source: JICA Expert Team Figure 4.6.4: Location of Traffic Congestion in Mainland West
In Mainland West, Changamwe/Jomvu serve as the starting point of the Northern Economic Corridor. In addition to the port, there are 12 container freight stations (CFSs), three major empty container terminals (ECTs), and other informal private facilities (e.g., heavy vehicle maintenance yards). Waiting for entry to the port, trailers park on road shoulders, run into small/residential roads, and wait on private property. Intersections with small turning radii, designed primarily for passenger traffic, become crippled when trailers attempt to turn.
As shown in Figure 4.6.4 above, the road network itself is very poor. All traffic between Mombasa Island and Nairobi uses Mombasa Road or Magongo Road, and these two major roads merge at Changamwe Junction and Total Jomvu Junction. The Changamwe Junction is also connected to Port Gate 18, the main entrance to the container yards.
Focusing specifically on walking and matatus, informal economic activities in Mombasa Island (Ferry, Old Town) and Mainland North (Kongowea) generate vast amounts of such trips. Figure 4.6.5 below shows the volumes of this traffic. It should be noted that the pedestrian crossings (blue arrows) intersect with the main traffic flow, a major source of congestion. Particularly, the crossings along Digo Road and in Mwembe Tayari represent the expansion of Old Town commercial functions, as do the 37,000 pedestrian crossings in front of Kongowea Market. These pedestrian/vehicle conflicts require major traffic management countermeasures to be undertaken.
Major Freight Movement
Major Private Vehicles Movement
Major Matatu Movement
The CBD Zonal characteristics
Privates cars Traffic characteristics
Major Locations of Confliction
Matatu and private car mixture with heavy trailers. Merging from Mikindani residential area makes congestion
Un-control led poor sprawl with mid density (+100 pop/ha)
Intermittent consecutive congestion area for 5-8km, due to intersection of Miritini, merging Hakika empty containers and CFSs
Mixture of CFS/empty container terminals along the busy corridor, with on-road service industries
Un-control led poor sprawl with mid density (+100 pop/ha), with mixture of freight service facilities
Mixture of CFS/empty container in residential district, to access hospitals and schools
Due to airport road traffic calming policy, this residential narrow road was designated as detour of trailers, suffering Bomu hospital accessibility
Port area, mainly for container terminals
The traffic started from the 3 CFSs along A109 to access port, the trailer needs to make u-turn at Makupa JCT.
This port internal road, 4 lanes link, not opened to the general traffic
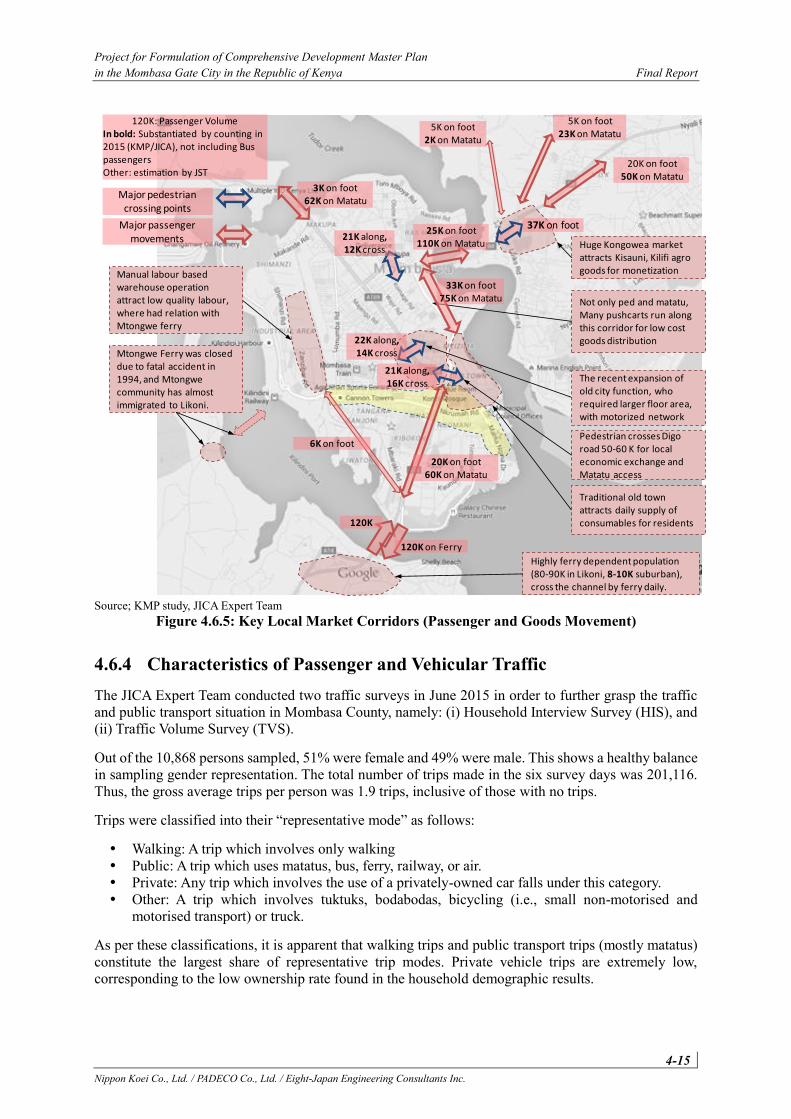
Project for Formulation of Comprehensive Development Master Plan in the Mombasa Gate City in the Republic of Kenya Final Report
4-15 Nippon Koei Co., Ltd. / PADECO Co., Ltd. / Eight-Japan Engineering Consultants Inc.
Source; KMP study, JICA Expert Team
Figure 4.6.5: Key Local Market Corridors (Passenger and Goods Movement)
4.6.4 Characteristics of Passenger and Vehicular Traffic The JICA Expert Team conducted two traffic surveys in June 2015 in order to further grasp the traffic and public transport situation in Mombasa County, namely: (i) Household Interview Survey (HIS), and (ii) Traffic Volume Survey (TVS).
Out of the 10,868 persons sampled, 51% were female and 49% were male. This shows a healthy balance in sampling gender representation. The total number of trips made in the six survey days was 201,116. Thus, the gross average trips per person was 1.9 trips, inclusive of those with no trips.
Trips were classified into their “representative mode” as follows:
Walking: A trip which involves only walking Public: A trip which uses matatus, bus, ferry, railway, or air. Private: Any trip which involves the use of a privately-owned car falls under this category. Other: A trip which involves tuktuks, bodabodas, bicycling (i.e., small non-motorised and
motorised transport) or truck.
As per these classifications, it is apparent that walking trips and public transport trips (mostly matatus) constitute the largest share of representative trip modes. Private vehicle trips are extremely low, corresponding to the low ownership rate found in the household demographic results.
Ferry-Kongowea Local Economic Corridor
Traditional old town attracts daily supply of consumables for residents
Huge Kongowea market attracts Kisauni, Kilifi agro goods for monetization
Highly ferry dependent population (80-90K in Likoni, 8-10K suburban), cross the channel by ferry daily.
120K on Ferry
120K
Manual labour based warehouse operation attract low quality labour, where had relation with Mtongwe ferry
The recent expansion of old city function, who required larger floor area, with motorized network
20K on foot60K on Matatu
6K on foot
Mtongwe Ferry was closed due to fatal accident in 1994, and Mtongwecommunity has almost immigrated to Likoni.
20K on foot50K on Matatu
5K on foot23K on Matatu
5K on foot2K on Matatu
Pedestrian crosses Digoroad 50-60 K for local economic exchange and Matatu access
Not only ped and matatu, Many pushcarts run along this corridor for low cost goods distribution
37K on foot
22K along, 14K cross
21K along, 16K cross
21K along, 12K cross
120K: Passenger VolumeIn bold: Substantiated by counting in 2015 (KMP/JICA), not including Bus passengersOther: estimation by JST
25K on foot110K on Matatu
33K on foot75K on Matatu
Major pedestrian crossing points
Major passenger movements
3K on foot62K on Matatu
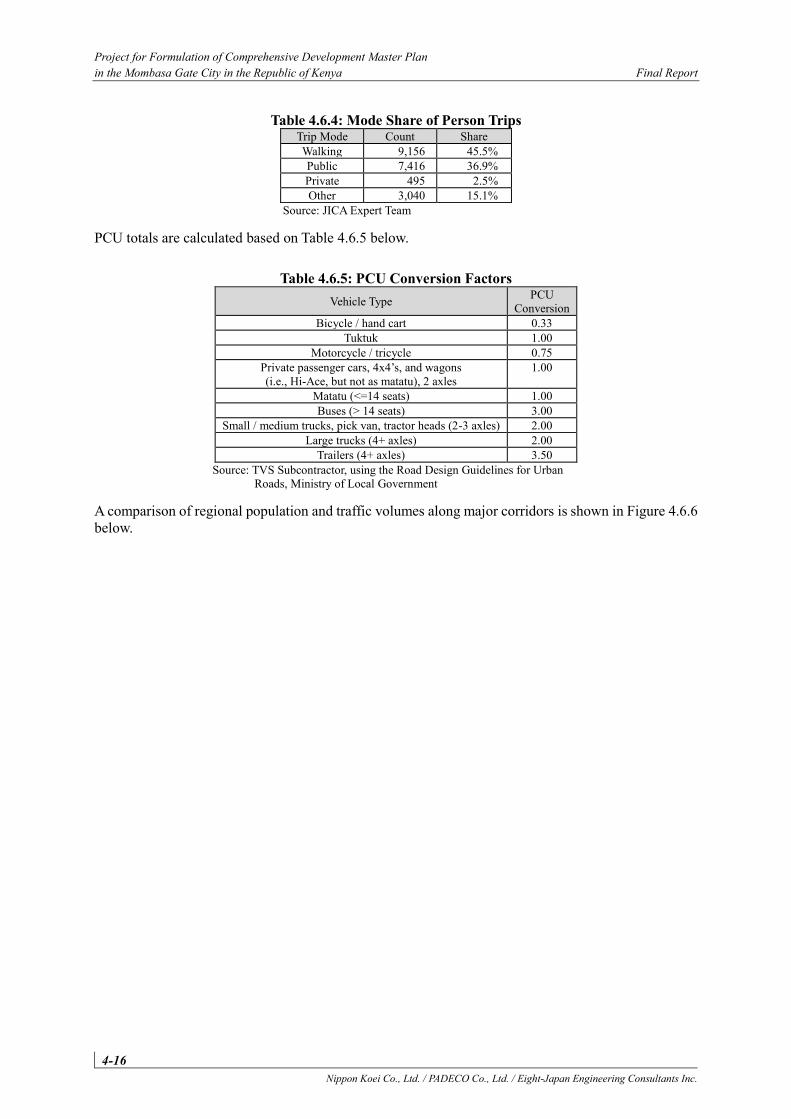
Project for Formulation of Comprehensive Development Master Plan in the Mombasa Gate City in the Republic of Kenya Final Report
4-16 Nippon Koei Co., Ltd. / PADECO Co., Ltd. / Eight-Japan Engineering Consultants Inc.
Table 4.6.4: Mode Share of Person Trips Trip Mode Count Share Walking 9,156 45.5% Public 7,416 36.9% Private 495 2.5% Other 3,040 15.1%
Source: JICA Expert Team
PCU totals are calculated based on Table 4.6.5 below.
Table 4.6.5: PCU Conversion Factors Vehicle Type PCU
Conversion Bicycle / hand cart 0.33
Tuktuk 1.00 Motorcycle / tricycle 0.75
Private passenger cars, 4x4’s, and wagons (i.e., Hi-Ace, but not as matatu), 2 axles
1.00
Matatu (<=14 seats) 1.00 Buses (> 14 seats) 3.00
Small / medium trucks, pick van, tractor heads (2-3 axles) 2.00 Large trucks (4+ axles) 2.00
Trailers (4+ axles) 3.50 Source: TVS Subcontractor, using the Road Design Guidelines for Urban
Roads, Ministry of Local Government
A comparison of regional population and traffic volumes along major corridors is shown in Figure 4.6.6 below.
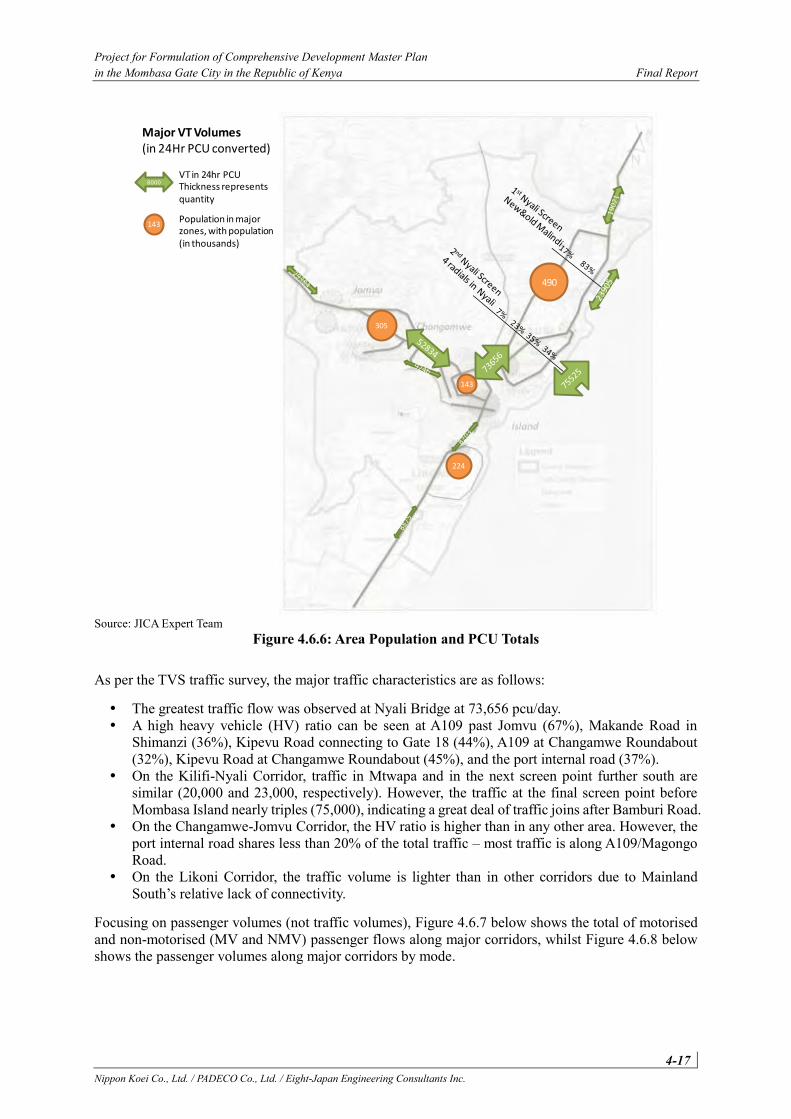
Project for Formulation of Comprehensive Development Master Plan in the Mombasa Gate City in the Republic of Kenya Final Report
4-17 Nippon Koei Co., Ltd. / PADECO Co., Ltd. / Eight-Japan Engineering Consultants Inc.
Source: JICA Expert Team
Figure 4.6.6: Area Population and PCU Totals
As per the TVS traffic survey, the major traffic characteristics are as follows:
The greatest traffic flow was observed at Nyali Bridge at 73,656 pcu/day. A high heavy vehicle (HV) ratio can be seen at A109 past Jomvu (67%), Makande Road in
Shimanzi (36%), Kipevu Road connecting to Gate 18 (44%), A109 at Changamwe Roundabout (32%), Kipevu Road at Changamwe Roundabout (45%), and the port internal road (37%).
On the Kilifi-Nyali Corridor, traffic in Mtwapa and in the next screen point further south are similar (20,000 and 23,000, respectively). However, the traffic at the final screen point before Mombasa Island nearly triples (75,000), indicating a great deal of traffic joins after Bamburi Road.
On the Changamwe-Jomvu Corridor, the HV ratio is higher than in any other area. However, the port internal road shares less than 20% of the total traffic – most traffic is along A109/Magongo Road.
On the Likoni Corridor, the traffic volume is lighter than in other corridors due to Mainland South’s relative lack of connectivity.
Focusing on passenger volumes (not traffic volumes), Figure 4.6.7 below shows the total of motorised and non-motorised (MV and NMV) passenger flows along major corridors, whilst Figure 4.6.8 below shows the passenger volumes along major corridors by mode.
8000
490
143
224
305
Major VT Volumes(in 24Hr PCU converted)
VT in 24hr PCUThickness represents quantity
143Population in major zones, with population (in thousands)
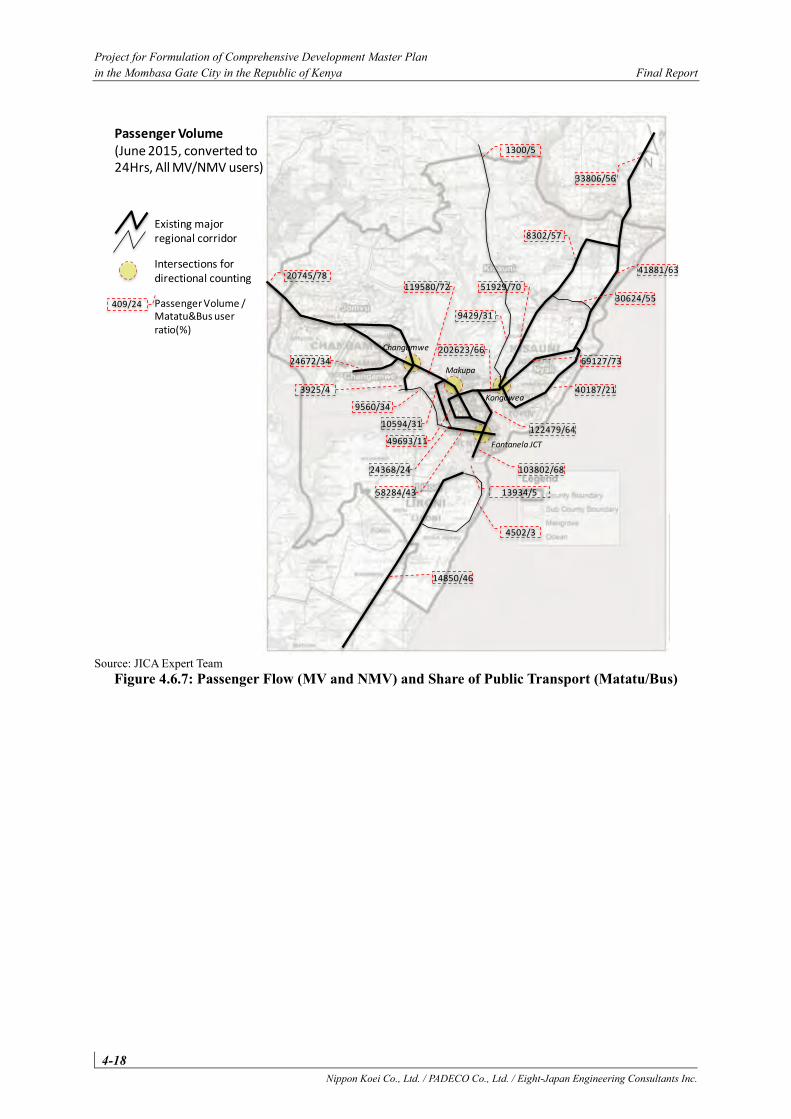
Project for Formulation of Comprehensive Development Master Plan in the Mombasa Gate City in the Republic of Kenya Final Report
4-18 Nippon Koei Co., Ltd. / PADECO Co., Ltd. / Eight-Japan Engineering Consultants Inc.
Source: JICA Expert Team
Figure 4.6.7: Passenger Flow (MV and NMV) and Share of Public Transport (Matatu/Bus)
Passenger Volume(June 2015, converted to 24Hrs, All MV/NMV users)
Existing major regional corridor
33806/56
41881/63
8302/57
40187/21
69127/73
9429/31
51929/70
202623/66
103802/68
14850/46
4502/3
24672/34
20745/78119580/72
122479/64
24368/24
49693/11
9560/34
1300/5
13934/5
Intersections for directional counting
10594/31
58284/43
30624/55
3925/4
409/24 Passenger Volume /Matatu&Bus user ratio(%)
Fontanela JCT
Kongowea
Makupa
Changamwe
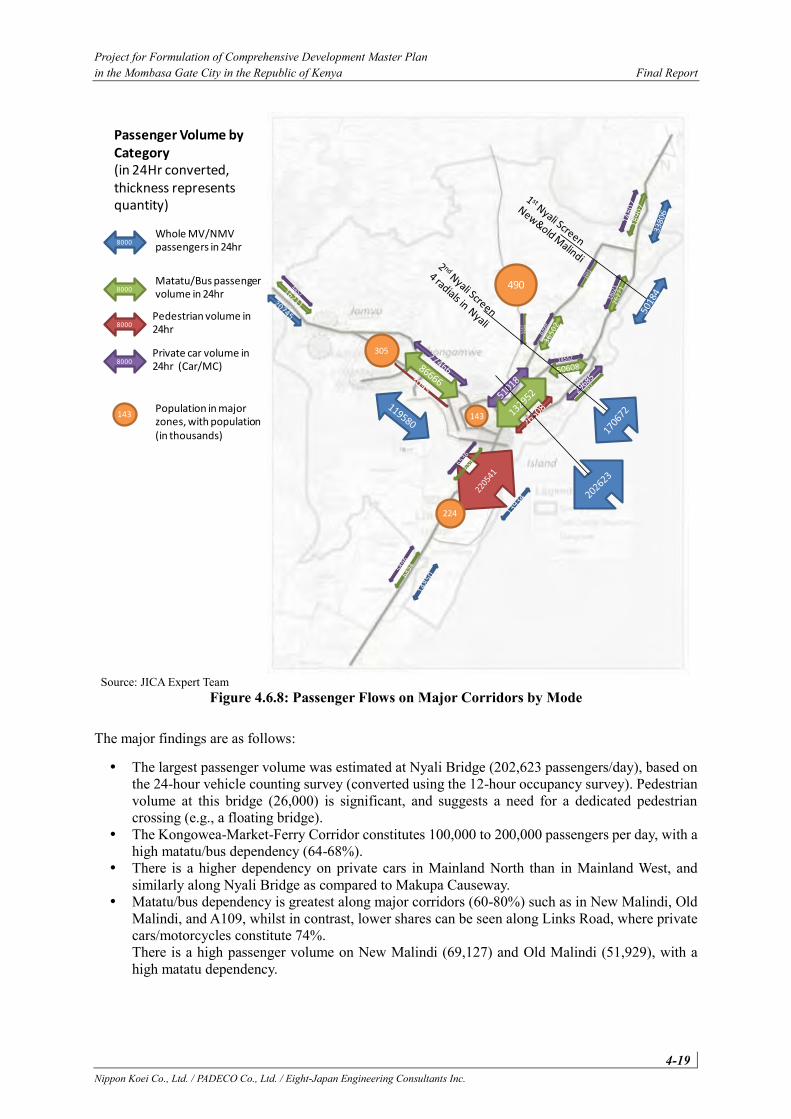
Project for Formulation of Comprehensive Development Master Plan in the Mombasa Gate City in the Republic of Kenya Final Report
4-19 Nippon Koei Co., Ltd. / PADECO Co., Ltd. / Eight-Japan Engineering Consultants Inc.
Source: JICA Expert Team
Figure 4.6.8: Passenger Flows on Major Corridors by Mode
The major findings are as follows:
The largest passenger volume was estimated at Nyali Bridge (202,623 passengers/day), based on the 24-hour vehicle counting survey (converted using the 12-hour occupancy survey). Pedestrian volume at this bridge (26,000) is significant, and suggests a need for a dedicated pedestrian crossing (e.g., a floating bridge).
The Kongowea-Market-Ferry Corridor constitutes 100,000 to 200,000 passengers per day, with a high matatu/bus dependency (64-68%).
There is a higher dependency on private cars in Mainland North than in Mainland West, and similarly along Nyali Bridge as compared to Makupa Causeway.
Matatu/bus dependency is greatest along major corridors (60-80%) such as in New Malindi, Old Malindi, and A109, whilst in contrast, lower shares can be seen along Links Road, where private cars/motorcycles constitute 74%. There is a high passenger volume on New Malindi (69,127) and Old Malindi (51,929), with a high matatu dependency.
8000 490
143
305
Passenger Volume by Category(in 24Hr converted, thickness represents quantity)
Matatu/Bus passenger volume in 24hr
143Population in major zones, with population (in thousands)
224
8000Pedestrian volume in 24hr 5
24
72
94
8
8000Private car volume in 24hr (Car/MC)
8000Whole MV/NMV passengers in 24hr
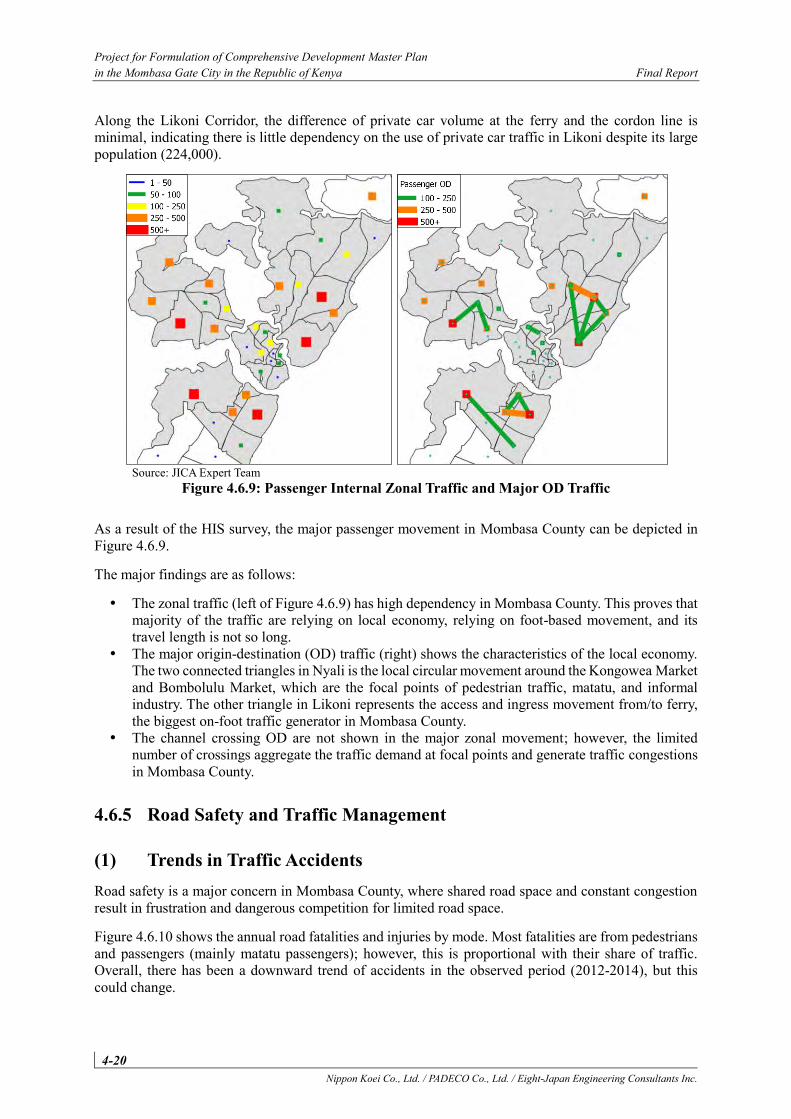
Project for Formulation of Comprehensive Development Master Plan in the Mombasa Gate City in the Republic of Kenya Final Report
4-20 Nippon Koei Co., Ltd. / PADECO Co., Ltd. / Eight-Japan Engineering Consultants Inc.
Along the Likoni Corridor, the difference of private car volume at the ferry and the cordon line is minimal, indicating there is little dependency on the use of private car traffic in Likoni despite its large population (224,000).
Source: JICA Expert Team
Figure 4.6.9: Passenger Internal Zonal Traffic and Major OD Traffic
As a result of the HIS survey, the major passenger movement in Mombasa County can be depicted in Figure 4.6.9.
The major findings are as follows:
The zonal traffic (left of Figure 4.6.9) has high dependency in Mombasa County. This proves that majority of the traffic are relying on local economy, relying on foot-based movement, and its travel length is not so long.
The major origin-destination (OD) traffic (right) shows the characteristics of the local economy. The two connected triangles in Nyali is the local circular movement around the Kongowea Market and Bombolulu Market, which are the focal points of pedestrian traffic, matatu, and informal industry. The other triangle in Likoni represents the access and ingress movement from/to ferry, the biggest on-foot traffic generator in Mombasa County.
The channel crossing OD are not shown in the major zonal movement; however, the limited number of crossings aggregate the traffic demand at focal points and generate traffic congestions in Mombasa County.
4.6.5 Road Safety and Traffic Management
(1) Trends in Traffic Accidents Road safety is a major concern in Mombasa County, where shared road space and constant congestion result in frustration and dangerous competition for limited road space.
Figure 4.6.10 shows the annual road fatalities and injuries by mode. Most fatalities are from pedestrians and passengers (mainly matatu passengers); however, this is proportional with their share of traffic. Overall, there has been a downward trend of accidents in the observed period (2012-2014), but this could change.
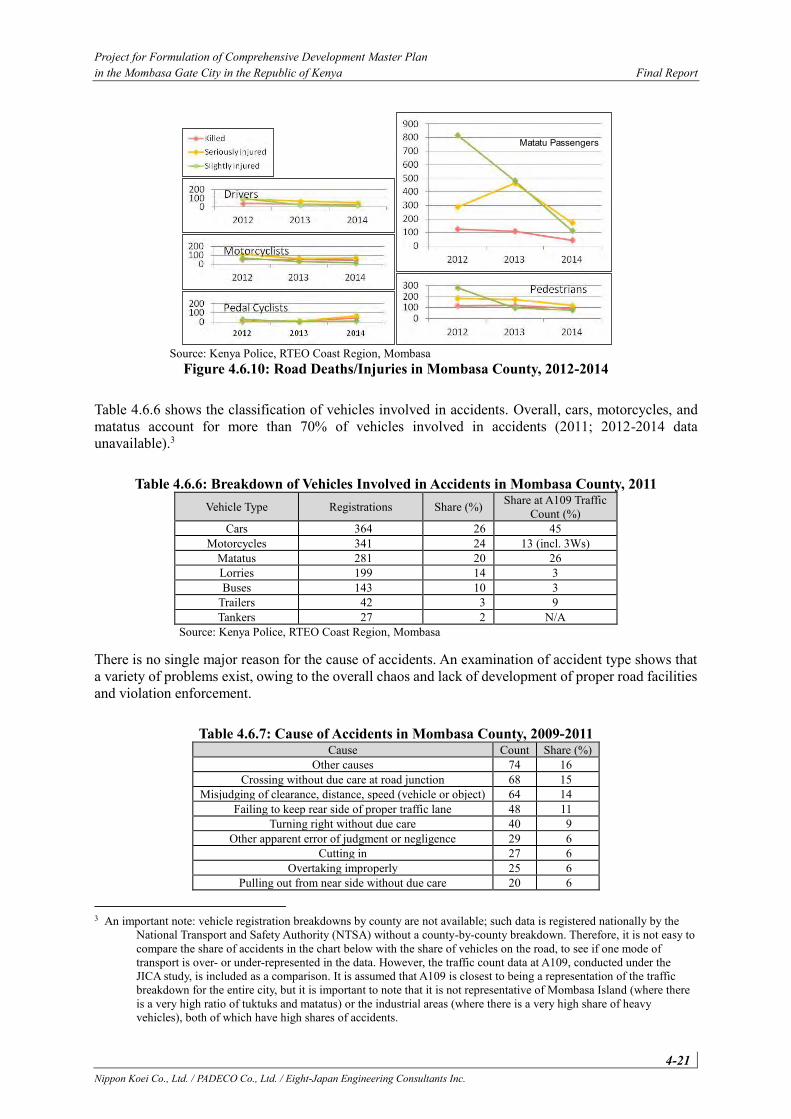
Project for Formulation of Comprehensive Development Master Plan in the Mombasa Gate City in the Republic of Kenya Final Report
4-21 Nippon Koei Co., Ltd. / PADECO Co., Ltd. / Eight-Japan Engineering Consultants Inc.
Source: Kenya Police, RTEO Coast Region, Mombasa
Figure 4.6.10: Road Deaths/Injuries in Mombasa County, 2012-2014
Table 4.6.6 shows the classification of vehicles involved in accidents. Overall, cars, motorcycles, and matatus account for more than 70% of vehicles involved in accidents (2011; 2012-2014 data unavailable).3
Table 4.6.6: Breakdown of Vehicles Involved in Accidents in Mombasa County, 2011 Vehicle Type Registrations Share (%) Share at A109 Traffic
Count (%) Cars 364 26 45
Motorcycles 341 24 13 (incl. 3Ws) Matatus 281 20 26 Lorries 199 14 3 Buses 143 10 3
Trailers 42 3 9 Tankers 27 2 N/A
Source: Kenya Police, RTEO Coast Region, Mombasa
There is no single major reason for the cause of accidents. An examination of accident type shows that a variety of problems exist, owing to the overall chaos and lack of development of proper road facilities and violation enforcement.
Table 4.6.7: Cause of Accidents in Mombasa County, 2009-2011 Cause Count Share (%)
Other causes 74 16 Crossing without due care at road junction 68 15
Misjudging of clearance, distance, speed (vehicle or object) 64 14 Failing to keep rear side of proper traffic lane 48 11
Turning right without due care 40 9 Other apparent error of judgment or negligence 29 6
Cutting in 27 6 Overtaking improperly 25 6
Pulling out from near side without due care 20 6
3 An important note: vehicle registration breakdowns by county are not available; such data is registered nationally by the
National Transport and Safety Authority (NTSA) without a county-by-county breakdown. Therefore, it is not easy to compare the share of accidents in the chart below with the share of vehicles on the road, to see if one mode of transport is over- or under-represented in the data. However, the traffic count data at A109, conducted under the JICA study, is included as a comparison. It is assumed that A109 is closest to being a representation of the traffic breakdown for the entire city, but it is important to note that it is not representative of Mombasa Island (where there is a very high ratio of tuktuks and matatus) or the industrial areas (where there is a very high share of heavy vehicles), both of which have high shares of accidents.
Matatu Passengers
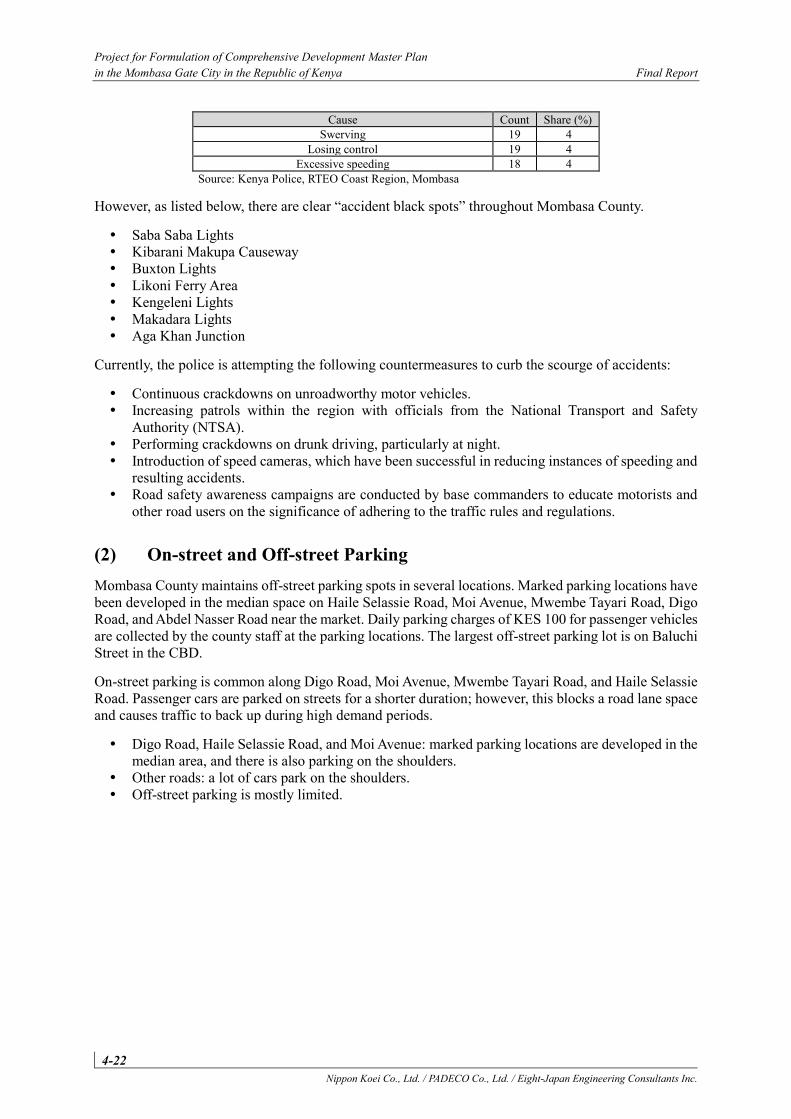
Project for Formulation of Comprehensive Development Master Plan in the Mombasa Gate City in the Republic of Kenya Final Report
4-22 Nippon Koei Co., Ltd. / PADECO Co., Ltd. / Eight-Japan Engineering Consultants Inc.
Cause Count Share (%) Swerving 19 4
Losing control 19 4 Excessive speeding 18 4
Source: Kenya Police, RTEO Coast Region, Mombasa
However, as listed below, there are clear “accident black spots” throughout Mombasa County.
Saba Saba Lights Kibarani Makupa Causeway Buxton Lights Likoni Ferry Area Kengeleni Lights Makadara Lights Aga Khan Junction
Currently, the police is attempting the following countermeasures to curb the scourge of accidents:
Continuous crackdowns on unroadworthy motor vehicles. Increasing patrols within the region with officials from the National Transport and Safety
Authority (NTSA). Performing crackdowns on drunk driving, particularly at night. Introduction of speed cameras, which have been successful in reducing instances of speeding and
resulting accidents. Road safety awareness campaigns are conducted by base commanders to educate motorists and
other road users on the significance of adhering to the traffic rules and regulations.
(2) On-street and Off-street Parking Mombasa County maintains off-street parking spots in several locations. Marked parking locations have been developed in the median space on Haile Selassie Road, Moi Avenue, Mwembe Tayari Road, Digo Road, and Abdel Nasser Road near the market. Daily parking charges of KES 100 for passenger vehicles are collected by the county staff at the parking locations. The largest off-street parking lot is on Baluchi Street in the CBD.
On-street parking is common along Digo Road, Moi Avenue, Mwembe Tayari Road, and Haile Selassie Road. Passenger cars are parked on streets for a shorter duration; however, this blocks a road lane space and causes traffic to back up during high demand periods.
Digo Road, Haile Selassie Road, and Moi Avenue: marked parking locations are developed in the median area, and there is also parking on the shoulders.
Other roads: a lot of cars park on the shoulders. Off-street parking is mostly limited.
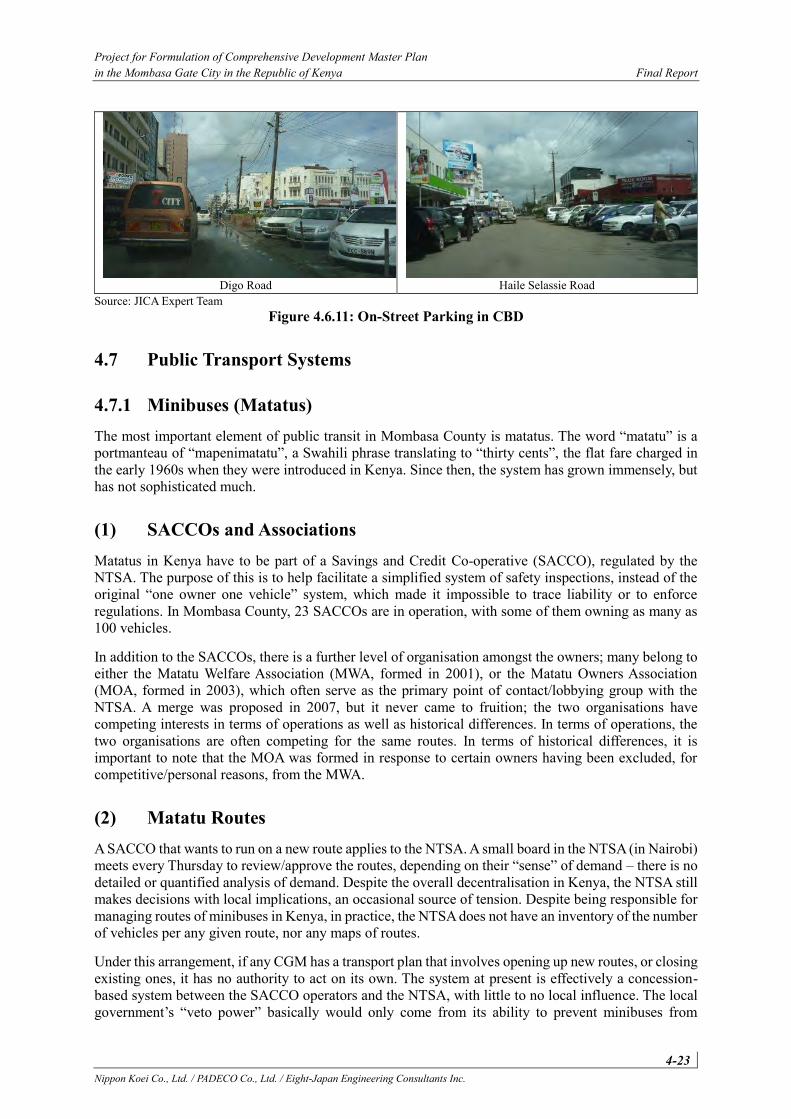
Project for Formulation of Comprehensive Development Master Plan in the Mombasa Gate City in the Republic of Kenya Final Report
4-23 Nippon Koei Co., Ltd. / PADECO Co., Ltd. / Eight-Japan Engineering Consultants Inc.
Digo Road
Haile Selassie Road
Source: JICA Expert Team Figure 4.6.11: On-Street Parking in CBD
4.7 Public Transport Systems
4.7.1 Minibuses (Matatus) The most important element of public transit in Mombasa County is matatus. The word “matatu” is a portmanteau of “mapenimatatu”, a Swahili phrase translating to “thirty cents”, the flat fare charged in the early 1960s when they were introduced in Kenya. Since then, the system has grown immensely, but has not sophisticated much.
(1) SACCOs and Associations Matatus in Kenya have to be part of a Savings and Credit Co-operative (SACCO), regulated by the NTSA. The purpose of this is to help facilitate a simplified system of safety inspections, instead of the original “one owner one vehicle” system, which made it impossible to trace liability or to enforce regulations. In Mombasa County, 23 SACCOs are in operation, with some of them owning as many as 100 vehicles.
In addition to the SACCOs, there is a further level of organisation amongst the owners; many belong to either the Matatu Welfare Association (MWA, formed in 2001), or the Matatu Owners Association (MOA, formed in 2003), which often serve as the primary point of contact/lobbying group with the NTSA. A merge was proposed in 2007, but it never came to fruition; the two organisations have competing interests in terms of operations as well as historical differences. In terms of operations, the two organisations are often competing for the same routes. In terms of historical differences, it is important to note that the MOA was formed in response to certain owners having been excluded, for competitive/personal reasons, from the MWA.
(2) Matatu Routes A SACCO that wants to run on a new route applies to the NTSA. A small board in the NTSA (in Nairobi) meets every Thursday to review/approve the routes, depending on their “sense” of demand – there is no detailed or quantified analysis of demand. Despite the overall decentralisation in Kenya, the NTSA still makes decisions with local implications, an occasional source of tension. Despite being responsible for managing routes of minibuses in Kenya, in practice, the NTSA does not have an inventory of the number of vehicles per any given route, nor any maps of routes.
Under this arrangement, if any CGM has a transport plan that involves opening up new routes, or closing existing ones, it has no authority to act on its own. The system at present is effectively a concession-based system between the SACCO operators and the NTSA, with little to no local influence. The local government’s “veto power” basically would only come from its ability to prevent minibuses from
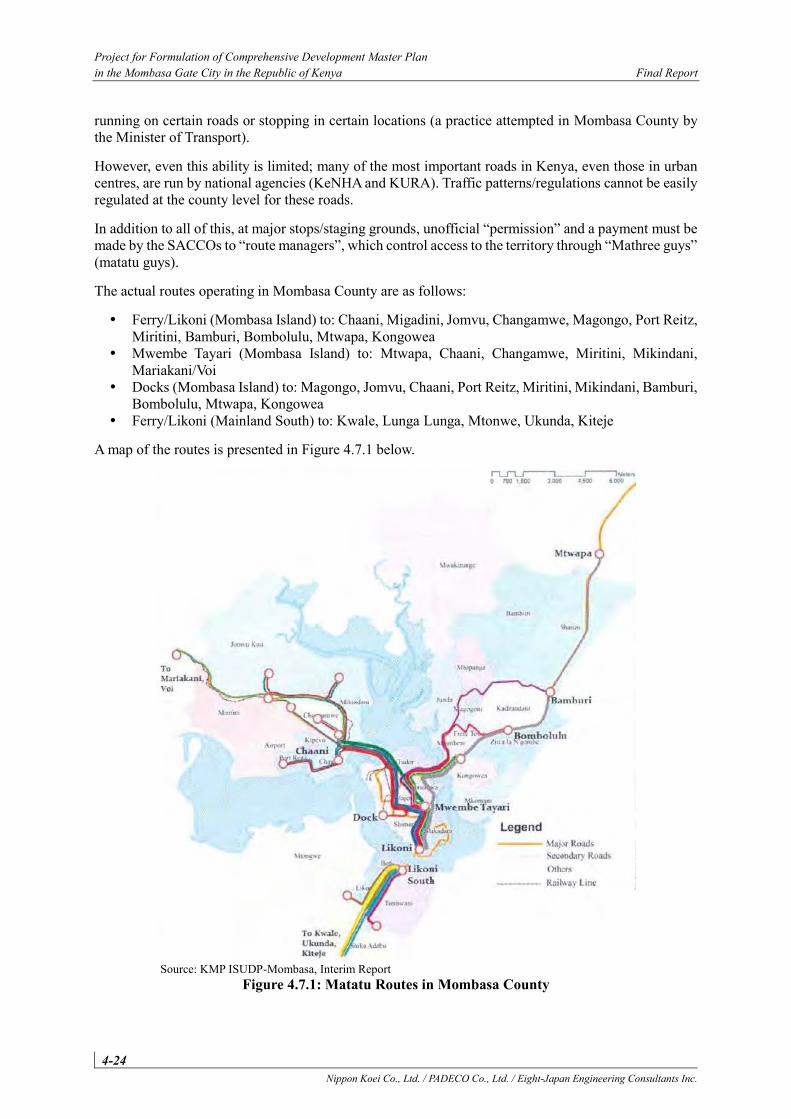
Project for Formulation of Comprehensive Development Master Plan in the Mombasa Gate City in the Republic of Kenya Final Report
4-24 Nippon Koei Co., Ltd. / PADECO Co., Ltd. / Eight-Japan Engineering Consultants Inc.
running on certain roads or stopping in certain locations (a practice attempted in Mombasa County by the Minister of Transport).
However, even this ability is limited; many of the most important roads in Kenya, even those in urban centres, are run by national agencies (KeNHA and KURA). Traffic patterns/regulations cannot be easily regulated at the county level for these roads.
In addition to all of this, at major stops/staging grounds, unofficial “permission” and a payment must be made by the SACCOs to “route managers”, which control access to the territory through “Mathree guys” (matatu guys).
The actual routes operating in Mombasa County are as follows:
Ferry/Likoni (Mombasa Island) to: Chaani, Migadini, Jomvu, Changamwe, Magongo, Port Reitz, Miritini, Bamburi, Bombolulu, Mtwapa, Kongowea
Mwembe Tayari (Mombasa Island) to: Mtwapa, Chaani, Changamwe, Miritini, Mikindani, Mariakani/Voi
Docks (Mombasa Island) to: Magongo, Jomvu, Chaani, Port Reitz, Miritini, Mikindani, Bamburi, Bombolulu, Mtwapa, Kongowea
Ferry/Likoni (Mainland South) to: Kwale, Lunga Lunga, Mtonwe, Ukunda, Kiteje
A map of the routes is presented in Figure 4.7.1 below.
Source: KMP ISUDP-Mombasa, Interim Report
Figure 4.7.1: Matatu Routes in Mombasa County
Project for Formulation of Comprehensive Development Master Plan in the Mombasa Gate City in the Republic of Kenya Final Report
4-25 Nippon Koei Co., Ltd. / PADECO Co., Ltd. / Eight-Japan Engineering Consultants Inc.
(3) Matatu Fares Despite the poor conditions of the vehicles and the associated ride experience, matatu fares are rather high as compared to other international examples – not just in the developing world, but even in the developing world. A ride from the Likoni Ferry to Mtwapa can cost KES 100.
As a comparison, minibuses in Dar es Salaam (“daladalas”) charge a flat fare of TSH 400 (KES 20), and minibuses in Hong Kong, a highly-developed city, generally cost HKD 2-10 (KES 30-150).4Because of the high fare levels, it is extremely common for commuters to walk long distances, even 10 km per direction, to reach work. To put these matatu prices in further perspective, food from street vendors can range from KES 10-50 for a snack, and up to KES 250 for a proper meal. Given the option between not walking and not eating, most people would prefer to walk and eat.
(4) Matatu Fleet and Operation Listed by seating capacity, the popular matatus in Kenya are:
Nissan Urvan/Homy/Caravan (12-14 seater) Toyota Hi-Ace (12-14 seater) Isuzu NKR 66L (25-26 seater) Isuzu NPR (29 seater) Isuzu NKR (33 seater) Isuzu NQR Max (37 seater) Hino 300 (33 seater)
In Mombasa County, the Nissan Urvan (12-14 seater) is far more dominant than any of the larger vehicles (an 80% share), likely due to their maneuverability on the narrow streets and ability to travel off-road to avoid traffic jams.
In the current arrangement, the owner of a matatu leases his vehicle to a driver, who hires a conductor. The rate is basically KES 5,000 a day for urban/intercity buses. Any amount of money the driver/conductor team makes over this threshold is theirs to keep, their major expenses being this rental fee and whatever fuel costs they incur. The driver/conductor team does not really care if they drive recklessly, because the vehicle is not theirs. They are trying to run as many routes as possible on their typical 12-hour shift. The chain of liability/responsibility, in case of accidents, is difficult to establish.
Remarkably, this is still much better than the way things were just a decade ago. In 2003, following a string of high-profile accidents, overloading was made illegal, amongst other safety changes, such as the aforementioned speed governors, special licensing requirements for drivers, and a requirement that all passengers wear a seatbelt. For a short time, these were strictly enforced, and passengers mostly complied. However, it did not take long for non-compliance to re-emerge.
4.7.2 Tuktuks (Three Wheelers) As of August 2015, there are approximately 4,600 registered auto-rickshaws, referred to locally as “tuktuks”, in Mombasa County.
4 Kenya and Tanzania have a similar Purchasing Power Parity (2014 World Bank data: 2,940 and 2,530, respectively), and as
such, the discrepancy in urban transport prices is notable. Hong Kong (2014: 56,570), as noted to be a highly-developed city, shows one of the best-case examples for affordable transport pricing.
Project for Formulation of Comprehensive Development Master Plan in the Mombasa Gate City in the Republic of Kenya Final Report
4-26 Nippon Koei Co., Ltd. / PADECO Co., Ltd. / Eight-Japan Engineering Consultants Inc.
(1) Registrations and Safety Inspections The NTSA charges an inspection charge of KES 7,000, whilst MCG charges a monthly fee (referred to as “parking fee”) of KES 1,200 and a one-time registration fee (to receive the four-digit ID number displayed on the tuktuks) of KES 2,000 for tuktuks. Insurance can cost up to KES 20,000 per year. Furthermore, the Tuktuk Association charges an entrance fee of KES 1,100 and KES 200 for painting zone colours (see section below) on the vehicle body.
(2) Tuktuk Zones Tuktuks are divided into four zones and marked with coloured strips, as follows:
Mombasa Island (Green Strip) Mainland South (Yellow Strip) Mainland North (Red Strip) Mainland West (Blue Strip)
When the colour of the vehicle is the same as the associated zone, a white strip is painted. However, these zones are not binding in any way. There is no legal or regulatory mandate preventing a tuktuk from operating in a different area. In practice, most will stick to their zones, possibly because of informal pressures / an inability to use informal queuing areas. The strips are most useful for potential passengers to identify if a vehicle is out of its original zone and is likely to return, possibly in their direction of travel, indicating a willingness to accept a fare at a lower price.
Aside from the Likoni Ferry (on Mombasa Island side), there are few proper queuing areas for tuktuks. In front of the General Post Office (in the CBD), there is a major unofficial queuing area. Informally, certain off-road patches become parking areas for tuktuks, such as outside of supermarkets and shopping areas. At these areas, there is no proper “queue”, but the drivers who are there will often have agreements with each other on who is allowed to carry the next passenger. Because they are waiting for fares, it is not uncommon for them to fend off tuktuks who are driving by attempting to pick up passengers in their immediate vicinity – they will jump on the front, hang the side, sit in the back, and even force the passenger out.
In terms of road privileges, there are no restricted areas for tuktuks; they can operate anywhere any vehicle can. Because of this, their growth has been rampant. Tuktuk drivers rent the vehicle from an owner for KES 1,000 per day (up to KES 1,200 for newer vehicles), and operate them for as many hours as they can, attempting to recoup that cost and gain a profit.
(3) Tuktuk Fares A tuktuk fare is the result of a negotiation between the driver and the passenger. In Mombasa Island, there is enough competition that standardised prices exist in practice; fares are KES 50 or KES 100, depending on how far the trip is.
Outside of Mombasa Island, there is no such guideline for the fare. Various factors go into a driver’s decision when considering a fare, i.e., the distance and the fuel cost (operating costs), the potential to pick up a passenger on the way back (opportunity cost), the quality of the road and the safety of the area (risk), and the time of the day and amount of competition (demand assumptions), amongst others.
During peak commuting hours, some tuktuks will run as “shuttle services” between fixed locations, such as between areas in the CBD and the Likoni Ferry. Three, four, or more passengers will pay a fare less than the KES 50 they would normally pay to share. This system competes with matatus, which are more susceptible to traffic jams or can have long queues.
Project for Formulation of Comprehensive Development Master Plan in the Mombasa Gate City in the Republic of Kenya Final Report
4-27 Nippon Koei Co., Ltd. / PADECO Co., Ltd. / Eight-Japan Engineering Consultants Inc.
On Sundays, when traffic is generally lower, tuktuk drivers will often turn their vehicles into “driving schools”, i.e., the driver and his trainee will share the front seat as the main driver offers both road advice and fare pricing advice.
(4) Tuktuk Fleet and Quality There are various brands of tuktuks that operate in Mombasa County; Bajaj, TVS, Piaggio, and Mahindra are the most common. They have different sizes, with some intended for three passengers and some intended for five; although in practice, all of them will carry as many as can fit on the inside, and in less-populated areas, even more hanging from the outside.
Despite their diminutive size, tuktuks have a very heavy frame. A tuktuk itself will likely inflict more damage on the light-bodied vehicle it comes in contact with. Because of this, other drivers on the road are wary to cut off tuktuks and mostly let them have their way. As a result, tuktuk drivers have a sense of invincibility as they drive. It is important to note that the tuktuk’s heavy frame does not protect the driver or the passenger in the event of an accident; they are often expelled from the vehicle and seriously injured, since the tuktuk is essentially an “open air” form of transport. Nevertheless, tuktuk drivers are fast and reckless, even in densely-trafficked/pedestrian-heavy areas.
In the Mombasa Island especially, tuktuks are often favored by mothers traveling with children, or women who are uncomfortable traveling in crowded matatus. However, tuktuks are not just for passengers; they are infamous for carrying any type of cargo, from crates of eggs in the interior to bed frames tied to the roof.
4.7.3 Motorcycle Taxis (Bodabodas) As proper public transit options are non-existent in Mombasa County, and those that do exist are increasingly unable to meet passenger demand and are ensnarled in traffic, motorcycle taxis (“bodabodas” or “pikipikis”) have seen immense growth in Mombasa County over the years.
Bodabodas fall under two classes, i.e., those properly registered as PSVs, and those unofficially operating. There is no special safety inspection for those operating as PSVs; they simply must pass the standard NTSA motorcycle inspection. For motorcycles operating as PSVs, they are required to get special insurance for PSVs, as there is no separate license for their operations. This insurance is based on the value of the motorcycle and is generally less than KES 10,000 per year.
Much like with tuktuk fares, there are no guidelines for bodaboda fares. A fare has more variation for a bodaboda than for a tuktuk in that some drivers are simply commuting for personal reasons when they are hailed by a prospective passenger, and they decide to take the fare if it is in their direction.
Bodaboda types that are popular in Mombasa County are made by Bajaj, Mahindra, Boxer, Haojin, TVS, Tiger, and much less frequently, Honda, Yamaha, and Ducati.
4.7.4 Ferry Services The ferry services across the Kilindini Harbor are operated by the Kenya Ferry Services (KFS), managing the Likoni and Mtongwe crossing points. KFS is 80% owned by the government and 20% owned by Kenya Ports Authority. The Likoni Ferry started operating in 1937.
Pedestrians account for 70% and vehicles for 30% of total business volume. On a daily basis, 6,000 vehicles and 300,000 passengers use ferry services, according to KFS. The ferry fleet owned by KFS is for the most part old and under capacity to meet the demand5.
5 The JICA Expert Team recognises that a technical proposal for cable car installation is proposed for the Likoni Channel.
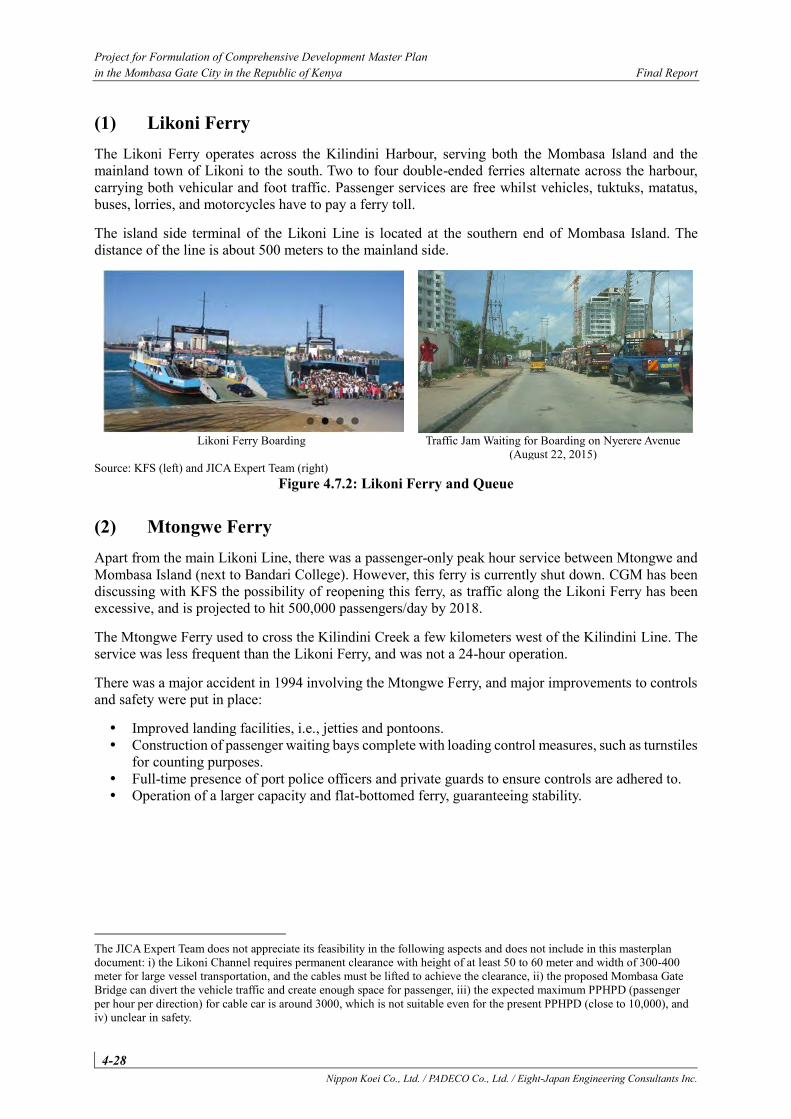
Project for Formulation of Comprehensive Development Master Plan in the Mombasa Gate City in the Republic of Kenya Final Report
4-28 Nippon Koei Co., Ltd. / PADECO Co., Ltd. / Eight-Japan Engineering Consultants Inc.
(1) Likoni Ferry The Likoni Ferry operates across the Kilindini Harbour, serving both the Mombasa Island and the mainland town of Likoni to the south. Two to four double-ended ferries alternate across the harbour, carrying both vehicular and foot traffic. Passenger services are free whilst vehicles, tuktuks, matatus, buses, lorries, and motorcycles have to pay a ferry toll.
The island side terminal of the Likoni Line is located at the southern end of Mombasa Island. The distance of the line is about 500 meters to the mainland side.
Likoni Ferry Boarding
Traffic Jam Waiting for Boarding on Nyerere Avenue
(August 22, 2015) Source: KFS (left) and JICA Expert Team (right)
Figure 4.7.2: Likoni Ferry and Queue
(2) Mtongwe Ferry Apart from the main Likoni Line, there was a passenger-only peak hour service between Mtongwe and Mombasa Island (next to Bandari College). However, this ferry is currently shut down. CGM has been discussing with KFS the possibility of reopening this ferry, as traffic along the Likoni Ferry has been excessive, and is projected to hit 500,000 passengers/day by 2018.
The Mtongwe Ferry used to cross the Kilindini Creek a few kilometers west of the Kilindini Line. The service was less frequent than the Likoni Ferry, and was not a 24-hour operation.
There was a major accident in 1994 involving the Mtongwe Ferry, and major improvements to controls and safety were put in place:
Improved landing facilities, i.e., jetties and pontoons. Construction of passenger waiting bays complete with loading control measures, such as turnstiles
for counting purposes. Full-time presence of port police officers and private guards to ensure controls are adhered to. Operation of a larger capacity and flat-bottomed ferry, guaranteeing stability.
The JICA Expert Team does not appreciate its feasibility in the following aspects and does not include in this masterplan document: i) the Likoni Channel requires permanent clearance with height of at least 50 to 60 meter and width of 300-400 meter for large vessel transportation, and the cables must be lifted to achieve the clearance, ii) the proposed Mombasa Gate Bridge can divert the vehicle traffic and create enough space for passenger, iii) the expected maximum PPHPD (passenger per hour per direction) for cable car is around 3000, which is not suitable even for the present PPHPD (close to 10,000), and iv) unclear in safety.
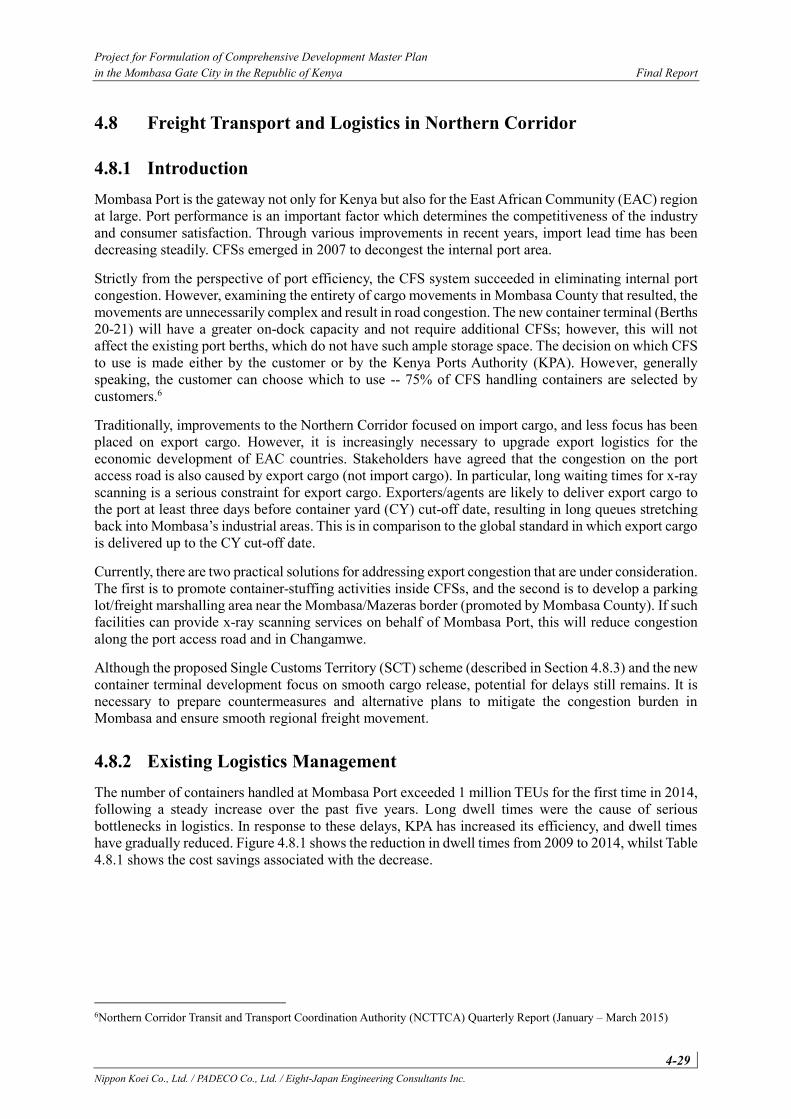
Project for Formulation of Comprehensive Development Master Plan in the Mombasa Gate City in the Republic of Kenya Final Report
4-29 Nippon Koei Co., Ltd. / PADECO Co., Ltd. / Eight-Japan Engineering Consultants Inc.
4.8 Freight Transport and Logistics in Northern Corridor
4.8.1 Introduction Mombasa Port is the gateway not only for Kenya but also for the East African Community (EAC) region at large. Port performance is an important factor which determines the competitiveness of the industry and consumer satisfaction. Through various improvements in recent years, import lead time has been decreasing steadily. CFSs emerged in 2007 to decongest the internal port area.
Strictly from the perspective of port efficiency, the CFS system succeeded in eliminating internal port congestion. However, examining the entirety of cargo movements in Mombasa County that resulted, the movements are unnecessarily complex and result in road congestion. The new container terminal (Berths 20-21) will have a greater on-dock capacity and not require additional CFSs; however, this will not affect the existing port berths, which do not have such ample storage space. The decision on which CFS to use is made either by the customer or by the Kenya Ports Authority (KPA). However, generally speaking, the customer can choose which to use -- 75% of CFS handling containers are selected by customers.6
Traditionally, improvements to the Northern Corridor focused on import cargo, and less focus has been placed on export cargo. However, it is increasingly necessary to upgrade export logistics for the economic development of EAC countries. Stakeholders have agreed that the congestion on the port access road is also caused by export cargo (not import cargo). In particular, long waiting times for x-ray scanning is a serious constraint for export cargo. Exporters/agents are likely to deliver export cargo to the port at least three days before container yard (CY) cut-off date, resulting in long queues stretching back into Mombasa’s industrial areas. This is in comparison to the global standard in which export cargo is delivered up to the CY cut-off date.
Currently, there are two practical solutions for addressing export congestion that are under consideration. The first is to promote container-stuffing activities inside CFSs, and the second is to develop a parking lot/freight marshalling area near the Mombasa/Mazeras border (promoted by Mombasa County). If such facilities can provide x-ray scanning services on behalf of Mombasa Port, this will reduce congestion along the port access road and in Changamwe.
Although the proposed Single Customs Territory (SCT) scheme (described in Section 4.8.3) and the new container terminal development focus on smooth cargo release, potential for delays still remains. It is necessary to prepare countermeasures and alternative plans to mitigate the congestion burden in Mombasa and ensure smooth regional freight movement.
4.8.2 Existing Logistics Management The number of containers handled at Mombasa Port exceeded 1 million TEUs for the first time in 2014, following a steady increase over the past five years. Long dwell times were the cause of serious bottlenecks in logistics. In response to these delays, KPA has increased its efficiency, and dwell times have gradually reduced. Figure 4.8.1 shows the reduction in dwell times from 2009 to 2014, whilst Table 4.8.1 shows the cost savings associated with the decrease.
6Northern Corridor Transit and Transport Coordination Authority (NCTTCA) Quarterly Report (January – March 2015)
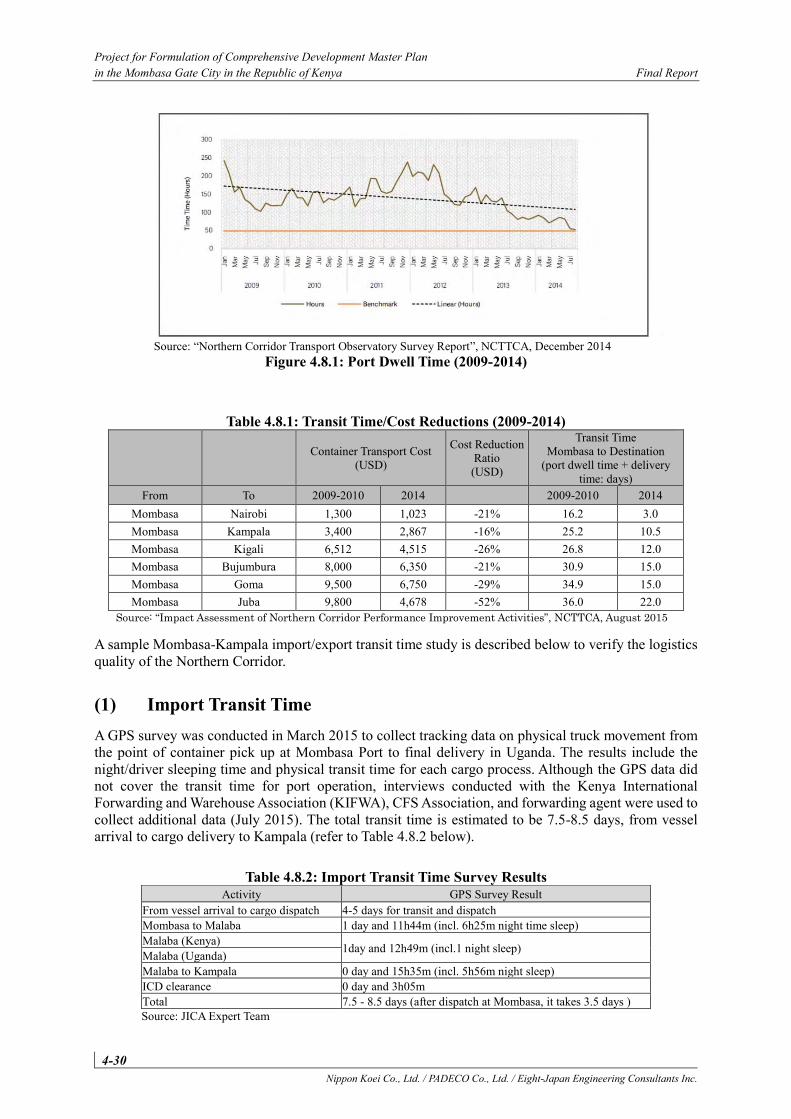
Project for Formulation of Comprehensive Development Master Plan in the Mombasa Gate City in the Republic of Kenya Final Report
4-30 Nippon Koei Co., Ltd. / PADECO Co., Ltd. / Eight-Japan Engineering Consultants Inc.
Source: “Northern Corridor Transport Observatory Survey Report”, NCTTCA, December 2014
Figure 4.8.1: Port Dwell Time (2009-2014)
Table 4.8.1: Transit Time/Cost Reductions (2009-2014)
Container Transport Cost (USD)
Cost Reduction Ratio (USD)
Transit Time Mombasa to Destination
(port dwell time + delivery time: days)
From To 2009-2010 2014 2009-2010 2014 Mombasa Nairobi 1,300 1,023 -21% 16.2 3.0 Mombasa Kampala 3,400 2,867 -16% 25.2 10.5 Mombasa Kigali 6,512 4,515 -26% 26.8 12.0 Mombasa Bujumbura 8,000 6,350 -21% 30.9 15.0 Mombasa Goma 9,500 6,750 -29% 34.9 15.0 Mombasa Juba 9,800 4,678 -52% 36.0 22.0
Source: “Impact Assessment of Northern Corridor Performance Improvement Activities”, NCTTCA, August 2015
A sample Mombasa-Kampala import/export transit time study is described below to verify the logistics quality of the Northern Corridor.
(1) Import Transit Time A GPS survey was conducted in March 2015 to collect tracking data on physical truck movement from the point of container pick up at Mombasa Port to final delivery in Uganda. The results include the night/driver sleeping time and physical transit time for each cargo process. Although the GPS data did not cover the transit time for port operation, interviews conducted with the Kenya International Forwarding and Warehouse Association (KIFWA), CFS Association, and forwarding agent were used to collect additional data (July 2015). The total transit time is estimated to be 7.5-8.5 days, from vessel arrival to cargo delivery to Kampala (refer to Table 4.8.2 below).
Table 4.8.2: Import Transit Time Survey Results Activity GPS Survey Result
From vessel arrival to cargo dispatch 4-5 days for transit and dispatch Mombasa to Malaba 1 day and 11h44m (incl. 6h25m night time sleep) Malaba (Kenya) 1day and 12h49m (incl.1 night sleep) Malaba (Uganda) Malaba to Kampala 0 day and 15h35m (incl. 5h56m night sleep) ICD clearance 0 day and 3h05m Total 7.5 - 8.5 days (after dispatch at Mombasa, it takes 3.5 days ) Source: JICA Expert Team
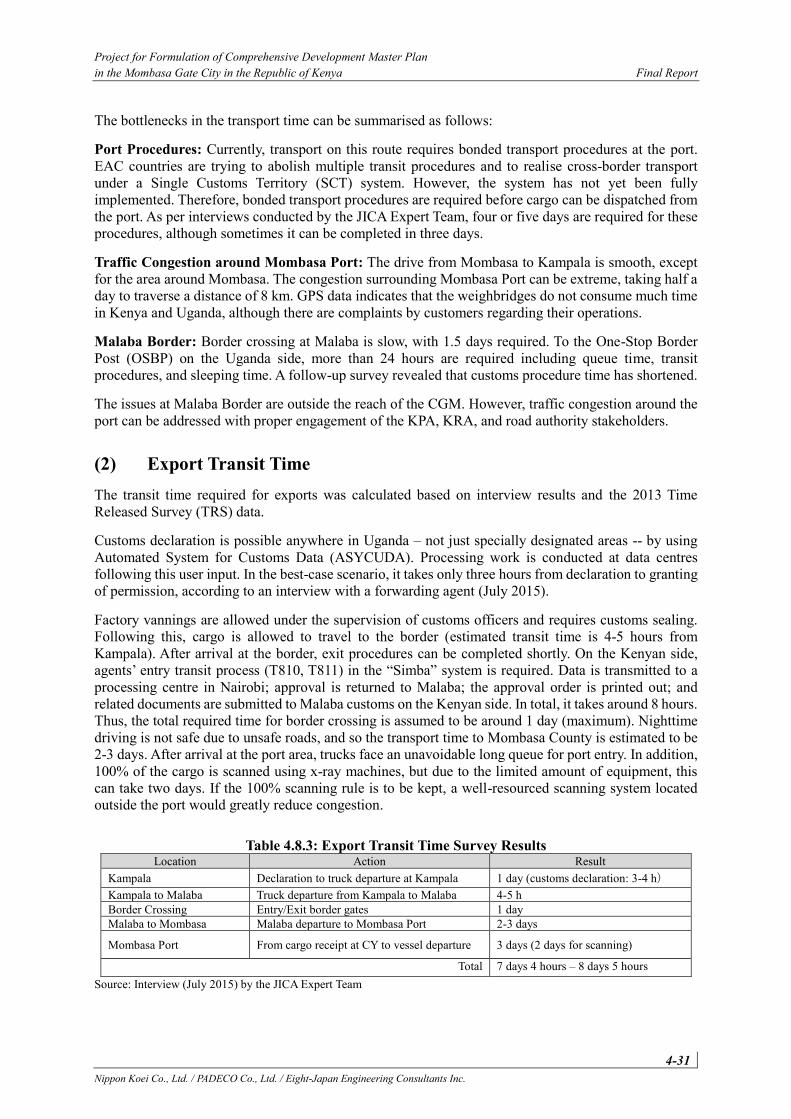
Project for Formulation of Comprehensive Development Master Plan in the Mombasa Gate City in the Republic of Kenya Final Report
4-31 Nippon Koei Co., Ltd. / PADECO Co., Ltd. / Eight-Japan Engineering Consultants Inc.
The bottlenecks in the transport time can be summarised as follows:
Port Procedures: Currently, transport on this route requires bonded transport procedures at the port. EAC countries are trying to abolish multiple transit procedures and to realise cross-border transport under a Single Customs Territory (SCT) system. However, the system has not yet been fully implemented. Therefore, bonded transport procedures are required before cargo can be dispatched from the port. As per interviews conducted by the JICA Expert Team, four or five days are required for these procedures, although sometimes it can be completed in three days.
Traffic Congestion around Mombasa Port: The drive from Mombasa to Kampala is smooth, except for the area around Mombasa. The congestion surrounding Mombasa Port can be extreme, taking half a day to traverse a distance of 8 km. GPS data indicates that the weighbridges do not consume much time in Kenya and Uganda, although there are complaints by customers regarding their operations.
Malaba Border: Border crossing at Malaba is slow, with 1.5 days required. To the One-Stop Border Post (OSBP) on the Uganda side, more than 24 hours are required including queue time, transit procedures, and sleeping time. A follow-up survey revealed that customs procedure time has shortened.
The issues at Malaba Border are outside the reach of the CGM. However, traffic congestion around the port can be addressed with proper engagement of the KPA, KRA, and road authority stakeholders.
(2) Export Transit Time The transit time required for exports was calculated based on interview results and the 2013 Time Released Survey (TRS) data.
Customs declaration is possible anywhere in Uganda – not just specially designated areas -- by using Automated System for Customs Data (ASYCUDA). Processing work is conducted at data centres following this user input. In the best-case scenario, it takes only three hours from declaration to granting of permission, according to an interview with a forwarding agent (July 2015).
Factory vannings are allowed under the supervision of customs officers and requires customs sealing. Following this, cargo is allowed to travel to the border (estimated transit time is 4-5 hours from Kampala). After arrival at the border, exit procedures can be completed shortly. On the Kenyan side, agents’ entry transit process (T810, T811) in the “Simba” system is required. Data is transmitted to a processing centre in Nairobi; approval is returned to Malaba; the approval order is printed out; and related documents are submitted to Malaba customs on the Kenyan side. In total, it takes around 8 hours. Thus, the total required time for border crossing is assumed to be around 1 day (maximum). Nighttime driving is not safe due to unsafe roads, and so the transport time to Mombasa County is estimated to be 2-3 days. After arrival at the port area, trucks face an unavoidable long queue for port entry. In addition, 100% of the cargo is scanned using x-ray machines, but due to the limited amount of equipment, this can take two days. If the 100% scanning rule is to be kept, a well-resourced scanning system located outside the port would greatly reduce congestion.
Table 4.8.3: Export Transit Time Survey Results Location Action Result
Kampala Declaration to truck departure at Kampala 1 day (customs declaration: 3-4 h) Kampala to Malaba Truck departure from Kampala to Malaba 4-5 h Border Crossing Entry/Exit border gates 1 day Malaba to Mombasa Malaba departure to Mombasa Port 2-3 days
Mombasa Port From cargo receipt at CY to vessel departure 3 days (2 days for scanning)
Total 7 days 4 hours – 8 days 5 hours Source: Interview (July 2015) by the JICA Expert Team
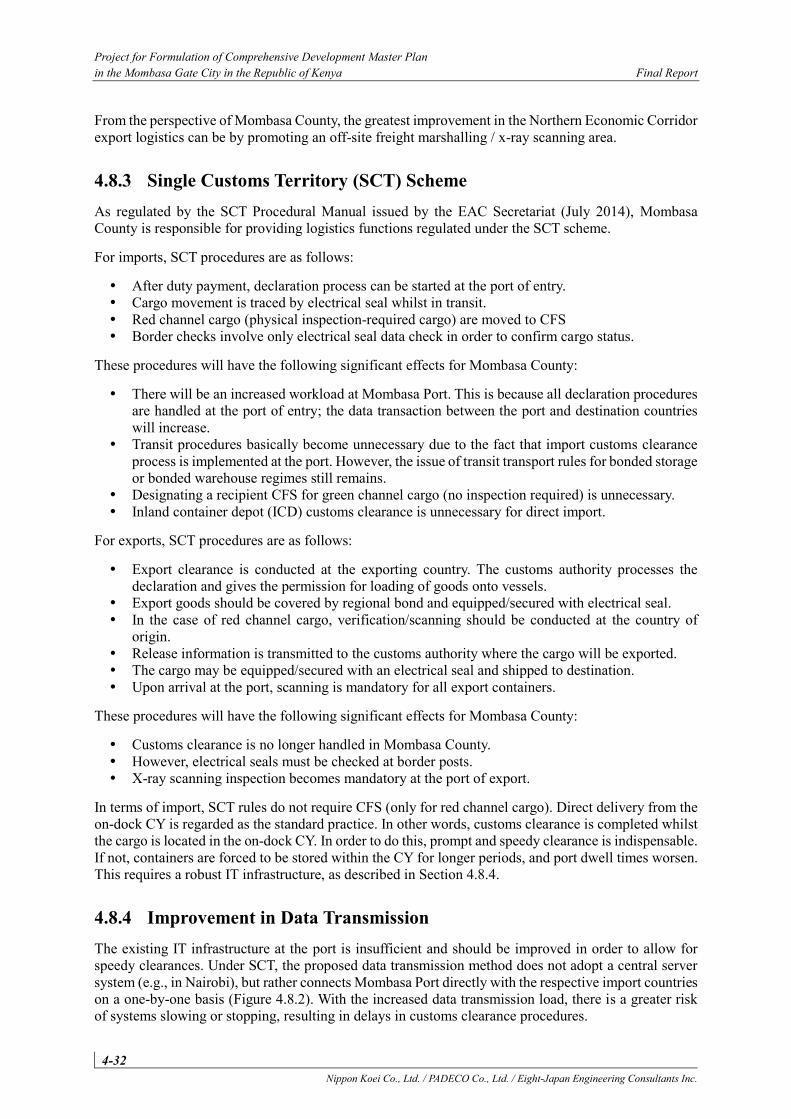
Project for Formulation of Comprehensive Development Master Plan in the Mombasa Gate City in the Republic of Kenya Final Report
4-32 Nippon Koei Co., Ltd. / PADECO Co., Ltd. / Eight-Japan Engineering Consultants Inc.
From the perspective of Mombasa County, the greatest improvement in the Northern Economic Corridor export logistics can be by promoting an off-site freight marshalling / x-ray scanning area.
4.8.3 Single Customs Territory (SCT) Scheme As regulated by the SCT Procedural Manual issued by the EAC Secretariat (July 2014), Mombasa County is responsible for providing logistics functions regulated under the SCT scheme.
For imports, SCT procedures are as follows:
After duty payment, declaration process can be started at the port of entry. Cargo movement is traced by electrical seal whilst in transit. Red channel cargo (physical inspection-required cargo) are moved to CFS Border checks involve only electrical seal data check in order to confirm cargo status.
These procedures will have the following significant effects for Mombasa County:
There will be an increased workload at Mombasa Port. This is because all declaration procedures are handled at the port of entry; the data transaction between the port and destination countries will increase.
Transit procedures basically become unnecessary due to the fact that import customs clearance process is implemented at the port. However, the issue of transit transport rules for bonded storage or bonded warehouse regimes still remains.
Designating a recipient CFS for green channel cargo (no inspection required) is unnecessary. Inland container depot (ICD) customs clearance is unnecessary for direct import.
For exports, SCT procedures are as follows:
Export clearance is conducted at the exporting country. The customs authority processes the declaration and gives the permission for loading of goods onto vessels.
Export goods should be covered by regional bond and equipped/secured with electrical seal. In the case of red channel cargo, verification/scanning should be conducted at the country of
origin. Release information is transmitted to the customs authority where the cargo will be exported. The cargo may be equipped/secured with an electrical seal and shipped to destination. Upon arrival at the port, scanning is mandatory for all export containers.
These procedures will have the following significant effects for Mombasa County:
Customs clearance is no longer handled in Mombasa County. However, electrical seals must be checked at border posts. X-ray scanning inspection becomes mandatory at the port of export.
In terms of import, SCT rules do not require CFS (only for red channel cargo). Direct delivery from the on-dock CY is regarded as the standard practice. In other words, customs clearance is completed whilst the cargo is located in the on-dock CY. In order to do this, prompt and speedy clearance is indispensable. If not, containers are forced to be stored within the CY for longer periods, and port dwell times worsen. This requires a robust IT infrastructure, as described in Section 4.8.4.
4.8.4 Improvement in Data Transmission The existing IT infrastructure at the port is insufficient and should be improved in order to allow for speedy clearances. Under SCT, the proposed data transmission method does not adopt a central server system (e.g., in Nairobi), but rather connects Mombasa Port directly with the respective import countries on a one-by-one basis (Figure 4.8.2). With the increased data transmission load, there is a greater risk of systems slowing or stopping, resulting in delays in customs clearance procedures.
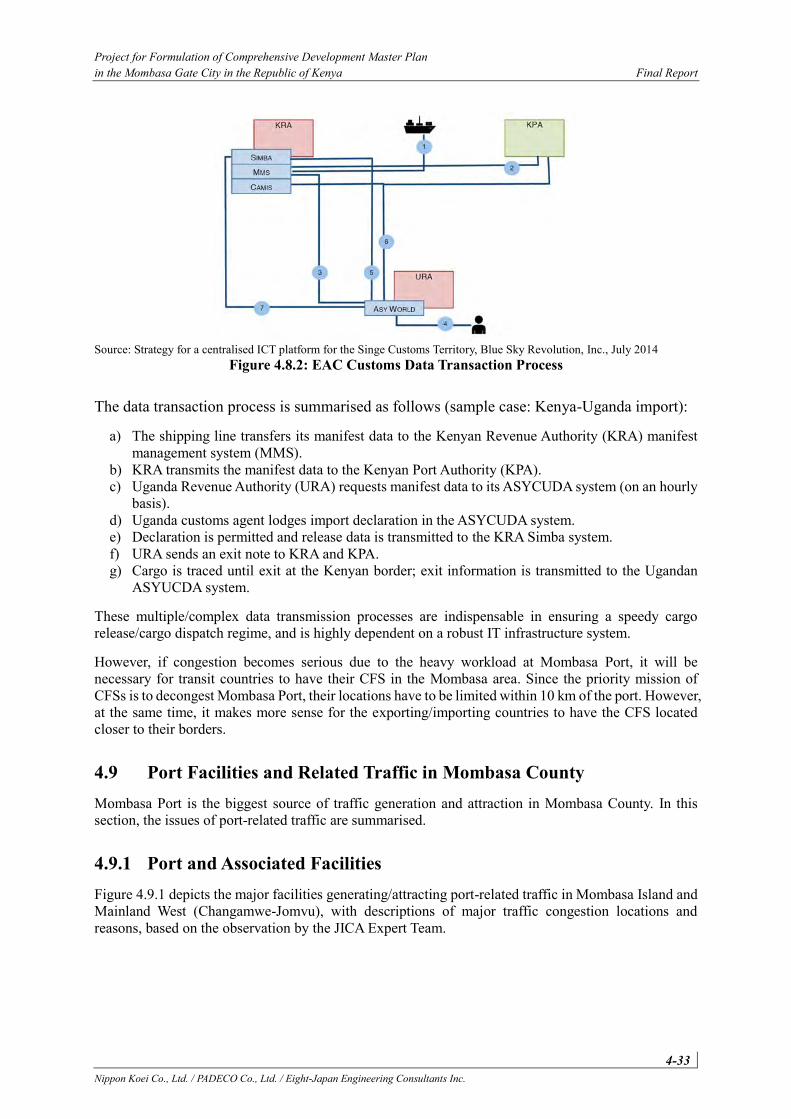
Project for Formulation of Comprehensive Development Master Plan in the Mombasa Gate City in the Republic of Kenya Final Report
4-33 Nippon Koei Co., Ltd. / PADECO Co., Ltd. / Eight-Japan Engineering Consultants Inc.
Source: Strategy for a centralised ICT platform for the Singe Customs Territory, Blue Sky Revolution, Inc., July 2014
Figure 4.8.2: EAC Customs Data Transaction Process
The data transaction process is summarised as follows (sample case: Kenya-Uganda import):
a) The shipping line transfers its manifest data to the Kenyan Revenue Authority (KRA) manifest management system (MMS).
b) KRA transmits the manifest data to the Kenyan Port Authority (KPA). c) Uganda Revenue Authority (URA) requests manifest data to its ASYCUDA system (on an hourly
basis). d) Uganda customs agent lodges import declaration in the ASYCUDA system. e) Declaration is permitted and release data is transmitted to the KRA Simba system. f) URA sends an exit note to KRA and KPA. g) Cargo is traced until exit at the Kenyan border; exit information is transmitted to the Ugandan
ASYUCDA system.
These multiple/complex data transmission processes are indispensable in ensuring a speedy cargo release/cargo dispatch regime, and is highly dependent on a robust IT infrastructure system.
However, if congestion becomes serious due to the heavy workload at Mombasa Port, it will be necessary for transit countries to have their CFS in the Mombasa area. Since the priority mission of CFSs is to decongest Mombasa Port, their locations have to be limited within 10 km of the port. However, at the same time, it makes more sense for the exporting/importing countries to have the CFS located closer to their borders.
4.9 Port Facilities and Related Traffic in Mombasa County Mombasa Port is the biggest source of traffic generation and attraction in Mombasa County. In this section, the issues of port-related traffic are summarised.
4.9.1 Port and Associated Facilities Figure 4.9.1 depicts the major facilities generating/attracting port-related traffic in Mombasa Island and Mainland West (Changamwe-Jomvu), with descriptions of major traffic congestion locations and reasons, based on the observation by the JICA Expert Team.
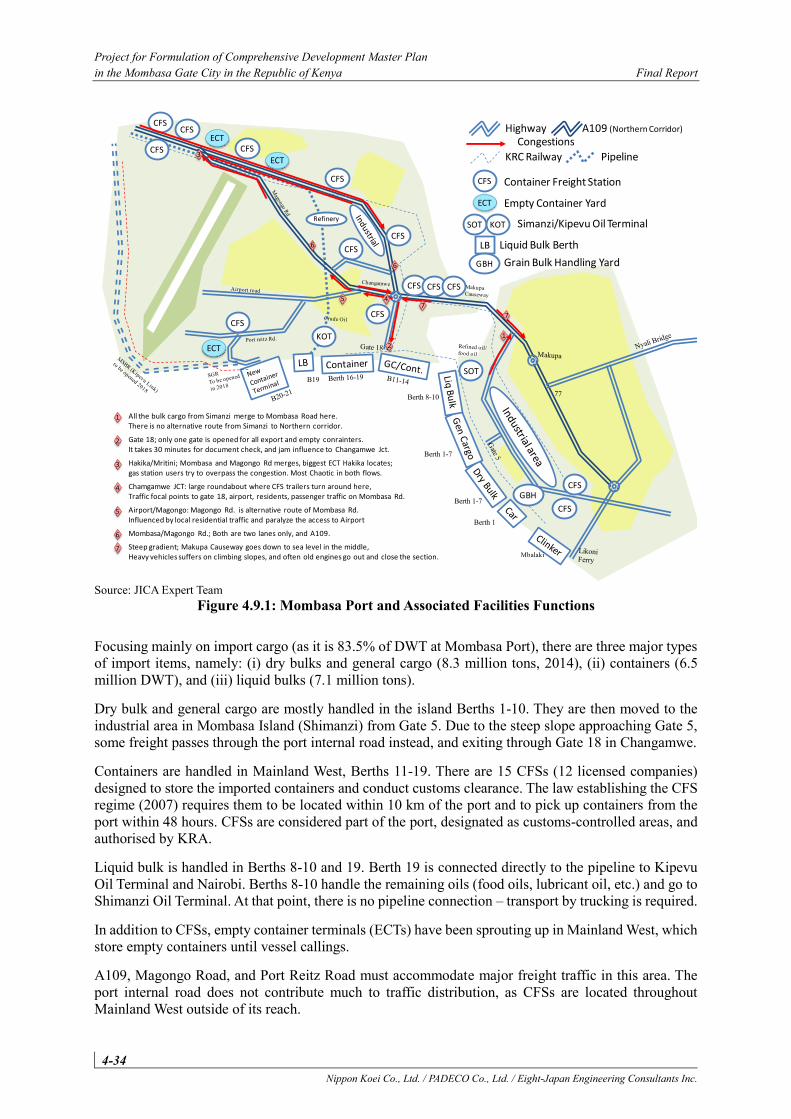
Project for Formulation of Comprehensive Development Master Plan in the Mombasa Gate City in the Republic of Kenya Final Report
4-34 Nippon Koei Co., Ltd. / PADECO Co., Ltd. / Eight-Japan Engineering Consultants Inc.
Source: JICA Expert Team
Figure 4.9.1: Mombasa Port and Associated Facilities Functions
Focusing mainly on import cargo (as it is 83.5% of DWT at Mombasa Port), there are three major types of import items, namely: (i) dry bulks and general cargo (8.3 million tons, 2014), (ii) containers (6.5 million DWT), and (iii) liquid bulks (7.1 million tons).
Dry bulk and general cargo are mostly handled in the island Berths 1-10. They are then moved to the industrial area in Mombasa Island (Shimanzi) from Gate 5. Due to the steep slope approaching Gate 5, some freight passes through the port internal road instead, and exiting through Gate 18 in Changamwe.
Containers are handled in Mainland West, Berths 11-19. There are 15 CFSs (12 licensed companies) designed to store the imported containers and conduct customs clearance. The law establishing the CFS regime (2007) requires them to be located within 10 km of the port and to pick up containers from the port within 48 hours. CFSs are considered part of the port, designated as customs-controlled areas, and authorised by KRA.
Liquid bulk is handled in Berths 8-10 and 19. Berth 19 is connected directly to the pipeline to Kipevu Oil Terminal and Nairobi. Berths 8-10 handle the remaining oils (food oils, lubricant oil, etc.) and go to Shimanzi Oil Terminal. At that point, there is no pipeline connection – transport by trucking is required.
In addition to CFSs, empty container terminals (ECTs) have been sprouting up in Mainland West, which store empty containers until vessel callings.
A109, Magongo Road, and Port Reitz Road must accommodate major freight traffic in this area. The port internal road does not contribute much to traffic distribution, as CFSs are located throughout Mainland West outside of its reach.
Berth 8-10
Berth 1-7
Berth 1-7
SOT
Berth 1
CFS
CFS
B19
ECT
ECT
CFS
KOT
Refinery
CFS
Highway
KRC Railway Pipeline
A109 (Northern Corridor)
CFS
Container Freight Station
Empty Container Yard
Simanzi/Kipevu Oil Terminal
LB Liquid Bulk Berth
CFS
CFS
CFSCFS
CFSECT
GBHCFS
CFS
ECT
SOT KOT
GBH Grain Bulk Handling Yard
5
3
6
1 All the bulk cargo from Simanzi merge to Mombasa Road here.There is no alternative route from Simanzi to Northern corridor.
Gate 18; only one gate is opened for all export and empty conrainters.It takes 30 minutes for document check, and jam influence to Changamwe Jct.
Hakika/Mritini; Mombasa and Magongo Rd merges, biggest ECT Hakika locates;gas station users try to overpass the congestion. Most Chaotic in both flows.
Chamgamwe JCT: large roundabout where CFS trailers turn around here, Traffic focal points to gate 18, airport, residents, passenger traffic on Mombasa Rd.
Airport/Magongo: Magongo Rd. is alternative route of Mombasa Rd. Influenced by local residential traffic and paralyze the access to Airport
Mombasa/Magongo Rd.; Both are two lanes only, and A109.
6
Steep gradient; Makupa Causeway goes down to sea level in the middle, Heavy vehicles suffers on climbing slopes, and often old engines go out and close the section.
2
3
4
5
6
7
CFS CFS CFS
Mbalaki
Congestions
4
1
2
7
7
Project for Formulation of Comprehensive Development Master Plan in the Mombasa Gate City in the Republic of Kenya Final Report
4-35 Nippon Koei Co., Ltd. / PADECO Co., Ltd. / Eight-Japan Engineering Consultants Inc.
4.9.2 Main Feature of Mombasa Port
(1) Volume of Cargo Handled The total cargo throughput at Mombasa Port increased by 11.5% from 22.307 million tons in 2013 to 24.875 million tons in 2014. Specifically, there was a notable increase in container traffic from 2012 to 2014. The port registered a total of 1.012 million TEUs handled in 2014 compared to 0.893 million TEUs in 2013, corresponding to a 13.2% increase. Mombasa is the biggest port in the EAC region. Figure 4.9.2 illustrates the comparison of container handling achievement with the port of Dar es Salaam.
Source: Kenya National Bureau of Statistics, 2015 Economic Survey, and Tanzania Ports Authority
Figure 4.9.2: Container Traffic at Mombasa vs. Dar es Salaam Port (TEU)
(2) Import/Export Characteristics There is a large imbalance in the number of filled containers. In 2014, loaded export containers amounted to only 23% of loaded import containers. As a result, many export containers are exported empty. Of the one million TEUs handled in 2014, one-third (0.33 million TEUs) were empty exports. In other words, Mombasa Port tends to retain empty containers, and there is the risk that empty containers can easily become dead stock.
(3) Major Destinations In 2014, one-fourth of imports were from transit countries. Mombasa Port is highly important as a regional gateway. In exports, however, total export volume from transit countries accounted for less than 10% of the entire volume at Mombasa Port. The low percentage of exports from transit countries is believed to be one of the major reasons for the small overall export volume at Mombasa Port.
Uganda is dominant amongst transit countries both in imports and exports. In 2014, Uganda accounted for 72% of exports to all transit countries and 77% of imports from all transit countries.
(4) Modes of Freight Transport Although rail transport is assumed to capture a 5% share of the traffic at Mombasa Port, its share has been declining further during 2015-2016. Currently, the Standard Gauge Rail (SGR) Project is underway, but its ability to capture traffic is uncertain. Rail transport is available only in Kenya and Uganda, and it is unavailable in Rwanda and other transit countries.
For rail transport, only exports reach the 5% level – imports are at around 3%. For Uganda’s exports, only 1% is carried on rail. As per interviews conducted with haulers and importers/exporters and a 2015 CPCS study, transportation between Mombasa and Nairobi costs around USD 1,000 for both railway and truck transport alike. Rail is not particularly competitive in terms of price, and its punctuality and
0
200,000
400,000
600,000
800,000
1,000,000
1,200,000
2011 2012 2013 2014
Mombasa
Dar es Salaam
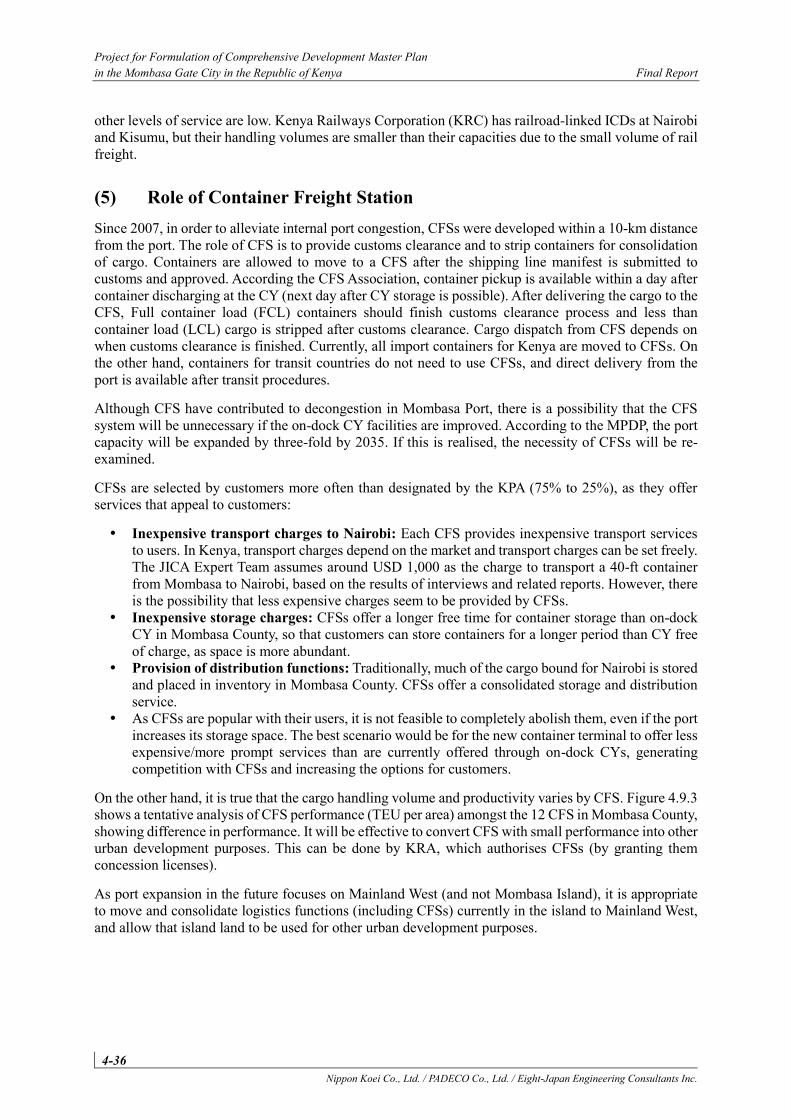
Project for Formulation of Comprehensive Development Master Plan in the Mombasa Gate City in the Republic of Kenya Final Report
4-36 Nippon Koei Co., Ltd. / PADECO Co., Ltd. / Eight-Japan Engineering Consultants Inc.
other levels of service are low. Kenya Railways Corporation (KRC) has railroad-linked ICDs at Nairobi and Kisumu, but their handling volumes are smaller than their capacities due to the small volume of rail freight.
(5) Role of Container Freight Station Since 2007, in order to alleviate internal port congestion, CFSs were developed within a 10-km distance from the port. The role of CFS is to provide customs clearance and to strip containers for consolidation of cargo. Containers are allowed to move to a CFS after the shipping line manifest is submitted to customs and approved. According the CFS Association, container pickup is available within a day after container discharging at the CY (next day after CY storage is possible). After delivering the cargo to the CFS, Full container load (FCL) containers should finish customs clearance process and less than container load (LCL) cargo is stripped after customs clearance. Cargo dispatch from CFS depends on when customs clearance is finished. Currently, all import containers for Kenya are moved to CFSs. On the other hand, containers for transit countries do not need to use CFSs, and direct delivery from the port is available after transit procedures.
Although CFS have contributed to decongestion in Mombasa Port, there is a possibility that the CFS system will be unnecessary if the on-dock CY facilities are improved. According to the MPDP, the port capacity will be expanded by three-fold by 2035. If this is realised, the necessity of CFSs will be re-examined.
CFSs are selected by customers more often than designated by the KPA (75% to 25%), as they offer services that appeal to customers:
Inexpensive transport charges to Nairobi: Each CFS provides inexpensive transport services to users. In Kenya, transport charges depend on the market and transport charges can be set freely. The JICA Expert Team assumes around USD 1,000 as the charge to transport a 40-ft container from Mombasa to Nairobi, based on the results of interviews and related reports. However, there is the possibility that less expensive charges seem to be provided by CFSs.
Inexpensive storage charges: CFSs offer a longer free time for container storage than on-dock CY in Mombasa County, so that customers can store containers for a longer period than CY free of charge, as space is more abundant.
Provision of distribution functions: Traditionally, much of the cargo bound for Nairobi is stored and placed in inventory in Mombasa County. CFSs offer a consolidated storage and distribution service.
As CFSs are popular with their users, it is not feasible to completely abolish them, even if the port increases its storage space. The best scenario would be for the new container terminal to offer less expensive/more prompt services than are currently offered through on-dock CYs, generating competition with CFSs and increasing the options for customers.
On the other hand, it is true that the cargo handling volume and productivity varies by CFS. Figure 4.9.3 shows a tentative analysis of CFS performance (TEU per area) amongst the 12 CFS in Mombasa County, showing difference in performance. It will be effective to convert CFS with small performance into other urban development purposes. This can be done by KRA, which authorises CFSs (by granting them concession licenses).
As port expansion in the future focuses on Mainland West (and not Mombasa Island), it is appropriate to move and consolidate logistics functions (including CFSs) currently in the island to Mainland West, and allow that island land to be used for other urban development purposes.
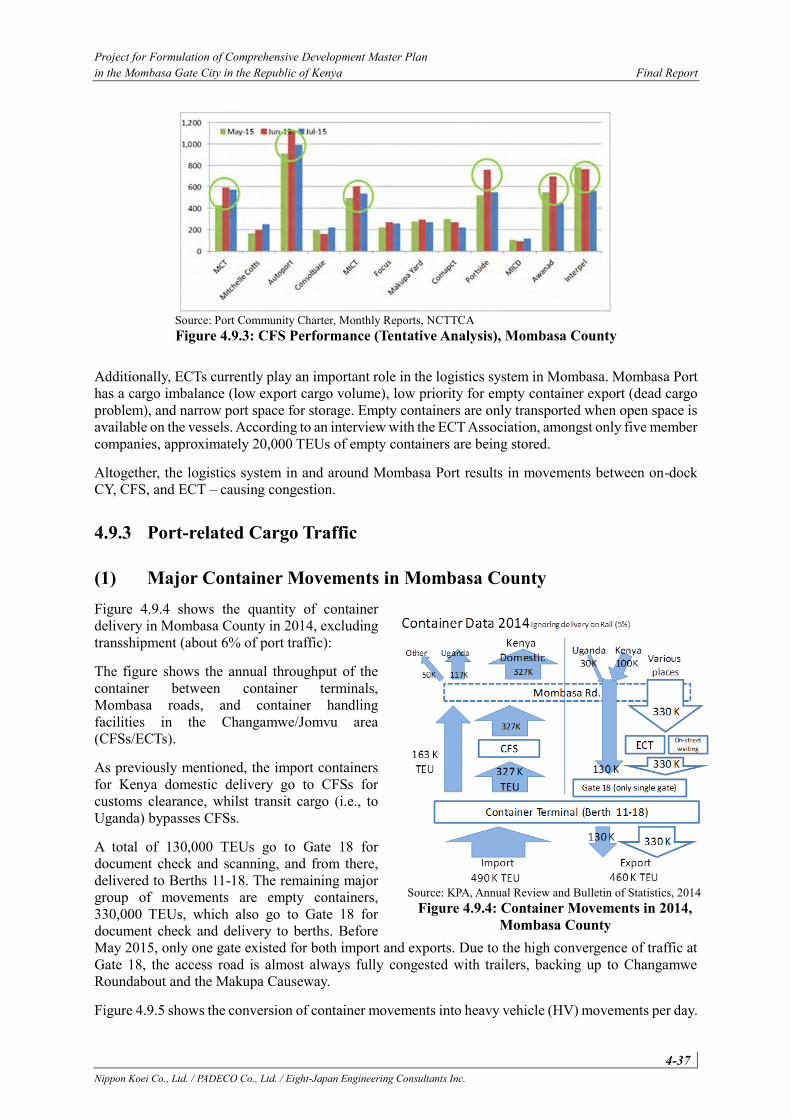
Project for Formulation of Comprehensive Development Master Plan in the Mombasa Gate City in the Republic of Kenya Final Report
4-37 Nippon Koei Co., Ltd. / PADECO Co., Ltd. / Eight-Japan Engineering Consultants Inc.
Source: Port Community Charter, Monthly Reports, NCTTCA Figure 4.9.3: CFS Performance (Tentative Analysis), Mombasa County
Additionally, ECTs currently play an important role in the logistics system in Mombasa. Mombasa Port has a cargo imbalance (low export cargo volume), low priority for empty container export (dead cargo problem), and narrow port space for storage. Empty containers are only transported when open space is available on the vessels. According to an interview with the ECT Association, amongst only five member companies, approximately 20,000 TEUs of empty containers are being stored.
Altogether, the logistics system in and around Mombasa Port results in movements between on-dock CY, CFS, and ECT – causing congestion.
4.9.3 Port-related Cargo Traffic
(1) Major Container Movements in Mombasa County Figure 4.9.4 shows the quantity of container delivery in Mombasa County in 2014, excluding transshipment (about 6% of port traffic):
The figure shows the annual throughput of the container between container terminals, Mombasa roads, and container handling facilities in the Changamwe/Jomvu area (CFSs/ECTs).
As previously mentioned, the import containers for Kenya domestic delivery go to CFSs for customs clearance, whilst transit cargo (i.e., to Uganda) bypasses CFSs.
A total of 130,000 TEUs go to Gate 18 for document check and scanning, and from there, delivered to Berths 11-18. The remaining major group of movements are empty containers, 330,000 TEUs, which also go to Gate 18 for document check and delivery to berths. Before May 2015, only one gate existed for both import and exports. Due to the high convergence of traffic at Gate 18, the access road is almost always fully congested with trailers, backing up to Changamwe Roundabout and the Makupa Causeway.
Figure 4.9.5 shows the conversion of container movements into heavy vehicle (HV) movements per day.
Source: KPA, Annual Review and Bulletin of Statistics, 2014 Figure 4.9.4: Container Movements in 2014,
Mombasa County
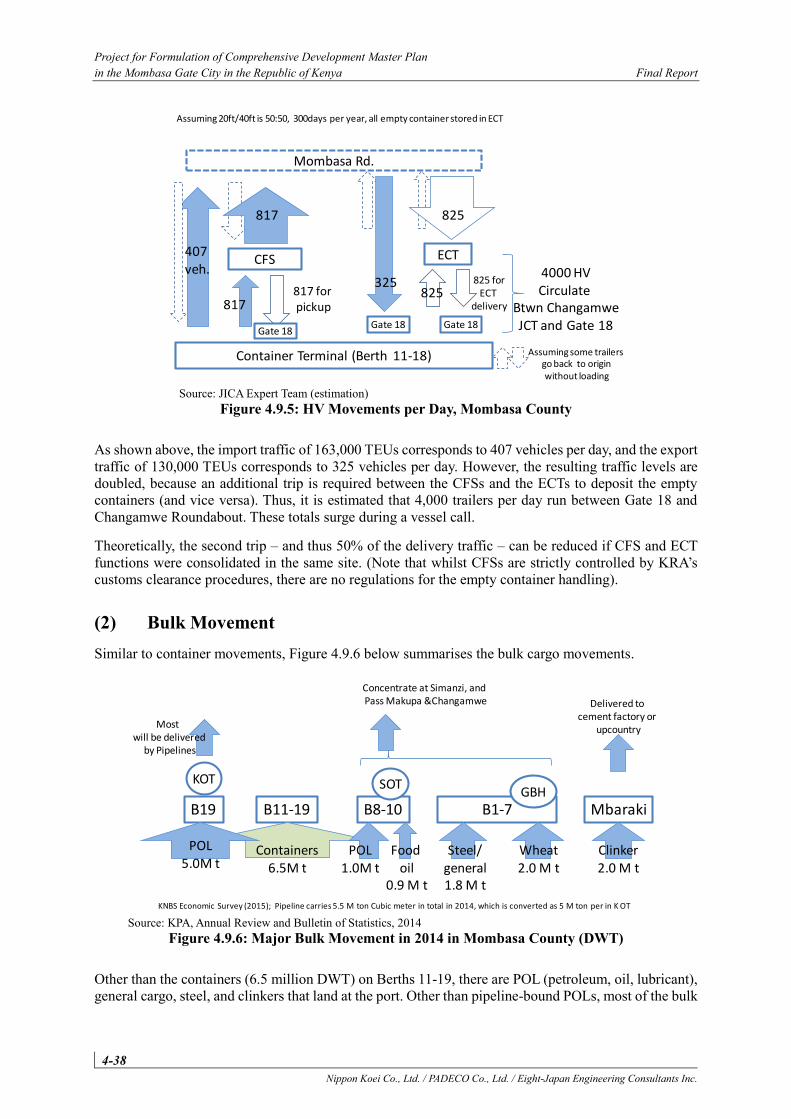
Project for Formulation of Comprehensive Development Master Plan in the Mombasa Gate City in the Republic of Kenya Final Report
4-38 Nippon Koei Co., Ltd. / PADECO Co., Ltd. / Eight-Japan Engineering Consultants Inc.
Source: JICA Expert Team (estimation)
Figure 4.9.5: HV Movements per Day, Mombasa County
As shown above, the import traffic of 163,000 TEUs corresponds to 407 vehicles per day, and the export traffic of 130,000 TEUs corresponds to 325 vehicles per day. However, the resulting traffic levels are doubled, because an additional trip is required between the CFSs and the ECTs to deposit the empty containers (and vice versa). Thus, it is estimated that 4,000 trailers per day run between Gate 18 and Changamwe Roundabout. These totals surge during a vessel call.
Theoretically, the second trip – and thus 50% of the delivery traffic – can be reduced if CFS and ECT functions were consolidated in the same site. (Note that whilst CFSs are strictly controlled by KRA’s customs clearance procedures, there are no regulations for the empty container handling).
(2) Bulk Movement Similar to container movements, Figure 4.9.6 below summarises the bulk cargo movements.
Source: KPA, Annual Review and Bulletin of Statistics, 2014
Figure 4.9.6: Major Bulk Movement in 2014 in Mombasa County (DWT)
Other than the containers (6.5 million DWT) on Berths 11-19, there are POL (petroleum, oil, lubricant), general cargo, steel, and clinkers that land at the port. Other than pipeline-bound POLs, most of the bulk
Container Terminal (Berth 11-18)
CFS407 veh.
Mombasa Rd.
817 825
ECT
325 825 forECT
delivery
Convert to HV Movement Per dayAssuming 20ft/40ft is 50:50, 300days per year, all empty container stored in ECT
817 for pickup817
825
4000 HVCirculate
Btwn ChangamweJCT and Gate 18Gate 18
Gate 18 Gate 18
Assuming some trailers go back to originwithout loading
B11-19 B1-7B8-10
SOT
B19
KOT
MbarakiGBH
Major Dry bulk/General Cargo in 2014 (DWT)
POL5.0M t
POL1.0M t
Food oil
0.9 M t
Steel/general1.8 M t
Wheat2.0 M t
Clinker2.0 M t
Most will be delivered
by Pipelines
Concentrate at Simanzi, and Pass Makupa &Changamwe Delivered to
cement factory or upcountry
Containers6.5M t
KNBS Economic Survey (2015); Pipeline carries 5.5 M ton Cubic meter in total in 2014, which is converted as 5 M ton per in K OT
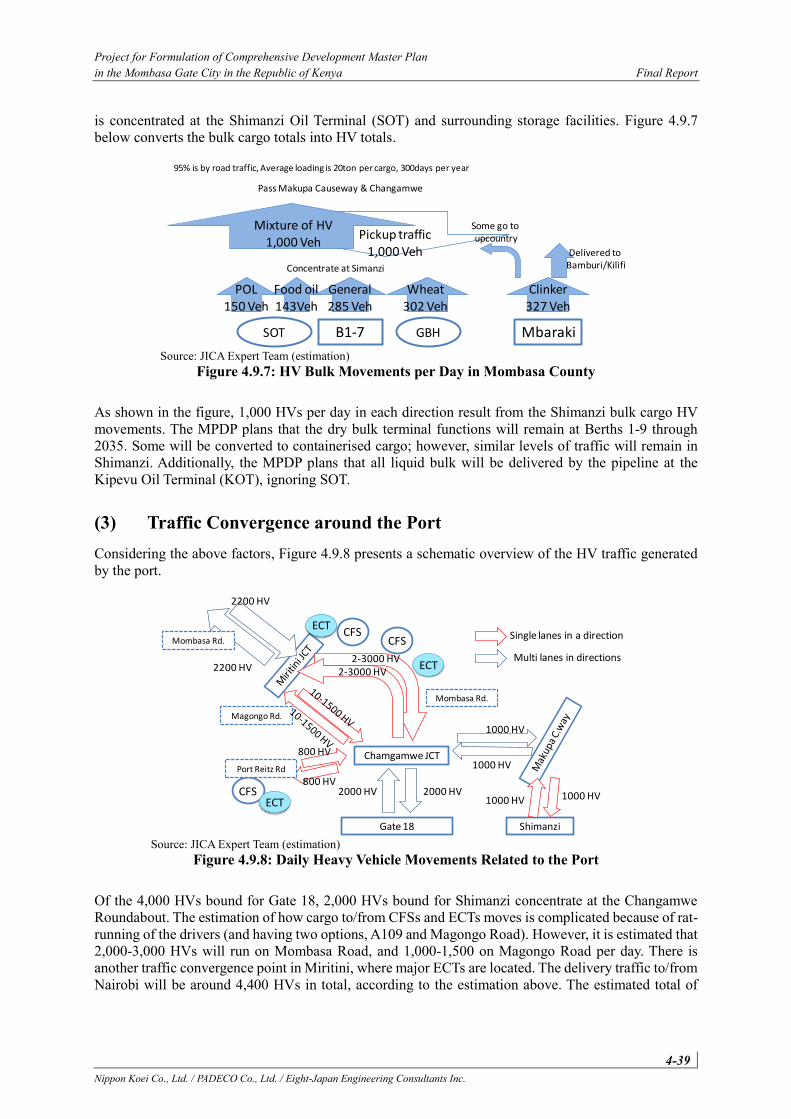
Project for Formulation of Comprehensive Development Master Plan in the Mombasa Gate City in the Republic of Kenya Final Report
4-39 Nippon Koei Co., Ltd. / PADECO Co., Ltd. / Eight-Japan Engineering Consultants Inc.
is concentrated at the Shimanzi Oil Terminal (SOT) and surrounding storage facilities. Figure 4.9.7 below converts the bulk cargo totals into HV totals.
Source: JICA Expert Team (estimation)
Figure 4.9.7: HV Bulk Movements per Day in Mombasa County
As shown in the figure, 1,000 HVs per day in each direction result from the Shimanzi bulk cargo HV movements. The MPDP plans that the dry bulk terminal functions will remain at Berths 1-9 through 2035. Some will be converted to containerised cargo; however, similar levels of traffic will remain in Shimanzi. Additionally, the MPDP plans that all liquid bulk will be delivered by the pipeline at the Kipevu Oil Terminal (KOT), ignoring SOT.
(3) Traffic Convergence around the Port Considering the above factors, Figure 4.9.8 presents a schematic overview of the HV traffic generated by the port.
Source: JICA Expert Team (estimation)
Figure 4.9.8: Daily Heavy Vehicle Movements Related to the Port
Of the 4,000 HVs bound for Gate 18, 2,000 HVs bound for Shimanzi concentrate at the Changamwe Roundabout. The estimation of how cargo to/from CFSs and ECTs moves is complicated because of rat-running of the drivers (and having two options, A109 and Magongo Road). However, it is estimated that 2,000-3,000 HVs will run on Mombasa Road, and 1,000-1,500 on Magongo Road per day. There is another traffic convergence point in Miritini, where major ECTs are located. The delivery traffic to/from Nairobi will be around 4,400 HVs in total, according to the estimation above. The estimated total of
B1-7SOT MbarakiGBH
Convert to HV Movement Per day
95% is by road traffic, Average loading is 20ton per cargo, 300days per year
POL150 Veh
Food oil143Veh
General285 Veh
Wheat302 Veh
Clinker327 Veh
Mixture of HV1,000 Veh
Pass Makupa Causeway & Changamwe
Concentrate at Simanzi
Some go to upcountryPickup traffic
1,000 Veh Delivered to Bamburi/Kilifi
Chamgamwe JCT
Gate 18
2000 HV2000 HVCFSECT
800 HV
800 HV
Port Reitz Rd
Magongo Rd.
CFS
ECT
Mombasa Rd.
Mombasa Rd.CFS
ECT
Shimanzi
1000 HV 1000 HV
1000 HV
1000 HV
2200 HV
2200 HV
2-3000 HV2-3000 HV
Single lanes in a direction
Multi lanes in directions
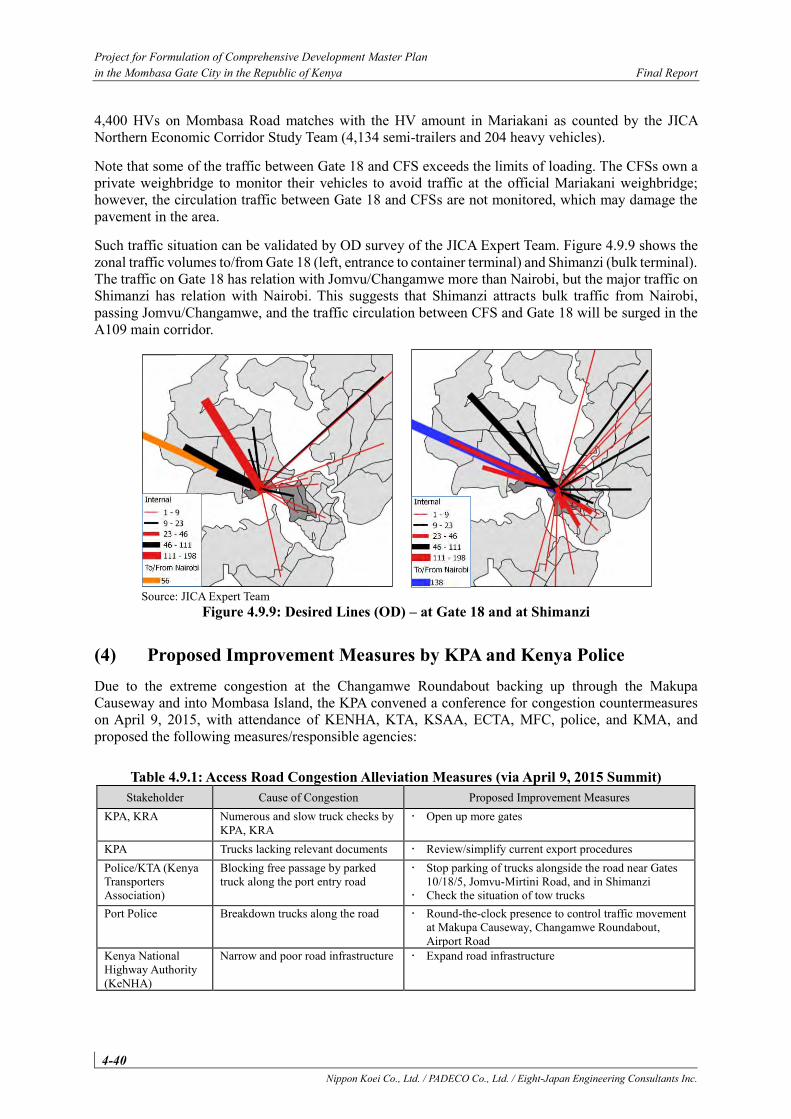
Project for Formulation of Comprehensive Development Master Plan in the Mombasa Gate City in the Republic of Kenya Final Report
4-40 Nippon Koei Co., Ltd. / PADECO Co., Ltd. / Eight-Japan Engineering Consultants Inc.
4,400 HVs on Mombasa Road matches with the HV amount in Mariakani as counted by the JICA Northern Economic Corridor Study Team (4,134 semi-trailers and 204 heavy vehicles).
Note that some of the traffic between Gate 18 and CFS exceeds the limits of loading. The CFSs own a private weighbridge to monitor their vehicles to avoid traffic at the official Mariakani weighbridge; however, the circulation traffic between Gate 18 and CFSs are not monitored, which may damage the pavement in the area.
Such traffic situation can be validated by OD survey of the JICA Expert Team. Figure 4.9.9 shows the zonal traffic volumes to/from Gate 18 (left, entrance to container terminal) and Shimanzi (bulk terminal). The traffic on Gate 18 has relation with Jomvu/Changamwe more than Nairobi, but the major traffic on Shimanzi has relation with Nairobi. This suggests that Shimanzi attracts bulk traffic from Nairobi, passing Jomvu/Changamwe, and the traffic circulation between CFS and Gate 18 will be surged in the A109 main corridor.
Source: JICA Expert Team
Figure 4.9.9: Desired Lines (OD) – at Gate 18 and at Shimanzi
(4) Proposed Improvement Measures by KPA and Kenya Police Due to the extreme congestion at the Changamwe Roundabout backing up through the Makupa Causeway and into Mombasa Island, the KPA convened a conference for congestion countermeasures on April 9, 2015, with attendance of KENHA, KTA, KSAA, ECTA, MFC, police, and KMA, and proposed the following measures/responsible agencies:
Table 4.9.1: Access Road Congestion Alleviation Measures (via April 9, 2015 Summit) Stakeholder Cause of Congestion Proposed Improvement Measures
KPA, KRA Numerous and slow truck checks by KPA, KRA
Open up more gates
KPA Trucks lacking relevant documents Review/simplify current export procedures Police/KTA (Kenya Transporters Association)
Blocking free passage by parked truck along the port entry road
Stop parking of trucks alongside the road near Gates 10/18/5, Jomvu-Mirtini Road, and in Shimanzi
Check the situation of tow trucks Port Police Breakdown trucks along the road Round-the-clock presence to control traffic movement
at Makupa Causeway, Changamwe Roundabout, Airport Road
Kenya National Highway Authority (KeNHA)
Narrow and poor road infrastructure Expand road infrastructure
Project for Formulation of Comprehensive Development Master Plan in the Mombasa Gate City in the Republic of Kenya Final Report
4-41 Nippon Koei Co., Ltd. / PADECO Co., Ltd. / Eight-Japan Engineering Consultants Inc.
Stakeholder Cause of Congestion Proposed Improvement Measures KPA, ECTs, Shipping agents
Overflow in empty container deport
KPA investigates the reason KPA temporarily allows empty container return
directly KPA increases capacity Online communication depot and shipping agent Allowing large lot empty vans for repatriation
Police Poor traffic management at hot spot Routing patrol at Changamwe Roundabout Others (KPA) Develop a holding ground at port for dropping export containers
(KPA) Online booking for trucks port entry (KPA, Shipping agents) Transshipment containers should be loaded directly to next vessel after stripping (Kenya Maritime Authority: KMA) Circulate minutes
Source: KMA
The proposed measures were a combination of physical improvements and institutional changes. At present, there are no information and implementation budget for the specific programmes envisioned. Various road widening/construction projects, port expansion, and SGR development have been explained earlier in this chapter (Sections 4.3 and 4.4).
4.9.4 Other Major Transport Infrastructure Other than port, there are three additional major transport infrastructures related to freight transport, i.e.: pipelines, railways, and airport.
(1) Pipeline Transport Table 4.9.2 below presents the pipeline throughput of white petroleum products from 2010 to 2014. Total pipeline throughput continued on an upward trend. In 2014, throughput of white petroleum products expanded by 7.7% from 5.2 million cubic meters in 2013 to 5.6 million cubic meters. Exports of petroleum products posted a slow growth of 1.7% in 2014 compared to the growth of 7.2% recorded in 2013. Motor spirits (premium) and jet fuel exports rose by 5.4% and 34.9%, respectively, in 2014. Throughput of refined petroleum products for domestic consumption increased by 353,100 tons in 2014, reflecting an increase of 11.0%.
Table 4.9.2: Pipeline Throughput of White Petroleum Products (2010-2014) (1,000 m3)
2010 2011 2012 2013 2014 (est) Exports Motor Spirits
(Premium) 387.4 429 626.3 688.6 726.0
Kerosene Illuminating Oil 99.0 84.7 89.3 86.1 75.8
Light Diesel Oil 505.8 516.8 899.4 979.1 916.1 Jet Fuel 161.0 142.3 206.4 198.3 267.6 Subtotal 1,153.2 1,172.8 1,821.4 1,952.1 1,985.5
Domestic Consumption
Motor Spirits (Premium) 689.9 782.6 785.9 897.5 1,028.8
Motor Spirits (Regular) 69.7 43.3 14.2 1.3 n/a Kerosene Illuminating Oil 264.8 250.5 304.8 353.8 362.9
Light Diesel Oil 1,252.9 1,129.8 1,079.0 1,174.0 1,314.2 Jet Fuel 773.2 878.4 850.3 792.7 866.5 Subtotal 3,050.5 3,084.6 3,034.2 3,219.3 3,572.4 Total 4,203.7 4,257.4 4,855.6 5,171.4 5,557.9
Source: Kenya National Bureau of Statistics, 2015 Economic Survey
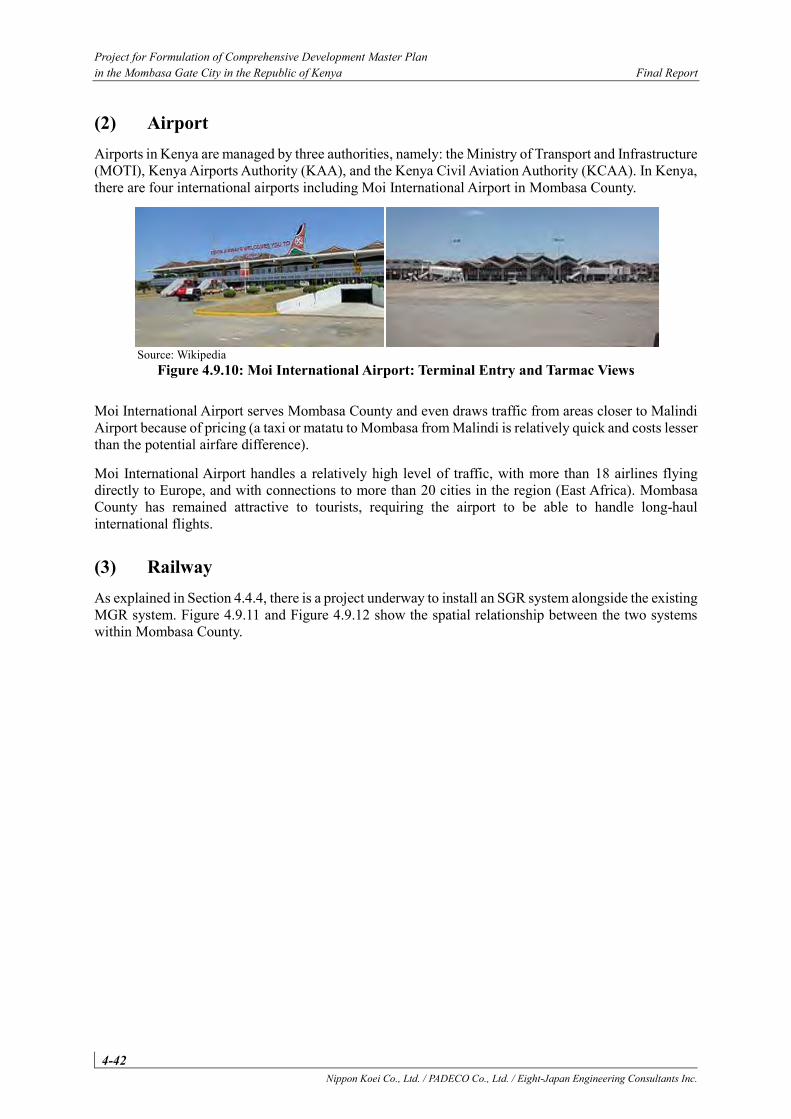
Project for Formulation of Comprehensive Development Master Plan in the Mombasa Gate City in the Republic of Kenya Final Report
4-42 Nippon Koei Co., Ltd. / PADECO Co., Ltd. / Eight-Japan Engineering Consultants Inc.
(2) Airport Airports in Kenya are managed by three authorities, namely: the Ministry of Transport and Infrastructure (MOTI), Kenya Airports Authority (KAA), and the Kenya Civil Aviation Authority (KCAA). In Kenya, there are four international airports including Moi International Airport in Mombasa County.
Source: Wikipedia
Figure 4.9.10: Moi International Airport: Terminal Entry and Tarmac Views
Moi International Airport serves Mombasa County and even draws traffic from areas closer to Malindi Airport because of pricing (a taxi or matatu to Mombasa from Malindi is relatively quick and costs lesser than the potential airfare difference).
Moi International Airport handles a relatively high level of traffic, with more than 18 airlines flying directly to Europe, and with connections to more than 20 cities in the region (East Africa). Mombasa County has remained attractive to tourists, requiring the airport to be able to handle long-haul international flights.
(3) Railway As explained in Section 4.4.4, there is a project underway to install an SGR system alongside the existing MGR system. Figure 4.9.11 and Figure 4.9.12 show the spatial relationship between the two systems within Mombasa County.
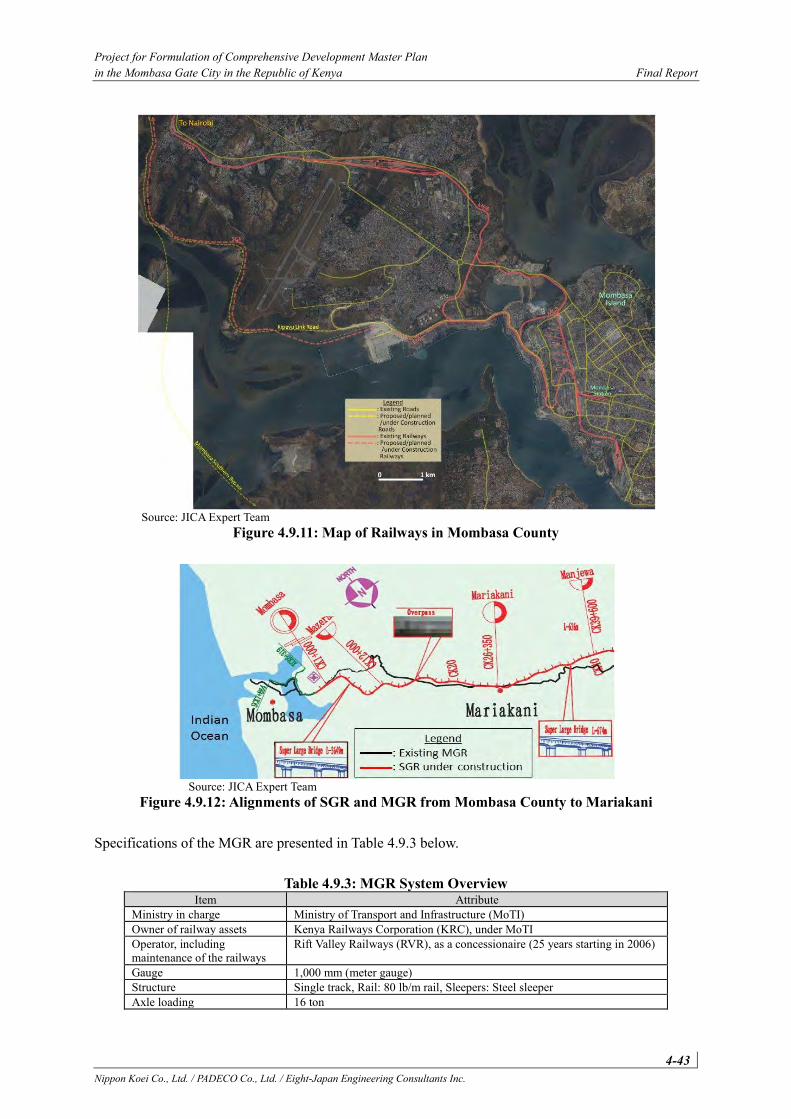
Project for Formulation of Comprehensive Development Master Plan in the Mombasa Gate City in the Republic of Kenya Final Report
4-43 Nippon Koei Co., Ltd. / PADECO Co., Ltd. / Eight-Japan Engineering Consultants Inc.
Source: JICA Expert Team
Figure 4.9.11: Map of Railways in Mombasa County
Source: JICA Expert Team
Figure 4.9.12: Alignments of SGR and MGR from Mombasa County to Mariakani
Specifications of the MGR are presented in Table 4.9.3 below.
Table 4.9.3: MGR System Overview Item Attribute
Ministry in charge Ministry of Transport and Infrastructure (MoTI) Owner of railway assets Kenya Railways Corporation (KRC), under MoTI Operator, including maintenance of the railways
Rift Valley Railways (RVR), as a concessionaire (25 years starting in 2006)
Gauge 1,000 mm (meter gauge) Structure Single track, Rail: 80 lb/m rail, Sleepers: Steel sleeper Axle loading 16 ton
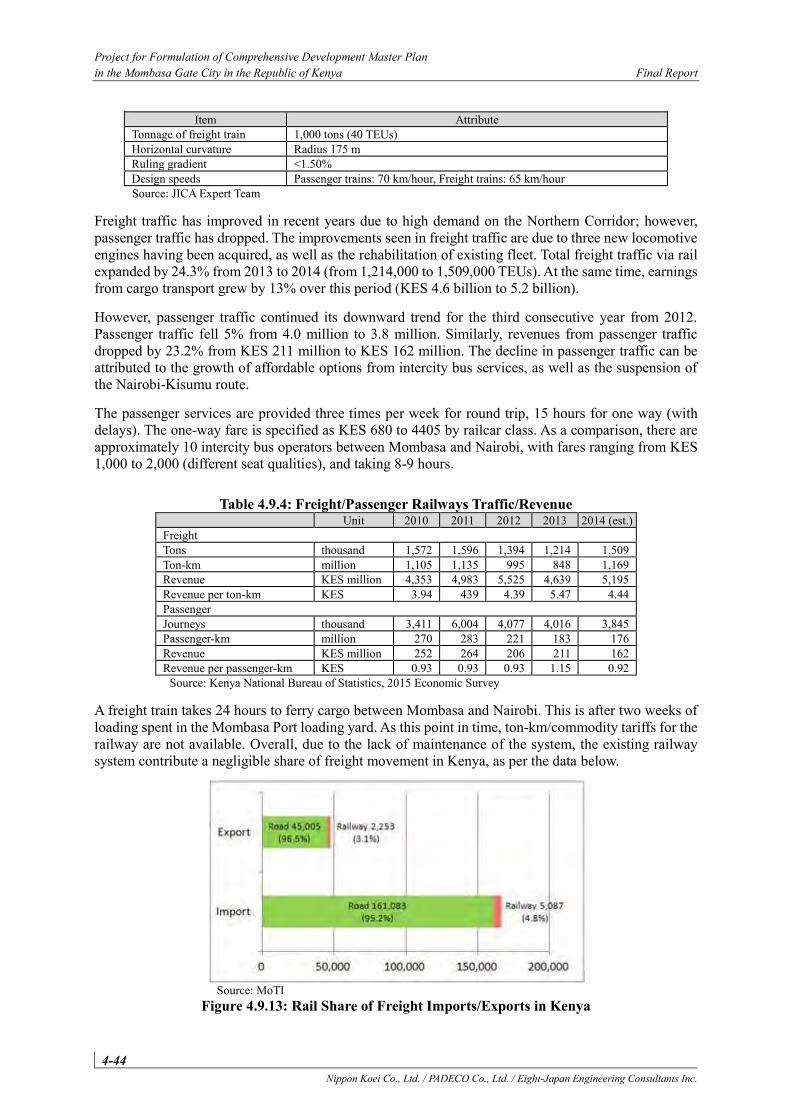
Project for Formulation of Comprehensive Development Master Plan in the Mombasa Gate City in the Republic of Kenya Final Report
4-44 Nippon Koei Co., Ltd. / PADECO Co., Ltd. / Eight-Japan Engineering Consultants Inc.
Item Attribute Tonnage of freight train 1,000 tons (40 TEUs) Horizontal curvature Radius 175 m Ruling gradient <1.50% Design speeds Passenger trains: 70 km/hour, Freight trains: 65 km/hour Source: JICA Expert Team
Freight traffic has improved in recent years due to high demand on the Northern Corridor; however, passenger traffic has dropped. The improvements seen in freight traffic are due to three new locomotive engines having been acquired, as well as the rehabilitation of existing fleet. Total freight traffic via rail expanded by 24.3% from 2013 to 2014 (from 1,214,000 to 1,509,000 TEUs). At the same time, earnings from cargo transport grew by 13% over this period (KES 4.6 billion to 5.2 billion).
However, passenger traffic continued its downward trend for the third consecutive year from 2012. Passenger traffic fell 5% from 4.0 million to 3.8 million. Similarly, revenues from passenger traffic dropped by 23.2% from KES 211 million to KES 162 million. The decline in passenger traffic can be attributed to the growth of affordable options from intercity bus services, as well as the suspension of the Nairobi-Kisumu route.
The passenger services are provided three times per week for round trip, 15 hours for one way (with delays). The one-way fare is specified as KES 680 to 4405 by railcar class. As a comparison, there are approximately 10 intercity bus operators between Mombasa and Nairobi, with fares ranging from KES 1,000 to 2,000 (different seat qualities), and taking 8-9 hours.
Table 4.9.4: Freight/Passenger Railways Traffic/Revenue Unit 2010 2011 2012 2013 2014 (est.)
Freight Tons thousand 1,572 1,596 1,394 1,214 1,509 Ton-km million 1,105 1,135 995 848 1,169 Revenue KES million 4,353 4,983 5,525 4,639 5,195 Revenue per ton-km KES 3.94 439 4.39 5.47 4.44 Passenger Journeys thousand 3,411 6,004 4,077 4,016 3,845 Passenger-km million 270 283 221 183 176 Revenue KES million 252 264 206 211 162 Revenue per passenger-km KES 0.93 0.93 0.93 1.15 0.92
Source: Kenya National Bureau of Statistics, 2015 Economic Survey
A freight train takes 24 hours to ferry cargo between Mombasa and Nairobi. This is after two weeks of loading spent in the Mombasa Port loading yard. As this point in time, ton-km/commodity tariffs for the railway are not available. Overall, due to the lack of maintenance of the system, the existing railway system contribute a negligible share of freight movement in Kenya, as per the data below.
Source: MoTI
Figure 4.9.13: Rail Share of Freight Imports/Exports in Kenya
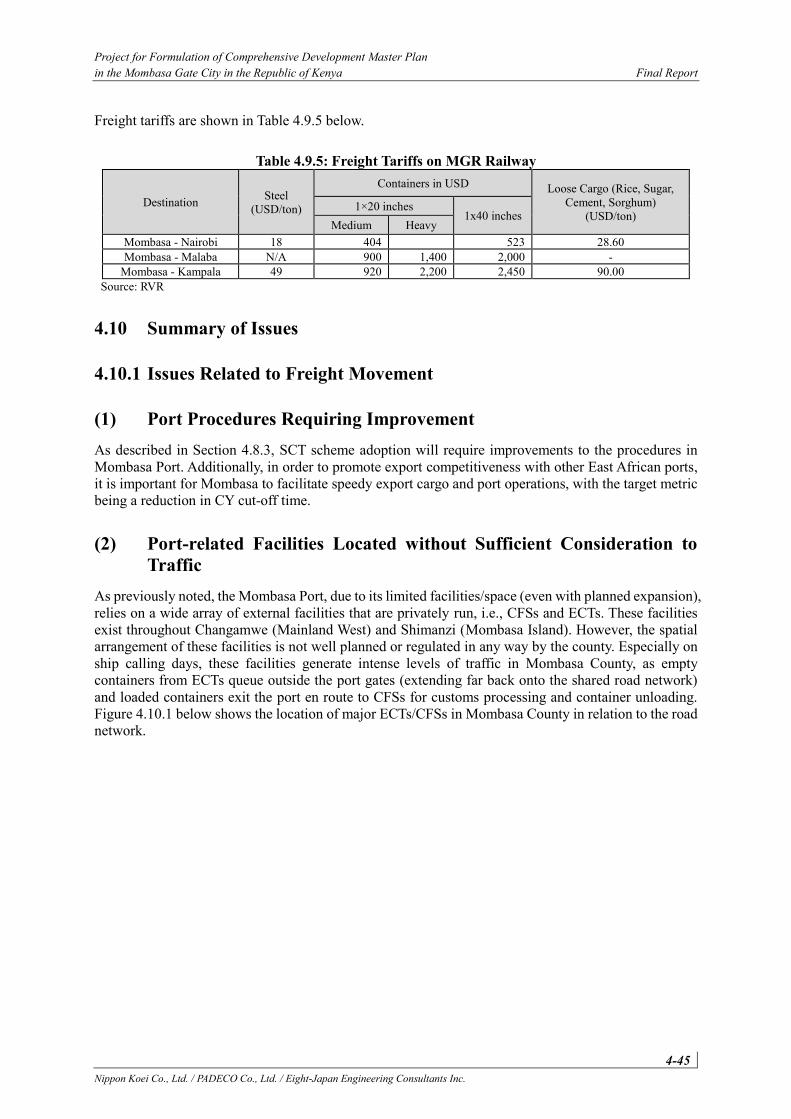
Project for Formulation of Comprehensive Development Master Plan in the Mombasa Gate City in the Republic of Kenya Final Report
4-45 Nippon Koei Co., Ltd. / PADECO Co., Ltd. / Eight-Japan Engineering Consultants Inc.
Freight tariffs are shown in Table 4.9.5 below.
Table 4.9.5: Freight Tariffs on MGR Railway
Destination Steel (USD/ton)
Containers in USD Loose Cargo (Rice, Sugar, Cement, Sorghum)
(USD/ton) 1×20 inches
1x40 inches Medium Heavy
Mombasa - Nairobi 18 404 523 28.60 Mombasa - Malaba N/A 900 1,400 2,000 -
Mombasa - Kampala 49 920 2,200 2,450 90.00 Source: RVR
4.10 Summary of Issues
4.10.1 Issues Related to Freight Movement
(1) Port Procedures Requiring Improvement As described in Section 4.8.3, SCT scheme adoption will require improvements to the procedures in Mombasa Port. Additionally, in order to promote export competitiveness with other East African ports, it is important for Mombasa to facilitate speedy export cargo and port operations, with the target metric being a reduction in CY cut-off time.
(2) Port-related Facilities Located without Sufficient Consideration to Traffic
As previously noted, the Mombasa Port, due to its limited facilities/space (even with planned expansion), relies on a wide array of external facilities that are privately run, i.e., CFSs and ECTs. These facilities exist throughout Changamwe (Mainland West) and Shimanzi (Mombasa Island). However, the spatial arrangement of these facilities is not well planned or regulated in any way by the county. Especially on ship calling days, these facilities generate intense levels of traffic in Mombasa County, as empty containers from ECTs queue outside the port gates (extending far back onto the shared road network) and loaded containers exit the port en route to CFSs for customs processing and container unloading. Figure 4.10.1 below shows the location of major ECTs/CFSs in Mombasa County in relation to the road network.
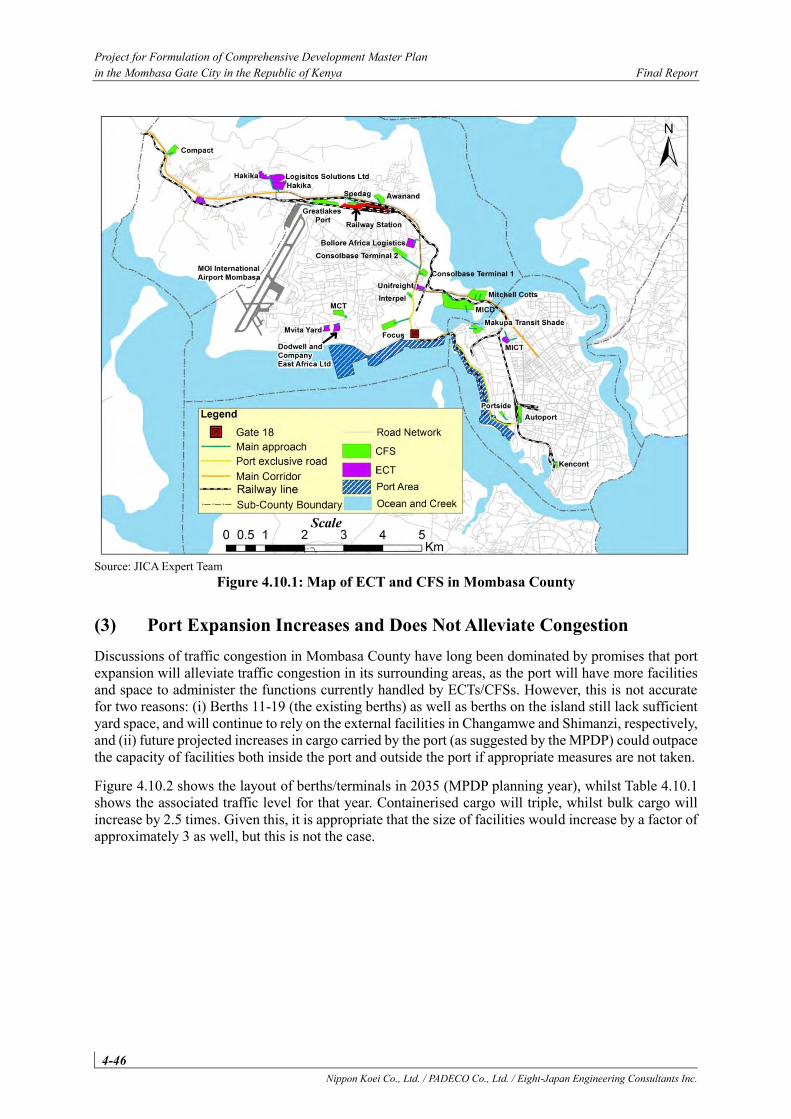
Project for Formulation of Comprehensive Development Master Plan in the Mombasa Gate City in the Republic of Kenya Final Report
4-46 Nippon Koei Co., Ltd. / PADECO Co., Ltd. / Eight-Japan Engineering Consultants Inc.
Source: JICA Expert Team
Figure 4.10.1: Map of ECT and CFS in Mombasa County
(3) Port Expansion Increases and Does Not Alleviate Congestion Discussions of traffic congestion in Mombasa County have long been dominated by promises that port expansion will alleviate traffic congestion in its surrounding areas, as the port will have more facilities and space to administer the functions currently handled by ECTs/CFSs. However, this is not accurate for two reasons: (i) Berths 11-19 (the existing berths) as well as berths on the island still lack sufficient yard space, and will continue to rely on the external facilities in Changamwe and Shimanzi, respectively, and (ii) future projected increases in cargo carried by the port (as suggested by the MPDP) could outpace the capacity of facilities both inside the port and outside the port if appropriate measures are not taken.
Figure 4.10.2 shows the layout of berths/terminals in 2035 (MPDP planning year), whilst Table 4.10.1 shows the associated traffic level for that year. Containerised cargo will triple, whilst bulk cargo will increase by 2.5 times. Given this, it is appropriate that the size of facilities would increase by a factor of approximately 3 as well, but this is not the case.
Project for Formulation of Comprehensive Development Master Plan in the Mombasa Gate City in the Republic of Kenya Final Report
4-47 Nippon Koei Co., Ltd. / PADECO Co., Ltd. / Eight-Japan Engineering Consultants Inc.
Source: JICA Expert Team for Mombasa Port Master Plan
Figure 4.10.2: Mombasa Port Area (as Planned, 2035)
Table 4.10.1: TEU Increases at Mombasa Port (as per Port Master Plan) 2015 2020 2025 2030 2035
Container TEU 1.04 M 1.562 M 2.412 M 3.131 M 3.789 M Bulk and General Cargo Import handled in Shimanzi and Kilindini*
18.20 M 24.0 M 26.1 M 44.9 M 54.0 M
All Bulk Export handled in Shimanzi and Kilindini 2.70 M 3.3 M 3.9 M 4.7 M 5.3 M Population in Mombasa County 1.15 M 1.37 M 1.63 M 1.94 M 2.30 M
* Note: Accounting for all dry bulk, general cargo, and 10% of POL and other liquid bulk. Some of this is to be handled in the new Dongo Kundu Port Bulk Terminal after 2030.
Source: Mombasa Port Master Plan, Final Report, 2015
(4) Uncertainty in Standard Gauge Rail Operational Plan and Traffic Capture Ability
SGR is designed as a single track system, which requires complex timetable coordination in train operations. This problem is compounded by the fact that both freight and passenger trains will run on the same alignment, further complicating scheduling. At present, it does not seem as if such coordination and scheduling efforts are receiving proper consideration by the relevant authorities (KPA, for coordinating ship callings and unloading, and KRC, for train operations).
Additionally, SGR will only service Berths 20-22 (when constructed), and does not connect to the containerised or break bulk cargo at Berths 11-19, which will continue to operate. Furthermore, whilst the plan for SGR is to capture 50% of freight bound for Nairobi, in reality, it is very difficult to achieve such a modal split target – operators tend to prefer trucking for its flexibility and competitive pricing (especially when fuel costs are low). Without regulations or mandates explicitly requiring this, it is improbable that such targets will be met.
Project for Formulation of Comprehensive Development Master Plan in the Mombasa Gate City in the Republic of Kenya Final Report
4-48 Nippon Koei Co., Ltd. / PADECO Co., Ltd. / Eight-Japan Engineering Consultants Inc.
(5) Kipevu Link Only Partially Captures Port Traffic Just as port expansion has often been promoted as “the solution” to freight movement-related traffic issues in Mombasa County, the Kipevu Link is similarly promoted as such. The Kipevu Link will indeed absorb trailer traffic directly from Gate 18, as well as transit cargo from Changamwe to the port. However, the freight handled at Gates 14-19 will continue to CFSs in Jomvu without taking the Kipevu Link. Most port traffic (close to 95%) goes toward Nairobi. The link should be extended further upcountry as a longer bypass road, because at present, it only ends at A109 (Nairobi Road) at Miritini, which is already severely congested.
(6) Lack of Coordinating Body for Port Traffic At present, there is no single entity required to answer for port-related traffic congestion in Mombasa County. KPA is mostly focused on its internal operations and not on the congestion outside the port. KRA is focused on customs clearance and taxation, which occurs eventually regardless of whether there is traffic congestion. KeNHA is mostly focused on road widening projects, hoping to alleviate the problems that are caused by issues out of its control. And the CGM, which must consider the traffic, environmental impacts, and employment considerations of all the port’s internal and external operations, is unable to coordinate such national institutions. (Recently, KPA has been working with the police on traffic alleviation in Changamwe, but this has been done without coordination with the county).
4.10.2 Issues Related to Passenger Movement When discussing passenger movement in Mombasa County, it is important to remember the modal split of passenger trips (refer to Chapter 10), namely: walking (45%), matatu (34%), bodaboda (11%), tuktuk (4%), private car (3%), and others (3%). Passenger movements in Mombasa County are characterised by this high share of walking and matatu trips. Furthermore, walking trips are not all necessarily short distance (although many are), but can be of all lengths, because of the high relative cost of matatu (public transport) services. Considering this, major issues related to passenger movement in Mombasa County are:
Low quality/high cost of public transport (matatus); Matatu operators lack the capacity to coordinate/merge; Insufficient passenger facilities; unsafe boarding/alighting; and Lack of facilities and regulations for tuktuks.
These issues are elaborated in the following sections.
(1) Low Quality/High Cost of Public Transport (Matatus) Despite the poor conditions of the vehicles themselves and the associated ride experience, matatu fares are rather high compared to other international examples – not just in the developing world, but even in the developing world. A ride from the Likoni Ferry to Mtwapa (20 km) can cost KES 100.
(2) Matatu Operators Lack the Capacity to Coordinate/Merge Matatu operators, at present, lack the capacity (or desire) to coordinate and improve the quality of their services. Certain Savings and Credit Cooperatives (SACCOs) dominate in Mombasa County (GENO, M.O.M., Mtwapa), but whilst they are large organisations, there is little to no coordination down to the level of the vehicles. Each vehicle is individually owned and the profit for that vehicle goes to the owner, with only a portion paid to the SACCO. There is little financial incentive for matatu operators to pool their resources and attempt to provide a higher quality transport service, and even if financial incentives
Project for Formulation of Comprehensive Development Master Plan in the Mombasa Gate City in the Republic of Kenya Final Report
4-49 Nippon Koei Co., Ltd. / PADECO Co., Ltd. / Eight-Japan Engineering Consultants Inc.
were imposed (through new government regulations), they lack the internal capacity to manage such a system without a capacity building programme.
(3) Insufficient Passenger Facilities; Unsafe Boarding/Alighting With the exception of staging grounds in Buxton, which is currently losing some of its land to private development, there are no proper queuing grounds for matatus, let alone proper stations or terminals. Especially in a city with a strong tourism industry, it is important to have a clear and navigable public transport system accessible to a wider population, with clearly marked signage, routes, and pedestrian facilities. In addition to the problems of clarity, passengers board and alight at almost any location on the road, creating dangerous conditions for them and other vehicle operators.
(4) Lack of Facilities and Regulations for Tuktuks At present in Mombasa County, there are about 6,000 registered tuktuks, about 4,000-4,500 of which are on the road (all registrations completed and cleared as roadworthy, etc.). Aside from the Likoni Ferry (on the Mombasa Island side), there are few proper queuing areas for tuktuks. In front of the General Post Office (in the CBD), there is a major unofficial queuing area. Informally, certain off-road patches become parking areas for tuktuks, such as outside of supermarkets and shopping areas. The lack of proper off-road queuing areas for tuktuks, and the general lack of regulation for their operating behavior (breaking traffic rules) further compound traffic congestion in the areas of Mombasa County where they congregate.

Project for Formulation of Comprehensive Development Master Plan in the Mombasa Gate City in the Republic of Kenya Final Report
5-1 Nippon Koei Co., Ltd. / PADECO Co., Ltd. / Eight-Japan Engineering Consultants Inc.
5. Urban Infrastructure and Facilities
5.1 Water Supply
5.1.1 Overview Mombasa County is classified as a chronically water-scarce county. To overcome this water stress situation, the National Water Master Plan 2030 (NWMP 2030) was formulated in 2013. A feasibility study of the Water Supply Master Plan for Mombasa and Other Towns within Coast Province as Water and Sanitation Service Improvement Project (WaSSIP) was provided. Based on the master plan, expanding the capacity through the development of new water resources is needed to cover the water demand in the future.
5.1.2 Review of Policy, Legal Framework, and Administrative Structure
(1) Policy and Legal Framework After the enactment of the Water Act 2002, the Government of Kenya (GoK) has been implementing water sector reforms. In the water resources management subsector, the Water Resources Management Authority was established in 2003 as the lead agency for national water resources management. The water resources management system was changed from administrative basis to catchment basis. The Kenya Vision 2030 was prepared in 2007 and the country's new development blueprint was presented. The national development targets on the water sector in the Vision 2030 are as follows:
Water and sanitation - to ensure that improved water and sanitation are available and accessible to all by 2030,
Agriculture - to increase the area under irrigation to 1.2 million ha by 2030 for the increase of agricultural production,
Environment - to be a nation that has a clean, secure, and sustainable environment by 2030, and Energy - to generate more energy and increase efficiency in energy sector.
(2) Administrative Structure The existing representation of the institutional framework of the water sector under the Ministry of Water and Irrigation (MWI) is illustrated in Figure 5.1.1. The roles and responsibilities of MWI include the development of legislation, policy formulation, sector coordination and guidance, and monitoring and evaluation. Water Services Regulatory Board (WASREB), composed of the head office and the regional offices, is a regulatory body for the planning, regulation, and management of water supply and sewerage to policy formulation at the national and regional levels. Water Services Boards (WSBs) are under the jurisdiction of MWI. The subregional offices of the Water Services Providers (WSPs) provide water supply and sewerage management services at subregional level under the regional offices of WSBs.
The Coast Water Services Board (CWSB) is a parastatal under MWI responsible for the provision of water and sewerage services in the coastal region. It is one of the eight WSBs in Kenya, formed during
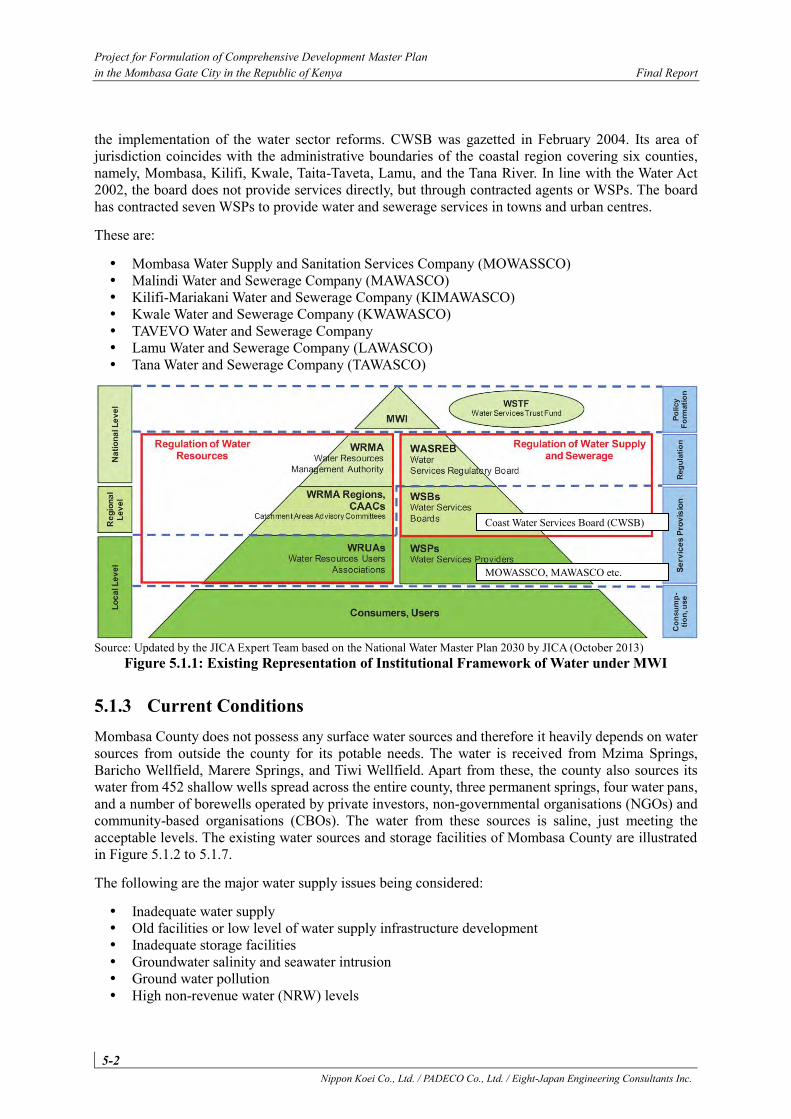
Project for Formulation of Comprehensive Development Master Plan in the Mombasa Gate City in the Republic of Kenya Final Report
5-2 Nippon Koei Co., Ltd. / PADECO Co., Ltd. / Eight-Japan Engineering Consultants Inc.
the implementation of the water sector reforms. CWSB was gazetted in February 2004. Its area of jurisdiction coincides with the administrative boundaries of the coastal region covering six counties, namely, Mombasa, Kilifi, Kwale, Taita-Taveta, Lamu, and the Tana River. In line with the Water Act 2002, the board does not provide services directly, but through contracted agents or WSPs. The board has contracted seven WSPs to provide water and sewerage services in towns and urban centres.
These are:
Mombasa Water Supply and Sanitation Services Company (MOWASSCO) Malindi Water and Sewerage Company (MAWASCO) Kilifi-Mariakani Water and Sewerage Company (KIMAWASCO) Kwale Water and Sewerage Company (KWAWASCO) TAVEVO Water and Sewerage Company Lamu Water and Sewerage Company (LAWASCO) Tana Water and Sewerage Company (TAWASCO)
Source: Updated by the JICA Expert Team based on the National Water Master Plan 2030 by JICA (October 2013)
Figure 5.1.1: Existing Representation of Institutional Framework of Water under MWI
5.1.3 Current Conditions Mombasa County does not possess any surface water sources and therefore it heavily depends on water sources from outside the county for its potable needs. The water is received from Mzima Springs, Baricho Wellfield, Marere Springs, and Tiwi Wellfield. Apart from these, the county also sources its water from 452 shallow wells spread across the entire county, three permanent springs, four water pans, and a number of borewells operated by private investors, non-governmental organisations (NGOs) and community-based organisations (CBOs). The water from these sources is saline, just meeting the acceptable levels. The existing water sources and storage facilities of Mombasa County are illustrated in Figure 5.1.2 to 5.1.7.
The following are the major water supply issues being considered:
Inadequate water supply Old facilities or low level of water supply infrastructure development Inadequate storage facilities Groundwater salinity and seawater intrusion Ground water pollution High non-revenue water (NRW) levels
Coast Water Services Board (CWSB)
MOWASSCO, MAWASCO etc.
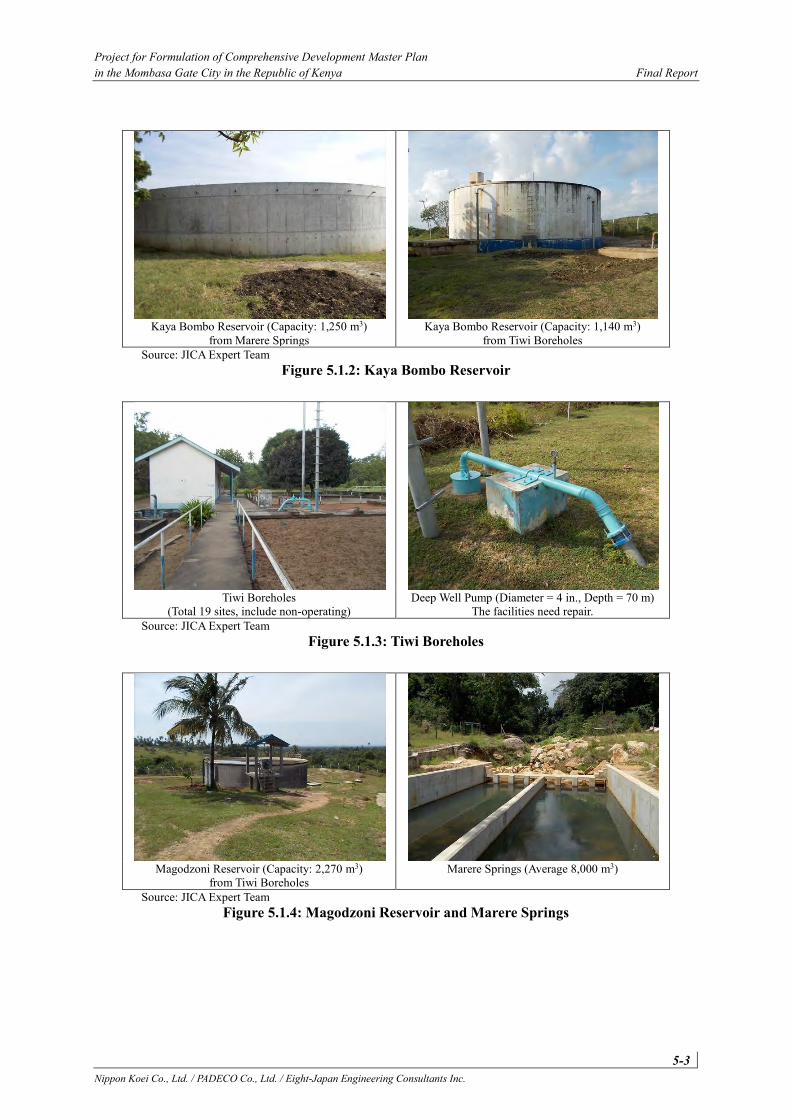
Project for Formulation of Comprehensive Development Master Plan in the Mombasa Gate City in the Republic of Kenya Final Report
5-3 Nippon Koei Co., Ltd. / PADECO Co., Ltd. / Eight-Japan Engineering Consultants Inc.
Kaya Bombo Reservoir (Capacity: 1,250 m3)
from Marere Springs Kaya Bombo Reservoir (Capacity: 1,140 m3)
from Tiwi Boreholes Source: JICA Expert Team
Figure 5.1.2: Kaya Bombo Reservoir
Tiwi Boreholes
(Total 19 sites, include non-operating) Deep Well Pump (Diameter = 4 in., Depth = 70 m)
The facilities need repair. Source: JICA Expert Team
Figure 5.1.3: Tiwi Boreholes
Magodzoni Reservoir (Capacity: 2,270 m3)
from Tiwi Boreholes Marere Springs (Average 8,000 m3)
Source: JICA Expert Team Figure 5.1.4: Magodzoni Reservoir and Marere Springs
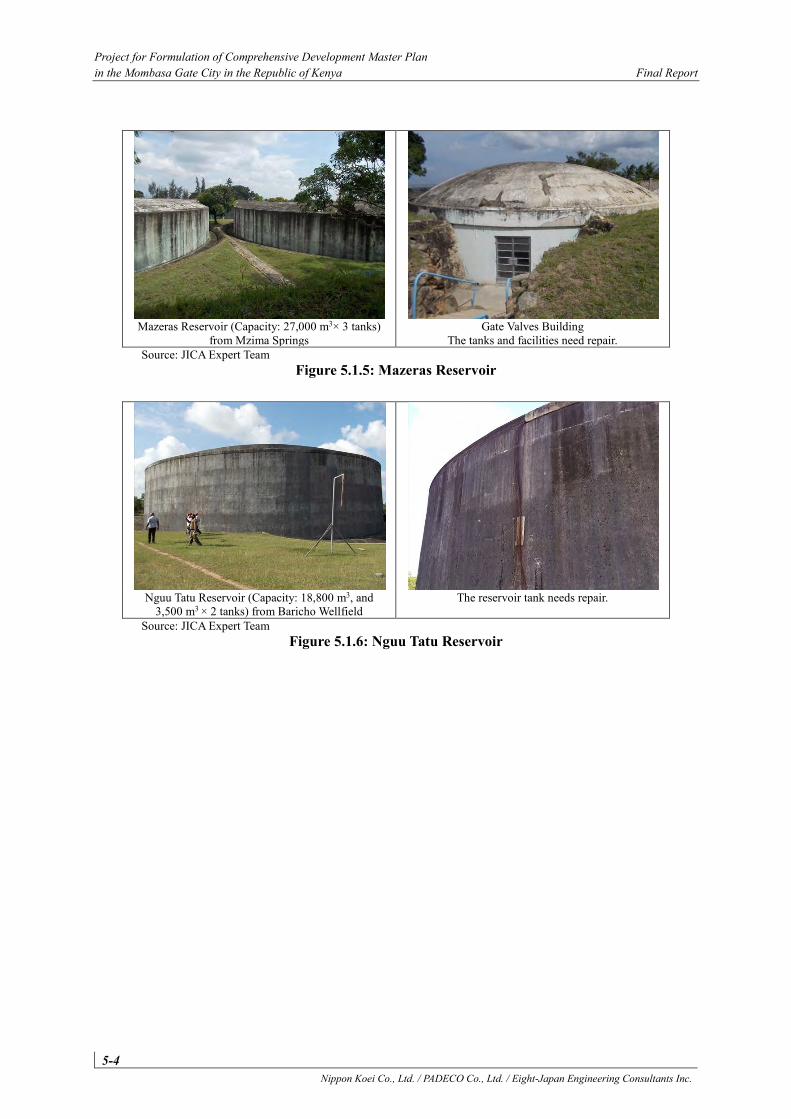
Project for Formulation of Comprehensive Development Master Plan in the Mombasa Gate City in the Republic of Kenya Final Report
5-4 Nippon Koei Co., Ltd. / PADECO Co., Ltd. / Eight-Japan Engineering Consultants Inc.
Mazeras Reservoir (Capacity: 27,000 m3× 3 tanks)
from Mzima Springs Gate Valves Building
The tanks and facilities need repair. Source: JICA Expert Team
Figure 5.1.5: Mazeras Reservoir
Nguu Tatu Reservoir (Capacity: 18,800 m3, and
3,500 m3 × 2 tanks) from Baricho Wellfield The reservoir tank needs repair.
Source: JICA Expert Team Figure 5.1.6: Nguu Tatu Reservoir
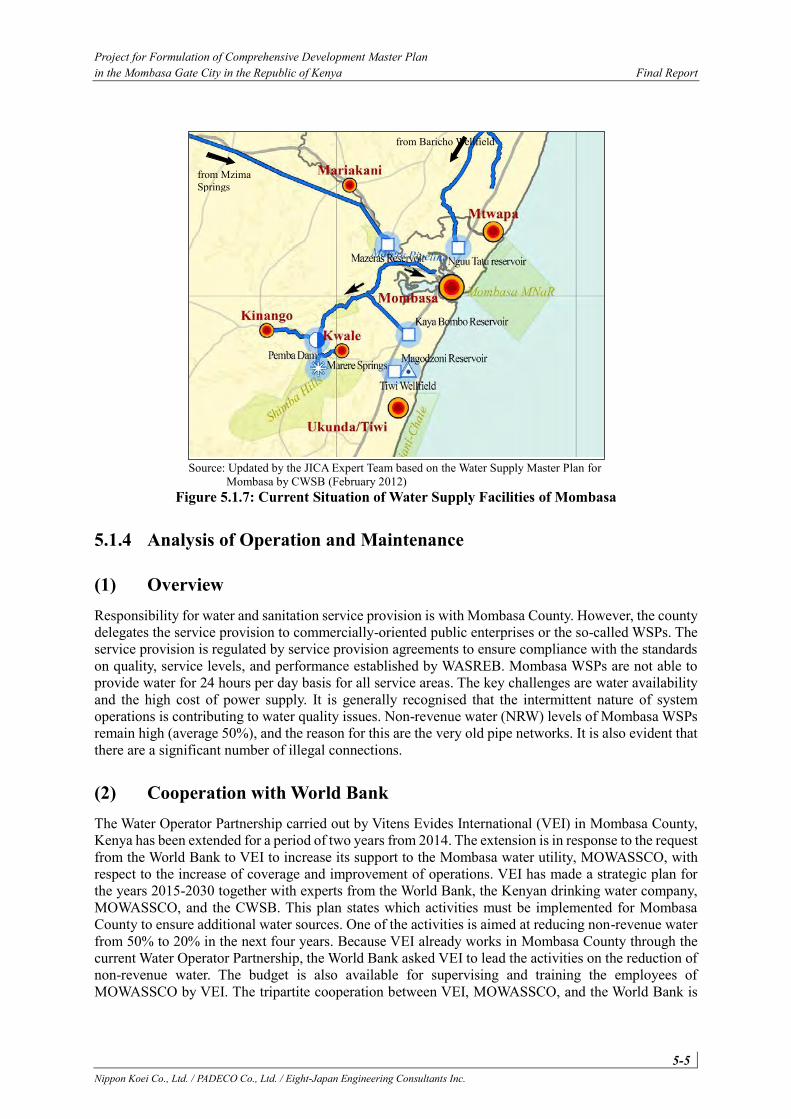
Project for Formulation of Comprehensive Development Master Plan in the Mombasa Gate City in the Republic of Kenya Final Report
5-5 Nippon Koei Co., Ltd. / PADECO Co., Ltd. / Eight-Japan Engineering Consultants Inc.
Source: Updated by the JICA Expert Team based on the Water Supply Master Plan for
Mombasa by CWSB (February 2012) Figure 5.1.7: Current Situation of Water Supply Facilities of Mombasa
5.1.4 Analysis of Operation and Maintenance
(1) Overview Responsibility for water and sanitation service provision is with Mombasa County. However, the county delegates the service provision to commercially-oriented public enterprises or the so-called WSPs. The service provision is regulated by service provision agreements to ensure compliance with the standards on quality, service levels, and performance established by WASREB. Mombasa WSPs are not able to provide water for 24 hours per day basis for all service areas. The key challenges are water availability and the high cost of power supply. It is generally recognised that the intermittent nature of system operations is contributing to water quality issues. Non-revenue water (NRW) levels of Mombasa WSPs remain high (average 50%), and the reason for this are the very old pipe networks. It is also evident that there are a significant number of illegal connections.
(2) Cooperation with World Bank The Water Operator Partnership carried out by Vitens Evides International (VEI) in Mombasa County, Kenya has been extended for a period of two years from 2014. The extension is in response to the request from the World Bank to VEI to increase its support to the Mombasa water utility, MOWASSCO, with respect to the increase of coverage and improvement of operations. VEI has made a strategic plan for the years 2015-2030 together with experts from the World Bank, the Kenyan drinking water company, MOWASSCO, and the CWSB. This plan states which activities must be implemented for Mombasa County to ensure additional water sources. One of the activities is aimed at reducing non-revenue water from 50% to 20% in the next four years. Because VEI already works in Mombasa County through the current Water Operator Partnership, the World Bank asked VEI to lead the activities on the reduction of non-revenue water. The budget is also available for supervising and training the employees of MOWASSCO by VEI. The tripartite cooperation between VEI, MOWASSCO, and the World Bank is
from Baricho Wellfield
from Mzima Springs
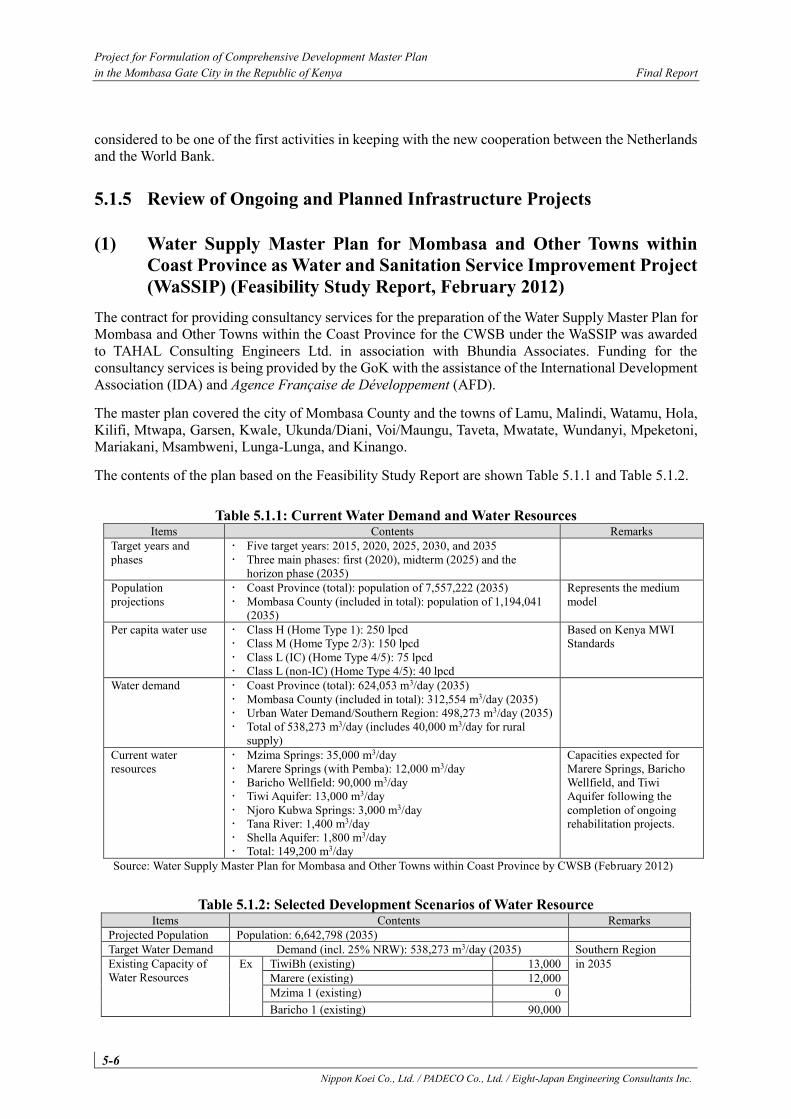
Project for Formulation of Comprehensive Development Master Plan in the Mombasa Gate City in the Republic of Kenya Final Report
5-6 Nippon Koei Co., Ltd. / PADECO Co., Ltd. / Eight-Japan Engineering Consultants Inc.
considered to be one of the first activities in keeping with the new cooperation between the Netherlands and the World Bank.
5.1.5 Review of Ongoing and Planned Infrastructure Projects
(1) Water Supply Master Plan for Mombasa and Other Towns within Coast Province as Water and Sanitation Service Improvement Project (WaSSIP) (Feasibility Study Report, February 2012)
The contract for providing consultancy services for the preparation of the Water Supply Master Plan for Mombasa and Other Towns within the Coast Province for the CWSB under the WaSSIP was awarded to TAHAL Consulting Engineers Ltd. in association with Bhundia Associates. Funding for the consultancy services is being provided by the GoK with the assistance of the International Development Association (IDA) and Agence Française de Développement (AFD).
The master plan covered the city of Mombasa County and the towns of Lamu, Malindi, Watamu, Hola, Kilifi, Mtwapa, Garsen, Kwale, Ukunda/Diani, Voi/Maungu, Taveta, Mwatate, Wundanyi, Mpeketoni, Mariakani, Msambweni, Lunga-Lunga, and Kinango.
The contents of the plan based on the Feasibility Study Report are shown Table 5.1.1 and Table 5.1.2.
Table 5.1.1: Current Water Demand and Water Resources Items Contents Remarks
Target years and phases
Five target years: 2015, 2020, 2025, 2030, and 2035 Three main phases: first (2020), midterm (2025) and the
horizon phase (2035)
Population projections
Coast Province (total): population of 7,557,222 (2035) Mombasa County (included in total): population of 1,194,041
(2035)
Represents the medium model
Per capita water use Class H (Home Type 1): 250 lpcd Class M (Home Type 2/3): 150 lpcd Class L (IC) (Home Type 4/5): 75 lpcd Class L (non-IC) (Home Type 4/5): 40 lpcd
Based on Kenya MWI Standards
Water demand Coast Province (total): 624,053 m3/day (2035) Mombasa County (included in total): 312,554 m3/day (2035) Urban Water Demand/Southern Region: 498,273 m3/day (2035) Total of 538,273 m3/day (includes 40,000 m3/day for rural
supply)
Current water resources
Mzima Springs: 35,000 m3/day Marere Springs (with Pemba): 12,000 m3/day Baricho Wellfield: 90,000 m3/day Tiwi Aquifer: 13,000 m3/day Njoro Kubwa Springs: 3,000 m3/day Tana River: 1,400 m3/day Shella Aquifer: 1,800 m3/day Total: 149,200 m3/day
Capacities expected for Marere Springs, Baricho Wellfield, and Tiwi Aquifer following the completion of ongoing rehabilitation projects.
Source: Water Supply Master Plan for Mombasa and Other Towns within Coast Province by CWSB (February 2012)
Table 5.1.2: Selected Development Scenarios of Water Resource Items Contents Remarks
Projected Population Population: 6,642,798 (2035) Target Water Demand Demand (incl. 25% NRW): 538,273 m3/day (2035) Southern Region Existing Capacity of Water Resources
Ex TiwiBh (existing) 13,000 in 2035 Marere (existing) 12,000 Mzima 1 (existing) 0 Baricho 1 (existing) 90,000
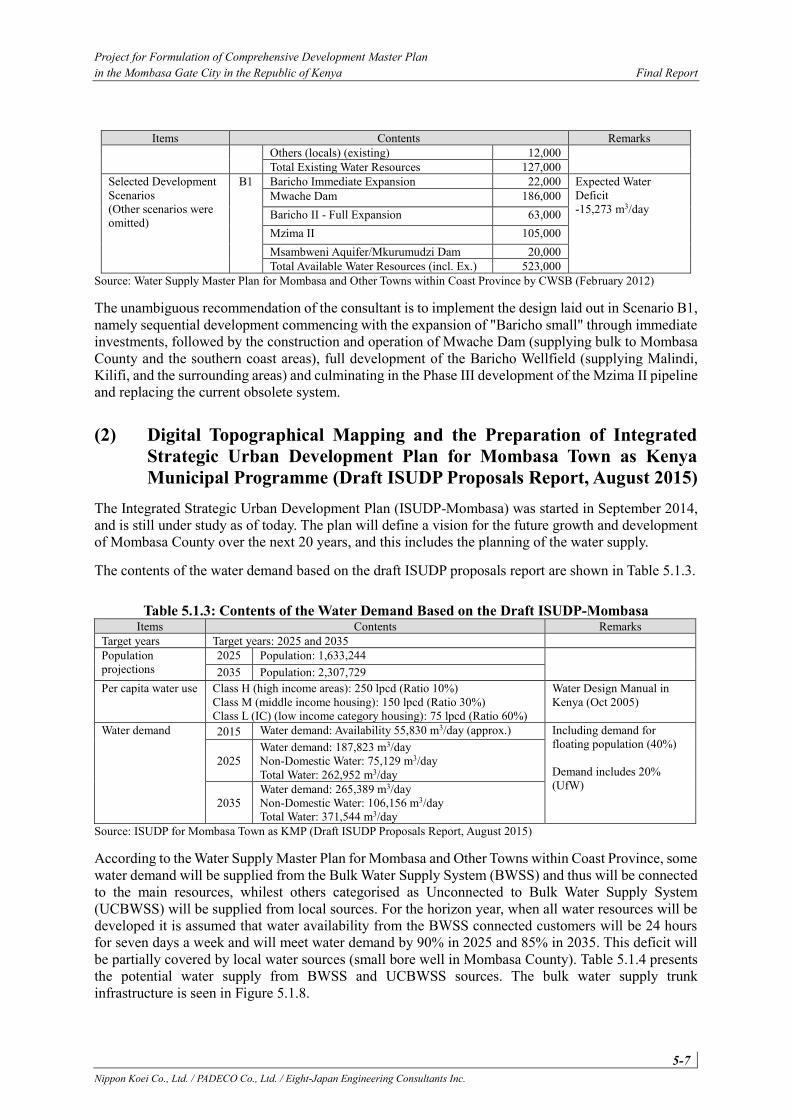
Project for Formulation of Comprehensive Development Master Plan in the Mombasa Gate City in the Republic of Kenya Final Report
5-7 Nippon Koei Co., Ltd. / PADECO Co., Ltd. / Eight-Japan Engineering Consultants Inc.
Items Contents Remarks Others (locals) (existing) 12,000 Total Existing Water Resources 127,000
Selected Development Scenarios (Other scenarios were omitted)
B1 Baricho Immediate Expansion 22,000 Expected Water Deficit -15,273 m3/day
Mwache Dam 186,000 Baricho II - Full Expansion 63,000 Mzima II 105,000 Msambweni Aquifer/Mkurumudzi Dam 20,000 Total Available Water Resources (incl. Ex.) 523,000
Source: Water Supply Master Plan for Mombasa and Other Towns within Coast Province by CWSB (February 2012)
The unambiguous recommendation of the consultant is to implement the design laid out in Scenario B1, namely sequential development commencing with the expansion of "Baricho small" through immediate investments, followed by the construction and operation of Mwache Dam (supplying bulk to Mombasa County and the southern coast areas), full development of the Baricho Wellfield (supplying Malindi, Kilifi, and the surrounding areas) and culminating in the Phase III development of the Mzima II pipeline and replacing the current obsolete system.
(2) Digital Topographical Mapping and the Preparation of Integrated Strategic Urban Development Plan for Mombasa Town as Kenya Municipal Programme (Draft ISUDP Proposals Report, August 2015)
The Integrated Strategic Urban Development Plan (ISUDP-Mombasa) was started in September 2014, and is still under study as of today. The plan will define a vision for the future growth and development of Mombasa County over the next 20 years, and this includes the planning of the water supply.
The contents of the water demand based on the draft ISUDP proposals report are shown in Table 5.1.3.
Table 5.1.3: Contents of the Water Demand Based on the Draft ISUDP-Mombasa Items Contents Remarks
Target years Target years: 2025 and 2035 Population projections
2025 Population: 1,633,244 2035 Population: 2,307,729
Per capita water use Class H (high income areas): 250 lpcd (Ratio 10%) Class M (middle income housing): 150 lpcd (Ratio 30%) Class L (IC) (low income category housing): 75 lpcd (Ratio 60%)
Water Design Manual in Kenya (Oct 2005)
Water demand 2015 Water demand: Availability 55,830 m3/day (approx.) Including demand for floating population (40%) Demand includes 20% (UfW)
2025 Water demand: 187,823 m3/day Non-Domestic Water: 75,129 m3/day Total Water: 262,952 m3/day
2035 Water demand: 265,389 m3/day Non-Domestic Water: 106,156 m3/day Total Water: 371,544 m3/day
Source: ISUDP for Mombasa Town as KMP (Draft ISUDP Proposals Report, August 2015)
According to the Water Supply Master Plan for Mombasa and Other Towns within Coast Province, some water demand will be supplied from the Bulk Water Supply System (BWSS) and thus will be connected to the main resources, whilest others categorised as Unconnected to Bulk Water Supply System (UCBWSS) will be supplied from local sources. For the horizon year, when all water resources will be developed it is assumed that water availability from the BWSS connected customers will be 24 hours for seven days a week and will meet water demand by 90% in 2025 and 85% in 2035. This deficit will be partially covered by local water sources (small bore well in Mombasa County). Table 5.1.4 presents the potential water supply from BWSS and UCBWSS sources. The bulk water supply trunk infrastructure is seen in Figure 5.1.8.
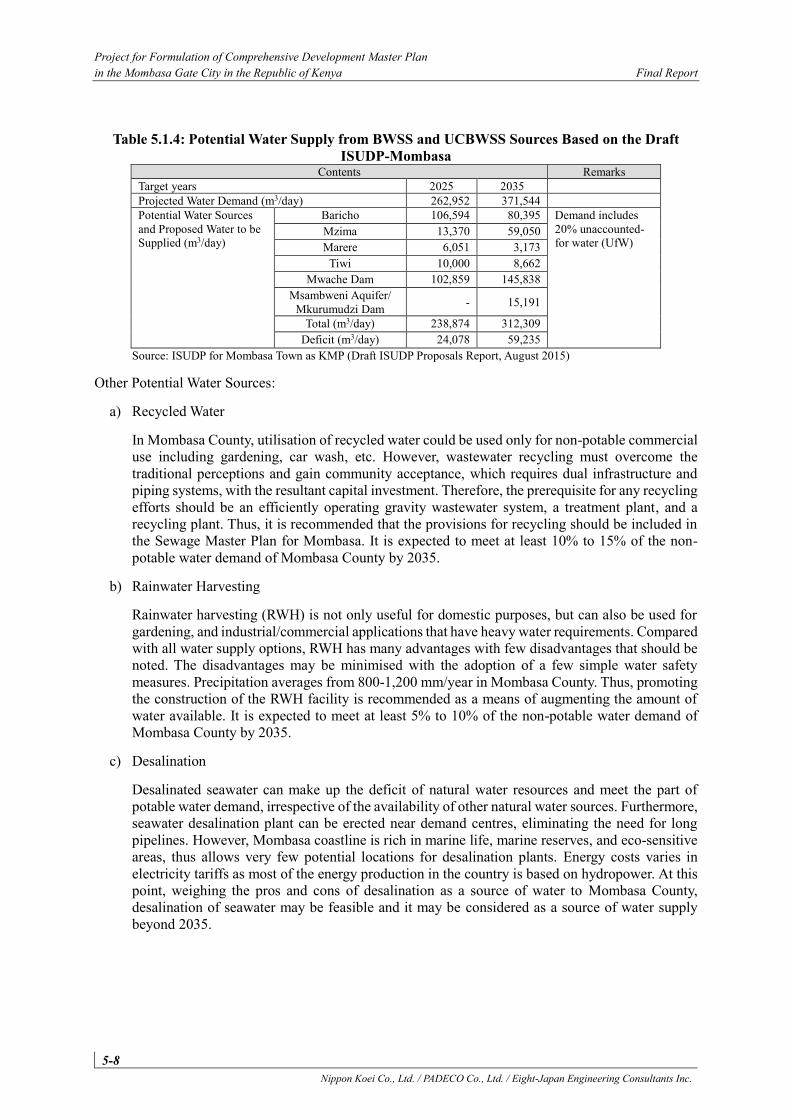
Project for Formulation of Comprehensive Development Master Plan in the Mombasa Gate City in the Republic of Kenya Final Report
5-8 Nippon Koei Co., Ltd. / PADECO Co., Ltd. / Eight-Japan Engineering Consultants Inc.
Table 5.1.4: Potential Water Supply from BWSS and UCBWSS Sources Based on the Draft ISUDP-Mombasa
Contents Remarks Target years 2025 2035 Projected Water Demand (m3/day) 262,952 371,544 Potential Water Sources and Proposed Water to be Supplied (m3/day)
Baricho 106,594 80,395 Demand includes 20% unaccounted-for water (UfW)
Mzima 13,370 59,050 Marere 6,051 3,173
Tiwi 10,000 8,662 Mwache Dam 102,859 145,838
Msambweni Aquifer/ Mkurumudzi Dam - 15,191
Total (m3/day) 238,874 312,309 Deficit (m3/day) 24,078 59,235
Source: ISUDP for Mombasa Town as KMP (Draft ISUDP Proposals Report, August 2015)
Other Potential Water Sources:
a) Recycled Water
In Mombasa County, utilisation of recycled water could be used only for non-potable commercial use including gardening, car wash, etc. However, wastewater recycling must overcome the traditional perceptions and gain community acceptance, which requires dual infrastructure and piping systems, with the resultant capital investment. Therefore, the prerequisite for any recycling efforts should be an efficiently operating gravity wastewater system, a treatment plant, and a recycling plant. Thus, it is recommended that the provisions for recycling should be included in the Sewage Master Plan for Mombasa. It is expected to meet at least 10% to 15% of the non-potable water demand of Mombasa County by 2035.
b) Rainwater Harvesting
Rainwater harvesting (RWH) is not only useful for domestic purposes, but can also be used for gardening, and industrial/commercial applications that have heavy water requirements. Compared with all water supply options, RWH has many advantages with few disadvantages that should be noted. The disadvantages may be minimised with the adoption of a few simple water safety measures. Precipitation averages from 800-1,200 mm/year in Mombasa County. Thus, promoting the construction of the RWH facility is recommended as a means of augmenting the amount of water available. It is expected to meet at least 5% to 10% of the non-potable water demand of Mombasa County by 2035.
c) Desalination
Desalinated seawater can make up the deficit of natural water resources and meet the part of potable water demand, irrespective of the availability of other natural water sources. Furthermore, seawater desalination plant can be erected near demand centres, eliminating the need for long pipelines. However, Mombasa coastline is rich in marine life, marine reserves, and eco-sensitive areas, thus allows very few potential locations for desalination plants. Energy costs varies in electricity tariffs as most of the energy production in the country is based on hydropower. At this point, weighing the pros and cons of desalination as a source of water to Mombasa County, desalination of seawater may be feasible and it may be considered as a source of water supply beyond 2035.
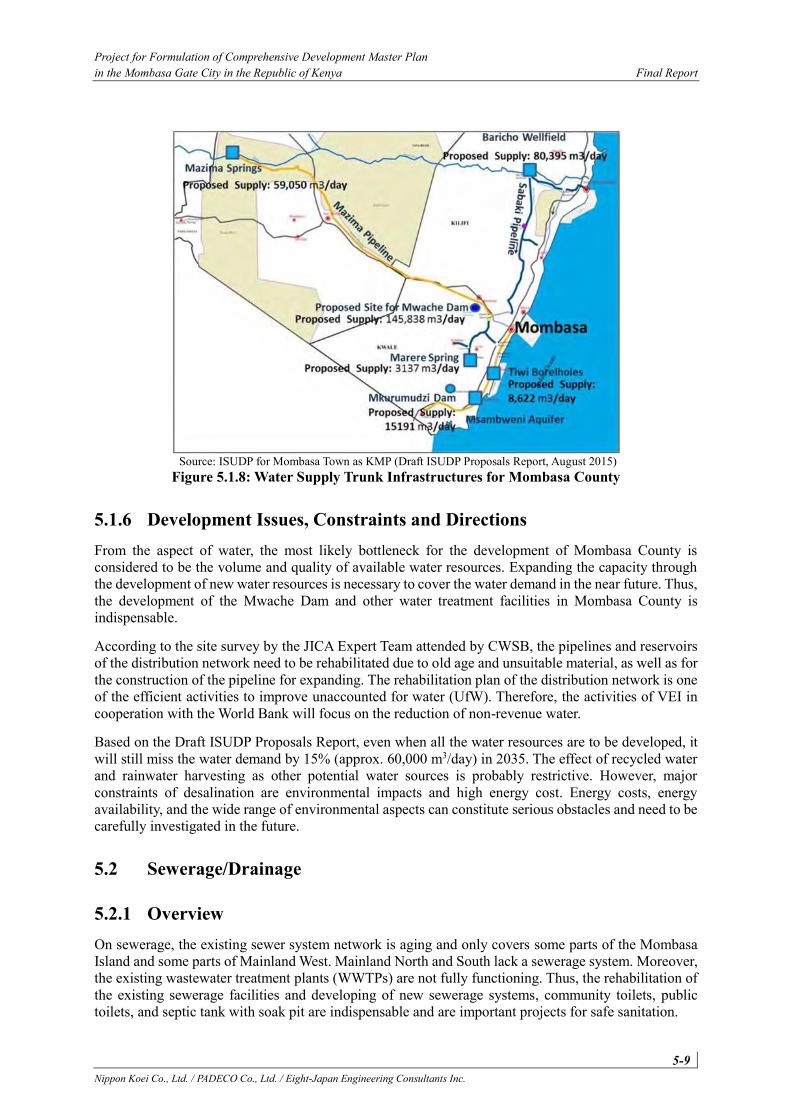
Project for Formulation of Comprehensive Development Master Plan in the Mombasa Gate City in the Republic of Kenya Final Report
5-9 Nippon Koei Co., Ltd. / PADECO Co., Ltd. / Eight-Japan Engineering Consultants Inc.
Source: ISUDP for Mombasa Town as KMP (Draft ISUDP Proposals Report, August 2015)
Figure 5.1.8: Water Supply Trunk Infrastructures for Mombasa County
5.1.6 Development Issues, Constraints and Directions From the aspect of water, the most likely bottleneck for the development of Mombasa County is considered to be the volume and quality of available water resources. Expanding the capacity through the development of new water resources is necessary to cover the water demand in the near future. Thus, the development of the Mwache Dam and other water treatment facilities in Mombasa County is indispensable.
According to the site survey by the JICA Expert Team attended by CWSB, the pipelines and reservoirs of the distribution network need to be rehabilitated due to old age and unsuitable material, as well as for the construction of the pipeline for expanding. The rehabilitation plan of the distribution network is one of the efficient activities to improve unaccounted for water (UfW). Therefore, the activities of VEI in cooperation with the World Bank will focus on the reduction of non-revenue water.
Based on the Draft ISUDP Proposals Report, even when all the water resources are to be developed, it will still miss the water demand by 15% (approx. 60,000 m3/day) in 2035. The effect of recycled water and rainwater harvesting as other potential water sources is probably restrictive. However, major constraints of desalination are environmental impacts and high energy cost. Energy costs, energy availability, and the wide range of environmental aspects can constitute serious obstacles and need to be carefully investigated in the future.
5.2 Sewerage/Drainage
5.2.1 Overview On sewerage, the existing sewer system network is aging and only covers some parts of the Mombasa Island and some parts of Mainland West. Mainland North and South lack a sewerage system. Moreover, the existing wastewater treatment plants (WWTPs) are not fully functioning. Thus, the rehabilitation of the existing sewerage facilities and developing of new sewerage systems, community toilets, public toilets, and septic tank with soak pit are indispensable and are important projects for safe sanitation.
Project for Formulation of Comprehensive Development Master Plan in the Mombasa Gate City in the Republic of Kenya Final Report
5-10 Nippon Koei Co., Ltd. / PADECO Co., Ltd. / Eight-Japan Engineering Consultants Inc.
On drainage, studies on storm water drainage are onsgoing. The drainage design guideline was provided by the Mombasa Storm Water Master Plan. However, the current storm water drainage covers only 10% of the total area.
5.2.2 Review of Policy, Legal Framework and Administrative Structure
(1) Policy and Legal Framework Promulgation of the Constitution of Kenya 2010 marked a momentous point in the country's history. Kenya's decentralisation is amongst the most rapid and ambitious devolution processes going on in the world, with new governance challenges and opportunities as the country builds a new set of county governments from scratch. Multiple new laws have been put in place and include new legislation on county government, urban areas, and management of the environment, public financial management as well as the transition to devolved government. New county institutions are gradually taking shape and in addition to this, the Water Act of 2014, which has been published, introduces governance, ownership and management responsibilities somewhat different to the legislation in place at the time of preparing the project proposal.
(2) Administrative Structure On sewerage, the GoK through the Ministry of Environment, Water and Natural Resources (MEWNR) has received credit from the IDA to undertake the Wastewater Master Plan for Mombasa and Selected Towns within the Coast Region. The CWSB is a parastatal (government-owned and autonomous) and operates under the MEWNR. The CWSB covers six counties namely, Mombasa, Kwale, Kilifi, Taita-Taveta, Lamu, and the Tana River. The autonomy of the counties has vested powers and privileges in each county especially on the provision of essential public services such as water, sanitation, education, and other social services.
On drainage, the Department of Transport and Infrastructure of Mombasa County does the installation and maintenance on the existing drainage through the adjustments done along with the road improvement.
5.2.3 Current Conditions
(1) Sewerage The county has two WWTPs located in Kizingo and Kipevu. The details of the WWTPs are as follows:
Kizingo WWTP is located within the Mombasa Island where there is a golf course in between the State House and the Galaxy Restaurant (Chinese Restaurant). It is an underground plant constructed 20 years ago with a design capacity of 10,000 m3/day, and it is currently non-functional. Kizingo Treatment Plant collapsed 20 years ago, and due to the absence of a functional sewerage system on the Mombasa Island, some of the residents empty their effluent into the Indian Ocean without treatment.
Kipevu WWTP is located in the Mainland West (Changamwe). It has a design capacity of 17,100 m3/day but is supplied with wastewater amounting from 6,000 to 7,000 m3/day. It serves the residents of Changamwe, Port Reitz, Magongo, and Jomvu.
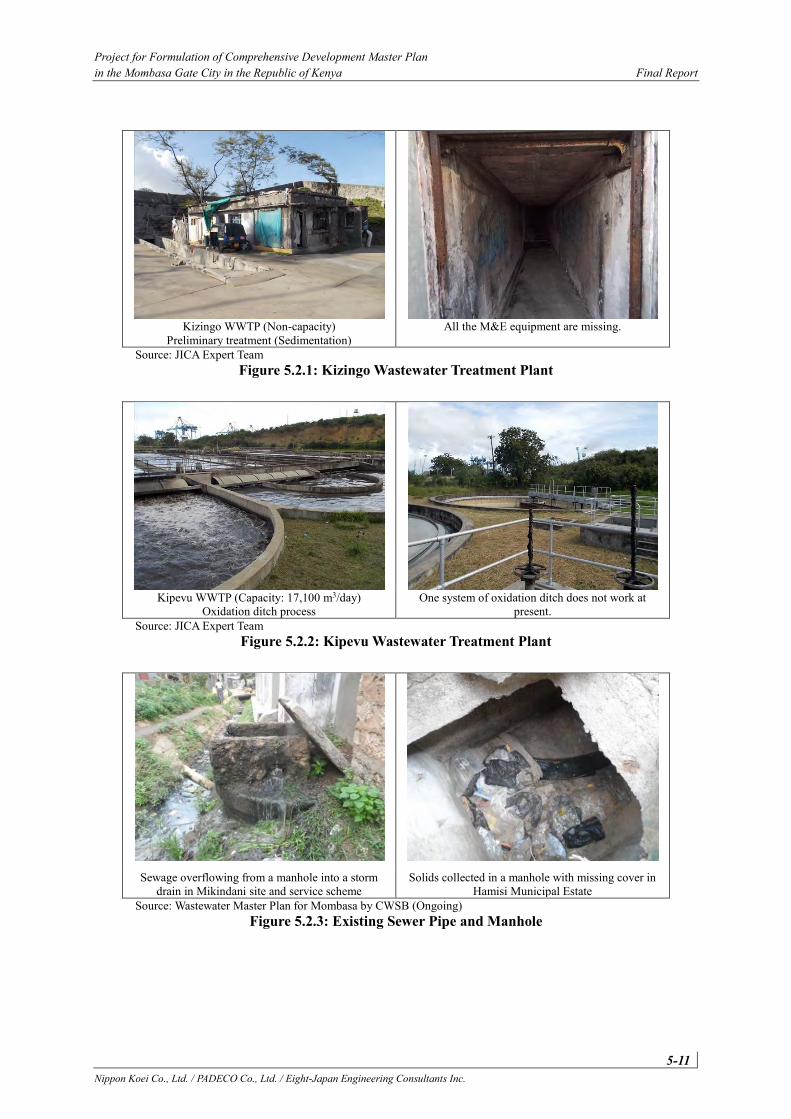
Project for Formulation of Comprehensive Development Master Plan in the Mombasa Gate City in the Republic of Kenya Final Report
5-11 Nippon Koei Co., Ltd. / PADECO Co., Ltd. / Eight-Japan Engineering Consultants Inc.
Kizingo WWTP (Non-capacity)
Preliminary treatment (Sedimentation) All the M&E equipment are missing.
Source: JICA Expert Team Figure 5.2.1: Kizingo Wastewater Treatment Plant
Kipevu WWTP (Capacity: 17,100 m3/day)
Oxidation ditch process One system of oxidation ditch does not work at
present. Source: JICA Expert Team
Figure 5.2.2: Kipevu Wastewater Treatment Plant
Sewage overflowing from a manhole into a storm
drain in Mikindani site and service scheme Solids collected in a manhole with missing cover in
Hamisi Municipal Estate Source: Wastewater Master Plan for Mombasa by CWSB (Ongoing)
Figure 5.2.3: Existing Sewer Pipe and Manhole
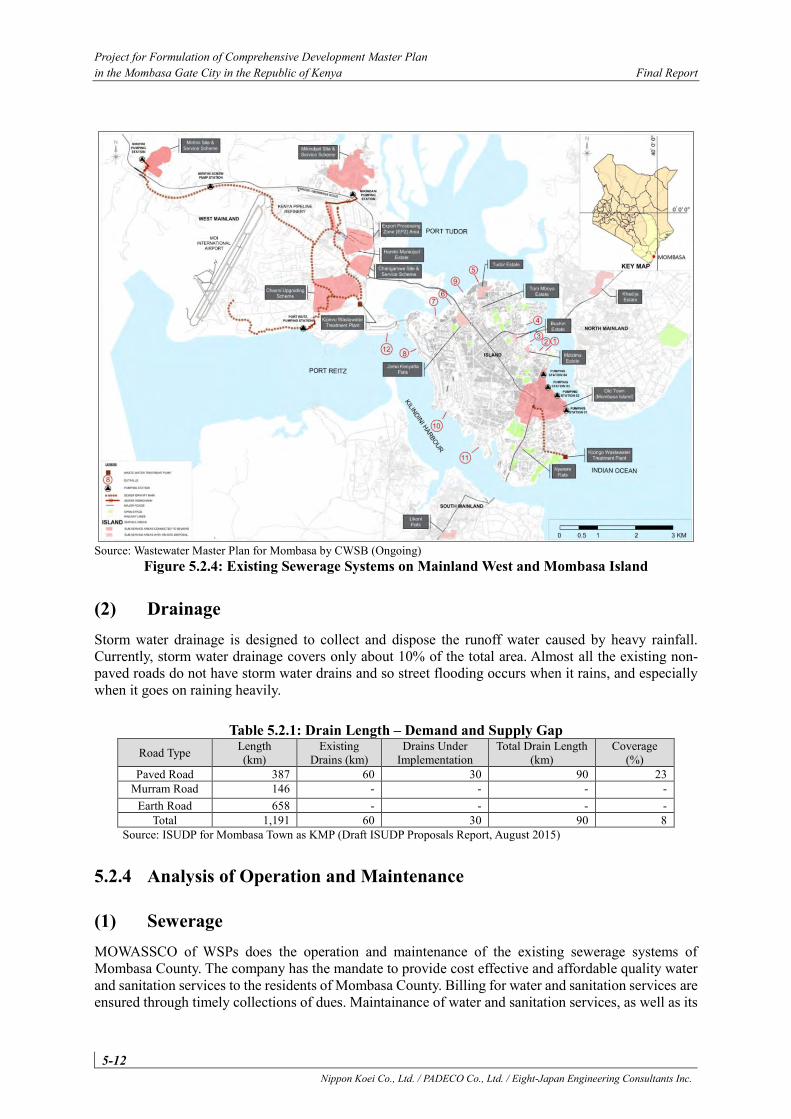
Project for Formulation of Comprehensive Development Master Plan in the Mombasa Gate City in the Republic of Kenya Final Report
5-12 Nippon Koei Co., Ltd. / PADECO Co., Ltd. / Eight-Japan Engineering Consultants Inc.
Source: Wastewater Master Plan for Mombasa by CWSB (Ongoing)
Figure 5.2.4: Existing Sewerage Systems on Mainland West and Mombasa Island
(2) Drainage Storm water drainage is designed to collect and dispose the runoff water caused by heavy rainfall. Currently, storm water drainage covers only about 10% of the total area. Almost all the existing non-paved roads do not have storm water drains and so street flooding occurs when it rains, and especially when it goes on raining heavily.
Table 5.2.1: Drain Length – Demand and Supply Gap Road Type Length
(km) Existing
Drains (km) Drains Under
Implementation Total Drain Length
(km) Coverage
(%) Paved Road 387 60 30 90 23
Murram Road 146 - - - - Earth Road 658 - - - -
Total 1,191 60 30 90 8 Source: ISUDP for Mombasa Town as KMP (Draft ISUDP Proposals Report, August 2015)
5.2.4 Analysis of Operation and Maintenance
(1) Sewerage MOWASSCO of WSPs does the operation and maintenance of the existing sewerage systems of Mombasa County. The company has the mandate to provide cost effective and affordable quality water and sanitation services to the residents of Mombasa County. Billing for water and sanitation services are ensured through timely collections of dues. Maintainance of water and sanitation services, as well as its
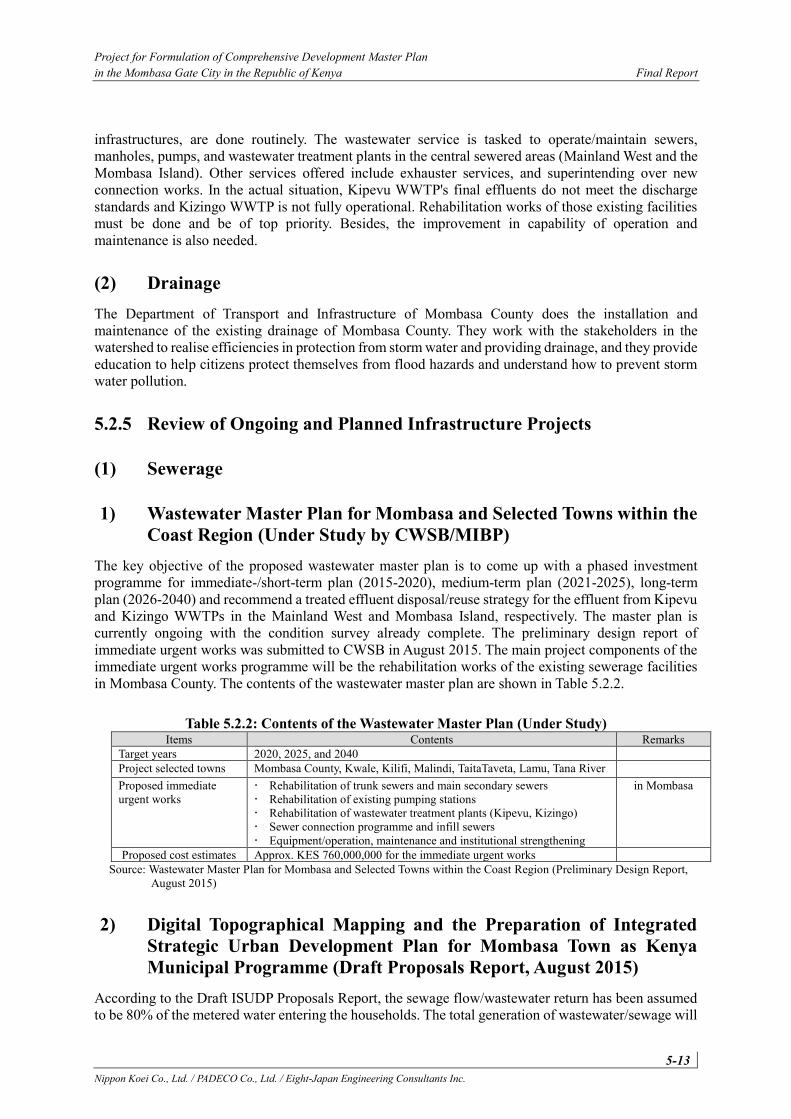
Project for Formulation of Comprehensive Development Master Plan in the Mombasa Gate City in the Republic of Kenya Final Report
5-13 Nippon Koei Co., Ltd. / PADECO Co., Ltd. / Eight-Japan Engineering Consultants Inc.
infrastructures, are done routinely. The wastewater service is tasked to operate/maintain sewers, manholes, pumps, and wastewater treatment plants in the central sewered areas (Mainland West and the Mombasa Island). Other services offered include exhauster services, and superintending over new connection works. In the actual situation, Kipevu WWTP's final effluents do not meet the discharge standards and Kizingo WWTP is not fully operational. Rehabilitation works of those existing facilities must be done and be of top priority. Besides, the improvement in capability of operation and maintenance is also needed.
(2) Drainage The Department of Transport and Infrastructure of Mombasa County does the installation and maintenance of the existing drainage of Mombasa County. They work with the stakeholders in the watershed to realise efficiencies in protection from storm water and providing drainage, and they provide education to help citizens protect themselves from flood hazards and understand how to prevent storm water pollution.
5.2.5 Review of Ongoing and Planned Infrastructure Projects
(1) Sewerage
1) Wastewater Master Plan for Mombasa and Selected Towns within the Coast Region (Under Study by CWSB/MIBP)
The key objective of the proposed wastewater master plan is to come up with a phased investment programme for immediate-/short-term plan (2015-2020), medium-term plan (2021-2025), long-term plan (2026-2040) and recommend a treated effluent disposal/reuse strategy for the effluent from Kipevu and Kizingo WWTPs in the Mainland West and Mombasa Island, respectively. The master plan is currently ongoing with the condition survey already complete. The preliminary design report of immediate urgent works was submitted to CWSB in August 2015. The main project components of the immediate urgent works programme will be the rehabilitation works of the existing sewerage facilities in Mombasa County. The contents of the wastewater master plan are shown in Table 5.2.2.
Table 5.2.2: Contents of the Wastewater Master Plan (Under Study) Items Contents Remarks
Target years 2020, 2025, and 2040 Project selected towns Mombasa County, Kwale, Kilifi, Malindi, TaitaTaveta, Lamu, Tana River Proposed immediate urgent works
Rehabilitation of trunk sewers and main secondary sewers Rehabilitation of existing pumping stations Rehabilitation of wastewater treatment plants (Kipevu, Kizingo) Sewer connection programme and infill sewers Equipment/operation, maintenance and institutional strengthening
in Mombasa
Proposed cost estimates Approx. KES 760,000,000 for the immediate urgent works Source: Wastewater Master Plan for Mombasa and Selected Towns within the Coast Region (Preliminary Design Report,
August 2015)
2) Digital Topographical Mapping and the Preparation of Integrated Strategic Urban Development Plan for Mombasa Town as Kenya Municipal Programme (Draft Proposals Report, August 2015)
According to the Draft ISUDP Proposals Report, the sewage flow/wastewater return has been assumed to be 80% of the metered water entering the households. The total generation of wastewater/sewage will
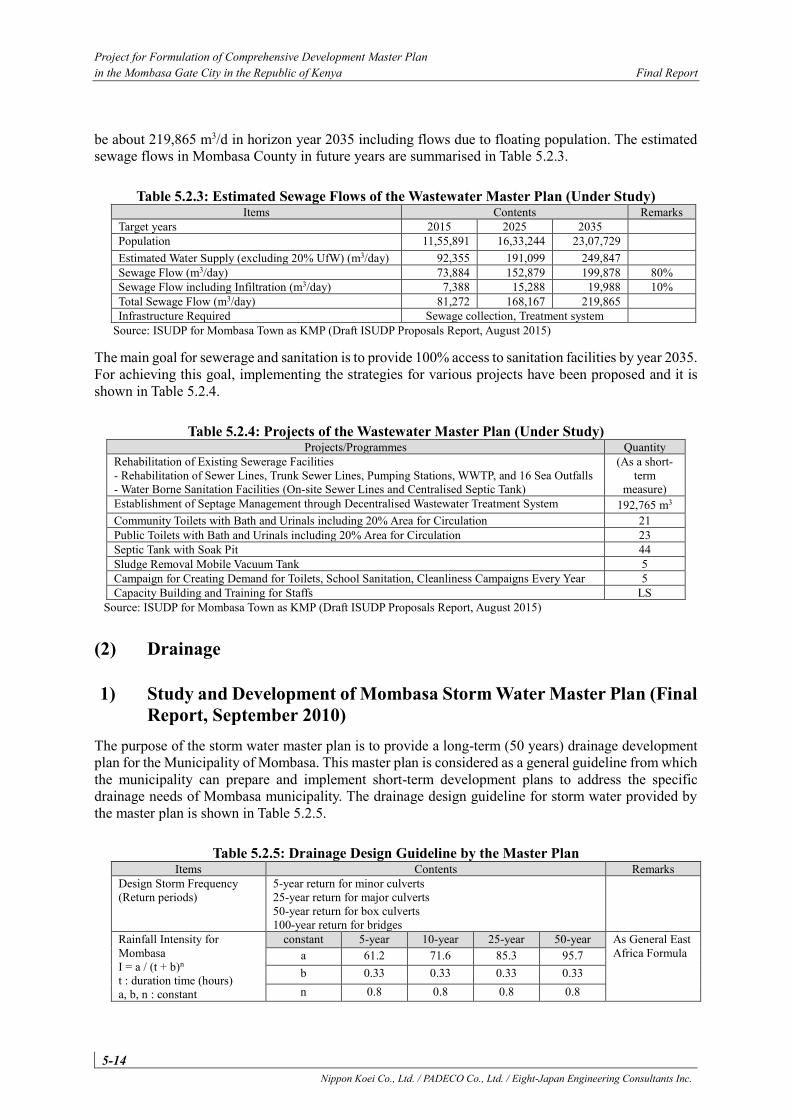
Project for Formulation of Comprehensive Development Master Plan in the Mombasa Gate City in the Republic of Kenya Final Report
5-14 Nippon Koei Co., Ltd. / PADECO Co., Ltd. / Eight-Japan Engineering Consultants Inc.
be about 219,865 m3/d in horizon year 2035 including flows due to floating population. The estimated sewage flows in Mombasa County in future years are summarised in Table 5.2.3.
Table 5.2.3: Estimated Sewage Flows of the Wastewater Master Plan (Under Study) Items Contents Remarks
Target years 2015 2025 2035 Population 11,55,891 16,33,244 23,07,729 Estimated Water Supply (excluding 20% UfW) (m3/day) 92,355 191,099 249,847 Sewage Flow (m3/day) 73,884 152,879 199,878 80% Sewage Flow including Infiltration (m3/day) 7,388 15,288 19,988 10% Total Sewage Flow (m3/day) 81,272 168,167 219,865 Infrastructure Required Sewage collection, Treatment system
Source: ISUDP for Mombasa Town as KMP (Draft ISUDP Proposals Report, August 2015)
The main goal for sewerage and sanitation is to provide 100% access to sanitation facilities by year 2035. For achieving this goal, implementing the strategies for various projects have been proposed and it is shown in Table 5.2.4.
Table 5.2.4: Projects of the Wastewater Master Plan (Under Study) Projects/Programmes Quantity
Rehabilitation of Existing Sewerage Facilities - Rehabilitation of Sewer Lines, Trunk Sewer Lines, Pumping Stations, WWTP, and 16 Sea Outfalls - Water Borne Sanitation Facilities (On-site Sewer Lines and Centralised Septic Tank)
(As a short-term
measure) Establishment of Septage Management through Decentralised Wastewater Treatment System 192,765 m3 Community Toilets with Bath and Urinals including 20% Area for Circulation 21 Public Toilets with Bath and Urinals including 20% Area for Circulation 23 Septic Tank with Soak Pit 44 Sludge Removal Mobile Vacuum Tank 5 Campaign for Creating Demand for Toilets, School Sanitation, Cleanliness Campaigns Every Year 5 Capacity Building and Training for Staffs LS
Source: ISUDP for Mombasa Town as KMP (Draft ISUDP Proposals Report, August 2015)
(2) Drainage
1) Study and Development of Mombasa Storm Water Master Plan (Final Report, September 2010)
The purpose of the storm water master plan is to provide a long-term (50 years) drainage development plan for the Municipality of Mombasa. This master plan is considered as a general guideline from which the municipality can prepare and implement short-term development plans to address the specific drainage needs of Mombasa municipality. The drainage design guideline for storm water provided by the master plan is shown in Table 5.2.5.
Table 5.2.5: Drainage Design Guideline by the Master Plan Items Contents Remarks
Design Storm Frequency (Return periods)
5-year return for minor culverts 25-year return for major culverts 50-year return for box culverts 100-year return for bridges
Rainfall Intensity for Mombasa I = a / (t + b)n
t : duration time (hours) a, b, n : constant
constant 5-year 10-year 25-year 50-year As General East Africa Formula a 61.2 71.6 85.3 95.7
b 0.33 0.33 0.33 0.33 n 0.8 0.8 0.8 0.8
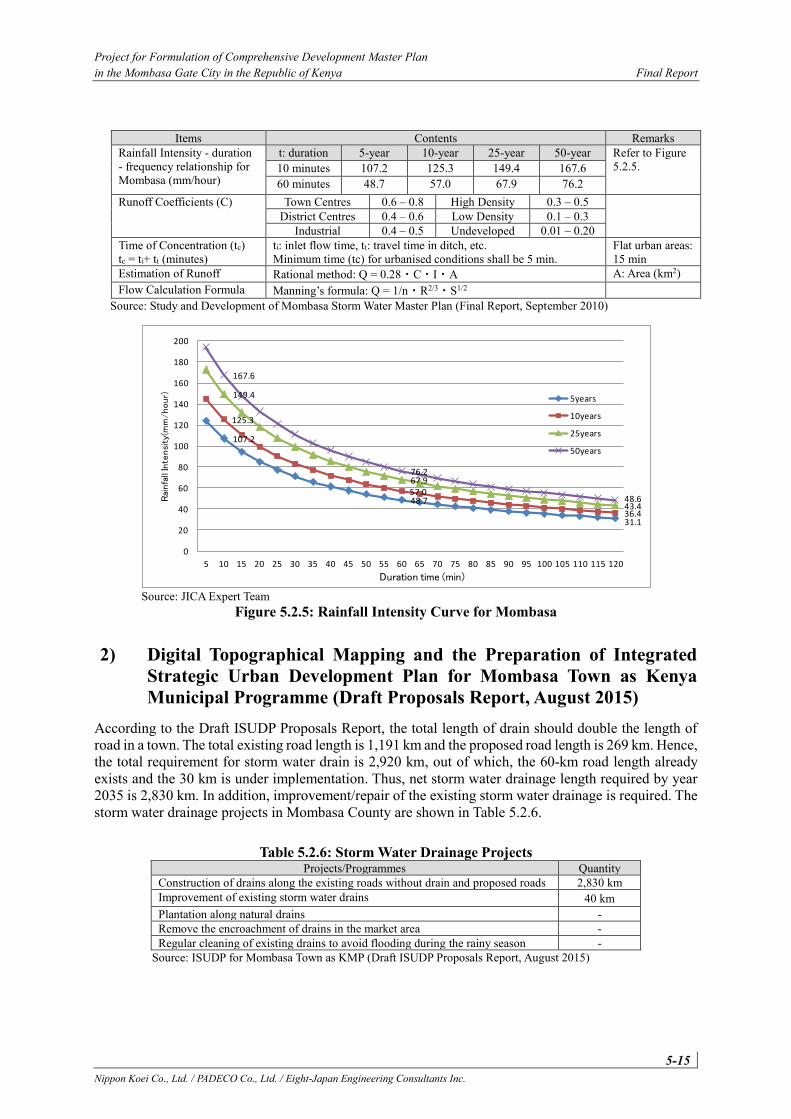
Project for Formulation of Comprehensive Development Master Plan in the Mombasa Gate City in the Republic of Kenya Final Report
5-15 Nippon Koei Co., Ltd. / PADECO Co., Ltd. / Eight-Japan Engineering Consultants Inc.
Items Contents Remarks Rainfall Intensity - duration - frequency relationship for Mombasa (mm/hour)
t: duration 5-year 10-year 25-year 50-year Refer to Figure 5.2.5.
10 minutes 107.2 125.3 149.4 167.6 60 minutes 48.7 57.0 67.9 76.2
Runoff Coefficients (C) Town Centres 0.6 – 0.8 High Density 0.3 – 0.5 District Centres 0.4 – 0.6 Low Density 0.1 – 0.3
Industrial 0.4 – 0.5 Undeveloped 0.01 – 0.20 Time of Concentration (tc) tc = ti+ tt (minutes)
ti: inlet flow time, tt: travel time in ditch, etc. Minimum time (tc) for urbanised conditions shall be 5 min.
Flat urban areas: 15 min
Estimation of Runoff Rational method: Q = 0.28・C・I・A A: Area (km2) Flow Calculation Formula Manning’s formula: Q = 1/n・R2/3・S1/2
Source: Study and Development of Mombasa Storm Water Master Plan (Final Report, September 2010)
Source: JICA Expert Team
Figure 5.2.5: Rainfall Intensity Curve for Mombasa
2) Digital Topographical Mapping and the Preparation of Integrated Strategic Urban Development Plan for Mombasa Town as Kenya Municipal Programme (Draft Proposals Report, August 2015)
According to the Draft ISUDP Proposals Report, the total length of drain should double the length of road in a town. The total existing road length is 1,191 km and the proposed road length is 269 km. Hence, the total requirement for storm water drain is 2,920 km, out of which, the 60-km road length already exists and the 30 km is under implementation. Thus, net storm water drainage length required by year 2035 is 2,830 km. In addition, improvement/repair of the existing storm water drainage is required. The storm water drainage projects in Mombasa County are shown in Table 5.2.6.
Table 5.2.6: Storm Water Drainage Projects Projects/Programmes Quantity
Construction of drains along the existing roads without drain and proposed roads 2,830 km Improvement of existing storm water drains 40 km Plantation along natural drains - Remove the encroachment of drains in the market area - Regular cleaning of existing drains to avoid flooding during the rainy season -
Source: ISUDP for Mombasa Town as KMP (Draft ISUDP Proposals Report, August 2015)
107.2
48.7
31.1
125.3
57.0
36.4
149.4
67.9
43.4
167.6
76.2
48.6
0
20
40
60
80
100
120
140
160
180
200
5 10 15 20 25 30 35 40 45 50 55 60 65 70 75 80 85 90 95 100 105 110 115 120
Rai
nfa
ll In
tensi
ty(m
m/hour)
Duration time (min)
5years
10years
25years
50years
Project for Formulation of Comprehensive Development Master Plan in the Mombasa Gate City in the Republic of Kenya Final Report
5-16 Nippon Koei Co., Ltd. / PADECO Co., Ltd. / Eight-Japan Engineering Consultants Inc.
5.2.6 Development Issues, Constraints, and Directions
(1) Sewerage The existing sewer system network is aging and only covers parts of the Mombasa Island and parts of Mainland West. Mainland North and South lack a sewerage system. Moreover, the existing WWTPs are not fully functioning. Thus, the rehabilitation of existing sewerage facilities in Mombasa County is indispensable and urgent.
On Kipevu WWTP, the rehabilitation works will mainly be electrical and mechanical works of aeration tanks and replacement of defective sludge pumps. Membrane diffuser or vertical-axis type aerator with draft tube is mainly used for oxidation ditch process nowadays, due to the fact that a churning ability of the existing horizontal-axis type aerator is weak, this may be considered in the rehabilitation works.
On Kizingo WWTP, the rehabilitation works should be full replacement of the treatment system due to the fact that the existing systems are not functioning. The new treatment system will be required with an advanced treatment for environmental protection of port and sea area.
The enormous time and cost is required for the sewerage projects, therefore, water environment is frequently contaminated. The status of the sewerage and sanitation in urban poor/slums/informal areas is very poor. Hence, community toilets, public toilets, and septic tank with soak pit are very important projects for safe sanitation. In conducting public works and making policy decisions, reflecting public opinion is increasingly important for the projects. Surveys to collect public opinion are carried out, and opportunities to participate in decision-making process are provided to the community.
Various events and PR programmes are needed to raise public awareness and understanding about the role of sewerage works and the importance of sewerage development. For example, participants will learn about the effects of sewerage systems through field trips, hands-on workshops, and study sessions of water environment.
(2) Drainage JICA studies on storm water drainage are ongoing and some issues are summarised below.
Currently, storm water drainage covers only 10% of the total area and almost all the non-paved roads do not have storm water drains. A comprehensive improvement of the drainage system is required following the development of Mombasa County.
Dumping of solid waste and soil by human activities along the drainage channels have caused flooding. Regular improvement and awareness programmes on the environmental concerns and public manners should be prepared for the general public. Also, regular cleaning of the existing drains is required to avoid flooding during rainy season.
Measures of rain water discharge control may be a necessity towards the increase of runoff coefficients following the development of large-scale land and housing in the future. On the measures, the responsibility for preventing flooding using storm water retention pond or rainwater infiltration facilities is imposed to the developer. Preparation of the legal regulation for management of this discharge control system is required.
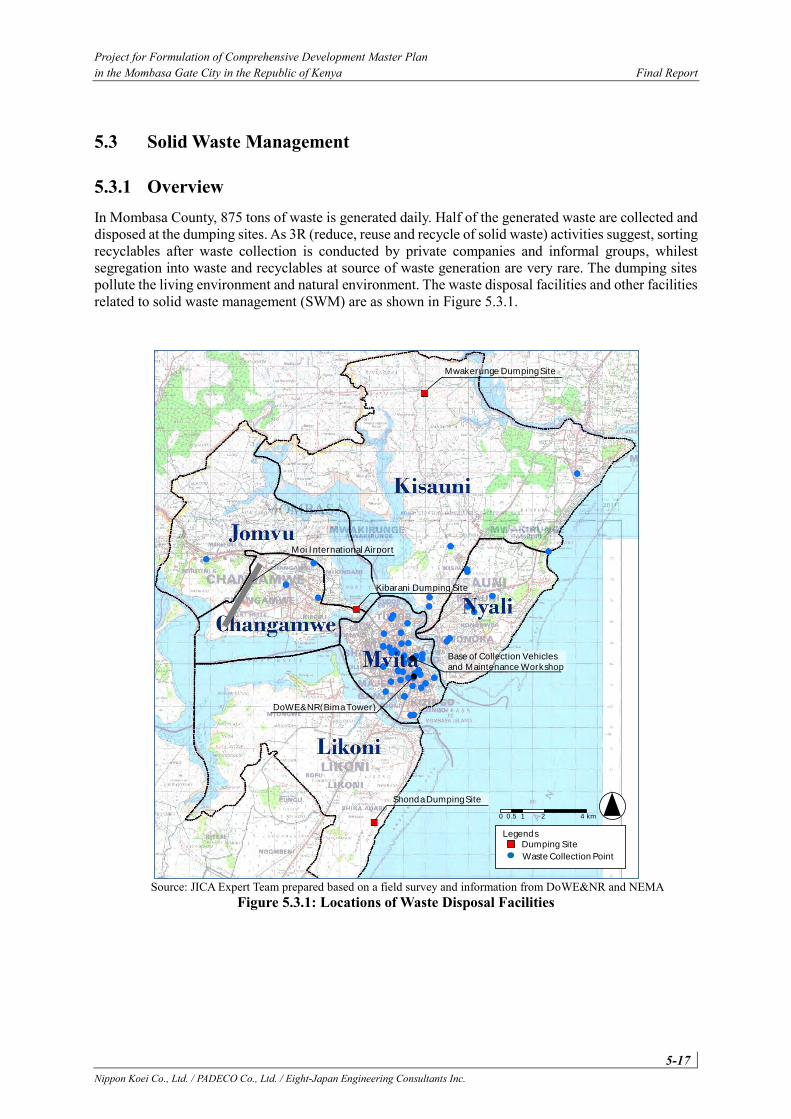
Project for Formulation of Comprehensive Development Master Plan in the Mombasa Gate City in the Republic of Kenya Final Report
5-17 Nippon Koei Co., Ltd. / PADECO Co., Ltd. / Eight-Japan Engineering Consultants Inc.
5.3 Solid Waste Management
5.3.1 Overview In Mombasa County, 875 tons of waste is generated daily. Half of the generated waste are collected and disposed at the dumping sites. As 3R (reduce, reuse and recycle of solid waste) activities suggest, sorting recyclables after waste collection is conducted by private companies and informal groups, whilest segregation into waste and recyclables at source of waste generation are very rare. The dumping sites pollute the living environment and natural environment. The waste disposal facilities and other facilities related to solid waste management (SWM) are as shown in Figure 5.3.1.
Source: JICA Expert Team prepared based on a field survey and information from DoWE&NR and NEMA
Figure 5.3.1: Locations of Waste Disposal Facilities
LegendsDumping Site
Waste Collection Point
0 0.5 1 2 4 km
Mwakerunge Dumping Site
Kibarani Dumping Site
Shonda Dumping Site
DoWE&NR(Bima Tower)
Base of Collection Vehicles and Maintenance Workshop
Moi International Airport
Project for Formulation of Comprehensive Development Master Plan in the Mombasa Gate City in the Republic of Kenya Final Report
5-18 Nippon Koei Co., Ltd. / PADECO Co., Ltd. / Eight-Japan Engineering Consultants Inc.
5.3.2 Review of Policy (Including KMP), Legal Framework and Administrative Structure
(1) Review of Policy (Including KMP)
1) Kenyan Policy Kenya Vision 2030 provides the development direction toward 2030 including the necessity of sustainable growth in Kenya. In the vision, the Solid Waste Management System Initiative as flagship project is raised and the development of solid waste management systems in five leading counties including Mombasa County have been proposed.
The National Environmental Management Authority (NEMA) is the regulatory body in-charge of the SWM at the national level. NEMA established the National Solid Waste Management Strategy in 2014 to guide sustainable SWM in Kenya. In the strategy, the minimum requirements and objectives for each kind of SWM activity are described.
2) Strategies and Projects Proposed by ISUDP-Mombasa According to the ISUDP Draft Final Report, strategies and projects are proposed as shown in Table 5.3.1.
Table 5.3.1: Strategies and Projects Proposed by ISUDP-Mombasa Strategies Projects
Establish an integrated solid waste management system
Develop an integrated waste management site including landfill site at the Mwakirunge area
Construct a perimeter fence to secure the proposed dumpsite area Construct and pave access roads leading to the proposed dumpsite Gradually close Kibarani dumpsite and develop modern waste treatment/ recycle
facility or recreational site Close the Ujamaa Shonda dumpsite and develop a new site in the special economic
zone (SEZ) Separate treatment for special waste
Develop composting sites for biodegradable waste at subsector level Develop incineration facility in all big hospitals Set up integrated waste management facility after sewerage system is in place Explore the possibility of Public Private Partnership (PPP)
Enhance waste collection and disposal mechanism
Introduction of two bin system for segregation of waste at source Door to door collection system to be established in the long run Recruit more staff for waste collection Provide adequate and accessible skips and dustbins Prepare a county solid waste Management policy
Public awareness campaign Awareness programme for segregation of waste at source and for solid waste management system in general
Eliminate dangers posed by Mwakirunge and Kibarani dumpsites
Plant tree cover on the two sites
Sources: ISUDP Draft Final Report
(2) Legal Framework The Environmental Management Coordination Act (EMCA, 2006) is an act of parliament to provide for the establishment of an appropriate legal and institutional framework for the management of the environment including solid waste management.
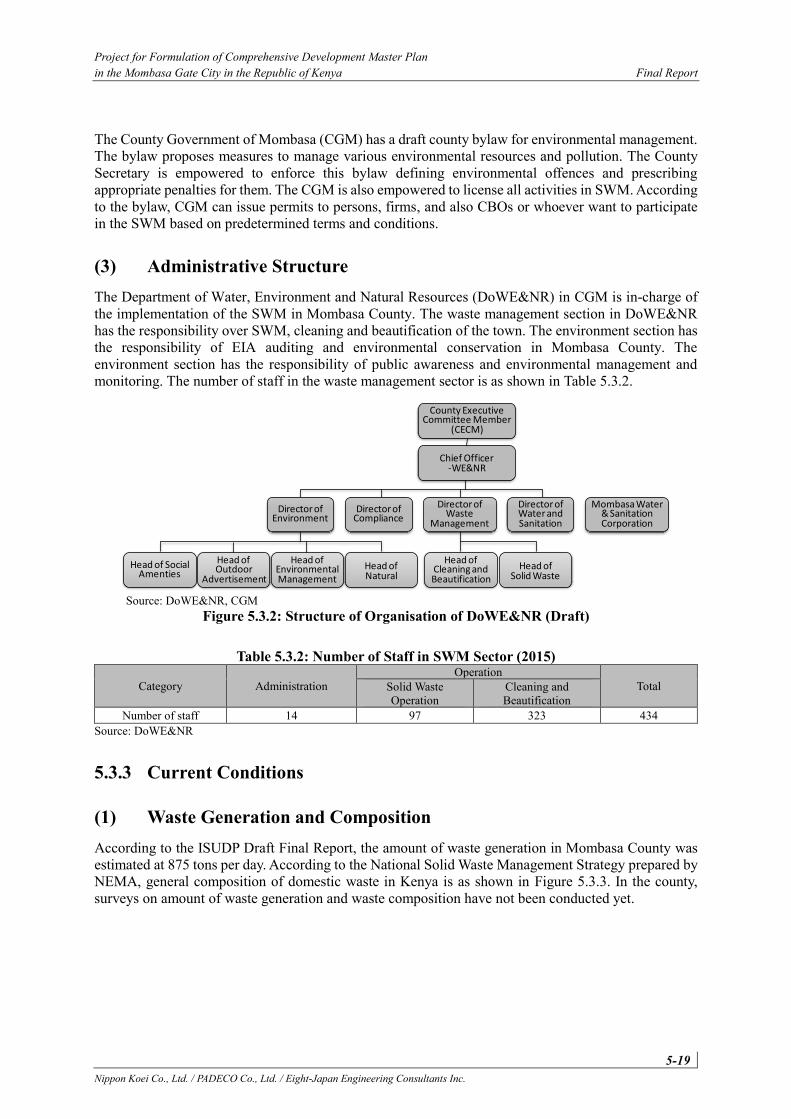
Project for Formulation of Comprehensive Development Master Plan in the Mombasa Gate City in the Republic of Kenya Final Report
5-19 Nippon Koei Co., Ltd. / PADECO Co., Ltd. / Eight-Japan Engineering Consultants Inc.
The County Government of Mombasa (CGM) has a draft county bylaw for environmental management. The bylaw proposes measures to manage various environmental resources and pollution. The County Secretary is empowered to enforce this bylaw defining environmental offences and prescribing appropriate penalties for them. The CGM is also empowered to license all activities in SWM. According to the bylaw, CGM can issue permits to persons, firms, and also CBOs or whoever want to participate in the SWM based on predetermined terms and conditions.
(3) Administrative Structure The Department of Water, Environment and Natural Resources (DoWE&NR) in CGM is in-charge of the implementation of the SWM in Mombasa County. The waste management section in DoWE&NR has the responsibility over SWM, cleaning and beautification of the town. The environment section has the responsibility of EIA auditing and environmental conservation in Mombasa County. The environment section has the responsibility of public awareness and environmental management and monitoring. The number of staff in the waste management sector is as shown in Table 5.3.2.
Source: DoWE&NR, CGM
Figure 5.3.2: Structure of Organisation of DoWE&NR (Draft)
Table 5.3.2: Number of Staff in SWM Sector (2015)
Category Administration Operation
Total Solid Waste Operation
Cleaning and Beautification
Number of staff 14 97 323 434 Source: DoWE&NR
5.3.3 Current Conditions
(1) Waste Generation and Composition According to the ISUDP Draft Final Report, the amount of waste generation in Mombasa County was estimated at 875 tons per day. According to the National Solid Waste Management Strategy prepared by NEMA, general composition of domestic waste in Kenya is as shown in Figure 5.3.3. In the county, surveys on amount of waste generation and waste composition have not been conducted yet.
County ExecutiveCommittee Member
(CECM)
Chief Officer -WE&NR
Director of Environment
Director of Compliance
Director of Water and Sanitation
Director of Waste
Management
Mombasa Water & Sanitation Corporation
Head of Cleaning and Beautification
Head of Solid Waste
Head of SocialAmenties
Head of Outdoor
Advertisement
Head of Environmental Management
Head of Natural
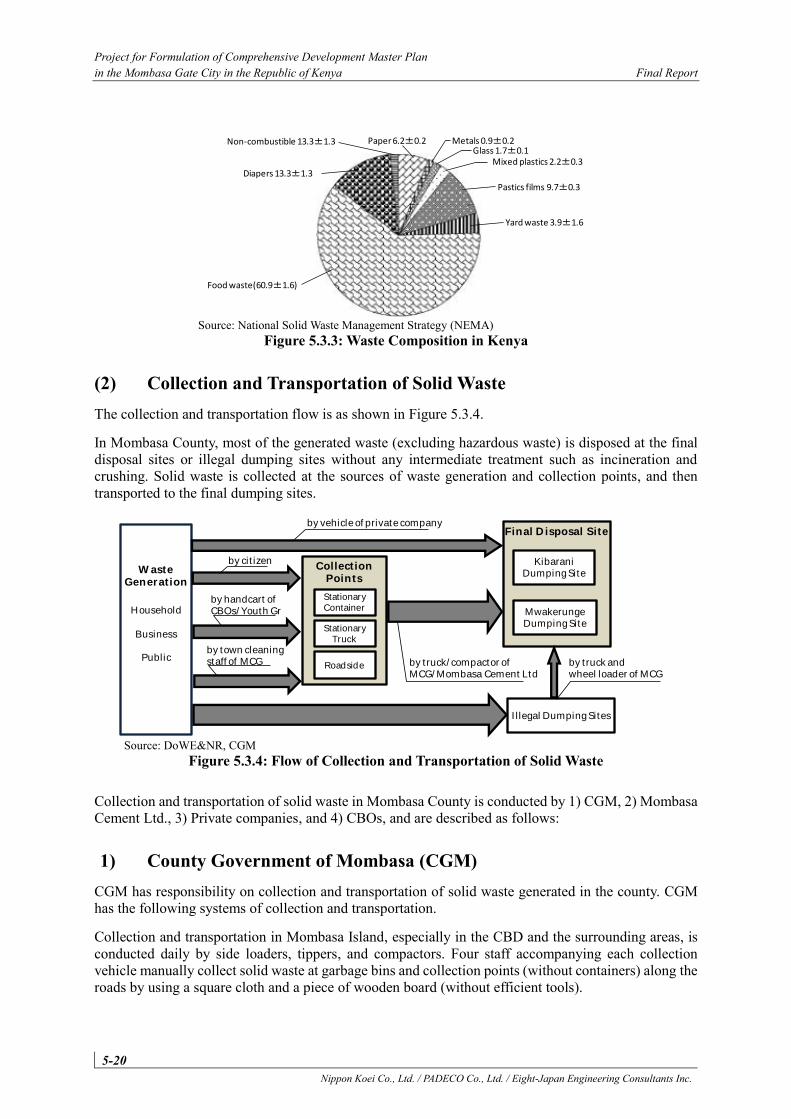
Project for Formulation of Comprehensive Development Master Plan in the Mombasa Gate City in the Republic of Kenya Final Report
5-20 Nippon Koei Co., Ltd. / PADECO Co., Ltd. / Eight-Japan Engineering Consultants Inc.
Source: National Solid Waste Management Strategy (NEMA)
Figure 5.3.3: Waste Composition in Kenya
(2) Collection and Transportation of Solid Waste The collection and transportation flow is as shown in Figure 5.3.4.
In Mombasa County, most of the generated waste (excluding hazardous waste) is disposed at the final disposal sites or illegal dumping sites without any intermediate treatment such as incineration and crushing. Solid waste is collected at the sources of waste generation and collection points, and then transported to the final dumping sites.
Source: DoWE&NR, CGM
Figure 5.3.4: Flow of Collection and Transportation of Solid Waste
Collection and transportation of solid waste in Mombasa County is conducted by 1) CGM, 2) Mombasa Cement Ltd., 3) Private companies, and 4) CBOs, and are described as follows:
1) County Government of Mombasa (CGM) CGM has responsibility on collection and transportation of solid waste generated in the county. CGM has the following systems of collection and transportation.
Collection and transportation in Mombasa Island, especially in the CBD and the surrounding areas, is conducted daily by side loaders, tippers, and compactors. Four staff accompanying each collection vehicle manually collect solid waste at garbage bins and collection points (without containers) along the roads by using a square cloth and a piece of wooden board (without efficient tools).
Paper 6.2±0.2 Metals 0.9±0.2Glass 1.7±0.1
Mixed plastics 2.2±0.3
Pastics films 9.7±0.3
Yard waste 3.9±1.6
Food waste(60.9±1.6)
Diapers 13.3±1.3
Non-combustible 13.3±1.3
Final Disposal Site
Waste Generation
Household
Business
Public
Collection Points
Stationary Truck
Roadside
Kibarani Dumping Site
MwakerungeDumping Site
Stationary Container
Illegal Dumping Sites
by vehicle of private company
by truck andwheel loader of MCG
by truck/compactor of MCG/Mombasa Cement Ltd
by citizen
by handcart of CBOs/Youth Gr
by town cleaning staff of MCG
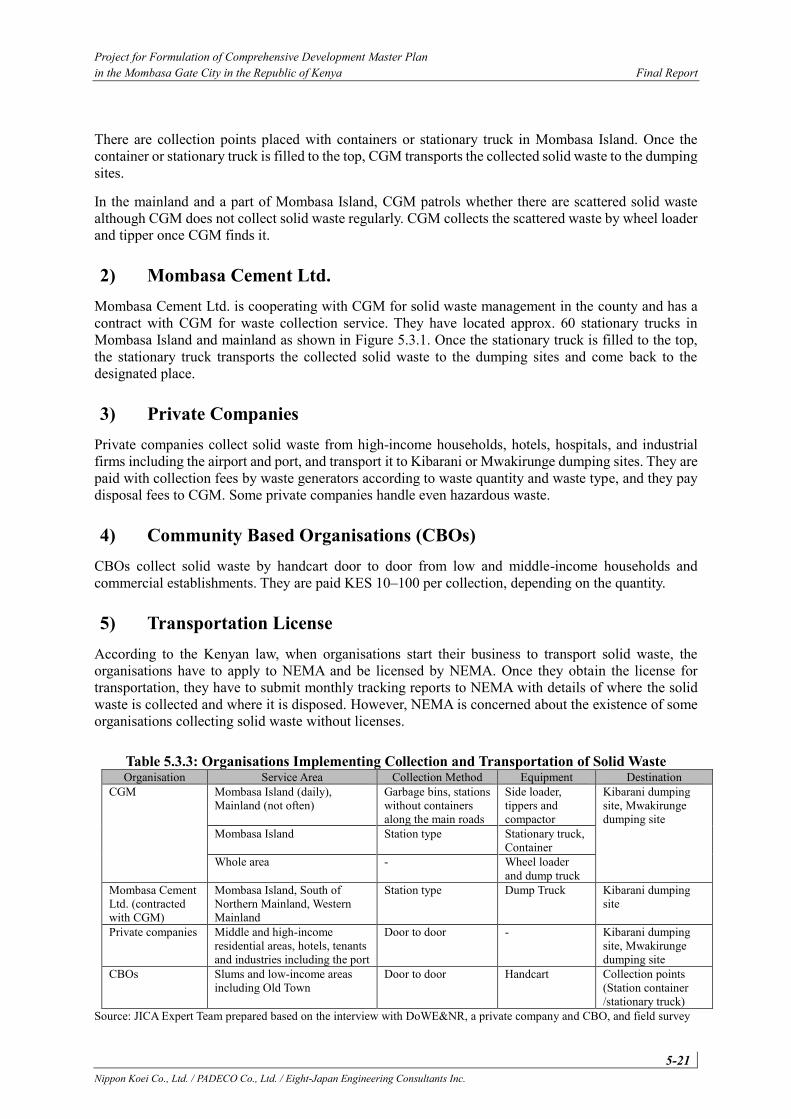
Project for Formulation of Comprehensive Development Master Plan in the Mombasa Gate City in the Republic of Kenya Final Report
5-21 Nippon Koei Co., Ltd. / PADECO Co., Ltd. / Eight-Japan Engineering Consultants Inc.
There are collection points placed with containers or stationary truck in Mombasa Island. Once the container or stationary truck is filled to the top, CGM transports the collected solid waste to the dumping sites.
In the mainland and a part of Mombasa Island, CGM patrols whether there are scattered solid waste although CGM does not collect solid waste regularly. CGM collects the scattered waste by wheel loader and tipper once CGM finds it.
2) Mombasa Cement Ltd. Mombasa Cement Ltd. is cooperating with CGM for solid waste management in the county and has a contract with CGM for waste collection service. They have located approx. 60 stationary trucks in Mombasa Island and mainland as shown in Figure 5.3.1. Once the stationary truck is filled to the top, the stationary truck transports the collected solid waste to the dumping sites and come back to the designated place.
3) Private Companies Private companies collect solid waste from high-income households, hotels, hospitals, and industrial firms including the airport and port, and transport it to Kibarani or Mwakirunge dumping sites. They are paid with collection fees by waste generators according to waste quantity and waste type, and they pay disposal fees to CGM. Some private companies handle even hazardous waste.
4) Community Based Organisations (CBOs) CBOs collect solid waste by handcart door to door from low and middle-income households and commercial establishments. They are paid KES 10–100 per collection, depending on the quantity.
5) Transportation License According to the Kenyan law, when organisations start their business to transport solid waste, the organisations have to apply to NEMA and be licensed by NEMA. Once they obtain the license for transportation, they have to submit monthly tracking reports to NEMA with details of where the solid waste is collected and where it is disposed. However, NEMA is concerned about the existence of some organisations collecting solid waste without licenses.
Table 5.3.3: Organisations Implementing Collection and Transportation of Solid Waste Organisation Service Area Collection Method Equipment Destination
CGM Mombasa Island (daily), Mainland (not often)
Garbage bins, stations without containers along the main roads
Side loader, tippers and compactor
Kibarani dumping site, Mwakirunge dumping site
Mombasa Island Station type Stationary truck, Container
Whole area - Wheel loader and dump truck
Mombasa Cement Ltd. (contracted with CGM)
Mombasa Island, South of Northern Mainland, Western Mainland
Station type Dump Truck Kibarani dumping site
Private companies Middle and high-income residential areas, hotels, tenants and industries including the port
Door to door - Kibarani dumping site, Mwakirunge dumping site
CBOs Slums and low-income areas including Old Town
Door to door Handcart Collection points (Station container /stationary truck)
Source: JICA Expert Team prepared based on the interview with DoWE&NR, a private company and CBO, and field survey
Project for Formulation of Comprehensive Development Master Plan in the Mombasa Gate City in the Republic of Kenya Final Report
5-22 Nippon Koei Co., Ltd. / PADECO Co., Ltd. / Eight-Japan Engineering Consultants Inc.
Table 5.3.4: Number of Waste Collection Vehicles Organisation Types of Vehicles Number of Vehicles Remarks
CGM
Dump truck 13 More than half of the 32 vehicles are not working due to defects, whilest some are being repaired.
Compactor 4 Side loader 8
Skipper truck1 5 Stationary truck 4
Total 32 Mombasa Cement Ltd. (contracted with CGM) Stationary truck 59 Approx. 30 % of the trucks are
being repaired. Private companies - 57 -
Total 150 - Note: 1) A kind of collection vehicles to pick up a waste collection container filled with solid waste and transport the
container to final disposal sites. Source: DoWE&NR and NEMA
CGM is not keeping record of quantity of the collected solid waste because CGM does not have a truck scale at each dumping site. However, CGM is keeping record of the number of trips of collection vehicle and estimated amount of collected solid waste based on the number of trips and capacities of waste collection trucks. The amount of collected solid waste is shown in Table 5.3.5. According to ISUDP-Mombasa, approximately 460 t (53%) of the total solid waste generated is formally managed whilest the rest (47%) is informally disposed through methods such as burning, burying, and illegal dumping which poses high potential risks to environmental pollution.
Table 5.3.5: Solid Waste Collected and Transported to Dumping Sites Organisations Solid Waste Collected and Transported to Dumping Sites Final Disposal Sites (t/year) (t/day)
CGM 113,908 311 Kibarani, Mwakirunge, and Likoni Shondaduming sites
Mombasa Cement Ltd. (contracted with CGM) 129,585 11 Kibarani and Mwakirunge,
dumping sites Private companies 4,195 355 Mwakirunge dumping site
Note: 1) The above amount was calculated based on the number of trips and capacities of waste collection trucks. Source: DoWE&NR
(3) Final Disposal of Waste There are two dumping sites in Kibarani and Mwakirunge, which CGM operates. There is also a dumping site in Shonda, which CGM does not operate, and many illegal dumping sites at roadsides and empty lands. Outlines of the dumping sites in Kibarani, Mwakirunge, and Shonda are as shown in Table 5.3.6.
Table 5.3.6: Dumping Sites Operated by CGM Name of
Dumping Site
Location/Distance from Mombasa
Island
Area of Accumulated
Solid Waste (ha) Period of Use Control and Record of Access
Kibarani dumping site Changamwe/3 km 10
Over 50 years (still operated)
Staff from CGM monitor the site anytime. Number of access of collection vehicles is
being recorded. Private trucks are not allowed to access.
Mwakirunge dumping site Mwakirunge/13 km 10 2006-now
Staffs from CGM monitor the site anytime. Number of access of collection vehicles is
being recorded. Private trucks are allowed to access.
Shonda dumping site Likoni/7 km 5 1990s-now No staff from CGM monitors the site.
Source: JICA Expert Team prepared based on interview with DoWE&NR and field study
Project for Formulation of Comprehensive Development Master Plan in the Mombasa Gate City in the Republic of Kenya Final Report
5-23 Nippon Koei Co., Ltd. / PADECO Co., Ltd. / Eight-Japan Engineering Consultants Inc.
Amount of solid waste transferred to Kibarani and Mwakirunge dumping sites have been estimated as shown in Table 5.3.4 based on the number of trips and capacities of waste collection trucks. The amount includes sorted materials after unloading at the dumping site and exclude solid waste disposed by private companies which do not have a contract with CGM.
1) Industrial Waste The quantity of generated industrial waste is not monitored. Industrial waste is mostly collected and transported to the dumping sites by private companies. Some kinds of industrial waste are recycled or reused and are as follows:
Waste oil are reused as fuel for incinerators in the county or recycled to oil. A private company is applying a license to collect electric waste (E-Waste). There is a recycling
facility for E-Waste in Nairobi. Scrap tires are recycled to oil.
2) Hazardous Waste Hazardous waste such as hospital waste and condemned goods from the port is mostly disposed at incinerators. There are four incinerators in Mombasa County. However, some hospital wastes were disposed at dumping sites. According to NEMA, the total capacity of the four incinerators is not sufficient to dispose all the hazardous waste generated in Mombasa County.
(4) 3R Activities CGM has not implemented any 3R activity yet. Private companies, CBOs, and waste pickers are sorting after collection of solid waste or after unloading at dumping sites. Sorted recyclables consist mainly of polyethylene terephthalate (PET) bottles, plastics, metals, and cartons. The sorted recyclables are transported to recyclers directly or through junk shops. Some categories of recyclable are even transported to Nairobi.
(5) Financial Aspects DoWE&NR recorded KES 575 million as annual revenue and KES 673 million as annual expenditure in 2014-2015. There is a negative gap of KES 98 million between revenue and expenditure. Although the revenue related to SMW sector is known, the expenditure in SMW sector is not known specifically.
5.3.4 Analysis of Operation and Maintenance
(1) Overall Solid Waste Management A master plan for Solid Waste Management in Municipal Council of Mombasa was prepared by AFD in 2006. However, the master plan seems not to have been implemented. CGM has not conducted a waste quantity survey yet in order to reliably estimate the amount of waste generation and CGM has not monitored quantities of disposed and recycled solid waste although they have monitored only a number of trips of collection vehicles disposed at the dumping sites.
SWM plan including development of waste disposal facilities and waste collection/transportation system cannot be prepared without accurate quantities of waste generation. Hereafter, the JICA Expert Team will estimate quantities of waste generation more accurately and develop plans to install waste disposal facilities and recycling plants based on the estimated quantities.
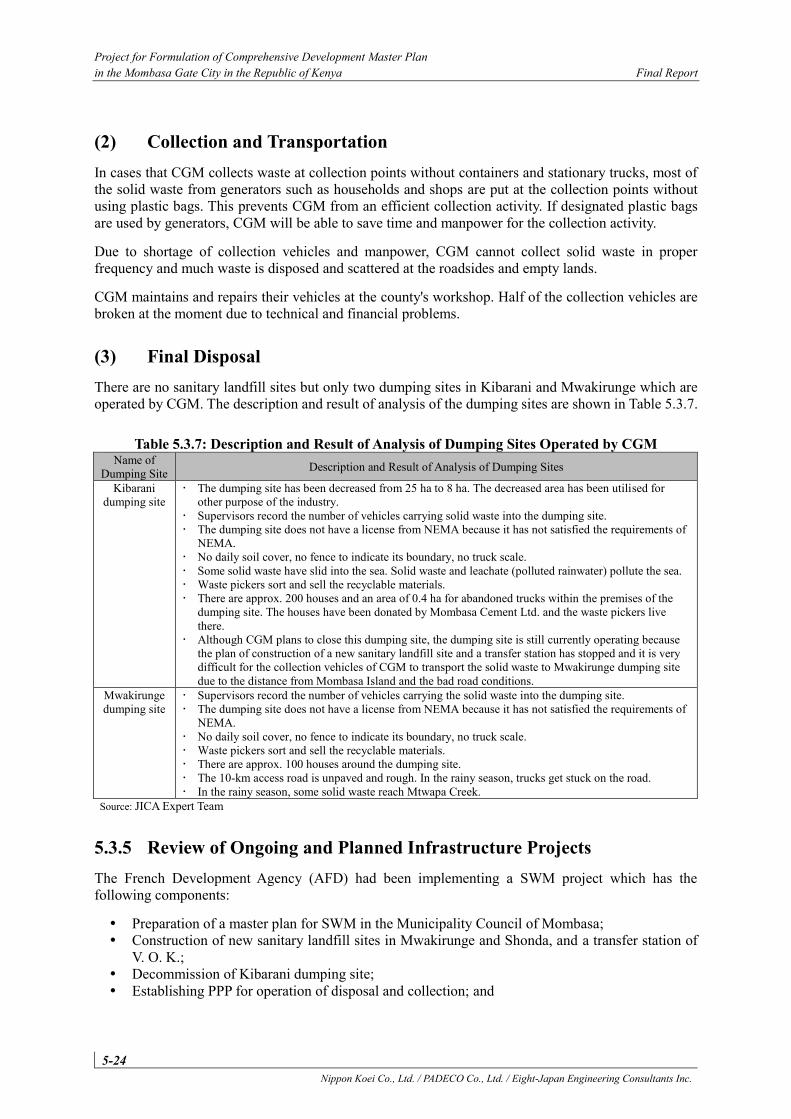
Project for Formulation of Comprehensive Development Master Plan in the Mombasa Gate City in the Republic of Kenya Final Report
5-24 Nippon Koei Co., Ltd. / PADECO Co., Ltd. / Eight-Japan Engineering Consultants Inc.
(2) Collection and Transportation In cases that CGM collects waste at collection points without containers and stationary trucks, most of the solid waste from generators such as households and shops are put at the collection points without using plastic bags. This prevents CGM from an efficient collection activity. If designated plastic bags are used by generators, CGM will be able to save time and manpower for the collection activity.
Due to shortage of collection vehicles and manpower, CGM cannot collect solid waste in proper frequency and much waste is disposed and scattered at the roadsides and empty lands.
CGM maintains and repairs their vehicles at the county's workshop. Half of the collection vehicles are broken at the moment due to technical and financial problems.
(3) Final Disposal There are no sanitary landfill sites but only two dumping sites in Kibarani and Mwakirunge which are operated by CGM. The description and result of analysis of the dumping sites are shown in Table 5.3.7.
Table 5.3.7: Description and Result of Analysis of Dumping Sites Operated by CGM Name of
Dumping Site Description and Result of Analysis of Dumping Sites
Kibarani dumping site
The dumping site has been decreased from 25 ha to 8 ha. The decreased area has been utilised for other purpose of the industry.
Supervisors record the number of vehicles carrying solid waste into the dumping site. The dumping site does not have a license from NEMA because it has not satisfied the requirements of
NEMA. No daily soil cover, no fence to indicate its boundary, no truck scale. Some solid waste have slid into the sea. Solid waste and leachate (polluted rainwater) pollute the sea. Waste pickers sort and sell the recyclable materials. There are approx. 200 houses and an area of 0.4 ha for abandoned trucks within the premises of the
dumping site. The houses have been donated by Mombasa Cement Ltd. and the waste pickers live there.
Although CGM plans to close this dumping site, the dumping site is still currently operating because the plan of construction of a new sanitary landfill site and a transfer station has stopped and it is very difficult for the collection vehicles of CGM to transport the solid waste to Mwakirunge dumping site due to the distance from Mombasa Island and the bad road conditions.
Mwakirunge dumping site
Supervisors record the number of vehicles carrying the solid waste into the dumping site. The dumping site does not have a license from NEMA because it has not satisfied the requirements of
NEMA. No daily soil cover, no fence to indicate its boundary, no truck scale. Waste pickers sort and sell the recyclable materials. There are approx. 100 houses around the dumping site. The 10-km access road is unpaved and rough. In the rainy season, trucks get stuck on the road. In the rainy season, some solid waste reach Mtwapa Creek.
Source: JICA Expert Team
5.3.5 Review of Ongoing and Planned Infrastructure Projects The French Development Agency (AFD) had been implementing a SWM project which has the following components:
Preparation of a master plan for SWM in the Municipality Council of Mombasa; Construction of new sanitary landfill sites in Mwakirunge and Shonda, and a transfer station of
V. O. K.; Decommission of Kibarani dumping site; Establishing PPP for operation of disposal and collection; and
Project for Formulation of Comprehensive Development Master Plan in the Mombasa Gate City in the Republic of Kenya Final Report
5-25 Nippon Koei Co., Ltd. / PADECO Co., Ltd. / Eight-Japan Engineering Consultants Inc.
Establishing and training of project implementation unit (PIU) and public awareness programmes and others.
However, since civil aviation's concern on “bird strike” made an objection against the construction of the sanitary landfill sites near the Moi International Airport, the project has been stopped. Although there are official dumping sites near the airport even now. AFD seems to have a plan to restart the SWM project from feasibility study.
5.3.6 Development Issues, Constraints, and Directions The following issues and causes are identified through the field survey and interview with DoWE&NR. The directions for the identified issues and causes are proposed and will be considered concretely in the planning stage.
a) Development of master plan for solid waste management: A Master Plan for Solid Waste Management in Municipal Council of Mombasa was prepared by AFD in 2004. However, the master plan seems not to have been implemented because the construction plan of the new sanitary landfill sites was abandoned. It is necessary for CGM to estimate accurately the amount of waste generation in the future and to develop a SWM master plan including the construction of waste disposal facilities and recycling plant and waste collection and transportation system based on the estimated amount.
b) Improvement of waste collection and transportation system including maintenance of collection vehicles: Waste collection system does not cover the whole area of the county, especially the mainland of Mombasa County, partly because of inefficient waste collection system and lack of vehicles. Consequently, there are scattered waste at the roadsides and empty lands in the mainland of Mombasa County. It is necessary for CGM to introduce efficient collection system, new collection vehicles, and develop the capacity of maintenance staff for solid waste collection.
c) Construction of new sanitary landfill site and safe closure of existing dumping sites: There are only dumping sites and no sanitary landfill sites in the county, and the dumping sites are not managed properly. Consequently, the dumping sites have polluted the sea and other environments. It is necessary for CGM to URGENTLY construct sanitary landfill sites at proper locations which have enough capacity for the landfill waste and facilities to prevent polluting the environment, and then close the existing dumping sites to minimise the environmental pollution. In addition, it is also needed to develop the capacity of CGM to operate and maintain the sanitary landfill sites properly. However, there is a critical issue on the construction of the new sanitary landfill sites. As mentioned above, due to the civil aviation’s concern on “bird strike”, they have objected the construction of the sanitary landfill sites within the 13-km radius from the Moi International Airport. According to ISUDP Draft Final Report, it was proposed that a new landfill site would be located 3.5 km from the west of the Mwakirunge dumping site, and this proposed location is located within the 13-km radius. Therefore, it is necessary to consider the location of the sanitary landfill sites. In the case that the new sanitary landfill sites cannot be constructed urgently and the existing dumping sites have to be utilised continuously due to the abovementioned issue, tentative rehabilitation of the dumping sites for environmental protection has to be considered to allow its continuous utilisation.
d) Improvement of disposal system of industrial waste: The quantities of generated and collected industrial waste have not been monitored by any organisation. On the other hand, according to SEZ project, it was estimated that 768 t per day of solid waste will be generated at the SEZ. Such large quantity of solid waste makes a huge impact to the SWM in the county. It is necessary for CGM to estimate the quantity of industrial waste and consider proper disposal system for the industrial waste together with NEMA, including whether CGM will also manage the solid waste generated at the SEZ.
Project for Formulation of Comprehensive Development Master Plan in the Mombasa Gate City in the Republic of Kenya Final Report
5-26 Nippon Koei Co., Ltd. / PADECO Co., Ltd. / Eight-Japan Engineering Consultants Inc.
e) Improvement of disposal system of hazardous waste: There is no sufficient capacity of incinerators for the disposal of hazardous waste, and some hazardous waste are disposed directly at the dumping sites. It is necessary for CGM to introduce another incinerator and supervision system of proper disposal of hazardous waste. In addition, it is also necessary to introduce tentative alternative disposal system for the hazardous waste such as landfilling at designated places.
f) Promotion of 3R activity: CGM has not conducted any 3R activities and does not have any recycling facilities. Although, some private companies, CBOs and waste pickers are collecting and selling recyclables to recyclers. As population and standard of living of citizens in the county increase, amount of waste generation will increase rapidly. In order to extend the lifespan of the landfill sites, the amount of solid waste disposed at landfill sites has to be reduced through the 3R activities. Therefore, it is necessary for CGM to introduce recycling facilities and suitable recyclable collection system.
5.4 Power Supply
5.4.1 Overview The power sector is guided by the Sessional Paper No. 4 of 2004, which was formulated by the Ministry of Energy and Petroleum (MoEP) and Energy Regulatory Commission (ERC).
As of 2015, power generation in Kenya with the combined installed capacity is 2,299 MW with 64% of it coming from renewable energy sources and 36% from fossil fuels. The current peak demand in Kenya is 1,570 MW.
In Mombasa County, there are two power plants, namely: Kipevu Power Plant (included: Kipevu I with 75 MW, Kipevu II with 74 MW, Kipevu III with 120 MW) and Rabai Power Plant with 90 MW. The total capacity of the two power plants is 359 MW against the peak demand of Mombasa County which is 166 MW.
Kenya Power is the single off-taker in the power market, buying power from all power generators on the basis of negotiated Power Purchase Agreements (PPA)for onward transmission, distribution and supply to consumers (single seller). Kenya Power is also a system operator in-charge of power dispatch and retailing in Mombasa County. Currently, the distribution network as medium voltage and low voltage is weak by limited redundancy and aging. This leads to increasing voltage loss and considerable power interruption as well. [Although the percentage of population access to electricity in Mombasa County is 75%, the power supply coverage in rural area (subcounties) is low].
5.4.2 Review of Policy, Legal Framework and Administrative Structure
(1) Review of Policy The power sector is guided by the Sessional Paper No. 4 of 2004 which was to lay the policy framework upon cost effective, affordable, adequate and quality energy services that will be made available to the domestic economy on a sustainable basis over the period 2004-2023. The agenda for action in the Sessional Paper includes enactment of a new and robust Energy Act (Energy Act 2006) to create a common energy sector regulator, the ERC.
The Energy Act, No. 12 of 2006 consolidated the Electric Power Act No. 11 of 1997 and the Petroleum Act Cap. 116. The act provided the establishment, powers and functions of the ERC as a successor of the Electricity Regulatory Board (ERB). Currently, the new Energy Bill 2015 is being reviewed by the Commission for the Implementation of the Constitution (CIC) and is awaiting the Kenyan Parliament’s
Project for Formulation of Comprehensive Development Master Plan in the Mombasa Gate City in the Republic of Kenya Final Report
5-27 Nippon Koei Co., Ltd. / PADECO Co., Ltd. / Eight-Japan Engineering Consultants Inc.
discussion. The new Energy Bill proposes the licensing of other electricity distributors and retailers, promising consumers choice and better quality of service.
Besides the principal acts above, there are several other acts and regulations that impact the power sector, including:
The Environmental Management and Co-ordination Act, 1999, which regulates the environmental aspect of the power sector.
The Local Government Act, Chapter 265, 1998, of the Laws of Kenya which grants authority for approval by local authorities of sites for construction and installation of levies for electric power poles and way-leaves charges.
The Physical Planning Act, Chapter 286, 1998, of the Laws of Kenya that provides for the construction of electric power substations and other infrastructure.
The Environment and Land Court Act No. 19 of 2011 that established the Environment and Land Court pursuant to Article 162(2) (b) of the Constitution.
The Kenya Electricity Grid Code is the primary technical document of the Electricity Supply Industry (ESI), collating the majority of the technical regulations covering the generation, transmission, distribution, and supply of electrical energy.
Essentially, the Grid Code is a consolidation of existing standards and practices in the Kenyan ESI and is intended to provide a transparent regulatory framework, in line with the principle of non-discriminatory access to the transmission and distribution systems, and is designed to provide technical specifications and procedures that complement the act.
The Electric Power (Electrical Installation Work) Rules, 2006, published as Legal Notice No.115, Kenya Gazette Supplement No. 60 (Legislative Supplement No. 34) on September 6, 2006 sets out the requirements for the licensing of electricians and electrical contractors. The licensing is administered and approved by ERC’s Electricians’ and Electrical Contractors’ Licensing Panel set up in 2006.
The Energy (Complaints and Dispute Resolution) Regulations, 2012, published as Legal Notice No. 42, Kenya Gazette Supplement No.49 (Legislative Supplement No. 15) on May 25, 2012 provides the means by which the Commission can help resolve complaints and disputes between a licensee and its customers where any party remains dissatisfied after exhausting the licensee's complaints resolution procedures.
The Energy (Electricity Licensing) Regulations, 2012 published as Legal Notice No. 44, Kenya Gazette Supplement No.49 (Legislative Supplement No. 15) on May 25, 2012 sets out the requirements to be fulfilled by any person desiring a license or permit authorising him to carry out any undertaking in the generation, transmission, distribution, or supply of electrical energy in Kenya.
(2) Legal Framework and Administrative Structure The power sector is currently structured as defined in the Energy Act 2006 consisting of distinct policy, regulatory, generation, transmission, and distribution functions. The institutional structure for electricity subsector is as follows:
Ministry of Energy and Petroleum (MoEP) is responsible for establishing the national energy policy and rural electrification plan, setting the direction for the growth of power sector, and making a long-term vision for the sector.
Energy Regulatory Commission (ERC) is responsible for enforcing regulations, licensing power companies, customer protection, approving power purchase agreements and tariff reviews.
Kenya Electricity Generation Company (KenGen) is the largest electricity generation company that is majority owned by the government. Whilest KenGen is a state corporation, Independent Power Producers (IPPs) are basically private sector investments. IPPs currently provide about
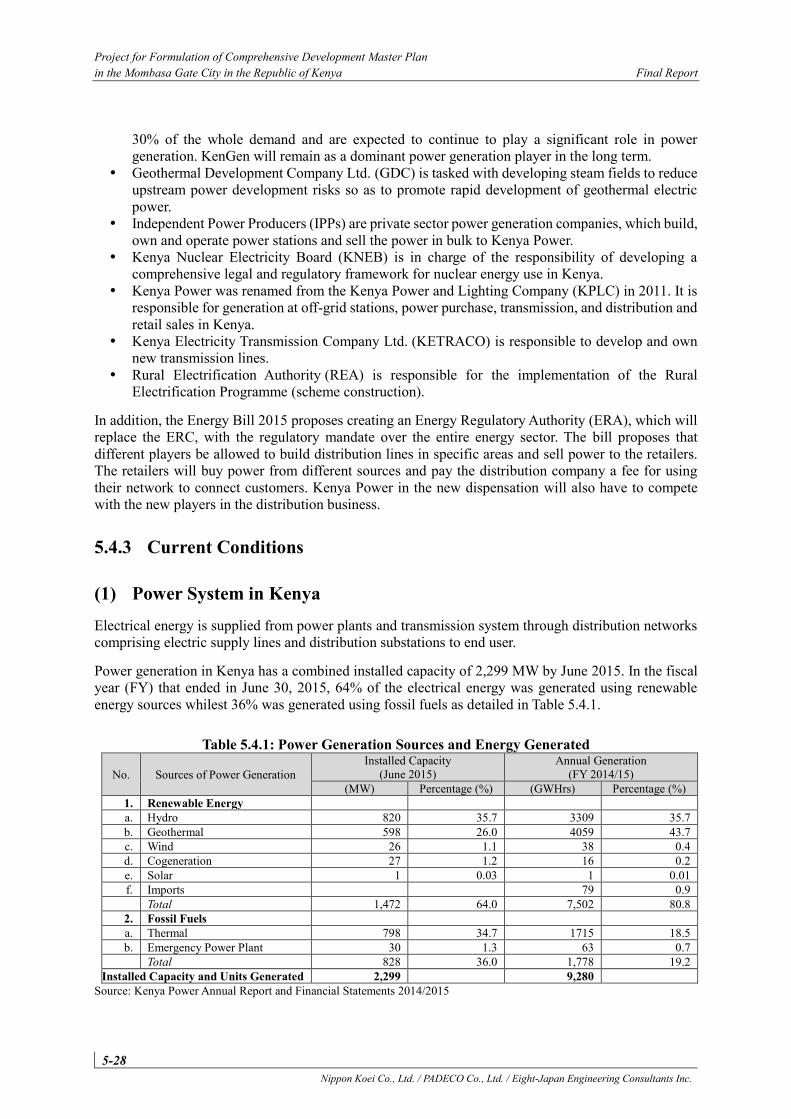
Project for Formulation of Comprehensive Development Master Plan in the Mombasa Gate City in the Republic of Kenya Final Report
5-28 Nippon Koei Co., Ltd. / PADECO Co., Ltd. / Eight-Japan Engineering Consultants Inc.
30% of the whole demand and are expected to continue to play a significant role in power generation. KenGen will remain as a dominant power generation player in the long term.
Geothermal Development Company Ltd. (GDC) is tasked with developing steam fields to reduce upstream power development risks so as to promote rapid development of geothermal electric power.
Independent Power Producers (IPPs) are private sector power generation companies, which build, own and operate power stations and sell the power in bulk to Kenya Power.
Kenya Nuclear Electricity Board (KNEB) is in charge of the responsibility of developing a comprehensive legal and regulatory framework for nuclear energy use in Kenya.
Kenya Power was renamed from the Kenya Power and Lighting Company (KPLC) in 2011. It is responsible for generation at off-grid stations, power purchase, transmission, and distribution and retail sales in Kenya.
Kenya Electricity Transmission Company Ltd. (KETRACO) is responsible to develop and own new transmission lines.
Rural Electrification Authority (REA) is responsible for the implementation of the Rural Electrification Programme (scheme construction).
In addition, the Energy Bill 2015 proposes creating an Energy Regulatory Authority (ERA), which will replace the ERC, with the regulatory mandate over the entire energy sector. The bill proposes that different players be allowed to build distribution lines in specific areas and sell power to the retailers. The retailers will buy power from different sources and pay the distribution company a fee for using their network to connect customers. Kenya Power in the new dispensation will also have to compete with the new players in the distribution business.
5.4.3 Current Conditions
(1) Power System in Kenya Electrical energy is supplied from power plants and transmission system through distribution networks comprising electric supply lines and distribution substations to end user.
Power generation in Kenya has a combined installed capacity of 2,299 MW by June 2015. In the fiscal year (FY) that ended in June 30, 2015, 64% of the electrical energy was generated using renewable energy sources whilest 36% was generated using fossil fuels as detailed in Table 5.4.1.
Table 5.4.1: Power Generation Sources and Energy Generated
No. Sources of Power Generation Installed Capacity
(June 2015) Annual Generation
(FY 2014/15) (MW) Percentage (%) (GWHrs) Percentage (%)
1. Renewable Energy a. Hydro 820 35.7 3309 35.7 b. Geothermal 598 26.0 4059 43.7 c. Wind 26 1.1 38 0.4 d. Cogeneration 27 1.2 16 0.2 e. Solar 1 0.03 1 0.01 f. Imports 79 0.9
Total 1,472 64.0 7,502 80.8 2. Fossil Fuels a. Thermal 798 34.7 1715 18.5 b. Emergency Power Plant 30 1.3 63 0.7
Total 828 36.0 1,778 19.2 Installed Capacity and Units Generated 2,299 9,280
Source: Kenya Power Annual Report and Financial Statements 2014/2015
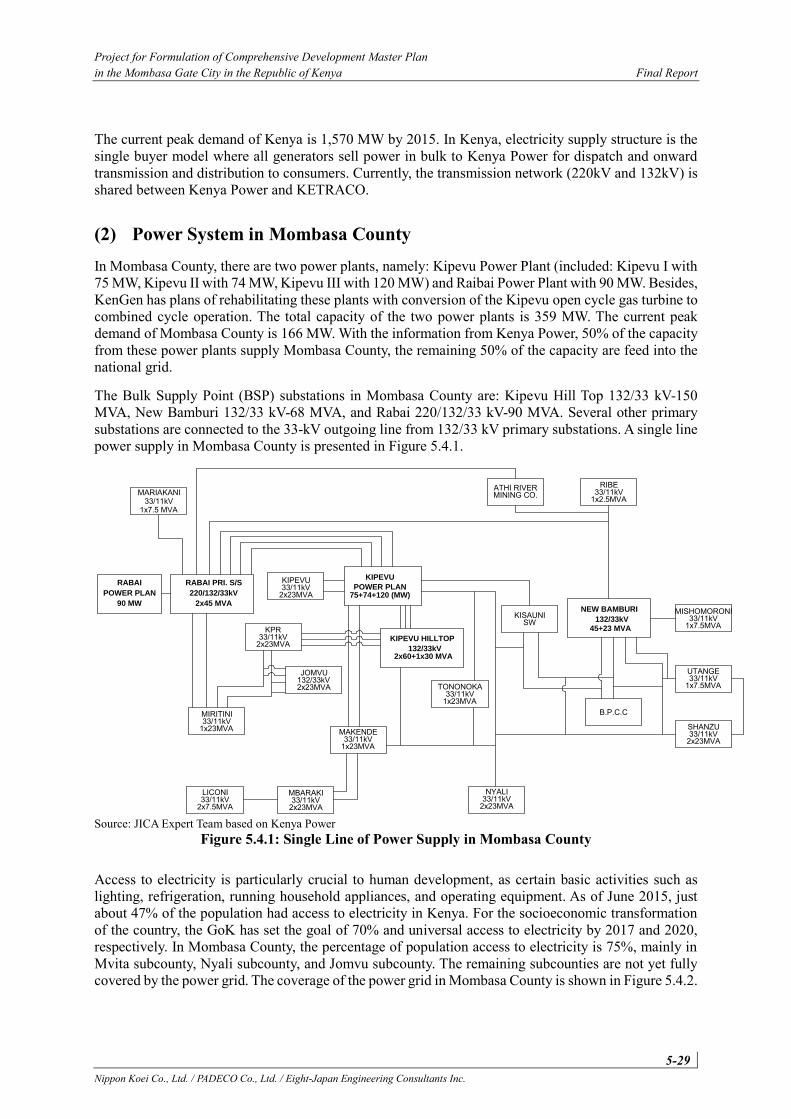
Project for Formulation of Comprehensive Development Master Plan in the Mombasa Gate City in the Republic of Kenya Final Report
5-29 Nippon Koei Co., Ltd. / PADECO Co., Ltd. / Eight-Japan Engineering Consultants Inc.
The current peak demand of Kenya is 1,570 MW by 2015. In Kenya, electricity supply structure is the single buyer model where all generators sell power in bulk to Kenya Power for dispatch and onward transmission and distribution to consumers. Currently, the transmission network (220kV and 132kV) is shared between Kenya Power and KETRACO.
(2) Power System in Mombasa County In Mombasa County, there are two power plants, namely: Kipevu Power Plant (included: Kipevu I with 75 MW, Kipevu II with 74 MW, Kipevu III with 120 MW) and Raibai Power Plant with 90 MW. Besides, KenGen has plans of rehabilitating these plants with conversion of the Kipevu open cycle gas turbine to combined cycle operation. The total capacity of the two power plants is 359 MW. The current peak demand of Mombasa County is 166 MW. With the information from Kenya Power, 50% of the capacity from these power plants supply Mombasa County, the remaining 50% of the capacity are feed into the national grid.
The Bulk Supply Point (BSP) substations in Mombasa County are: Kipevu Hill Top 132/33 kV-150 MVA, New Bamburi 132/33 kV-68 MVA, and Rabai 220/132/33 kV-90 MVA. Several other primary substations are connected to the 33-kV outgoing line from 132/33 kV primary substations. A single line power supply in Mombasa County is presented in Figure 5.4.1.
Source: JICA Expert Team based on Kenya Power
Figure 5.4.1: Single Line of Power Supply in Mombasa County
Access to electricity is particularly crucial to human development, as certain basic activities such as lighting, refrigeration, running household appliances, and operating equipment. As of June 2015, just about 47% of the population had access to electricity in Kenya. For the socioeconomic transformation of the country, the GoK has set the goal of 70% and universal access to electricity by 2017 and 2020, respectively. In Mombasa County, the percentage of population access to electricity is 75%, mainly in Mvita subcounty, Nyali subcounty, and Jomvu subcounty. The remaining subcounties are not yet fully covered by the power grid. The coverage of the power grid in Mombasa County is shown in Figure 5.4.2.
220/132/33kV
2x45 MVA
33/11kV1x7.5 MVA
ATHI RIVERMINING CO. 33/11kV
1x2.5MVA
NEW BAMBURI
132/33kV 33/11kV1x7.5MVA
KIPEVU
33/11kV2x23MVA
33/11kV2x23MVA
45+23 MVA
33/11kV1x23MVA
132/33kV2x23MVA
33/11kV1x23MVA
KIPEVU HILLTOP
132/33kV2x60+1x30 MVA
33/11kV2x23MVA
33/11kV2x7.5MVA 2x23MVA
33/11kV1x23MVA
KISAUNISW
RABAI PRI. S/S
33/11kV1x7.5MVA
33/11kV2x23MVA
B.P.C.C
POWER PLAN
MARIAKANIRIBE
MISHOMORONI
UTANGE
SHANZU
33/11kVNYALIMBARAKILICONI
MIRITINI
JOMVU
KPR
KIPEVU
MAKENDE
TONONOKA
75+74+120 (MW)POWER PLAN
90 MW
RABAI
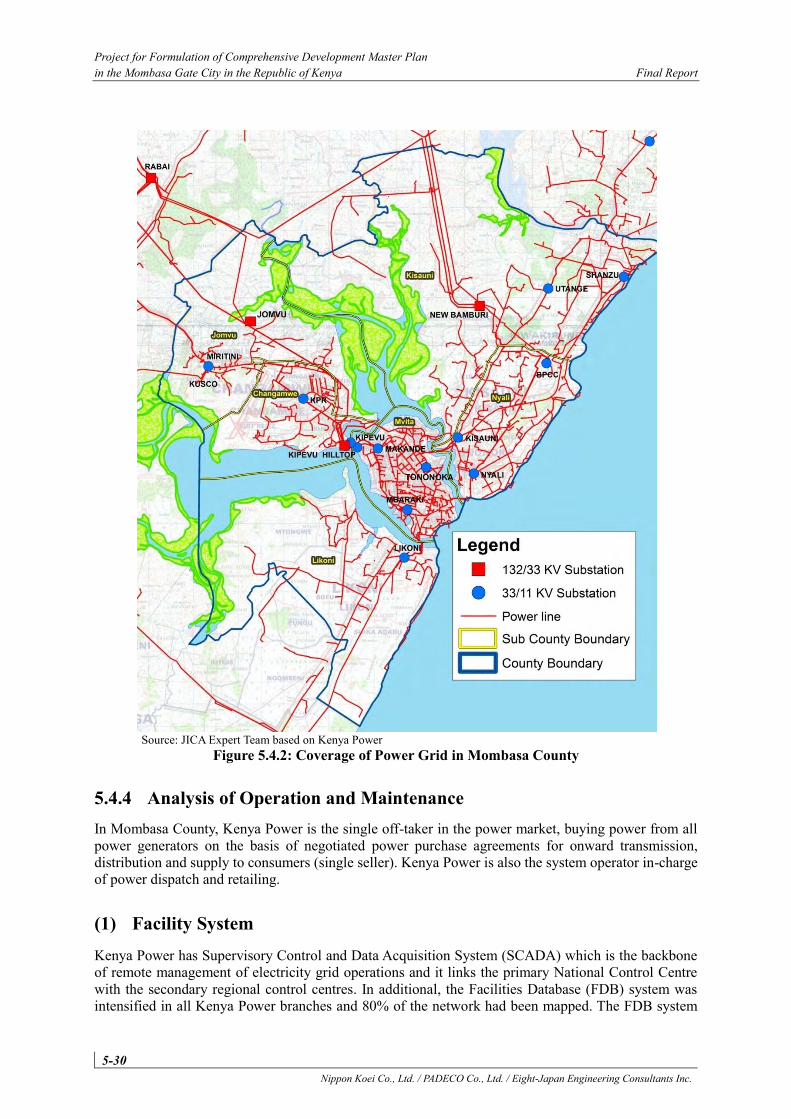
Project for Formulation of Comprehensive Development Master Plan in the Mombasa Gate City in the Republic of Kenya Final Report
5-30 Nippon Koei Co., Ltd. / PADECO Co., Ltd. / Eight-Japan Engineering Consultants Inc.
Source: JICA Expert Team based on Kenya Power
Figure 5.4.2: Coverage of Power Grid in Mombasa County
5.4.4 Analysis of Operation and Maintenance In Mombasa County, Kenya Power is the single off-taker in the power market, buying power from all power generators on the basis of negotiated power purchase agreements for onward transmission, distribution and supply to consumers (single seller). Kenya Power is also the system operator in-charge of power dispatch and retailing.
(1) Facility System Kenya Power has Supervisory Control and Data Acquisition System (SCADA) which is the backbone of remote management of electricity grid operations and it links the primary National Control Centre with the secondary regional control centres. In additional, the Facilities Database (FDB) system was intensified in all Kenya Power branches and 80% of the network had been mapped. The FDB system
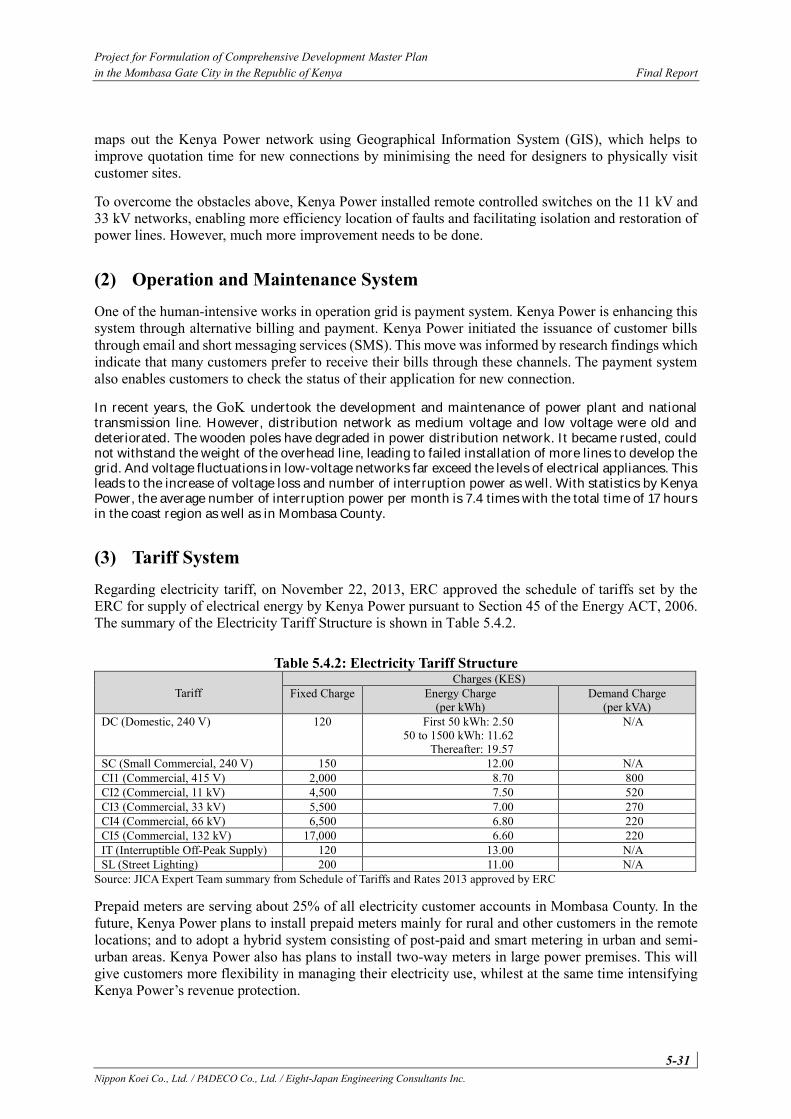
Project for Formulation of Comprehensive Development Master Plan in the Mombasa Gate City in the Republic of Kenya Final Report
5-31 Nippon Koei Co., Ltd. / PADECO Co., Ltd. / Eight-Japan Engineering Consultants Inc.
maps out the Kenya Power network using Geographical Information System (GIS), which helps to improve quotation time for new connections by minimising the need for designers to physically visit customer sites.
To overcome the obstacles above, Kenya Power installed remote controlled switches on the 11 kV and 33 kV networks, enabling more efficiency location of faults and facilitating isolation and restoration of power lines. However, much more improvement needs to be done.
(2) Operation and Maintenance System One of the human-intensive works in operation grid is payment system. Kenya Power is enhancing this system through alternative billing and payment. Kenya Power initiated the issuance of customer bills through email and short messaging services (SMS). This move was informed by research findings which indicate that many customers prefer to receive their bills through these channels. The payment system also enables customers to check the status of their application for new connection.
In recent years, the GoK undertook the development and maintenance of power plant and national transmission line. However, distribution network as medium voltage and low voltage were old and deteriorated. The wooden poles have degraded in power distribution network. It became rusted, could not withstand the weight of the overhead line, leading to failed installation of more lines to develop the grid. And voltage fluctuations in low-voltage networks far exceed the levels of electrical appliances. This leads to the increase of voltage loss and number of interruption power as well. With statistics by Kenya Power, the average number of interruption power per month is 7.4 times with the total time of 17 hours in the coast region as well as in Mombasa County.
(3) Tariff System Regarding electricity tariff, on November 22, 2013, ERC approved the schedule of tariffs set by the ERC for supply of electrical energy by Kenya Power pursuant to Section 45 of the Energy ACT, 2006. The summary of the Electricity Tariff Structure is shown in Table 5.4.2.
Table 5.4.2: Electricity Tariff Structure
Tariff Charges (KES)
Fixed Charge Energy Charge (per kWh)
Demand Charge (per kVA)
DC (Domestic, 240 V) 120 First 50 kWh: 2.50 50 to 1500 kWh: 11.62
Thereafter: 19.57
N/A
SC (Small Commercial, 240 V) 150 12.00 N/A CI1 (Commercial, 415 V) 2,000 8.70 800 CI2 (Commercial, 11 kV) 4,500 7.50 520 CI3 (Commercial, 33 kV) 5,500 7.00 270 CI4 (Commercial, 66 kV) 6,500 6.80 220 CI5 (Commercial, 132 kV) 17,000 6.60 220 IT (Interruptible Off-Peak Supply) 120 13.00 N/A SL (Street Lighting) 200 11.00 N/A
Source: JICA Expert Team summary from Schedule of Tariffs and Rates 2013 approved by ERC
Prepaid meters are serving about 25% of all electricity customer accounts in Mombasa County. In the future, Kenya Power plans to install prepaid meters mainly for rural and other customers in the remote locations; and to adopt a hybrid system consisting of post-paid and smart metering in urban and semi-urban areas. Kenya Power also has plans to install two-way meters in large power premises. This will give customers more flexibility in managing their electricity use, whilest at the same time intensifying Kenya Power’s revenue protection.
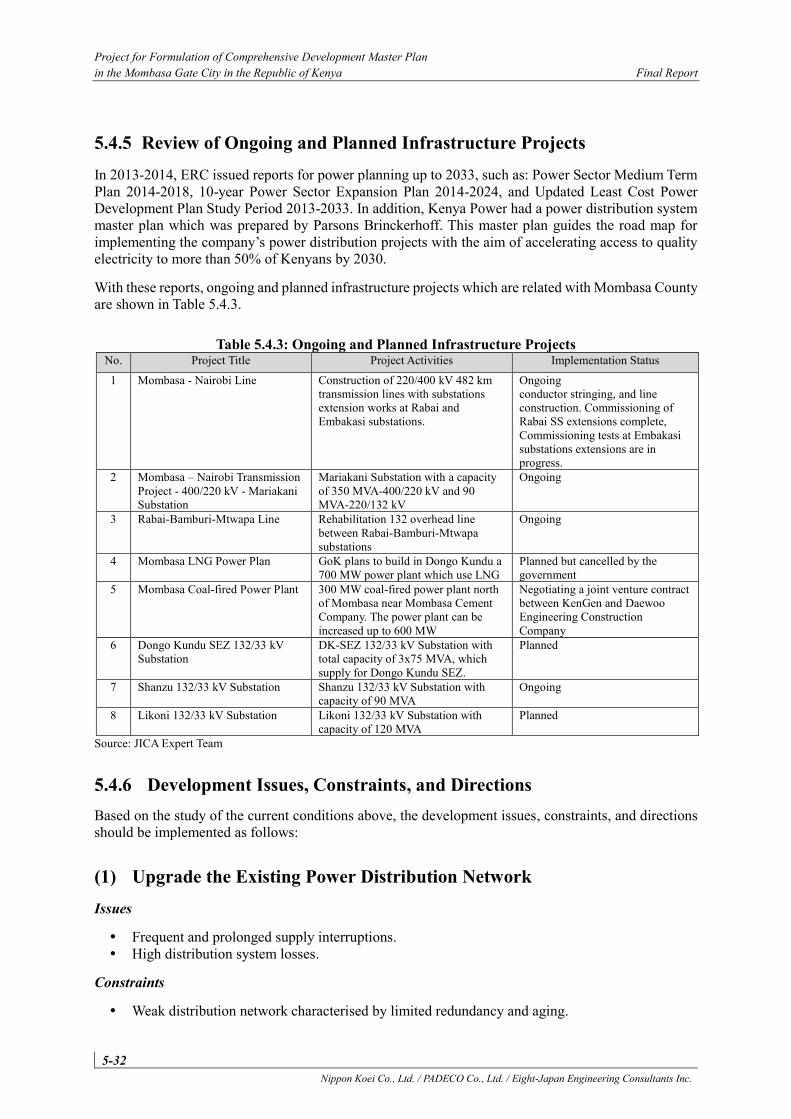
Project for Formulation of Comprehensive Development Master Plan in the Mombasa Gate City in the Republic of Kenya Final Report
5-32 Nippon Koei Co., Ltd. / PADECO Co., Ltd. / Eight-Japan Engineering Consultants Inc.
5.4.5 Review of Ongoing and Planned Infrastructure Projects In 2013-2014, ERC issued reports for power planning up to 2033, such as: Power Sector Medium Term Plan 2014-2018, 10-year Power Sector Expansion Plan 2014-2024, and Updated Least Cost Power Development Plan Study Period 2013-2033. In addition, Kenya Power had a power distribution system master plan which was prepared by Parsons Brinckerhoff. This master plan guides the road map for implementing the company’s power distribution projects with the aim of accelerating access to quality electricity to more than 50% of Kenyans by 2030.
With these reports, ongoing and planned infrastructure projects which are related with Mombasa County are shown in Table 5.4.3.
Table 5.4.3: Ongoing and Planned Infrastructure Projects No. Project Title Project Activities Implementation Status
1 Mombasa - Nairobi Line Construction of 220/400 kV 482 km transmission lines with substations extension works at Rabai and Embakasi substations.
Ongoing conductor stringing, and line construction. Commissioning of Rabai SS extensions complete, Commissioning tests at Embakasi substations extensions are in progress.
2 Mombasa – Nairobi Transmission Project - 400/220 kV - Mariakani Substation
Mariakani Substation with a capacity of 350 MVA-400/220 kV and 90 MVA-220/132 kV
Ongoing
3 Rabai-Bamburi-Mtwapa Line Rehabilitation 132 overhead line between Rabai-Bamburi-Mtwapa substations
Ongoing
4 Mombasa LNG Power Plan GoK plans to build in Dongo Kundu a 700 MW power plant which use LNG
Planned but cancelled by the government
5 Mombasa Coal-fired Power Plant 300 MW coal-fired power plant north of Mombasa near Mombasa Cement Company. The power plant can be increased up to 600 MW
Negotiating a joint venture contract between KenGen and Daewoo Engineering Construction Company
6 Dongo Kundu SEZ 132/33 kV Substation
DK-SEZ 132/33 kV Substation with total capacity of 3x75 MVA, which supply for Dongo Kundu SEZ.
Planned
7 Shanzu 132/33 kV Substation Shanzu 132/33 kV Substation with capacity of 90 MVA
Ongoing
8 Likoni 132/33 kV Substation Likoni 132/33 kV Substation with capacity of 120 MVA
Planned
Source: JICA Expert Team
5.4.6 Development Issues, Constraints, and Directions Based on the study of the current conditions above, the development issues, constraints, and directions should be implemented as follows:
(1) Upgrade the Existing Power Distribution Network Issues
Frequent and prolonged supply interruptions. High distribution system losses.
Constraints
Weak distribution network characterised by limited redundancy and aging.
Project for Formulation of Comprehensive Development Master Plan in the Mombasa Gate City in the Republic of Kenya Final Report
5-33 Nippon Koei Co., Ltd. / PADECO Co., Ltd. / Eight-Japan Engineering Consultants Inc.
Lack of substations in adoption of parallel redundancy. Inappropriate technical standards leading to high costs of materials, labour, and transport.
Directions
Ensure reinforcement and development of the distribution network so as to improve reliability and quality of supply. Government to facilitate partnership programmes in modernisation of the distribution networks.
Replace the entire wooden poles by concrete poles. Installation of new substations to improve power supply to the load. Increased levels of
transformer redundancy at existing substations with the aim of achieving N-1 (parallel redundancy) security of supply. Also check the equipment on existing gird, replacing the equipment was downgraded.
Replace the entire low voltage overhead line which are using bare cable by aerial bundled cable (ABC) for the reduction of illegal power line connections and theft of electricity, and it also reduces power losses.
(2) Rural Electrification Issues
Power supply coverage in rural area is low such as Jomvu and Likoni subcounties.
Constraints
Low load growth and scattered nature of population in rural areas. High costs of rural electrification projects.
Directions
Kenya Power needs to know that there is a benefit to its investments in the distribution system. If there were no planning process to assess the costs and benefits of a given project, then that would be a real risk of waste.
For the development of social security, the County Government of Mombasa should:
Support the Kenya Power to mobilise funds from development partners for rural electrification programmes.
Support data collection, packaging and dissemination of information on energy systems in rural areas to create investor and consumer awareness on the economic potential offered by these systems.
Provide incentives to both users and producers of energy technologies in rural areas. Use of off-grid systems, including stand-alone renewable energy solutions such as solar
power and wind power. Support local capacity programmes for the manufacturing, installation, maintenance and
operation of the renewable energy in rural areas.
5.5 Telecommunications
5.5.1 Overview The Information and Communications Technology (ICT) Sector in Kenya is formulated by the Ministry of Information, Communication and Technology (MOICT) and Communications Authority of Kenya (CA).
Project for Formulation of Comprehensive Development Master Plan in the Mombasa Gate City in the Republic of Kenya Final Report
5-34 Nippon Koei Co., Ltd. / PADECO Co., Ltd. / Eight-Japan Engineering Consultants Inc.
Currently, mobile network coverage is up to 95% for voice and data services with the major telecommunication providers, including Safaricom, Airtel and Telkom Kenya (Orange), and has a strong presence within the Mombasa County. The main technology of mobile phone is 2G and 3G. In December 2014, Safaricom has launched the LTE Advanced Network (4G technology). Besides the mobile network, Telkom Kenya (Orange) is the sole provider of landline phone services in Kenya, which is a physical connection between two telecommunications devices.
Regarding the international internet connection, it is provided through undersea fibre optic cables and by satellite. There are four undersea cable operators named SEACOM, Telkom Kenya Limited (TEAMS), and Lower Indian Ocean Network (LION2) in Mombasa County.
Mombasa County has seven post offices and one subpost office with the full products and services. Radio and digital television are accessible to all areas in the county.
For ITC system of government, the county has a fibre network with a speed of 60 Mbs for Multi-Protocol Label Switching (MPLS) on wide area network (WAN).
5.5.2 Review of Policy, Legal Framework and Administrative Structure The ICT Sector Policy in Kenya is formulated by the Ministry of Information, Communication and Technology (MOICT). In March 2006, the GoK released the ICT Sector Policy Guidelines via the Kenya Gazette. The guidelines are envisaged to replace the Telecommunications and Postal Sector Guidelines of December 2001. This policy was guided by the need for infrastructure development, human resource development, stakeholder participation and appropriate policy and regulatory framework. It focuses on IT, broadcasting, telecommunications, postal services, radio frequency spectrum, universal access and institutional framework for implementation.
One of the key factors in the development and expansion of ICTs has been the liberalisation of the market that started in 1999. The Kenya Post and Telecommunications Corporation was split into five entities as follows:
The Postal Corporation of Kenya which was established by the Postal Corporation of Kenya Act, 1998, is the public postal licensee with the specific role to ensure universal access of postal services;
Telkom Kenya Ltd. (later privatised) was established as a public telecommunications operator under the Companies Act;
Communications Commission of Kenya (CCK) is the regulatory body for the sector. CCK is responsible for facilitating the development of the information and communications sectors including broadcasting, multimedia, telecommunications, electronic commerce, postal and courier services;
The National Communications Secretariat (NCS) is to advise on policy issues; and
An Appeals Tribunal is for arbitrating in cases where disputes arise between parties.
This shift involved an important re-organisation of the public ICT policy from emphasis being put on scale economies achieved through government monopolies to competition and the use of Private-Public Associations (PPAs) to increase the reach of existing ICTs.
Kenya Communication Act 1998 has now been amended to the Kenya Information and Communications (amendment) Act, 2013. The amended law brought with it a raft of changes with respect to the administration of the regulatory body and most fundamentally the regulation of the ICT sector. This law establishes the Communications Authority of Kenya (CA) to replace the Communications Commission of Kenya (CCK) and provides independence of the authority from control of government, political, and commercial interests.
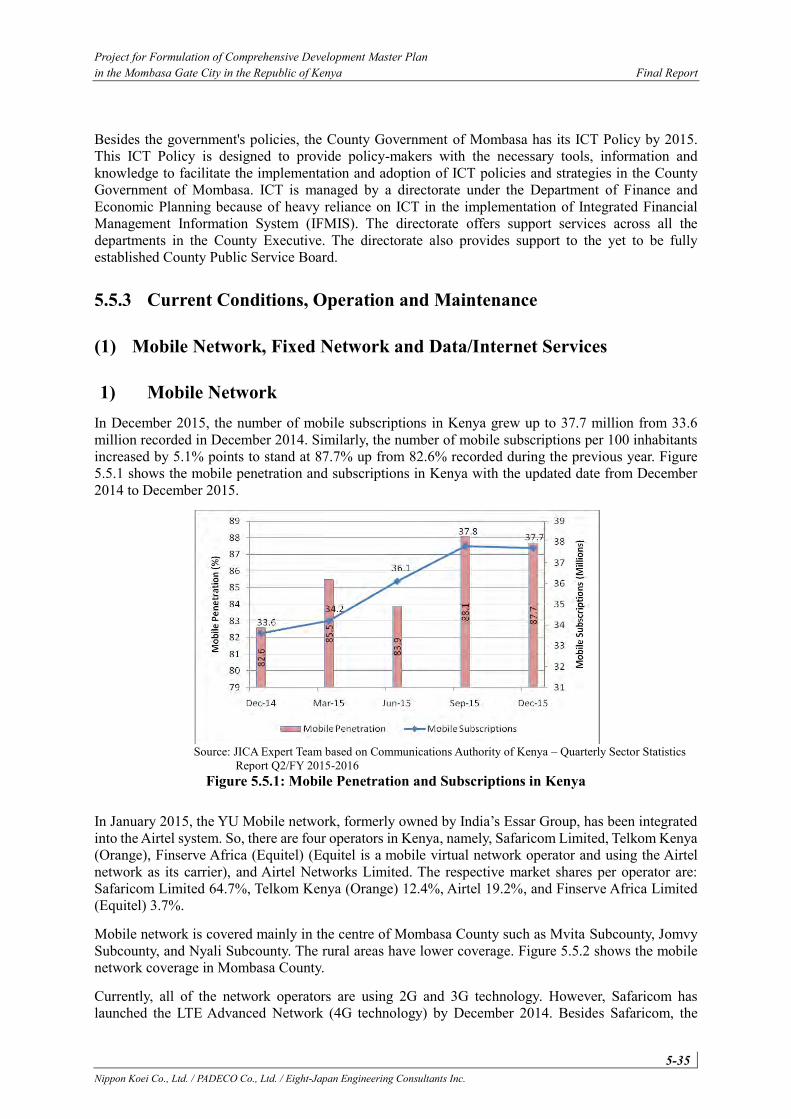
Project for Formulation of Comprehensive Development Master Plan in the Mombasa Gate City in the Republic of Kenya Final Report
5-35 Nippon Koei Co., Ltd. / PADECO Co., Ltd. / Eight-Japan Engineering Consultants Inc.
Besides the government's policies, the County Government of Mombasa has its ICT Policy by 2015. This ICT Policy is designed to provide policy-makers with the necessary tools, information and knowledge to facilitate the implementation and adoption of ICT policies and strategies in the County Government of Mombasa. ICT is managed by a directorate under the Department of Finance and Economic Planning because of heavy reliance on ICT in the implementation of Integrated Financial Management Information System (IFMIS). The directorate offers support services across all the departments in the County Executive. The directorate also provides support to the yet to be fully established County Public Service Board.
5.5.3 Current Conditions, Operation and Maintenance
(1) Mobile Network, Fixed Network and Data/Internet Services
1) Mobile Network In December 2015, the number of mobile subscriptions in Kenya grew up to 37.7 million from 33.6 million recorded in December 2014. Similarly, the number of mobile subscriptions per 100 inhabitants increased by 5.1% points to stand at 87.7% up from 82.6% recorded during the previous year. Figure 5.5.1 shows the mobile penetration and subscriptions in Kenya with the updated date from December 2014 to December 2015.
Source: JICA Expert Team based on Communications Authority of Kenya – Quarterly Sector Statistics
Report Q2/FY 2015-2016 Figure 5.5.1: Mobile Penetration and Subscriptions in Kenya
In January 2015, the YU Mobile network, formerly owned by India’s Essar Group, has been integrated into the Airtel system. So, there are four operators in Kenya, namely, Safaricom Limited, Telkom Kenya (Orange), Finserve Africa (Equitel) (Equitel is a mobile virtual network operator and using the Airtel network as its carrier), and Airtel Networks Limited. The respective market shares per operator are: Safaricom Limited 64.7%, Telkom Kenya (Orange) 12.4%, Airtel 19.2%, and Finserve Africa Limited (Equitel) 3.7%.
Mobile network is covered mainly in the centre of Mombasa County such as Mvita Subcounty, Jomvy Subcounty, and Nyali Subcounty. The rural areas have lower coverage. Figure 5.5.2 shows the mobile network coverage in Mombasa County.
Currently, all of the network operators are using 2G and 3G technology. However, Safaricom has launched the LTE Advanced Network (4G technology) by December 2014. Besides Safaricom, the
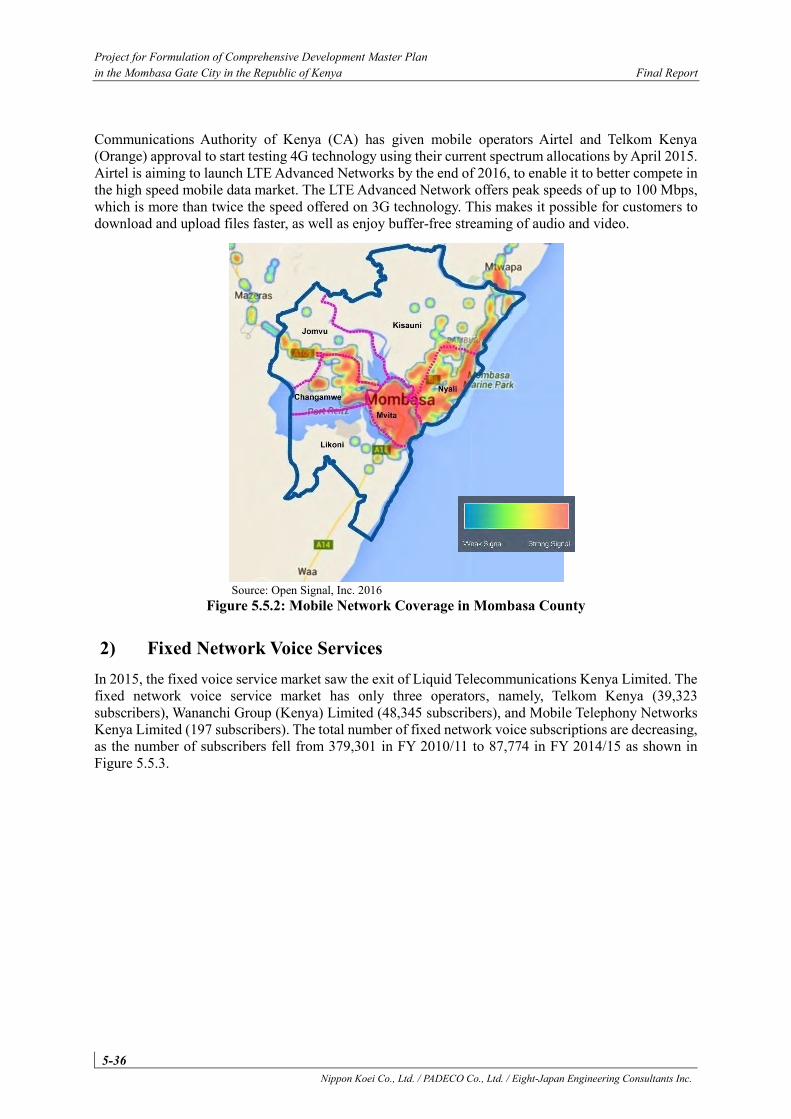
Project for Formulation of Comprehensive Development Master Plan in the Mombasa Gate City in the Republic of Kenya Final Report
5-36 Nippon Koei Co., Ltd. / PADECO Co., Ltd. / Eight-Japan Engineering Consultants Inc.
Communications Authority of Kenya (CA) has given mobile operators Airtel and Telkom Kenya (Orange) approval to start testing 4G technology using their current spectrum allocations by April 2015. Airtel is aiming to launch LTE Advanced Networks by the end of 2016, to enable it to better compete in the high speed mobile data market. The LTE Advanced Network offers peak speeds of up to 100 Mbps, which is more than twice the speed offered on 3G technology. This makes it possible for customers to download and upload files faster, as well as enjoy buffer-free streaming of audio and video.
Source: Open Signal, Inc. 2016
Figure 5.5.2: Mobile Network Coverage in Mombasa County
2) Fixed Network Voice Services In 2015, the fixed voice service market saw the exit of Liquid Telecommunications Kenya Limited. The fixed network voice service market has only three operators, namely, Telkom Kenya (39,323 subscribers), Wananchi Group (Kenya) Limited (48,345 subscribers), and Mobile Telephony Networks Kenya Limited (197 subscribers). The total number of fixed network voice subscriptions are decreasing, as the number of subscribers fell from 379,301 in FY 2010/11 to 87,774 in FY 2014/15 as shown in Figure 5.5.3.
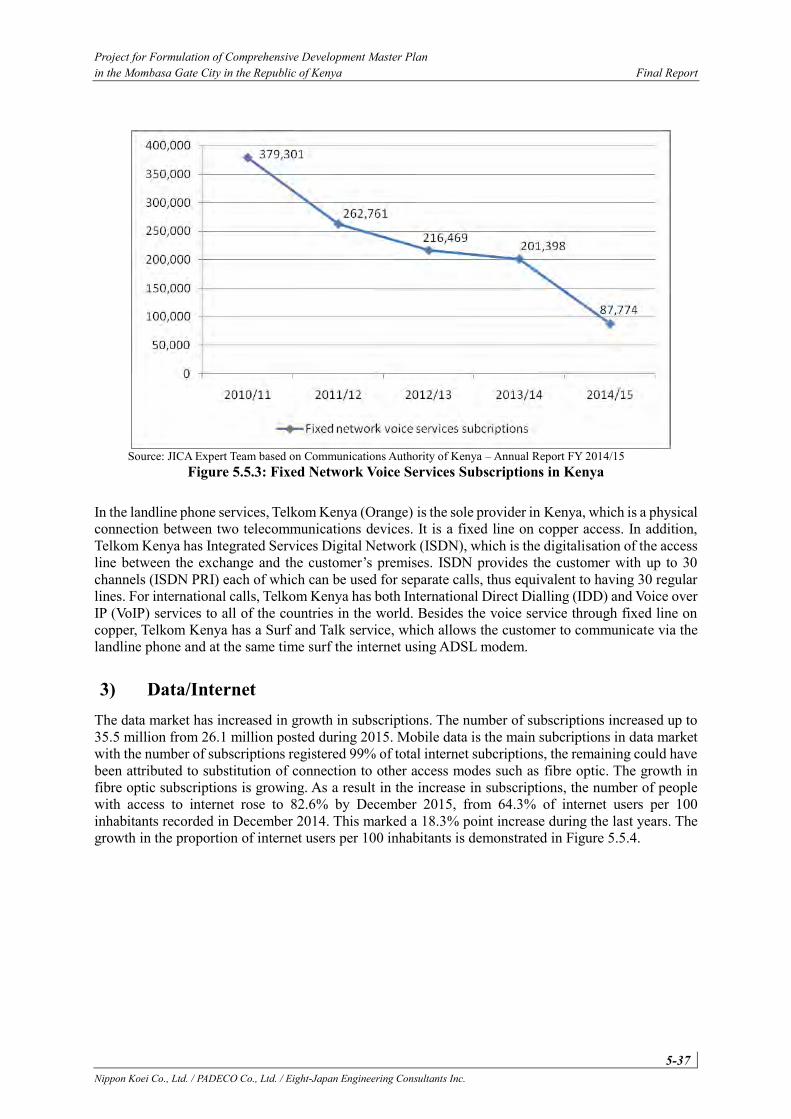
Project for Formulation of Comprehensive Development Master Plan in the Mombasa Gate City in the Republic of Kenya Final Report
5-37 Nippon Koei Co., Ltd. / PADECO Co., Ltd. / Eight-Japan Engineering Consultants Inc.
Source: JICA Expert Team based on Communications Authority of Kenya – Annual Report FY 2014/15
Figure 5.5.3: Fixed Network Voice Services Subscriptions in Kenya
In the landline phone services, Telkom Kenya (Orange) is the sole provider in Kenya, which is a physical connection between two telecommunications devices. It is a fixed line on copper access. In addition, Telkom Kenya has Integrated Services Digital Network (ISDN), which is the digitalisation of the access line between the exchange and the customer’s premises. ISDN provides the customer with up to 30 channels (ISDN PRI) each of which can be used for separate calls, thus equivalent to having 30 regular lines. For international calls, Telkom Kenya has both International Direct Dialling (IDD) and Voice over IP (VoIP) services to all of the countries in the world. Besides the voice service through fixed line on copper, Telkom Kenya has a Surf and Talk service, which allows the customer to communicate via the landline phone and at the same time surf the internet using ADSL modem.
3) Data/Internet The data market has increased in growth in subscriptions. The number of subscriptions increased up to 35.5 million from 26.1 million posted during 2015. Mobile data is the main subcriptions in data market with the number of subscriptions registered 99% of total internet subcriptions, the remaining could have been attributed to substitution of connection to other access modes such as fibre optic. The growth in fibre optic subscriptions is growing. As a result in the increase in subscriptions, the number of people with access to internet rose to 82.6% by December 2015, from 64.3% of internet users per 100 inhabitants recorded in December 2014. This marked a 18.3% point increase during the last years. The growth in the proportion of internet users per 100 inhabitants is demonstrated in Figure 5.5.4.
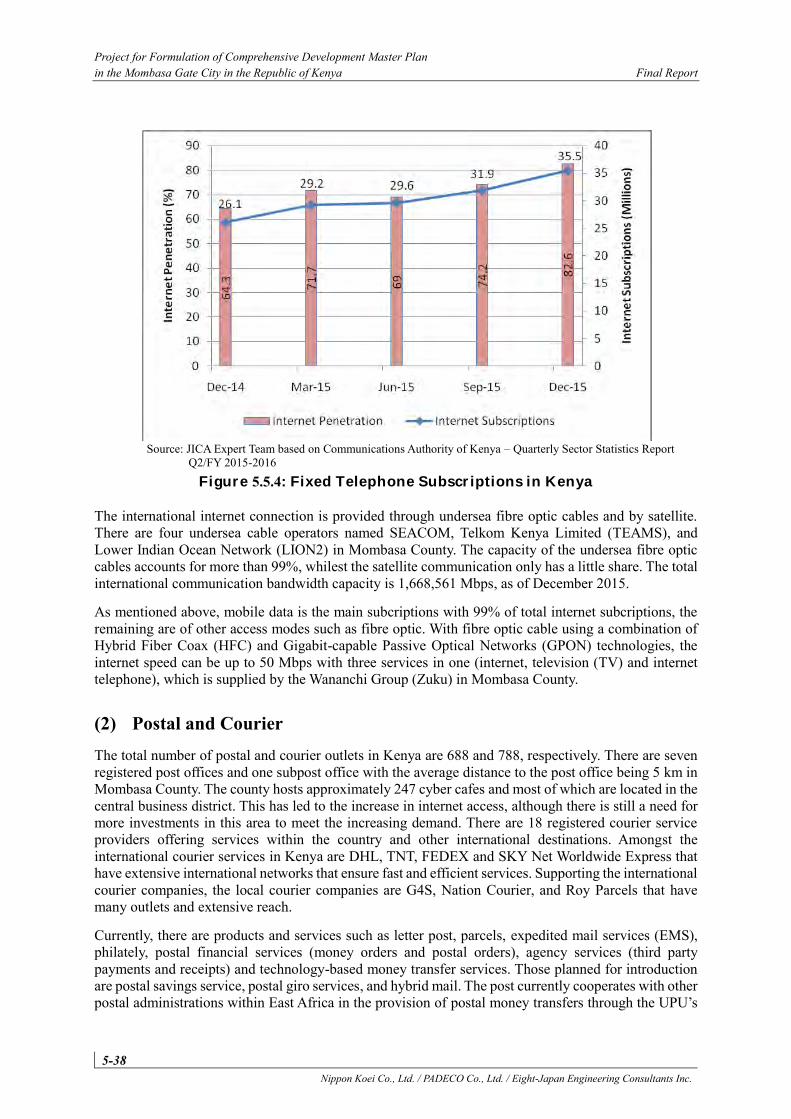
Project for Formulation of Comprehensive Development Master Plan in the Mombasa Gate City in the Republic of Kenya Final Report
5-38 Nippon Koei Co., Ltd. / PADECO Co., Ltd. / Eight-Japan Engineering Consultants Inc.
Source: JICA Expert Team based on Communications Authority of Kenya – Quarterly Sector Statistics Report
Q2/FY 2015-2016
Figure 5.5.4: Fixed Telephone Subscriptions in Kenya
The international internet connection is provided through undersea fibre optic cables and by satellite. There are four undersea cable operators named SEACOM, Telkom Kenya Limited (TEAMS), and Lower Indian Ocean Network (LION2) in Mombasa County. The capacity of the undersea fibre optic cables accounts for more than 99%, whilest the satellite communication only has a little share. The total international communication bandwidth capacity is 1,668,561 Mbps, as of December 2015.
As mentioned above, mobile data is the main subcriptions with 99% of total internet subcriptions, the remaining are of other access modes such as fibre optic. With fibre optic cable using a combination of Hybrid Fiber Coax (HFC) and Gigabit-capable Passive Optical Networks (GPON) technologies, the internet speed can be up to 50 Mbps with three services in one (internet, television (TV) and internet telephone), which is supplied by the Wananchi Group (Zuku) in Mombasa County.
(2) Postal and Courier The total number of postal and courier outlets in Kenya are 688 and 788, respectively. There are seven registered post offices and one subpost office with the average distance to the post office being 5 km in Mombasa County. The county hosts approximately 247 cyber cafes and most of which are located in the central business district. This has led to the increase in internet access, although there is still a need for more investments in this area to meet the increasing demand. There are 18 registered courier service providers offering services within the country and other international destinations. Amongst the international courier services in Kenya are DHL, TNT, FEDEX and SKY Net Worldwide Express that have extensive international networks that ensure fast and efficient services. Supporting the international courier companies, the local courier companies are G4S, Nation Courier, and Roy Parcels that have many outlets and extensive reach.
Currently, there are products and services such as letter post, parcels, expedited mail services (EMS), philately, postal financial services (money orders and postal orders), agency services (third party payments and receipts) and technology-based money transfer services. Those planned for introduction are postal savings service, postal giro services, and hybrid mail. The post currently cooperates with other postal administrations within East Africa in the provision of postal money transfers through the UPU’s
Project for Formulation of Comprehensive Development Master Plan in the Mombasa Gate City in the Republic of Kenya Final Report
5-39 Nippon Koei Co., Ltd. / PADECO Co., Ltd. / Eight-Japan Engineering Consultants Inc.
electronic International Financial System (IFS). It also has the International Postal System (IPS) that enables track and trace facilities for mail and EMS within UPU member countries.
(3) Broadcast There are 35 FM broadcasters (with 32 FM channels) that are licensed to broadcast in Mombasa County. KBC, Citizen FM, Kiss FM (pop), Classic FM (classics), Capital FM (rock and pop), Easy FM (R&B), Metro FM (Reggae), X FM (Rock), and Homeboyz Radio (Hip hop and R&B) are the popular radio stations in terms of listeners and coverage. Most radio stations are owned by media companies, and they are Kenya Broadcasting Corporation (KBC), Nation Media Group, Standard Media Group, Radio Africa Group, Royal Media Service, and MediaMax Communication Group. KBC, a government-managed broadcasting company, is the main broadcasters with 5 FM channels throughout the Mombasa County in English and Kiswahili.
KBC, NTV, KTN, Citizen TV, and K24 are the biggest TV stations, with a total of 12 channels from 14 TV broadcasters, in terms of coverage and viewers in Mombasa County. Digital TV is also available from broadcasters such as Zuku (Wananchi Group), DStv (MultiChoice Africa Ltd.), Azam TV (Bakhresa Group), and Startimes (StarTimes Media Ltd.)
Radio transmission is accessible to all areas in the county. In addition, the number of TV channels is 12, which has resulted in diversity in programming and an increase in the level of local content. The technology of TV broadcasting has been migrated from analogue to digital by 2015. At the onset, Kenya had adopted DVB-T technology. However, due to the advancement in technology, the government made a decision to upgrade this technology to DVB-T2 in December 2010. Compared with DVB–T, DVB-T2 offers better sound and picture quality, has a capacity for more channels, has wider geographic coverage, has improved security features, and can accommodate high definition, standard definition, mobile TV, and digital audio.
(4) ICT in County Government of Mombasa According to the director of the ICT Department of the County Goverment of Mombasa, the total number of computers is around 600. Amongst these, desktop computers accounted for 400 and laptop computers for 200. A number of office equipment are 200 printers and copiers, 50 tablets/iPads, 50 scanners, 76 network switches, 1000 digital phones, 24 routers, and 4 servers.
The county also uses systems such as:
1. Local Authority Integrated Finance and Operations Management Systems (LAIFOMS) for revenue
collection
2. Integrated Financial Management Information System (IFMIS) for financial management
3. Seasonal Ticketing System (STS) for management of seasonal ticketing for the transport
department
4. An asset tracking system
5. Firewall
6. Unified communication (Telephony)
7. E-Construction and E-Single Business Permit System
8. Zizi which is for revenue collection and is from Kenya Commercial Bank
9. Websites for County Government of Mombasa
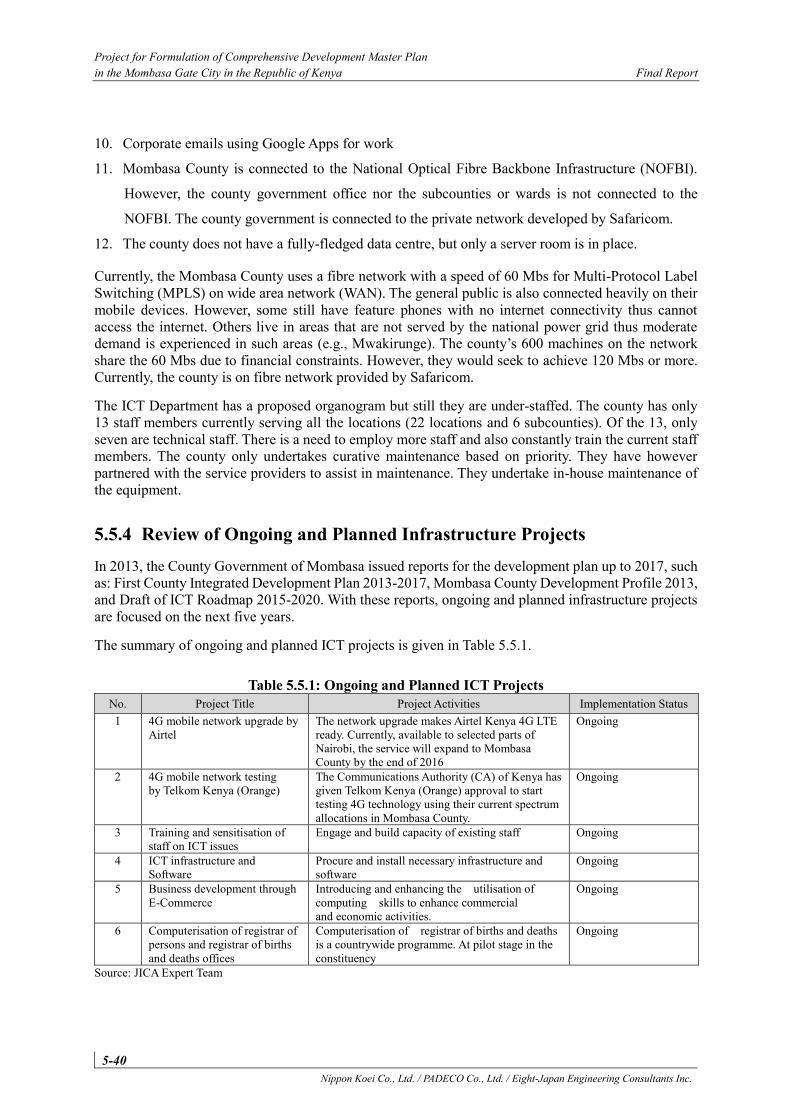
Project for Formulation of Comprehensive Development Master Plan in the Mombasa Gate City in the Republic of Kenya Final Report
5-40 Nippon Koei Co., Ltd. / PADECO Co., Ltd. / Eight-Japan Engineering Consultants Inc.
10. Corporate emails using Google Apps for work
11. Mombasa County is connected to the National Optical Fibre Backbone Infrastructure (NOFBI).
However, the county government office nor the subcounties or wards is not connected to the
NOFBI. The county government is connected to the private network developed by Safaricom.
12. The county does not have a fully-fledged data centre, but only a server room is in place.
Currently, the Mombasa County uses a fibre network with a speed of 60 Mbs for Multi-Protocol Label Switching (MPLS) on wide area network (WAN). The general public is also connected heavily on their mobile devices. However, some still have feature phones with no internet connectivity thus cannot access the internet. Others live in areas that are not served by the national power grid thus moderate demand is experienced in such areas (e.g., Mwakirunge). The county’s 600 machines on the network share the 60 Mbs due to financial constraints. However, they would seek to achieve 120 Mbs or more. Currently, the county is on fibre network provided by Safaricom.
The ICT Department has a proposed organogram but still they are under-staffed. The county has only 13 staff members currently serving all the locations (22 locations and 6 subcounties). Of the 13, only seven are technical staff. There is a need to employ more staff and also constantly train the current staff members. The county only undertakes curative maintenance based on priority. They have however partnered with the service providers to assist in maintenance. They undertake in-house maintenance of the equipment.
5.5.4 Review of Ongoing and Planned Infrastructure Projects In 2013, the County Government of Mombasa issued reports for the development plan up to 2017, such as: First County Integrated Development Plan 2013-2017, Mombasa County Development Profile 2013, and Draft of ICT Roadmap 2015-2020. With these reports, ongoing and planned infrastructure projects are focused on the next five years.
The summary of ongoing and planned ICT projects is given in Table 5.5.1.
Table 5.5.1: Ongoing and Planned ICT Projects No. Project Title Project Activities Implementation Status 1 4G mobile network upgrade by
Airtel The network upgrade makes Airtel Kenya 4G LTE ready. Currently, available to selected parts of Nairobi, the service will expand to Mombasa County by the end of 2016
Ongoing
2 4G mobile network testing by Telkom Kenya (Orange)
The Communications Authority (CA) of Kenya has given Telkom Kenya (Orange) approval to start testing 4G technology using their current spectrum allocations in Mombasa County.
Ongoing
3 Training and sensitisation of staff on ICT issues
Engage and build capacity of existing staff Ongoing
4 ICT infrastructure and Software
Procure and install necessary infrastructure and software
Ongoing
5 Business development through E-Commerce
Introducing and enhancing the utilisation of computing skills to enhance commercial and economic activities.
Ongoing
6 Computerisation of registrar of persons and registrar of births and deaths offices
Computerisation of registrar of births and deaths is a countrywide programme. At pilot stage in the constituency
Ongoing
Source: JICA Expert Team
Project for Formulation of Comprehensive Development Master Plan in the Mombasa Gate City in the Republic of Kenya Final Report
5-41 Nippon Koei Co., Ltd. / PADECO Co., Ltd. / Eight-Japan Engineering Consultants Inc.
5.5.5 Development Issues, Constraints and Directions Based on the study of the current conditions above, the development issues, constraints, and directions should be divided to two fields (general public, government).
(1) General Public Issues
Mobile coverage in the rural areas such as Kisauni and Likoni Subcounty, is low.
Constraints
Low population density in the rural area Operators deploy their telecommunications infrastructure (cable laying works, antenna towers,
etc.) based on their own marketing strategy. These constraints led to the increase in investment costs for the operator per customer, and leading
to their refusal to expand the network.
Directions
Shared antenna towers are proposed to be operated and maintained by local governments such as Mombasa County or a third party partially funded by public sources. Shared antenna towers will improve the landscape by reducing the number of antenna towers of individual operators and will promote effective land use.
(2) Government
1) Promotion of E-Government System Currently, Mombasa County has a WAN network with E-Construction and E-Single Business Permit System. Although, this system should be upgraded to become a fully E-Government System. The E-Government should facilitate better and ensure efficient delivery of information and services to the citizens, promote productivity amongst public servants, encourage participation of citizens in government and empower all Kenyans. E-Government uses a range of information technologies, such as the Wide Area Networks (WAN), Internet, and Mobile Computing, to transform government operations in order to improve effectiveness, efficiency, and service delivery.
Issues
Implement a Metro Area Network (MAN) in improving the connectivity for user and provide interconnection between County Government of Mombasa with the subcounties.
The county does not have a fully-fledged data centre. Protect data and information against cyber-attacks. The country only has an ineffective server room. No network management software with access rights and enhanced security features. Data manually stored in one location. County lacks backup generators. Electricity is erratic leading to working hour losses.
Constraints
National Optical Fibre Backbone Infrastructure (NOFBI) is present only at the county headquarters. Most of the county government offices in Mombasa are not connected to LAN. The departments are not interconnected.
Project for Formulation of Comprehensive Development Master Plan in the Mombasa Gate City in the Republic of Kenya Final Report
5-42 Nippon Koei Co., Ltd. / PADECO Co., Ltd. / Eight-Japan Engineering Consultants Inc.
County Government of Mombasa (CGM) has basic internet connectivity with narrow band at a speed of 60 Mbs by Safaricom.
Directions
Network construction amongst the urban cores and subcentres by connecting fiber optic cables laid along the roads.
Upgrade the networking equipment including the optical transmission device, router, switch, and network control unit to expand the network bandwidth capacity.
Interconnection between CGM with subcounties by connecting to the NOFBI. The data centre is a centralised repository, either physical or virtual, for the storage, management,
and dissemination of data and information. For efficient data exchange between CGM and subcounties, the dedicated government network can be utilised effectively to centralise the governmental information in the data centre.
Cyber-attacks of fraudulent access and distributed denial of service (DDoS) have hit and damaged the intranet system of companies and government offices and concurrently might have caused a leak of confidential information or an organisation’s defamation. Cyber-attack protection does not only serve to block an attack from outside of the intranet, but also includes countermeasures which are premised on intrusion into the intranet.
Acquire power backup generators for all subcounty offices.
2) Disaster Recovery Centre Management (DRC) Issues
Instantaneous information dissemination helps citizens evacuate to safety in case of disasters or emergencies.
Constraints
Mombasa County does not have a centre in which they can announce the information about protection of lives and property.
Directions
Rainfall and sea water level information observation and telemetric information transmission system with security fence will be sent to the Disaster Recovery Centre Management (DRC). DRC will announce the information on the rising sea levels to give notice to the residents living near the sea to evacuate.
Wireless information dissemination including outside message boards and public megaphones with security fence.
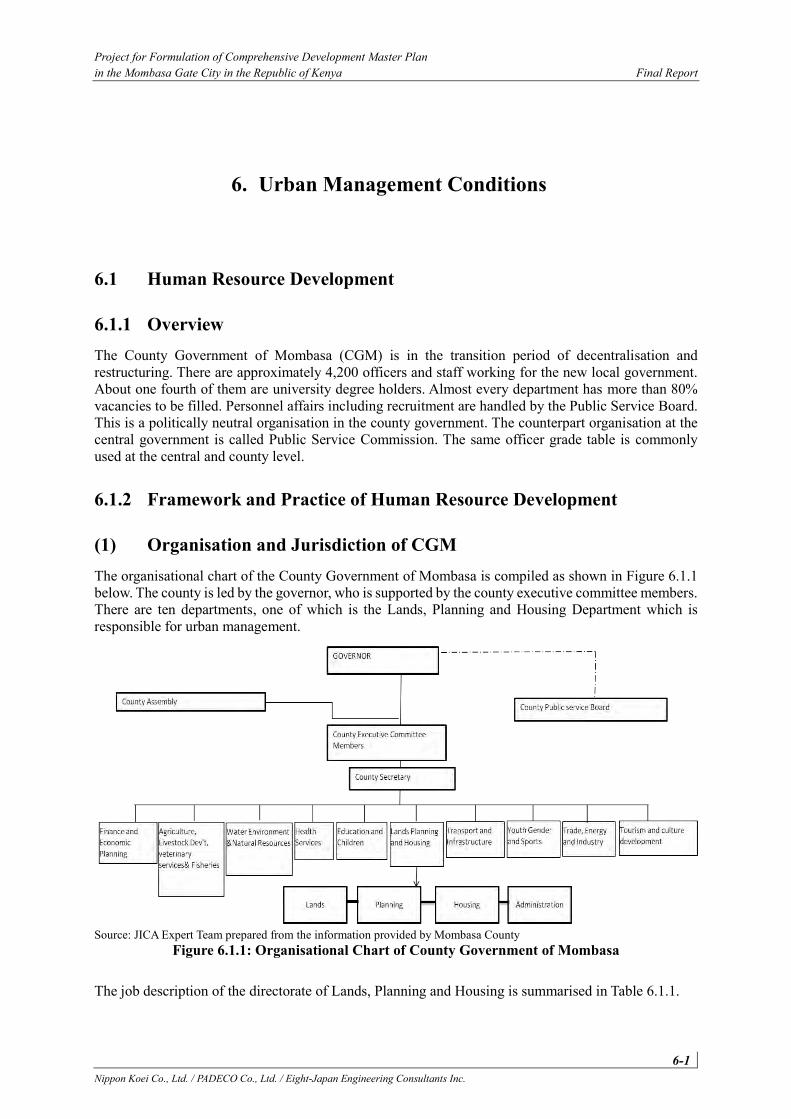
Project for Formulation of Comprehensive Development Master Plan in the Mombasa Gate City in the Republic of Kenya Final Report
6-1 Nippon Koei Co., Ltd. / PADECO Co., Ltd. / Eight-Japan Engineering Consultants Inc.
6. Urban Management Conditions
6.1 Human Resource Development
6.1.1 Overview The County Government of Mombasa (CGM) is in the transition period of decentralisation and restructuring. There are approximately 4,200 officers and staff working for the new local government. About one fourth of them are university degree holders. Almost every department has more than 80% vacancies to be filled. Personnel affairs including recruitment are handled by the Public Service Board. This is a politically neutral organisation in the county government. The counterpart organisation at the central government is called Public Service Commission. The same officer grade table is commonly used at the central and county level.
6.1.2 Framework and Practice of Human Resource Development
(1) Organisation and Jurisdiction of CGM The organisational chart of the County Government of Mombasa is compiled as shown in Figure 6.1.1 below. The county is led by the governor, who is supported by the county executive committee members. There are ten departments, one of which is the Lands, Planning and Housing Department which is responsible for urban management.
Source: JICA Expert Team prepared from the information provided by Mombasa County
Figure 6.1.1: Organisational Chart of County Government of Mombasa
The job description of the directorate of Lands, Planning and Housing is summarised in Table 6.1.1.
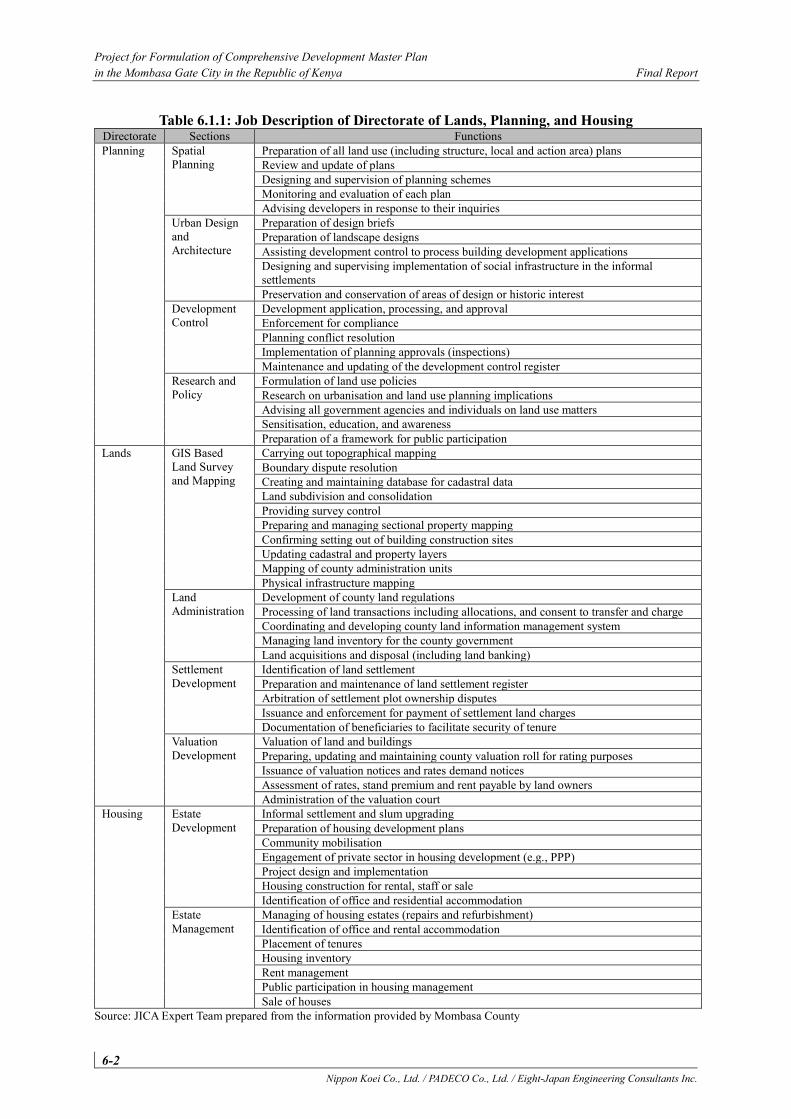
Project for Formulation of Comprehensive Development Master Plan in the Mombasa Gate City in the Republic of Kenya Final Report
6-2 Nippon Koei Co., Ltd. / PADECO Co., Ltd. / Eight-Japan Engineering Consultants Inc.
Table 6.1.1: Job Description of Directorate of Lands, Planning, and Housing Directorate Sections Functions Planning Spatial
Planning Preparation of all land use (including structure, local and action area) plans Review and update of plans Designing and supervision of planning schemes Monitoring and evaluation of each plan Advising developers in response to their inquiries
Urban Design and Architecture
Preparation of design briefs Preparation of landscape designs Assisting development control to process building development applications Designing and supervising implementation of social infrastructure in the informal settlements Preservation and conservation of areas of design or historic interest
Development Control
Development application, processing, and approval Enforcement for compliance Planning conflict resolution Implementation of planning approvals (inspections) Maintenance and updating of the development control register
Research and Policy
Formulation of land use policies Research on urbanisation and land use planning implications Advising all government agencies and individuals on land use matters Sensitisation, education, and awareness Preparation of a framework for public participation
Lands GIS Based Land Survey and Mapping
Carrying out topographical mapping Boundary dispute resolution Creating and maintaining database for cadastral data Land subdivision and consolidation Providing survey control Preparing and managing sectional property mapping Confirming setting out of building construction sites Updating cadastral and property layers Mapping of county administration units Physical infrastructure mapping
Land Administration
Development of county land regulations Processing of land transactions including allocations, and consent to transfer and charge Coordinating and developing county land information management system Managing land inventory for the county government Land acquisitions and disposal (including land banking)
Settlement Development
Identification of land settlement Preparation and maintenance of land settlement register Arbitration of settlement plot ownership disputes Issuance and enforcement for payment of settlement land charges Documentation of beneficiaries to facilitate security of tenure
Valuation Development
Valuation of land and buildings Preparing, updating and maintaining county valuation roll for rating purposes Issuance of valuation notices and rates demand notices Assessment of rates, stand premium and rent payable by land owners Administration of the valuation court
Housing Estate Development
Informal settlement and slum upgrading Preparation of housing development plans Community mobilisation Engagement of private sector in housing development (e.g., PPP) Project design and implementation Housing construction for rental, staff or sale Identification of office and residential accommodation
Estate Management
Managing of housing estates (repairs and refurbishment) Identification of office and rental accommodation Placement of tenures Housing inventory Rent management Public participation in housing management Sale of houses
Source: JICA Expert Team prepared from the information provided by Mombasa County
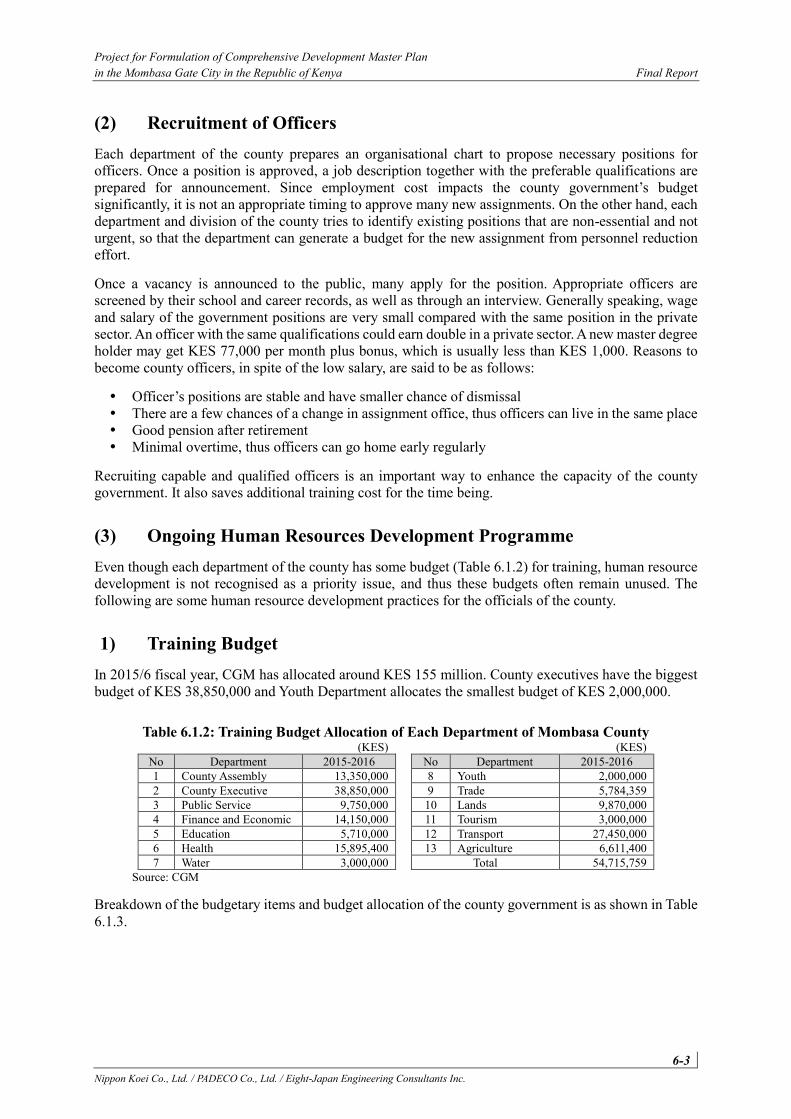
Project for Formulation of Comprehensive Development Master Plan in the Mombasa Gate City in the Republic of Kenya Final Report
6-3 Nippon Koei Co., Ltd. / PADECO Co., Ltd. / Eight-Japan Engineering Consultants Inc.
(2) Recruitment of Officers Each department of the county prepares an organisational chart to propose necessary positions for officers. Once a position is approved, a job description together with the preferable qualifications are prepared for announcement. Since employment cost impacts the county government’s budget significantly, it is not an appropriate timing to approve many new assignments. On the other hand, each department and division of the county tries to identify existing positions that are non-essential and not urgent, so that the department can generate a budget for the new assignment from personnel reduction effort.
Once a vacancy is announced to the public, many apply for the position. Appropriate officers are screened by their school and career records, as well as through an interview. Generally speaking, wage and salary of the government positions are very small compared with the same position in the private sector. An officer with the same qualifications could earn double in a private sector. A new master degree holder may get KES 77,000 per month plus bonus, which is usually less than KES 1,000. Reasons to become county officers, in spite of the low salary, are said to be as follows:
Officer’s positions are stable and have smaller chance of dismissal There are a few chances of a change in assignment office, thus officers can live in the same place Good pension after retirement Minimal overtime, thus officers can go home early regularly
Recruiting capable and qualified officers is an important way to enhance the capacity of the county government. It also saves additional training cost for the time being.
(3) Ongoing Human Resources Development Programme Even though each department of the county has some budget (Table 6.1.2) for training, human resource development is not recognised as a priority issue, and thus these budgets often remain unused. The following are some human resource development practices for the officials of the county.
1) Training Budget In 2015/6 fiscal year, CGM has allocated around KES 155 million. County executives have the biggest budget of KES 38,850,000 and Youth Department allocates the smallest budget of KES 2,000,000.
Table 6.1.2: Training Budget Allocation of Each Department of Mombasa County (KES) (KES)
No Department 2015-2016 No Department 2015-2016 1 County Assembly 13,350,000 8 Youth 2,000,000 2 County Executive 38,850,000 9 Trade 5,784,359 3 Public Service 9,750,000 10 Lands 9,870,000 4 Finance and Economic 14,150,000 11 Tourism 3,000,000 5 Education 5,710,000 12 Transport 27,450,000 6 Health 15,895,400 13 Agriculture 6,611,400 7 Water 3,000,000 Total 54,715,759
Source: CGM
Breakdown of the budgetary items and budget allocation of the county government is as shown in Table 6.1.3.
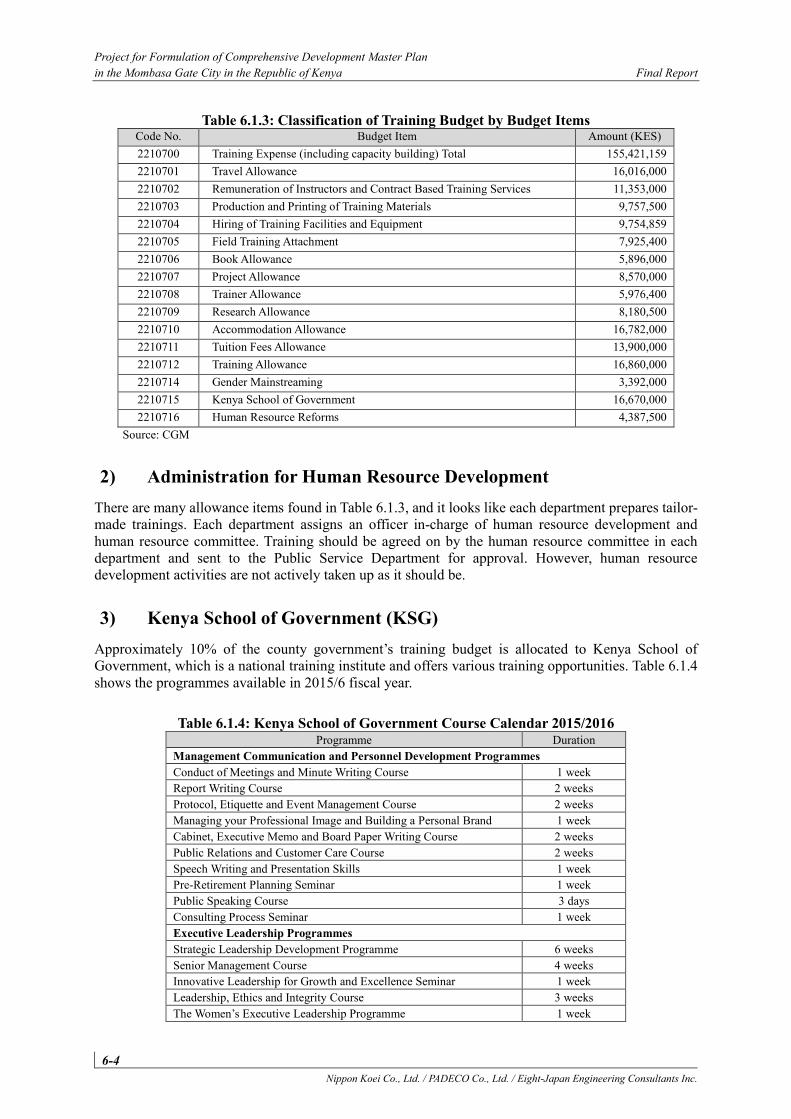
Project for Formulation of Comprehensive Development Master Plan in the Mombasa Gate City in the Republic of Kenya Final Report
6-4 Nippon Koei Co., Ltd. / PADECO Co., Ltd. / Eight-Japan Engineering Consultants Inc.
Table 6.1.3: Classification of Training Budget by Budget Items Code No. Budget Item Amount (KES) 2210700 Training Expense (including capacity building) Total 155,421,159 2210701 Travel Allowance 16,016,000 2210702 Remuneration of Instructors and Contract Based Training Services 11,353,000 2210703 Production and Printing of Training Materials 9,757,500 2210704 Hiring of Training Facilities and Equipment 9,754,859 2210705 Field Training Attachment 7,925,400 2210706 Book Allowance 5,896,000 2210707 Project Allowance 8,570,000 2210708 Trainer Allowance 5,976,400 2210709 Research Allowance 8,180,500 2210710 Accommodation Allowance 16,782,000 2210711 Tuition Fees Allowance 13,900,000 2210712 Training Allowance 16,860,000 2210714 Gender Mainstreaming 3,392,000 2210715 Kenya School of Government 16,670,000 2210716 Human Resource Reforms 4,387,500
Source: CGM
2) Administration for Human Resource Development There are many allowance items found in Table 6.1.3, and it looks like each department prepares tailor-made trainings. Each department assigns an officer in-charge of human resource development and human resource committee. Training should be agreed on by the human resource committee in each department and sent to the Public Service Department for approval. However, human resource development activities are not actively taken up as it should be.
3) Kenya School of Government (KSG) Approximately 10% of the county government’s training budget is allocated to Kenya School of Government, which is a national training institute and offers various training opportunities. Table 6.1.4 shows the programmes available in 2015/6 fiscal year.
Table 6.1.4: Kenya School of Government Course Calendar 2015/2016 Programme Duration
Management Communication and Personnel Development Programmes Conduct of Meetings and Minute Writing Course 1 week Report Writing Course 2 weeks Protocol, Etiquette and Event Management Course 2 weeks Managing your Professional Image and Building a Personal Brand 1 week Cabinet, Executive Memo and Board Paper Writing Course 2 weeks Public Relations and Customer Care Course 2 weeks Speech Writing and Presentation Skills 1 week Pre-Retirement Planning Seminar 1 week Public Speaking Course 3 days Consulting Process Seminar 1 week Executive Leadership Programmes Strategic Leadership Development Programme 6 weeks Senior Management Course 4 weeks Innovative Leadership for Growth and Excellence Seminar 1 week Leadership, Ethics and Integrity Course 3 weeks The Women’s Executive Leadership Programme 1 week
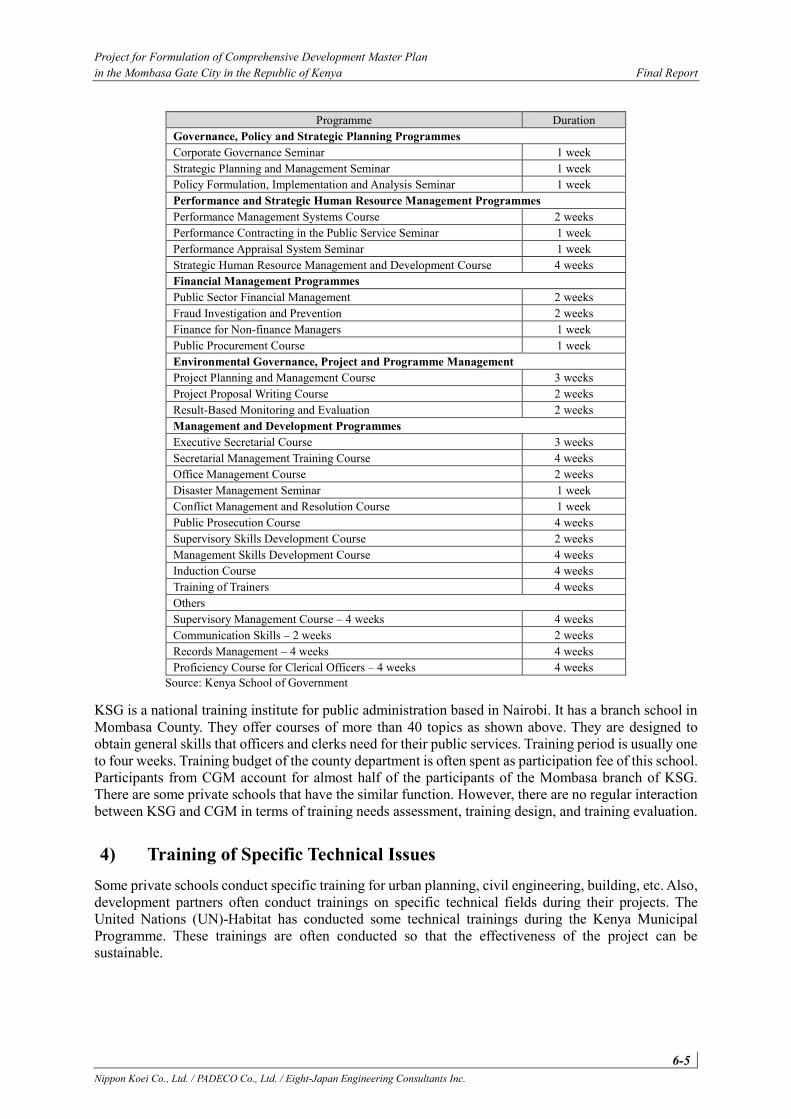
Project for Formulation of Comprehensive Development Master Plan in the Mombasa Gate City in the Republic of Kenya Final Report
6-5 Nippon Koei Co., Ltd. / PADECO Co., Ltd. / Eight-Japan Engineering Consultants Inc.
Programme Duration Governance, Policy and Strategic Planning Programmes Corporate Governance Seminar 1 week Strategic Planning and Management Seminar 1 week Policy Formulation, Implementation and Analysis Seminar 1 week Performance and Strategic Human Resource Management Programmes Performance Management Systems Course 2 weeks Performance Contracting in the Public Service Seminar 1 week Performance Appraisal System Seminar 1 week Strategic Human Resource Management and Development Course 4 weeks Financial Management Programmes Public Sector Financial Management 2 weeks Fraud Investigation and Prevention 2 weeks Finance for Non-finance Managers 1 week Public Procurement Course 1 week Environmental Governance, Project and Programme Management Project Planning and Management Course 3 weeks Project Proposal Writing Course 2 weeks Result-Based Monitoring and Evaluation 2 weeks Management and Development Programmes Executive Secretarial Course 3 weeks Secretarial Management Training Course 4 weeks Office Management Course 2 weeks Disaster Management Seminar 1 week Conflict Management and Resolution Course 1 week Public Prosecution Course 4 weeks Supervisory Skills Development Course 2 weeks Management Skills Development Course 4 weeks Induction Course 4 weeks Training of Trainers 4 weeks Others Supervisory Management Course – 4 weeks 4 weeks Communication Skills – 2 weeks 2 weeks Records Management – 4 weeks 4 weeks Proficiency Course for Clerical Officers – 4 weeks 4 weeks
Source: Kenya School of Government
KSG is a national training institute for public administration based in Nairobi. It has a branch school in Mombasa County. They offer courses of more than 40 topics as shown above. They are designed to obtain general skills that officers and clerks need for their public services. Training period is usually one to four weeks. Training budget of the county department is often spent as participation fee of this school. Participants from CGM account for almost half of the participants of the Mombasa branch of KSG. There are some private schools that have the similar function. However, there are no regular interaction between KSG and CGM in terms of training needs assessment, training design, and training evaluation.
4) Training of Specific Technical Issues Some private schools conduct specific training for urban planning, civil engineering, building, etc. Also, development partners often conduct trainings on specific technical fields during their projects. The United Nations (UN)-Habitat has conducted some technical trainings during the Kenya Municipal Programme. These trainings are often conducted so that the effectiveness of the project can be sustainable.
Project for Formulation of Comprehensive Development Master Plan in the Mombasa Gate City in the Republic of Kenya Final Report
6-6 Nippon Koei Co., Ltd. / PADECO Co., Ltd. / Eight-Japan Engineering Consultants Inc.
5) Learning Through Practise Newly assigned officers should gain new knowledge and skills for the execution of his/her duties. Very often this effort is conducted in the form of “learning through practise”. Officers learn from their bosses, colleagues, and even subordinates. In this regard, compiling of relevant laws, regulations, and working manuals is an effective way to facilitate “learning through practise” for the improvement of the personnel and the capacity of the organisation. It is said that some work manuals have been prepared and are in use for daily tasks.
6) Enrolment to University Course There is a system called Study Leave. If an officer wants to study in a post-bachelor diploma course or master degree course of a university at his/her own expenses, this leave petition is often accepted. If the person comes back to the country work force, 75% of the tuition fee he/she had spent is reimbursed. Governmental scholarship is not available. Development partners (donors) support university education to staff involved in the relevant projects. One short point of university education for county officers is matching of the study topic. What they learn in the university course is not always matched with the county department’s needs.
(4) Capacity Analysis The Public Service Department of the county has a plan to conduct a Training Needs Assessment (TNA). They may apply this to specific positions where capacity insufficiency is apparent. However, every officer and his/her chief should be aware if his/her capacity is sufficient or not to carry out the duties. At the beginning of every fiscal year, county staff sets a performance target, and at the end of the fiscal year their boss conducts a performance evaluation. Annual evaluation record should be kept for each staff, and this practice is especially good to be able to synchronise it with the TNA. Finally, capacity analyses shall be linked to the promotion system amongst the job-groups.
6.1.3 Issues of Human Resource Development and Training The following are general issues and discussion points in human resource development of the county government.
(1) Less Effective Training
1) No Needs Assessment Before sending officers to readymade trainings, such as those conducted by the Kenya School of Government, or even preparing tailor made trainings, the candidate trainees should be assessed on their capacity and needs of training. If a pre-test is carried out to see the level of knowledge of the candidates, the necessity of the training is clearly shown. In other words, if the candidate already has the knowledge which will be given in the training, he/she does not have to attend the course.
2) Inconsistent Matching Between Requested Skill/Knowledge and Trainings
Matching of requested skill/knowledge with the trainings is an important issue. If supply of training does not meet the demand of knowledge/skill, training cannot improve the achievement of public services. Public and private training institutes should explain their syllabus or course outline to the potential clients and participants. Study Leave is a good system of human resource development,
Project for Formulation of Comprehensive Development Master Plan in the Mombasa Gate City in the Republic of Kenya Final Report
6-7 Nippon Koei Co., Ltd. / PADECO Co., Ltd. / Eight-Japan Engineering Consultants Inc.
however, if the officer has an intention to come back to the office again, he/she should discuss it with his/her chief to clarify how her learnings can contribute to the specific public services that the county needs to improve on.
3) No Evaluation of Training Effectiveness Effectiveness of trainings can be measured in the ways listed below, and which are not fully included in the human resource development system of the county government. The following items are not taken into consideration for the training evaluation.
a) Reaction: This is an evaluation by the training participants. If he/she has learned enough, if the instructor is good or not, if what he/she learned can be applied to his/her tasks, etc.
b) Learning: This is an evaluation of knowledge and skill acquired from the training. This can be measured through a final-test. Comparison of achievement between the pre-test and final test may show the first-hand effectiveness of the training.
c) Behaviour: How the trainee applied the acquired knowledge and skill to his/her tasks. Follow-up survey such as questionnaire to colleagues and bosses may be needed.
d) Result: How the training results contributed to the achievement of the mission of the organisation. This survey needs a check list of the effectiveness measurement.
(2) Little Information Available for Training Schemes and Courses Information of training opportunity is often available at the department chief’s desk and not always available to all the officers and staff. Even though a couple of million KES is allocated in a department budget, often, it is not spent by the end of fiscal year. Officers might be too busy in a situation of human resource shortage to take office leave for training. However, if each department recognises the importance of human resource development and offers information of available trainings, officers may try to get more chance of training. Spontaneous motivation to improve his/her capacity is the first step of human resource development.
Information on trainings may include those of the central government and development partners. Seminars, trainings, and even scholarships of the central government or development partners are less expensive and are often precisely focused on the urban management issue of the present situation in Kenya. However, these occasions are not fully utilised.
(3) Little Consideration on Alternatives of Training Competent human resource is necessary for delivering public services of the county government. Training is one methodology to secure appropriate human resource in each department. However, there are some other alternatives to secure quality public services. The following alternatives have not been considered in effective combination:
1) Recruitment If the departments can add new employees with the needed knowledge and skills, the hired employees would not need immediate training. The county government expects to add more staff in the near future, thus the qualifications for the newly recruited position should be carefully prepared, and candidate experience and ability should be strictly examined.
Project for Formulation of Comprehensive Development Master Plan in the Mombasa Gate City in the Republic of Kenya Final Report
6-8 Nippon Koei Co., Ltd. / PADECO Co., Ltd. / Eight-Japan Engineering Consultants Inc.
2) Contracting-Out Some jobs and works can be contracted-out from the private sector. Designing building structures and infrastructure, and supervising these works are the typical cases. Contracting-out reduces the necessity of training human resource in the public sectors. Each department should check up public services and relevant works, and facilitate contract-out.
3) Privatisation There can be many public business sectors that can be privatised. Some public businesses get income from beneficiaries, such as water supply, sewage, education, medical care, housing, parking, and solid waste collection. These services have potential for privatisation, or even partial privatisation. Once a public service is privatised, the county government can be free from the duty of human resource management in that sector.
6.2 Urban Development Control
6.2.1 Overview Since this is a transition period from a centralised public administration to a decentralised one, laws and regulations have not been fully prepared or approved. For example, The Physical Planning law has not been enacted. There is only one officer in-charge of controlling land development and building construction, which is not enough work force for this duty. Rapid migration1 and urbanisation, as well as the tendency of ignoring legal procedure, affect orderly and disciplined urbanisation. Squatting and unapproved developments are observed.
6.2.2 Review of Legal Framework of Development Control
(1) Legal Framework The new constitution writes that local authority has responsibility of urban control. Article 29, Part V of the Physical Planning Act (1996) describes:
PART V Control of Development Article 29 Powers of Local Authorities Subject to the provisions of this act, each local authority shall have the power— to prohibit or control the use and development of land and buildings in the interests of proper and orderly development of its area;
Actual control tools are defined in the Physical Planning Act (1996). A bill to revise this act has been prepared and is just waiting for enactment (information as of September 10, 2015).
1Refer to Figure 2.3.1 for the significance of rapid population growth.
Project for Formulation of Comprehensive Development Master Plan in the Mombasa Gate City in the Republic of Kenya Final Report
6-9 Nippon Koei Co., Ltd. / PADECO Co., Ltd. / Eight-Japan Engineering Consultants Inc.
Outline of Physical Planning Act (1996) PART I – Preliminary PART II – Administration PART III – Establishment and Composition of Physical Planning Liaison Committees PART IV – Physical Development Plans A—Regional Physical Development Plan B—Local Physical Development Plan PART V – Control of Development PART VI – Miscellaneous The act consists of two major parts, 1) Physical Development Plans (part IV) and Control of Development (Part V). The following schedules (1, 2 and 3) define the contents of the physical plans. FIRST SCHEDULE Matters which May be Dealt Within Regional Physical Development Plans PART I – Analysis PART II – Policy PART III – Implementation SECOND SCHEDULE Matters which May be Dealt Within Local Physical Development Plans THIRD SCHEDULE Long-term, Short-term, Renewal and Redevelopment Plans A—Long-term Plans B—Short-term Plans C—Renewal or Redevelopment Plans
The County Government Act also refers to the authority of development control. It mentions:
Article 111 City or Municipal Plans
A city or municipal plans shall be the instrument for development facilitation and development control within the respective city or municipality.
A city or municipal plan shall within a particular city or municipality, provide for development control in the city or municipality within the national housing and building code framework.
Description in Urban Areas and Cities Act is as follows:
PART V Integrated Development Planning Article 36. “Objectives of Integrated Urban Areas and City Development Planning” (1) Every city and municipality established under this Act shall operate within the framework of
integrated development planning which shall be the basis for development control. First Schedule: “Classification of Cities and Towns by Services” In classifying an area as a city, municipality, or town, the regard shall be the ability to provide the following services: City – (Population at least 500,000) Planning and Development Control, Traffic Control and Parking, Water and Sanitation, Street Lighting, Outdoor Advertising, Cemeteries and Crematoria, Public Transport, Libraries, Storm Drainage, Ambulance Services, Heath Facilities, Fire Fighting and Disaster Management, Control of Drugs, Sports and Cultural Activities, Electricity and Gas Reticulation, Abattoirs, Refuse Collection, Solid Waste Management, Air Pollution, Child Care Facilities, Pre-Primary Education, Local Distributor Roads, Conference Facilities, Community Centres, Five Star Hotel, Guest Houses, National Hospital, Referral Hospital, County Hospital, University, Constituent University Campuses, Polytechnic, Training Institution, National School, County School, Stadium, National
Project for Formulation of Comprehensive Development Master Plan in the Mombasa Gate City in the Republic of Kenya Final Report
6-10 Nippon Koei Co., Ltd. / PADECO Co., Ltd. / Eight-Japan Engineering Consultants Inc.
Stadium International Airport, Airport, Airstrip, National Theatre, Theatre, Library Service, Administrative Seat, Financial Hub, Diplomatic Hub, Consulate, Museum, Historical Monument, Fire Station, Emergency Postal Services, National TV Station, National Radio Station, Regional Radio Station, Community Radio, Casinos, Funeral Parlour, Cemetery, Recreational Parks, Management of Markets, Marine Water Front, Animal Control and Welfare, and Religious Institution.
Description in Building Code is as follows:
Outline of Building Code (2009 Edition) The Colonial Government introduced a by-laws for building development controls in 1929. After several renovations, the latest edition of the building code was introduced in 2009. This code is also called “Planning and Building Regulations”. The scope of the code and contents of the code are as follows: “These regulations cover provisions for national, regional and local physical planning, siting, site operations, building design, building and infrastructure services, disaster risk management on construction sites and maintenance of all buildings as contained in these regulations.” Volume 1: Interpretation and Administration Volume 2: Physical Planning, Sitting and Site Preparation Volume 3: Structure and Materials Volume 4: Building Services Volume 5: Safety, Disaster Risk Management and Maintenance
(2) Current Development Plan and Control Procedure of Mombasa County
1) Development Plan and Control Procedure The legal framework defines that both land development/improvement and building construction need approval of the county government. Two important bases for checking land development and building permission are Mombasa Physical Development Plan (1971) and the Kenya Building Code.
The county government examines applications and makes three alternative decisions: 1) permission, 2) permission with condition/recommendation, or 3) refusal. Inspection is conducted as a procedure of examining land development application. The Environmental Impact Assessment (EIA) and Initial Environmental Examination (IEE) procedure handled by the National Environmental Management Authority (NEMA) is often a recommendation of land development and building permission. In some cases, land development/building permission can be issued without EIA/IEE. In other cases, EIA/IEE is required before the land development/building permission. The details are defined in the Physical, Planning Bill.
2) Partial Trial of Land Use Control The zoning mentioned in c) above covers all the Mombasa County area. On the other hand, there are some priority areas where development control with zoning has been in practice.
The Mombasa Physical Development Plan (1971), was not consistent or detailed enough to conduct the development control based on its zoning. However, Mombasa County has proposed (not yet approved as of August 13, 2016) two zoning plans with practical control items:
Nyali/Shanzu Zoning Plan This is to conserve the good environment of the spacey and quiet residential area.
Project for Formulation of Comprehensive Development Master Plan in the Mombasa Gate City in the Republic of Kenya Final Report
6-11 Nippon Koei Co., Ltd. / PADECO Co., Ltd. / Eight-Japan Engineering Consultants Inc.
Changamwe/Miritini Zoning Plan This is to facilitate a well-organised development of the industrial area.
Even though these plans have not been authorised yet, applications of land development and building construction of the abovementioned areas are controlled by these proposed plans. By these plans, Mombasa County regulates the development with the following aspects:
Land and building use Land and building use of residential, commercial, industrial, tourism and other purposes is regulated.
Storey of houses Limitation on the number of floors (two, three or four-storey) is regulated.
Minimum land area Minimum land area for the plot is regulated. (Example: One acre of land for one house.)
This trial of land use control would be invalid if the new zoning and relevant regulations are approved. However, lessons learned from this trial zoning regulation should be applied to the new full-scale land use control.
(3) Prospective Regulation for Land Development and Building Construction
1) New Land Use Plan The new zoning regulation is under preparation. Zoning outline and methodologies are prepared by the Integrated Strategic Urban Development Plan for Mombasa Town (ISUD Plan 2035). This ISUD Plan includes the proposed land use plan for 2035. This land use plan (zoning) is prepared in consistent with the existing land use. The number of existing non-conforming buildings is rather small. There are 16 variations of land uses proposed in the ISUD Plan, namely:
Residential Transportation Riparian Reserve Industrial Recreational Water Pond Commercial Beach Creek Educational Forest Ocean Public Purpose Agricultural Public Utility Future Development
Basic development/conservation guideline is proposed for each zone in the ISUD Plan. Figure 6.2.1 below shows the proposed zoning proposed by the ISUD Plan.
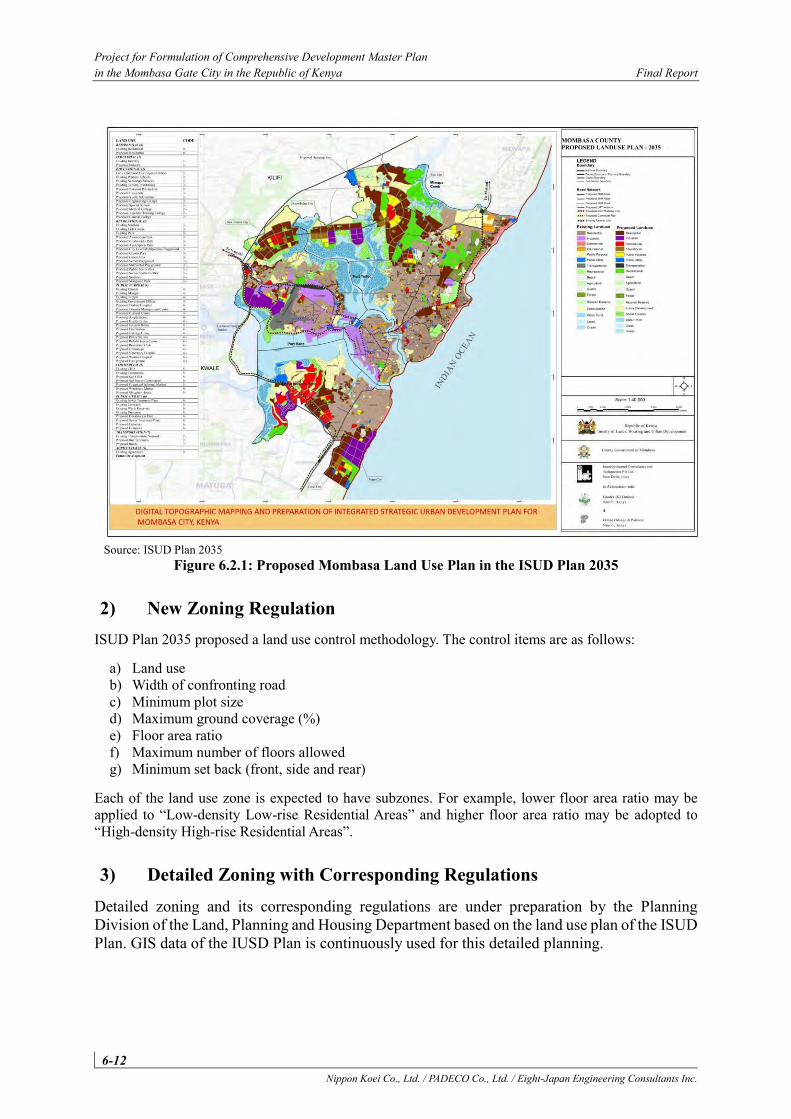
Project for Formulation of Comprehensive Development Master Plan in the Mombasa Gate City in the Republic of Kenya Final Report
6-12 Nippon Koei Co., Ltd. / PADECO Co., Ltd. / Eight-Japan Engineering Consultants Inc.
Source: ISUD Plan 2035
Figure 6.2.1: Proposed Mombasa Land Use Plan in the ISUD Plan 2035
2) New Zoning Regulation ISUD Plan 2035 proposed a land use control methodology. The control items are as follows:
a) Land use b) Width of confronting road c) Minimum plot size d) Maximum ground coverage (%) e) Floor area ratio f) Maximum number of floors allowed g) Minimum set back (front, side and rear)
Each of the land use zone is expected to have subzones. For example, lower floor area ratio may be applied to “Low-density Low-rise Residential Areas” and higher floor area ratio may be adopted to “High-density High-rise Residential Areas”.
3) Detailed Zoning with Corresponding Regulations Detailed zoning and its corresponding regulations are under preparation by the Planning Division of the Land, Planning and Housing Department based on the land use plan of the ISUD Plan. GIS data of the IUSD Plan is continuously used for this detailed planning.
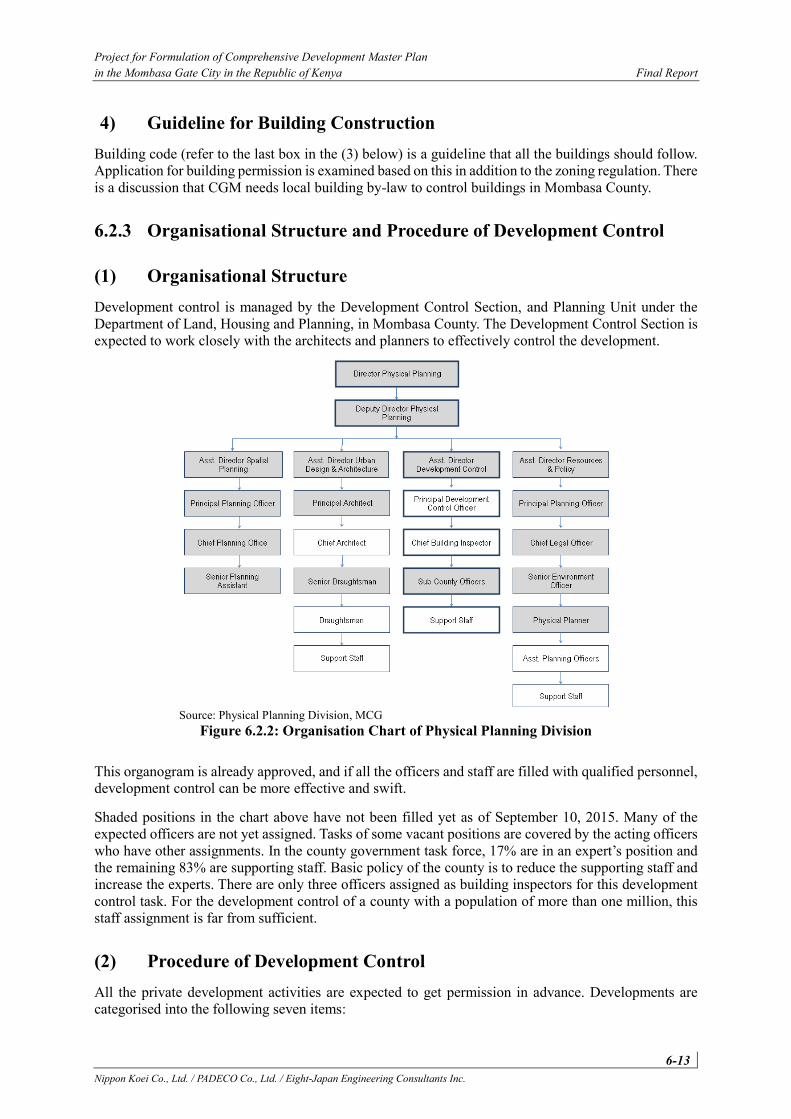
Project for Formulation of Comprehensive Development Master Plan in the Mombasa Gate City in the Republic of Kenya Final Report
6-13 Nippon Koei Co., Ltd. / PADECO Co., Ltd. / Eight-Japan Engineering Consultants Inc.
4) Guideline for Building Construction Building code (refer to the last box in the (3) below) is a guideline that all the buildings should follow. Application for building permission is examined based on this in addition to the zoning regulation. There is a discussion that CGM needs local building by-law to control buildings in Mombasa County.
6.2.3 Organisational Structure and Procedure of Development Control
(1) Organisational Structure Development control is managed by the Development Control Section, and Planning Unit under the Department of Land, Housing and Planning, in Mombasa County. The Development Control Section is expected to work closely with the architects and planners to effectively control the development.
Source: Physical Planning Division, MCG
Figure 6.2.2: Organisation Chart of Physical Planning Division
This organogram is already approved, and if all the officers and staff are filled with qualified personnel, development control can be more effective and swift.
Shaded positions in the chart above have not been filled yet as of September 10, 2015. Many of the expected officers are not yet assigned. Tasks of some vacant positions are covered by the acting officers who have other assignments. In the county government task force, 17% are in an expert’s position and the remaining 83% are supporting staff. Basic policy of the county is to reduce the supporting staff and increase the experts. There are only three officers assigned as building inspectors for this development control task. For the development control of a county with a population of more than one million, this staff assignment is far from sufficient.
(2) Procedure of Development Control All the private development activities are expected to get permission in advance. Developments are categorised into the following seven items:
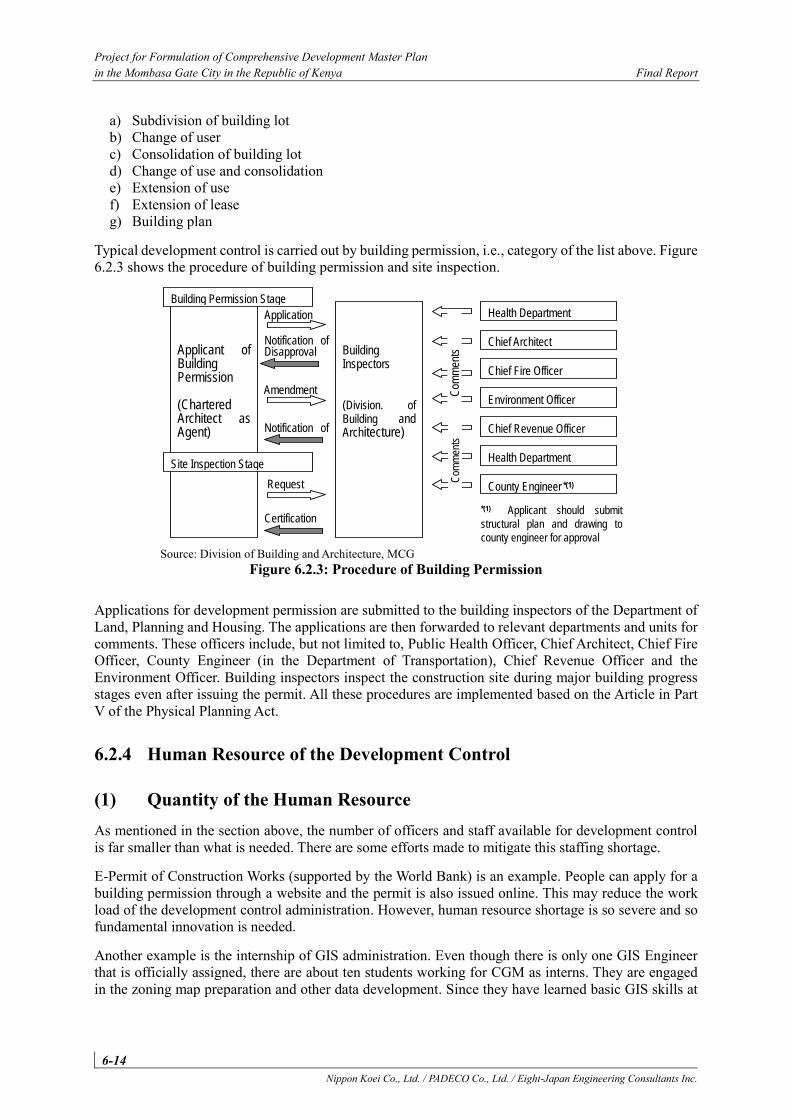
Project for Formulation of Comprehensive Development Master Plan in the Mombasa Gate City in the Republic of Kenya Final Report
6-14 Nippon Koei Co., Ltd. / PADECO Co., Ltd. / Eight-Japan Engineering Consultants Inc.
a) Subdivision of building lot b) Change of user c) Consolidation of building lot d) Change of use and consolidation e) Extension of use f) Extension of lease g) Building plan
Typical development control is carried out by building permission, i.e., category of the list above. Figure 6.2.3 shows the procedure of building permission and site inspection.
Source: Division of Building and Architecture, MCG
Figure 6.2.3: Procedure of Building Permission
Applications for development permission are submitted to the building inspectors of the Department of Land, Planning and Housing. The applications are then forwarded to relevant departments and units for comments. These officers include, but not limited to, Public Health Officer, Chief Architect, Chief Fire Officer, County Engineer (in the Department of Transportation), Chief Revenue Officer and the Environment Officer. Building inspectors inspect the construction site during major building progress stages even after issuing the permit. All these procedures are implemented based on the Article in Part V of the Physical Planning Act.
6.2.4 Human Resource of the Development Control
(1) Quantity of the Human Resource As mentioned in the section above, the number of officers and staff available for development control is far smaller than what is needed. There are some efforts made to mitigate this staffing shortage.
E-Permit of Construction Works (supported by the World Bank) is an example. People can apply for a building permission through a website and the permit is also issued online. This may reduce the work load of the development control administration. However, human resource shortage is so severe and so fundamental innovation is needed.
Another example is the internship of GIS administration. Even though there is only one GIS Engineer that is officially assigned, there are about ten students working for CGM as interns. They are engaged in the zoning map preparation and other data development. Since they have learned basic GIS skills at
Building Inspectors (Division. of Building and Architecture)
Applicant of Building Permission (Chartered Architect as Agent)
Chief Architect
Health Department
Environment Officer
Chief Fire Officer
Health Department
Chief Revenue Officer
Com
men
ts Notification of
Disapproval
Application
Amendment
Notification of
Approval C
omm
ents
*(1) Applicant should submit
structural plan and drawing to
county engineer for approval
Building Permission Stage
Site Inspection Stage
County Engineer *(1) Request
Certification
after
Inspection
Project for Formulation of Comprehensive Development Master Plan in the Mombasa Gate City in the Republic of Kenya Final Report
6-15 Nippon Koei Co., Ltd. / PADECO Co., Ltd. / Eight-Japan Engineering Consultants Inc.
their university, they can contribute to the CGM administration and at the same time, they can learn how the GIS technology is applied to practical situations.
(2) Quality of the Human Resource Quality of assigned officers for development control is not sufficient. For example, building inspectors have no educational background in architecture or building engineering. This affects the detailed discussion with architects, who are representatives of the building owners. There are some training institutes and universities conducting relevant diploma courses as evening classes. Directors and assistant directors are aware that many officers need such training. It is a contradiction that they are too busy to allocate time for training.
6.2.5 Issues and Constraints of Development Control According to the Assistant Director in the Development Control Section of the Planning Unit, there are many issues in development control. The following are the issues of development control based on the analysis of sections above, as well as from the interviews with the officers.
(1) Insufficient Number of Qualified Officers For human resource to carry out the development control is not sufficient in quantity as well as in quality. This constraint causes significant problems including those mentioned below.
(2) Uncontrolled Development Major problem of the urban control is the development without permission. In the past years (June 2015-May 2016), the county authority issued 575 development permissions. However, still many developments are performed even without permission. Very few of the houses in the informal settlements are built with permission. Only three inspectors are handling this task. The director of the Building and Architecture Division requires 20 inspectors to carry out this development control duty.
(3) Difficulty of Law Enforcement The Principal Development Control Offices and Chief Building Inspector are in-charge of law enforcement. Even if the county authority is aware of the violation of laws, the Development Control Section has very limited human resource that they cannot take due to action against illegal development. Development application is submitted through qualified architects or planners. These professionals are not engaged in smaller buildings of ordinary citizens. Accordingly, owners of smaller buildings do not follow the development permit procedure.
(4) Land Tenure and Squatting Development control requests for an agreement with the land owner of the development or building site. Also, the right land owner should have fully paid the land rates (tax). It is at times difficult to ascertain the rightful legal owner of the land and there are many cases of squatting on public land. Thus, especially in low income residential areas, it is a difficult task to establish the rightful land owners and this also further complicates the development control. Therefore, if a person wants to get a permit for a new building on a land that is of unclear ownership, it is impossible for the authority to issue one. At this moment, cadastre map and information are managed through a hard copy. There is an intention to introduce GIS to improve the quality of administration by identifying the ownership and history of land rate payment.
Project for Formulation of Comprehensive Development Master Plan in the Mombasa Gate City in the Republic of Kenya Final Report
6-16 Nippon Koei Co., Ltd. / PADECO Co., Ltd. / Eight-Japan Engineering Consultants Inc.
6.3 Human Resource Development for Public Private Partnership (PPP)
6.3.1 Overview This section discusses how a human resource development of Public Private Partnership (PPP) related officers of the county can contribute to the actual implementation of the priority subprojects.
In the recent years, the idea of PPP is applied to many public works. Table 6.3.1 shows some prospective projects of the PPP. Thus, Mombasa area including County Government of Mombasa, needs to develop human resource to accomplish these projects.
Table 6.3.1: Prospective Projects in Mombasa Name of Subproject Contracting Authority 1 2nd Nyali Bridge Kenya Urban Roads Authority (KURA) 2 Dualling of Mombasa - Nairobi Highway Kenya National Highways Authority (KeNHA) 3 Mombasa 2nd Container Terminal Phase II and III Kenya Ports Authority (KPA) 4 Mombasa Port Development Project (MPDP) Kenya Ports Authority (KPA) 5 Conversion of Berth 11-14 Into Container Terminals Kenya Ports Authority (KPA) 6 Multi-storey Terminal at Likoni Kenya Ferry Services Limited (KFSL) 7 Integrated Marine Transport System (IMTS) County Government of Mombasa (CGM) 8 Mombasa Petroleum Trading Hub National Oil Corporation of Kenya (NOCK) 9 Mombasa Solid Waste Management County Government of Mombasa (CGM) 10 Multilevel Car Park Facility in Mombasa County Mombasa County 10 Special Economic Zone (SEZ) Ministry of Industrialisation and Enterprise Dev. 11 Mombasa International Convention Centre (MICC) Tourism Finance Corporation (TFC)
Source: PPP Pipeline Status Report, March 2016
6.3.2 Framework and Organisation of PPP PPP’s relevant organisations and individuals are as follows:
(1) Public Private Partnership Unit (PPP Unit) This PPP Unit is at the National Treasury and takes the overall responsibility in promoting and managing PPP at the central government level. It maintains a good website where useful information, such as PPP Manual, is available. Contracting authorities, including the county government, needs the approval of the PPU to implement the PPP project.
(2) PPP Node PPP Act 2013 defines and expects the functions of PPP Node as follows2:
Each contracting authority intending to undertake a PPP project is required to establish a PPP Node staffed with officers with the ability to carry out day-to-day management of a PPP project (i.e., financial, technical, procurement, and legal personnel).
2 Information from PPP Unit.
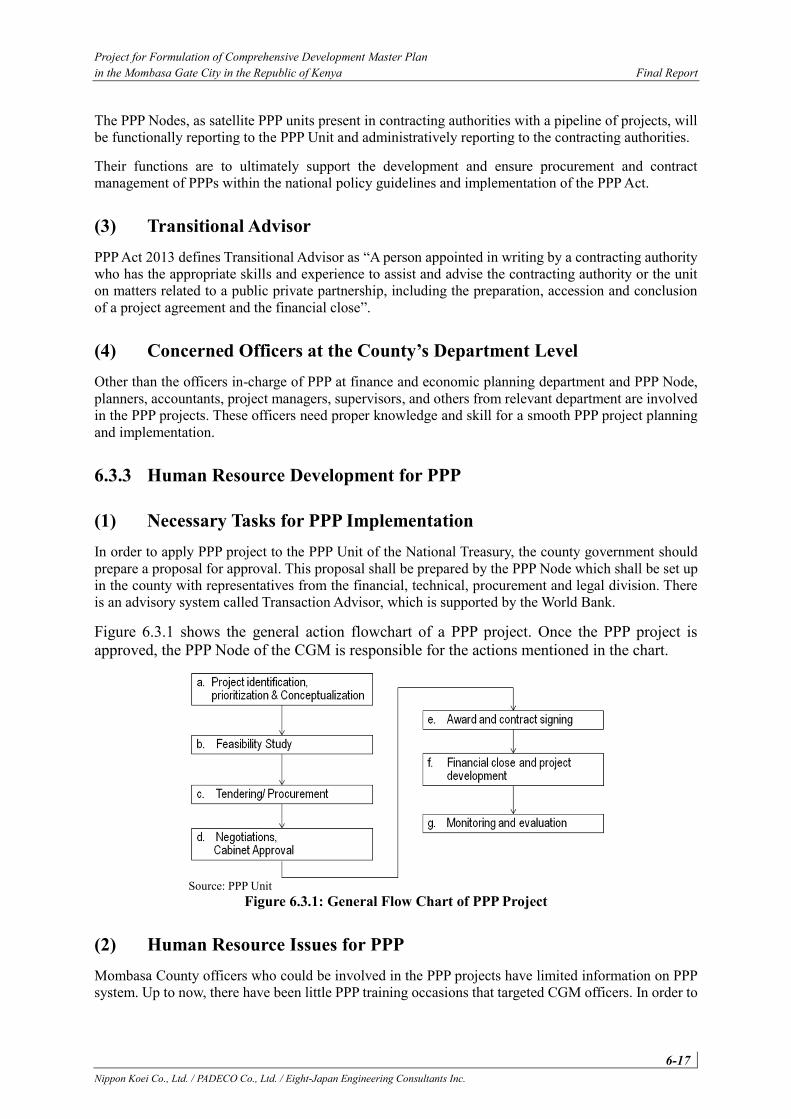
Project for Formulation of Comprehensive Development Master Plan in the Mombasa Gate City in the Republic of Kenya Final Report
6-17 Nippon Koei Co., Ltd. / PADECO Co., Ltd. / Eight-Japan Engineering Consultants Inc.
The PPP Nodes, as satellite PPP units present in contracting authorities with a pipeline of projects, will be functionally reporting to the PPP Unit and administratively reporting to the contracting authorities.
Their functions are to ultimately support the development and ensure procurement and contract management of PPPs within the national policy guidelines and implementation of the PPP Act.
(3) Transitional Advisor PPP Act 2013 defines Transitional Advisor as “A person appointed in writing by a contracting authority who has the appropriate skills and experience to assist and advise the contracting authority or the unit on matters related to a public private partnership, including the preparation, accession and conclusion of a project agreement and the financial close”.
(4) Concerned Officers at the County’s Department Level Other than the officers in-charge of PPP at finance and economic planning department and PPP Node, planners, accountants, project managers, supervisors, and others from relevant department are involved in the PPP projects. These officers need proper knowledge and skill for a smooth PPP project planning and implementation.
6.3.3 Human Resource Development for PPP
(1) Necessary Tasks for PPP Implementation In order to apply PPP project to the PPP Unit of the National Treasury, the county government should prepare a proposal for approval. This proposal shall be prepared by the PPP Node which shall be set up in the county with representatives from the financial, technical, procurement and legal division. There is an advisory system called Transaction Advisor, which is supported by the World Bank.
Figure 6.3.1 shows the general action flowchart of a PPP project. Once the PPP project is approved, the PPP Node of the CGM is responsible for the actions mentioned in the chart.
Source: PPP Unit
Figure 6.3.1: General Flow Chart of PPP Project
(2) Human Resource Issues for PPP Mombasa County officers who could be involved in the PPP projects have limited information on PPP system. Up to now, there have been little PPP training occasions that targeted CGM officers. In order to
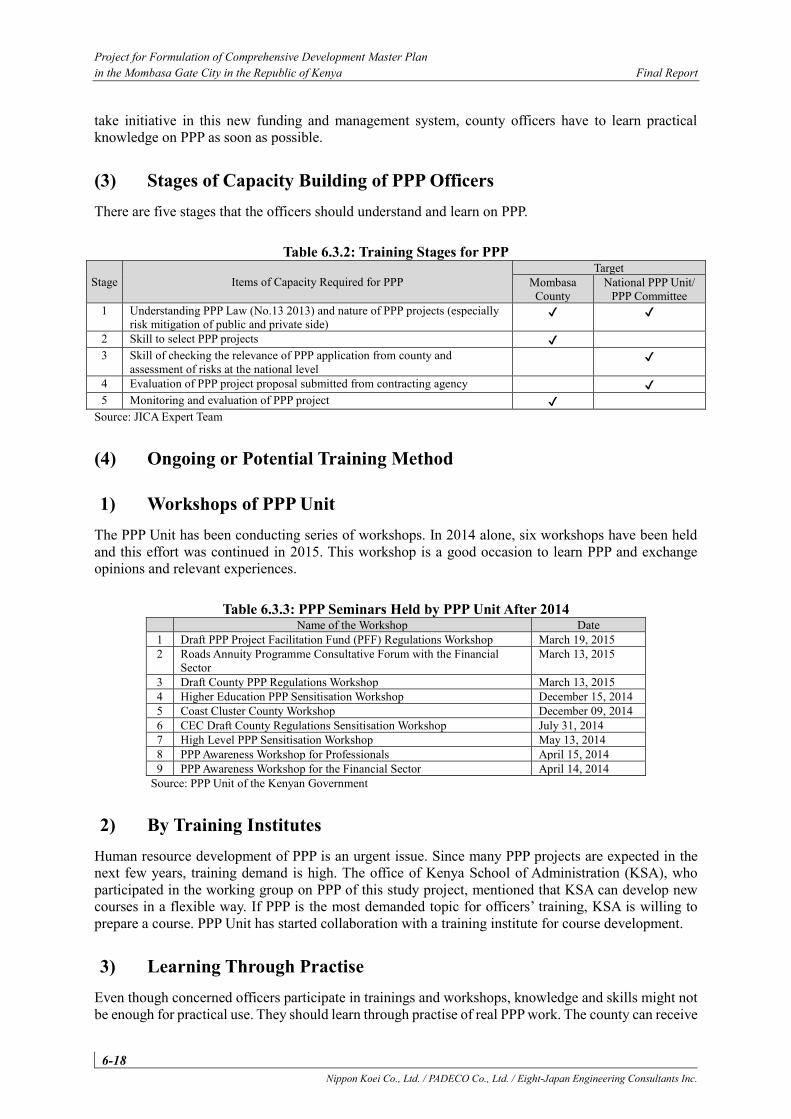
Project for Formulation of Comprehensive Development Master Plan in the Mombasa Gate City in the Republic of Kenya Final Report
6-18 Nippon Koei Co., Ltd. / PADECO Co., Ltd. / Eight-Japan Engineering Consultants Inc.
take initiative in this new funding and management system, county officers have to learn practical knowledge on PPP as soon as possible.
(3) Stages of Capacity Building of PPP Officers There are five stages that the officers should understand and learn on PPP.
Table 6.3.2: Training Stages for PPP
Stage Items of Capacity Required for PPP Target
Mombasa County
National PPP Unit/ PPP Committee
1 Understanding PPP Law (No.13 2013) and nature of PPP projects (especially risk mitigation of public and private side)
✔ ✔
2 Skill to select PPP projects ✔ 3 Skill of checking the relevance of PPP application from county and
assessment of risks at the national level ✔
4 Evaluation of PPP project proposal submitted from contracting agency ✔ 5 Monitoring and evaluation of PPP project ✔
Source: JICA Expert Team
(4) Ongoing or Potential Training Method
1) Workshops of PPP Unit The PPP Unit has been conducting series of workshops. In 2014 alone, six workshops have been held and this effort was continued in 2015. This workshop is a good occasion to learn PPP and exchange opinions and relevant experiences.
Table 6.3.3: PPP Seminars Held by PPP Unit After 2014 Name of the Workshop Date
1 Draft PPP Project Facilitation Fund (PFF) Regulations Workshop March 19, 2015 2 Roads Annuity Programme Consultative Forum with the Financial
Sector March 13, 2015
3 Draft County PPP Regulations Workshop March 13, 2015 4 Higher Education PPP Sensitisation Workshop December 15, 2014 5 Coast Cluster County Workshop December 09, 2014 6 CEC Draft County Regulations Sensitisation Workshop July 31, 2014 7 High Level PPP Sensitisation Workshop May 13, 2014 8 PPP Awareness Workshop for Professionals April 15, 2014 9 PPP Awareness Workshop for the Financial Sector April 14, 2014
Source: PPP Unit of the Kenyan Government
2) By Training Institutes Human resource development of PPP is an urgent issue. Since many PPP projects are expected in the next few years, training demand is high. The office of Kenya School of Administration (KSA), who participated in the working group on PPP of this study project, mentioned that KSA can develop new courses in a flexible way. If PPP is the most demanded topic for officers’ training, KSA is willing to prepare a course. PPP Unit has started collaboration with a training institute for course development.
3) Learning Through Practise Even though concerned officers participate in trainings and workshops, knowledge and skills might not be enough for practical use. They should learn through practise of real PPP work. The county can receive
Project for Formulation of Comprehensive Development Master Plan in the Mombasa Gate City in the Republic of Kenya Final Report
6-19 Nippon Koei Co., Ltd. / PADECO Co., Ltd. / Eight-Japan Engineering Consultants Inc.
Transaction Advisors (from PPP Unit) who support county officers for the planning and implementation of PPP projects. Thus, for the county officers who are involved in the PPP project, Transaction Advisors are very good resource persons to work with. PPP Unit can also technically and financially support the feasibility studies (F/S) of the prospective PPP projects, which is also a good chance to understand PPP. Once the county achieves a good practice, officers involved become experts of PPP.

Project for Formulation of Comprehensive Development Master Plan in the Mombasa Gate City in the Republic of Kenya Final Report
7-1 Nippon Koei Co., Ltd. / PADECO Co., Ltd. / Eight-Japan Engineering Consultants Inc.
7. Planning Issues and Directions
7.1 General Planning issues and directions, which have been addressed in the interim report, are re-captured for (i) socioeconomic sector, (ii) urban development, (iii) roads, transport, and logistics sector, (iv) infrastructure sector, and (v) urban management sector to be considered in the planning aspect.
7.2 Socio-economy
7.2.1 Social Service and Facilities Inadequate basic educational facilities: In Mombasa County, there is a shortage of public
facilities, whilst the existing facilities lack proper infrastructure. The gap created by insufficient number of public facilities is being covered by private facilities, which are also lacking in infrastructure.
Connection between education and labour market: Kenya Vision 2030 and Mombasa County Vision on the education sector put greater emphasis on the linkage between education and labour
market by creating entrepreneurial skills and competencies. There is a need for more higher education and training courses focusing on the industries in the county.
Inadequate health service delivery points: There is inadequate number of facilities in relation to the total population of the county, with existing facilities with poor quality infrastructure and service. Furthermore, the suburban areas of the county have larger share of the shortage. To attain the vision and improve the situation, the county should establish referral hospitals and emergency medical services in each subcounty as a first step.
7.2.2 Housing Condition Shortage of affordable and quality housing especially for lower income households: There is
a shortage of affordable and quality housing especially for lower income households. Due to insufficient financial capital of the County Government of Mombasa (CGM), they are unable to provide houses, hence, positioning the private sector to be the dominant player in the housing sector. There is a greater need for CGM to support the development of low-cost housing and also promote the private sector’s participation in the housing supply.
Inadequate management of development approval system: Mombasa County has witnessed an increased in growth of unplanned settlements. This is a result of inadequate management of development approval system. According to a survey, as much as half of the respondents who owned houses did not seek approvals from CGM before commencing the construction. Some landlords have agreements with tenants without validation or change of user. As a result, many housing estates and settlements have come up without access roads, proper drainage systems, water, and provisions for social amenities such as schools, playgrounds, and recreational facilities. The county government should also improve the current system.
Project for Formulation of Comprehensive Development Master Plan in the Mombasa Gate City in the Republic of Kenya Final Report
7-2 Nippon Koei Co., Ltd. / PADECO Co., Ltd. / Eight-Japan Engineering Consultants Inc.
7.2.3 Tourism and Heritage Lack of coordination with the national authorities in terms of infrastructure development
which supports tourism: Accessibility is an essential factor to support tourism. However, Mombasa County does not have a mandate to develop national roads and ports. There is no mechanism to coordinate between the authorities to consider regional priorities.
Lack of consideration for tourist’s preference in product development: The current service providers do not take tourist’s needs into consideration. In other words, they offer their tourism products and services based on their own needs rather than tourist’s needs.
Under exploitation of tourism resources / heritages: Mombasa County offers various kinds of tourism resources. In collaboration with the surrounding areas, it can offer more diversified and competitive tourism products; however, those have not been well utilised.
Limited tourism products: Although tourism resources exist in Mombasa County, their value is being deteriorated without proper maintenance. The county and private sector have to take a role of maintenance to add value to tourism resources.
Limited capacity of service providers: In order to promote eco-tourism and responsible tourism with the intention to diversify tourism products, professional guides are one of the key factors. Hence, it is vital to develop and upgrade professional skills of existing service providers.
Unstructured interaction between tourists and local communities: Decades ago, there were many initiatives of community involvement within the tourism industry. However, the product value could not be maintained. Hence, the county should build capacity amongst the locals.
Environmental degradation: Environmental degradation such as shoreline erosion and poor waste management is a concern. Tourism awareness should be incorporated in the curriculum to enhance environmental conservation and improve tourism environments.
Limited capacity of tourism-related organisations: The newly established Department of Tourism Development and Culture in Mombasa County suffers from shortage of manpower. Hence, the recruitment of staff to plan and implement the various mandates is essential.
Lack of effective coordination between the public and private sector: This results from the limited capacity of the Department of Tourism Development and Culture. The county needs to: develop marketing strategy; provide effective and efficient market trend information and analysis for private investors; and distribute information of developed tourism products through concerned channels.
7.3 Urban Development
7.3.1 Urban Development in General Sprawl and expansion of uncontrolled urban development: The sprawl and expansion of
uncontrolled urban development occurs for several reasons which include lack of implementation of the 1971 Master Plan and ineffective execution of development control. In order to stop the sprawl, the master plan has to be updated to match the development trend and to clarify development direction including development promotion area and controlled area for effective control.
Insufficient provision of infrastructure and urban services: Because of population increase and expansion of urbanised area, infrastructure and urban services are not adequate in terms of quantity and quality. Urban infrastructure is poor in urban areas where infrastructure is old and not functioning, and urban infrastructure is inadequate in the suburbs because infrastructure development lags behind the population growth and urbanisation. Similar condition can be observed for urban services such as education and health. Both quality and quantity of service are poor. Infrastructure and urban services have to be improved for serving the population in Mombasa County and for Mombasa County to function as a “Gateway City” for the Northern Economic Corridor.
Project for Formulation of Comprehensive Development Master Plan in the Mombasa Gate City in the Republic of Kenya Final Report
7-3 Nippon Koei Co., Ltd. / PADECO Co., Ltd. / Eight-Japan Engineering Consultants Inc.
Poor linkage of road network and land use: Since Mombasa County is composed of mainland and island, there is some constraint in urbanisation and road network. Urbanisation is concentrated in the area where transportation is connecting the island and the mainland. Kongowea is located at the area where Nyali Bridge connects the island and the mainland, and the market and some commercial functions are developed. Due to poor intersection design and poor urban development plan, the area is congested with vehicles and pedestrians. Similar situation is seen in many other locations in Mombasa County. Proper urban development has to be adopted to improve the condition.
Mixture of urban and logistic functions: One of the main urban characteristics of Mombasa County is the mixture of urban and logistic functions, particularly in the area of Changamwe and Jomvu, where airport, port, CFS, industry, warehouse, and residential function are mixed. Heavy traffic generated from and to the port is the main cause of traffic congestion and air pollution, which is considered a nuisance for the local people. Regional traffic and local traffic have to be separated to minimise the impact to the local people; transport and land use have to be considered together to avoid further congestion expected from the expansion of port and development of subcentres.
Excessive concentration and poor condition of infrastructure in the Mombasa Island: One of the major issues in Mombasa County is the congestion in the Mombasa Island, which is caused by mixed function, including residential function, commercial function, industrial function, and port function. Mixed function (port and industry) is causing inflow of Northern Corridor related traffic. Road network or artery traffic flow is also not clearly defined, which is creating mixed transport mode. In addition, most of the infrastructures were developed during the colonial era and most of them are in poor condition. Wastewater treatment plant, for example, is not functioning anymore. The condition of the island has to be improved through proper land use, proper traffic flow including installation of new public transport system, and rehabilitation of infrastructure.
7.3.2 Informal Settlements Formalisation of informal settlements: It refers to legal processes where improved residential
areas are created with formal services through which residents obtain formal security of tenure. This can be achieved through in-situ upgrades, through relocation and also through having the informal settlement declared as a formal residential area, bringing about clearly demarcated land parcels and provision of services such as water and sanitation, and residents obtaining formal security of tenure. The aim of formalisation of informal settlements is, amongst others, to provide certainty to people living in these areas. Once settlements have been formally recognised and infrastructure is put in place, people feel secure enough to start investing in their dwellings.
Upgrading: Slum upgrading is a process through which informal areas are gradually improved, formalised, and incorporated into the city itself, through extending land, services, and citizenship to slum dwellers. It involves providing slum dwellers with the economic, social, institutional, and community services available to other citizens. These services include legal, physical, social, or economic. Slum upgrading is not simply about water or drainage or housing but involves putting into motion the economic, social, institutional, and community activities that are needed to turn around downward trends in an area. These activities should be undertaken collaboratively amongst all parties involved—residents, community groups, businesses as well as local and national authorities, where applicable.
Redevelopment: Slum redevelopment entails the acquisition of the area occupied by the informal settlement, demolition and removal of buildings, and improvements and replanning the area. This is to allow putting up of high-rise structures and making use of the freed up land for the provision of support infrastructure and public facilities.
Relocation: Slum relocation entails the clearing of the informal settlement in its current location and moving the residents to a new development in another location. This may be done so as to move communities settled in vulnerable disaster prone areas such as flood prone areas or those
Project for Formulation of Comprehensive Development Master Plan in the Mombasa Gate City in the Republic of Kenya Final Report
7-4 Nippon Koei Co., Ltd. / PADECO Co., Ltd. / Eight-Japan Engineering Consultants Inc.
residing close to the ocean. Also, these communities can be relocated so as to protect the fragile marine ecosystems. Usually, strategies employed tend to ignore several dimensions of the lives of the dwellers. There is a need to look at several aspects of life in the informal settlements such as the distance from their workplaces, employment opportunities, social integration, etc.
7.4 Roads, Transport, and Logistics Port-related traffic congestion: The biggest traffic issue in Mombasa County is port-related
traffic. Several interventions have been proposed, although it is unlikely that these will completely alleviate the congestion problems in Mainland West.
Port expansion: Not a congestion alleviator. Additional traffic: The Mombasa Port Development Project (MPDP) states that general cargo
and bulk will remain in their existing location up to 2035, which will continue to attract traffic to Shimanzi.
Standard Gauge Railway (SGR): SGR is expected to absorb 30% of freight traffic in 2020-2025. However, generally speaking, conversion from truck-hauling to rail is not easy. Truck operators will attempt to price competitively to maximise their profits against the SGR.
Kipevu Link, Southern Bypass, and Northern Bypass: It can be said that the 95% of traffic from the Mombasa Port to Kipevu Link will head to Nairobi. The Kipevu Link should be extended to Nairobi because currently, it simply joins A109, which is under-capacity.
Institutional issues: At present, no entity answers for problems of port-related traffic. The Kenya Ports Authority (KPA) is concerned with handling within the port. Whilst Kenya Revenue Authority (KRA) focuses on taxation of import containers. Kenya National Highways Authority (KeNHA) is crucially experiencing delays in widening of the road network. Recently, KPA has begun considering congestion alleviation in Changamwe, working with the police. However, this was conducted without inputs from CGM. CGM is attempting to handle port-related traffic; however, it suffers from lack of internal resources.
Urban traffic: As compared with other mega-cities in Asia or even Nairobi, the traffic jams from commuters/private vehicles are not so severe, especially as compared with port-related traffic issues. This is a very encouraging sign for the future growth of Mombasa County.
Gap in road ratio between the island and mainland areas: The high road coverage ratio in the Mombasa Island helps distribute motorised traffic; whereas, the low road coverage ratio in the mainland areas results in inefficient traffic flows.
Focal points: There are several focal points in the city, e.g., Barclays Roundabout, Nyali/Links (Kongowea) Junction, Changamwe Roundabout, and Miritini Junction. The location of the Second Nyali Bridge Proposal is near to the city centre, and together with the Gate Bridge Proposal by KeNHA, those bridges create the shortest passage point between Nyali and Kwale, bringing the regional traffic to Barclays Roundabout. The Northern Bypass, connecting to Miritini, will result in it becoming a future focal point of traffic.
Missing links; No circular road: Similar to Nairobi, the railway station location results in a missing link of a potential “ring corridor” in the Mombasa Island. Arterials in radial direction are rich in Nyali and the Mombasa Island; however, roads in this circular direction are missing in other places.
Policies ignoring low-income groups / Pedestrian traffic: The high-dependency of walking trips is a strength of Mombasa County, and the existing central business district (CBD) network of arcades supports such flows. However, for the most part, these flows are not prioritised with respect to vehicle traffic – there are few exclusive facilities for pedestrians. As a consequence, the mixture of pedestrian and motorised transport generates severe traffic congestion, such as in Kongowea.
Induced traffic and reduced traffic: The three Yen Loan bridges from Mombasa to Kilifi allowing seamless transport along the coastal corridor for more than 100 km, accelerating the motorisation in Mainland North. On the contrary, traffic demand in Mainland South, having poor
Project for Formulation of Comprehensive Development Master Plan in the Mombasa Gate City in the Republic of Kenya Final Report
7-5 Nippon Koei Co., Ltd. / PADECO Co., Ltd. / Eight-Japan Engineering Consultants Inc.
accessibility as compared with Mainland North, has been reduced. The traffic demand in the Mainland West is also strained due to continuous congestion by heavy vehicles.
Limited control over public transport: The low quality of matatu, 3W, and bodaboda services is a threat to the future development of Mombasa County. Mombasa County has certain controls for 3Ws, but enforcement is limited. The matatu industry is rather powerful at the national level, and it is difficult to control at the county level.
7.5 Infrastructure
7.5.1 Water Supply Water volume and quality: The most likely bottleneck for the development of Mombasa County
is considered to be the volume and quality of available water resources. Expanding the capacity through the development of new water resources is necessary to cover the water demand in the near future. Thus, the development of Mwache Dam and water treatment facilities for Mombasa County is indispensable at the start.
Water supply and distribution: According to the site survey by the JICA Expert Team attended by the Coast Water Service Board (CWSB), the pipelines and reservoirs of the distribution network need to be rehabilitated due to overage and unsuitable materials as well as construction of pipeline for expansion. The rehabilitation plan of distribution network is one of the efficient activities to improve Unaccounted for Water (UfW). Therefore, the activities of Vitens Evides International (VEI) jointly with the World Bank will focus on the reduction of non-revenue water.
Cost and energy availability: Based on the Draft Integrated Strategic Urban Development Plan (ISUDP) Proposals Report, even when all water resources are developed, water demand will not be met by 15% (approx. 60,000 m3/day) in 2035. The effect of recycled water and rainwater harvesting as other potential water sources is probably restrictive. However, major constraints of desalination are environmental impacts and high energy cost. Energy costs, energy availability, and the wide range of environmental aspects can constitute serious obstacles and need to be carefully investigated in the future.
7.5.2 Sewerage/Drainage The existing sewer system network is aging and only covers parts of the Mombasa Island and
parts of Mombasa West Mainland. Mainland North and South lack sewerage system. Moreover, the existing wastewater treatment plants (WWTPs) are not fully functioning. Thus, the rehabilitation of existing sewerage facilities in Mombasa County is indispensable and urgent.
The enormous time and cost required for the sewerage projects means that the water environment is frequently contaminated. The status of sewerage and sanitation in areas of urban poor/slums/ informal areas is very poor. Hence, community toilets, public toilets, and septic tank with soak pit are very important projects for safe sanitation. In conducting public works and making policy decisions, reflecting public opinion is increasingly important for the projects. Surveys to collect public opinion are carried out, and opportunities to participate in decision-making process are provided to the community.
Various events and public relation (PR) programs are needed to raise public awareness and understanding about the role of sewerage works and the importance of sewerage development. For example, participants will learn about the effects of sewerage systems through field trips, hands-on workshops, and study sessions on water environment.
Currently, storm water drainage covers only 10% of the total area and almost the non-paved roads do not have storm water drains. The improvement of a comprehensive drainage system is required following the developments in Mombasa County.
Dumping of solid waste and soil by human activities along the drainage channels has caused flooding. Regular programmes to improve awareness on the environmental concerns and public
Project for Formulation of Comprehensive Development Master Plan in the Mombasa Gate City in the Republic of Kenya Final Report
7-6 Nippon Koei Co., Ltd. / PADECO Co., Ltd. / Eight-Japan Engineering Consultants Inc.
conduct should be conducted for those to be resettled. Also, regular cleaning of existing drains to avoid flooding is required during the rainy season.
Measures of rain water discharge control may be necessary towards the increase of runoff coefficients following the development of large-scale land and housing in the future. On the measures, the responsibility of preventing flooding using storm water retention pond or rainwater infiltration facilities is imposed to the developer. Preparation of the legal regulation for management of this discharge control system is required.
7.5.3 Solid Waste Management Development of master plan for solid waste management: A master plan for solid waste
management (SWM) in Mombasa County was prepared by the French Development Agency (Agence française de développement: AFD) in 2004. However, the master plan (MP) seems not to have been implemented. It is necessary for CGM to estimate accurate amount of waste generation in the future and to develop a SWM master plan including construction of waste disposal facilities and recycling plants and waste collection and transportation system based on the estimated amount.
Improvement of waste collection and transportation system including maintenance of collection vehicles: Waste collection system not covering the whole area of the county, especially the mainland of Mombasa County, partly because of inefficient waste collection system and lack of vehicles. Consequently, there is a lot of waste scattered at the roadsides and empty lands in the mainland of Mombasa County. It is necessary for CGM to introduce efficient collection system and new collection vehicles and develop the capacity of maintenance staff for collection vehicles.
Construction of new sanitary landfill site and safe closure of existing dumping sites: There are only dumping sites but no sanitary landfill sites in the county and the dumping sites are not properly managed. Consequently, the dumping sites have polluted the sea and other environmental resources. It is necessary for CGM to urgently construct sanitary landfill sites at proper locations which have enough capacity for landfill waste and facilities to prevent pollution of the environment as well as closure of the existing dumping sites to minimise environmental pollution. In addition, develop the capacity of CGM to operate and maintain sanitary landfill sites properly.
Improvement of disposal system of industrial waste: The quantities of generated and collected industrial waste have not been monitored by any organisation. On the other hand, according to special economic zone (SEZ) project, it was estimated that 768 tons per day of solid waste will be generated at SEZ. Such large quantities of solid waste make a huge impact to SWM in the county. It is necessary for CGM to estimate the quantity of industrial waste and consider proper disposal system for industrial waste together with the National Environment Management Authority (NEMA), including whether CGM will also manage solid waste generated at the special economic zone (SEZ).
Improvement of disposal system of hazardous waste: There is insufficient capacity of incinerators to dispose hazardous waste and some hazardous wastes are disposed at the dumping sites. It is necessary for CGM to introduce another incinerator and supervision system for proper disposal of hazardous waste. In addition, it is necessary to introduce tentative alternative disposal system for hazardous waste such as land filling at designated places.
Promotion of 3Rs activity: CGM has not conducted 3R activity and does not have any recycling facilities although some private companies, CBOs, and waste pickers are collecting and selling recyclables. As population and standard of living of citizens in the county increases, the amount of waste generation will increase rapidly. In order to extend the lifespan of landfill sites, the amount of solid waste disposed at landfill sites has to be reduced through 3R activities. Therefore, it is necessary for CGM to introduce recycling facilities and suitable recyclable collection system.
Project for Formulation of Comprehensive Development Master Plan in the Mombasa Gate City in the Republic of Kenya Final Report
7-7 Nippon Koei Co., Ltd. / PADECO Co., Ltd. / Eight-Japan Engineering Consultants Inc.
7.5.4 Power Supply Frequent and prolonged supply interruptions: Frequent interruptions and high distribution
system losses are observed. Weak distribution network is characterised by limited redundancy and aging. Lack of substations in adoption of parallel redundancy and inappropriate technical standards is leading to high costs of materials, labour, and transport.
Upgrade: Existing power distribution network should be upgraded. Reinforcement and development of the distribution network so as to improve reliability and quality of supply should be ensured. Government should facilitate partnership programs in modernisation of the distribution networks.
Rural electrification: Power supply coverage in rural area is low such as Jomvu and Likoni subcounties. This is due to low load growth and scattered nature of population in rural areas and high costs of rural electrification projects. For the development of social security, CGM should:
Support Kenya Power to mobilise funds from development partners for rural electrification programmes.
Support data collection, packaging, and dissemination of information on energy systems in rural areas to create investor and consumer awareness on the economic potential offered by these systems.
Provide incentives to both users and producers of energy technologies in rural areas. Use of off-grid systems, including standalone renewable energy solutions such as solar
power, wind power, etc. Support local capacity programmes for manufacture, installation, maintenance, and
operation of renewable energy in rural areas.
7.5.5 Telecommunications Mobile coverage in rural area: Mobile coverage in rural area is low such as Kisauni and Likoni
subcounties because population density is low in the rural area. Operators deploy their telecommunications infrastructure (cable laying works, antenna towers, etc.) based on their own marketing strategy. These constraints led to increased investment costs per customer for the operators making them not wanting to expand the network. Shared antenna towers are proposed to be operated and maintained by local governments such as Mombasa County or a third party partially funded by public sources. Shared antenna towers will improve the landscape by reducing the number of antenna towers of individual operators and will promote effective land use.
Promotion of e-Government system: Currently, Mombasa County has a wide area networks (WAN) with e-Construction and e-Single Business Permit System. This system should be upgraded to become a fully e-Government. The e-Government should facilitate better and efficient delivery of information and services to the citizens, promote productivity amongst public servants, encourage participation of citizens in the government, and empower all Kenyans. E-Government uses a range of information technologies, such as WAN, internet, and mobile computing, to transform government operations in order to improve effectiveness, efficiency, and service delivery.
Issues: A Metro Area Network (MAN) for improvement connectivity for user should be implemented and provide interconnection between CGM with subcounties. The county does not have a fully-fledged data centre. Data and information should be protected against cyber-attacks. The county has an ineffective server room only; no network management software with access rights and enhanced security features. Data is manually stored in one location. County lacks backup generators. Electricity is erratic leading to working hour losses.
Constraints: The National Optical Fibre Backbone Infrastructure (NOFBI) exists only at the county headquarters. Most of CGM offices in Mombasa County are not connected to LAN, and the departments are not interconnected. CGM has basic internet connectivity with narrow band at a speed of 60 Mbs by Safaricom.
Project for Formulation of Comprehensive Development Master Plan in the Mombasa Gate City in the Republic of Kenya Final Report
7-8 Nippon Koei Co., Ltd. / PADECO Co., Ltd. / Eight-Japan Engineering Consultants Inc.
Directions: Network should be constructed amongst the urban cores and subcentres by connecting fiber optic cables laid along the roads. The networking equipment including optical transmission device, router, switch, and network control unit to expand the network bandwidth capacity should be upgraded. Interconnection between CGM with subcounties by connecting to NOFBI should be improved. The data centre is a centralised repository, either physical or virtual, for the storage, management, and dissemination of data and information. For efficient data exchange between CGM and subcounties, the dedicated government network can be utilised effectively to centralise the government information in the data centre.
Disaster Recovery Centre Management (DRC): Instantaneous information dissemination helps citizens evacuate to safety in case of disasters or emergencies. Mombasa County does not have a centre for announcing the information about protection of lives and property. Rainfall and sea water level information observation and telemetric information transmission system with security fence will be sent to the Disaster Recovery Centre Management (DRC). DRC will announce the information on rising sea levels in order to give notice to the residents living near the sea to evacuate.
7.6 Urban Development Management
7.6.1 Urban Development Control Uncontrolled development: Many land development and building construction are implemented
without proper procedure of approval and consensus. People have a tendency of ignoring legal procedure. Not only procedural matters but also substantial violation of law can often be observed.
Difficulty of law enforcement: Principal Development Control Offices and Chief Building Inspector are in charge of law enforcement. Even if the County Authority is aware of the law, Development Control Section has extremely limited human resources that limits their action against illegal development.
Land tenure and squatting: Development control requests agreement of the land owner of the development/ building site. Rightful legal owner of the land is sometimes difficult to identify. Also, public lands are often squatted on. Thus, especially areas of low income community are in a chaotic situation in ownership, physical situation and legal development procedure.
7.6.2 Public Private Partnership (PPP) General affordability issues: The National Priority List for PPP Projects contains various fields
of business that may attribute to the complicated PPP arrangement in the future. In particular, the affordability of the users and society to utilise the projects may become the breaking point for the PPP scheme.
Political Gap: After severe disputes between county governments and the central government, significant power and resources have been devolved to new county government structures. There is therefore an urgent need for specific guidelines including the actual procedures for the PPP project between PPP unit and PPP node.
Legal Gap: The following points may be necessary to check and confirm with the PPP unit and/or a contracting authority prior to the planning of the PPP project.
Procurement time limit and costs: There is no time limit or guidelines regarding matters of timelines for the procurement cycle or procuring decision-making by contracting authorities.
Restrictions on assignment or transfer of tenders and successful projects: The PPP Act prohibits the winding-up of any Special Purpose Company (SPC), alteration of their legal structure, and share capital reductions unless the company has obtained prior written approval by the contracting authority.
Project for Formulation of Comprehensive Development Master Plan in the Mombasa Gate City in the Republic of Kenya Final Report
7-9 Nippon Koei Co., Ltd. / PADECO Co., Ltd. / Eight-Japan Engineering Consultants Inc.
Restriction of share transfer: During and after the completion of a PPP project, the majority shareholders of the project company are also expressly prohibited from transferring any of their shares in SPC without prior authority’s acceptance certificate.
PPP contract standardisation across the public sector: Guidelines to standardise procurement practice across the public sector is indispensable.
Administrative review of public procurement: Private contractors should be monitored through a multiplicity of public procurement review bodies.
Ambiguity of some clause in the PPP Act: There is ambiguity in some clauses which states “or other agreement as may be approved by the Cabinet Secretary” or “the Cabinet Secretary shall prescribe the thresholds for approval and the carrying out of projects by the county governments under this Act”.
Financial Gap: Funding gap between the plan and the affordable public budget: The county government together with the central government shall procure the necessary funds totaling up to USD 37 billion from out of direct borrowing, donors, fiscal budget, Constituency Development Fund (CDF), and private sectors
Little probability of payment by beneficiaries: The issues for the arrangement of PPP projects will be difficult to impose the scheme of beneficiary payment on the use of infrastructure as a result of an already established habit. Thus, the financial burden for the contracting authority/ government/investor will be unavoidable.
Insufficient statements for guarantee and support of government under PPP Act-Project Facilitation Fund (PFF): The major concern will be the amount of PFF (KES 750 million for 2014/2015) which may be extremely insufficient to support the PPP project on the list.
Insufficient incentives in PPP Act: PPP Act does not have the clause of “incentive to the private” except the item above. In addition, a contracting authority may have to bear almost all the financial burden of the PPP projects. In order to encourage the private investors, the PPP Act shall include the incentives such as, but not limited to, income tax holiday, exemption of work permit, and visa at once for the employee of the Special Purpose Vehicle (SPV), exemption of import duty, free remittance of proceeds, and so on.
Issues concerning the organisation/staff domain: PPP unit and a contracting authority of PPP projects shall proceed the proper process in order to achieve the development trigger. Since the application of PPP project was made just recently, for the improvement of the capacity of the department/procedure/staff, the so-called “Capacity Building” will be introduced.