Project Energy-saving air-Lubricated Ships (PELS) - … · Project Energy-saving air-Lubricated...
16
2 nd International Symposium on Seawater Drag Reduction Busan, Korea, 23-26 MAY 2005 Project Energy-saving air-Lubricated Ships (PELS) Cornel Thill, Serge Toxopeus and Frans van Walree (Maritime Research Institute Netherlands, MARIN, The Netherlands) ABSTRACT For the majority of current ships sailing, the dominant part of the resistance is due to friction with the surrounding water, see the grey area in Figure 1. Addressing this part of a ship’s resistance means to improve ship’s performance on top of what is achievable by “traditional” optimisations, such as shape optimisation and minimising the radiated waves. By reducing the friction improvements of the ship’s efficiency of net up to 20% are deemed feasible. There is currently no other technique in naval architecture that can promise such savings. A promising technique to address the frictional resistance of a ship is insulating the ship from the water by actively providing an air-layer between ship and water to drastically reduce the resistance of ships and thereby reduce propulsive power, fuel consumption and CO 2 production. Figure 1: Relative resistance components of a ship INTRODUCTION The national Dutch research project PELS gave evidence that positive overall energy savings are feasible in all operational conditions of a ship, including effects of waves and manoeuvres. PELS comprises scientific research for 1.2 million Euros, mostly used for model tests at the MAritime Research Institute the Netherlands, MARIN. Three techniques were tested, i.e.: • Air cavity ships • Micro Bubble Drag Reduction • Air-film, generated by air injection onto a super water-repellent coated ship. The impact of air lubrication is not limited to the powering performance of the ship. Other aspects that need to be investigated are the stability of the air lubrication during sailing in waves and during manoeuvres. The safety of the vessel, the seakeeping performance and the manoeuvrability are influenced by the air lubrication itself and by the hull form that is required for efficient air lubrication. To comply with all operational conditions of a ship and determine the influence of the drag reduction on the performance of the ship, tests were conducted as follows: • Seakeeping tests, in head, bow- and stern quartering, beam and stern seas. • Manoeuvring tests, comprising captive planar- motion mechanism (PMM) tests as well as free-sailing tests. • Resistance and propulsion tests in the depressurised towing tank, with a correctly scaled down compressibility of the air. To address the important issue of possible scale effects, two scale models were made for the tests with different scale ratios. One of these models was divided in ten separate segments to allow for the determination of the distribution of the hydrodynamic forces along the length of the ship. The bottom of each segment was adapted to incorporate the micro-bubble lubrication and the air cavities either way.
Transcript of Project Energy-saving air-Lubricated Ships (PELS) - … · Project Energy-saving air-Lubricated...

2nd International Symposium on Seawater Drag Reduction Busan, Korea, 23-26 MAY 2005
Project Energy-saving air-Lubricated Ships (PELS)
Cornel Thill, Serge Toxopeus and Frans van Walree (Maritime Research Institute Netherlands, MARIN, The Netherlands)
ABSTRACT
For the majority of current ships sailing, the dominant part of the resistance is due to friction with the surrounding water, see the grey area in Figure 1. Addressing this part of a ship’s resistance means to improve ship’s performance on top of what is achievable by “traditional” optimisations, such as shape optimisation and minimising the radiated waves. By reducing the friction improvements of the ship’s efficiency of net up to 20% are deemed feasible. There is currently no other technique in naval architecture that can promise such savings.
A promising technique to address the frictional resistance of a ship is insulating the ship from the water by actively providing an air-layer between ship and water to drastically reduce the resistance of ships and thereby reduce propulsive power, fuel consumption and CO2 production.
Figure 1: Relative resistance components of a ship
INTRODUCTION
The national Dutch research project PELS gave evidence that positive overall energy savings are feasible in all operational conditions of a ship, including effects of waves and manoeuvres. PELS comprises scientific research
for 1.2 million Euros, mostly used for model tests at the MAritime Research Institute the Netherlands, MARIN. Three techniques were tested, i.e.:
• Air cavity ships • Micro Bubble Drag Reduction • Air-film, generated by air injection onto a
super water-repellent coated ship. The impact of air lubrication is not limited
to the powering performance of the ship. Other aspects that need to be investigated are the stability of the air lubrication during sailing in waves and during manoeuvres. The safety of the vessel, the seakeeping performance and the manoeuvrability are influenced by the air lubrication itself and by the hull form that is required for efficient air lubrication.
To comply with all operational conditions
of a ship and determine the influence of the drag reduction on the performance of the ship, tests were conducted as follows:
• Seakeeping tests, in head, bow- and stern
quartering, beam and stern seas. • Manoeuvring tests, comprising captive planar-
motion mechanism (PMM) tests as well as free-sailing tests.
• Resistance and propulsion tests in the depressurised towing tank, with a correctly scaled down compressibility of the air.
To address the important issue of
possible scale effects, two scale models were made for the tests with different scale ratios. One of these models was divided in ten separate segments to allow for the determination of the distribution of the hydrodynamic forces along the length of the ship. The bottom of each segment was adapted to incorporate the micro-bubble lubrication and the air cavities either way.

The scale effect investigations were finalised by testing almost full-scale Reynolds numbers with another set-up in the large cavitation tunnel of Berlin Technical University.
To support dedicated design strategies,
potential flow tools were developed to optimise the shape of an air cavity for powering and seakeeping by computing the wavy free surface inside of it. The fundamentals of the computational method are described in this paper. Some comparisons with experimental data are given as well.
Furthermore the calculation of the trajectories of micro-bubbles using the computed flow field of MARIN’s RANS code PARNASSOS is presented. In this way, air-ignition points enabling an efficient covering of the hull surface with bubbles can be determined.
SHIP MODELS
In order to experimentally assess the performance of the air lubrication and investigate the scale effects on air lubrication, two different wooden models were manufactured: a model with a length between perpendiculars Lpp of 6 m (scale 1:20) and a second, larger and geometrically similar (GeoSim), model with an Lpp of 11.51 m (scale 1:10.4).
HULL FORM
The background of the PELS project was that the results should not be restricted to one specific ship type. Therefore, a fictitious hull form was designed. The requirements for the hull form were as follows:
• A large parallel midship section to maximise
the possibilities for air lubrication by either micro-bubbles or air-cavities.
• Small bilge radius to maximise the width of the air cavities.
• Propulsion by twin thrusters in order to be able to position the propellers outside the flow of the air/water mixture.
• A pram-type aft ship to also allow some lubrication at the stern and to facilitate the thrusters.
• A simple stream-lined bow. • For practical purposes, the model should be
easily modified from air-cavities to micro-bubble lubrication and vice-versa.
These requirements led to the hull form as presented in Figure 2. For the micro-bubble lubrication, the air cavities were closed with panels that were flush with the bottom of the ship.
Figure 2: Body plan of ship model with air cavities
AIR LUBRICATION SYSTEM
For practical purposes, nitrogen gas was used instead of air for filling the air cavities or for the micro bubble lubrication. The reason for this was to avoid any fouling during the tests of the porous metal by oxidation.
The nitrogen gas was stored under high pressure in cylinders with reduction valves, reducing the pressure in the gas tubes to about 5 bar. The gas was led through mass flow controllers which were able to control the volume flow of the gas. Several different flow controllers were used to control the air flow to the porous strips.
AIR CAVITIES
When sailing with air cavities the chambers are filled with air through air injection outlets. With the exception of the foremost air cavity, each air cavity consisted of 3 air chambers next to each other to reduce the adverse effects of the free surface in the chambers on the stability.
As the wave pattern inside a cavity follows the laws of a free surface wave, its wavelength for a given speed Vs can be computed. Assuming that the sharp edge of the leading edge of the cavity generates a transom flow condition and aiming at a smooth transition of the generated wave with the sealing, trailing wedge of the cavity, the length of the cavity is estimated by the equation from Matveev (1999).
2 2s
Cavity smL 0.34 V= ⋅ (1)

Equation (1) is only a rough estimate,
since many aspects are responsible for departing from the simplified two dimensional model used in this equation: e.g. local three-dimensional features of the flow, external waves or trim- and sinkage of the hull that is hosting the cavity.
Despite of the efforts to maximise the
efficiency of air-cavities, the theoretical maximum drag reduction is less than that for an ideal air-lubricated surface, because:
• The cavities can only cover horizontal or more
or less horizontal areas. Air-lubrication along vertical surfaces disappears rapidly due to gravity effects.
• Inside of the cavities a wave pattern develops, which generates an additional wave resistance.
• At the ends of the cavities, the free surface reattaches on the sealing wedges and causes losses by the momentum exchange and the wave breaking.
MICRO-BUBBLES
The ship models were fitted with porous metal strips for micro-bubble air lubrication. These strips were placed at five longitudinal locations along the ship. To create bubbles, nitrogen gas was pumped through the porous metal. The porous metal has a pore diameter Dpore = 4·10-6 m, a porosity of η = 21% and a permeability of κp = 0.1·10-12 m2. Figure 3 shows the bottom configuration of the ship model for the micro-bubble case.
AIR FILM (1:10.4 MODEL)
Air films have not been studied on manoeuvring and on seakeeping, as it was decided during the already granted project.
The decision to incorporate testing on air films into the work scope was made after the start of the PELS project. For the testing of the resistance and powering performance of the ship, it was possible to re-allocate some of the work within the project to allow for such tests. However, within the budget available for studying the seakeeping and manoeuvring performance of the ship, no possibility existed for rescheduling of the work. Therefore, only the large model was prepared for air film testing.
Proposed by Fukuda et al. (2000), air injection together with a super water repellent (SWR) coating appears to be a very attractive method to drastically reduce the resistance of a ship sailing in water.
In order to gain at least some basic know-ledge of this technique, the backside of the filling plates used to close the cavities in the large ship model was painted with a certain SWR coating, HIREC™. As the curved filling pieces at the stern of the vessel could not be turned, SWR coating was just applied to the flat parts.
The gas was injected and the effective power was determined the same way as for the micro bubble case.
Figure 3: Bottom configuration for micro bubbles
SEGMENTED MODEL (1:20 MODEL)
The 6 m model was divided into ten segments of equal length in order to be able to derive information about the distribution of the forces along the length of the ship during the manoeuvring and seakeeping experiments.
The segments are numbered from 1 (stern segment) to 10 (bow segment). In each segment the forces and moments in all six degrees of motion could be measured. However, during the free sailing tests, only segments 9 and 10 were instrumented. To prevent the water flowing in between the segments, small flexible latex strips were mounted between the segments. These were unable to absorb forces, hence the interaction between the segments is zero. A rigid backbone connected all the segments. This backbone was connected to the carriage during the captive tests.

Figure 4 shows the segmented model during preparations. The ship model is divided at even ship stations (stations ranging from 0 through 20). At the moment the picture was taken, the flexible latex strips were not placed yet. The first wedge in the forward/centre air cavity was attached to the model. Furthermore, the air injection pieces for the air cavities and for the micro-bubble lubrication can be seen. Figure 5 presents the ship model fully prepared for the tests.
Figure 4: Detail of bottom configuration of segmented ship model during preparations.
Figure 5: Segmented ship model ready for testing.
SEAKEEPING ASPECTS OF AIR-LUBRICATION
Tests were performed with the segmented model for the condition without air lubrication, with air chambers and with air bubbles, in regular and irregular waves, at two speeds in wave directions ranging from bow to stern quartering.
The purpose of the tests was to establish
whether the air lubrication remained effective in waves, if lost air quantities would appear in the propeller disk area to disturb the propeller efficiency and loading and to which extend the
ship motions would be affected by air lubrication. Figure 6 shows the model during a run in waves.
In general terms the results of the tests
were as follows:
• Ship motions appeared not to be significantly affected by air lubrication, see for instance Figure 7. An exception is beam seas for which the model with air chambers showed significantly more roll. This is due to the change in stability.
• Although power savings reduce when operating in waves, for most conditions with air bubbles power reductions remain possible, while for some low speed conditions with air chambers more power is required with air lubrication than without air lubrication, see Figure 8.
• The model with air chambers showed substantial loss of air volume due to ship motions and waves at the lower speeds and substantial quantities of air occasionally arrived in the propeller operating area causing thrust and torque variations.
Figure 6: Model in waves
0.5135
1.5135
0.590
1.590
0.5315
1.5315
No bubblesBubbles
0
0.2
0.4
0.6
0.8
1
1.2
Heave [m/m]
Wave height, heading
No bubbles
Bubbles
Figure 7: Heave response with and without air bubbles

-8
-6
-4
-2
0
2
4
6
8
Power [%]
0.5 1.5 0.5 1.5 0.5 1.5 0.5 1.5
180 180 135 135 90 90 45 45
Wave height and direction
Vs=13.5 kt
Vs=9 kt
Figure 8: Effective power reduction in waves with air chambers
BASIC COMPUTATIONAL MODEL
To study the effects of a seaway on the efficiency of air lubrication and vice versa the effects of air lubrication on the seakeeping characteristics of ships, a computational method is required that combines traditional ship hydrodynamics with a description of air chamber flows. The PANSHIP time domain panel code, see Van Walree (2002), was deemed a good starting point.
PANSHIP is a time domain panel method
that uses linearised free surface boundary conditions. The geometry of the ship hull is represented by a number of quadrilateral source and doublet panels. By using a transient Green function description for the fluid potential and including the effect of ship motions and incident waves in the boundary condition at each panel, the pressure acting on each panel is obtained.
PANSHIP has two modes of use: a semi-
linear one and a semi-nonlinear one. The first mode is the time domain equivalent of frequency domain based panel methods in which the nonlinear effects are limited to the Froude-Krylov force components and the determination of the steady trim and sinkage. The second mode determines besides the Froude-Krylov forces also “added mass” and “damping” forces on the actual submerged hull form. The only linearization applied is the use of linear free surface boundary conditions.
A relatively new development in
PANSHIP is the use of the lifting surface option to account for so-called viscous reaction or manoeuvring forces when operating in beam or quartering waves. Traditionally, such force
components are described by means of empirical formulations based on experimental results. At high speed viscous forces other than friction are assumed to be relatively small so that the side forces acting on a hull operating at drift angle can be described by modelling the hull as a low aspect ratio lifting surface. This would eliminate the use of empirical models which are inherently of limited validity.
PANSHIP determines motions in six
degrees of freedom and can handle all wave directions. The fundamental nature of the computational method and the use of panels to represent the hull shape makes PANSHIP a suitable tool for use for ships with air chambers. Air chambers can be well represented by surface panels while replacing the water fluid flow by an air flow enables the computation of the pressures on panels in air chambers. The extension of the PANSHIP model to account for the air flow dynamics is briefly described in the next sections.
AIR CHAMBER DYNAMICS
In addition to the general equations of motion of the ship, equations are added for the pressure in each air chamber. In an analogous manner as for the motions, a differential equation for the pressure is integrated in time yielding the pressure in each air chamber at each time step. Based on the instantaneous air volume, air leakage, air inflow and water pressure, the pressure equation can be set-up and solved.
Applying the pressure on the air chamber panels yields the forces acting on the air chamber parts of the ship. Combined with the forces on non air chamber panels, the ship motions are determined which in turn are input for the next time step were the actual air volume, air leakage and air inflow are determined yielding the pressure differential equation. The main equations are described below.
Cushion pressure
The differential equation for the cushion pressure is based on two equations. The first equation describes mass conservation in the cushion:
ca
in outad ( )V ( - ) = Q Q
dtρ
ρ (2)

where Qin and Qout denote the incoming and outgoing air flow rate, ρa denotes the density of air, Vc denotes the instantaneous volume inside the cushion and t is time.
A second equation describes the nature
of the process of compression and expansion. Assuming that these pressure fluctuations happen fast enough, it can be approximated by an adiabatic process, where C is a constant:
p = CV κ or alternatively p = Cκρ (3)
Where κ, the ratio of specific heats Cp /Cv,
is a constant at 1.4 for air. Expanding the first equation and
substituting this in the second results in the following expression for the time derivative of pressure p:
- 1
c aIN OUT 0
c 0 a
p + pdp dV = - - Q Qdt dt + p pV
κκ
κ ρ κ ρ
(4) in which the index 0 refers to the value in
an equilibrium condition, pa denotes the atmospheric pressure, and Vc denotes the actual cushion volume including changes due to the water surface deflection, ship motions and waves. This differential equation is integrated simultaneously with the equations of motion. The derivative of the cushion volume Vc with respect to time is approximated by a finite difference scheme as this quantity is known only at discrete instants in time.
Air supply system
The air supply system is modelled as a single fan system. The characteristics of this fan are entered into the program by three points on the fan curve (flow rate Q versus cushion pressure pc) at a certain rate of revolution denoted Ni. These points are recalculated for the actual rpm of the fan, Ni by:
2
dd i
i
N = p pN
and dd i
i
N = Q QN
(5)
A second order polynomial is fitted through the three points on the recalculated fan curve, in order to determine the incoming flow rate Qin as a function of the cushion pressure pc.
Air leakage
The amount of air that leaks underneath the air chamber sides when a gap is present, is based on a simple formula reflecting Bernoulli's equation.
cout
R ac
2 dp = A Q
c ρ (6)
where A denotes the leakage area and
dpc denotes the pressure difference. The actual air density at pressure pc, ρac is determined from:
1/
a cac a
a c0
( + )p p =
( + )p p
κ
ρ ρ (7)
where pc0 denotes the equilibrium
pressure. The leakage area is determined from the
actual position of the air chamber edges in the wave field. A resistance coefficient cR is introduced in the flow rate equation which value is based on experiments with openings underneath a SES side hull. In the program cR = 1.75 is used.
VERIFICATION
For the ship and air chamber configuration used during the experimental study, see Van Walree et al. (2005), a number of initial simulations in waves have been performed to verify the results. Figure 9 shows a pressure and streamline plot for a certain point in time during a simulation in head waves. Discontinuities in dynamic pressure are observed around the air chambers where the air flow either starts or stops.
Figure 10 shows the heave and pitch motions in head waves with and without air chambers. Similar to the experimental results, the effect on the motion amplitude of adding air chambers is not very large. The loss of air due to motions and waves does lead to a mean drop in air pressure which explains the lower mean heave motion for the case with air chambers. The mean draft increases by about 0.25 m.

Z
X
Y
cpu
0.53540.45450.37370.29290.21210.13130.0505
-0.0303-0.1111-0.1919-0.2727-0.3535-0.4343-0.5152-0.5960-0.6768-0.7576-0.8384-0.9192-1.0000
Figure 9: Pressure and streamlines on vessel with 6 air chambers
t
z0
0 5 10 150
0.2
0.4
0.6
0.8
1
1.2
1.4
1.6
1.8
2
2.2
2.4
2.6
2.8
3air chambersno air chambers
t
thet
a
0 5 10 15-2.5
-2
-1.5
-1
-0.5
0
0.5
1
1.5
2
2.5
Figure 10: Comparison of heave and pitch motions
Figure 11 shows the air volume, pressure and loss rate versus time for the forward air chamber for a simulation in regular head waves. The start-up transient is clearly visible. The drop in pressure is associated with the loss of air at a time instant of about 1.0 sec. At this same instant the volume is high, leading to air leakage (i.e. loss of air). After about 5 seconds, the initial transients are gone and more or less regular variations in volume and pressure are shown. Occasionally some air leaks away.
Time [sec]
Pre
ssur
e[P
a]
Volu
me
[m3]
&Lo
ssFl
owR
ate
[m3/
s]
0 2 4 6 8 10 12 1420000
22000
24000
26000
28000
30000
32000
34000
36000
0
20
40
60
80
100
Pressure
Volume
Loss Flow Rate
Figure 11: Volume, pressure and air leakage versus time
VALIDATION
In this paragraph the motions in waves as recorded during the experimental phase and as computed by PANSHIP are compared. First motions without application of air lubrication are compared, i.e. for an ordinary ship. Figure 12 shows comparisons of the responses for roll and pitch motions in regular bow quartering waves. The speed is 13.5 knots for all cases. The differences between experimental and calculated data are deemed very acceptable, except perhaps for the roll response at a frequency of 0.65 rad/sec.
Figure 13 shows the ratios between the
responses with and without air chambers as found from the experiments and as predicted by PANSHIP. The wave direction is again bow-quartering.

0.60.65
0.7 11 1
0
0.1
0.2
0.3
0.4
0.5
0.6
0.7
Roll [ deg/m]
Roll response in bow quartering seas - no air chambers, no bubbles
Test
Panship
Test 0.32 0.53 0.52 0.27 0.13
Panship 0.45 0.65 0.5 0.32 0.12
0.6 0.65 0.7 1 1.1
0.6 0.65 0.7 1 1.1
Test
Panship00.20.40.60.8
11.21.41.61.8
2
Pitch [deg/m]
Wave frequency [rad/sec]
Pitch response in bow quartering seas - no air chambers, no bubbles
Test
Panship
Test 1.4 1.38 1.87 0.19 0.07
Panship 1.55 1.6 1.53 0.23 0.06
0.6 0.65 0.7 1 1.1
Figure 12: Comparison roll and pitch motions
0.6 0.65 0.7 1 1.1
Test
Panship0
0.2
0.4
0.6
0.8
1
1.2
1.4
Ratio [-]
Wave frequency [rad/sec]
Roll response ratio w/o air chambers
Test
Panship
Test 1.09 0.83 1.21 0.93 1.08
Panship 0.68 0.67 1.14 1 0.83
0.6 0.65 0.7 1 1.1
0.6 0.65 0.7 1 1.1
Test
Panship00.20.40.60.8
11.21.41.61.8
Ratio [-]
Wave frequency [rad/sec]
Pitch response ratio w/o air chambers
Test
Panship
Test 0.93 1.01 0.89 0.89 0.86
Panship 0.8 0.97 1.1 1 1.67
0.6 0.65 0.7 1 1.1
Figure 13: Response ratios for roll and pitch
The figures show that in general the trend
with wave frequency is well predicted by PANSHIP. Exceptions are roll at the lowest frequency and pitch at the highest frequency, but this is difficult to predict due to the small magnitude of roll and pitch at these frequencies. CONCLUSIONS
The following conclusions were drawn with respect to the investigations for the seakeeping characteristics of ships with air lubrication:
• The seakeeping characteristics of the
investigated ship are not significantly affected by the use of either bubbles or air chambers for air lubrication. An exception is the roll motion in beam seas for the model with air chambers.
• Power savings remain largely intact with lubrication by means of air bubbles but may become negative when using air chambers at a relatively low speed. Also, lost air volume from air chambers may affect the propeller thrust and torque.
• Predictions for air chambers dynamics such as the variations of air volume, pressures and air losses seem to be in qualitative agreement with expectations.
• Predictions for the motions in waves agree well with experimental data. This is the case for the ship operating with and without air chambers. Only when motions are small, relative predictions for the ratio of motions with and without air chambers are inaccurate.
MANOEUVRING ASPECTS OF AIR-LUBRICATION
The primary purpose of the manoeuvring tests was to determine the effect of the air lubrication on the manoeuvring characteristics and to obtain validation data for manoeuvring simulation models. Secondary objectives were:
• judge the difference in manoeuvring
characteristics between the concepts • verify compliance with relevant criteria posed
in IMO Resolution A.751 (18) • compare the behaviour of the ship to other
ships

The manoeuvring tests comprised captive planar motion mechanism (PMM) tests, see Figure 14, and free sailing manoeuvring tests. During the manoeuvring tests, the hull without air-lubrication (designated conventional or bare hull), with micro-bubbles and with air cavities are examined.
Figure 14: PMM tests.
PMM EXPERIMENTS
The PMM tests were conducted to investigate the forces on the hull form during manoeuvring conditions. Furthermore, data was obtained for the determination and validation of mathematical manoeuvring models for air-lubricated ships.
In Figure 15 an example on one of the results obtained is presented. It is seen that a slight reduction in the side forces is found for the ship with micro-bubble lubrication, compared to the conventional (bare-hull with air cavities closed and without lubrication) configuration. Figure 16 shows a similar bar graph, for the three configurations at 9° drift angle. Note that the relatively large force on the aft segment (number 1) is caused by the method of non-dimensionalisation: the local forces are made non-dimensional using the lateral area of the segment, which in the case of segment 1 is much smaller than the lateral areas of the other segments.
Judging from the test results and under-
water video observations, it was found that the amount of air lubrication using micro bubbles or air cavities reduced as a function of the drift angle. In general, the micro-bubbles followed the flow direction and left the ship's bottom at about the drift angle. With air cavities, air left the air
chambers due to pressure build-up or reduction at the side-walls of the chambers. For increasing drift angles, this effect was more pronounced. This means that during extreme manoeuvres, the air lubrication is not effective anymore.
Figure 15: Lateral forces measured on an air-lubricated ship, two speeds, two cases (with micro-bubbles (markers) and without (lines)), pure drift, drift angle 2.5°
1 2 3 4 5 6 7 8 9 10APP Segment FPP
-
Y
' [-]
+
Conventional, microbubbles
Conventional, bare hull
Air cavities
Figure 16: Distribution of lateral force along ship length at 9 deg drift angle.
- Drift angle [deg] +
-
Y' [
-]
+
Conventional, bare hullConventional, microbubbles Air cavities
Figure 17: Comparison of overall lateral force.

FREE-SAILING EXPERIMENTS
The free sailing manoeuvring tests, see Figure 18, were conducted to directly determine and compare the manoeuvring characteristics of the air-lubricated hull form. The free sailing tests consisted of standard zig-zag and combined turning circle and pull-out experiments.
Figure 18: Ship model during free sailing manoeuvre.
Free-sailing model tests are traditionally
conducted with a constant pitch and RPM setting of the propellers. However, nowadays, real-time controllers are available to control the RPM of a propeller, based on the absorbed power. Since in reality, the loading of the propeller will be limited by the available power (or torque) of the main engine, a power-controlled propeller during model tests will result in a better modelling of reality. It was therefore decided to conduct some of the free sailing manoeuvres with a controller limiting the available power for the propeller. The engine control was such that the propeller revolution is modulated to ensure that the desired power does not exceed the estimated maximum power. The estimated maximum power of the propeller was derived from the nominal propeller revolutions for the self propulsion point of the model according to the following equation:
MAX MAX nomP Q 2 n= ⋅ ⋅ π ⋅ (8)
If the propeller revolutions are kept
constant and the velocity of the vessel decreases, more torque is consequently required since the inflow velocity of the propeller decreases and hence the propeller load increases. If the estimated maximum power is reached the propeller revolutions are decreased in order to prevent overloading.
Based on the test results, the course changing and yaw checking ability of the ship with air cavities was found to be much better than for the conventional and micro-bubble configurations. This is caused by the directional stabilising effect of the side walls of the air cavities. For the conventional configuration and the micro-bubble configuration, insufficient damping in the aft ship was present. It should be noted however that for a realistic prototype, a centreline skeg would probably be applied, increasing the course keeping ability of the ship in all conditions. The study of a centreline skeg however was outside of the scope of this project.
The turning ability for all three configurations was found to be good, but the directional stability was poor, due to insufficient damping. In this respect, the best results were found with air cavities.
The effectiveness of air lubrication while manoeuvring depends highly on the encountered drift angles. For large drift angles, the air will disappear from the chambers. In Figure 19, an underwater photograph of the model with filled air cavities during a manoeuvre is presented. It is seen that the aft air cavity does not contain air anymore, but the other cavities are nicely filled.
From a manoeuvring viewpoint, the difference between the conventional and micro-bubbles configuration was found to be negligible.
Figure 19: Underwater view of model with air cavities during free-sailing manoeuvre.
POWERING ASPECTS OF AIR-LUBRICATION
Resistance and powering aspects have been investigated by testing geometrical similar ship models at different scales (GeoSim) on resistance and propulsion in the diluted air of MARIN’s Depressurised Towing Tank, measuring 240m in length, 18m in breadth and having a water depth of 8m. In this unique research facility,

models can be towed with a carriage comparable to a conventional towing tank. As the walls of the building are made from solid concrete capable to resist the difference in air pressure, the ambient air pressure inside of the tank can be scaled down correctly to the similarity law of the compressibility of the air at model scale. A picture of this facility is shown in Figure 20, giving an impression of the size of the tank and the technique of the carriage being used. The vacuum tight compartment at the left was used to host the gas supply as being described in more detail in the section on scale-effects of air-lubrication.
Figure 20: MARIN’s depressurised towing tank
Reference tests without air-lubrication
between the two GeoSim models indicated an increased resistance of the smaller model. This was caused by the additional resistance of the segment boundaries of the smaller model. In other words, extrapolating the results of resistance tests of the small model yielded a much higher full-scale resistance than measured on the same model without slits at another scale.
Since ample knowledge on scale effects of conventional ships is available at MARIN, the recorded measurements were corrected in a way that the reference test without air lubrication at both scales yielded the same prediction on full-scale. Therefore, the difference in drag was insulated and subtracted from all results measured on the small model.
One exception was made for the air cavity
ship case. When strips cause increased resistance of the segmented model, strips inside of the cavities, where they have no contact with the water, cannot contribute to the increased
resistance. Therefore, the correction was correlated with the length of the slits exposed to the water, which was observed by under water video recordings.
The correlated curves of the small and large reference model are shown in Figure 21.
Ship speed
Effe
ctiv
e Po
wer
8200 Large model
8201 Small model
Figure 21: Result of the reference tests after correction for slit effects
Thereafter, three techniques were tested,
and compared using the described manner of correction for the two scales:
• Air cavity ships • Micro Bubble Drag Reduction • Air-film, generated by air injection to a super
water-repellent coated ship.
MICRO BUBBLES
Since once the gas is released into the water by forming a bubble, no pressure inside of the bubble could be measured, the pressure at the draught of the vessel was assumed to be the counter pressure for the airflow. All model test results represent the effective power, in other words, losses by the penetration through the
porous medium are not accounted for. For calculating the effective power the flow rate (by the Mass Flow Controller, MFC) and the hydrostatic pressure at the draught of the vessel where used.
The mechanism of drag reduction by
micro bubbles is believed to be independent from the Froude number, which is however an imperative when testing free sailing ship models. This way, the resulting variation in Reynolds number by utilising the two differently scaled models was insufficient to derive any conclusive remarks regarding possible scale effects based on these tests.
To nevertheless investigate possible scale effects on micro bubble drag reduction, almost full-scale Reynolds numbers have been tested in the large cavitation tunnel of Berlin Technical University. These tests are described in the section on scale-effects of air-lubrication.
AIR CAVITY SHIP
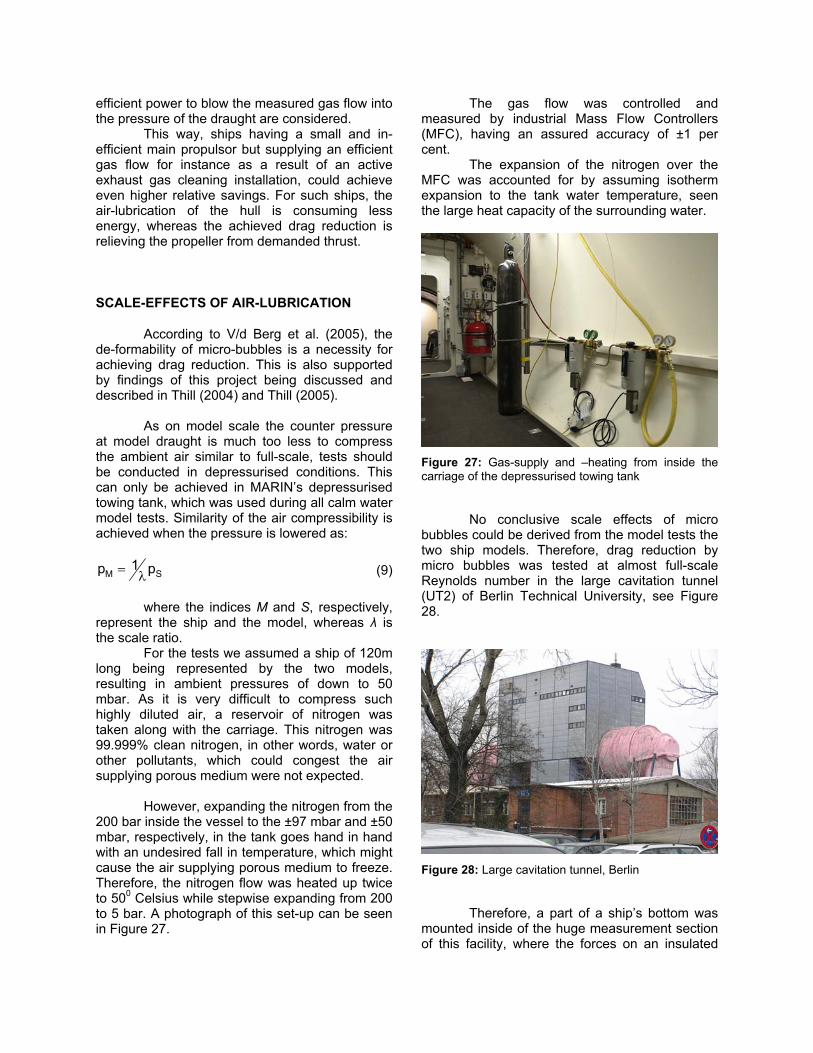
When sailing with air cavities the chambers are filled with air through air injection outlets. Here, the pressure inside of the cavities was measured very close to the injection point and this pressure together with the gas flow was used to determine the effective power of the air supply. Inlet slits and the position of the pressure gauges can be seen in Figure 22.
Constant air filling
<>
Setpoint
Constant air filling
<>
Setpoint
Figure 22: Scheme of the gas-supply and control system
For the first time one cavity was made
active, i.e. the filling of one air-cavity was measured using a newly developed gauge on the sealing wedge of the cavity. MARIN’s
measurement systems make all measured signals real-time available for closed loop control applications by using industry standard OPC interfaces. For this project a newly developed controller system was programmed based on this technique to control the airflow to the air-cavity through a mass-flow controller responsible for the filling of this air-cavity in a way that the airflow was reduced to the required minimum. The principle of this is also visible in Figure 22.
Ship speed
Res
ista
nce
coef
ficie
nt
Ach
ieve
d m
inim
um
Des
ign
poin
t
Figure 23: Measured wave resistance inside of the cavities
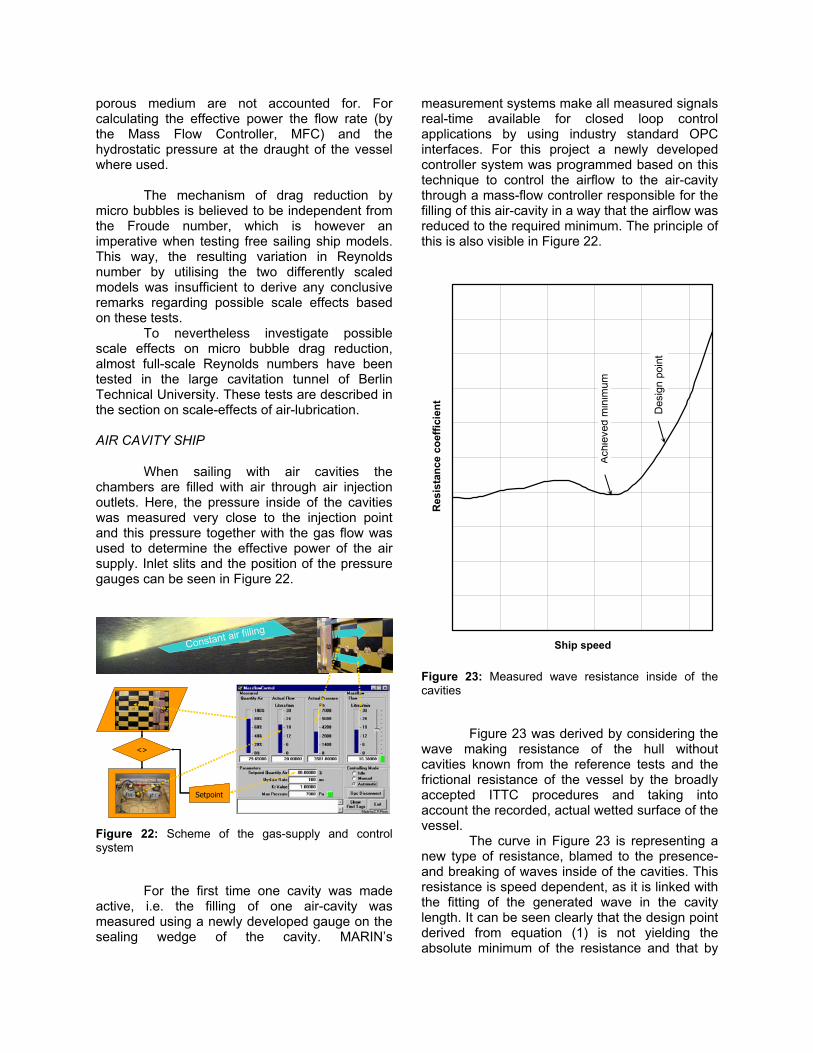
Figure 23 was derived by considering the
wave making resistance of the hull without cavities known from the reference tests and the frictional resistance of the vessel by the broadly accepted ITTC procedures and taking into account the recorded, actual wetted surface of the vessel.
The curve in Figure 23 is representing a new type of resistance, blamed to the presence- and breaking of waves inside of the cavities. This resistance is speed dependent, as it is linked with the fitting of the generated wave in the cavity length. It can be seen clearly that the design point derived from equation (1) is not yielding the absolute minimum of the resistance and that by

utilising dedicated free surface codes to determine the design of an air cavity even higher savings could be expected. However, the achieved mini-mum is highly speed-dependent such that air cavity ships are not well suited to operate in off-design conditions.
Still the estimate of the favourable cavity length by equation (1) is valuable for pre-designing an air cavity ship and to determine the number of cavities in a row in an early design stage.
Careful engineering of the cavity length,
internal pressure and shape of the sealing wedge can now be achieved by an expansion of MARIN’s potential flow based code RAPID1.
An example can be seen in Figure 24, which is a close-up to computed free surfaces inside of six air cavities.
Figure 24 Computed wave pattern of 3D topology inside of air cavities
Figure 25: Computed bubble trajectories within the three dimensional viscid flow field of the 6m model
Another program extension which was
developed within the PELS project is based on MARIN’s RANS code PARNASSOS2. This code is 1 RAised Panel Iterative Dawson, see Raven (1996) 2 PARabolised NAvier Stokes SOlution System, see Hoekstra (1999)
computing the viscid flow around a free sailing ship, even under drift angles and including the free, wavy surface and up to full scale Reynolds number. Herewith it is a powerful, well validated tool, which could be used as a starting point. In first instance it was therefore decided to develop an extension to this code with just one way coupling to not too severely interfere with the existing code: The trajectories of bubbles are integrated within the flow field of PARNASSOS by a Lagrangian approach, see Leijnse (2003).
For design purposes, this code can
sufficiently well predict the path a bubble follows to optimise the position of injection points in a way to maximise the affected bottom area and to prevent problems such as air suction by the propeller, which can be seen in Figure 25.
Ship speed
Req
uire
d ai
r pow
er (o
ther
sca
le)
Effe
ctiv
e po
werConfig 1
Config 2Config 3Config 4
Figure 26: Efficient power results of the tests
POWERING RESULTS
All measurements are summarised in Figure 26. It should be noted again, that all results are considering effective powers, in other words, the delivered power of the propeller and the
efficient power to blow the measured gas flow into the pressure of the draught are considered.
This way, ships having a small and in-efficient main propulsor but supplying an efficient gas flow for instance as a result of an active exhaust gas cleaning installation, could achieve even higher relative savings. For such ships, the air-lubrication of the hull is consuming less energy, whereas the achieved drag reduction is relieving the propeller from demanded thrust.
SCALE-EFFECTS OF AIR-LUBRICATION
According to V/d Berg et al. (2005), the de-formability of micro-bubbles is a necessity for achieving drag reduction. This is also supported by findings of this project being discussed and described in Thill (2004) and Thill (2005).
As on model scale the counter pressure
at model draught is much too less to compress the ambient air similar to full-scale, tests should be conducted in depressurised conditions. This can only be achieved in MARIN’s depressurised towing tank, which was used during all calm water model tests. Similarity of the air compressibility is achieved when the pressure is lowered as:
M S1p p= λ (9)
where the indices M and S, respectively,
represent the ship and the model, whereas λ is the scale ratio.
For the tests we assumed a ship of 120m long being represented by the two models, resulting in ambient pressures of down to 50 mbar. As it is very difficult to compress such highly diluted air, a reservoir of nitrogen was taken along with the carriage. This nitrogen was 99.999% clean nitrogen, in other words, water or other pollutants, which could congest the air supplying porous medium were not expected.
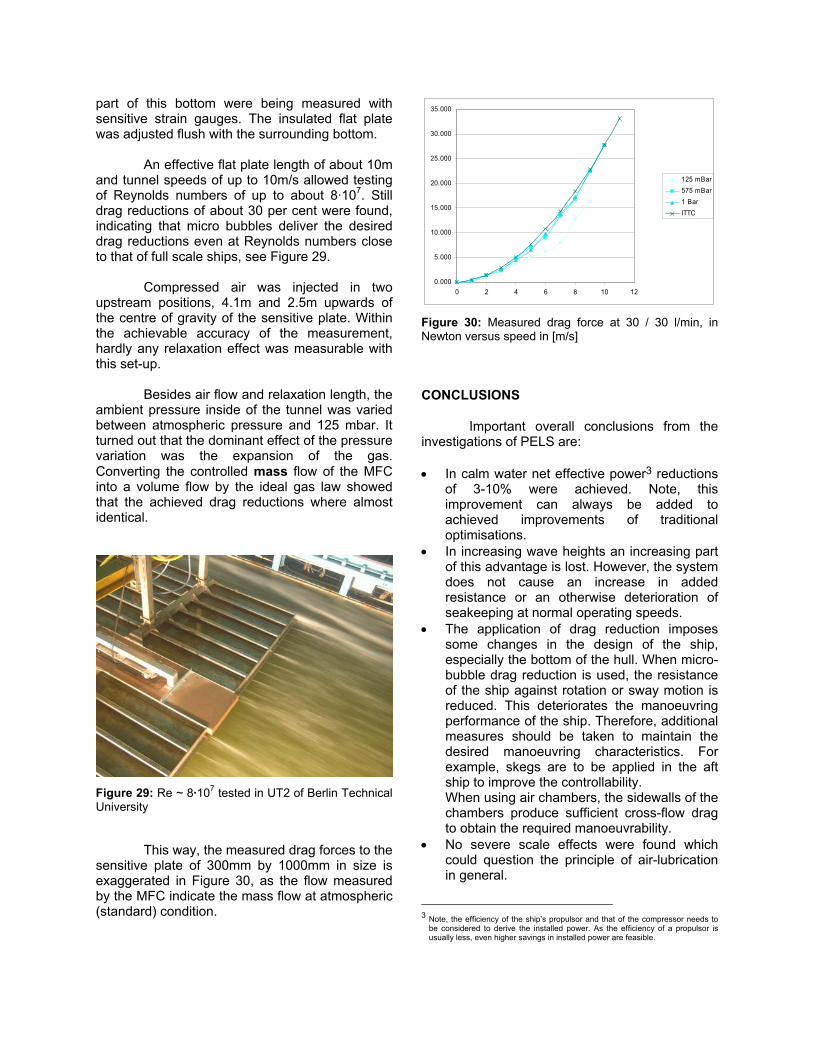
However, expanding the nitrogen from the
200 bar inside the vessel to the ±97 mbar and ±50 mbar, respectively, in the tank goes hand in hand with an undesired fall in temperature, which might cause the air supplying porous medium to freeze. Therefore, the nitrogen flow was heated up twice to 500 Celsius while stepwise expanding from 200 to 5 bar. A photograph of this set-up can be seen in Figure 27.
The gas flow was controlled and measured by industrial Mass Flow Controllers (MFC), having an assured accuracy of ±1 per cent.
The expansion of the nitrogen over the MFC was accounted for by assuming isotherm expansion to the tank water temperature, seen the large heat capacity of the surrounding water.
Figure 27: Gas-supply and –heating from inside the carriage of the depressurised towing tank
No conclusive scale effects of micro
bubbles could be derived from the model tests the two ship models. Therefore, drag reduction by micro bubbles was tested at almost full-scale Reynolds number in the large cavitation tunnel (UT2) of Berlin Technical University, see Figure 28.
Figure 28: Large cavitation tunnel, Berlin
Therefore, a part of a ship’s bottom was
mounted inside of the huge measurement section of this facility, where the forces on an insulated
part of this bottom were being measured with sensitive strain gauges. The insulated flat plate was adjusted flush with the surrounding bottom.
An effective flat plate length of about 10m
and tunnel speeds of up to 10m/s allowed testing of Reynolds numbers of up to about 8·107. Still drag reductions of about 30 per cent were found, indicating that micro bubbles deliver the desired drag reductions even at Reynolds numbers close to that of full scale ships, see Figure 29.
Compressed air was injected in two
upstream positions, 4.1m and 2.5m upwards of the centre of gravity of the sensitive plate. Within the achievable accuracy of the measurement, hardly any relaxation effect was measurable with this set-up.
Besides air flow and relaxation length, the
ambient pressure inside of the tunnel was varied between atmospheric pressure and 125 mbar. It turned out that the dominant effect of the pressure variation was the expansion of the gas. Converting the controlled mass flow of the MFC into a volume flow by the ideal gas law showed that the achieved drag reductions where almost identical.
Figure 29: Re ~ 8·107 tested in UT2 of Berlin Technical University
This way, the measured drag forces to the
sensitive plate of 300mm by 1000mm in size is exaggerated in Figure 30, as the flow measured by the MFC indicate the mass flow at atmospheric (standard) condition.
0.000
5.000
10.000
15.000
20.000
25.000
30.000
35.000
0 2 4 6 8 10 12
125 mBar575 mBar1 BarITTC
Figure 30: Measured drag force at 30 / 30 l/min, in Newton versus speed in [m/s]
CONCLUSIONS
Important overall conclusions from the investigations of PELS are:
• In calm water net effective power3 reductions
of 3-10% were achieved. Note, this improvement can always be added to achieved improvements of traditional optimisations.
• In increasing wave heights an increasing part of this advantage is lost. However, the system does not cause an increase in added resistance or an otherwise deterioration of seakeeping at normal operating speeds.
• The application of drag reduction imposes some changes in the design of the ship, especially the bottom of the hull. When micro-bubble drag reduction is used, the resistance of the ship against rotation or sway motion is reduced. This deteriorates the manoeuvring performance of the ship. Therefore, additional measures should be taken to maintain the desired manoeuvring characteristics. For example, skegs are to be applied in the aft ship to improve the controllability. When using air chambers, the sidewalls of the chambers produce sufficient cross-flow drag to obtain the required manoeuvrability.
• No severe scale effects were found which could question the principle of air-lubrication in general.
3 Note, the efficiency of the ship’s propulsor and that of the compressor needs to
be considered to derive the installed power. As the efficiency of a propulsor is usually less, even higher savings in installed power are feasible.
Because the model that was used in the
PELS project resembles just a fictitious ship-like body, it is expected that the advantage mentioned above can be surpassed with dedicated design strategies. To support such strategies, CFD tools have been developed to optimise the shape of an air cavity by computing the wavy free surface inside of it.
ACKNOWLEDGMENTS
The financial support granted by the e.e.t. programme of Novem is gratefully acknowledged.
The across the board open mind and constructive expert monitoring by P. Haemers of e.e.t. and the external management by Dr. Ir. M. Goldan of Stichting BOS is highly appreciated.
Without the interest and the support of the Dutch industrial partners Bodewes Binnenvaart, Damen Shipyards, DK-group Netherlands, van der Giessen de Noord and Scheepswerf Grave this project was certainly not conducted.
During the project, Ir. H. Leijnse from Twente University and Ir. M. Verhulst graduated on the optical bubble recognition routines and the LDV measurements. Without the help of these colleagues and the other, unnamed colleagues at MARIN, a project of the size and complexity of PELS could never succeed.
REFERENCES
Berg, T. v.d., Luther, S. Lathrop, D.P. and Lohse, D., “Drag Reduction in Bubbly Taylor-Couette Turbulence”, Physical Review Letters, The American Physical Society, February, 2005.
Fukuda, K., Tokunaga, J., Nobunaga, T., Nakatani, T., Iwasaki, T. and Kunitake, Y., “Frictional drag reduction with air lubricant over a super-water-repellent surface”, Journal of Marine Science and Technology, Vol 5, nr. 3, Dec. 2000, p 123-130.
Hoekstra, M., "Numerical simulation of ship stern flows with a space-marching Navier Stokes method", Thesis, Delft University of Technology, October, 1999.
Leijnse, H., “Drag reduction by microbubbles”, master’s thesis, Twente University, February, 2003.
Matveev, K., “Modelling of Vertical Plane Motion of an Air Cavity Ship in Waves“, Proceedings of the 5th international conference on fast sea transportation, FAST ’99, 1999.
Raven, H.C., "A solution method for the nonlinear ship wave resistance problem", Thesis, Delft University of Technology, June, 1996.
Thill, C., “High Speed Camera Observations of Micro-Bubbles in a TBL flow”, 13th European Drag Reduction Meeting, Aussois, France, 1-4 June 2004.
Thill, C., "Insights into Project Energy-saving air-Lubricated Ships (PELS)," Proceedings of the Motorship Marine Propulsion Conference 2005, Bilbao Expedition Centre, Spain, 27 – 28 January 2005, pp. 205-215.
Walree, F. van, "Development, Validation and Application of a Time Domain seakeeping method for High Speed Craft with a Ride Control System", 24th Symposium on Naval Hydrodynamics, Fukuoka Japan, July 2002.
Walree, F. van and Visser, C., "Free sailing seakeeping tests on an air lubricated model", MARIN Report 14972-11-SMB (restricted), March 2005.