PROJECT DESIGN DOCUMENT (PDD) - CDM Loan Scheme · PROJECT DESIGN DOCUMENT (PDD) ... installing...
40
UNFCCC/CCNUCC CDM – Executive Board Page 1 PROJECT DESIGN DOCUMENT FORM FOR CDM PROJECT ACTIVITIES (F-CDM-PDD) Version 04.1 PROJECT DESIGN DOCUMENT (PDD) Title of the project activity Olkaria I Units 4&5 Geothermal Project Version number of the PDD 03 Completion date of the PDD 7/11/2012 Project participant(s) Kenya Electricity Generating Company (KenGen) Host Party(ies) Kenya Sectoral scope and selected methodology(ies) 01 ACM0002, “Consolidated baseline methodology for grid-connected electricity generation from renewable sources” (Version 13.0.0) Estimated amount of annual average GHG emission reductions 635,049 (tonnes)
Transcript of PROJECT DESIGN DOCUMENT (PDD) - CDM Loan Scheme · PROJECT DESIGN DOCUMENT (PDD) ... installing...

UNFCCC/CCNUCC
CDM – Executive Board Page 1
PROJECT DESIGN DOCUMENT FORM
FOR CDM PROJECT ACTIVITIES (F-CDM-PDD)
Version 04.1
PROJECT DESIGN DOCUMENT (PDD)
Title of the project activity Olkaria I Units 4&5 Geothermal Project
Version number of the PDD 03
Completion date of the PDD 7/11/2012
Project participant(s) Kenya Electricity Generating Company (KenGen)
Host Party(ies) Kenya
Sectoral scope and selected methodology(ies) 01
ACM0002, “Consolidated baseline methodology
for grid-connected electricity generation from
renewable sources” (Version 13.0.0)
Estimated amount of annual average GHG
emission reductions
635,049 (tonnes)

UNFCCC/CCNUCC
CDM – Executive Board Page 2
SECTION A. Description of project activity
A.1. Purpose and general description of project activity
>>
The objective of the Olkaria I Units 4&5 Geothermal Project, which has been proposed by the Kenya
Electricity Generating Company Limited (KenGen), is to add about 1,128,288 MWh per year of
geothermal-generated electricity to the Kenya national grid system. The project is a greenfield renewable
energy project which will utilise steam collected from geothermal wells for electricity generation. The
following activities are to be undertaken as part of the implementation of the project activity:
i. Drilling of steam production wells and reinjection wells to provide adequate steam capacity for
the 140 MW power plant
ii. Constructing the steam gathering and reinjection pipeline networks and the associated
infrastructure, such as access roads and new well pads
iii. Construction of power house, installing turbine, generator and its auxiliary equipment
iv. Construction of switchyard and double circuit 220 KV transmission line
Although Kenya has a geothermal potential of between 7,000 and 10,000 MW, about 200 MW of
generation capacity from geothermal has been installed in the country1.
The Kenyan national grid system, with an installed generating capacity of about 1,593 MW by end 2011
(according to the 2010/2011 KPLC Annual Report)2, comprises both renewable and thermal generation
sources. In 2011, KPLC purchased 7,424,137MWh of electricity to the grid which comprised of 19.45%
from geothermal, 42.55% from hydro, 36.26% from thermal, 0.25% from wind, 0.43% from imports and
1.06% from biomass.
The renewable energy generated by the project will be sold under a Power Purchase Agreement to the
Kenya Power and Lighting Company (KPLC). The project activity will reduce CO2 emission through the
displacement of electricity generated by fossil fuel fired power plants connected to the national grid. The
baseline scenario for the project is as follows:
Electricity delivered to the grid by the project activity would have otherwise been generated by the
operation of grid-connected power plants and by the addition of new generation sources, as reflected in
the combined margin (CM) calculations described in the “Tool to calculate the emission factor for an
electricity system”.
In the project scenario, the renewable electricity generated from geothermal source will displace an
equivalent amount of electricity currently generated by the grid-connected power plants.
The project will result in greenhouse gas (GHG) emission reductions by displacing fossil fuel-based
electricity generation in the Kenyan grid with clean geothermal power.
The project is estimated to generate an average of 635,049 tonnes of CER annually and a total of
4,445,343 tonnes over the crediting period.
The project will contribute to the sustainable development of Kenya in the following ways:
i. Renewable electricity – The proposed project will provide renewable and clean electricity to the
national grid while also diversifying the electricity sources for the country and reducing fossil
fuel imports. This will also result in considerable foreign exchange savings that can be committed
to other economic activities.
1 http://oilprice.com/Alternative-Energy/Geothermal-Energy/Kenya-to-Investigate-Potential-of-Geothermal-Power.html and pages 114 to 115 of
the KPLC Annual Report for 2010/2011 (http://www.kenyapower.co.ke/AR/Annual%2520Report%25202010%2520-%25202011.pdf) 2 See http://www.kenyapower.co.ke/AR/Annual%2520Report%25202010%2520-%25202011.pdf
UNFCCC/CCNUCC
CDM – Executive Board Page 3
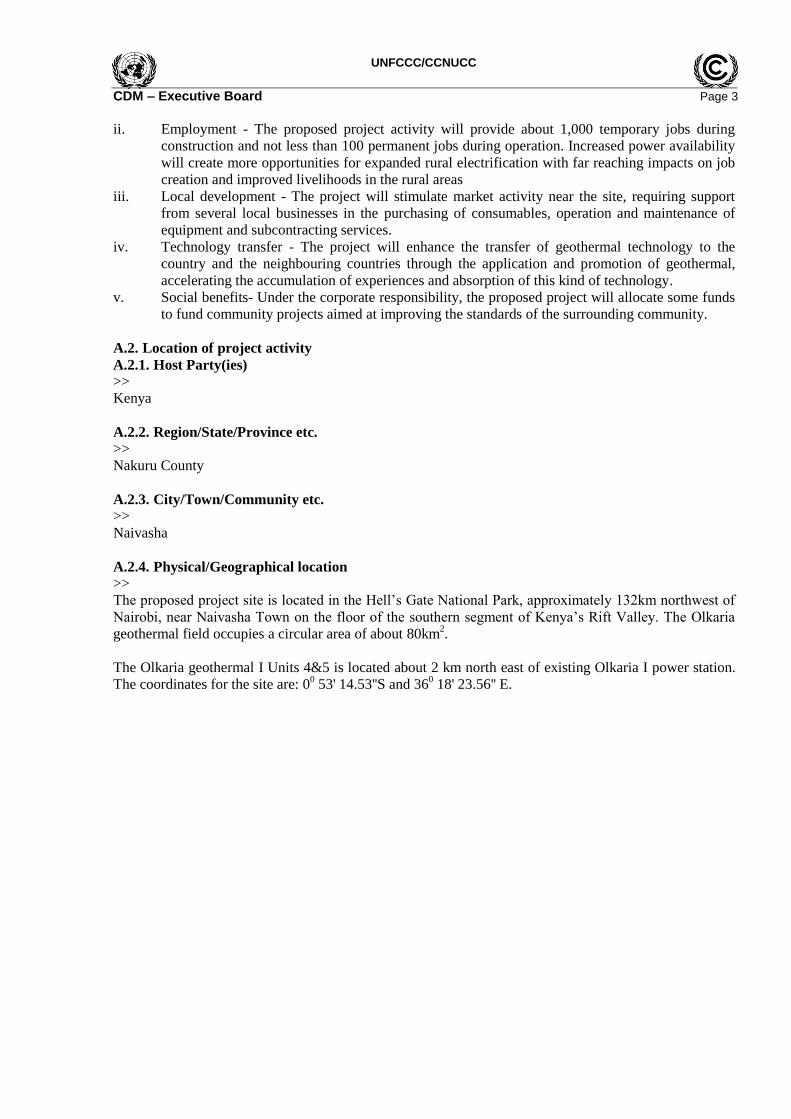
ii. Employment - The proposed project activity will provide about 1,000 temporary jobs during
construction and not less than 100 permanent jobs during operation. Increased power availability
will create more opportunities for expanded rural electrification with far reaching impacts on job
creation and improved livelihoods in the rural areas
iii. Local development - The project will stimulate market activity near the site, requiring support
from several local businesses in the purchasing of consumables, operation and maintenance of
equipment and subcontracting services.
iv. Technology transfer - The project will enhance the transfer of geothermal technology to the
country and the neighbouring countries through the application and promotion of geothermal,
accelerating the accumulation of experiences and absorption of this kind of technology.
v. Social benefits- Under the corporate responsibility, the proposed project will allocate some funds
to fund community projects aimed at improving the standards of the surrounding community.
A.2. Location of project activity
A.2.1. Host Party(ies)
>>
Kenya
A.2.2. Region/State/Province etc.
>>
Nakuru County
A.2.3. City/Town/Community etc.
>>
Naivasha
A.2.4. Physical/Geographical location
>>
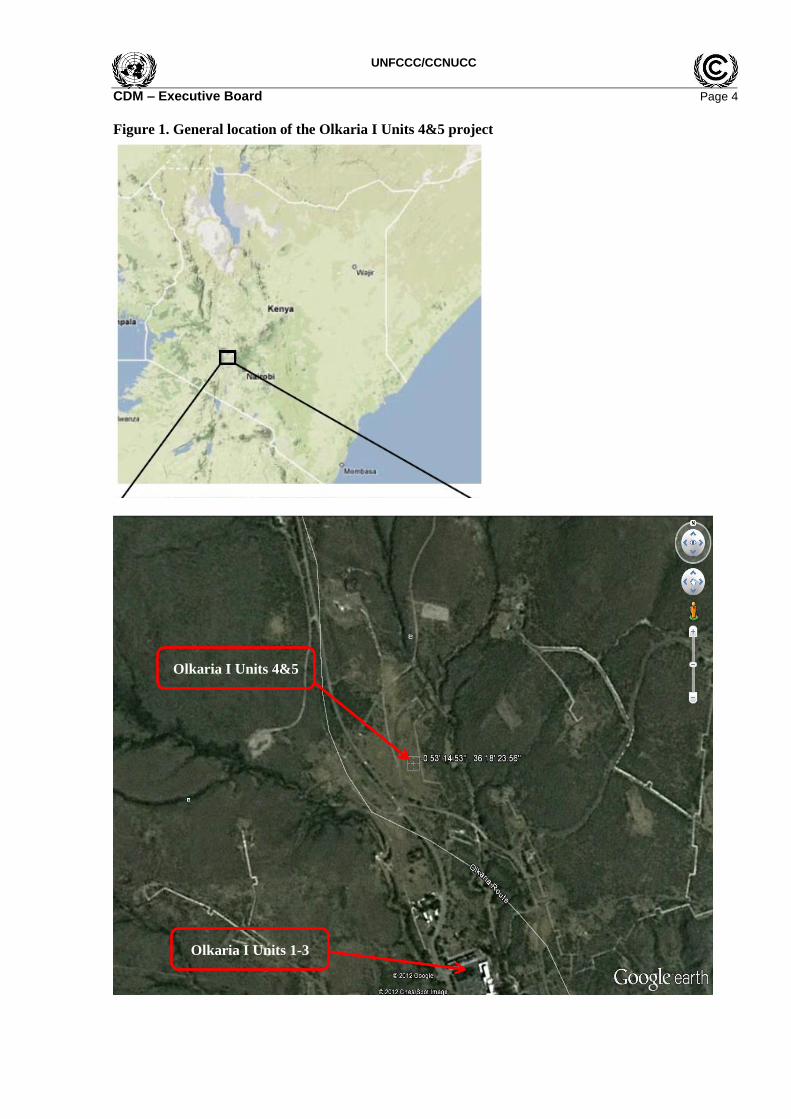
The proposed project site is located in the Hell’s Gate National Park, approximately 132km northwest of
Nairobi, near Naivasha Town on the floor of the southern segment of Kenya’s Rift Valley. The Olkaria
geothermal field occupies a circular area of about 80km2.
The Olkaria geothermal I Units 4&5 is located about 2 km north east of existing Olkaria I power station.
The coordinates for the site are: 00 53' 14.53''S and 36
0 18' 23.56'' E.
UNFCCC/CCNUCC
CDM – Executive Board Page 4
Figure 1. General location of the Olkaria I Units 4&5 project
Olkaria I Units 1-3
Olkaria I Units 4&5

UNFCCC/CCNUCC
CDM – Executive Board Page 5
A.3. Technologies and/or measures
The purpose of the proposed project activity is to build and operate a 140 MW capacity greenfield
geothermal power plant capable of exporting 1,128,288 MWh of clean electricity per year to the Kenya
national grid. The electricity exported to the grid will displace the fossil fuel intensive electricity from the
Kenya national grid. The 140 MW generation capacity project will involve the installation and operation
of a geothermal power plant, consisting of a steam turbine, a generator switchyard and transmission line.
The steam for the project will be provided by geothermal wells and the condensate will be re-injected to
maintain groundwater supply. The plant is designed to have a typical lifetime of 25 years3.
The baseline scenario is the provision of the electricity generated by the project by the additional
provision of comparable capacity or electricity generation by the Kenya Power and Light Company, the
national grid operator, which is the same as the situation existing before the project activity. The project
scenario is the installation and operation of the geothermal plant with a total installed capacity of 140
MW at the project site where presently there is no power generation at all.
Since there is a significant proportion of thermal power generation in the Kenya national grid system, the
establishment of the proposed project activity will lead to greenhouse gas (GHG) emission reductions as
estimated following the baseline methodology below.
The Technology
The project will consist of two identical 70 MW units with a design steam pressure and temperature of 5
bara and 151.70C, respectively. The geothermal technology applied will consist of a single flash
condensing turbine manufactured by Toshiba Power Systems Company4 and a generator manufactured by
Mitsubishi Corporation5. The management of the project including procurement, engineering and
construction (EPC) has been contracted out to a Consortium of Hyundai Engineering Co. Ltd & Toyota
Tsusho Corporation.
The main project equipment and their key parameters are shown in Table 1.
Table 1: Key Equipment and their Specifications
Equipment Parameter Specification
Plant cycle - Single Flash, Condensing
Turbine No. of units 2 set Type Single Casing, Double Flow, Impulse and/or Reaction,
Condensing Type, Electro-hydraulic Governor Rated output 70,000 kW
Max. capacity 105 % Rated output Speed 3,000 rpm
Steam pressure/temp. 5.0 bar absolute / 151.7oC at interface point Condenser No. of units 2 set
Type Spray, Direct Contact type Condenser
Generator
No. of Units 2 set
Type 3 phase, Horizontal cylindrical field, totally enclosed, self-
ventilated, air-cooled, brushless type exciter
Capacity 70,000 kW
Voltage 11 kV/50/3000 rpm
3 See page 145 of file “WB-KenGen-Olkaria-PhaseII-Final-FSR_text for printing_.pdf” 4 http://www.toshiba.co.jp/worldwide/about/company/ps.html 5 http://www.mitsubishicorp.com/jp/en/bg/machinery/

UNFCCC/CCNUCC
CDM – Executive Board Page 6
/Frequency/Speed
Generator
transformer
No. of Units 2 set
Type Outdoor use, oil-immersed, self-cooled type
Capacity 87,500 kVA
Primary voltage 11 kV (Delta), with on load tap changer (plus 10%, minus
10%)
Secondary Voltage 220 kV (Star)
Frequency/ Number of
phases/ Rating
50Hz/3/ Continuous
The detailed technical specifications of the turbine/generator and auxiliaries are as contained in the
Feasibility Study Report for New Units of the Optimization Project (Section 4.3)6
Although Kenya has installed close to 200 MW of geothermal power generation capacity, the proposed
project activity offers significant technology transfer from Annex I party to Kenya as it involves the
application of more updated geothermal technology covering, steam exploration, well drilling and power
plant construction and operation. Local installation, operation and maintenance staff will be trained by the
equipment manufacturers.
The Process
The proposed project activity will draw its steam from new wells being drilled near and around the
project site. Since location of steam wells is based on blocks, the proposed project will have separate and
distinct steam sources, different from the other existing plants. The applicable Power Purchase Agreement
(PPA) with KPLC will also be separate.
Steam collected from the production steam wells supplying the project activity, will be fed into the two
70 MW turbines at 5 bar pressure after brine separation. The steam from the turbine will exhaust via a
direct contact condenser, which uses a forced draught cooling tower for steam condensation. The returning condensate from the turbine and steam separator will then be collected and re-injected back into
the geothermal field cold re-injection wells.
Generation will be at 11kV and will be stepped up to 220kV before being transmitted. The electricity
generated from the project activity will be measured using two meters (one meter will be owned by
KenGen (Main Meter) while the other by Kenya Power and Lighting Company (back-up Meter)). The
two meters will be located at a sub-station located within the geothermal project site. Electricity generated
will be transmitted to Olkaria II sub-station where it will be stepped-up and subsequent export to the
National Grid via a high voltage transmission line. The geothermal plant will be monitored and controlled
at the central control room at the project site.
Although Kenya has installed close to 200 MW of geothermal power generation capacity, the proposed
project activity offers significant technology transfer from Annex I party to Kenya as it involves the
application of more updated geothermal technology covering, steam exploration, well drilling and power
plant construction and operation. Local installation, operation and maintenance staff will be trained by the
equipment manufacturers. It is important for the staff to understand both the steam resource and the
turbine/generator technology. Technical training will be done as part of the installation programme. The
manufacturers’ turbine/generator training manuals will be used on site. Opportunities for additional ad-
hoc training will be created as and when needed.
6 See from page 108 of file “WB-KenGen-Olkaria-PhaseII-Final-FSR_text for printing_.pdf”

UNFCCC/CCNUCC
CDM – Executive Board Page 7
A.4. Parties and project participants
>>
Party involved
(host) indicates a host
Party
Private and/or public entity(ies)
project participants
(as applicable)
Indicate if the Party involved
wishes to be considered as
project participant (Yes/No)
Kenya (host) Kenya Electricity Generating
Company Limited. (Private entity)
No
A.5. Public funding of project activity
>>
Public funds from Annex I countries are involved in the proposed project activity. The project activity
does not make use of Official Development Assistance (ODA), nor does it result in the diversion of such
ODA. Instead, the project is funded through equity and commercial loans.
SECTION B. Application of selected approved baseline and monitoring methodology
B.1. Reference of methodology
>>
ACM0002, “Consolidated baseline methodology for grid-connected electricity generation from renewable
sources” (Version 13.0.0)
This methodology also refers to the latest approved version of the following tools:
i. Tool to calculate the emission factor for an electricity system, version 2.2.1, EB 63
ii. Tool for the demonstration and assessment of additionality, version 6.0.0, EB 65
B.2. Applicability of methodology
>>
Applicability Requirement of ACM0002, Version
13.0.0
Olkaria I Units 4&5 Geothermal
Project
Applicabi
lity Met?
Grid-connected renewable power generation project
activities that (a) install a new power plant at a site
where no renewable power plant was operated prior to
the implementation of the project activity (greenfield
plant); (b) involve a capacity addition; (c) involve a
retrofit of (an) existing plant(s); or (d) involve a
replacement of (an) existing plant(s)
The proposed project is a
Greenfield grid-connected
renewable power generation
activity and the site where the
project will be located has got no
other power project
Yes
The project activity is the installation, capacity
addition, retrofit or replacement of a power plant/unit
of one of the following types: hydro power plant/unit
(either with a run-of-river reservoir or an accumulation
reservoir), wind power plant/unit, geothermal power
plant/unit, solar power plant/unit, wave power
plant/unit or tidal power plant/unit
The proposed project is an
installation of a new geothermal
power plant
Yes
In the case of capacity additions, retrofits or
replacements (except for capacity addition projects for
which the electricity generation of the existing power
plant(s) or unit(s) is not affected): the existing plant
started commercial operation prior to the start of a
minimum historical reference period of five years,
used for the calculation of baseline emissions and
defined in the baseline emission section, and no
capacity addition or retrofit of the plant has been
The proposed project is a greenfield
project (i.e. not capacity additions,
retrofits or replacements).
Yes

UNFCCC/CCNUCC
CDM – Executive Board Page 8
undertaken between the start of this minimum
historical reference period and the implementation of
the project activity
In case of hydro power plants, at least one of the
following conditions must apply:
The project activity is implemented in an existing
single or multiple reservoirs, with no change in the
volume of any of the reservoirs; or;
The project activity is implemented in an existing
single or multiple reservoirs, where the volume of
any of reservoirs is increased and the power
density of each reservoir, as per the definitions
given in the Project Emissions section, is greater
than 4 W/m2; after the implementation of the
project activity; or
The project activity results in new single or
multiple reservoirs and the power density of each
reservoir, as per the definitions given in the
Project Emissions section, is greater than 4 W/m2
after the implementation of the project activity.
Project is not a hydro power plant
and the conditions do not apply
Yes
The methodology is not applicable to the following:
Project activities that involve switching from
fossil fuels to renewable energy sources at the site
of the project activity, since in this case the
baseline may be the continued use of fossil fuels at
the site;
Biomass fired power plants;
A hydro power plant that results in the creation of
a new single reservoir or in the increase in an
existing single reservoir where the power density
of the reservoir is less than 4 W/m2
Project does:
not involve switching from
fossil fuels to renewable energy
sources
is not a biomass fired plant
is not a hydro power plant
Yes
The geographic and system boundaries for the relevant
electricity grid can be clearly identified and
information on the characteristics of the grid is
available.
The geographic and system
boundary of Kenyan grid is clearly
identifiable and information on the
grid exits.
Yes
B.3. Project boundary
The greenhouse gases and emission sources included in or excluded from the project boundary are shown
in Table 1 below.
Source GHGs Included? Justification/Explanation
Ba
seli
ne
Sce
na
rio CO2 emissions from electricity
generation in fossil fuel fired power
plants that are displaced due to the
project activity.
CO2 Yes Main emission source
CH4 No Minor emission source
N2O No Minor emission source
Pro
ject
Sce
nari
o
For geothermal power plants, fugitive
emissions of CH4 and CO2 from non-
condensable gases contained in
geothermal steam.
CO2 Yes Main emission source
CH4 Yes Main emission source
N2O No Minor emission source
CO2 emissions from combustion of CO2 Yes Main emission source
UNFCCC/CCNUCC
CDM – Executive Board Page 9
fossil fuels for electricity generation
in solar thermal power plants and
geothermal power plants
CH4 No Minor emission source
N2O No Minor emission source
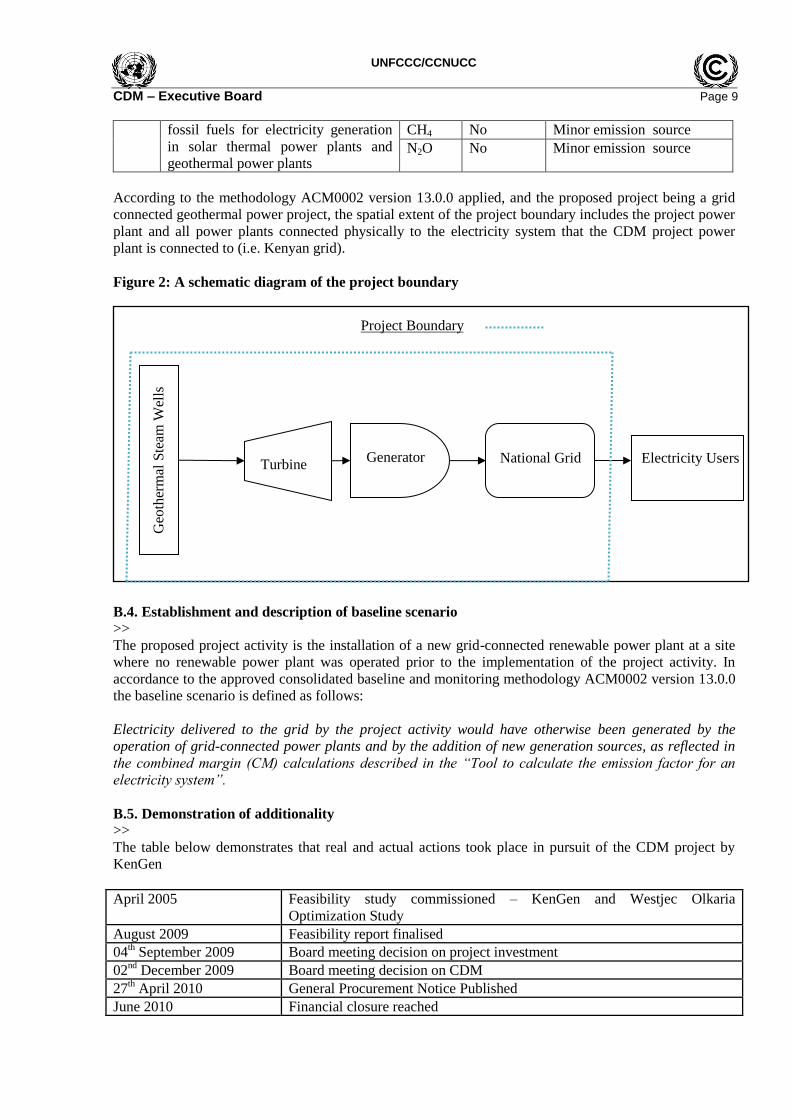
According to the methodology ACM0002 version 13.0.0 applied, and the proposed project being a grid
connected geothermal power project, the spatial extent of the project boundary includes the project power
plant and all power plants connected physically to the electricity system that the CDM project power
plant is connected to (i.e. Kenyan grid).
Figure 2: A schematic diagram of the project boundary
B.4. Establishment and description of baseline scenario
>>
The proposed project activity is the installation of a new grid-connected renewable power plant at a site
where no renewable power plant was operated prior to the implementation of the project activity. In
accordance to the approved consolidated baseline and monitoring methodology ACM0002 version 13.0.0
the baseline scenario is defined as follows:
Electricity delivered to the grid by the project activity would have otherwise been generated by the
operation of grid-connected power plants and by the addition of new generation sources, as reflected in
the combined margin (CM) calculations described in the “Tool to calculate the emission factor for an
electricity system”.
B.5. Demonstration of additionality
>>
The table below demonstrates that real and actual actions took place in pursuit of the CDM project by
KenGen
April 2005 Feasibility study commissioned – KenGen and Westjec Olkaria
Optimization Study August 2009 Feasibility report finalised 04
th September 2009 Board meeting decision on project investment
02nd
December 2009 Board meeting decision on CDM 27
th April 2010 General Procurement Notice Published
June 2010 Financial closure reached
Geo
ther
mal
Ste
am W
ells
Turbine Generator National Grid Electricity Users
Project Boundary

UNFCCC/CCNUCC
CDM – Executive Board Page 10
15th Oct 10 & 25
th Oct 10 ‘No objection’ received for Tender Documentation for Lot B.2 & B.1
received respectively 23
rd Feb 11 ‘No objection’ received for Tender Documentation – Lot C
7th /15
th April 11 Tender Documentation – Lot A ‘No objection’ received from WB/KfW
12th April 2011 Prior consideration for the project sent to UNFCCC and the Kenyan DNA
Refer http://cdm.unfccc.int/Projects/PriorCDM/notifications/index_html August 2011 Carbon Asset advisory services tender for the project issued 07
th Nov 2011 Engineering, Procurement and Construction (EPC) contract signed
9th November 2011 Contract signed for Lot B : Power Plant
5th December 2011 Project construction started
6th December 2011 Contract signed for Lot C: HV Lines & Substation
February 2012 Negotiation completed in December 2011 and Contract Documentation sent
to WB/KFW for Lot A: Steamfield Development 10
th February 2012 Carbon Asset advisory services contract signed
March 02,2012 ‘No objection’ received for Lot A Contract 4
th April 2012 Contract signed for Lot A: Steam field Development
Since the project starting date (award of tender for Engineering Procurement & Construction on 7 Nov
2011) is after 02 August 2008, the UNFCCC was notified of the commencement of the project activity
and of the intention to seek CDM status on 12/4/2011as per the “Guidelines on the Demonstration and
Assessment of Prior Consideration of the CDM”; (version 04.0), EB 62.
In order to demonstrate and asses additionality for this project, the “Tool for the demonstration and
assessment of additionality”; version 06.0.0 (EB 65) is applied as per the requirements of the approved
consolidated baseline and monitoring methodology, ACM0002 version 13.0.0.
The stepwise approach of the methodological tool for demonstration and assessment of additionality, as
shown in the flow chart below, has been applied and is discussed below.

UNFCCC/CCNUCC
CDM – Executive Board Page 11
Step 1: Identification of alternatives to the project activity consistent with current laws and
regulations
Realistic and credible alternatives to the project activity have been defined through the following Sub-
steps:
Sub-step 1a: Define alternatives to the project
The following are the realistic and credible alternatives available to the project activity that provide
outputs or services comparable with the proposed CDM project activity:
Alternative 1: The proposed project activity undertaken without being registered as a CDM project
activity. This would entail the construction and operation of the project with the total installed capacity of
140 MW, without being registered as a CDM project activity.
Alternative 2: Electricity generated by the operation of grid-connected power plants and by the addition
of new generating sources. This is the continuation of the current situation and, according to ACM0002,
is the identified baseline for the installation of a new grid-connected renewable power plant,
Alternative 3: A fossil fuel based power plant producing electricity with comparable quality, properties
and application areas. This alternative, involving the construction and operation of a new fossil fuel
power plant, is considered credible because fossil fuel based power plants have already been implemented
in Kenya by Independent Power Producers (e.g. Tsavo Power, Iberafrica and Rabai). More recently,
another IPP, Rabai Power, has commissioned a fossil fuel based power plant with a capacity of 90 MW.
Plans are also underway by KenGen to develop a 300/600MW coal fired power plant in Mombasa.
Alternative 4: A power plant using another source of renewable energy and producing electricity with
comparable quality, properties and application areas (e.g. hydro, biomass or wind). This alternative,
involving the construction and operation of another renewable power plant such as solar, wind, hydro or
biomass, is considered credible because wind and hydro power plants have already been implemented by
KenGen and Independent Power Producers in Kenya (Ormat Power and Mumias Sugar Company,
respectively), although their capacities are far less than the proposed project. Solar power plants are not
considered a credible alternative given the high investment costs involved.
Since there are no known renewable (wind, hydro and biomass) resources with electricity generation
potential similar to the proposed project activity, alternative 4 is not feasible.
Sub-step 1b: Consistency with mandatory laws and regulations
Both the above alternatives to the project activity are consistent with the Energy Act (2006)7 and the
related mandatory and regulatory requirements8, taking into account the enforcement in Kenya and EB
decisions on national and/or sectoral policies and regulations.
The Energy Act (2006) allows for Independent Power Producers to supply electricity to the national grid
through a Power Purchase Agreement with the Kenya Power and Lighting Company. There are no
restrictions on types of power plants, and both fossil fuel based power plants and renewable energy power
plants are allowed to deliver electricity to the grid.
Since the realistic and credible alternatives available to the project participants, as identified above,
comply with all applicable laws and regulations, the project is additional under step 1.
7 http://www.erc.go.ke/energy.pdf accessed 15/12/2011 8 http://www.erc.go.ke/erc/regulatory_instruments/?ContentID=16 accessed 15/12/2011

UNFCCC/CCNUCC
CDM – Executive Board Page 12
Step 2: Investment analysis
Taking into account the “Tool for the demonstration and assessment of additionality”; version 06.0.0 and
the “Guidelines on the Assessment of Investment Analysis”, version 05), this step has been used to
determine that the proposed project activity is not economically or financially feasible, without the
revenue from the sale of CERs.
The following Sub-steps have been used to conduct the investment analysis.
Sub-step 2a: Determine appropriate analysis method
The “Tool for the demonstration and assessment of additionality”; version 06.0.0 provides for any of the
following three investment analysis methods:
(i) Simple cost analysis (Option I),
(ii) Investment comparison analysis (Option II)
(iii) Benchmark analysis (Option III).
As per the “Tool for the demonstration and assessment of additionality”; version 06.0.0, and since, the
proposed project activity will generate financial and economic benefits (sale of electricity to the state
utility) other than CDM related income, the simple cost analysis (Option I) cannot be applied.
The baseline scenario identified in accordance to the approved consolidated baseline and monitoring
methodology, ACM0002, is the supply of electricity from the grid. This baseline does not necessarily
require investment and is not within the control of the project developer (the project activity could be
implemented by entities other than the project proponent). Benchmark analysis (Option III) is therefore
selected as the most appropriate method of financial analysis for this project.
Given that the project has dual revenue streams, electricity for sale to the national grid and certified
emission reductions, from the definition of alternatives in Sub-step 1a above, we are restricted to the
proposed project activity not undertaken as a CDM project.
Sub-step 2b: Option III. Apply benchmark analysis
The Internal Rate of Return (IRR) is the most commonly used financial indicator by Bankers and
Investors to assess the intrinsic viability of a project. It is also the financial indicator used by the Kenya
Government to assess the intrinsic viability of a project. The IRR thus computed, has to be compared with
a benchmark indicator. The Project IRR has therefore been chosen as the relevant financial indicator for
the investment analysis of the proposed project and has been calculated on a pre-tax basis as per the “Tool
for the demonstration and assessment of additionality”, Version 06.0.0. The Project IRR has been chosen
since this is a long term project with negative and positive cash flows and because Project IRR is not
affected by subjective inputs (NPV for example is affected by the discount rate applied in the analysis).
As per page 3 of the “Guideline on Assessment of Investment Analysis”, vers 05 (EB 62, Annex 5), in
case where a benchmark approach is used, the applied benchmark shall be appropriate to the type of IRR
calculated. The government of Kenya issued guidelines on the minimum required rate of return for all
government projects. This minimum return rate specified by the Kenya Government in the Treasury
Circular No 1/2007 dated 3rd
Jan 2007, paragraph 2.3, page 4 (See sent file “Ministry of
Finance_Treasury Circular_1_2007”) has been applied as the benchmark.
Sub-step 2c: Calculation and comparison of financial indicators (only applicable to Options II and III)
The main data used in calculating the project IRR are shown in the table below.
UNFCCC/CCNUCC
CDM – Executive Board Page 13
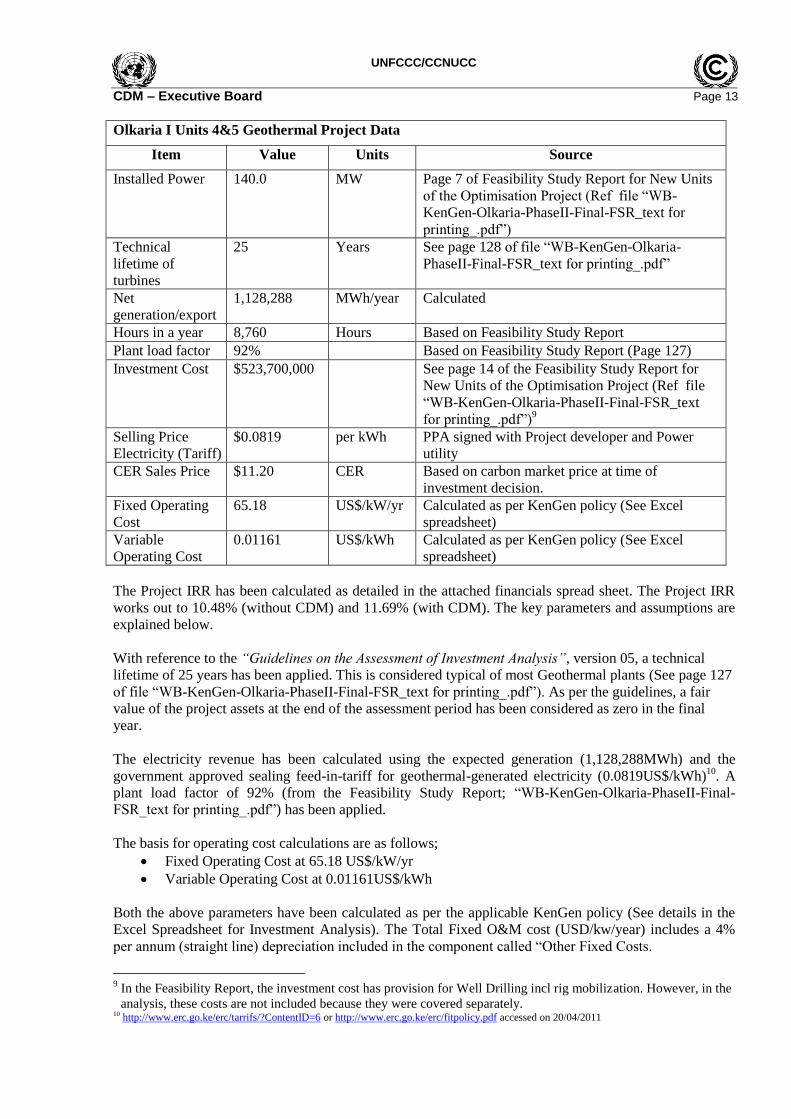
Olkaria I Units 4&5 Geothermal Project Data
Item Value Units Source
Installed Power 140.0 MW Page 7 of Feasibility Study Report for New Units
of the Optimisation Project (Ref file “WB-
KenGen-Olkaria-PhaseII-Final-FSR_text for
printing_.pdf”)
Technical
lifetime of
turbines
25 Years See page 128 of file “WB-KenGen-Olkaria-
PhaseII-Final-FSR_text for printing_.pdf”
Net
generation/export
1,128,288 MWh/year Calculated
Hours in a year 8,760 Hours Based on Feasibility Study Report
Plant load factor 92% Based on Feasibility Study Report (Page 127)
Investment Cost $523,700,000 See page 14 of the Feasibility Study Report for
New Units of the Optimisation Project (Ref file
“WB-KenGen-Olkaria-PhaseII-Final-FSR_text
for printing_.pdf”)9
Selling Price
Electricity (Tariff)
$0.0819 per kWh PPA signed with Project developer and Power
utility
CER Sales Price $11.20 CER Based on carbon market price at time of
investment decision.
Fixed Operating
Cost
65.18 US$/kW/yr Calculated as per KenGen policy (See Excel
spreadsheet)
Variable
Operating Cost
0.01161 US$/kWh Calculated as per KenGen policy (See Excel
spreadsheet)
The Project IRR has been calculated as detailed in the attached financials spread sheet. The Project IRR
works out to 10.48% (without CDM) and 11.69% (with CDM). The key parameters and assumptions are
explained below.
With reference to the “Guidelines on the Assessment of Investment Analysis”, version 05, a technical
lifetime of 25 years has been applied. This is considered typical of most Geothermal plants (See page 127
of file “WB-KenGen-Olkaria-PhaseII-Final-FSR_text for printing_.pdf”). As per the guidelines, a fair
value of the project assets at the end of the assessment period has been considered as zero in the final
year.
The electricity revenue has been calculated using the expected generation (1,128,288MWh) and the
government approved sealing feed-in-tariff for geothermal-generated electricity (0.0819US$/kWh)10
. A
plant load factor of 92% (from the Feasibility Study Report; “WB-KenGen-Olkaria-PhaseII-Final-
FSR_text for printing_.pdf”) has been applied.
The basis for operating cost calculations are as follows;
Fixed Operating Cost at 65.18 US$/kW/yr
Variable Operating Cost at 0.01161US$/kWh
Both the above parameters have been calculated as per the applicable KenGen policy (See details in the
Excel Spreadsheet for Investment Analysis). The Total Fixed O&M cost (USD/kw/year) includes a 4%
per annum (straight line) depreciation included in the component called “Other Fixed Costs.
9 In the Feasibility Report, the investment cost has provision for Well Drilling incl rig mobilization. However, in the
analysis, these costs are not included because they were covered separately. 10 http://www.erc.go.ke/erc/tarrifs/?ContentID=6 or http://www.erc.go.ke/erc/fitpolicy.pdf accessed on 20/04/2011

UNFCCC/CCNUCC
CDM – Executive Board Page 14
From the calculations above, the Project IRR at 10.48% (without CDM) is less than the benchmark rate of
15%. A comparison of the Project IRR with the benchmark reveals that the project is not feasible for
KenGen on a commercial basis.
Sub-step 2d: Sensitivity analysis (only applicable to Options II and III):
The robustness of the conclusion drawn above has been tested, by subjecting the critical assumptions to
reasonable variations as per the “Guidelines on the Assessment of Investment Analysis”, version 05 which
state that:
“Only variables, including the initial investment cost, that constitute more than 20% of either total
project costs or total project revenues should be subjected to reasonable variation (all parameters
varied need not necessarily be subjected to both negative and positive variations of the same
magnitude), and the results of this variation should be presented in the PDD and be reproducible in the
associated spread sheets”.
The initial objective of a sensitivity analysis is to determine in which scenarios the project activity would
pass the benchmark or become more favourable than the alternative.
Based on the guidelines, the Project Proponent has identified the critical parameters as:
1. Investment cost
2. Operating cost
3. Net generation/export
4. Selling Price Electricity (Tariff)
Accordingly, the critical assumptions have been subjected to a goal seek sensitivity analysis. The
outcome of the sensitivity analysis is given in the table below.
Parameter Value to Benchmark
Investment Cost 70% Decrease of 30%
Operating Cost 10% Decrease of 90%
Net generation/export 131% Increase by 31%
Selling Price electricity
(Tariff)
131% Increase by 31%
From the table above, it is evident that for the Project IRR to reach the benchmark value of 15%, one of
the following is necessary:
1. The investment cost has to decrease by 30% while the other parameters remain constant
2. The operating cost has to decrease by 90% while the other parameters remain constant or
3. The generation has to increase by at least 31% while the other factors remain constant.
4. The electricity sale price/tariff has to increase by at least 31% while the other factors remain constant.
It is evident that the project IRR remains low even with the favourable variations above.
The benchmark and sensitivity analyses (under step 2) show that the project activity is not financially
viable without the CER revenue (Project IRR of 10.48% against a benchmark of 15%) and the CER
revenue helps to improve the Project IRR to 11.69%. The sensitivity analysis is shown in the figure
below:

UNFCCC/CCNUCC
CDM – Executive Board Page 15
* Tariff sensitivity has not been shown on the chart as it is exactly identical to Generation.
Although carbon revenues help to improve the financial performance of the project, it does not achieve
the 15% benchmark and the project has to be further justified on socio-economic grounds as required by
the Government of Kenya. In accordance with the Kenya Government Treasury Circular No 1/2007 dated
3rd Jan 2007, paragraph 2.3, page 4 (See file “Ministry of Finance_Treasury Circular_1_2007”), where
the rate of return is less than 15%, adequate justification for the proposed project has to be presented in
terms of socio-economic impact of the proposal. The socio-economic impacts of geothermal development
has been independently presented in a study by AFREPEN entitled “The Socio-Economic and
Environmental Impact Of Geothermal Energy On The Rural Poor In Kenya” (See file “AFREPEN Study
Report.pdf”;
http://www.afrepren.org/adb_finesse/Task%203/Background%20Material/AFREPREN%20OPaper%201
2.pdf) and “Environmental & Socio-Economic Study” (See file “Environmental & Socio-Economic Study
by Martin Mwangi.pdf”; http://www.geothermal.org/10MarApril24.pdf
The proposed project is therefore additional up to step 2.
Step 4: Common practice analysis.
This section provides the “Common practice analysis” as per Paragraph 47 of the “Tool for the
demonstration and assessment of additionality”, version 06.0.0, EB 65
Step 1. Output Range.
The proposed project has a capacity of 140 MW consisting of 2 steam turbines of 70 MW each. Going by
the guideline of +/-50%, the applicable output range for the project is 70 MW to 210 MW.
8.5%
9.5%
10.5%
11.5%
12.5%
13.5%
14.5%
15.5%
-10 -5 0 5 10
IRR
Sensitivity (%)
Sensitivity Analysis
OperatingCost
GenerationkWh
InvestmentCost
Benchmark

UNFCCC/CCNUCC
CDM – Executive Board Page 16
Step 2. Applicable Geographical Area
The applicable geographical area for the proposed project covers the entire host country (Kenya) as the
default area specified in the guideline. The projects within the host country and the output range that have
started commercial operation before the start date and are connected to the national grid system are shown
in the table below.
Emergency supply projects that have been brought intermittently between 2006 to date due to poor
hydrology have not been included in this table (See
http://www.kplc.co.ke/fileadmin/user_upload/1Report_Pages.pdf):
Plant Technology Type Year of
Commissioning
Capacity
MW
Remarks
Rabai -Petrothermal
Thermal –
Automotive Gas
Oil Sept 09 90
Olkaria 2 Geothermal 2003-2009 70 CDM registered
Kipevu Diesel 1-Petrothermal
Thermal –Heavy
Fuel Oil Oct 99 75
Tsavo-Petrothermal
Thermal-Heavy
Fuel oil June 01 74
Kamburu Hydro 1974-76 94.2
Kiambere Hydro 1988 144
Turkwel Hydro 1991 106
Kipevu III
Thermal –Heavy
Fuel Oil 2011 115
The total number Nall, which excludes the CDM-registered projects, is 7.
Step 3. Applicable Technology
Other than the CDM-registered Olkaria2, none of the plants listed in step 2 above apply geothermal
energy technology. Ndiff is therefore the same as Nall (7).
Step 3. Calculation of factor F
F = 1-Ndiff/Nall
Factor F is therefore 0. There are therefore no plants using similar technology to the technology used in
the proposed project activity. Also, since Nall is equal to Ndiff, then the Nall-Ndiff = 0.
Since factor F is 0 and Nall-Ndiff is also 0, the proposed project activity is not a common practice as per the
guidelines. The proposed project activity is therefore additional under common practice analysis.
B.6. Emission reductions
B.6.1. Explanation of methodological choices
>>
Project Emissions

UNFCCC/CCNUCC
CDM – Executive Board Page 17
The project activity involves operation of new geothermal power plant and in accordance with ACM0002
(Version 13.0.0) emission due to the release of non-condensable gases is accounted for under project
emissions. Project emissions are accounted for by using the following equation:
Where:
PEy Project emissions in year y (tCO2e)
PEFF,y Project emissions from fossil fuel consumption in year y (tCO2)
PEGP,y Project emissions from the operation of geothermal power plants due to the release of
non-condensable gases in year y (tCO2e)
PEHP,y Project emissions from water reservoirs of hydro power plants in year y (tCO2e)
Fossil fuel combustion (PEFF,y)
PEFF,y is calculated as per the latest version of the Tool to calculate project or leakage CO2 emissions
from fossil fuel combustion version 02.
As per the tool, CO2 emissions from fossil fuel combustion in process j are calculated based on the
quantity of fuels combusted and the CO2 emission coefficient of those fuels. For this project, PEFC,j,y is
equal to PEFF,y. Where PEFC,j,y is calculated as follows:
The CO2 emission coefficient COEFi,y can be calculated using Option B, i.e. The CO2 emission coefficient
COEFi,y is calculated based on net calorific value and CO2 emission factor of the fuel type i, as follows:
Emissions of non-condensable gases from the operation of geothermal power plants (PEGP,y)

UNFCCC/CCNUCC
CDM – Executive Board Page 18
Since the project activity is a geothermal project, fugitive emissions of carbon dioxide and methane due to
release of non-condensable gases from produced steam is counted for. As a conservative approach, this
methodology assumes that all non-condensable gases entering the power plant are discharged to
atmosphere via the cooling tower. Fugitive carbon dioxide and methane emissions due to well testing and
well bleeding are not considered, as they are negligible. PEGP,y is calculated as follows:
Where:
PEGP,y = Project emissions from the operation of geothermal power plants due to the release
of non-condensable gases in year y (tCO2e)
wsteam,CO2,y = Average mass fraction of carbon dioxide in the produced steam in year y
(tCO2/t steam)
wsteam,CH4,y = Average mass fraction of methane in the produced steam in year y (tCH4/t steam)
GWPCH4 = Global warming potential of methane valid for the relevant commitment period
(tCO2e/tCH4)
Msteam,y = Quantity of steam produced in year y (t steam)
Baseline emissions
Baseline emissions include only CO2 emissions from electricity generation in fossil fuel fired power
plants in the grid that are displaced due to the project activity. The methodology assumes that all project
electricity generation above baseline levels would have been generated by existing grid-connected power
plants and the addition of new grid-connected power plants. The baseline emissions are to be calculated
as follows:
Where:
BEy = Baseline emissions in year y (tCO2)
EGPJ,y = Quantity of net electricity generation that is produced and fed into the grid as a result of
the implementation of the CDM project activity in year y (MWh)
EFgrid,CM,y = Combined margin CO2 emission factor for grid connected power generation in year y
calculated using the latest version of the .Tool to calculate the emission factor for an
electricity system. (tCO2/MWh)
Since the project is a Greenfield renewable energy power plant, the quantity of electricity generated is
calculated as per the formula below:
Where:
EGPJ,y = Quantity of net electricity generation that is produced and fed into the grid as a
result of the implementation of the CDM project activity in year y (MWh)
EGfacility,y = Quantity of net electricity generation supplied by the project plant/unit to the grid
in year y (MWh)
Emission Factor of the grid (EFgrid,CM,y)
The baseline emission factor (EFy) is calculated as a combined margin (EFgrid,CM,y), consisting of the
combination of operating margin (EFgrid,OM,y) and build margin (EFgrid,BM,y) factors in accordance with the
latest “Tool to calculate the emission factor for an electricity system, version 02”.

UNFCCC/CCNUCC
CDM – Executive Board Page 19
Calculations of the combined margin emission factor of the grid will be done ex-post based on dispatch
data from an official source (Kenya Power and Lighting Company Limited (KPLC), www.kplc.co.ke and
Energy Regulatory Commission, http://www.erc.go.ke/ctariff.pdf). KPLC does not post the dispatch data
on its website, so the data has been obtained from KPLC on a disc.
Step 1: Identify the relevant electricity systems
As per the project boundary selected and in determining the electricity emission factors, the spatial extent
of the project boundary includes the Kenyan grid system, which is physically connected to the project
activity through transmission and distribution lines. All power plants considered in the baseline are
connected to this grid system and the project activity will export power to this grid system and displace
electricity within it.
Step 2: Choose whether to include off-grid power plants in the project electricity system (optional)
Off-grid power plants are not included in grid emission factor determination (option I).
Step 3: Select a method to determine the operating margin (OM)
The tool to calculate the emission factor for an electricity system version 02 offers the following optional
methods to calculate the Operating Margin emission factor(s), EFgrid, OM,y:
(a) Simple OM, or
(b) Simple adjusted OM, or
(c) Dispatch Data Analysis OM, or
(d) Average OM.
The Dispatch Data Analysis method has been used to calculate EFgrid,OM,y.
The Operating Margin emission factor EFgrid,OM, will therefore be updated annually (ex-post) for the year
in which actual project electricity generation and associated emissions reductions occur.
The baseline calculation for the PDD, however, is based on ex-ante data vintage using the most recent
year (January – December 2011) which data was made available (See attached ER calculation
spreadsheet).
Step 4: Calculate the operating margin emission factor according to the selected method
(c) Dispatch data analysis
The dispatch data analysis OM emission factor (EFgrid,OM-DD,y) is determined based on the grid power units
that are actually dispatched at the margin during each hour h where the project is displacing grid
electricity. This approach is not applicable to historical data and, thus, requires annual monitoring of
EFgrid,OM-DD,y.
As per the methodological tool, the dispatch emission factor is calculated as follows:
(10)
Where:
EFgrid,OM-DD,y Dispatch data analysis operating margin CO2 emission factor in year y (tCO2/MWh)
EGPJ,h Electricity displaced by the project activity in hour h of year y (MWh)

UNFCCC/CCNUCC
CDM – Executive Board Page 20
EFEL,DD,h CO2 emission factor for power units in the top of the dispatch order in hour h in year
y (tCO2/MWh)
EGPJ,y Total electricity displaced by the project activity in year y (MWh)
h Hours in year y in which the project activity is displacing grid electricity
y Year in which the project activity is displacing grid electricity
The hourly emission factor is calculated as follows:
(12)
Where:
EFEL,DD,h CO2 emission factor for grid power units in the top of the dispatch order in hour h in
year y (tCO2/MWh)
EGn,h Net quantity of electricity generated and delivered to the grid by grid power unit n
in hour h (MWh)
EFEL,n,y CO2 emission factor of grid power unit n in year y (tCO2/MWh)
N Grid power units in the top of the dispatch (as defined below)
h Hours in year y in which the project activity is displacing grid electricity
y Year in which the project activity is displacing grid electricity
By using the dispatch data available from Kenya Power and Lighting Company (the power utility
company), the dispatch data analysis OM emission factor (EFgrid,OM-DD,y) of the Kenyan grid system is
calculated to be 0.633 tCO2/MWh (See ER calculation spreadsheet)
Step 5: Calculate the build margin (BM) emission factor
In terms of vintage of data, the Build Margin is calculated as per Option 1, where the first crediting
period, the build margin emission factor is calculated ex ante based on the most recent information
available on units already built for sample group m at the time of CDM-PDD submission to the DOE for
validation.
The sample group of power units m used to calculate the build margin was determined as per the
following procedure, consistent with option 1 of data vintage selected above:
a) Identify the set of five power units, excluding power units registered as CDM project activities, that
started to supply electricity to the grid most recently (SET5-units) and determine their annual electricity
generation (AEGSET-5-units, in MWh);
b) Determine the annual electricity generation of the project electricity system, excluding power units
registered as CDM project activities (AEGtotal, in MWh). Identify the set of power units, excluding
power units registered as CDM project activities, that started to supply electricity to the grid most
recently and that comprise 20% of AEGtotal (if 20% falls on part of the generation of a unit, the
generation of that unit is fully included in the calculation) (SET≥20%) and determine their annual
electricity generation (AEGSET-≥20%, in MWh);
c) From SET5-units and SET≥20% select the set of power units that comprises the larger annual electricity
generation (SETsample); Identify the date when the power units in SETsample started to supply electricity
to the grid. If none of the power units in SETsample started to supply electricity to the grid more than 10
years ago, then use SETsample to calculate the build margin. In this case ignore steps (d), (e) and (f).
UNFCCC/CCNUCC
CDM – Executive Board Page 21
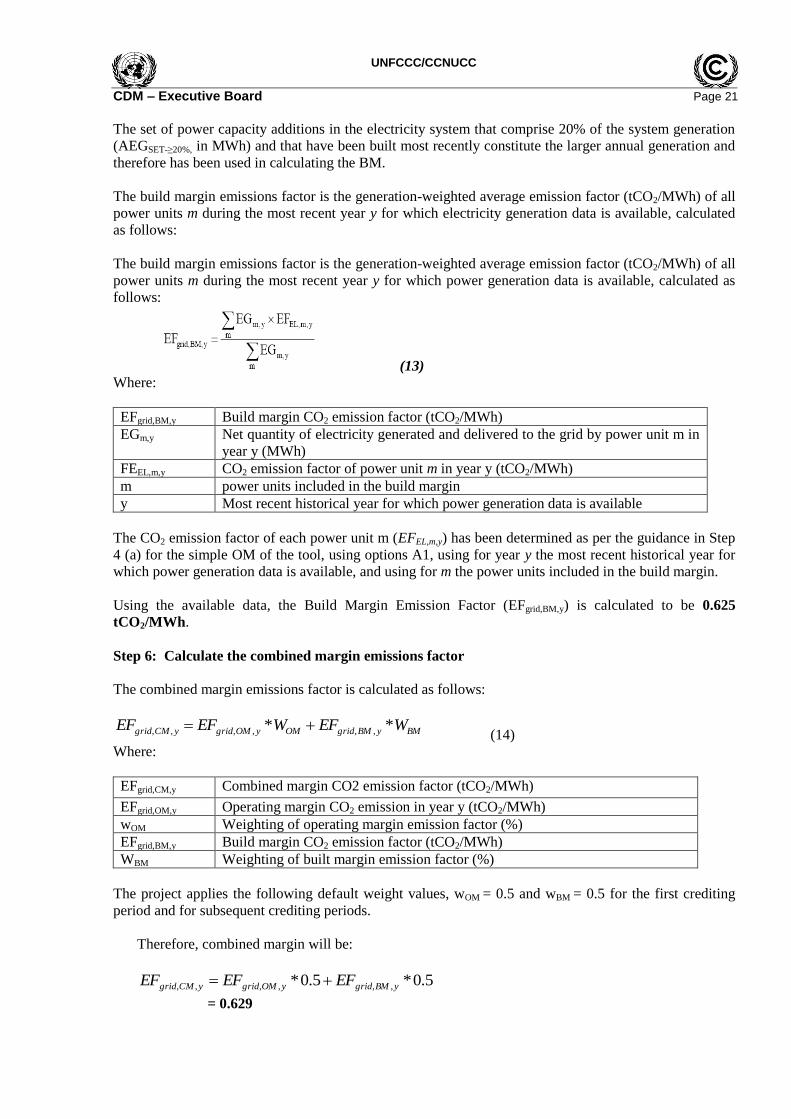
The set of power capacity additions in the electricity system that comprise 20% of the system generation
(AEGSET-≥20%, in MWh) and that have been built most recently constitute the larger annual generation and
therefore has been used in calculating the BM.
The build margin emissions factor is the generation-weighted average emission factor (tCO2/MWh) of all
power units m during the most recent year y for which electricity generation data is available, calculated
as follows:
The build margin emissions factor is the generation-weighted average emission factor (tCO2/MWh) of all
power units m during the most recent year y for which power generation data is available, calculated as
follows:
(13) Where:
EFgrid,BM,y Build margin CO2 emission factor (tCO2/MWh)
EGm,y Net quantity of electricity generated and delivered to the grid by power unit m in
year y (MWh)
FEEL,m,y CO2 emission factor of power unit m in year y (tCO2/MWh)
m power units included in the build margin
y Most recent historical year for which power generation data is available
The CO2 emission factor of each power unit m (EFEL,m,y) has been determined as per the guidance in Step
4 (a) for the simple OM of the tool, using options A1, using for year y the most recent historical year for
which power generation data is available, and using for m the power units included in the build margin.
Using the available data, the Build Margin Emission Factor (EFgrid,BM,y) is calculated to be 0.625
tCO2/MWh.
Step 6: Calculate the combined margin emissions factor
The combined margin emissions factor is calculated as follows:
BMyBMgridOMyOMgridyCMgrid WEFWEFEF ** ,,,,,, (14)
Where:
EFgrid,CM,y Combined margin CO2 emission factor (tCO2/MWh)
EFgrid,OM,y Operating margin CO2 emission in year y (tCO2/MWh)
wOM Weighting of operating margin emission factor (%)
EFgrid,BM,y Build margin CO2 emission factor (tCO2/MWh)
WBM Weighting of built margin emission factor (%)
The project applies the following default weight values, wOM = 0.5 and wBM = 0.5 for the first crediting
period and for subsequent crediting periods.
Therefore, combined margin will be:
5.0*5.0* ,,,,,, yBMgridyOMgridyCMgrid EFEFEF
= 0.629

UNFCCC/CCNUCC
CDM – Executive Board Page 22
Leakage
No leakage emissions are considered.
Emission reductions
Emission reductions are calculated as follows:
Where:
ERy = Emission reductions in year y (t CO2e)
BEy = Baseline emissions in year y (t CO2)
PEy = Project emissions in year y (t CO2e)
B.6.2. Data and parameters fixed ex ante
>>
Data / Parameter GWPCH4
Unit tCO2/tCH4
Description Global warming potential of methane valid for the relevant commitment
period.
Source of data IPCC
Value(s) applied 21
Choice of data
or
Measurement methods
and procedures
Default value for the first commitment period
Purpose of data Calculation of project emissions
Additional comment -
B.6.3. Ex ante calculation of emission reductions
>>
Project Emissions
Fossil fuel combustion (PEFF,y)
Although combustion of fossil fuel is a potential source, facility such as emergency diesel to combust
fossil fuel will not be installed in the project activity, therefore the emission is considered Zero (0)
PEFF,y = 0.
Emissions of non-condensable gases from the operation of geothermal power plants (PEGP,y)
PEGP,y is calculated as follows:
Calculation of fugitive emissions from non-condensable gases (NCG):
The NCG composition of the wells on-site was studied by the Kenya Electricity Generating Company Ltd
(KenGen) during the normal monitoring. The latest monitoring results are from 26 production wells
which will supply steam to Olkaria I Units 4&5 power station.

UNFCCC/CCNUCC
CDM – Executive Board Page 23
The analysis determined the percentage of NCG’s in the produced steam and the composition of those
NCGs. The average readings of the wells is used to estimate project emissions, but monitored data of the
steam coming from all producing wells will be used ex-post. From the results from the analysis is
detailed below:
Fraction of NCG's in the produced steam 0.008820
Average CO2 (%) in NGC 89.28%
Average CH4 (%) in NCG 0.07209%
Wsteam, CO2 0.7875%
Wsteam, CH4 0.0006359%
PEGP,y = (0.7875%+ (0.0006359%* 21)) * 9,320,640.00 tons/yr = 74,644 tCO2e per year
= 0 +74,644 + 0
= 74,644 tCO2e
Baseline emissions
The baseline emissions are to be calculated as follows:
= 1,128,288 MWh/yr * 0.629 tCO2/MWh
= 709,693 tCO2e
Since the project is a Greenfield renewable energy power plant, the project electricity quantity is as
below:
=1,128,288 MWh
Leakage
No leakage emissions are considered zero (0).
Emission reductions
= 709,693 - 74,644 – 0
= 635, 049 tCO2e

UNFCCC/CCNUCC
CDM – Executive Board Page 24
B.6.4. Summary of ex ante estimates of emission reductions
Year Baseline emissions
(t CO2e)
Project emissions
(t CO2e)
Leakage
(t CO2e)
Emission reductions
(t CO2e)
01/07/2014 –
31/12/2014 354,847 37,322 0.00 317,525
2015 709,693 74,644 0.00 635,049
2016 709,693 74,644 0.00 635,049
2017 709,693 74,644 0.00 635,049
2018 709,693 74,644 0.00 635,049
2019 709,693 74,644 0.00 635,049
2020 709,693 74,644 0.00 635,049
01/01/2021 –
30/06/2021 354,846 37,322 0.00 317,524
Total 4,967,851 522,508 0.00 4,445,343
Total number of
crediting years
7
Annual
average over the
crediting period
709,693 74,644 0.00 635,049
* Crediting period start in July 2014 and ends in June 2021.
B.7. Monitoring plan
B.7.1. Data and parameters to be monitored
Data / Parameter EGfacility,y
Unit MWh
Description Quantity of net electricity generation supplied by the project plant/unit to
the grid in year y
Source of data Electricity meters
Value(s) applied 1,128,288
Measurement methods
and procedures
The following parameters shall be measured:
(i) The quantity of electricity supplied by the project plant to the grid; and
(ii) The quantity of electricity delivered to the project plant from the grid
Monitoring frequency Continuous measurement and at least monthly recording
QA/QC procedures Electricity supplied by the project activity to the grid will be double
checked by receipt of electricity sales.
Purpose of data Calculation of baseline emissions
Additional comment -

UNFCCC/CCNUCC
CDM – Executive Board Page 25
Data / Parameter EFgrid,CM,y
Unit tCO2e/MWh
Description Combined margin CO2 emission factor for grid connected power
generation in year y calculated using the latest version of the “Tool to
calculate the emission factor for an electricity system”
Source of data KPLC Dispatch Centre and IPCC default factors
Value(s) applied 0.629
Measurement methods
and procedures As per the .Tool to calculate the emission factor for an electricity system.
Monitoring frequency As per the .Tool to calculate the emission factor for an electricity system.
QA/QC procedures As per the .Tool to calculate the emission factor for an electricity system.
Purpose of data Calculation of baseline emissions
Additional comment -
Data / Parameter wsteam,CO2,y
Unit tCO2/t seam
Description Average mass fraction of carbon dioxide in the produced steam in year y
Source of data Project site activity. Measured by KenGen
Value(s) applied 0.00787494
Measurement methods
and procedures
Non-condensable gases sampling is carried out in production wells and at
the steam field-power plant interface using ASTM Standard Practice E1675
for Sampling 2-Phase Geothermal Fluid for Purposes of Chemical Analysis
(as applicable to sampling single phase steam only). The CO2 and CH4
sampling and analysis procedure consists of collecting non-condensable
gases samples from the main steam line with glass flasks, filled with
sodium hydroxide solution and additional chemicals to prevent oxidation.
Hydrogen sulphide (H2S) and carbon dioxide (CO2) dissolve in the solvent
while the residual compounds remain in their gaseous phase. The gas
portion is then analysed using gas chromatography to determine the content
of the residuals including
CH4. All alkanes concentrations are reported in terms of methane.
Monitoring frequency The NCG sampling and analysis should be performed every 3
months(quarterly)
QA/QC procedures Sampling will be performed to correct specifications and re-sampled,
should a sample be abnormal.
Purpose of data Calculation of project emissions
Additional comment -

UNFCCC/CCNUCC
CDM – Executive Board Page 26
Data / Parameter Wsteam,CH4,y
Unit tCH4/t steam
Description Average mass fraction of methane in the produced steam in year y
Source of data Project site activity. Measured by KenGen
Value(s) applied 0.000006359
Measurement methods
and procedures
Non-condensable gases sampling is carried out in production wells and at
the steam field-power plant interface using ASTM Standard Practice E1675
for Sampling 2-Phase Geothermal Fluid for Purposes of Chemical Analysis
(as applicable to sampling single phase steam only). The CO2 and CH4
sampling and analysis procedure consists of collecting non-condensable
gases samples from the main steam line with glass flasks, filled with
sodium hydroxide solution and additional chemicals to prevent oxidation.
Hydrogen sulphide (H2S) and carbon dioxide (CO2) dissolve in the solvent
while the residual compounds remain in their gaseous phase. The gas
portion is then analysed using gas chromatography to determine the content
of the residuals including
CH4. All alkanes concentrations are reported in terms of methane.
Monitoring frequency The NCG sampling and analysis should be performed every 3
months(quarterly)
QA/QC procedures Sampling will be performed to correct specifications and re-sampled,
should a sample be abnormal.
Purpose of data Calculation of project emissions
Additional comment -
Data / Parameter MSteam,y
Unit t steam
Description Quantity of steam produced in year y
Source of data Project site activity. KenGen
Value(s) applied 9,320,640
Measurement methods
and procedures
The steam quantity discharged from the geothermal wells is measured with
a venture flow meter (or other equipment with at least the same accuracy).
Measurement of temperature and pressure upstream of the venture meter is
required to define the steam properties. The calculation of steam quantities
is done on a continuous basis and is based on international standards. The
measurement results are summarized transparently in regular production
reports
Monitoring frequency Daily
QA/QC procedures Data is read continuously and logged. Data will be entered into CDM
monitoring workbook every day and will be checked for consistency when
entered. Meters will be maintained and periodically verified according to
manufacturer specifications to ensure accurate readings; they will be
recalibrated within the schedule recommended by the manufacturer.
Purpose of data Calculation of baseline and project emissions
Additional comment -
B.7.2. Sampling plan
>>
All data is monitored and there is no sampling plan to be undertaken.

UNFCCC/CCNUCC
CDM – Executive Board Page 27
B.7.3. Other elements of monitoring plan
>>
The monitoring of the parameters will form part of the overall production monitoring at the geothermal
facility. The responsibility of calculation of the emission reduction will be the responsibility CDM
Manager. Review of the calculations will be the responsibility of the plant manager. Data will be stored
electronically onsite, with archiving at KenGen. All data collected as part of monitoring will be archived
electronically and be kept at least for 2 years after the end of the last crediting period. All measurements
will be conducted with calibrated measurement equipment according to relevant industry standards.
The monitoring by the project will involve monitoring the following the following parameters:
1. Electricity generated and exported into the grid by the project.
2. Steam generation and use by the project
3. Sampling and analysis of steam parameters (i.e. Non-condensable gases (NCGs))
4. Grid Emission Factor
1. Electricity
Net electricity export to the national grid by the project activity will be metered by the project proponent
and Kenya Power and Lighting Company (KPLC). Two meters will be installed to record the net export,
i.e. main meter and check meter. Monthly readings will be performed jointly at end of each month where
the readings from both meters will be taken and compared for consistency. The main meter readings will
then be used as the net export and will be used for records and invoicing. The meters will be calibrated as
per the industry standards and by each respective owner.
Electricity meters to be installed will meet the relevant local standards at the time of installation and will
undergo calibration as per the relevant requirement and also as outlined in the Power Purchase Agreement
signed between the two companies. Electricity measurements will be taken in accordance with signed
between KenGen and KPLC.
2. Steam generation
Steam meters will be installed to continuously measure the quantity of steam produced during the year in
the production wells. The meters will have the integration and their readings will be relayed and be
displayed in the SCADA. Daily log will be kept electronically. At the end of each month, the records will
be retrieved by the CDM team leader and be arranged in right format for use.
3. Non-Condensable gases (NCGs)
As per the methodology requirement, the sampling and analysis of NCGs will be done quarterly. The
sampling will be done as per the set out requirement and the sampling team will be trained on how to take
the samples. The following gases will be analysed: Methane (CH4) and Carbon dioxide (CO2)
4. Grid Emission factor
The grid emission factors will be monitored and be calculated as per the latest tool to calculate the
emission factor of the electricity system.
5. Operational and Management structure
The diagram below provides an overview of the general management structure of project proponent as it
will directly affect the implementation of the proposed project.
Monitoring Structure

UNFCCC/CCNUCC
CDM – Executive Board Page 28
The project proponent will designate a staff (CDM Manager) who will be in charge of CDM. The CDM
Manager will be in charge of ensuring that all the monitoring is done as per the requirements of the
methodology and the PDD.
6. Monitoring Equipment Installation
Metering of Electricity Supplied to the Grid
Meter for reading electricity supplied to the grid will be located at interconnection point at the sub-station
on site. The Main meter will be owned by KenGen while the check meter will be owned by KPLC. Both
meters will be located at same point.
Metering of Geothermal Steam Flow
All steam wells will have a flow meter to measure the amount of steam generated by each well. The flow
meters will be linked to the SCADA system where they will be read in the control room. Periodic
recording will be done both in hard copy and soft copy.
Steam Sampling and Analysis
Quarterly steam sampling will be carried out where each well will be sampled. The sample will be
analysed at the Olkaria laboratory and lab analysis results will be submitted to the CDM manager for
review and archiving and use for calculation of CERs.
Geothermal Operations Manager
1. ERPAs
2. Record keeping
3. Coordinate External Audits
4. Implement Operational structure and QA procedures
5. Track and fulfil all environmental and social obligations
Managing Director
CDM Manager 6. Gas analysis records
7. Steam records
8. Power generation records
9. Electricity sales checking
10. EF calculation records
11. ER calculation records
12. Plant Operation
13. Maintenance
14. Measurement systems
15. Measurement obligations
Regulatory Affairs Director

UNFCCC/CCNUCC
CDM – Executive Board Page 29
Figure 3: Schematic diagram, of metering points
SECTION C. Duration and crediting period
C.1. Duration of project activity
C.1.1. Start date of project activity
>>
07th Nov 2011, the date when the EPC contract was awarded.
C.1.2. Expected operational lifetime of project activity
>>
25 years, 0 Months
C.2. Crediting period of project activity
C.2.1. Type of crediting period
>>
The project has chosen a renewable period
This is the first renewable period
C.2.2. Start date of crediting period
>>
01/07/2014 or the date of registration of the project with UNFCCC, whichever is later
C.2.3. Length of crediting period
7 Years and 0 Months
Steam Well
Re-injection Well
Steam Meter (MSteam,y)
Wsteam,CO2,y & Wsteam,CH4,y
Subtation
Grid
Turbine Generator
Electricity meter
(EGfacility,y)
Turbine Generator
Steam Meter (MSteam,y)
Wsteam,CO2,y & Wsteam,CH4,y
Grid Emission Factor
(EFgrid,CM,y)

UNFCCC/CCNUCC
CDM – Executive Board Page 30
SECTION D. Environmental impacts
D.1. Analysis of environmental impacts
>>
A full Environmental Social Impact Assessment (ESIA) study was carried out by the consultant Gibb
Africa Ltd. The report was prepared in 2010 in accordance with the Environmental (Impact Assessment
and Audit) Regulations of 2003. It is also guided by the World Bank’s requirements for industrial projects
and IFC’s EHS Guidelines for Geothermal Projects. Its findings were reported in Environmental and
Social Impact Assessment (ESIA) Report for Olkaria I Units 4&5 Geothermal Project in Naivasha
District. GIBB Africa Ltd, April 2010.
The study methodology comprised the following activities:
Preliminary meetings;
Data collection and Document review;
Site inspection and discussions with site personnel;
Air and Noise Dispersion Modelling;
Ecological Assessment;
Landscape Survey;
Social Impact Assessment; Community Resources Mapping;
Meeting with stakeholders;
Public Consultation;
Data Analysis;
Reporting.
D.2. Environmental impact assessment
>>
From the report, the identified impacts stem from release of Non-condensable gases, noise pollution and
waste water discharges. Release of Hydrogen Sulphide was considered and measurements from existing
power plant were used to predict the likely trend from the proposed project since they use the same
technology. The report pointed out that measurements form the existing plants shows H2O emissions way
below the WHO guidelines. However, since these concentrations are low, their effect will be reduced
further through air dispersion.
Noise pollution was also identified, although this is limited to during construction period, through well
drilling and testing. During operation, the level of noise is much lower. During operation, the impact will
be monitored and be mitigated through use of appropriate safety gears.
Waste water from steam will be re-injected and this will reduce surface water contamination. The re-
inject will reduce the acidification of surface water from brine. The power plant also uses fresh water
drawn from the Lake Naivasha. However, since the quantities used are low, the project will not have an
effect on the hydrology of the lake.
In addition, since the project developer is already operating other geothermal power plants, the company
has in place an environment and social management plan prepared to cover all the phases of the project
life: design, construction, operation and maintenance. The plan describes each of the main mitigation
measures to be implemented, their frequency, and who should be responsible during and after
construction. Environmental and social monitoring, as integral parts of the environmental management
plan, has also been included.
KenGen has also established Environmental Management systems as in integral component of its
business planning since the company was established. Through the certified EMS system, KenGen has

UNFCCC/CCNUCC
CDM – Executive Board Page 31
identified and documented its significant environmental aspects and impacts on the environment and set
in place interventions to manage these aspects.
To successfully sustain the good environmental practices, KenGen has set up a fully-fledged
Environmental and Social Department at Olkaria to undertake the implementation of environmental and
social management plans of the existing Olkaria I and Olkaria II Power Plants and carry out monitoring of
various parameters.
SECTION E. Local stakeholder consultation
E.1. Solicitation of comments from local stakeholders
>>
Consultative meetings at district and local levels included discussions with the provincial administration,
village elders, KenGen staff, specialists and key informants were done.
Consultative meetings at district and local levels included discussions with the provincial administration,
village elders, KenGen staff, specialists and key informants were done.
The consultations was done in plenary meeting where the stakeholders were given chance to air their
views and comments. The consultation was held on 8th
March 2012 at KenGen Social hall.
The consultations were invited through letters, word of mouth and through use of village elders who were
tasked with announcing to their people about the meetings.
E.2. Summary of comments received
>>
A good number (99%) of the respondents admitted that they were aware of the project and the activities
under the Project. The information had been disseminated through KenGen officials and through those
who were employed during the drilling of the exploration wells meant for the project within the area.
Other issues which were raised during consultations include:
i. The need for electricity supply in Olkaria Cultural Centre and Suswa Centre
ii. Locals to be given first priority in employment during construction and operation
iii. Measures be taken to ensure safety of the public from electrocution through exposure to the high
voltage lines
iv. The need for supply of electricity to a local Radio station at Maili Moja town in Narok District
v. Encourage KenGen and KPLC to be involved in corporate social responsibility activities
especially in Narok District.
E.3. Report on consideration of comments received
>>
KenGen has in place Environmental Management system which guides their operations in order to ensure
that the impacts of geothermal development are minimal. As part of the plan, relocation and sharing of
projects benefits is included. The comments received during the consultation focused more on sharing of
project benefits.
KenGen through their department of Corporate Social Responsibility will be helping the locals with funds
which they will use for projects the community will identify.
On employment, the project will consider offering jobs to the locals based on skills needed and
availability. In cases where the skills available matches those required, they will be considered.

UNFCCC/CCNUCC
CDM – Executive Board Page 32
SECTION F. Approval and authorization
>>
The project has received the Letter of Approval at the time the project was submitted to the DOE.
- - - - -

UNFCCC/CCNUCC
CDM – Executive Board Page 33
Appendix 1: Contact information of project participants
Organization name Kenya Electricity Generating Company Ltd (KenGen)
Street/P.O. Box Kolobot Road, P.O Box 47936-00100
Building Stima Plaza
City Nairobi
State/Region Nairobi
Postcode 20
Country Kenya
Telephone 254-20-3666000
Fax 254-20-3745250
E-mail [email protected]
Website http://www.kengen.co.ke
Contact person Simon Ngure
Title Regulatory Affairs Director
Salutation Mr.
Last name Ngure
Middle name
First name Simon
Department Regulatory Affairs
Mobile 254-727719936
Direct fax 254-20-3745250
Direct tel. 254-20-3666531
Personal e-mail

UNFCCC/CCNUCC
CDM – Executive Board Page 34
Appendix 2: Affirmation regarding public funding
There is Annex I public funding involved in the proposed project. The project does not make use of
Official Development Assistance (ODA). The project is debt financed by the World Bank, KfW
Bankengruppe and Japan International Cooperation Agency.

UNFCCC/CCNUCC
CDM – Executive Board Page 35
Appendix 3: Applicability of selected methodology
See section B. 2 above

UNFCCC/CCNUCC
CDM – Executive Board Page 36
Appendix 4: Further background information on ex ante calculation of emission reductions
The Kenyan electricity system consists of one national grid system which serves the entire country. All
the generating companies feed their power into the national grid. The grid is owned and operated by the
Kenya Power and Lighting Company (KPLC), the sole power distribution and retailing company.
However, not all parts of the country are served by this grid some parts of the country are served by
isolated fossil fuel generators owned by KPLC.
The Kenyan electricity system comprises of around 1,593MW of installed capacity, with an effective
capacity of 1,479MW.
As per the dispatch data obtained from KPLC and which has been applied in the calculation of emission
factor of the grid, KPLC in 2011 purchased 7,424,137 MWh of electricity into the national grid system.
The grid mix contained more renewable source than non-renewable generated electricity. The table below
shows the grid composition from power dispatched to the grid in 2011.
Grid Composition
Plants MWh %
Hydro 3,158,707 42.55%
Wind 18,910 0.25%
Biomass 79,002 1.06%
Thermal 2,691,739 36.26%
Geothermal 1,444,124 19.45%
Imports 31,655 0.43%
Totals 7,424,137 100.00%
The table below shows power plants which are connected to the Kenya grid in the year 2011.
Power Plant Electricity Purchased 2011 (MWh)
Wanji-Hydro 43,064
Tana-Hydro 77,535
Masinga-Hydro 155,008
Kamburu-Hydro 364,931
Gitaru-Hydro 722,403
Kindaruma-Hydro 146,083
Kiambere-Hydro 758,755
Imenti Tea (feed in plant) 664
Sagana-Hydro 8,081
Sosiani-Hydro 1,140
Gogo-Hydro 5,816
Sondu-Hydro 371,495
Turkwel-Hydro 503,734
Ngong Wind- Wind 18,910
Mumias-Biomass 79,002
Orpower4 Steam-Geo 366,702
Olkaria 1-Geo 232,906
Olkaria 2-Geo 844,516
Kipevu Diesel 1- Petrothermal 235,504
Kipevu III-Petrothermal 594,412

UNFCCC/CCNUCC
CDM – Executive Board Page 37
Tsavo-Petrothermal 387,874
Rabai-Petrothermal 387,529
IberAfrica 1-Petrothermal 381,904
IberAfrica 2-Petrothermal 383,888
Aggreko 4-Petrothermal 165,343
Aggreko embakasi5-Petrothermal 81,625
Aggreko embakasi6-Petrothermal 27,493
Aggreko embakasi7-Petrothermal 29,057
Aggreko muhoroni-Petrothermal 17,108
UETCL-Import 31,655
Total 7,424,137

UNFCCC/CCNUCC
CDM – Executive Board Page 38
Appendix 5: Further background information on monitoring plan
Monitoring will be undertaken as per steps outlined in Section B.7.2. above. The monitoring will be done
as follows:
Total net electricity generation exported to the grid by the project activity will be metered by
KenGen and KPLC, and readings of meters will be done jointly. The Readings will be cross-
checked with receipts of sales invoices for consistency.
Sales invoices and meter readings will be cross checked to ensure data integrity and consistency;
Sampling of non-condensable gases will be undertaken by KenGen at least every 3 months
(quarterly). The samples will be taken to the laboratory for analysis of average mass fraction of
carbon dioxide and methane in the produced steam.
Quantity of steam produced during the year in the production wells will be measured daily using
a venturi flow meter/integrating meter. Measurements will be recorded regularly in production
reports and also can be generated electronically.
CDM Monitoring System Procedures
Procedure name Description Scope
Procedures identified for
training of monitoring
personnel
This procedure outlines the steps
to ensure that staff will acquire
adequate training to collect and
archive complete and accurate
data necessary for CDM
monitoring.
KenGen is ISO 9001 certified for all
their plants in Kenya. Procedures for
training have been incorporated as part
of ISO 9001.
CDM data and record
keeping arrangements
This procedure provides details of
the site data and record keeping
arrangements. The arrangements
ensure that complete and accurate
records are retained within the
quality control system.
All data and records should be managed
following this procedure. The staff is
responsible for ensuring that any data or
records are dealt with according to this
procedure. Data and records will be
stored and archived according to this
procedure.
Data collection This procedure describes how to
collect data for all of the
monitored variables in the PDD.
This procedure will outline the steps to
collect the data from the electricity
meter, steam flow meters, and sample
steam for NCG analysis.
CDM data quality
control and quality
assurance
This procedure covers all
measured and/or calculated
variables.
Data and records will be checked prior
to being stored and archived. Data from
the project will be checked to identify
possible errors or omissions. All records
will be checked for completeness.
Equipment maintenance This procedure outlines the steps
to provide regular maintenance to
the electricity meters and steam
flows meters.
This procedure should be followed
by all staff involved in checking and
maintaining the on site meters
Equipment calibration This procedure details the process
of organising and managing the
calibration of measuring and
monitoring equipment.
The calibration of the electricity
meters will be conducted by a
suitable company according to the
AMM standards. The relevant
Scientist/Engineer in charge is
responsible for organising the

UNFCCC/CCNUCC
CDM – Executive Board Page 39
calibration and ensuring that records are
retained.
Internal audits of GHG
project compliance with
operational requirements
This procedure details the internal
audits for compliance with
operational requirements.
An internal quality audit team is
available within KenGen and this will
be tasked to include the audit of the
GHG project compliance. KenGen has
ISO 9001 certification and will be
extending this to include the proposed
project.
Project performance
reviews before data is
submitted for verification,
internally or externally
This procedure is for project
performance reviews before data
is submitted for verification,
internally or externally.
The KenGen internal quality audit team
will be tasked with the review of data
before submission for verification.
Corrective action to
provide for more accurate
future monitoring and
reporting
This procedure details the
corrective action in order to
provide for more accurate future
monitoring and reporting.
Any requirement for more accurate
reporting will be identified by the
quality audit team and will be discussed
and resolved by the entire management
team.
Corrective Actions Details how corrective actions of
errors will be taken care of, if
necessary.
Any corrections in the source data are
marked, and the type of correction is
documented in the spreadsheet. The
original source data are stored next to
the corrected data.

UNFCCC/CCNUCC
CDM – Executive Board Page 40
Appendix 6: Summary of post registration changes
Not Applicable