Project construction cost estimates and fund sources
78
Project construction cost estimates and fund sources 16
Transcript of Project construction cost estimates and fund sources

Project construction cost estimates and fund sources
16

1 Funding Sources for the CRC
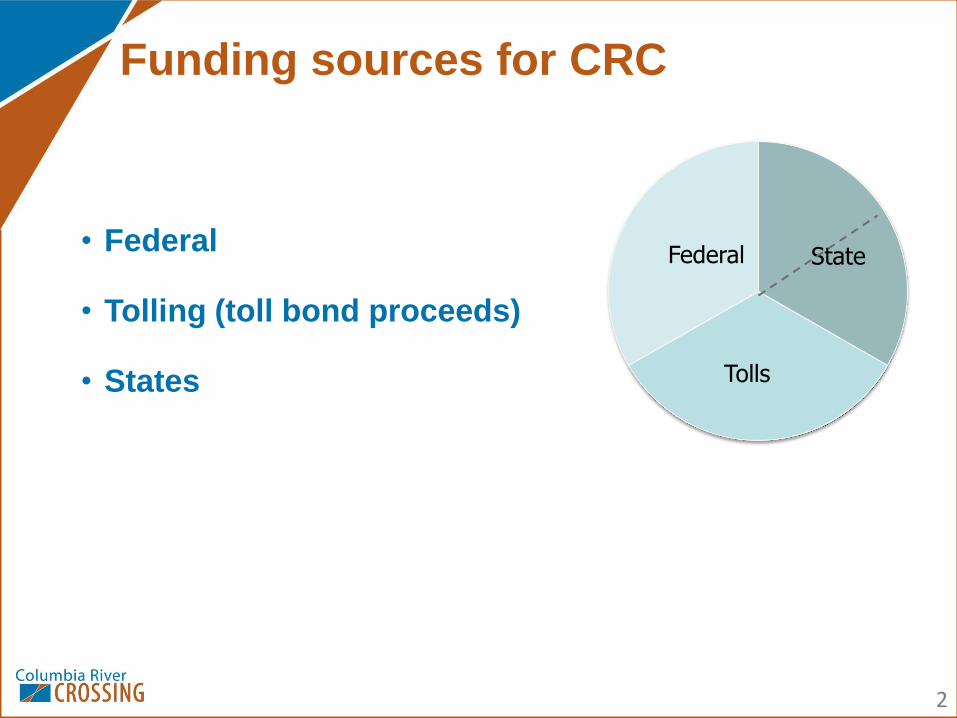
• Federal
• Tolling (toll bond proceeds)
• States
Funding sources for CRC
State Federal
Tolls
2

FTA New Starts funds ($850 million)
Process: New Starts application started, with high ranking.
Apply to enter final design fall 2012; enter final design late
2012. Submit Full Funding Grant Agreement application fall
2013.
Uses: Light rail route, stations, park and rides, ped/bike
access
Availability: 2014 or later – must have all funds (state,
tolling) secured
FHWA funds ($400 million)
Process: Monitor programs and criteria
Uses: Bridge, highway, interchanges
Availability: 2013 or later
•
Federal funds
Federal
3
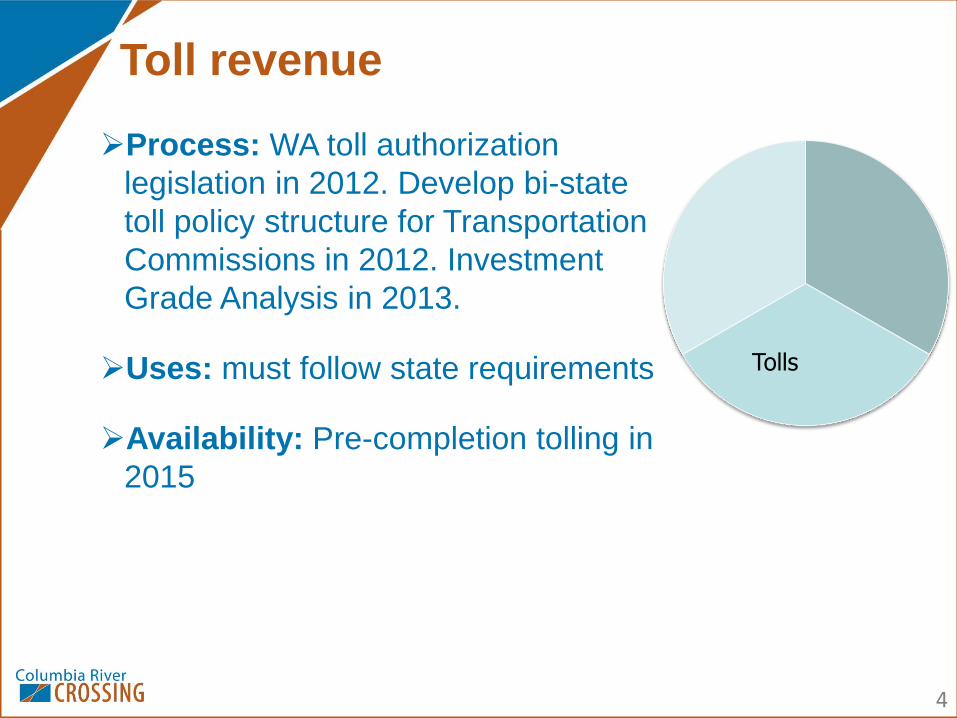
Process: WA toll authorization
legislation in 2012. Develop bi-state
toll policy structure for Transportation
Commissions in 2012. Investment
Grade Analysis in 2013.
Uses: must follow state requirements
Availability: Pre-completion tolling in
2015
Toll revenue
Tolls
4
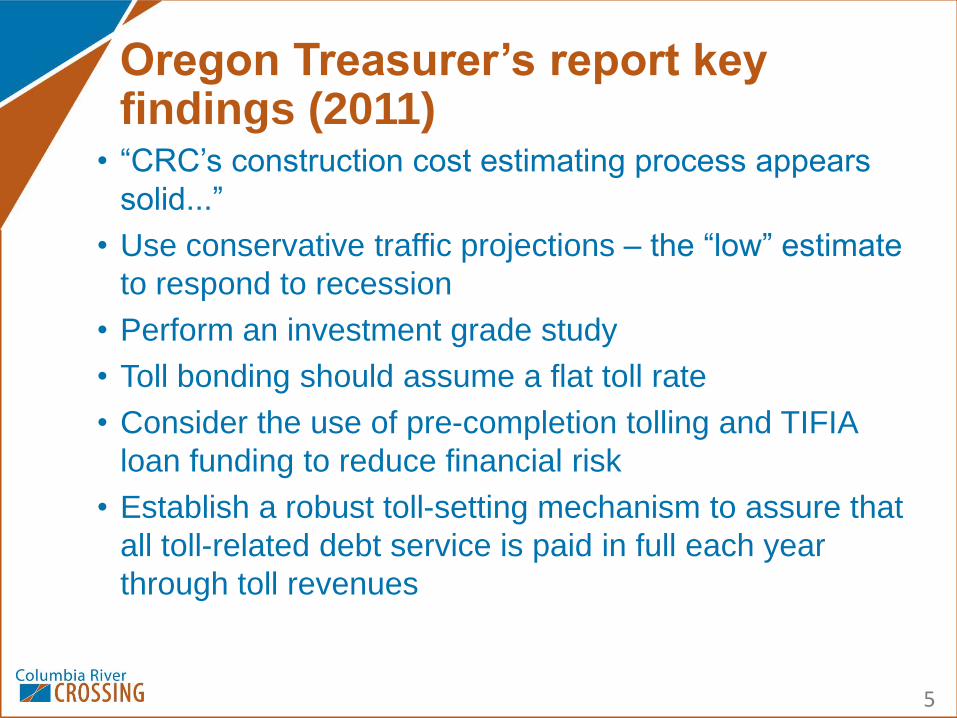
• “CRC’s construction cost estimating process appears
solid...”
• Use conservative traffic projections – the “low” estimate
to respond to recession
• Perform an investment grade study
• Toll bonding should assume a flat toll rate
• Consider the use of pre-completion tolling and TIFIA
loan funding to reduce financial risk
• Establish a robust toll-setting mechanism to assure that
all toll-related debt service is paid in full each year
through toll revenues
Oregon Treasurer’s report key findings (2011)
5

Tolling responsibilities
• Washington and Oregon Transportation
Commissions have tolling authority in their
respective state
• Both departments are responsible for the
planning, analysis and construction of all toll
bridges and other toll facilities
6

Washington state funds
State
7
Process: Requires existing or
new revenue and legislative
action
Uses: Washington highway,
interchanges, local
improvements, bike/pedestrian
Availability: Committed by 2013
to meet FTA eligibility

Oregon state funds
State
8
Process: 2012 Legislative
Oversight Committee, Interim
Transportation Committees, and
legislators review project.
Uses: Oregon highway,
interchanges, local improvements,
bike/pedestrian. Constitution
specifies that highway funds must
be used for highway purposes
Availability: Legislature needs to
act in early 2013 to meet FTA
eligibility

2012 2013 2014 20151 2 3 4 1 2 3 4 1 2 3 4 1 2 3 4
1 TIFIA: Letter of Interest2 WA: Toll authority legislation3 FTA: Final design application 1
4 FTA: Final design approval5 Investment Grade Analysis (required for tolls/TIFIA $)6 OR: State funds committed7 WA: State funds committed8 Local light rail operations and maintenance funding committed9 FTA: Full funding grant agreement application 2
10 OR: State funds available11 WA: State funds available12 TIFIA: Submit application13 Construction begins - CRB Design-Build14 FHWA: Discretionary Funds (Surface Transportation Vote)15 Tolls: WA set toll rates16 Tolls: OR set toll rates17 FTA: Funds available18 TIFIA: Loan funds available 3
19 Tolls: pre-completion tolling funds available
DRAFT: 06/12/12
1 Must have 50% non-FTA funds committed or budgeted. Tolling authority in 2012 expected to meet this requirement.2 Must have all funds authorized.3 TIFIA is typically the last funding source. Must have full finance plan and FTA approved.
Estimated funding sourcesFederal Transit ..................................... $850 M Federal Highway .................................... $400 MTolls* ................................................... $900 M - $ 1.3 B OR/WA state funds ($450/each) ............. $900 M* TIFIA is a federal loan and credit program. Tolls are the revenue source for the loan. The federal backed loan program reduces coverage rate for tolls.
1
2
$
$
?
$$3
$
= Due Date BLUE = TIFIA BLACK = Tolling ORANGE = FTA and State Funding
KEY
$
Funding Schedule (subject to change)

Page 1 of 2
Columbia River Crossing Quarterly Report Ending March 2012
Provided in accordance with ESHB 2190, Section 305(17)
Project Description
The Columbia River Crossing project will help address significant safety and congestion problems along Interstate 5 between Vancouver and Portland, a critical freight corridor between Canada and Mexico. A replacement bridge with light rail was chosen as the locally preferred alternative in 2008 because it best addresses the challenges identified through the federal environmental review process: Heavy congestion, a high volume of collisions, problems moving freight, lack of a reliable transit option and seismic risk. The project will reduce congestion on I-5 and adjacent neighborhoods, reduce collisions by 70 percent, and provide a more reliable trip for interstate and international commerce that crosses the Interstate Bridge each year. In 2005, truck freight with an estimated value of $40 billion was calculated to cross the Interstate Bridge.
(i) Update on preliminary engineering and right-of-way activities this quarter:
The Columbia River Crossing project received the federal Record of Decision Dec. 7, 2011. This quarter, (January-March 2012) activities transitioned from the planning phase to the pre-construction phase, where work focused on permitting, construction planning and financial planning. Specific accomplishments included:
Completed Washington State Environmental Policy Act process with closure of appeal period for Notice of Action Taken.
Developed process with U.S. Coast Guard and U.S. Army Corps of Engineers related to permit application for General Bridge Permit.
Began work on drilled shaft/driven pile pre-construction test project to increase knowledge about soil strength and stability for bridge foundations.
Completed subsurface utility engineering phase one field work.
Developed list of potential construction contract packages.
Completed project utility relocation schedule.
Submitted Real Estate Acquisition Management Plan to Federal Transit Administration, as required for federal transit funding application.
Supported meetings of Oregon Legislative Oversight Committee on CRC.
Received tolling authorization from Washington Legislature for replacement bridge facility.
(ii) Planned objectives for preliminary engineering and right-of-way next quarter:
Activities for the next quarter (April – June, 2012) will continue to center on pre-construction activities, with the primary focus on financial planning and those activities necessary to remain competitive for the federal New Starts transit funding administered by the FTA. Planned activities include:
Continue river user data collection and begin impact analysis related to General Bridge Permit.
Continue drilled shaft/driven pile test project. Project completion expected in July 2012.
Complete 30 percent (preliminary engineering) transit design.
Identify conflicts and potential resolution options related to sub-surface utilities.
Conduct Cost Estimate Validation Process workshop.
Support FTA risk assessment workshop.
Develop and provide information to Oregon Legislative Oversight Committee on CRC.
Support initial meeting and project tour of the Washington Legislative Oversight Committee on CRC.

Page 2 of 2
(iii) Total appropriation by State:
Washington Oregon
2011-13 Total 2011-13 Total
State 8,253,000 48,988,000 State 2,537,571 11,732,148
Federal1 54,195,304 75,884,000 Federal1 27,850,834 87,397,847
Total 62,448,304 124,872,000 Total 30,388,405 99,129,995 1 $7.5 million of the Corridor of the Future funding is shown in Oregon's federal appropriation amount, which causes
Washington’s federal appropriation in 2011-13 to differ from 12LEGFIN.
(iv) Project expenditures through March, 2012:
Washington Oregon
Shared Expenditures
Preliminary Engineering 68,864,600 69,624,927
Construction
Shared Expenditures Sub-total1 68,864,600 76,301,655
Non-Shared Expenditures
Right of Way 0 0
Non-Shared Expenditures Sub-Total 0 0
TOTAL 68,864,600 76,301,655 1
Includes $6,676,728 in expenditures paid directly by ODOT that are not processed through WSDOT’s accounting system
(v) Funds committed by the state of Oregon to right-of-way acquisition:
Oregon has not committed funds to acquire right-of-way.

1
360/737-2726 503/256-2726 WWW.COLUMBIARIVERCROSSING.ORG 700 WASHINGTON STREET, SUITE 300, VANCOUVER, WA 98660
Memorandum
May 17, 2012
TO: Matt Garrett, Director, Oregon Department of Transportation
FROM: CRC Staff
SUBJECT: Review of public testimony presented at the March 2012 CRC Interim Joint Legislative Oversight Committee
As you have requested, we have reviewed written and verbal testimony presented to the CRC Interim Joint Legislative Oversight Committee in March 2012. The project will be responding to key issues, including project alternatives and financing plans, at the May 21 Oversight Committee meeting. Additionally, we have identified three topic areas: cost of the project, traffic and toll revenues, and peer review, where public and written statements warrant correction or an alternative interpretation. The project has prepared several finance plan scenarios reflecting a range of traffic and revenue forecasts, financing assumptions, and variations in project scope. Our response is based on the data underlying the financial plan scenarios reported in the Final Environmental Impact Statement (EIS). Our review is without access to the calculations used to generate the public comments. This response relies on the “low” estimate of traffic and toll revenue; the estimate used in preparing the finance plan scenarios in the Final EIS, and is the most appropriate basis for responding to the public comments.
Cost of Project: An estimate of the total project cost presented in testimony is based on an incorrect project scope, incorrect toll rate estimate, and a faulty methodology that significantly overstates the real cost. 1. Use of “nominal dollars” in the testimony, instead of “real” or “constant” dollars to value a 36-year stream of costs is methodology that distorts the real cost of the project. The time value of money is the central concept in finance theory. This method values a multi-year stream of payments by converting the annual payments into real (or constant) dollars and then adds those real dollars together to determine the value of the payment stream. The analysis presented does not follow this universally accepted approach. Instead, it estimates the value of a multi-year stream of costs by summing nominal costs through the year 2048 without regard to the fact that a dollar in future years, such as in 2048, is not worth a dollar today (the costs from this analysis are in what are called “nominal dollars” because they are a dollar in name only, not in value). 2. The calculation of bond interest payments over the next 30 years in the testimony overstates the total of interest payments over the next 30 years by about $1.4 billion in nominal dollars and by about $1.85 billion in 2011 dollars over the next 36 years. While the calculations are not made available, an explanation of the differences could be:
• Instead of summing interest, as stated in the testimony, it appears the total includes principal plus interest but is incorrectly labeled as interest.
• References to “the next 30 years,” appear actually to total the payments to the year 2048, or the next 36 years.
• By adding the amount incorrectly referred to as interest payments, which actually consists of interest and principal, to the project’s principal cost there is a double-counting of the principal cost in the total project cost.

REVIEW OF PUBLIC TESTIMONY PRESENTED AT THE MARCH 2012 CRC INTERIM JOINT LEGISLATIVE OVERSIGHT COMMITTEE
2
• If the 36-year interest payment stream is converted to 2011 dollars, assuming a 2.5% per year average inflation, that stream of revenue totals about $0.85 billion, about 69% less than the estimate contained in public testimony.
3. The calculation of toll collection costs in the testimony overstates the 36-year total of toll collection costs by about $450 million in nominal dollars and almost $1.1 billion in 2011 dollars.
• The end result contained in the testimony was $1.7 billion in nominal dollars; the actual nominal dollar total of toll collection costs for the Scenario A toll rate schedule, low estimate, is about $1.1 billion, not the $1.7 billion presented in testimony.
• If the 36-year stream of toll collection cost is converted to 2011 dollars, assuming a 2.5% per year average inflation, that stream of revenue totals about $0.62 billion, about 64% less than estimates presented.
4. Calculations of credit card, sales tax and bond issuance costs described in the testimony overstate the 36-year total of these costs by over $100 million in nominal dollars and about $175 million in 2011 dollars. While calculations supporting the testimony were not made available, the testimony appears to indicate the following errors:
• The sales tax cost of the project (paid on the Washington portion of the project only) is included in the capital cost of the project – so including it again on top of the reported project cost results in double-counting these costs.
• The total of bond issuance costs, including capitalized interest and reserves, is about $24 million (the vast majority of which is capitalized interest). The total of credit card fees is $144 million in nominal dollars. Those costs total $168 million compared to the $275 million presented in testimony.
• If the 36-year stream of toll collection cost is converted to 2011 dollars, assuming a 2.5% per year average inflation, that stream of revenue totals about $80 million. When summed with the issuance costs, the total is about 62% less than the estimate presented in testimony.
Correcting for these inaccuracies highlights that costs in the testimony are overstated by almost 50% in nominal dollars and almost 100% in 2011 dollars.
Amount that Testimony Overstates Cumulative 36-Year Development and Operating Costs (in Billions of Dollars)
Testimony Corrected
Dollar Estimate Nominal $ Nominal $ 2011$ Nominal $ 2011$ Project Scope LPA LPA w/
Phasing LPA w/ Phasing
LPA w/ Phasing
LPA w/ Phasing
Cost Estimate (Confidence level from CEVP) 90% 60% 60% 90% 90%
Capital Cost $3.76 $3.16 $2.65 $3.50 $2.94
Cumulative Interest Payments $2.70 $1.24 $0.85 $1.24 $0.85
Cumulative Toll Collection Cost $1.70 $1.13 $0.62 $1.13 $0.62
Cumulative Credit Card, Sales Tax, Bond Issuance Cost $0.28 $0.17 $0.10 $0.17 $0.10
Cumulative Incremental Transit Operating Cost $0.18 $0.18 $0.18 $0.18 $0.18
36-Year Cumulative All-In Cost $8.61 $5.87 $4.40 $6.21 $4.68
Overstatement of Total
$2.74 $4.21 $2.40 $3.93
Percentage Overstatement
47% 96% 39% 84%

REVIEW OF PUBLIC TESTIMONY PRESENTED AT THE MARCH 2012 CRC INTERIM JOINT LEGISLATIVE OVERSIGHT COMMITTEE
3
5. Even as corrected on the previous page, the true 36-year cumulative cost of building and operating the CRC project is overstated.
• The interest costs used for the financing estimates are based on very conservative interest rates that substantially increase the estimated interest payments. For example, the assumed interest rate for the TIFIA loan is 60 percent (220 basis points) higher than the today’s actual rate (as of April 5, 2012).
• The taxes paid to Oregon and Washington are not netted out of the cost. • The substantial costs that would have to be paid if CRC is not built and are avoided for the
foreseeable future with CRC, such as rehabilitating the structure, deck replacement, lift replacement, painting, etc., are not netted out in the testimony calculations.
• The estimate of the 30-year total of transit operations cost in the testimony appears to be based on comparing those costs to today’s costs – they do not account for the fact that without the light rail improvements in the CRC project, bus operations costs would grow over time as population and ridership grow. The Final EIS shows that the difference in transit operations costs in the year 2030 between the light rail and No Build scenarios is only about $400,000 in 2010 dollars.
Traffic and Toll Revenues The testimony stated that the CRC funding plan is inaccurately “predicated on the assumption that traffic on I-5 crossing the Columbia River will grow from 127,000 vehicles today to 184,000 vehicles per day in 2030.”
• The testimony ignores the fact that the finance plan is predicated on the “low” estimate of toll revenues, consistent with the recommendations of the independent review undertaken by the State Treasurer’s Office.
• It is correct that the average weekday traffic on the I-5 Bridge in 2010 was about 127,000 vehicles. However, the average 2030 (FY 2031) weekday traffic volume used in the finance plan is 157,000, which is 27,000 daily trips less than the 184,000 presented in testimony.
• The traffic forecasts actually used in the project’s finance plan estimates of the borrowing
capacity of tolling (for the base toll rate schedule) had 101,000 vehicle trips in 2019, and did not reach the 143,700 trip level presented in the testimony as anticipated in 2010 until 2028.
• The drop in average traffic volumes on the I-5 Bridge over the past few years is mistakenly
attributed as evidence of a permanent change in travel behavior, when in fact it resulted from the economic recession and construction in the Delta Park segment of I-5. Most recently, traffic volumes on I-5 have been increasing again.
• In response to allegations that higher gas prices were causing the drop, C&M Associates, the
independent review consultant retained by the State Treasurer, concluded that, “The drop in traffic volumes was more of a consequence of the Delta Park construction project on I-5 and the economy” than the increase in gas prices. See C&M Associates, Columbia River Crossing Desktop Review of Traffic and Toll Revenue Forecasts Final Report (June 2011), prepared for the Oregon State Treasury.
• By omitting key facts, the testimony provided an incomplete assessment of the independent
review of traffic forecasts commissioned by the Oregon State Treasurer, and did not acknowledge the adjustments made to the financial assumptions in the Final EIS.

REVIEW OF PUBLIC TESTIMONY PRESENTED AT THE MARCH 2012 CRC INTERIM JOINT LEGISLATIVE OVERSIGHT COMMITTEE
4
Peer Review of Models Used for CRC The testimony did not adequately represent the conclusions of the modeling peer review conducted for the CRC; rather than criticizing the models, the peer review validated the models.
• The models that were examined by a peer review team of national modeling experts concluded
that, “For the reasons we explain in our report, we strongly believe the travel demand model and project analysis are valid and comprehensive.” (Travel Demand Model Review Panel Report, November 25, 2008).
• The testimony misrepresents the peer review group conclusion by stating that the peer review “raised significant questions about the project, traffic projections, and related issues, many of which are still unaddressed” (Page 11, Cortright memo of March 16, 2011). While the peer review posed ideas about how to improve the models, it put the recommendation into context as follows: “The panel also provided long-term recommendations for the Portland Metro regional travel demand and land use forecasting models, but these long-term recommendations were beyond the scope of the CRC project and were not considered to impact the outcome of the project findings.” (Page 2, CRC Travel Demand Model Review Panel Findings and Recommendations, November 2008).
• The argument asserted in the testimony that the travel forecasting models used to forecast traffic
are flawed because they do not account for rising fuel costs is incorrect in two key ways. First, the model is based on auto operating costs, not just fuel costs. Data from the federal Bureau of Transportation Statistics show the operating cost per miles of autos has remained relatively constant in constant dollars. Secondly, the testimony focuses on the price of oil, when driver behavior is driven by the cost of fuel per mile. The testimony that long-term rising oil prices equate to rising long-term per mile fuel costs is refuted by the Energy Information Administration (EIA), Department of Energy reports.
• The 2012 Annual Energy Outlook (AEO2012) Early Release Reference case (released January
23, 2012), which provides updated projections for U.S. energy markets through 2035, found that the expected increase in oil prices to the year 2035 will be offset by a 27% reduction in fuel use per mile for light duty vehicles and a 19% reduction in fuel use per mile for heavy duty vehicles.
• In assessing the recent spike in gas price in the March 26, 2012 edition of Today in Energy, EIA
explained that the cost per mile of gas in real dollars has actually significantly declined over the past three decades when it wrote “In nominal terms, retail gasoline prices increased about 37 cents (11.5%) compared to the February 2011 average price of $3.21 per gallon, the previous nominal record. The increase was less steep when adjusted for inflation. In real terms, retail gasoline prices were up 8.9% compared to February 2011. The February 2012 price of $3.58 per gallon eclipsed the previous February record set in 1981. However, compared to 1980, costs per mile driven are lower due to increased vehicle efficiency. Adjusted for inflation, costs per mile driven were about 23 cents in 1980. In February 2012, that number was estimated to be between 16 cents and 17 cents per mile.”
In summary, CRC staff remains confident that cost estimates are realistic and based on best-practices methodology. The traffic and revenue forecasting has been reasonable, is based on methodologies that have undergone rigorous scrutiny by peer and independent reviews, and the key recommendations from these reviews have been incorporated in the current data. As CRC continues to refine the financial plan, construction cost estimates will be updated, an investment grade analysis will be completed and traffic and revenue forecasts will be revised.
cc: Project Controls

Prepared by the Debt Management Division of the Oregon State Treasury
COLUMBIA RIVER CROSSINGFINANCIAL PLAN REVIEW
July 20, 2011
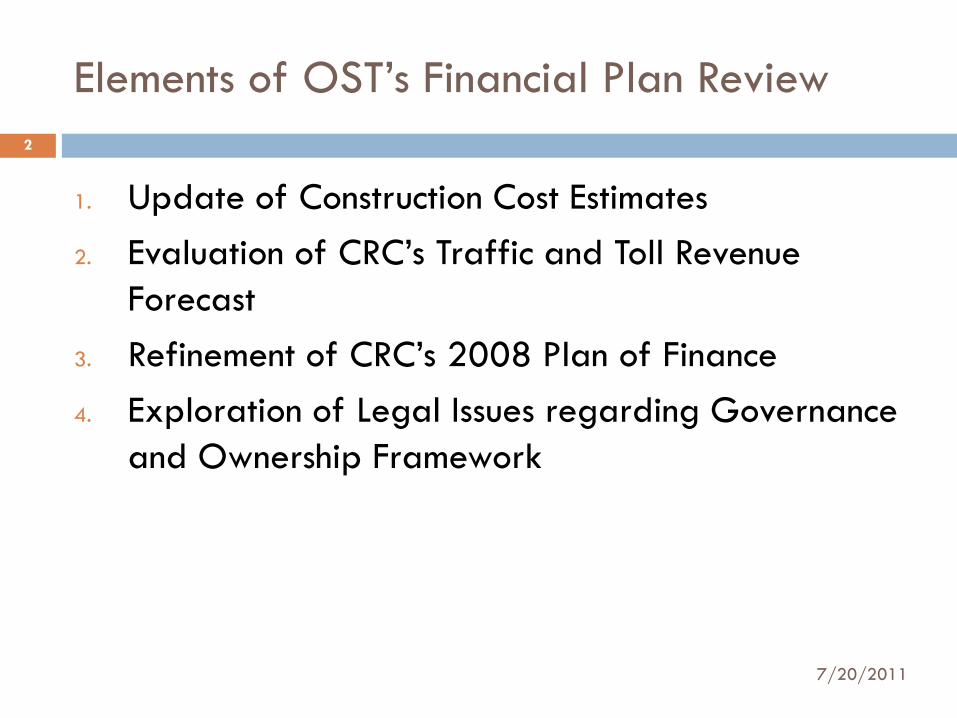
Elements of OST’s Financial Plan Review
1. Update of Construction Cost Estimates2. Evaluation of CRC’s Traffic and Toll Revenue
Forecast3. Refinement of CRC’s 2008 Plan of Finance4. Exploration of Legal Issues regarding Governance
and Ownership Framework
2
7/20/2011

Participants in the OST Review Process3
Update to Construction Cost Estimates
- CRC staff and consultants
Legal Issues re Governance and Ownership
- Oregon DOJ - Orrick Herrington & Sutcliffe (bond counsel)
- ODOT/WDOT- CRC staff and consultants
Independent Review of CRC Traffic/Toll Revenue
Forecast- RB Consult, Ltd- C&M Associates, Inc
Finance Plan Refinement- DMD- ODOT- PRAG (financial advisory firm)- Citi/Morgan Stanley (underwriters)
Update Scenarios for both State-backed and Stand-alone Toll Bonds
OST
Refinement of Likely Approaches to State Equity Contribution
Interim Funding Plan for Anticipated Federal Funds
7/20/2011

Update to Construction Cost Estimate Phased Construction Scenario
Cost Estimation Validation Process (CEVP) is an estimating technique employed by the CRC that uses a probabilistic approach to narrow the range of costs as key project milestones are met
Assuming phased construction (does not include improvements to SR-500 or the Port of Portland flyover ramp), overall CRC project costs are now estimated to be between $2.63 to $3.49 billion, with a 60% probability that costs will be $3.13 billion or less
4
7/20/2011

Update to Construction Cost Estimate Full Build Scenario
Under the full build scenario, which does include improvements to SR-500 and the Port of Portland flyover ramp, overall CRC project costs are estimated to be between $2.82 to $3.75 billion, with a 60% probability that costs will be $3.37 billion or less
Final decision about size and scope of project will be determined upon further refinement of overall project costs and the future availability of various federal and state funds
5
7/20/2011
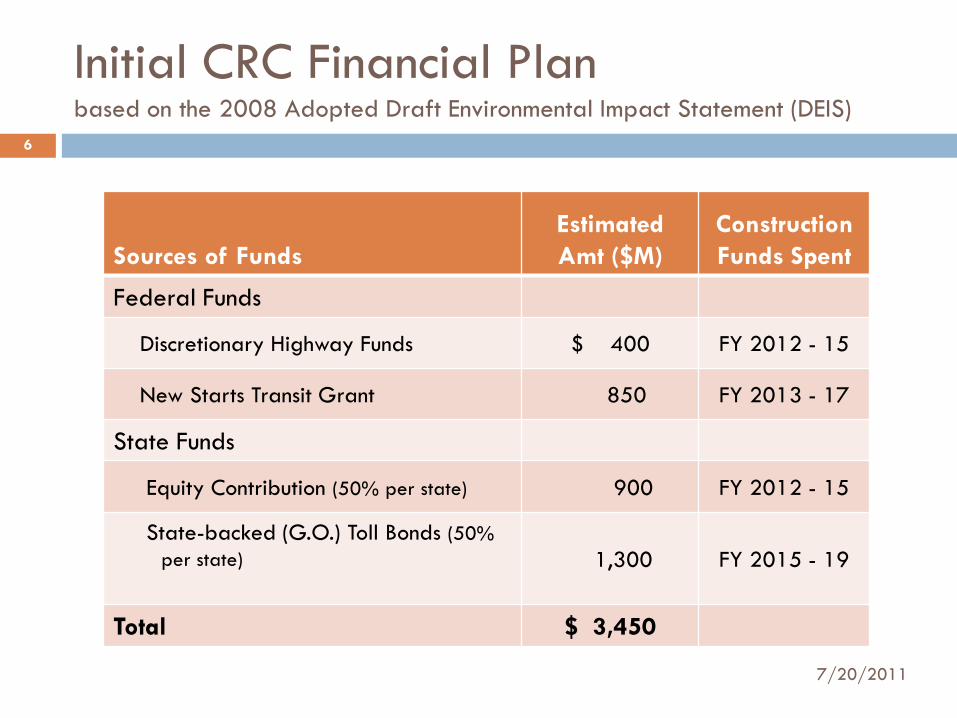
Initial CRC Financial Planbased on the 2008 Adopted Draft Environmental Impact Statement (DEIS)
Sources of FundsEstimated Amt ($M)
ConstructionFunds Spent
Federal Funds
Discretionary Highway Funds $ 400 FY 2012 - 15
New Starts Transit Grant 850 FY 2013 - 17
State Funds
Equity Contribution (50% per state) 900 FY 2012 - 15
State-backed (G.O.) Toll Bonds (50% per state) 1,300 FY 2015 - 19
Total $ 3,450
6
7/20/2011

Toll Bonding Considerations
General Obligation (G.O.) bonds vs. stand-alone toll revenue bonds Repayment of either type of bond comes from tolls paid by I-5 bridge users State-backed G.O. bonds can be sold at higher credit ratings and therefore,
significantly lower interest costs, than stand-alone toll revenue bonds Each DOT (and ultimately, each state’s General Fund) are obligated to cover toll
revenue shortfalls over the life of these G.O. bonds
An “investment grade” traffic and toll revenue forecast prior to the initial sale of toll bonds is essential Bonds must be structured and sized prudently so that neither states’ long-term credit
ratings are impacted by the CRC project
Establishing a strong coverage requirement can also help mitigate potential toll revenue shortfalls by providing a substantial revenue cushion CRC financing model assumes 1.25 debt service coverage level for State-backed G.O.
toll bonds The initial CRC finance plan phased toll bonds towards the latter parts of the
construction project in order to minimize the use of capitalized interest (borrowing for interest payments on the bonds until the imposition of tolls on bridge users)
7
7/20/2011

Background on CRC’s Traffic and Toll Revenue Forecasting
8
A 4-step traffic and toll revenue forecast was developed in 2005 by Stantec using the Portland Metro traffic model Model modified upward using “VIS SIM” micro-simulation to adjust traffic flows by 6%
based upon planned improvements to the I-5 corridor upon project completion 2008 DEIS conservatively used Stantec’s baseline forecast without this predicted
improvement in traffic flows to calculate projected toll revenues Some economists are nevertheless critical of the current 4-step traffic
forecast model’s ability to accurately predict traffic growth and toll revenue over time By its very nature, this type of model assumes a steady growth rate in annual
population, employment, traffic, and GDP Cumulative impacts of relatively small differences in assumptions about traffic growth
can have a significant impact on forecast revenues over the 30-year forecast horizon Changes in land use and employment patterns as well as periodic changes in economic
conditions can have a profound impact on driving patterns and thus, toll revenue generation
Many toll roads around the world have not met their forecast revenues due to these unanticipated conditions
7/20/2011
OST’s Evaluation of CRC’s Traffic and Toll Revenue Forecasting to Date
OST hired two respected independent consulting firms to conduct desktop reviews of the CRC forecasts from both the credit analysis and traffic engineering perspectives Robert Bain, RB Consult Ltd (former S&P ratings analyst who has published
widely on problems with the traffic and toll forecasting process) Herb Vargas and Carlos Contreras, C&M Associates, Inc. (traffic engineering
firm with international experience in investment grade studies)
Each firm independently reviewed CRC’s traffic modeling approach as well as key socioeconomic and land use factors which drive the forecast of long-term trends in traffic growth in the Columbia River corridor
While both firms agreed that CRC’s modeling thus far has been adequate for EIS purposes, they also noted that a far more robust modeling approach (i.e., the investment grade traffic and toll revenue study) will be required prior to the initial toll bond financing planned for FY 2015
9
7/20/2011

Summary of the Consultants’ Findings
Portland Metro’s 2002 long-term employment projections, which were relied upon for the 2008 DEIS, are very outdated
Traffic counts on the I-5 and I-205 bridges have not grown at the rates predicted in the 2008 DEIS
Both firms recommend that the CRC lower its baseline traffic and toll revenue forecasts in recognition of the unanticipated depth of the recent recession and the resulting impact on Portland Metro’s long-term employment and traffic growth trends
For planning purposes, it was suggested that the CRC assume that projected annual gross toll revenues will be somewhere between 15% to 25% lower than the baseline forecast assumed at the time the 2008 DEIS was adopted
10
7/20/2011
Actual vs. Projected I-5 Bridge TrafficAverage Annual Daily Trips

Next Steps in Refining the CRC Traffic and Toll Forecast Model
The key difference between OST’s two consultants was their assumption regarding the likely shift in traffic to the I-205 bridge upon tolling of the new I-5 bridge
The original Stantec forecast assumed the new I-5 bridge would still “capture” 45% -47% of traffic in the overall corridor
For each 1% reduction in the I-5 bridge “capture” rate, our consultants’ estimate that gross toll revenues drop by approximately 2%
An investment grade study that incorporates the latest forecast of long-term employment trends and examines the impact of tolling on bridge users of different income levels will allow the CRC to narrow and refine projected I-5 toll revenues prior to the initial sale of bonds in FY 2015
11
7/20/2011
$0
$200
$400
$600
2019
2021
2023
2025
2027
2029
2031
2033
2035
2037
2039
2041
2043
2045
2047
2049
2051
2053
2055
2057
2059
Millions
Revised CRC (I‐5) Revenue Forecast
Original Stantec ForecastRevised Revenue Forecast at 15% HaircutRevised Revenue Forecast at 25% Haircut
0
100,000
200,000
300,000
400,000
500,000
1987
1991
1995
1999
2003
2007
2011
2015
2019
2023
2027
2031
2035
2039
2043
2047
2051
2055
2059
Revised Corridor (I‐5 + I‐205) Traffic Forecast
Observed Corridor AADTStantec Corridor ForecastRevised Corridor Forecast at 15% Rev HaircutRevised Corridor Forecast at 25% Rev Haircut
Impact of Lowering the I-5 Bridge Toll Revenue Forecast on the CRC Finance Plan
All else being equal, a 15% reduction in gross toll revenues reduces the amount of proceeds that can be generated for the project through sale of state-backed G.O. toll bonds by 18.5%, or approximately $240 millioncompared to the CRC’s original finance plan
The percentage differential between the reduction in revenues vs. project proceeds is due to certain annual and periodic fixed costs associated with operation and maintenance of the I-5 toll bridge that will need to be funded regardless of overall traffic levels
At a 25% toll revenue reduction, estimated project proceeds are reduced by 31% or approximately $407 million
12
7/20/2011

Other Bond Structuring Considerations Impacting CRC Project Financing
The original CRC finance plan envisioned that State-backed GO bonds would be “back-loaded” (i.e. structured with ascending annual debt service linked to ascending toll revenues over time), with the following assumptions: I-5 bridge traffic would grow annually by 1.3% Toll rates would increase annually by 2.5%
Based on Washington’s experience with toll revenue shortfalls on the Tacoma Narrows project, Washington State Treasurer McIntire is now requiring WDOT to use more conservative revenue growth assumptions on all new state bond tolling projects
Eliminating the toll escalation assumption from the CRC financing model reduces the risk of toll revenue shortfalls, but also reduces the amount of toll bond proceeds that can be generated by approximately $318 million
When combined with the impacts of the aforementioned 15% - 25% potential reduction in projected toll revenues, CRC toll bond proceeds are estimated to be $468 to $598 million lower than predicted in the 2008 DEIS
13
7/20/2011

Potential Solutions to the CRC Funding Gap
Pre-Completion Tolling CRC has estimated that pre-completion tolling of the I-5 bridge could generate up to
$200 million in additional revenue for the project
TIFIA Loan The Transportation Infrastructure Finance and Innovation Act (TIFIA) established a Federal
program that provides direct loans to surface transportation projects of national and regional significance
TIFIA loans provide competitive interest rates and flexible repayment terms (no interest payments are required during construction, up 35 years for repayment upon project completion, and debt service coverage of 1.1x revenues on a subordinate basis to the states’ G.O. bonds)
A TIFIA loan of $704 to $833 million, repaid from I-5 toll revenues, would substantially reduce the need for state-backed G.O. bonds and limit the exposure of each state’s General Fund to the project, while restoring project funding by $194 to $238 million
Given the increasingly competitive nature of the TIFIA loan approval process, the CRC team – if it opts to pursue this option -- should initiate efforts to secure US DOT and Congressional approval for this loan at the same time it seeks other Federal funding commitments for the project
14
7/20/2011

Potential Modifications to CRC’s Plan of Finance
Sources of FundsOriginal
CRC Plan ($M)
Combined Impact of Debt Structuring Limitations and Toll Revenue Reductions
on CRC Original Plan ($M)
Potential Modifications to CRC Plan ($M)
At a 25%Revenue Reduction
At a15% Revenue Reduction
Federal Funds
Discretionary Highway Funds $ 400 $ 400 $ 400 $ 400
New Starts Transit Grant 850 850 850 850
State Funds
Equity Contribution (50% per state) 900 900 900 900
State-backed (G.O.) Toll Bonds (50% per state) 1,300 702 832 190 - 230
TIFIA Loan (secured by tolls & back-up pledge of ODOT/WDOT revenues)
- - - 704 - 833
Pre-Completion Tolling (estimated) - - - 200
Total $ 3,450 $ 2,852 $ 2,982 $ 3,244 - 3,413
15
7/20/2011
Other CRC Financing Issues16
Securing Federal transit funding is now on the critical path $850M in New Starts grant is key to moving ahead with
the overall project as currently conceived Vote on tax to generate $3M in annual transit operating
funds by Clark County residents is critical to getting the New Starts money
Failure to win Federal funding for the transit portion of the project may require rethinking of the overall project scope, timeline and financing plan
Assuming the CRC is successful in securing a commitment of all anticipated Federal funding, the two states will nevertheless need to provide interim financing to pay significant portions of the CRC’s construction costs prior to receiving $1.25 billion of transit and discretionary highway money
7/20/2011

Other CRC Financing Issues (continued)17
The current CRC plan envisions equity contributions of $450 million by each state in FY 2013 to fund initial phases of design and construction
ODOT’s preferred option appears to be issuing state-backed G.O. bonds to cover its equity contribution Under the Oregon Constitution, ODOT is allowed to issue G.O. bonds to fund
“permanent roads” within the state Both the G.O. bond sale and source of debt repayment will require legislative
approval A 1.5 cent per gallon dedicated increase in state gas tax (or equivalent weight-mile
fees) generates $40.6 million per year and is estimated to support up to $522 million in self-supporting 25-year G.O. bonds at a 1.10x coverage level
Alternatively, ODOT could issue 12-year “GARVEE” Bonds which are a type of grant anticipation note that gets repaid from future federal discretionary highway revenues GARVEEs are frequently issued by states and local governments for large
transportation projects and will likely be the source of interim funding used for other Federally-funded aspects of the project
Each $10 million in annual Federal Funds pledged would generate roughly $94 – 99 million in equity towards the project 7/20/2011

Governance and Ownership Framework18
ODOT/WDOT continue to meet to develop the IGA for governance and ownership of the project Oregon’s Department of Justice and ODOT’s bond counsel, Orrick, Herrington
and Sutcliffe, are now included in the CRC governance planning process CRC’s current plan envisions that toll collection, bridge ownership and
on-going maintenance will be done by the State of Washington but that Oregon will share in a 50/50 split of all CRC project costs, including cost overruns and revenue shortfalls Oregon Constitution prohibits use of state gas tax for projects outside state
borders Preliminary cost allocation between project elements suggests this will not be
a problem Regardless of whether the CRC project is funded in part through state-
backed G.O. toll bonds or a Federal TIFIA loan, the CRC’s governance plan must include a robust toll-setting mechanism to assure that all toll-related debt service is paid in full each year through toll revenues
7/20/2011

Conclusions
CRC’s construction cost estimating process appears solid, with contingency plans being developed for project phasing depending upon the finalized estimate of project costs and the availability of various state and federal funds
Key assumptions in the traffic and toll revenue forecast used in the 2008 DEIS are now outdated, given the unanticipated depth of the recent recession Completion of an investment grade study over the next two years will allow the
CRC to refine its estimate of anticipated I-5 bridge toll revenues over time, which in turn will allow us to refine the amount of toll bond proceeds that can be generated for the project
The combined impact of Washington State Treasurer McIntire’s requirement that CRC adopt a more conservative toll bond debt structure and the potential toll revenue reduction of 15% – 25% is a $468 to $598 million reduction in projected CRC funding resources
7/20/2011
19

Conclusions (continued)
Pre-completion tolling of the I-5 bridge and the shift from state-backed GO toll bonds to a primarily TIFIA loan funding approach may be able to restore between $394 to $438 million in CRC funding, while greatly reducing the financial risk to both states’ General Funds and credit ratings
Securing Federal funding for the project remains on the critical path, with an important vote on taxes to fund annual transit operating costs coming up this fall in Clark County
Both state-generated and federal transportation funds can be leveraged to provide Oregon’s $450 million equity contribution to the CRC project
The CRC’s governance plan must include a robust toll-setting mechanism to assure that all toll-related debt service is paid in full each year through toll revenues
7/20/2011
20

FTA Office of Planning and Environment FTA Office of Program Management
FTA Major Capital Transit Investment Fact Sheet
New Starts Project Development SAFETEA-LU continues the long-standing process for the planning and development of New Starts projects. The New Starts planning and project development process reflects a continuum of local policy development, technical studies, and decision-making activities, where broad regional problems are identified and prioritized; options for addressing specific problems in specific corridors are identified, evaluated, and narrowed; and optimal investment strategies are selected and advanced for more detailed analysis and, ultimately, implementation and operation. Although the development of New Starts projects must follow statutory requirements, FTA emphasizes that the New Starts planning and project development process is, at its core, simply a "common sense" approach to problem solving, and should answer questions like: “What is the problem in need of solving?; What are potential solutions?; What are their benefits?; What do they cost?; and, Which alternative is the best solution, given available resources, to address the problem?.
The early stages of the New Starts project development process – alternatives analysis (AA) and much of preliminary engineering (PE) - is carried out within the metropolitan planning process specified by SAFETEA-LU and the environmental review processes as required by the National Environmental Policy Act of 1969 (NEPA). As such, planning and project development activities for New Starts projects – with only a few
exceptions – are intended to be consistent with the analyses and decision-making process expected for the adequate study and subsequent development of any major capital transportation (transit, highway, or multimodal) project in a given corridor. AA studies are a corridor-level analysis of a range of alternatives designed to address locally-identified mobility and other problems in a specific transportation corridor. AA is considered complete with the selection of a locally preferred alternative (LPA) to advance into PE. In PE, the LPA is further developed to the point where environmental impacts are known and mitigation is provided for; the project scope is final and its cost estimate relatively firm; and its financial plan is set, with the majority of local funding committed. Final design is the last phase of New Starts project development during which the project sponsor prepares for construction. Final design is also the stage during which FTA may enter into a multi-year commitment to fund a proposed New Starts project; this commitment is called a full funding grant agreement.
New Starts funding is discretionary, and SAFETEA-LU continues previous Federal law intended to facilitate effective FTA management of the program and ensure that scarce New Starts resources are made available to the most meritorious of transit investments. To achieve this, SAFETEA-LU requires that FTA approve New Starts project entry into preliminary engineering and final design. This approval is based upon: a) the “readiness” of a project (and its sponsor) to carry out the activities of each phase of development; and b) its rating against several statutorily-defined New Starts criteria. These criteria include project cost effectiveness, the transit supportiveness of existing and future land use, and local financial commitment, among others. Some of the New Starts project justification criteria are based upon incremental benefits of the proposed project against a lower-cost “baseline” improvement. SAFETEA-LU also requires that the locally-generated information used to estimate the costs and benefits of proposed New Starts projects be found by FTA to be reliable. Finally, FTA needs to be assured that project sponsors have the financial and technical capacity to develop, construct, and operate large and complex transportation infrastructure projects on time and within budget. Consequently, the development of New Starts projects often requires a level of technical analyses and FTA oversight beyond what is often experienced in the development of projects not funded with New Starts resources. FTA recognizes the rigor of the process and provides project sponsors technical assistance
in the development of New Starts projects, as well as the opportunity to participate in the development of New Starts project development, evaluation, and funding policies. In addition, FTA is examining ways it can speed its review and approval of project deliverables and milestones, lessen the reporting requirements of New Starts project sponsors, and encourage innovative and time-saving project delivery methods – including the participation of the private sector – without sacrificing its program stewardship responsibilities.
Full Funding Grant Agreement
Alternatives Analysis
Final Design Commitment of Non-Federal Funding, Construction Plans, ROW Acquisition,
Before-After Data Collection Plan,
FTA Evaluation for FFGA, Begin Negotiations
Proj Mgmt Over-sight
Construction
Preliminary Engineering Complete NEPA Process
Refinement of Financial Plan
Select LPA, MPO Action
PMP
FTA Decision on entry into PE
FTA Decision on entry into FD
New Starts Planning and
Project Development Process
Systems Planning

January 2010
Columbia River Crossing Tolling Study Committee Report to the Washington and Oregon Legislatures

Table of Contents
Letter from Committee Members 2
Executive Summary 3
Columbia River Crossing Project Background 5
Committee Charge and Legislative Direction 7
Committee Work Approach 8
Public Engagement 9
Outreach Activities and Events 10
Input Requested by the Legislation 13
Evaluating Toll Scenarios 17
Assumptions in Toll Scenarios 17
Variables Examined in Toll Scenarios 18
Toll Scenarios Studied 19
Funding Opportunity and Financial Capacity Analysis 21
How Bridge Tolling Affects Diversion 22
Bridge Performance 24
Tolling and Traffic Management Technology 27
Preliminary Ideas about Diversion Mitigation 29
Toll-Setting Framework 29
Next Steps 31Gail Achterman ChairOregon Transportation Commission
Paula Hammond Secretary of TransportationWashington State Department of Transportation
Carol MoserChairWashington State Transportation Commission
Matthew Garrett Director of TransportationOregon Department of Transportation
2 Columbia River Crossing Tolling Study Committee Report
Letter from Committee Members
January 19, 2010
To: Governor Chris Gregoire
Members of the Washington State Legislature
We are pleased to submit the Columbia River Crossing (CRC) Tolling Study Committee’s report in accordance with
ESSB 5352, as approved by the 2009 Washington State Legislature. Tolling is needed for the CRC project as a way
to supplement federal and state funding and to manage traffi c fl ow. Th e Committee was charged with evaluating the
expected traffi c diversion and funding contribution associated with tolling Interstate 5 (I-5), building awareness and
engaging residents and bridge users in this preliminary discussion, coordinating with the transportation commissions
and departments from both states, discussing a potential bi-state toll setting framework, and reporting back to the
Governor and Legislature in 2010.
Ten scenarios were evaluated; some with tolls only on I-5 and others with tolls on I-5 and I-205, the adjacent crossing
over the Columbia River. All scenarios assumed electronic tolling without the use of toll booths, and all but one
included variable tolls, with rates that change throughout the day according to a set schedule.
Although tolling bridges across the Columbia River was done 40 years ago, many residents are unfamiliar with the
concept. Th ose who have experienced tolling might not know about modern-day tolling involving transponders and
variable rates. In response, the Committee and its staff created a Web site (http://tolling.columbiarivercrossing.org)
and distributed fact sheets to explain the terms and technology. Residents, business owners and jurisdictions were
engaged with a variety of outreach methods: open houses, listening sessions, presentations to neighborhood groups,
informational booths at fairs/festivals, and an online survey. More than 13,000 people visited the Web site, at least
10,000 people received materials or participated in an event; over 4,200 completed the Web survey.
Public outreach eff orts informed us about the following:
• Support exists for tolling during construction as a way to reduce costs.
• Th ere is a high level of opposition to tolling I-205.
• Tolling as a funding source is not well understood. Many felt that federal funds or taxes should be suffi cient.
• Learning more about variable tolling did not aff ect attitudes.
Scenario analysis shows that tolls can reduce traffi c volumes and hours of congestion on the tolled facility. Th is is
because some people will choose a new route, change their time of travel, take transit, carpool, or decide not to cross
the Columbia River.
All of our fi ndings are explained in this report and detailed appendices. All documents can be found online: http://
tolling.columbiarivercrossing.org. For questions about the report, please contact Jennifer Ziegler at WSDOT
at [email protected] or 206-464-1194. Copies of this report will also be provided to the Washington State
Transportation Commission, and the Oregon Legislature, Oregon Governor and Oregon Transportation Commission.
We would like to acknowledge and thank the thousands of people that participated in this study, and the staff from
both departments of transportation that were instrumental in this eff ort. We look forward to seeing the future steps in
the toll setting process for the CRC project as they unfold.
Paula Hammond, Secretary, Washington State Department of Transportation
Carol Moser, Chair, Washington State Transportation Commission
Matthew Garrett, Director, Oregon Director of Transportation
Gail Achterman, Chair, Oregon Transportation Commission

3Columbia River Crossing Tolling Study Committee Report
Web site, taking part in a Web survey or writing to the
Committee. Although tolling bridges over the Columbia
River has occurred in the past, many current residents
are not familiar with tolling as a funding or traffi c
management tool. Participants were given information
about modern-day tolling, including electronic and
variable rate toll schedules. Th rough these interactions,
Committee members were able to gain a better
understanding of the varied public concerns, questions,
and attitudes related to tolling:
Many commuters disapproved of tolling as a • funding source, expressing that existing taxes should pay for an Interstate highway or the federal government should contribute more funds. Others understand that tolls will be needed to supplement other funding sources in order to build the project.
Learning more about variable tolling as a way • to improve traffi c fl ow, as well as raise funds for the bridge, did not readily change attitudes about variable tolling.
I-5 and I-205provide the two direct connections between
Portland and Vancouver.
Executive SummaryIn 2009, the Washington State Legislature directed
the Washington State Department of Transportation
(WSDOT) to evaluate tolls as a means to fi nance the
Columbia River Crossing (CRC) project, in coordination
with the Oregon Department of Transportation
(ODOT), and report its fi ndings to the Legislature
and Governor in 2010. To evaluate traffi c and funding
information and engage citizens on this issue, a Tolling
Study Committee was convened.
Today’s aging Interstate Bridge, crossing the
Columbia River between Vancouver, Washington and
Portland, Oregon, is snarled with traffi c almost daily
due to bridge lifts or collisions. Th e combination of
congestion, narrow bridge lanes, short on-ramps and
earthquake vulnerability makes for a corridor that needs
improvement. Th e CRC project includes a replacement
Interstate 5 (I-5) bridge, extension of the light rail line to
Vancouver, and highway safety improvements. Funding
will come from a variety of sources, including federal,
state (Oregon and Washington), and tolling.
Th e 2009 legislation asked for an evaluation of toll
scenarios to better understand the traffi c eff ects, funding
contribution, and public awareness and input about
tolling to build the CRC project. Th e Committee and
its staff studied 10 scenarios, which included tolling the
I-5 bridge alone and tolling both I-5 and the parallel
I-205 bridge. Electronic toll collection was assumed
for all scenarios and all but one included variable toll
rates, where tolls would change according to a set
schedule. Extensive public outreach and engagement was
conducted to provide information and receive comments
about tolling in the Portland-Vancouver region.
Findings from the technical evaluation and public
conversations are contained within this report.
Overall Findings from Public EngagementTh e Committee led an extensive public outreach and
input-gathering eff ort in conjunction with the tolling
scenario evaluation. Th ousands of people engaged
directly with this process by attending Committee
meetings or public workshops, visiting the Tolling Study
Portland
Vancouver
8484
205
405
205
5
500
503
14
26
99E
5
DIMENSIONS ARE APPROXIMATE.
N2 MILES
Columbia R
Willamette R
W A S H I N G T O N
O R E G O N

4 Columbia River Crossing Tolling Study Committee Report
Th e freight and business community has a generally • favorable response to the concept of tolling to fund the project and reduce the hours of congestion in the project area.
Just over half of the survey respondents agreed that • tolling early to reduce costs and debt would be a favorable way to move forward with the project.
A high number of survey respondents indicated • they would strongly oppose tolling I-205.
Many questions remain: the amount of funding needed
from tolls, whether I-205 is a part of the fi nancing or
traffi c management package, and whether discounts will
be allowed for any bridge users.
Overall Findings from Scenario AnalysisTh e Committee evaluated 10 tolling scenarios. All but
one assumed a variable rate toll that would change
according to a set schedule. Some scenarios evaluated
tolls only on I-5 and others included tolls on I-5 and
I-205.
Financial Capacity
Th e scenarios examined could raise between $940
million and $3.36 billion in funding from tolls. Th e
most an I-5 only scenario raised was $2.09 billion. With
a toll on both I-5 and I-205, the funding contribution
from tolls was typically more than the I-5 only tolling
scenarios. Tolling early could raise an additional $330
million for any of the scenarios studied.
Traffi c Conditions with Tolling
Tolls lead to a decrease in the level of cross-river • traffi c demand and cause some vehicle trips to shift to uncongested off -peak times (when the toll is lower). As a result, the duration and magnitude of traffi c congestion would be reduced.
Daily and hourly traffi c volumes in 2030 would • vary for the I-5 bridge and the I-205 bridge with diff erent tolling levels. For I-5 only toll scenarios, some trips would divert to I-205 to avoid paying the toll. For scenarios that toll both bridges, diversion to I-205 would be minimized and trips would shift to I-5 once the option of a non-tolled route was removed.
Diversion due to Tolls
For most of the I-5 only toll scenarios, the majority • of drivers would not change their travel patterns. Some would choose a new destination or a non-tolled route. Diversion to transit is minimal due to the already increased ridership associated with project improvements.
Higher tolls on I-5 would cause more route • diversion; however, the percentage of diversion tends to be lower during peak periods when travelers’ willingness to pay tolls may be higher and/or alternative routes are congested, and thus, time consuming.
For scenarios that toll both the I-5 and I-205 • bridges, traffi c levels would be higher on I-5 and lower on I-205 compared to tolling only the I-5 bridge. However, compared to the No Toll project scenario, total cross-river traffi c demand would be less on both the I-5 and I-205 bridges as many trips would divert to transit or not be made across the Columbia River.
Next Steps
Th e Final Environmental Impact Statement will be
produced in 2010 and the fi nance plan will continue
to be developed over the next two years as the project’s
scope, budget and funding sources are refi ned. Project
specifi cations and traffi c data will inform the toll-
setting process that is just beginning. Th e Oregon and
Washington transportation commissions will work
together to determine the appropriate structure for
issuing debt, authorizing bonds and setting rates on
a bi-state facility. Public engagement and community
outreach will continue throughout this process.
Appendices on Disk and Available on the Web site
(http://tolling.columbiarivercrossing.org):
Volume 1A: ESSB 5352
B: Outreach activities and materials
C: Travel Demand Forecasting, Revenue
Projections, Determination of Net Revenues,
and Financial Capacity Analysis
Volume 2 D: All public comments received
5Columbia River Crossing Tolling Study Committee Report
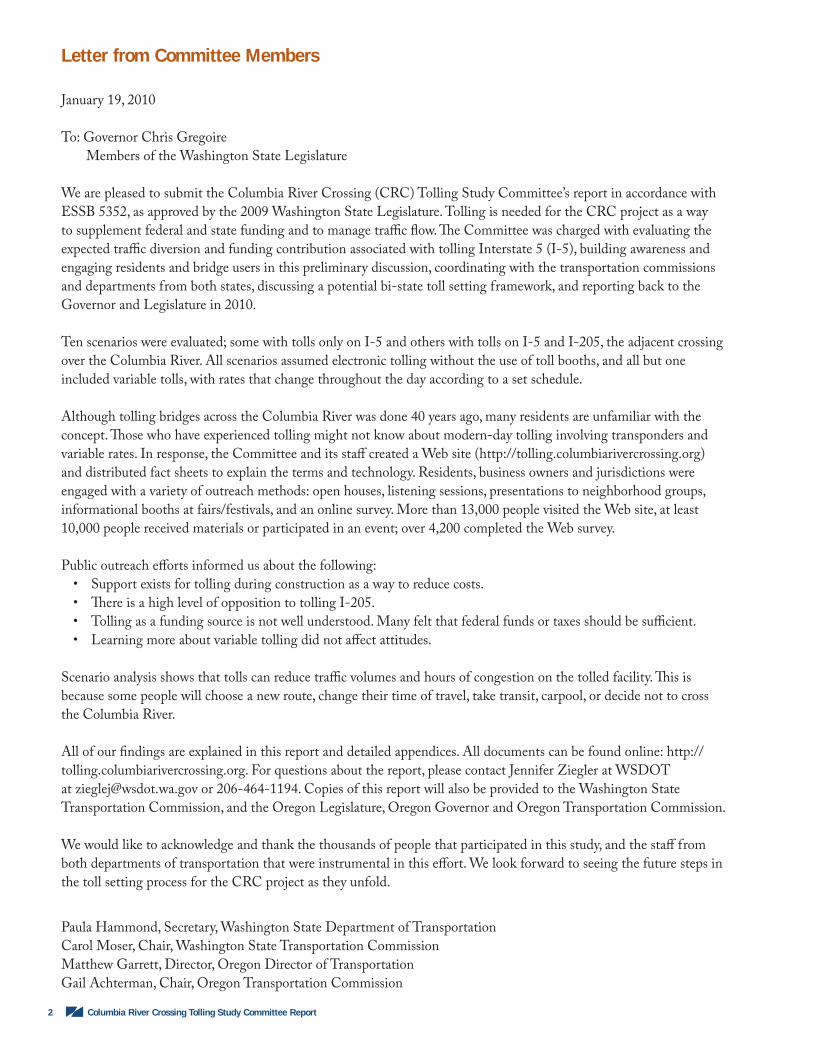
Columbia River Crossing Project BackgroundI-5 is one of two highways that cross the Columbia River between Vancouver,
Washington and Portland, Oregon. Approximately 135,000 vehicles travel
across the Interstate Bridge each day. About $40 billion in freight crosses the
river each year. Collisions on and near the bridge occur at a rate almost twice
as high as on other similar urban highways.
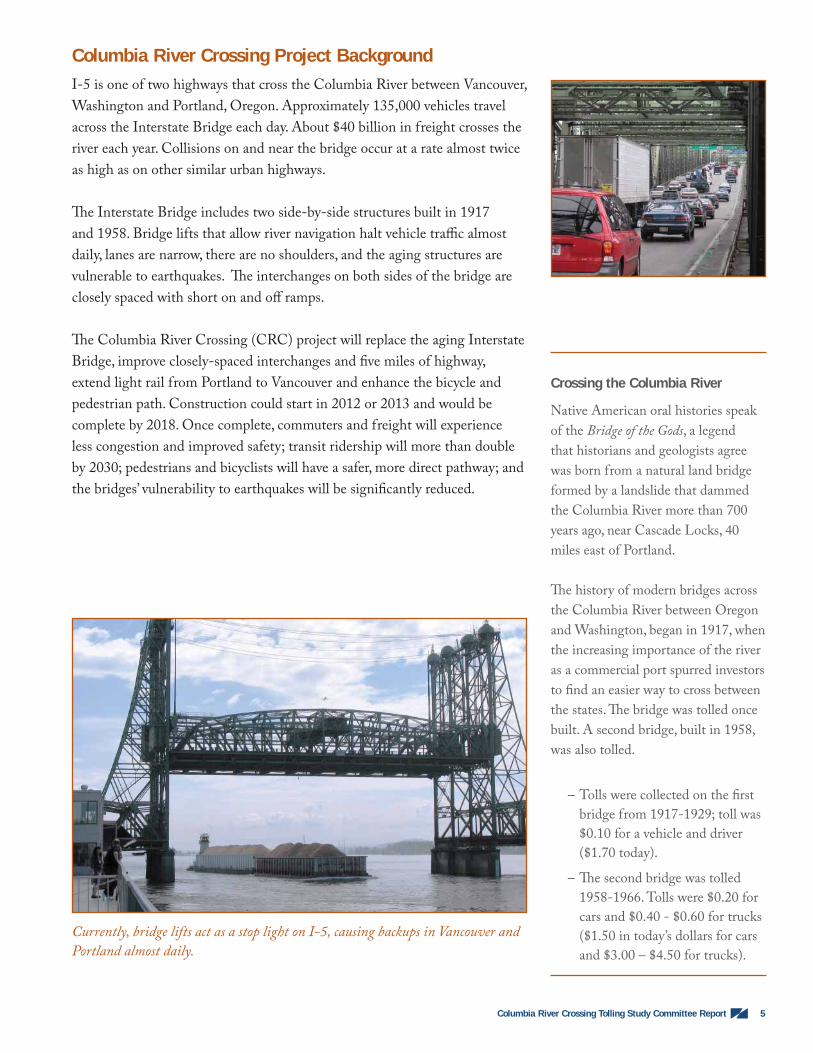
Th e Interstate Bridge includes two side-by-side structures built in 1917
and 1958. Bridge lifts that allow river navigation halt vehicle traffi c almost
daily, lanes are narrow, there are no shoulders, and the aging structures are
vulnerable to earthquakes. Th e interchanges on both sides of the bridge are
closely spaced with short on and off ramps.
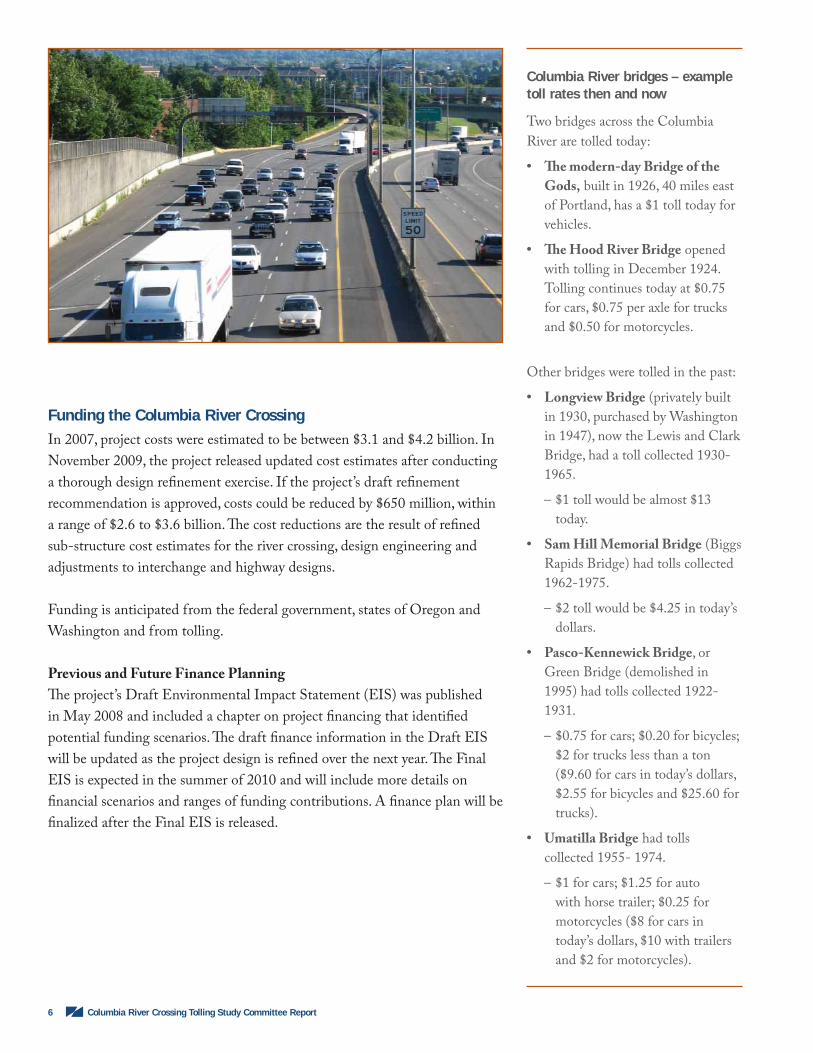
Th e Columbia River Crossing (CRC) project will replace the aging Interstate
Bridge, improve closely-spaced interchanges and fi ve miles of highway,
extend light rail from Portland to Vancouver and enhance the bicycle and
pedestrian path. Construction could start in 2012 or 2013 and would be
complete by 2018. Once complete, commuters and freight will experience
less congestion and improved safety; transit ridership will more than double
by 2030; pedestrians and bicyclists will have a safer, more direct pathway; and
the bridges’ vulnerability to earthquakes will be signifi cantly reduced.
Crossing the Columbia River
Native American oral histories speak
of the Bridge of the Gods, a legend
that historians and geologists agree
was born from a natural land bridge
formed by a landslide that dammed
the Columbia River more than 700
years ago, near Cascade Locks, 40
miles east of Portland.
Th e history of modern bridges across
the Columbia River between Oregon
and Washington, began in 1917, when
the increasing importance of the river
as a commercial port spurred investors
to fi nd an easier way to cross between
the states. Th e bridge was tolled once
built. A second bridge, built in 1958,
was also tolled.
Tolls were collected on the fi rst –
bridge from 1917-1929; toll was
$0.10 for a vehicle and driver
($1.70 today).
Th e second bridge was tolled –
1958-1966. Tolls were $0.20 for
cars and $0.40 - $0.60 for trucks
($1.50 in today’s dollars for cars
and $3.00 – $4.50 for trucks).
Currently, bridge lifts act as a stop light on I-5, causing backups in Vancouver and
Portland almost daily.
6 Columbia River Crossing Tolling Study Committee Report
Funding the Columbia River CrossingIn 2007, project costs were estimated to be between $3.1 and $4.2 billion. In
November 2009, the project released updated cost estimates after conducting
a thorough design refi nement exercise. If the project’s draft refi nement
recommendation is approved, costs could be reduced by $650 million, within
a range of $2.6 to $3.6 billion. Th e cost reductions are the result of refi ned
sub-structure cost estimates for the river crossing, design engineering and
adjustments to interchange and highway designs.
Funding is anticipated from the federal government, states of Oregon and
Washington and from tolling.
Previous and Future Finance Planning
Th e project’s Draft Environmental Impact Statement (EIS) was published
in May 2008 and included a chapter on project fi nancing that identifi ed
potential funding scenarios. Th e draft fi nance information in the Draft EIS
will be updated as the project design is refi ned over the next year. Th e Final
EIS is expected in the summer of 2010 and will include more details on
fi nancial scenarios and ranges of funding contributions. A fi nance plan will be
fi nalized after the Final EIS is released.
Columbia River bridges – example toll rates then and now
Two bridges across the Columbia
River are tolled today:
Th e modern-day Bridge of the •
Gods, built in 1926, 40 miles east
of Portland, has a $1 toll today for
vehicles.
Th e Hood River Bridge• opened
with tolling in December 1924.
Tolling continues today at $0.75
for cars, $0.75 per axle for trucks
and $0.50 for motorcycles.
Other bridges were tolled in the past:
Longview Bridge• (privately built
in 1930, purchased by Washington
in 1947), now the Lewis and Clark
Bridge, had a toll collected 1930-
1965.
$1 toll would be almost $13 –
today.
Sam Hill Memorial Bridge• (Biggs
Rapids Bridge) had tolls collected
1962-1975.
$2 toll would be $4.25 in today’s –
dollars.
Pasco-Kennewick Bridge• , or
Green Bridge (demolished in
1995) had tolls collected 1922-
1931.
$0.75 for cars; $0.20 for bicycles; –
$2 for trucks less than a ton
($9.60 for cars in today’s dollars,
$2.55 for bicycles and $25.60 for
trucks).
Umatilla Bridge• had tolls
collected 1955- 1974.
$1 for cars; $1.25 for auto –
with horse trailer; $0.25 for
motorcycles ($8 for cars in
today’s dollars, $10 with trailers
and $2 for motorcycles).
7Columbia River Crossing Tolling Study Committee Report
Committee Charge and Legislative DirectionTh e Washington State Department of Transportation, in coordination with
the Oregon Department of Transportation, was charged with conducting a
tolling study for the CRC project by the Washington State Legislature in
2009 (ESSB 5352). Th e departments of transportation convened a Tolling
Study Committee composed of:
Paula Hammond, Secretary, Washington State Department of • Transportation
Carol Moser, Chair, Washington State Transportation Commission•
Matthew Garrett, Director, Oregon Director of Transportation•
Gail Achterman, Chair, Oregon Transportation Commission•
Th e Committee was responsible for evaluating funding and traffi c diversion
eff ects of a variety of tolling scenarios, engaging citizens and project sponsors
in the conversation, educating the public about tolling technology and
reporting to the Washington State Legislature in January 2010.
Requirements of the tolling study, as outlined in the legislation, include:
Evaluate potential diversion of traffi c from I-5 to other parts of the • transportation system in the vicinity of the Columbia River
Evaluate the most advanced tolling technology •
Evaluate other technologies that can help manage traffi c•
Confer with the Project Sponsors Council and report regularly to the • transportation commission
Research options for a potential toll-setting framework between the • Oregon and Washington transportation commissions
Provide a report to the governor and legislature by January 2010•
Th e act requires conversations and public work sessions with users of the
bridge, business and freight groups, and local governments about the
following topics:
Tolling as a way to fund the project and reduce congestion with the use • of variable tolling
Implementation of tolls and tolling impacts on the I-5 and I-205 • corridors, including diversion of traffi c to local streets and potential mitigation
Tolling I-205 separately as a management tool for the broader • transportation system

8 Columbia River Crossing Tolling Study Committee Report
Committee Work ApproachAlthough the I-5 and I-205 bridges were tolled in the past, it has been 40
years since a toll has existed on either of these roadways. Many Portland and
Vancouver area residents are no longer familiar with tolling. Th ose that have
experienced tolling may not understand recent technological advances that
make electronic and variable tolling possible. Th e Tolling Study Committee
knew that providing information was important as conversations about
tolling scenarios were beginning. A variety of outreach techniques engaged
the public in discussions about tolling as a way to fund the project and
help manage congestion on I-5. Information was provided to thousands of
residents and bridge users in the form of fact sheets, presentations to business
associations and community groups, web content, and an online survey.
Tolling terms
Electronic toll collection: Collecting
tolls without the use of toll booths,
generally using transponders or license
plate recognition technology. Drivers
do not need to slow down or stop to
have their toll collected.
Fixed rate toll: Toll rates remain the
same, regardless of time of day or level
of congestion.
Variable toll: Toll rates that vary by
time of day based on a set schedule.
legislative report
2009 2010
June July August September October November December January
6/24open house
6/23open house
6/30listening session
7/1listening session
online survey
community and business outreach
10/1public committee meeting
12/7public committee meeting
revise/evaluate scenarios
Tolling Study Timeline
9Columbia River Crossing Tolling Study Committee Report
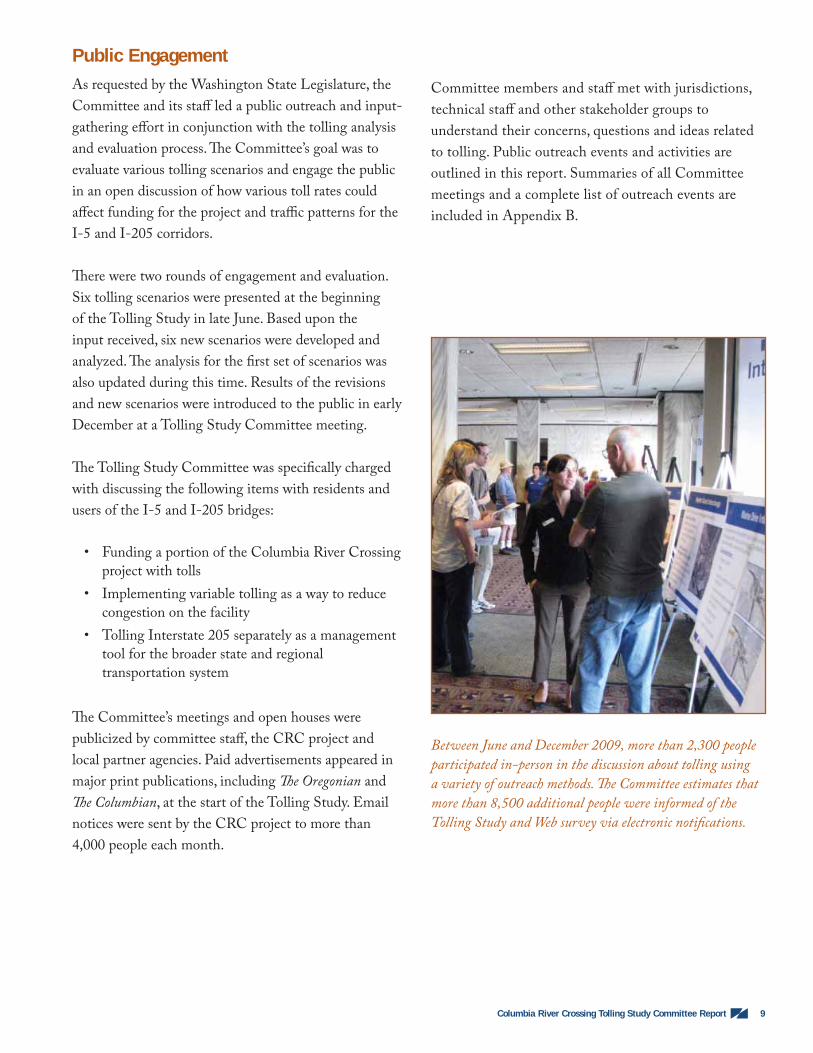
Public EngagementAs requested by the Washington State Legislature, the
Committee and its staff led a public outreach and input-
gathering eff ort in conjunction with the tolling analysis
and evaluation process. Th e Committee’s goal was to
evaluate various tolling scenarios and engage the public
in an open discussion of how various toll rates could
aff ect funding for the project and traffi c patterns for the
I-5 and I-205 corridors.
Th ere were two rounds of engagement and evaluation.
Six tolling scenarios were presented at the beginning
of the Tolling Study in late June. Based upon the
input received, six new scenarios were developed and
analyzed. Th e analysis for the fi rst set of scenarios was
also updated during this time. Results of the revisions
and new scenarios were introduced to the public in early
December at a Tolling Study Committee meeting.
Th e Tolling Study Committee was specifi cally charged
with discussing the following items with residents and
users of the I-5 and I-205 bridges:
Funding a portion of the Columbia River Crossing • project with tolls
Implementing variable tolling as a way to reduce • congestion on the facility
Tolling Interstate 205 separately as a management • tool for the broader state and regional transportation system
Th e Committee’s meetings and open houses were
publicized by committee staff , the CRC project and
local partner agencies. Paid advertisements appeared in
major print publications, including Th e Oregonian and
Th e Columbian, at the start of the Tolling Study. Email
notices were sent by the CRC project to more than
4,000 people each month.
Committee members and staff met with jurisdictions,
technical staff and other stakeholder groups to
understand their concerns, questions and ideas related
to tolling. Public outreach events and activities are
outlined in this report. Summaries of all Committee
meetings and a complete list of outreach events are
included in Appendix B.
Between June and December 2009, more than 2,300 people
participated in-person in the discussion about tolling using
a variety of outreach methods. Th e Committee estimates that
more than 8,500 additional people were informed of the
Tolling Study and Web survey via electronic notifi cations.

10 Columbia River Crossing Tolling Study Committee Report
Outreach Activities and Events
Discussions with Local, Regional and State Elected OfficialsLocal, regional and state leaders were updated regularly about tolling
scenarios and public input. Updates were provided at Project Sponsors
Council meetings in June, September and December. Presentations were
made as requested to boards and councils of partner organizations. Other
local, regional, state and federal elected offi cials received updates in person
or via email. Members of the Project Sponsors Council were invited to
participate in all Tolling Study Committee meetings to hear public input
fi rsthand.
State Transportation CommissionsTh roughout the study, briefi ngs and updates were provided to the
Washington and Oregon commissions. At the beginning of the Tolling
Study, staff briefed the Washington, Oregon and California transportation
commissions during a special three-state commission meeting on July 22,
2009. Th e Oregon Transportation Commission received a presentation in
August 2009. As members of the Tolling Study Committee, the chairs of the
transportation commissions provided an ongoing link between the study and
the commissions in each state.
Outreach to Freight, Business Groups and Large EmployersI-5 is the primary north-south freight corridor on the west coast, connecting
Mexico to Canada. International, national and local businesses often plan
their travel to avoid congestion at the Interstate Bridge between Portland
and Vancouver. Th e ports in both cities also depend on access to I-5 to move
Freight and business groups engaged in the Tolling Study
Battle Ground Chamber of Commerce
Bergstrom Nutrition
Columbia Corridor Association
CRC Freight Working Group
CRC Marine Drive Stakeholder Group
Economic Roundtable
Frito Lay
Green Transfer
Hill International
Independent Dispatch, Inc
Local IBEW
Metro Freight and Goods Movement Task Force
National Association of Women in Construction
North Clackamas Chamber of Commerce
Northwest Pipe
Oregon Association of Minority Entrepreneurs
Oregon Business Association, Transportation Committee
Oregon Highway Users Alliance
Oregon Trucking Association
Pacifi c Continental Bank
Pacifi c Freightways
Parkrose Business Association
Peninsula Truck Lines
Port of Portland
Port of Vancouver
Portland Business Alliance, Transportation Committee
Shaver Transportation
Subaru of America, Inc.
Swan Island Business Association
Uptown Village Association
Urban Entrepreneurs
Vancouver’s Downtown Association
Washington Highway Users Federation
Washington State University Small Business Development Department
Washington State Good Roads and Transportation Annual Conference
West Coast Corridor Coalition
Local agencies provided input and received regular Tolling Study updates at
Project Sponsors Council meetings, a group convened by the governors of both
states to advise the departments of transportation on project development. Th e
group is chaired by citizens of Oregon and Washington and has representatives
from the following agencies:
City of Vancouver•
City of Portland•
C-TRAN•
TriMet•
Metro•
SW Washington Regional Transportation Council•
ODOT•
WSDOT•

11Columbia River Crossing Tolling Study Committee Report
goods to and from their facilities. As important stakeholder interest
groups, freight companies and business groups were specifi cally engaged
in conversations about the Tolling Study.
Two freight and business forums, hosted by the CRC project and the
ports of Portland and Vancouver, were held August 18, 2009. About 80
people attended the events, representing national freight fl eet managers,
local freight companies, small and minority business owners, and business
associations. Support for the project was high and there was widespread
recognition that tolling was needed to build the replacement bridge.
Th e majority of the questions focused on logistical issues that will be
determined closer to implementation of the tolls.
In addition to the freight forums, 17 business associations, chambers of
commerce, and CRC advisory groups were engaged in the Tolling Study.
Th ese groups each have dozens of member businesses and organizations.
Many members of these groups indicated support of tolling as a way
to provide funding for the project and reduce time spent in congestion.
Some employers, such as Legacy Hospital, distributed information to
employees about the online tolling survey.
Owner-Operator Independent Drivers Association (OOIDA) published
a mid-November article about the CRC Tolling Study in Land Line, a
trade publication for professional truckers. A week later, OOIDA posted
information on its Web site for Oregon and Washington members,
urging them to voice their opinion about assumptions that medium and
large trucks would pay higher tolls. In the days following, CRC received
about 30 emails from industry members expressing their opinions on
tolling. Th e majority of them did not support tolling.
Community groups engaged in the Tolling Study
Arnada Neighborhood Association
Bike Me! Vancouver
Bridgeton Neighborhood Association
Clark County Bicycle Advisory Committee
Community Choices
CRC Pedestrian and Bicycle Advisory Committee
East Columbia Neighborhood Association
Ellsworth Springs Neighborhood Association
Esther Short Neighborhood Association
Fruit Valley Neighborhood Association
Hayden Island Manufactured Home Owners and Renters Association
Hayden Island Neighborhood Network (HiNooN)
Hough Neighborhood Association
Kenton Neighborhood Association
Kevanna Park Neighborhood Association
King Neighborhood Association
League of United Latin American Citizens
Neighborhood Associations Council of Clark County
Neighborhood Traffi c Safety Alliance
Northeast Coalition of Neighborhoods
Northfi eld Neighborhood Association
Northwest Association of Environmental Professionals
Northwest Neighborhood Association
Rose Village Neighborhood Association
Shumway Neighborhood Association
Sunnyside United Neighbors Community Planning Organization
Vancouver-Clark Parks and Recreation Advisory Commission
Vancouver Housing Authority, Resident Advisory Board

12 Columbia River Crossing Tolling Study Committee Report
Information about the Tolling Study and online survey was provided to area residents at summer fairs and festivals.
Project Sponsors Council and Tolling Study Committee members heard directly from residents and businesses at summer listening sessions.
Screenshot of the Tolling Study Web site.
Community Organizations and Neighborhood OutreachNeighborhood associations, service agencies and
community groups adjacent to the I-5 and I-205
corridors were contacted about the Tolling Study.
Presentations were held with 30 community groups
between July and December, 2009. Over 500 residents
living near I-5 and I-205 were informed and engaged
at these meetings. Appendix B includes the dates of the
community presentations.
Other members of the public were informed about the
study and engaged in conversation at fairs and festivals
throughout the summer. CRC staff ed informational
booths about the project and the tolling study,
answering questions and taking comments directly
from neighborhood residents. Project staff attended 20
festivals, reaching nearly 1,300 people, during the tolling
study period.
Specifi c eff orts were made to involve low-income,
minority and limited English speaking populations.
Th e Vancouver Housing Authority included an article
about the tolling study in its August newsletter to over
3,000 residents. Th e tolling fact sheet was translated
into Spanish, Vietnamese and Russian and distributed
to social service organizations, churches and local
businesses.
Open Houses, Listening Sessions and Public Committee MeetingsInformation about the Tolling Study, Committee
members and timeline was fi rst presented at two project
open houses at the end of June 2009. Th e Tolling Study
Committee hosted two listening sessions on June 30
and July 1, 2009 to discuss the preliminary scenarios and
fi ndings with the public and receive input. Public input
was also heard at the October 1, and December 7, 2009
Tolling Study Committee meetings. Meeting summaries
can be found in Appendix B.
Web siteA Web site, http://tolling.columbiarivercrossing.org,
was created to communicate with the public. Th e site
was updated regularly and all Tolling Study Committee

13Columbia River Crossing Tolling Study Committee Report
Most online survey respondents live in the Portland -
Vancouver area. Th is map shows zip codes provided that are
closest to the project area.
meeting materials were posted online. A clear link to this
new site was visible on the homepage of the main CRC
Web site. Th e site received 15,238 page views during the
course of the study.
Online SurveyAn online survey was developed to increase awareness
and provide information about tolling terms and
concepts to residents and business owners in the greater
Vancouver-Portland metropolitan area. Th e survey was
advertised with Web banner ads, monthly emails sent by
the CRC project to over 4,000 people, partner agency
Web sites, neighborhood groups and large employers.
CRC and project sponsors also posted links to the survey
on their Web sites. At least 48 diff erent sites posted a
link to the CRC tolling survey or the project’s tolling
Web site.
Th e survey was online from August 18 to October 31,
2009 and over 4,200 people participated.
Input Requested by the LegislationTh e legislation specifi ed that discussions should occur
with bridge users and local residents about the topics
below. Information about these topics was provided
during outreach events, at presentations and as part
of the online survey. Comments and questions were
received throughout the Tolling Study in writing, via
email and in person. Key fi ndings are summarized below
and additional information can be found in the following
section. All written comments received can be found
online and attached to this report on CD Volume 2.
Funding a portion of the Columbia River Crossing
project with tolls
Opinions are mixed about using tolls as a way to
fund the CRC project. People that did not support
tolling as a funding source or did not understand why
tolling would be needed to fund the CRC project
often expressed a belief that their taxes should be
suffi cient to fund transportation projects. Some
meeting attendees expressed frustration that such
an important, national interstate corridor would not
be predominantly funded by federal sources. Others
thought project costs should be reduced to the point
that tolling would not be needed.
When doing outreach presentations to groups
familiar with the project, many attendees seemed to
understand that tolls would be needed to supplement
state and federal sources in order to provide suffi cient
funding to pay for the project. Support for tolling
as a project funding source was expressed by some,
including the freight and business community. Many
expressed understanding that tolls would be needed
to build the project and urged quick action so project
benefi ts could be realized as soon as possible.
Implementing variable tolling as a way to reduce
congestion on the facility
Variable tolling is a new concept to many in the
region. In response, the Committee and staff
provided information in the form of fact sheets, a
Web site, PowerPoint presentations, and the online
survey. For survey respondents, learning more about
how variable tolling could work did not change
attitudes about variable tolling.
Respondents that supported variable tolling on the
corridor typically did so because of its ability to help
manage congestion, in addition to providing funding
for the project.

14 Columbia River Crossing Tolling Study Committee Report
Th ose that did not support variable tolling indicated that it would be
unfair because many bridge users do not have fl exible schedules. Some felt
that variable tolls would not be eff ective at managing congestion because
most people would not change their time of travel. Several people thought
variable tolls would be confusing to drivers and could make it diffi cult to
budget monthly toll expenses for the household.
Tolling I-205 separately as a management tool for the broader state and
regional transportation system
After learning about expected traffi c and funding benefi ts associations
with tolling both bridges, a high number (45.2 percent) of survey
respondents indicated they would strongly oppose tolling I-205.
Other comments received during outreach events and in writing did not
have a clear preference for tolling or not tolling I-205 as a management
tool. People that expressed support for tolling both bridges indicated that
diversion to I-205 would be too high unless both bridges were tolled.
Th ose that did not support tolling I-205 often cited the importance of
having a no-toll option for their trip across the Columbia River.
In addition, questions were received at most outreach events from
residents about the policy setting process and how toll revenue collected
on I-205 might be used.
Online Survey HighlightsTh e survey was posted online from August 18 to October 31, 2009. During
that time, 4,248 people completed all or some of the CRC tolling survey
questions. About half indicated they traveled across the I-5 bridge multiple
times a week and tended to use the I-205 bridge a couple of times a month or
less. More than half of these trips made across the I-5 bridge were by single
occupants in a personal vehicle; about 28 percent were carpool trips with
household members. Traveling to or from work was the most frequent reason
given for using the I-5 bridge (29 percent). Recreational activities (18.4
percent), errands/shopping (16.7 percent) and visiting family or friends (16.8
percent) were the three next most selected reasons.
In addition to demographic questions and questions about current travel
patterns, eight questions in the survey asked specifi cally about electronic
tolling, variable tolling, funding, anticipated travel choices, and tolling I-205.
Responses to these questions are described in the previous section and the
following pie charts. Responses to all survey questions can be found online
and attached to this report on CD Volume 2.

15Columbia River Crossing Tolling Study Committee Report
Tolls on I-5 Columbia River bridge along with state and federal funding, will be used to help replace existing bridge, improve highway, and operate and maintain it into the future. Which of the following do you think tolls on the I-5 Columbia River bridge should be used for? (choose all that apply)
Replacing the bridge and improving the highway
Increasing transit use
Providing incentives to carpool or vanpool
Other (please specify)
Much less likely
Somewhat less likely
No difference
Somewhat more likely
Much more likely
Tolling the I-5 and I-205 bridges over the Columbia River, instead of tolling just the I-5 Columbia River bridge, could result in lower toll rates, more traffic improvements, and less traffic congestion on both the I-5 and I-205 highways. Knowing this, how supportive of tolling both I-5 and I-205 bridges are you? (choose one)
Not at all supportive
Not very supportive
Somewhat supportive
Very supportive
Current technology allows tolls to be collected electronically as vehicles travel across the bridge at regular highway speeds. There will not be toll booths. Knowing this, does this make you more or less likely to support tolling of the I-5 Columbia River bridge? (choose one)

16 Columbia River Crossing Tolling Study Committee Report
Written Comments and QuestionsTh e last question included in the online survey asked for
any additional input for the Tolling Study Committee.
Answers to this question, in addition to other written
comments received are summarized below. Including the
general comments provided via the survey, more than
4,500 comments were received via email, phone or postal
mail during the Tolling Study.
Common comment topics were:
Attitudes about tolling and fi nancing•
Comments expressed an opinion about tolling as a
funding source for the project or included ideas for
other funding sources.
“If tolls are necessary to get a new, better bridge, then do
so.”
“Tolls are a good idea because they reduce traffi c and
raise funds for road improvements.”
“Tolls should not be put on Interstate freeways.”
“Federal taxes and federal stimulus money should pay
for the bridge, not the local residents.”
Tolling Study and process•
Comments responded to the scenario assumptions
about rates for personal vehicles, trucks and other
users, provided opinions about variable tolling, or
commented on the Tolling Study process, outreach
eff orts, the Web survey, or future policy decisions to
be made.
“Please determine the fl at toll needed instead. Th ank you
for the process of public input.”
“I am concerned the 205 bridge use will become heavy
instead of the I-5 bridge.”
“Congestion pricing is a penalty for having a real 8-5
job. It would take me 2.5 hours to ride the MAX from
Delta Park to my job at Orenco Station. Th is is not a
viable option.”
“To gain public acceptance I would propose that tolls
be reasonable and more for large semi-trucks, less for
pickup trucks or cars with trailer…and lowest for cars
by themselves. No charge for motorcycles. I feel the max
toll for (a) car at peak would (be) 2 bucks, trucks 3
bucks max and for semi-trucks, 7 dollars. Suggest a
lower toll be accessed on I-205 roughly half. I would
also suggest taxpayers be told…when a certain amount
of money is in the bridge fund….maybe in 10 years…
then toll would drop but keep some tolls to pay for the
future bridge needs. Also, would add the toll should be
the same going north or south. “
Discounts and equity•
Comments and questions about equity, rebates,
discounts and fairness were heard throughout the
Tolling Study. Some felt that tolling would be most
equitable if all users were asked to pay.
“Service and delivery for small companies should be
exempt from toll.”
“I do not think that people in WA should have to pay
(a) toll if they are required to commute to OR for work
purposes. And vice versa…If it is required for work I
think that monthly/or yearly passes should be available
for a discount.”
“I think tolls should be less for those that are carpooling,
and more for the 80% of trips that are made with one
person in the car.”
“People that live in WA and work in OR shouldn’t have
to pay tolls at all. Let OR take the money out of the
income tax it collects from WA residents.”
“If tolling the I-5 bridge is enacted, all persons using
the bridge should pay a toll including transit, cyclists,
pedestrians, motorcyclists since all are equal users of the
bridge. Th at is the only way I would support tolling.”
Operations•
Some wanted to know how transponders would
work for auto and freight fl eets. Others had
comments about technology, logistics, and
implementation for local and out-of-state bridge
users. A few mentioned concerns about privacy, in
connection to electronic toll collection.
“We ought to be able to purchase a one-time fare at a
facility near the bridge.”

17Columbia River Crossing Tolling Study Committee Report
“If out of state visitors get a bill in the mail, what
is the mechanism for getting them to pay? Are we
discouraging them from visiting our states? Also,
tolls will aff ect visitor experience. Tourism is a huge
economic driver for our region.”
“I have used those electronic tolling devices and they are
painless. Great way to drive and avoid the lines.”
“Are your transponders going to tie in with existing
transponders?”
Th e CRC project • Comments about project elements and the size, scope, schedule, purpose, and cost of the overall project were captured in this category.
“A new bridge is long overdue. Th e bridge should be built to last 100 years and should have at least 12 vehicle lanes.”
“I think the addition of light rail is an excellent choice and will be a great addition to travel into Vancouver.”
“Upgrade existing I-5 bridge for transit, biking and walking and don’t build new bridge.”
Evaluating Toll ScenariosTh e Legislature directed the Committee to study
scenarios that included variable rate tolling on I-5 and
I-205 in order to better understand potential eff ects to
the toll funding contribution and traffi c patterns on I-5
and other transportation corridors in the area.
Th e Committee and staff evaluated six scenarios that
included tolling only I-5 and tolling I-5 and I-205 in the
early summer of 2009. Th ese scenarios were presented
to the public and project sponsors. Additional scenarios
were developed in the fall. For each scenario, tolling
could start in mid-2018 after the project was built, or
during construction in mid-2013. Detailed information
about each scenario can be found in Appendix C.
A three-step approach was used to evaluate the toll
scenarios:
Travel demand modeling: • Forecasts the number of vehicles and people crossing the Columbia River,
the routes they take and their method of travel (auto or transit) for a typical weekday.
Revenue projections:• Forecasts annual toll revenue, toll collection and facility operations and other maintenance costs, and reductions to yield the net revenues available for project fi nancing.
Financial capacity analysis:• Assesses how much project funding can be supported with future tolls by issuing state-backed bonds, and in the case of early tolling of the existing bridge, additional “pay-as-you-go” construction spending. Financial capacity analysis provides the bottom line for the toll funding contribution possible under each scenario, given assumptions about when and how much funding is needed.
More information about the three steps above can be
found in Appendix C.
Assumptions in Toll ScenariosTh e May 2008 Draft EIS includes a tolling scenario
with a variable toll rate. Five additional scenarios were
developed at the start of the Tolling Study. Th ree of these
included diff erent rates on I-5 and two included tolls on
both the I-5 and I-205 bridges. As a result of discussions
with the public and project partners, two scenarios were
removed and six new scenarios were developed and
analyzed in the fall of 2009. All scenarios assumed that
bicyclists, pedestrians and transit vehicles would not pay
the toll.
A “No Toll” project scenario was included in the study
for comparison purposes. Under this scenario, the project
would be built but no toll would be implemented. Th e
scenario is not considered viable as tolls will be needed to
supplement state and federal funds.

18 Columbia River Crossing Tolling Study Committee Report
When would tolling start?Th e new bridge over the Columbia River is expected to
open by mid-2018. Tolling could start at that time, or
earlier, depending upon legislative direction.
Th e option of starting tolling on the existing I-5
bridge during construction could be added to any of
the scenarios below. A mid-2013 tolling start date
could raise up to $330 million in additional direct
construction funding and provide needed funds earlier
in the construction process. Traffi c on the existing bridge
would also be less congested if variable tolls were in place
during construction.
Variables Examined in Toll ScenariosToll scenarios diff ered in their use of a couple key
variables, including:
Variable or fi xed-rate tolls –• All but one of the scenarios assume a variable toll that would be highest during peak hours and lower at all other times. Th e variable toll schedule would be set according to a specifi c schedule. For the fi xed-rate scenario, the toll would remain the same 24 hours a day.
Toll rate ranges –• All but one scenario assumed the time frames shown in Exhibit 1 for the variable toll schedule. Scenario 1D assumed that the toll rates would change more frequently throughout the day. See Appendix C for this information.
Range of Toll Rates EvaluatedToll rates for each of the specifi c scenarios can be found in Appendix C. For the purposes of this analysis and report, all toll rates are reported in year end 2006 dollars, for consistency with the Draft EIS analysis. Tolls are assumed to increase yearly to keep pace with expected infl ation. Th e analysis assumes a future infl ation rate of 2.5 percent per year.
Th e toll amounts shown are for a one-way trip. For the I-5 only toll scenarios, the total round-trip amount would depend on the time of day that a person traveled north and south across the bridge. For the scenarios with both I-5 and I-205 tolled, the total cost would depend on the time of travel southbound, since double the one-way toll was assumed to be collected southbound only for a round-trip.
For the purpose of this analysis, trucks were broken down into two categories: medium trucks and large tractor trailers. Medium trucks would pay two times the rate of a passenger car, and large tractor trailers would pay four times the passenger car rate.
Range of Tolls Analyzed by Time Period (toll amounts are for a one-way trip)
Time of day 2006 dollars 2018 dollars (year of opening)
Midnight to 5 a.m. $1.00 - $3.00 $1.34 - $4.04
5 a.m. to 6 a.m. $1.25 - $4.50 $1.68 - $6.05
6 a.m. to 10 a.m. $1.50 - $6.00 $2.69 - $8.07
10 a.m. to 3 p.m. $1.25 - $4.50 $1.68 - $6.05
3 p.m. to 7 p.m. $1.50 - $6.00 $2.69 - $8.07
7 p.m. to 8 p.m. $1.25 - $4.50 $1.68 - $6.05
8 p.m. to Midnight $1.00 - $3.00 $1.34 - $4.04
Exhibit 1. Toll rates vary within in each range, depending on scenario being considered. Toll rates will not be set as part of
this analysis. Rates will be determined in the future by the state transportation commissions.

19Columbia River Crossing Tolling Study Committee Report
Toll Scenarios Studied
I-5 only Toll ScenariosFor the I-5 only scenarios, tolls would be collected in both
directions of travel over the I-5 Columbia River bridge.
1A. Toll I-5 according to the variable rate assumed
in the project’s Draft EIS – Th is tolling scenario was
studied in the Draft EIS. Rates would be highest during
peak traffi c hours and lower during other times of day.
1B. Toll I-5 at a variable rate lower than assumed in
the Draft EIS – Th is scenario was added after the initial
outreach to better understand eff ects of a lower toll on
funding and traffi c patterns.
1C. Toll I-5 with a fi xed rate toll – Th is scenario was
added after the initial outreach to provide a comparison
to variable tolls. It is the only fi xed rate scenario studied.
A weighted average of the Draft EIS variable toll rates
was used.
1D. Toll I-5 with additional price points – Other
variable toll scenarios were modeled using three diff erent
toll levels that would change based on time of day.
Th is scenario studied a toll rate that would change
more frequently by smaller increments, and is more
representative of how a variable toll would likely be
implemented. It was developed based on questions
received during initial outreach eff orts. Th e variable toll
schedule for 1D includes fi ve diff erent toll levels.
1E. Toll I-5 at 1.5X the variable rate studied in the
Draft EIS – Th is scenario was added after the initial
outreach. Some wondered how incremental changes to
the toll rate might aff ect traffi c patterns and funding.
1F. Toll I-5 at 2X the variable rate studied in the
Draft EIS – One of the initial scenarios, this provided
additional funding and traffi c data.
1G. Toll I-5 at 3X the variable rate studied in the Draft
EIS – Toll rates studied are the highest of the scenarios.
Th is scenario shows that increasing the toll past a certain
point does not result in more funding. At these rates,
less funding is raised than scenario 1F due to increased
diversion. Th is scenario illustrates that tolls as high as 3x the
Draft EIS rate would not work for the corridor, from both a
funding and traffi c perspective.
I-5 and I-205 Toll ScenariosFor the scenarios that modeled tolls on I-5 and I-205,
roundtrip tolls would be collected southbound only.
2A. Toll both bridges according to the variable rate
schedule assumed in the Draft EIS – Th is was one
of the preliminary scenarios. Variable rate schedule
assumptions matched those included in the project’s
Draft EIS.
2B. Toll both bridges at a lower variable rate than
assumed in the Draft EIS – Tolling both bridges would
raise more funding than tolling only I-5. Th is scenario
was developed to see how a lower rate on both bridges
would aff ect traffi c patterns and the funding contribution
from tolls.
2C. Toll both bridges with variable rate; I-205 would
have a lower toll than I-5 during peak hours – Th is
option was developed as part of the second set of
scenarios as a way to evaluate what eff ects a lower toll
on I-205 would have on the transportation system. Th e
toll on I-5 would be the same as the variable rate in the
Draft EIS.

20 Columbia River Crossing Tolling Study Committee Report
Scenarios Analyzed Tolls Collected
Toll Schedule Type
Tolling Start Date
Tolling I-5 Only Scenario 1ADEIS Toll Rate
Each Way Variable Toll Schedule
Mid 2018(FY 2019)
Scenario 1BLower than DEIS Toll Rate
Scenario 1CFlat Toll Rate
Fixed Toll Schedule
Scenario 1DAdditional Price Points
Variable Toll Schedule
Scenario 1E1.5x DEIS Toll Rate
Scenario 1F2x DEIS Toll Rate
Scenario 1G3x DEIS Toll Rate
Pre-Completion Tolling1
DEIS Toll RateEach Way Variable Toll
ScheduleMid 2013(FY 2014)
Tolling I-5 and I-205 Scenario 2ADEIS Toll Rate
Southbound Only2
Variable Toll Schedule
Mid 2018(FY 2019)
Scenario 2BLower than DEIS Toll Rate
Scenario 2CLower I-205 Toll
1 Pre-Completion Tolling to be added to any scenario2 A round-trip toll is collected southbound only
Toll Scenarios at a Glance

21Columbia River Crossing Tolling Study Committee Report
Funding Opportunity and Financial Capacity AnalysisA variety of funding sources will likely be needed to build the project, including federal and state funding sources, combined with funding from tolls.
Funding projections from tolls associated with each of the Tolling Study scenarios are shown in Exhibit 2 below.
For the purposes of this analysis, the new I-5 bridge is
assumed to be substantially completed by mid-2018,
with revenue operations beginning on July 1, 2018
(fi scal year 2019). Toll bond proceeds are assumed to be
received in the middle and latter years of construction to
maximize their funding contribution, and other funding
sources are assumed to cover construction costs in the
initial years. Other project improvements to the highway
and interchanges would continue into 2019, and the
last bonds needed to fund these completion activities
Exhibit 2. Th e funding contribution from tolls is aff ected by the rate schedule and traffi c diversion. Scenario 1G’s higher toll
raises less funds from tolls than Scenario 1F because of increased diversion. Scenarios that include tolls on both bridges have a
higher potential for funding from tolls.
are assumed to be issued after tolling has commenced.
Th e use of toll bonds will increase the total costs paid
during and after construction due to the added interest
and issuance costs. However, these fi nancing costs are
treated separately from the project capital cost during
construction. Increased use of toll bonds will increase
the total costs paid due to added interest and issuance
costs. Th e construction cost does not increase as a result;
rather it adds a fi nancing cost both during and after
construction.
0 $0.5 $1.0 $1.5 $2.0 $2.5 $3.0 $3.5
Funding Contribution from Tolls ─ All Toll Scenarios
Funding Contribution (billions)
Scenario 1ADraft EIS toll
Scenario 1BLower than Draft EIS toll
Scenario 1DAdditional price points $1.53 B$1.22 B
Scenario 1E1.5 x Draft EIS toll $1.43 B $1.84 B
Scenario 1F2 x Draft EIS toll $2.09 B$1.55 B
Scenario 1G3 x Draft EIS toll $1.99 B$1.21 B
Assumes 30 year state-backed debt. Tolling during construction could add up to $330 million to any scenario.
Scenario 2BLower than Draft EIS toll
on both bridges
$2.75 B
$2.08 B
$3.36 B
$2.54 B
Scenario 2CLower toll on I-205
$2.42 B $2.98 B
Scenario 2ADraft EIS toll
on both bridges
$1.13 B $1.43 B
$1.18 B$0.94 B
Scenario 1CFixed rate $1.38 B$1.11 B

22 Columbia River Crossing Tolling Study Committee Report
How Bridge Tolling Affects DiversionTh e collective changes in travel patterns in response to
a toll are referred to as toll diversion. Person-trip toll
diversion can be defi ned in four ways:
Trips that take another route•
Trips that shift mode, including switching to transit • or consolidating into carpools
Trips that change destination•
Trips that travel at a diff erent time of day•
Toll diversion rates are aff ected by many factors,
including how the toll aff ects the overall monetary
and time cost of travel, trip purpose and frequency,
availability and quality of alternate travel routes or
modes, and the socio-economic characteristics of the
travelers. If no reasonable alternate route is available,
many people will continue to make the same trip, at the
same time of day rather than divert to a lower toll period,
change mode, or alter their destination/eliminate the
trip to avoid crossing the river at all. Exhibit 3 shows
how travel patterns would be aff ected by tolls on I-5, as
studied in Scenario 1A.
It is important to note that while a toll on the new
bridge will yield diff erent travel patterns compared
with the same new bridge without a toll, this basis of
comparison may not be meaningful if the project cannot
be funded without the benefi t of tolls.
Highway DiversionFor the I-5 only toll scenarios, the level of route
diversion to I-205 would vary with the toll charged on
I-5 as well as by the time of day. Higher tolls would
cause more route diversion; however, the percentage
rate of diversion tends to be lower during peak periods
when travelers’ willingness to pay tolls may be higher
and/or alternative routes are congested, and thus, time
consuming. In all of the toll scenarios, I-5 bridge traffi c
demand would be lower and I-205 demand higher with
I-5 tolls than without them.
For scenarios that include a toll only on the I-5 bridge,
varying amounts of trips would divert to I-205. In all
Exhibit 3. With a toll on I-5, most drivers would not change
their travel patterns. Some would choose a new destination
or a non-tolled route. Diversion to transit is minimal due
to the already increased ridership associated with project
improvements.
Travel patterns for tolls on I-5 (Scenario 1A)
Travel on I-5(No Change)
82%
Change TripDestination
(Do Not Cross River)
13%Change Route
to I-205
4.5%Change Mode
to Transit
0.5%
cases, year 2030 traffi c levels on the I-5 bridge would be
less than under the No Toll project scenario, while I-205
bridge levels would be higher.
Scenario 1A would divert about 5 percent of the I-5 • bridge’s daily trips to the I-205 bridge compared to the No Toll project scenario.
Th e lowest amount of diversion to I-205 would • result under Scenario 1B, with 3 percent of I-5’s trips diverting to the I-205 bridge.
Th e highest amount of diversion to I-205 would • result under Scenario 1G, with about 14 percent of I-5’s trips diverting to the I-205 bridge.
For scenarios that toll both the I-5 and I-205 bridges,
traffi c levels would be higher on I-5 and lower on
I-205 than if only the I-5 bridge was tolled. However,
compared to the No Toll project scenario, total cross-
river traffi c demand would be less on both the I-5 and
I-205 bridges as many trips would divert to transit or not
be made across the Columbia River.

23Columbia River Crossing Tolling Study Committee Report
Compared to Scenario 1A, Scenario 2C would • increase I-5 bridge daily trips the least – by about 6 percent, while Scenario 2B would increase I-5 bridge daily trips the most – by about 11 percent.
Compared to Scenario 1A, tolling both bridges • would reduce total daily cross-river (I-5 and I-205) trips by about 6 percent to 8 percent. Compared to the No Toll project scenario, tolling both bridges would reduce daily cross-river trips by about 12 to 14 percent.
All scenarios that include a toll only on the I-5 bridge
would result in a higher number of trips on the I-205
bridge than would result under a the No Toll scenario
(from about a 4 percent increase under Scenario 1B to
about a 15 percent increase under Scenario 1G). Most
of the scenarios – with the exception of Scenarios 1E,
1F and 1G – would result in minor levels of traffi c
diversion to I-205 via east-west highways in Vancouver
and in Portland. Th is is due to the existing and predicted
congestion along the key routes connecting to I-205,
including I-84.
Diversion to Transit Th e CRC project extends Portland’s existing light rail
system to Vancouver, signifi cantly increasing transit
access and use by residents. Th e new light rail system
will be optimized with feeder buses and park-and-ride
lots. Prior to adding a toll, I-5 transit person-trips are
expected to increase by 74 percent compared to the No
Build scenario, from 11,600 daily person-trips to 20,200
daily person-trips. Analysis shows the incremental,
additional shift to transit after a toll is added:
Scenario 1A would divert an additional 0.5 percent • of I-5’s daily person trips to transit compared to the No Toll scenario.
For scenarios that toll I-5 only, the lowest amount • of toll diversion to transit would result under Scenario 1B (0.5 percent) and the highest amount under Scenario 1G (1.0 percent).
For scenarios that toll both I-5 and I-205, the • lowest amount of toll diversion to transit would result under Scenario 2B (0.5 percent) and the highest amount under Scenario 2A (1 percent).
Other Types of Trip DiversionWith tolls, some people would choose to change their
destination (i.e., not cross the Columbia River) or to
not make a trip at all. Since the diversion statistics apply
to daily traffi c, reduced frequency trips may also be
included with those not making a trip at all.
Under Scenario 1A, the introduction of the toll • would result in 13 percent of I-5 trips not crossing the river or not being made at all compared to the No Toll project scenario.
For scenarios that toll I-5 only, the lowest amount • of destination diversion and/or trip elimination due to tolls would result under Scenario 1B (about 11 percent) and the highest amount under Scenario 1G (about 46 percent). Note that Scenario 1G is a reference point that assumes the highest tolls tested. Scenario 1F includes lower toll rates (two thirds less) than those in Scenario 1G, but would achieve more funding with less diversion.
For scenarios that toll both the I-5 and I-205 • bridges, the lowest level of destination diversion and/or trip elimination would result under Scenario 2B (23 percent) and the highest amount under Scenario 2A (about 27 percent).

24 Columbia River Crossing Tolling Study Committee Report
0
50,000
100,000
150,000
200,000
250,000
Average Daily Traffic Volumes for Tolling Scenarios
Scenarios
Ave
rage
Num
ber o
f Veh
icle
s(e
stim
ated
for y
ear 2
030)
Scenario 1ADraft EIS toll
No TollNo Build Scenario 1BLower than Draft EIS toll
Scenario 1CFixed rate
Scenario 1DAdditional price points
Scenario 1E1.5 x Draft
EIS toll
Scenario 1F2 x Draft EIS toll
Scenario 1G3 x Draft EIS toll
I-205 Bridge
I-5 Bridge
Scenario 2CLower toll on I-205
Scenario 2BLower than
Draft EIS tollon both bridges
Scenario 2ADraft EIS toll
on both bridges
Average Daily Traffic VolumesDaily and hourly traffi c levels in 2030 would vary for the
I-5 bridge and the I-205 bridge with diff erent tolling
levels. Exhibit 4 shows expected average daily traffi c
volumes for I-5 and I-205 for each scenario. When there
is a toll only on I-5, some trips will divert to I-205, the
non-tolled route. When there is a toll on both bridges,
some trips currently using I-205 would shift to I-5.
In the No Toll project scenario, the I-5 bridge is • projected to carry 220,000 vehicles each weekday and the I-205 bridge is estimated to carry 203,000 vehicles per day.
Under Scenario 1A, I-5 bridge volumes would be • less by about 18 percent (39,000 vehicles), while I-205 bridge volumes would be about 6 percent (13,000 vehicles) greater.
Of scenarios that would toll the I-5 bridge only, • Scenario 1G would reduce I-5 traffi c the most (by 59.5 percent or 131,000 vehicles) and increase I-205 traffi c the greatest (by about 18 percent or 37,000 vehicles) compared to the No Toll project scenario. Scenario 1G would reduce total cross-river trips the most (by about 22 percent or 94,000 vehicles).
Of scenarios that would toll both bridges, Scenario • 2A would reduce cross-river trips the most (by about 11 percent or 48,000 vehicles).
Exhibit 4. Th e average number of daily vehicles crossing I-5 and I-205 would vary with diff erent toll rates.
Bridge Performance

25Columbia River Crossing Tolling Study Committee Report
Hours of CongestionTh e duration of congestion at the I-5 bridge is related
to the level of cross-river traffi c demand. Exhibits 5 and
6 show the duration of congestion expected for each
of the toll scenarios studied. Demand now and in the
future will be greatest southbound in the morning peak
and northbound in the evening peak. For the No Build
scenario, by the year 2030, about 15 hours of congestion
is expected to occur each weekday over the course of the
day (about 7 hours in the southbound direction and
8 hours in the northbound direction). Th e duration and
magnitude of traffi c congestion would be reduced as tolls
decrease the level of cross-river traffi c demand and shift
some trips to uncongested, off -peak times (when the toll
is lower).
0
1
2
3
4
5
6
7
8
9
10
11
12
13
14
15
Hours of Congestion for I-5 Only Tolling Scenarios
Scenarios
Hou
rs o
f Con
gest
ion
Scenario 1ADraft EIS toll
No Build No Toll
15
4.5
7
5 4.754.25
3.5
2.5
1
Scenario 1BLower than Draft EIS toll
Scenario 1CFixed rate
Scenario 1DAdditional price points
Scenario 1E1.5 x Draft
EIS toll
Scenario 1F2 x Draft EIS toll
Scenario 1G3 x Draft EIS toll
Exhibit 5. Without the project, there would be 15 hours of congestion a day in 2030. With tolls on I-5 and project
improvements, congestion would be reduced.
Under Scenario 1A, I-5 bridge congestion would • occur for a total of about 5 hours on a typical weekday in 2030, or 70 percent less hours than the No Build scenario.
Of the scenarios that would toll the I-5 bridge only, • the least amount of I-5 bridge congestion would occur under Scenario 1G, with 1 hour of congested conditions. Th e longest duration of congestion would result with Scenario 1B’s relatively lower tolls, with about 5 hours of weekday traffi c congestion.
For those scenarios that would toll both the I-5 • and the I-205 bridges, the lowest level of I-5 bridge congestion would result under Scenario 2C,with 5 hours of congested conditions. Th e longest duration would result with Scenario 2B, with about 6 hours of congestion.

26 Columbia River Crossing Tolling Study Committee Report
0
1
2
3
4
5
6
7
8
9
10
11
12
13
14
15
Scenario 2CLower toll on I-205
Scenario 2BLower than
Draft EIS tollon both bridges
Scenario 2ADraft EIS toll
on both bridges
Hours of Congestion for I-5 and I-205 Tolling Scenarios
Scenarios
Hou
rs o
f Con
gest
ion
No Build No Toll
15
7
5.55.75
5
Exhibit 6. With tolls on both I-5 and
I-205, the hours of congestion in 2030
on I-5 would be reduced, compared
to the No Build and No Toll project
scenarios.
Today, 135,000 transit, freight and auto trips are delayed by congestion about 6 hours a day.

27Columbia River Crossing Tolling Study Committee Report
Tolling and Traffic Management Technology
Electronic Toll Collection TechnologyTh e Columbia River Crossing will use 100 percent
electronic tolling – no toll booths at all.
Washington State launched its Good to Go! electronic
tolling system in 2007 with the opening of the new
Tacoma Narrows Bridge. Using Good to Go!, most
electronic tolls are collected with a transponder, about
the size of a credit card. Drivers affi x the transponder on
the inside of their cars’ windshields. When driving on a
tolled facility, an overhead antenna reads the transponder,
identifi es the vehicle as being linked to an account,
and deducts the correct toll from a prepaid account.
Automatic replenishment allows drivers to easily manage
accounts by authorizing payments from a credit card or
bank account.
According to the regional traffi c model, the majority of
the trips in this corridor are made by frequent users. As a
result, the analysis assumes that many of these trips will
rely on the transponder technology. Options will exist for
drivers that do not have transponder accounts because
they are infrequent users or may be visiting from out
of town. Th ese vehicles would have their license plate
photographed and drivers could pre- or post-pay (online
or by phone), or be invoiced for the toll by mail. An
additional administrative fee would apply for processing
“pay-by-plate” payments. Signage in the corridor will
direct drivers on how to pay if they do not have an
account.
Transponder technology and license-plate recognizing
cameras are a key component of nearly all modern
tolling facilities around the world. Despite the option
of a toll booth, more than 70 percent of traffi c using
the new Tacoma Narrows Bridge travels non-stop at
highway speeds without stopping at toll booths. During
peak times, the number reaches 85 percent. Likewise,
solo drivers on SR 167 south of Seattle use this same
Good To Go! electronic tolling system to pay for a quicker
trip in the high occupancy toll (HOT) lanes.
WSDOT’s intent is to create one system that allows
drivers to have one account, one customer service
contact, and one statement for all toll transactions at
any facility using Good To Go!. Oregon is also committed
to developing an integrated system and has guidelines
similar to Washington about implementing electronic
tolling systems. A coordinated dual-state eff ort will
ensure all operations work together and all tolling
policies are consistent.
Approximately 70-85 percent of CRC transactions are
expected to be made by Good To Go! account holders or
with pre-paid license plate accounts, with the remaining
bridge users being invoiced for their tolls. By eliminating
toll booths at the facility, several issues are being
addressed, including:
Congestion caused by toll booths. Th ere will be no • need for vehicles to stop or exit the roadway, tolls are collected at normal highway speeds, for smooth-fl owing traffi c.
Toll booth related accidents. Electronic tolling • greatly decreases safety issues related to stop and go traffi c.
Capital costs for right of way and toll plaza • construction. It’s estimated to cost at least $100 to $200 million to install a toll plaza in this developed corridor.
Transponders are the size of a credit card and can be affi xed
to the inside of a vehicle’s windshield.

28 Columbia River Crossing Tolling Study Committee Report
Operating costs. Cash collection is twice as costly as • electronic toll collection
As technology continues to develop, additional
technologies will become available and could make
toll collection even easier and more cost effi cient.
Technologies that may be available for local toll
collection in the future include:
Global positioning system (GPS)-based tolling • technology
Stored-value card for transit, ferries and tolled • facilities
Rental car companies outfi tting rental cars with • transponders or using license plate images to pay tolls for their rental fl eets
Technology continues to evolve in today’s fast-paced
world and WSDOT and ODOT are committed to
bringing the most time-saving and cost-eff ective tolling
technology options to their drivers now and in the
future.
Building Smarter Highways Active traffi c management is the use of high-tech traffi c
tools to make roadways safer and less congested. Th ese
tools provide more accurate real-time information about
what is on the road ahead and help improve traffi c
fl ow. WSDOT and ODOT plan to use these types of
technologies in the CRC corridor to further enhance
traffi c fl ow and introduce low-cost projects that have
high benefi ts for drivers. Th e Committee reiterated
strong support at its December 7, 2009 meeting for the
use of these tools and technologies.
Today’s traffi c management tools and technologies
include:
Real-time information for drivers, such as electronic • driver information signs, traffi c cameras, traffi c centers and online traffi c maps. Hundreds of traffi c cameras and sensors throughout the two states provide real-time information about congestion, alerts and travel times, which reaches drivers through the media, 511 Travel Info, electronic devices, and agency Web sites.
Travel time signs that display estimated travel times • and other traffi c conditions so drivers can take more
Tolling gantries, located over the highway, read transponders
and license plates, without causing drivers to slow down.
control over their commutes and make on-the-road route decisions.
Ramp meters that automatically space vehicles • entering the fl ow of traffi c on the highway. Th ere now are about 150 ramp meters in the Vancouver-Portland metro area.
Incident response teams that clear roads and help • drivers. Four to ten minutes of traffi c congestion can result from every minute a lane remains blocked. Rapid detection of incidents and clearing minimize the impact on congestion, especially during peak periods.
Smarter Roadways TomorrowIn addition to expanding the tools already being
deployed, new techniques are available that allow
WSDOT and ODOT to adapt to constantly changing
highway conditions and respond in the most effi cient
manner. Some of the new active traffi c management
tools include:
Installing overhead signs, which convey variable • speed limits.
Installing lane closures and warning signs, to alert • drivers to slow down or change lanes because of collisions and backups.
Building additional emergency pull off areas for • vehicle breakdowns or collisions, where possible.
Overhead signs alert drivers about collisions and speed limits.
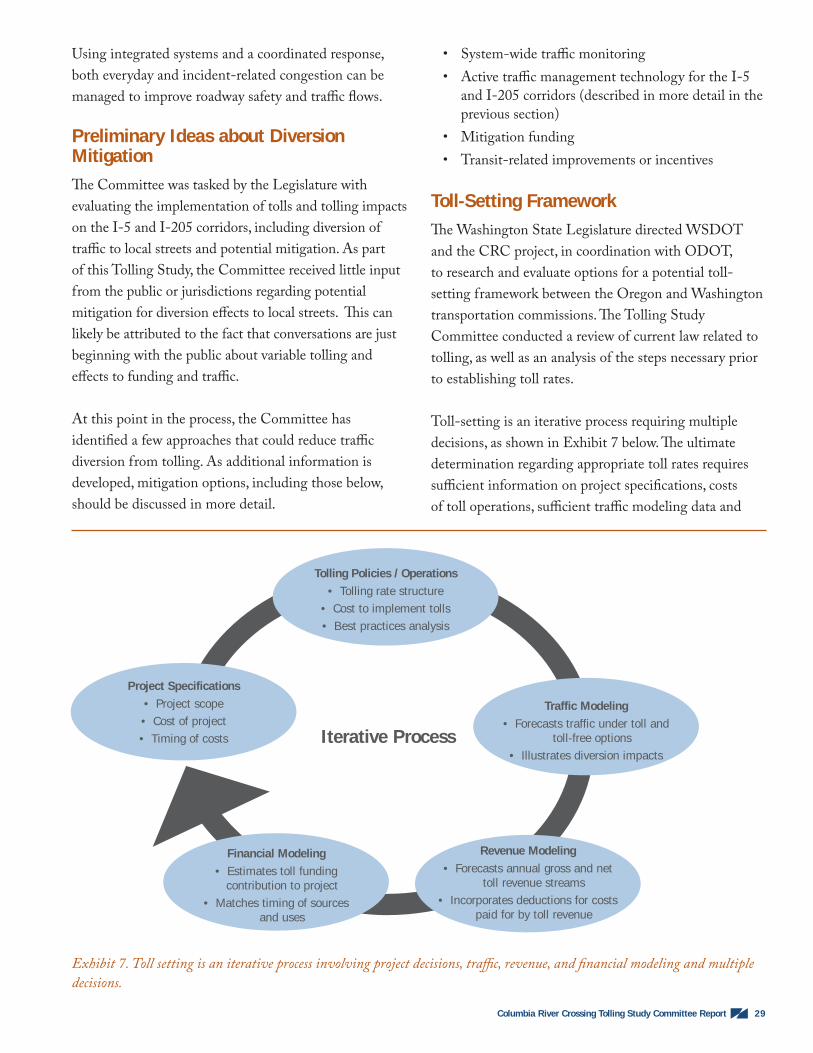
29Columbia River Crossing Tolling Study Committee Report
Using integrated systems and a coordinated response,
both everyday and incident-related congestion can be
managed to improve roadway safety and traffi c fl ows.
Preliminary Ideas about Diversion Mitigation Th e Committee was tasked by the Legislature with
evaluating the implementation of tolls and tolling impacts
on the I-5 and I-205 corridors, including diversion of
traffi c to local streets and potential mitigation. As part
of this Tolling Study, the Committee received little input
from the public or jurisdictions regarding potential
mitigation for diversion eff ects to local streets. Th is can
likely be attributed to the fact that conversations are just
beginning with the public about variable tolling and
eff ects to funding and traffi c.
At this point in the process, the Committee has
identifi ed a few approaches that could reduce traffi c
diversion from tolling. As additional information is
developed, mitigation options, including those below,
should be discussed in more detail.
Exhibit 7. Toll setting is an iterative process involving project decisions, traffi c, revenue, and fi nancial modeling and multiple
decisions.
System-wide traffi c monitoring•
Active traffi c management technology for the I-5 • and I-205 corridors (described in more detail in the previous section)
Mitigation funding •
Transit-related improvements or incentives•
Toll-Setting FrameworkTh e Washington State Legislature directed WSDOT
and the CRC project, in coordination with ODOT,
to research and evaluate options for a potential toll-
setting framework between the Oregon and Washington
transportation commissions. Th e Tolling Study
Committee conducted a review of current law related to
tolling, as well as an analysis of the steps necessary prior
to establishing toll rates.
Toll-setting is an iterative process requiring multiple
decisions, as shown in Exhibit 7 below. Th e ultimate
determination regarding appropriate toll rates requires
suffi cient information on project specifi cations, costs
of toll operations, suffi cient traffi c modeling data and
Tolling Policies / OperationsTolling rate structure•
Cost to implement tolls• Best practices analysis•
Project SpecificationsProject scope• Cost of project• Timing of costs•
Traffic ModelingForecasts traffic under toll and •
toll-free optionsIllustrates diversion impacts•
Financial ModelingEstimates toll funding • contribution to project
Matches timing of sources • and uses
Revenue ModelingForecasts annual gross and net •
toll revenue streamsIncorporates deductions for costs •
paid for by toll revenue
Iterative Process
30 Columbia River Crossing Tolling Study Committee Report
a revenue and fi nancial analysis based upon the traffi c
information. Th e Columbia River Crossing project is in
the initial stages of this process.
After completion of the traffi c, revenue and fi nancial
analysis, federal and state governments will have a
role regarding the decision to toll the I-5 bridge and
potential policy guidance regarding toll rates.
Federal Historically, federal law prohibited toll collection on
Interstate highways. Exceptions have been provided for
facilities that had tolls before they were added to the
Interstate system. Additionally, tolling is permitted on
reconstruction and replacement projects for existing,
non-tolled bridges.
Th e Federal Highway Administration must approve a
tolling agreement on federally-funded state highways
and more recent federal transportation authorization
has established six programs which provide for tolls
on Interstate routes under specifi c circumstances.
Congress is currently renewing and rewriting federal
transportation law, which could change federal tolling
provisions in the future.
State of Oregon Th e Oregon State Legislature granted authority to
the Oregon Transportation Commission to set tolling
policies. Th e Oregon Transportation Commission has
the following responsibilities:
Establish tolls for state tollways after taking into • account certain statutory considerations, including cost of construction, reconstruction, maintaining, repairing and operating the tollway and debt service requirements.
Adopt rules specifying a process for reviewing toll • proposals.
Adopt rules setting standards for electronic • toll collections systems and photo enforcement systems to ensure compatibility with the state of Washington to the extent technology permits.
Set variable tolls depending on time of day and use • of the facility.
Th e Oregon Department of Transportation has the
following responsibilities related to tolling:
Plan, design, construct, reconstruct, operate and • maintain all tollway projects.
Operate and collect tolls on any tollway project • through electronic or manual toll collection.
Use the same transponders as those planned for use • in Washington.
State of Washington In 2008, the Washington State Legislature adopted
a statutory framework to guide decisions regarding
tolling. Th e legislation established the following policy
guidelines regarding tolling decisions:
Washington should use tolling to encourage • eff ective use of the transportation system and provide a source of transportation funding.
Tolling should be used when it can be • demonstrated to contribute a signifi cant portion of the cost of a project that cannot be funded solely with existing sources or optimize the performance of the transportation system.
Tolling should be fairly and equitably applied and • not have signifi cant adverse diversion impacts that cannot be mitigated.
Tolling should consider relevant social equity, • environmental and economic issues, and should be directed at making progress toward the state’s greenhouse gas reduction goals.
Toll rates must be set to meet anticipated funding • obligations. To the extent possible, the toll rates should be set to optimize system performance, recognizing necessary trade-off s to generate revenue.
Tolls on future toll facilities may remain in place • to fund additional capacity, capital rehabilitation, maintenance, management, and operations and to optimize performance of the system.
Additionally, the Legislature adopted specifi c provisions
regarding the responsibilities of the Legislature, the
Transportation Commission and WSDOT related
to tolling. In Washington, only the Legislature may
authorize the imposition of tolls on eligible state toll
facilities.
31Columbia River Crossing Tolling Study Committee Report
Th e Washington State Transportation Commission has
the following responsibilities:
Sets toll rates and considers state policy guidelines • in determining toll rates.
Establishes appropriate exemptions.•
Reviews toll collection policies, toll operations • policies, and toll revenue expenditures on the eligible toll facilities.
Ensures that toll rates will generate revenues • suffi cient to meet operating costs of the eligible toll facilities and meet obligations for the timely payment of debt service on the bonds.
Th e Washington State Department of Transportation
must undertake the following activities:
Plan, analyze and construct toll bridges and other • toll facilities.
Utilize and administer toll collection systems that • are simplifi ed, unifi ed and interoperable.
To the extent practicable, avoid the use of toll • booths.
Set statewide standards and protocols for all toll • facilities within the state.
Next Steps
Project DevelopmentTraffi c and revenue work must continue to establish a
fi nancial plan to support the project. Th e Final EIS is
expected in the summer of 2010. Th is document will
contain more details on fi nancial scenarios and ranges of
funding contributions. Th e fi nance plan will be further
developed over the next two years as the project’s scope,
budget and funding sources are refi ned. Th e federal
Record of Decision is expected in late 2010, following
the Final EIS. Th e earliest construction could start is
2012 and the new bridge is expected to open by 2018.
Bi-State Toll-Setting FrameworkIn Washington, clear statutory authorization of tolling is
required. Additionally, the two states must determine the
appropriate structure for the issuance of debt and which
state will provide the authorization to purchase bonds
that will be supported by toll revenue.
Th e two transportation commissions must determine the
appropriate method for setting toll rates on a bi-state
facility. Th at analysis must not only involve a discussion
of the appropriate rate-setting structure, but also
whether exemptions would be appropriate. Additional
collaboration between the departments of transportation
and transportation commissions will be necessary to
establish the appropriate framework.
Public EngagementCRC will continue its extensive outreach and public
involvement program as project development, fi nancial
planning and the toll setting process move forward. A
statistically valid survey is expected after project designs
and costs are further refi ned. Information about project
activities will be provided online, in print and at public
meetings and open houses. Community advisory groups
will continue to meet to advance specifi c aspects of the
project. Public comments will continue to be encouraged
and accepted, about tolling and all other aspects of the
project, at anytime.

32 Columbia River Crossing Tolling Study Committee Report
Appendices (attached on CD)
Volume 1A: Legislation – ESSB 5352
B: Outreach Events and Materials
C: Travel Demand Modeling, Revenue Forecasting
and Financial Analysis
Volume 2D: Tolling Comments
• Public comments (email, letter, phone)
• Survey responses
AMERICANS WITH DISABILITIES ACT (ADA) INFORMATION Materials can be provided in alternative formats: large print, Braille, cassette tape, or on computer disk for people with disabilities by calling the Office of Equal Opportunity (OEO) at (360) 705-7097. Persons who are deaf or hard of hearing may contact OEO through the Washington Relay Service at 7-1-1.
TITLE VI NOTICE TO PUBLIC It is the Washington State Department of Transportation’s (WSDOT) policy to assure that no person shall, on the grounds of race, color, national origin and sex, as provided by Title VI of the Civil Rights Act of 1964, be excluded from participation in, be denied the benefits of, or be otherwise discriminated against under any of its federally funded programs and activities. For language interpretation services, please contact the project office at (866) 396-2726. Any person who believes his/her Title VI protection has been violated, may file a complaint with WSDOT’s Office of Equal Opportunity (OEO). For Title VI complaint forms and advice, please contact OEO’s Title VI Coordinator at (360) 705-7098.
Columbia River Crossing Tolling Study Committee Report to the Legislatures

SR 520 Bridge Investment Grade Traffic and Revenue Study
Floating Bridge and Eastside Project
August 29, 2011 i
TABLE OF CONTENTS
PAGE
Executive Summary ES-1
Project Description ES-1
Study Approach ES-3
Travel Survey ES-3
Stated Preference Survey ES-4
Economic Growth Review ES-4
Tolling Operations ES-5
Traffic and Gross Revenue Modeling Approach ES-6
Major Assumptions ES-7
Traffic and Gross Revenue Results ES-9
Sensitivity Tests ES-11
Regional Growth ES-12
Value of Time ES-12
Account Based Participation Rate ES-13
Motor Fuel Cost ES-14
Trip Suppression and Mode Shift ES-14
Possible Tolling of the I-90 Bridge ES-14
Chapter 1 – Introduction 1-1
Project Description 1-2
General 1-2
SR 520 Long Term Plan 1-3
SR 520 Tolling Project 1-4
Assumed Tolling Periods 1-5
Lake Washington Urban Partnership Agreement 1-6
Tolling Studies and Authority 1-7
SR 520 Overall Context as a Toll Facility 1-7
WSA Scope of Work 1-8
Travel Patterns Survey 1-9
Travel Time Survey 1-9
Stated Preference Survey 1-9
Tolling Analysis Model Development 1-9
Independent Corridor Growth Analysis 1-10
Traffic and Revenue Analysis 1-10
Sensitivity Tests 1-11
Report Structure 1-12

SR 520 Bridge Investment Grade Traffic and Revenue Study
Floating Bridge and Eastside Project
August 29, 2011 ii
TABLE OF CONTENTS (CONT’D)
PAGE
Chapter 2 – Existing Traffic Conditions 2-1 Existing Highway System 2-1
Major Routes 2-1
Description of Major Routes 2-2
Special Lane Configurations 2-5
Speed Limits 2-5
Traffic Trends & Variations 2-6
Data Sources 2-6
Annual Average Daily Traffic 2-7
Historical Traffic Trends 2-7
Average Weekday Traffic 2-8
Traffic Variations 2-8
Seasonal/Monthly Variations 2-9
Day-of-Week/Daily Variations 2-10
Hourly Variations 2-10
Percentage of Traffic by Time Period 2-12
WSA Supplemental Counts 2-12
Vehicle Classification Counts 2-14
Travel Time & Speed 2-15
Route Travel Times 2-16
Travel Speeds on East-West Routes 2-17
Existing Transit Services in the Study Area 2-19
Bus Routes Operating on SR 520 Bridge 2-20
Travel Pattern Surveys 2-22
Methodology and Procedures 2-22
Time Period of Trip 2-23
Trip Purpose 2-23
Frequency 2-23
Vehicle Class 2-23
Trip Origins and Destinations 2-24

SR 520 Bridge Investment Grade Traffic and Revenue Study
Floating Bridge and Eastside Project
August 29, 2011 iii
TABLE OF CONTENTS (CONT’D)
PAGE
Chapter 3 – Stated Preference Survey 3-1
Survey Approach 3-2
Survey Questionnaire 3-2
Screening and Revealed Preference Questions 3-2
Stated Preference Questions 3-3
Debrief and Opinion Questions 3-5
Demographic Questions 3-6
Survey Administration 3-6
Survey Results 3-6
Revealed Preference and Demographic Results 3-7
Stated Preference Results 3-8
Value of Time 3-9
Trip Suppression, Shifts to Transit, and Changes in Trip Timing 3-15
Conclusions 3-17
Chapter 4 – Economic Growth Review 4-1
Introduction 4-1
Regional Development Patterns Context 4-2
Methodology 4-3
Regional Level Baseline Scenario 4-4
Other Socioeconomic Trends 4-7
Development of Sub-Regional Level Estimates and Forecasts 4-8
2010 Base Year Traffic Analysis Zone Estimates 4-9
Baseline Scenario Traffic Analysis Zone Forecasts (2010-2040) 4-10
Alternative Scenarios 4-11
Additional Forecast Reviews 4-13
Vehicle Miles of Travel Law 4-14
Conclusions 4-15

SR 520 Bridge Investment Grade Traffic and Revenue Study
Floating Bridge and Eastside Project
August 29, 2011 iv
TABLE OF CONTENTS (CONT’D)
PAGE
Chapter 5 – Tolling Operations 5-1
Data Sources 5-2
SR 520 Toll Collection System Summary 5-2
SR 520 Payment Types 5-3
SR 520 Vehicle Classification and Exemptions 5-5
SR 520 Marketing Activities and Incentives 5-6
Transponder Sales Information 5-7
Preliminary Estimates of Payment Market Shares 5-8
Chapter 6 – Traffic and Revenue Approach 6-1
Analytical Methodology 6-1
Primary Inputs 6-3
Major Components of Travel Model 6-3
Trip Tables 6-3
Highway Networks 6-4
Traffic Analysis Zone System 6-6
Value of Time 6-6
Vehicle Operating Cost 6-7
Tolling Analysis Model 6-8
Model Development 6-8
Model Structure 6-9
Model Calibration 6-11
Estimated Traffic 6-11
Travel Time Calibration 6-11
Toll Structure 6-13
Vehicle Classes 6-13
Toll Payment Methods 6-14
Estimated Market Share by Payment Types 6-14
Toll Sensitivity 6-15
Toll Rates 6-16
Major Assumptions 6-17

SR 520 Bridge Investment Grade Traffic and Revenue Study
Floating Bridge and Eastside Project
August 29, 2011 v
TABLE OF CONTENTS (CONT’D)
PAGE NUMBER
Chapter 7 – Traffic & Gross Revenue 7-1
Estimated Daily Traffic & Revenue 7-1
Weekday Traffic 7-1
Weekday Revenue 7-3
Estimated Annual Traffic & Gross Revenue 7-4
Annualization Method 7-4
Ramp-up 7-5
Construction Impacts 7-6
Results 7-6
Additional Notes on Results 7-11
Chapter 8 – Sensitivity Tests 8-1
Sensitivity Tests Assumptions and Results 8-2
Regional Growth 8-2
Value of Time 8-3
Account-Based Participation Rate 8-3
Motor Fuel Cost 8-4
Trip Suppression and Mode Shift 8-4
Possible Tolling of the I-90 Bridge 8-5
Disclaimer