Project Completion Reports: A Review of Findings from ... report is accordingly based on a...
42
1 PROJECT COMPLETION REPORTS: A Review of Findings from projects Approved between 1986 and 1999 by Arthur Fagan, Andrew Felton, Iain Murray and Dale Poad reports EVALUATION REPORT EV637 November 2001
Transcript of Project Completion Reports: A Review of Findings from ... report is accordingly based on a...

1
PROJECT COMPLETION REPORTS:
A Review of Findingsfrom
projects Approvedbetween 1986 and 1999
byArthur Fagan, Andrew Felton,
Iain Murray and Dale Poad
rep
ort
sEVALUATION REPORT EV637
November 2001
Project Completion Reports Table of Contents
CONTENTS
Preface iAbbreviations and Note iii
INTRODUCTION 1
Analysis of Results 3
DIAGRAMS:
Figure 1 Distribution of Project Size 4
Figure 2 Average Project Size, by Region 5
Figure 3 Time Management Performance 6
Figure 4 Expenditure Management Performance 6
Figure 5 Delivery of Project Inputs (Donor and Overseas Partners) 7
Figure 6 Delivery of Project Outputs 8
Figure 7 Expected Achievement of Project Purpose 9
Figure 8 Relationship between Achievement of Purpose 10
and Expenditure Management
Figure 9 Expected Achievement of Project Goal 11
Appendix A: Main Data Tables (1-3) 13
Appendix B: Other Statistical Tables (4-15) 17
Appendix C: The original PCR Form used for data covered 25
by this analysis
Appendix D: The Current PCR Form, introduced in July 1999 31


i
Project Completion Reports Preface
PREFACE
This review is an analysis of the findings of a collection of 716 Project Completion Reports (PCRs)prepared by project managers and received over the last six years. It is effectively an update of thereport issued in August 1999, which covered 617 reports.
The main purpose of a PCR is to provide an assessment of the effectiveness of a project’simplementation. It also provides an early estimate of project impact, as well as helping to identifyprojects that may be suitable for future ex post evaluation.
This study was undertaken by the following members of Evaluation Department -
• Arthur Fagan, Programme Manager• Andrew Felton, Research Officer• Iain Murray, Deputy Programme Manager• Dale Poad, Deputy Programme Manager
and involved the following stages:
- analysis of relevant PCRs;
- preparation of a draft report;
- a meeting of DFID Portfolio Review Committee to consider the findings and their - possible implications for DFID’s current and future programmes;
- agreement on the final report for publication.

ii
iii
Project Completion Reports Abbreviations and Acronyms
ABBREVIATIONS AND ACRONYMS
DFID Department for International Development
EvD Evaluation Department
ODA Overseas Development Administration
PCR Project Completion Report
IMPORTANT NOTE
The former Overseas Development Administration (ODA) became the Department forInternational Development (DFID) in May 1997. Although for convenience theacronym DFID has been used throughout the review, it should be remembered that anumber of the projects covered were operational almost entirely within the period ofthe ODA’s existence.
Evaluation Department
November 2001

1
Project Completion Reports Introduction
Summary
PCRs cannot provide a comprehensive picture of changes in apparent project performance overtime, and any analysis of them must be interpreted with caution.
A comparison of the performance ratings awarded in PCRs completed on projects approvedduring four periods (1986-89, 1990-91, 1992-93 and 1994-1999) suggests, roughly in line withthe previous report, that in most respects there has been a steady overall improvement, albeitwith some checks and particularly regional variation. Although it is difficult to attribute thisimprovement to any one factor, especially when the external environment can be so variable, thefindings suggest that refinements to project management procedures over the years have had abeneficial effect.
Introduction
1. The purpose of this review is to highlight the main trends in performance of DFID’s projects overtime through an examination of data provided in PCRs. It is the seventh review Evaluation Departmenthas undertaken of DFID PCRs, and effectively updates the sixth, similarly-structured report produced inAugust 1999. Analysis of PCRs is just one of a number of other systems being developed by DFID tomonitor and report on the performance of our portfolio.
2. PCRs are designed to provide both assessments of experience of project implementation andforecasts of expected success in achieving stated project objectives. They also provide one means ofidentifying projects suitable for subsequent evaluation. A PCR is required for every geographical bilateralproject with expenditure of £500,000 or greater; below this level of expenditure and for sectoral projectsor multilateral aid, they are optional. PCRs become due once disbursement of allocated funds reaches95%. In contrast with ex post evaluation studies, which are undertaken by independent consultants,preparation of PCRs is a project management function and reports are usually completed by the projectmanager in the relevant geographical department or overseas office. Thus, PCR authors may be ratingprojects in which they or, where staff have moved on, their immediate predecessors were directly involved.Completed PCRs are submitted to Evaluation Department which examines them closely for internalconsistency and overall quality before accepting them.
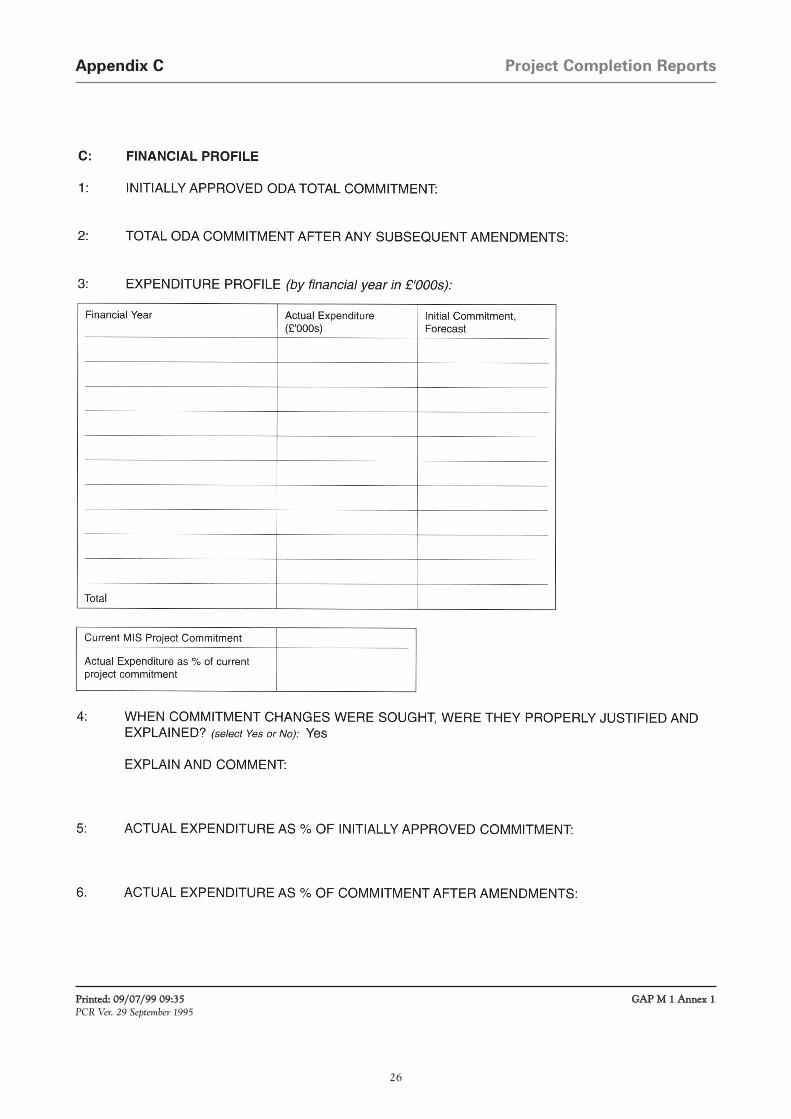
3. The format used for all the PCRs covered by this review is shown in Appendix C. However, witheffect from 1 July 1999 a revised and simplified PCR form came into use, this is shown in Appendix D.

Project Completion ReportsIntroduction
2
4. This review follows the new format and approach introduced in the December 1998 report, themain features of which vis- -vis previous practice are as follows:-
• PCRs are analysed by year of project approval rather than year of completion, which enablesus better to gauge how far changes in DFID’s operating procedures may have brought aboutcorresponding improvements in project management and overall success.
• The analysis covers virtually all PCRs incorporated into DFID’s Management InformationSystems database since the latter was set up, although in this case projects approved before1986 are excluded.
• Where prepared, PCR’s for projects of less than £500,000 are now included. The analysisexcludes one exceptionally large project1 which would otherwise distort the expenditure dataunduly.
• Wherever possible presentation is graphical or diagrammatic rather than tabular, with theminimum of commentary.
• No analysis is made of lessons learned. This partly reflects the size of the task of synthesisingentries of very varying length and quality from many hundred PCRs, and partly the proven,more general difficulty of extracting lessons of substance and value even from small numbers.At the same time the potential of the PCR system as a source of useful lessons is considerableand consideration is being given to integrating PCR data with other project monitoringinformation into DFID’s new Performance Reporting Information System for Management(PRISM)2.
For now we intend to follow this format in future analyses, adding each year’s data to the existingpopulation.
5. This report is accordingly based on a population of 716 PCRs which together
account for some £2.08 billion of expenditure. The projects covered by the PCRs were approvedbetween 1986 and 1999. But it should be noted that by no means all past projects over the £1/2mthreshold are covered by PCRs. This is partly because some categories of expenditure create practicaldifficulties for completion reporting and partly because compliance with reporting requirements has oftenbeen low. It is believed that incorporating report production within PRISM will go a long way towardsobviating these problems, with programme personnel assuming direct responsibility for a greatlysimplified process while gaining a vastly improved capability to analysis PCRs across all sectors andcountries.
6. An appreciable proportion of PCRs (7.4% by number, 25.2% by value) relate to Programme Aidinterventions, which are usually of shorter duration and often of higher value than the normal run ofprojects; where their inclusion in the analysis was found to affect the results appreciably, the material hasbeen disaggregated to make this clear.
1 This project is the Hindustan Zinc Mining and Smelting Complex, India (approved 1987). Expenditure on the project amounted to £84m andthe PCR shows the project to have been largely unsuccessful in achieving its objectives.
2 A centralised portfolio database intended, among other things, as a means of facilitating effective dissemination of the lessons of experiencethroughout the organisation.

3
Project Completion Reports Introduction
7. As in the more recent studies, the analysis has been undertaken mainly on an aggregated basis. Keytrends by region have been drawn out. No formal analysis by sector has been included as the sample cellsizes often become too small to provide a reliable guide; but some raw data is provided in thesupplementary statistical breakdown presented in Appendix B, Tables 4-15. Judgements of success aremade on the basis of a rating scale of five - highly successful, successful, partially successful,largely unsuccessful and wholly unsuccessful. A positive performance is assumed if either of thetop two ratings is assigned. The middle, partially successful rating is considered ambiguous, and hastherefore been ignored in successive PCR analyses, including this one. For more details on ratings, see theform at Appendix C.
Analysis of Results
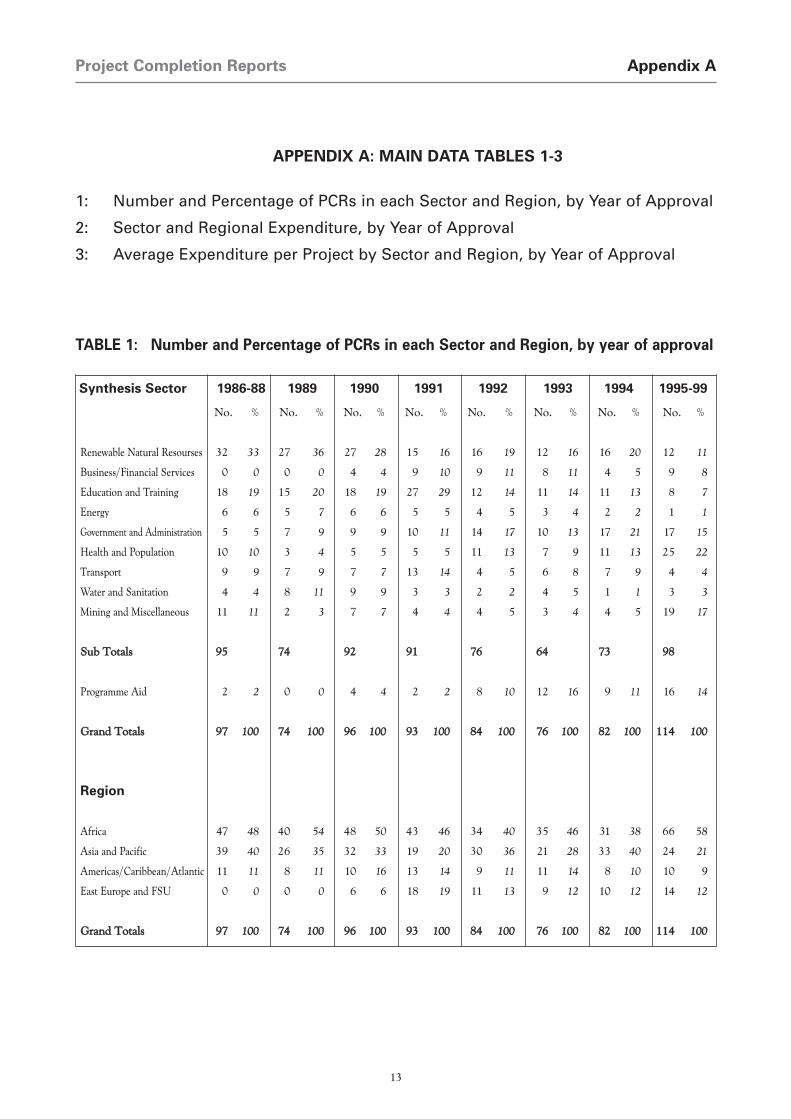
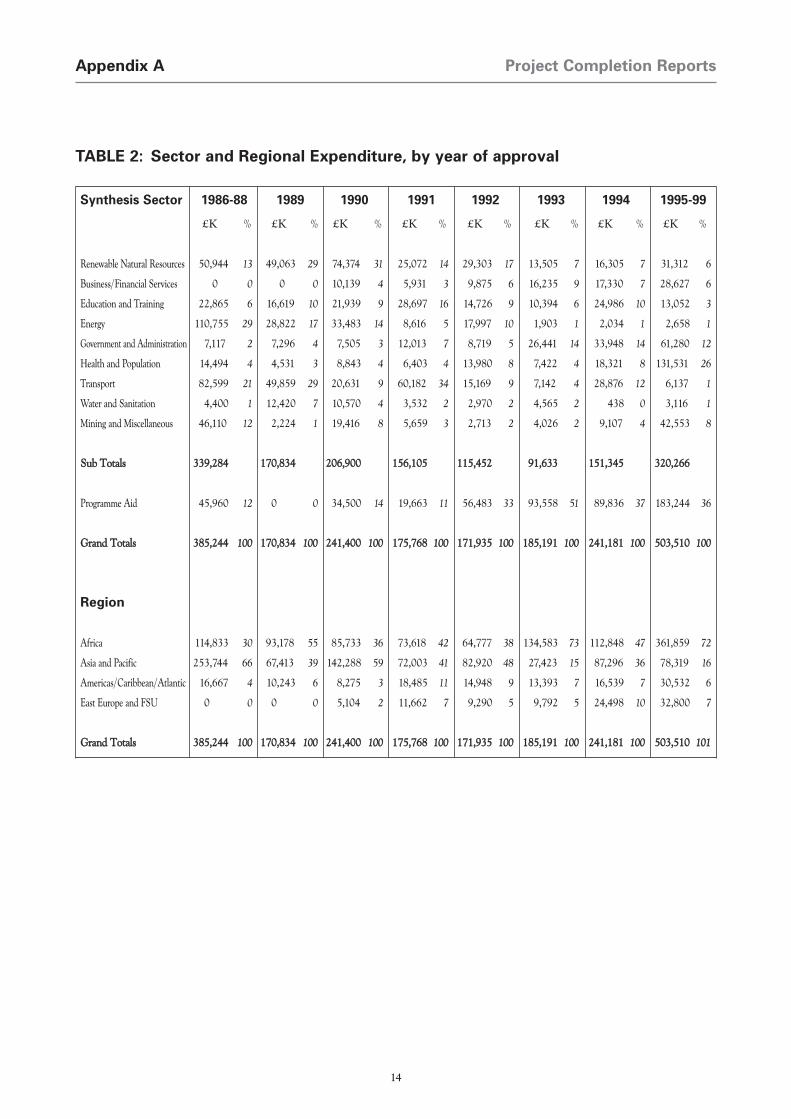
8. The basic data on the population of PCRs covered by this report are presented in Appendix A.These show, on a year of approval basis and subdivided by sector and region, the distribution of the PCRson three bases:
• number;
• corresponding total project expenditure; and
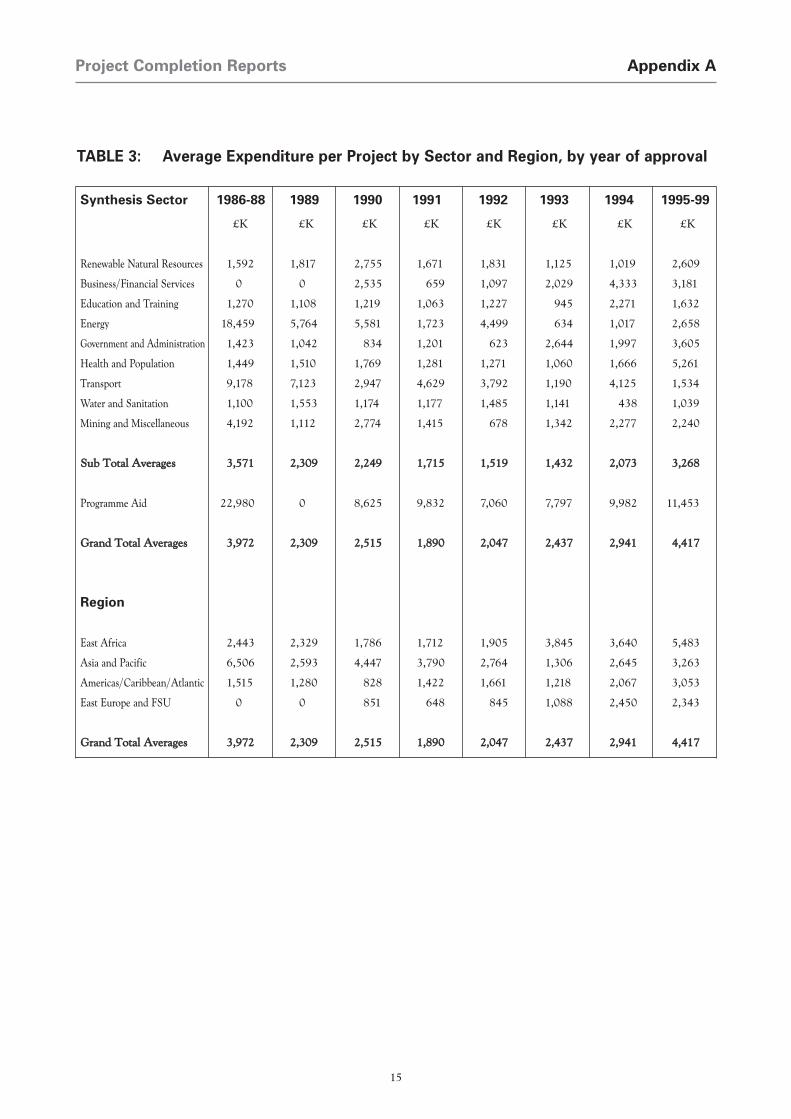
• corresponding average project expenditure.
The data are presented in both absolute and percentage terms, and in current prices. For theapproval year periods 1986-89 and 1995-99. Data are aggregated partly to avoid inconvenientlylarge tables; but for the period 1986-89 it was also assumed that there is now less managementinterest in a detailed breakdown, given the extensive procedural changes introduced in the 1990s,while from 1995 onwards an increasing number of projects approved have yet to run their fullcourse and be reported on, with consequently progressively smaller annual samples as well as a biastowards shorter projects.
9. The data are, as previously, further aggregated for the analysis covered by subsequent paragraphsand the associated diagrams. Findings are compared for four approval periods - 1986-1989 (170 PCRs),1990-1991 (189), 1992-1993 (160), and 1994-99 (197). These groupings avoid excessive disparitiesbetween the sizes of the populations compared.
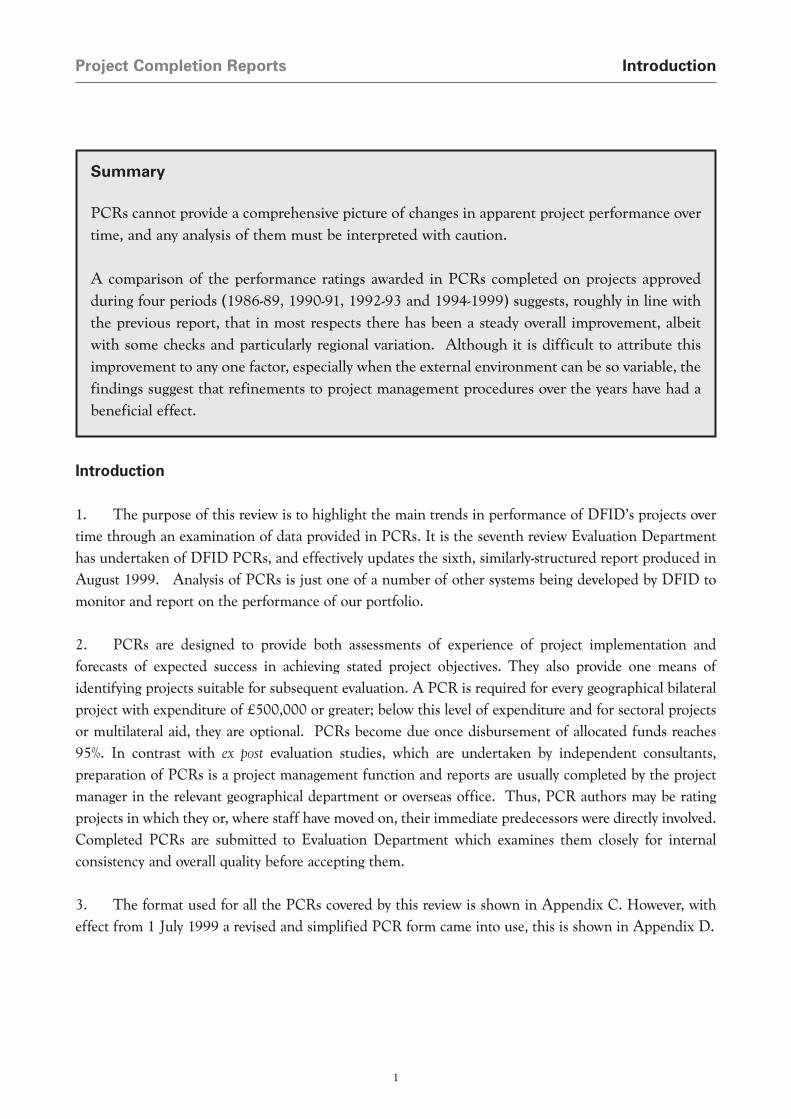
10. Figure 1 and figure 2 (P9 and 10) confirm earlier evidence of appreciable changes in the sectoral
balance, for example declines in the proportional numbers of Natural Resources, Energy,Education/Training and Water/Sanitation projects, and a predictable increase in Programme Aid.
Project Completion ReportsAnalysis of Results
4
Distribution of project size during 1986-89
<£499K
£500-999K
£1,000-2,499K
£2,500-4,999K
>£5,000K
Distribution of project size during 1990-91
<£499K
£500-999K
£1,000-2,499K
£2,500-4,999K
>£5,000K
Distribution of project size during 1992-93
<£499K
£500-999K
£1,000-2,499K
£2,500-4,999K
>£5,000K
Distribution of project size during 1994-99
<£499K
£500-999K
£1,000-2,499K
£2,500-4,999K
>£5,000K
Project Size
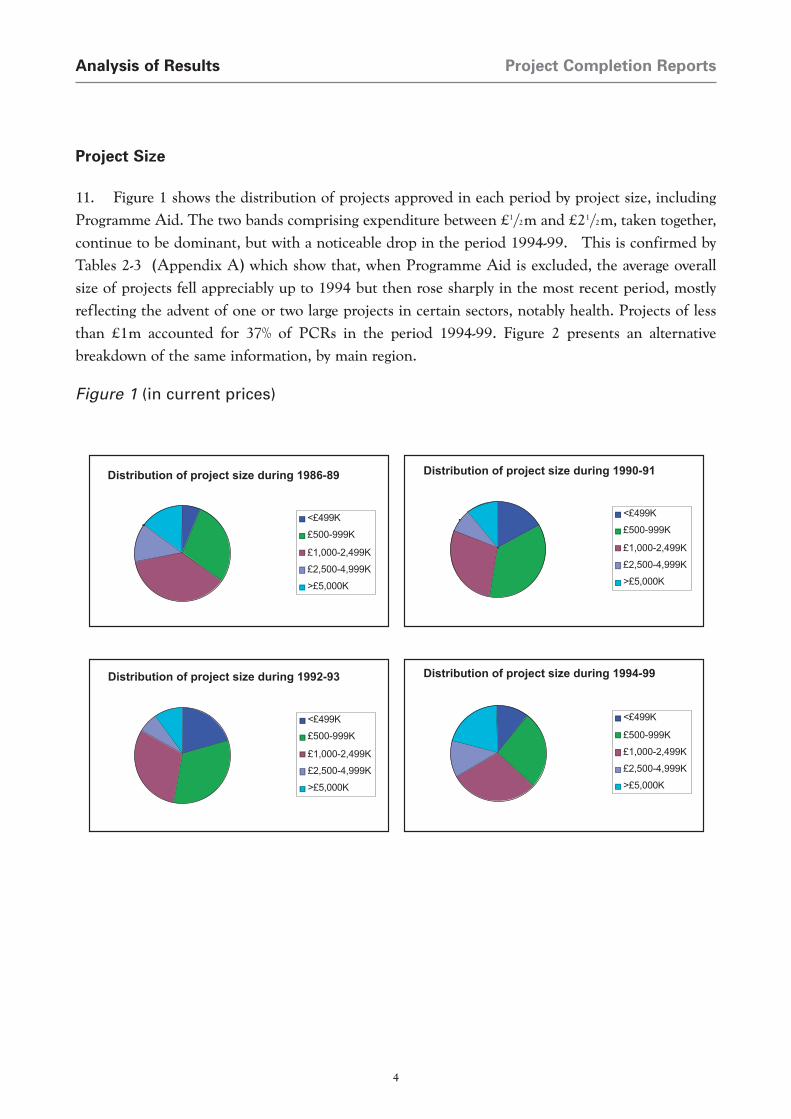
11. Figure 1 shows the distribution of projects approved in each period by project size, includingProgramme Aid. The two bands comprising expenditure between £1/2m and £21/2m, taken together,continue to be dominant, but with a noticeable drop in the period 1994-99. This is confirmed byTables 2-3 (Appendix A) which show that, when Programme Aid is excluded, the average overallsize of projects fell appreciably up to 1994 but then rose sharply in the most recent period, mostlyreflecting the advent of one or two large projects in certain sectors, notably health. Projects of lessthan £1m accounted for 37% of PCRs in the period 1994-99. Figure 2 presents an alternativebreakdown of the same information, by main region.
Figure 1 (in current prices)
5
Project Completion Reports Analysis of Results
12. There is virtually no correlation between project performance and project size. This includesprojects below the £0.5 million PCR threshold, where completion of the forms is discretionary.
Africa
0
1
2
3
4
5
6
7
1986-89 1990-91 1992-93 1994-99
Year of Approval
£m
Asia
0
1
2
3
4
5
6
7
1986-89 1990-91 1992-93 1994-99
Year of Approval
£m
Americas/Carib/Atlantic
0
1
2
3
4
5
6
7
1986-89 1990-91 1992-93 1994-99
Year of Approval
£m
Europe/FSU
0
1
2
3
4
5
6
7
1986-89 1990-91 1992-93 1994-99
Year of Approval
£m
Figure 2 Average Value of Projects for which PCRs were available (current prices)
Project Completion ReportsAnalysis of Results
6
Time Management: Proportion of projects within each of three categories categories (see
0
10
20
30
40
50
60
70
80
90
100
1986-89 1990-91 1992-93 1994-99 Year of Approval
Under-run
Within 10% of planned
Over-run
% o
f P
CR
s
Expenditure Management: Proportion of projects within each of three categories (see key)
0
10
20
30
40
50
60
70
80
90
100
1986-89 1990-91 1992-93 1994-99Year of Approval
% o
f P
CR
s
Under-run
Within10% ofplanned
Over-run
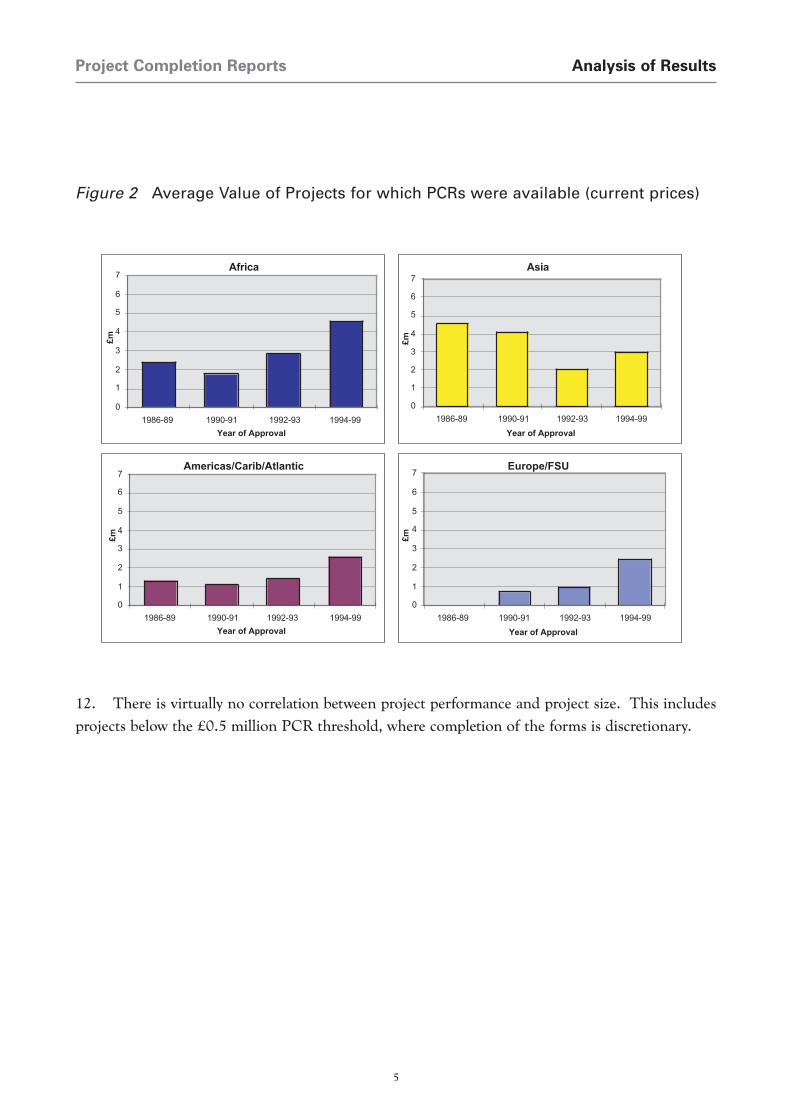
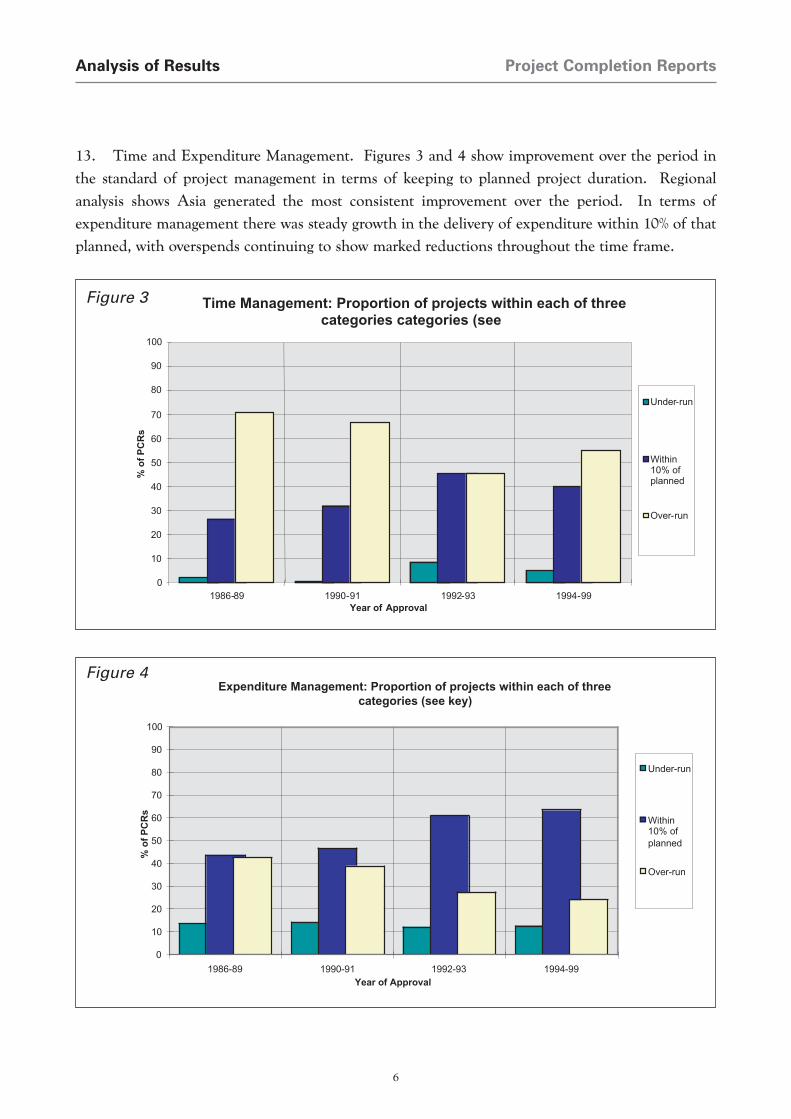
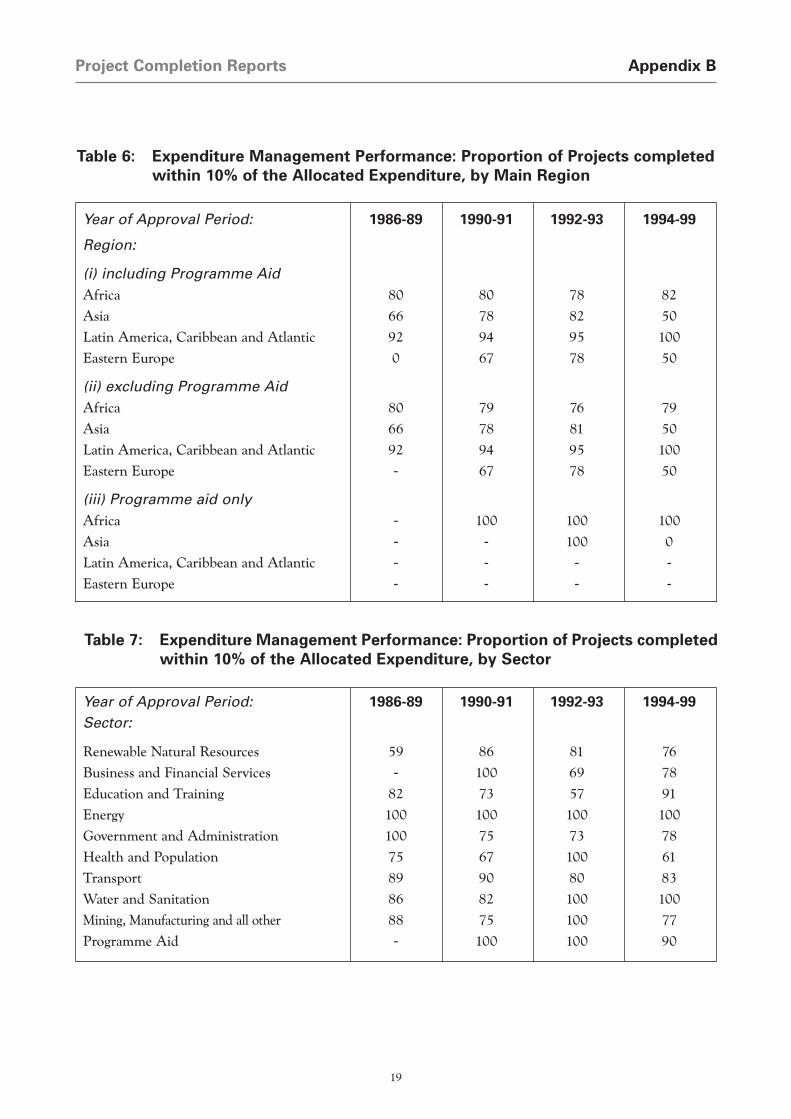
13. Time and Expenditure Management. Figures 3 and 4 show improvement over the period inthe standard of project management in terms of keeping to planned project duration. Regionalanalysis shows Asia generated the most consistent improvement over the period. In terms ofexpenditure management there was steady growth in the delivery of expenditure within 10% of thatplanned, with overspends continuing to show marked reductions throughout the time frame.
Figure 3
Figure 4
7
Project Completion Reports Analysis of Results
Input Ratings: Donor and Partner (see key)
0
10
20
30
40
50
60
70
80
90
100
1986-89 1990-91 1992-93 1994-99
Year of Approval
% S
atis
fact
ory
Donor
Partner
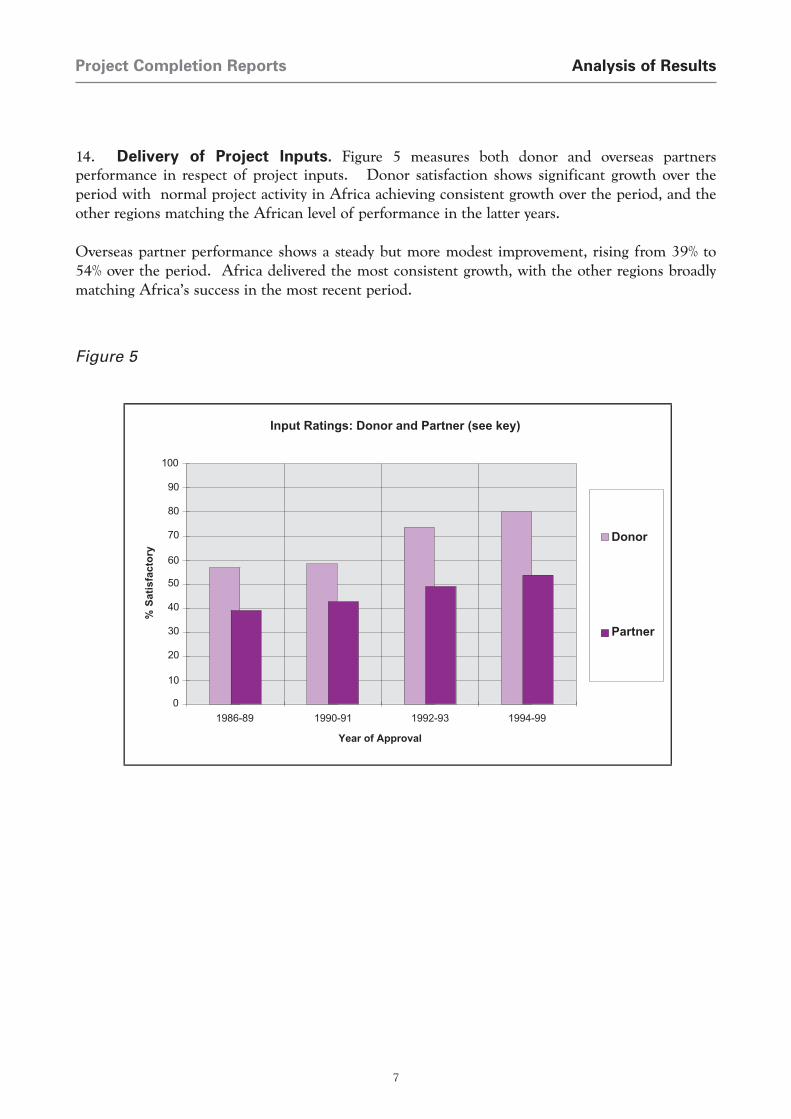
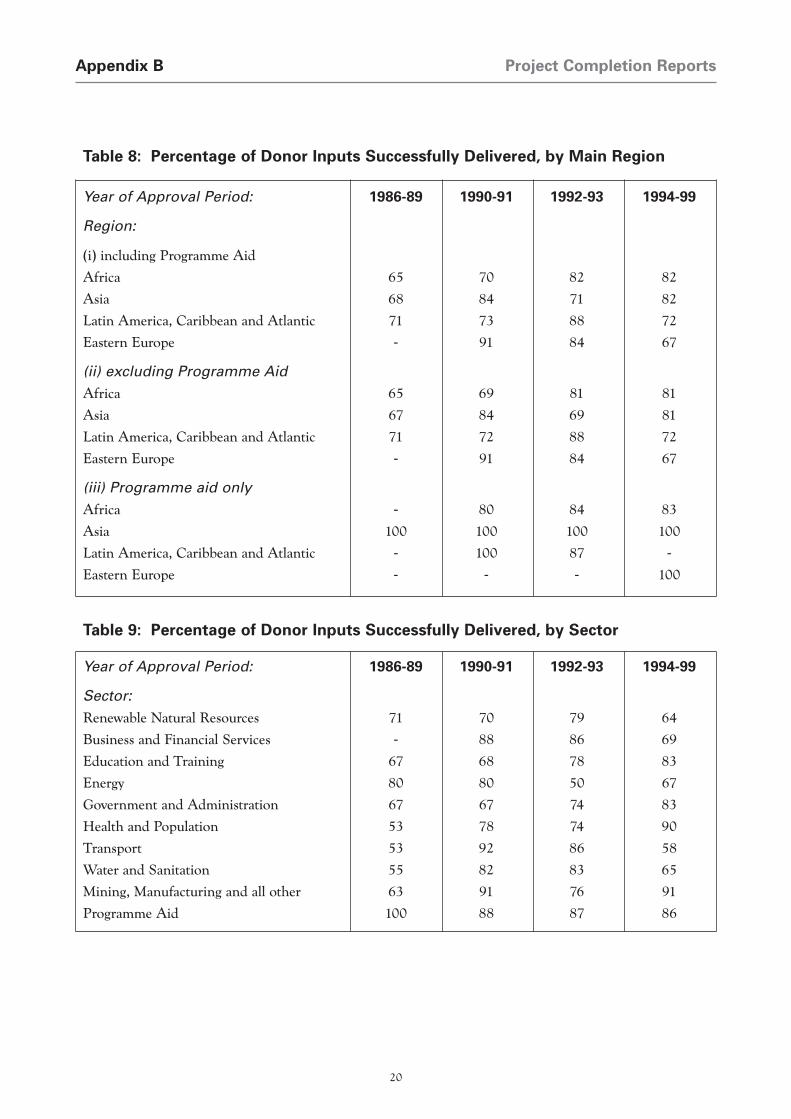
14. Delivery of Project Inputs. Figure 5 measures both donor and overseas partnersperformance in respect of project inputs. Donor satisfaction shows significant growth over theperiod with normal project activity in Africa achieving consistent growth over the period, and theother regions matching the African level of performance in the latter years.
Overseas partner performance shows a steady but more modest improvement, rising from 39% to54% over the period. Africa delivered the most consistent growth, with the other regions broadlymatching Africa’s success in the most recent period.
Figure 5

Project Completion ReportsAnalysis of Results
8
Proportion of PCRs with positive output ratings (excluding Programme Aid)
0
10
20
30
40
50
60
70
80
90
100
1986-89 1990-91 1992-93 1994-99
Year of Approval
%
Proportion of PCRs with positive output ratings (All Projects)
0
10
20
30
40
50
60
70
80
90
100
1986-89 1990-91 1992-93 1994-99
Year of Approval
%
Figure 6
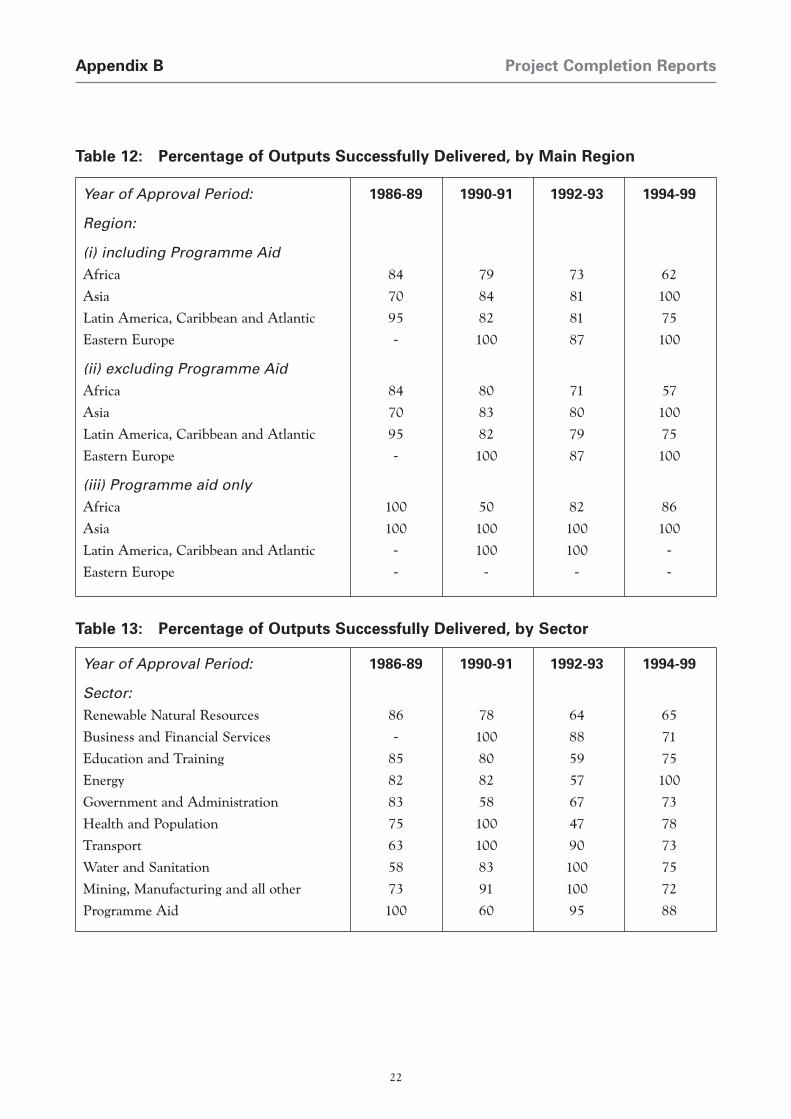
15. Delivery of Project Outputs. Figure 6 shows no clear improvement over time althoughsuccess levels for all activities have been consistently in excess of 70%. There are considerablefluctuations in regional performance, with Asia and Eastern Europe being particularly successful(See Appendix B table 12).
9
Project Completion Reports Analysis of Results
All Regions (excluding Programme Aid)
0
10
20
30
40
50
60
70
80
90
100
1986-89 1990-91 1992-93 1994-99
Year of Approval
% S
atis
fact
ory
0
10
20
30
40
50
60
70
80
90
100
1986-89 1990-91 1992-93 1994-99
Year of Approval
% S
atis
fact
ory
Africa Asia Americas/Carib/Atlan Europe/FSU
Figure 7
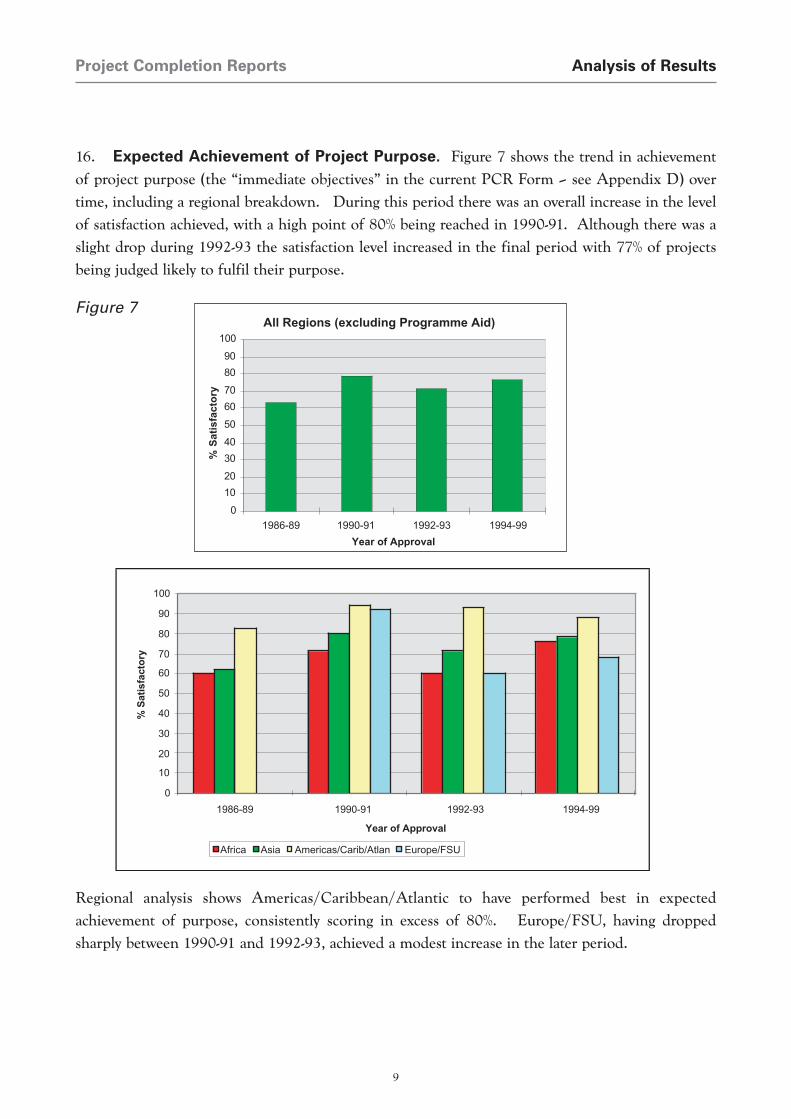
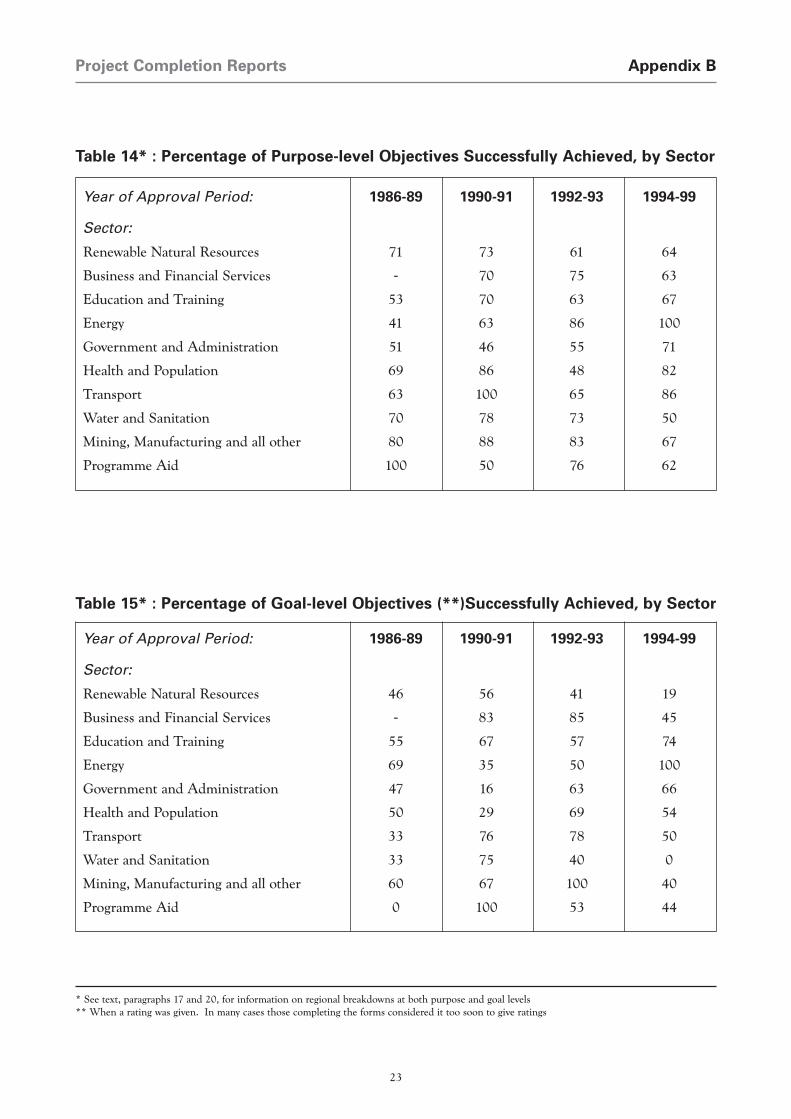
16. Expected Achievement of Project Purpose. Figure 7 shows the trend in achievementof project purpose (the “immediate objectives” in the current PCR Form – see Appendix D) overtime, including a regional breakdown. During this period there was an overall increase in the levelof satisfaction achieved, with a high point of 80% being reached in 1990-91. Although there was aslight drop during 1992-93 the satisfaction level increased in the final period with 77% of projectsbeing judged likely to fulfil their purpose.
Regional analysis shows Americas/Caribbean/Atlantic to have performed best in expectedachievement of purpose, consistently scoring in excess of 80%. Europe/FSU, having droppedsharply between 1990-91 and 1992-93, achieved a modest increase in the later period.
Project Completion ReportsAnalysis of Results
10
Expenditure management and Achievement of Objectives
0
10
20
30
40
50
60
70
80
90
1986-89 1990-91 1992-93 1994-99
Year of Approval
% E
xpec
ted
to a
chie
ve o
bjec
tives Under-
run
Within10% of
target
Over-run
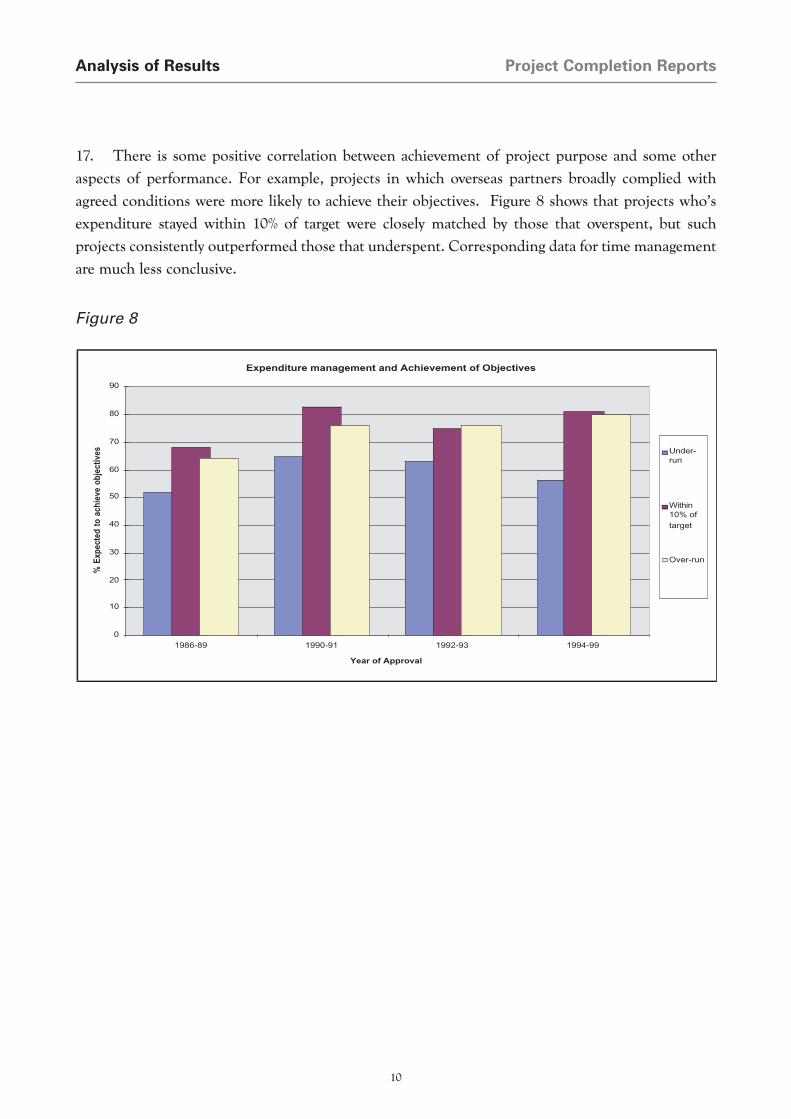
17. There is some positive correlation between achievement of project purpose and some otheraspects of performance. For example, projects in which overseas partners broadly complied withagreed conditions were more likely to achieve their objectives. Figure 8 shows that projects who’sexpenditure stayed within 10% of target were closely matched by those that overspent, but suchprojects consistently outperformed those that underspent. Corresponding data for time managementare much less conclusive.
Figure 8

11
Project Completion Reports Analysis of Results
Africa
0
10
20
30
40
50
60
70
80
90
100
1986-89 1990-91 1992-93 1994-99Year of Approval
%
Asia
0
10
20
30
40
5060
70
80
90
100
1986-89 1990-91 1992-93 1994-99Year of Approval
%
Americas/Carib/Atlantic
0
10
20
30
40
50
60
7080
90100
1986-89 1990-91 1992-93 1994-99Year of Approval
%
Europe/FSU
0
10
20
30
40
50
60
70
80
90
100
1986-89 1990-91 1992-93 1994-99
Year of Approval
%
16. Expected Achievement of Project Goal. The trends for forecasted achievement of goal(the wider, longer-term objectives to which the project purpose is directed), are shown in Figure 9 forall projects combined and by region but excluding Programme Aid. There are considerable regionalvariations, and overall the expected success rate is around 60%. It should however be noted thatproject managers are not always inclined to make forecasts, with less than three-quarters of PCRsreceived scoring against this category.
17. Sustainability. A substantial proportion of PCRs contain no rating for sustainability, with projectmanagers considering that it was too early to make a judgement. Where a definite rating for sustainabilitywas given and satisfactory ratings had been allocated for expected achievement of purpose or goal a positivesustainability rating was awarded in over 85% of all cases, both overall and in all regions. Even where poorerachievement ratings were given, those objectives that were still expected to be achieved, even if onlypartially, were generally also expected to be sustainable.
Figure 9
Project Completion ReportsAnalysis of Results
12
18. Sectoral Data. Appendix B provides supplementary statistical data including somedisaggregation by sector although the results should be interpreted with care. In a number of cases thebreakdown of the data results in small cell sizes yielding results which should be interpreted with specialcaution. Where the cell size consists of between one and five PCRs, the result is shown in parentheses.
19. The raw data suggest that improvements in overall portfolio performance over time are reflectedless evenly by sector than by region. However, the great variation in the size of the individual cells stillprevents the possibility of a rigorous sectoral analysis to complement the regional analysis, since thefindings may be misleading.
Project Completion Reports Appendix A
13
No. % No. % No. % No. % No. % No. % No. % No. %
Renewable Natural Resourses 32 33 27 36 27 28 15 16 16 19 12 16 16 20 12 11
Business/Financial Services 0 0 0 0 4 4 9 10 9 11 8 11 4 5 9 8
Education and Training 18 19 15 20 18 19 27 29 12 14 11 14 11 13 8 7
Energy 6 6 5 7 6 6 5 5 4 5 3 4 2 2 1 1
Government and Administration 5 5 7 9 9 9 10 11 14 17 10 13 17 21 17 15
Health and Population 10 10 3 4 5 5 5 5 11 13 7 9 11 13 25 22
Transport 9 9 7 9 7 7 13 14 4 5 6 8 7 9 4 4
Water and Sanitation 4 4 8 11 9 9 3 3 2 2 4 5 1 1 3 3
Mining and Miscellaneous 11 11 2 3 7 7 4 4 4 5 3 4 4 5 19 17
SSuubb TToottaallss 9955 7744 9922 9911 7766 6644 7733 9988
Programme Aid 2 2 0 0 4 4 2 2 8 10 12 16 9 11 16 14
GGrraanndd TToottaallss 9977 110000 7744 110000 9966 110000 9933 110000 8844 110000 7766 110000 8822 110000 111144 110000
Region
Africa 47 48 40 54 48 50 43 46 34 40 35 46 31 38 66 58
Asia and Pacific 39 40 26 35 32 33 19 20 30 36 21 28 33 40 24 21
Americas/Caribbean/Atlantic 11 11 8 11 10 16 13 14 9 11 11 14 8 10 10 9
East Europe and FSU 0 0 0 0 6 6 18 19 11 13 9 12 10 12 14 12
GGrraanndd TToottaallss 9977 110000 7744 110000 9966 110000 9933 110000 8844 110000 7766 110000 8822 110000 111144 110000
Synthesis Sector 1986-88 1989 1990 1991 1992 1993 1994 1995-99
APPENDIX A: MAIN DATA TABLES 1-3
1: Number and Percentage of PCRs in each Sector and Region, by Year of Approval
2: Sector and Regional Expenditure, by Year of Approval
3: Average Expenditure per Project by Sector and Region, by Year of Approval
TABLE 1: Number and Percentage of PCRs in each Sector and Region, by year of approval
Project Completion ReportsAppendix A
14
£K % £K % £K % £K % £K % £K % £K % £K %
Renewable Natural Resources 50,944 13 49,063 29 74,374 31 25,072 14 29,303 17 13,505 7 16,305 7 31,312 6
Business/Financial Services ,0 0 ,0 0 10,139 4 5,931 3 9,875 6 16,235 9 17,330 7 28,627 6
Education and Training 22,865 6 16,619 10 21,939 9 28,697 16 14,726 9 10,394 6 24,986 10 13,052 3
Energy 110,755 29 28,822 17 33,483 14 8,616 5 17,997 10 1,903 1 2,034 1 2,658 1
Government and Administration 7,117 2 7,296 4 7,505 3 12,013 7 8,719 5 26,441 14 33,948 14 61,280 12
Health and Population 14,494 4 4,531 3 8,843 4 6,403 4 13,980 8 7,422 4 18,321 8 131,531 26
Transport 82,599 21 49,859 29 20,631 9 60,182 34 15,169 9 7,142 4 28,876 12 6,137 1
Water and Sanitation 4,400 1 12,420 7 10,570 4 3,532 2 2,970 2 4,565 2 ,438 0 3,116 1
Mining and Miscellaneous 46,110 12 2,224 1 19,416 8 5,659 3 2,713 2 4,026 2 9,107 4 42,553 8
SSuubb TToottaallss 333399,,228844 117700,,883344 220066,,990000 115566,,110055 111155,,445522 9911,,663333 115511,,334455 332200,,226666
Programme Aid 45,960 12 0 0 34,500 14 19,663 11 56,483 33 93,558 51 89,836 37 183,244 36
GGrraanndd TToottaallss 338855,,224444 110000 117700,,883344 110000 224411,,440000 110000 117755,,776688 110000 117711,,993355 110000 118855,,119911 110000 224411,,118811 110000 550033,,551100 110000
Region
Africa 114,833 30 93,178 55 85,733 36 73,618 42 64,777 38 134,583 73 112,848 47 361,859 72
Asia and Pacific 253,744 66 67,413 39 142,288 59 72,003 41 82,920 48 27,423 15 87,296 36 78,319 16
Americas/Caribbean/Atlantic 16,667 4 10,243 6 8,275 3 18,485 11 14,948 9 13,393 7 16,539 7 30,532 6
East Europe and FSU 0 0 0 0 5,104 2 11,662 7 9,290 5 9,792 5 24,498 10 32,800 7
GGrraanndd TToottaallss 338855,,224444 110000 117700,,883344 110000 224411,,440000 110000 117755,,776688 110000 117711,,993355 110000 118855,,119911 110000 224411,,118811 110000 550033,,551100 110011
Synthesis Sector 1986-88 1989 1990 1991 1992 1993 1994 1995-99
TABLE 2: Sector and Regional Expenditure, by year of approval
15
£K £K £K £K £K £K £K £K
Renewable Natural Resources 1,592 1,817 2,755 1,671 1,831 1,125 1,019 2,609
Business/Financial Services ,0 ,0 2,535 ,659 1,097 2,029 4,333 3,181
Education and Training 1,270 1,108 1,219 1,063 1,227 ,945 2,271 1,632
Energy 18,459 5,764 5,581 1,723 4,499 ,634 1,017 2,658
Government and Administration 1,423 1,042 ,834 1,201 ,623 2,644 1,997 3,605
Health and Population 1,449 1,510 1,769 1,281 1,271 1,060 1,666 5,261
Transport 9,178 7,123 2,947 4,629 3,792 1,190 4,125 1,534
Water and Sanitation 1,100 1,553 1,174 1,177 1,485 1,141 ,438 1,039
Mining and Miscellaneous 4,192 1,112 2,774 1,415 ,678 1,342 2,277 2,240
SSuubb TToottaall AAvveerraaggeess 33,,557711 22,,330099 22,,224499 11,,771155 11,,551199 11,,443322 22,,007733 33,,226688
Programme Aid 22,980 ,0 8,625 9,832 7,060 7,797 9,982 11,453
GGrraanndd TToottaall AAvveerraaggeess 33,,997722 22,,330099 22,,551155 11,,889900 22,,004477 22,,443377 22,,994411 44,,441177
Region
East Africa 2,443 2,329 1,786 1,712 1,905 3,845 3,640 5,483
Asia and Pacific 6,506 2,593 4,447 3,790 2,764 1,306 2,645 3,263
Americas/Caribbean/Atlantic 1,515 1,280 ,828 1,422 1,661 1,218 2,067 3,053
East Europe and FSU ,0 ,0 ,851 ,648 ,845 1,088 2,450 2,343
GGrraanndd TToottaall AAvveerraaggeess 33,,997722 22,,330099 22,,551155 11,,889900 22,,004477 22,,443377 22,,994411 44,,441177
Synthesis Sector 1986-88 1989 1990 1991 1992 1993 1994 1995-99
TABLE 3: Average Expenditure per Project by Sector and Region, by year of approval
Project Completion Reports Appendix A

16
Project Completion ReportsAppendix A

17
Project Completion Reports Appendix B
APPENDIX B* OTHER STATISTICAL TABLES (4-15)
*In some cases the breakdowns given result in relatively small sub-populations or"cells". In such cases results must be treated with care. Where the data consisted ofbetween one and five PCRs, the result is shown in brackets. Where no PCRs wereavailable, this is indicated by a dash.
Table 4 Time Management Performance: Proportion of Projects completedwithin 10% of the allocated time, by Main Region
Table 5 Time Management Performance: Proportion of Projects completedwithin 10% of the allocated time, by Sector
Table 6 Expenditure Management Performance: Proportion of Projectscompleted within 10% of the Allocated Expenditure, by Main Region
Table 7 Expenditure Management Performance: Proportion of Projectscompleted within 10% of the Allocated Expenditure, by Sector
Table 8 Percentage of Donor Inputs Successfully Delivered, by Main Region
Table 9 Percentage of Donor Inputs Successfully Delivered, by Sector
Table 10 Percentage of Recipient Inputs Successfully Delivered, by Main Region
Table 11 Percentage of Recipient Inputs Successfully Delivered, by Sector
Table 12 Percentage of Outputs Successfully Delivered, by Main Region
Table 13 Percentage of Outputs Successfully Delivered, by Sector
Table 14 Percentage of Purpose-level Objectives Successfully Achieved, by Sector
Table 15 Percentage of Goal-level Objectives Successfully Achieved, by Sector

Year of Approval Period: 1986-89 1990-91 1992-93 1994-99
Sector:
Renewable Natural Resources 33 25 42 41
Business and Financial Services - 54 41 36
Education and Training 36 42 65 59
Energy 0 20 0 0
Government and Administration 20 11 54 47
Health and Population 50 20 28 18
Transport 19 39 40 30
Water and Sanitation 9 17 17 67
Mining, Manufacturing 0 60 75 33
and all other
Programme Aid 50 40 58 73
Project Completion ReportsAppendix B
18
Year of Approval Period: 1986-89 1990-91 1992-93 1994-99
Region:
Africa 29 27 46 43
Asia 19 33 34 44
Latin America, Caribbean 41 25 53 41
and Atlantic
Eastern Europe - 54 68 36
Table 4: Time Management Performance: Proportion of Projects completed within
10% of the Allocated Time, by Main Region (%)
Table 5: Time Management Performance: Proportion of Projects completed within
10% of the allocated time, by Sector
19
Project Completion Reports Appendix B
Year of Approval Period: 1986-89 1990-91 1992-93 1994-99
Region:
(i) including Programme AidAfrica 80 80 78 82Asia 66 78 82 50Latin America, Caribbean and Atlantic 92 94 95 100Eastern Europe 0 67 78 50
(ii) excluding Programme AidAfrica 80 79 76 79Asia 66 78 81 50Latin America, Caribbean and Atlantic 92 94 95 100Eastern Europe - 67 78 50
(iii) Programme aid onlyAfrica - 100 100 100Asia - - 100 0Latin America, Caribbean and Atlantic - - - -Eastern Europe - - - -
Table 6: Expenditure Management Performance: Proportion of Projects completed
within 10% of the Allocated Expenditure, by Main Region
Year of Approval Period: 1986-89 1990-91 1992-93 1994-99
Sector:
Renewable Natural Resources 59 86 81 76Business and Financial Services - 100 69 78Education and Training 82 73 57 91Energy 100 100 100 100Government and Administration 100 75 73 78Health and Population 75 67 100 61Transport 89 90 80 83Water and Sanitation 86 82 100 100Mining, Manufacturing and all other 88 75 100 77Programme Aid - 100 100 90
Table 7: Expenditure Management Performance: Proportion of Projects completed
within 10% of the Allocated Expenditure, by Sector
Project Completion ReportsAppendix B
20
Year of Approval Period: 1986-89 1990-91 1992-93 1994-99
Region:
(i) including Programme AidAfrica 65 70 82 82Asia 68 84 71 82Latin America, Caribbean and Atlantic 71 73 88 72Eastern Europe - 91 84 67
(ii) excluding Programme AidAfrica 65 69 81 81Asia 67 84 69 81Latin America, Caribbean and Atlantic 71 72 88 72Eastern Europe - 91 84 67
(iii) Programme aid onlyAfrica - 80 84 83Asia 100 100 100 100Latin America, Caribbean and Atlantic - 100 87 -
Eastern Europe - - - 100
Table 8: Percentage of Donor Inputs Successfully Delivered, by Main Region
Year of Approval Period: 1986-89 1990-91 1992-93 1994-99
Sector:Renewable Natural Resources 71 70 79 64Business and Financial Services - 88 86 69Education and Training 67 68 78 83Energy 80 80 50 67Government and Administration 67 67 74 83Health and Population 53 78 74 90Transport 53 92 86 58Water and Sanitation 55 82 83 65Mining, Manufacturing and all other 63 91 76 91Programme Aid 100 88 87 86
Table 9: Percentage of Donor Inputs Successfully Delivered, by Sector

21
Project Completion Reports Appendix B
Year of Approval Period: 1986-89 1990-91 1992-93 1994-99
Region:
(i) including Programme AidAfrica 29 35 50 54Asia 37 54 39 53Latin America, Caribbean and Atlantic 65 43 75 56Eastern Europe - 85 20 50
(ii) excluding Programme AidAfrica 29 35 47 53Asia 37 54 40 54Latin America, Caribbean and Atlantic 65 42 71 56Eastern Europe - 85 20 50
(iii) Programme aid onlyAfrica - 0 78 56Asia - - 30 0Latin America, Caribbean and Atlantic - 50 100 -
Eastern Europe - - - -
Table 10: Percentage of Recipient Inputs Successfully Delivered, by Main Region
Year of Approval Period: 1986-89 1990-91 1992-93 1994-99
Sector:Renewable Natural Resources 43 36 42 52Business and Financial Services - 67 65 47Education and Training 32 45 44 60Energy 24 44 27 53Government and Administration 25 22 48 47Health and Population 22 48 33 65Transport 37 66 60 38Water and Sanitation 33 48 63 65Mining, Manufacturing and all other 49 45 75 46Programme Aid - 25 74 52
Table 11: Percentage of Recipient Inputs Successfully Delivered, by Sector
Project Completion ReportsAppendix B
22
Year of Approval Period: 1986-89 1990-91 1992-93 1994-99
Region:
(i) including Programme AidAfrica 84 79 73 62Asia 70 84 81 100Latin America, Caribbean and Atlantic 95 82 81 75Eastern Europe - 100 87 100
(ii) excluding Programme AidAfrica 84 80 71 57Asia 70 83 80 100Latin America, Caribbean and Atlantic 95 82 79 75Eastern Europe - 100 87 100
(iii) Programme aid onlyAfrica 100 50 82 86Asia 100 100 100 100Latin America, Caribbean and Atlantic - 100 100 -
Eastern Europe - - - -
Table 12: Percentage of Outputs Successfully Delivered, by Main Region
Year of Approval Period: 1986-89 1990-91 1992-93 1994-99
Sector:Renewable Natural Resources 86 78 64 65Business and Financial Services - 100 88 71Education and Training 85 80 59 75Energy 82 82 57 100Government and Administration 83 58 67 73Health and Population 75 100 47 78Transport 63 100 90 73Water and Sanitation 58 83 100 75Mining, Manufacturing and all other 73 91 100 72Programme Aid 100 60 95 88
Table 13: Percentage of Outputs Successfully Delivered, by Sector
23
Project Completion Reports Appendix B
Year of Approval Period: 1986-89 1990-91 1992-93 1994-99
Sector:
Renewable Natural Resources 71 73 61 64
Business and Financial Services - 70 75 63
Education and Training 53 70 63 67
Energy 41 63 86 100
Government and Administration 51 46 55 71
Health and Population 69 86 48 82
Transport 63 100 65 86
Water and Sanitation 70 78 73 50
Mining, Manufacturing and all other 80 88 83 67
Programme Aid 100 50 76 62
Table 14* : Percentage of Purpose-level Objectives Successfully Achieved, by Sector
Year of Approval Period: 1986-89 1990-91 1992-93 1994-99
Sector:
Renewable Natural Resources 46 56 41 19
Business and Financial Services - 83 85 45
Education and Training 55 67 57 74
Energy 69 35 50 100
Government and Administration 47 16 63 66
Health and Population 50 29 69 54
Transport 33 76 78 50
Water and Sanitation 33 75 40 0
Mining, Manufacturing and all other 60 67 100 40
Programme Aid 0 100 53 44
Table 15* : Percentage of Goal-level Objectives (**)Successfully Achieved, by Sector
* See text, paragraphs 17 and 20, for information on regional breakdowns at both purpose and goal levels ** When a rating was given. In many cases those completing the forms considered it too soon to give ratings

24
Project Completion ReportsAppendix B

Project Completion Reports Appendix C
25
PPrriinntteedd:: 0099//0077//9999 0099::3355 GGAAPP MM 11 AAnnnneexx 11PCR Ver. 29 September 1995
Project Completion ReportsAppendix C
26
PPrriinntteedd:: 0099//0077//9999 0099::3355 GGAAPP MM 11 AAnnnneexx 11PCR Ver. 29 September 1995

27
PPrriinntteedd:: 0099//0077//9999 0099::3355 GGAAPP MM 11 AAnnnneexx 11PCR Ver. 29 September 1995
Project Completion Reports Appendix C

Project Completion ReportsAppendix C
28
PPrriinntteedd:: 0099//0077//9999 0099::3355 GGAAPP MM 11 AAnnnneexx 11PCR Ver. 29 September 1995

29
PPrriinntteedd:: 0099//0077//9999 0099::3355 GGAAPP MM 11 AAnnnneexx 11PCR Ver. 29 September 1995
Project Completion Reports Appendix C

Project Completion ReportsAppendix C
30
PPrriinntteedd:: 0099//0077//9999 0099::3355 GGAAPP MM 11 AAnnnneexx 11PCR Ver. 29 September 1995

31
Project Completion Reports Appendix D

Project Completion ReportsAppendix D
32

33
Project Completion Reports Appendix D

34
Project Completion Reports Appendix D
The Department for International Development (DFID)The Department for International Development (DFID) is the UKgovernment department responsible for promoting developmentand the reduction of poverty. The government first elected in 1997has increased its commitment to development by strengthening thedepartment and increasing its budget.
The central focus of the Government’s policy, set out in the 1997White Paper on International Development, is a commitment to theinternationally agreed target to halve the proportion of people livingin extreme poverty by 2015, together with the associated targetsincluding basic health care provision and universal access toprimary education by the same date. The second White Paper onInternational Development, published in December 2000,reaffirmed this commitment, while focusing specifically on how tomanage the process of globalisation to benefit poor people.
DFID seeks to work in partnership with governments which arecommitted to the international targets, and seeks to work withbusiness, civil society and the research community to this end.We also work with multilateral institutions including the WorldBank, United Nations agencies and the European Community.
The bulk of our assistance is concentrated on the poorest countriesin Asia and sub-Saharan Africa. We are also contributing to povertyelimination and sustainable development in middle incomecountries in Latin America, the Caribbean and elsewhere. DFID isalso helping the transition countries in central and eastern Europe totry to ensure that the process of change brings benefits to allpeople and particularly to the poorest.
As well as its headquarters in London and East Kilbride, DFID hasoffices in many developing countries. In others, DFID worksthrough staff based in British embassies and high commissions.DFID’s headquarters are located at:
DFID DFID94 Victoria Street Abercrombie HouseLondon SW1E 5JL Eaglesham RoadUK East Kilbride
Glasgow G75 8EAUK
(from January 2002: 1 Palace Street, London Street, London SW1E 5HE, UK)
and at:
Switchboard: 020 7917 7000 Fax: 020 7917 0019Website: www.dfid.gov.ukemail: [email protected] enquiry point: 0845 3004100 From overseas: +44 1355 84 3132
ISBN 1 86192 407 0Pro
duce
d by
AK
RO
S PR
INT
LTD
for
DFI
D In
tern
atio
nal D
ivis
ion