PROJECT COMPLETION REPORT ON R&D PROJECTS...
41
PROJECT COMPLETION REPORT ON DEVELOPMENT OF DATABASE OF EQUIPMENT SUPPORTED UNDER EXTRAMURAL R&D PROJECTS SANCTIONED DURING 2008-09 TO 2010-11 PERIOD (PHASE II) (Project Reference F.No.DST/NSTMIS/05/174/2014-15) A STUDY CONDUCTED BY THE ENERGY AND RESOURCES INSTITUTE (TERI) DARBARI SETH BLOCK IHC COMPLEX, LODHI ROAD NEW DELHI - 110 003 SPONSORED BY DEPARTMENT OF SCIENCE AND TECHNOLOGY NATIONAL SCIENCE AND TECHNOLOGY MANAGEMENT INFORMATION SYSTEM TECHNOLOGY BHAVAN, NEW MEHRAULI ROAD NEW DELHI - 110 016 April 2017 1
Transcript of PROJECT COMPLETION REPORT ON R&D PROJECTS...
PROJECT COMPLETION REPORT
ON
DEVELOPMENT OF DATABASE OF EQUIPMENT SUPPORTED UNDER EXTRAMURAL R&D PROJECTS SANCTIONED DURING 2008-09 TO 2010-11 PERIOD (PHASE II)
(Project Reference F.No.DST/NSTMIS/05/174/2014-15)
A STUDY
CONDUCTED B Y THE ENERGY AND RESOURCES INSTITUTE (TERI)
DARBARI SETH BLOCK IHC COMPLEX, LODHI ROAD
NEW DELHI - 110 003
SPONSORED B Y DEPARTMENT OF SCIENCE AND TECHNOLOGY
NATIONAL SCIENCE AND TECHNOLOGY MANAGEMENT INFORMATION SYSTEM
TECHNOLOGY BHAVAN, NEW MEHRAULI ROAD NEW DELHI - 110 016
April 2017
1

T E R I. 2017.Development of Database of Equipment Supported under Extramural R&D ProjectsSanctioned During 2008-09 to 2010-11 PeriodNew Delhi: The Energy and Resources Institute. 35pp.[Project Report No. 2014LC01]
For more information
Knowledge Management Division T E R IDarbari Seth Block IHC Complex, Lodhi Road New Delhi - 110 003 India
Tel. 2468 2100 or 2468 2111 E-mail [email protected] Fax 2468 2144 or 2468 2145
Web www.teriin.org India +91 • Delhi (0) 11 Mobile: 09810793533
2

ACKNOWLEDGEMENTS
The project team is grateful to the National Science and Technology Management
Information System (NSTMIS) Division of the Department of Science and Technology (DST),
Government of India for providing an opportunity to undertake this study on ‘Development of
Database of Equipment funded under Extramural R&D Projects’. It gratefully acknowledges the
guidance, inputs and cooperation provided by the Local Project Advisory Committee Members,
viz. Dr Parveen Arora, Head (CHORD-NSTMIS), Department of Science and Technology,
Government of India, Mrs Namita Gupta, Scientist-F, Department of Science and Technology,
Government of India, Dr Suneet Tuli, Dean [R&D], Indian Institute of Technology, Delhi, Dr
Suresh Chand, Chief Scientist, National Physical Laboratory, New Delhi, Dr Sandeep Chatterjee,
Registrar, Indian Institute of Technology Delhi, Dr Chandrima Shaha, Director, National Institute
of Immunology, New Delhi, Dr Annapoorni Subramanian, Professor, Department of Physics and
Astrophysics, University of Delhi, and Dr Garima Shukla, Additional Professor, Department of
Neurology, All India Institute of Medical Sciences, New Delhi, from time to time in the execution
of this project.
That TERI was able to successfully complete this project has been possible only due to the
whole-hearted support and cooperation extended by the project investigators/heads of
institutions/nodal officers of various project implementing agencies, universities and higher
educational institutions, who forwarded the requisite data of equipments for the database. The
project team duly acknowledges their support.
Finally, a word of thanks also goes to the project team members for their indulgence,
commitment and hard work of surveying, collecting, compiling and authenticating data from a
plethora of agencies located across the country, and to other TERI research and administrative
professionals who contributed towards the timely completion of the project.
T P Sankar (Project Investigator)
New Delhi April 2017
3
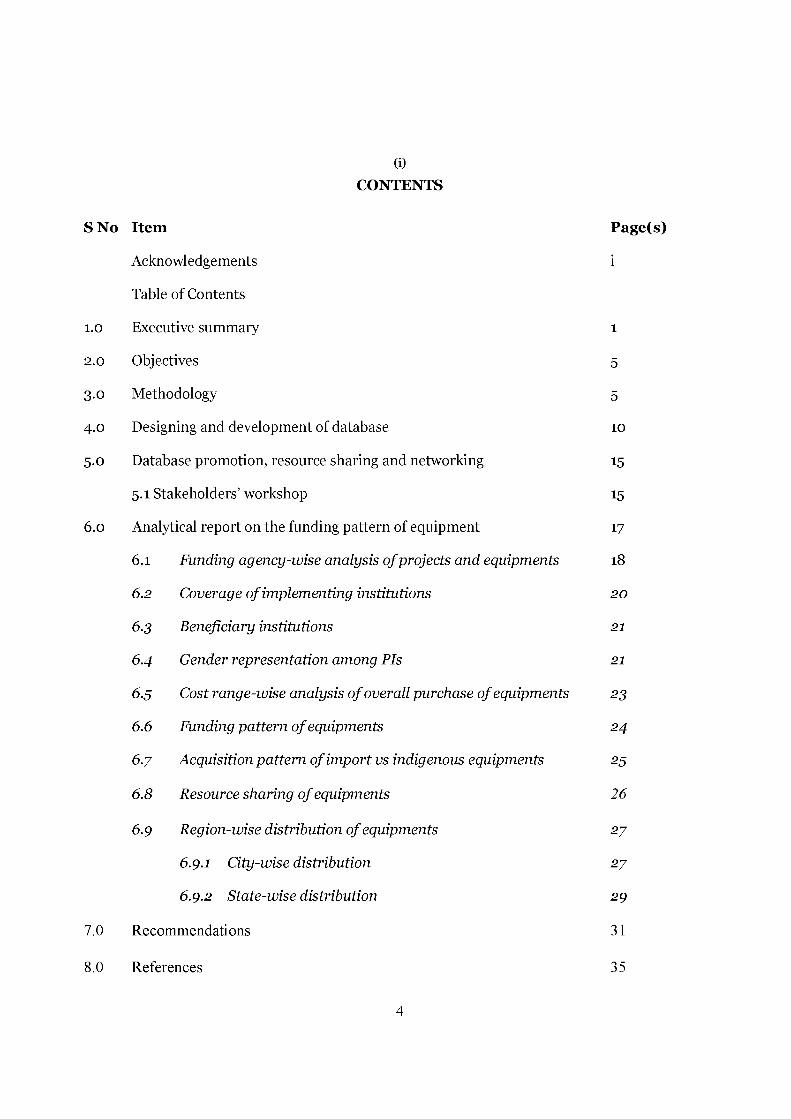
(i)CONTENTS
S No Item Page(s)
Acknowledgements i
Table of Contents
1.0 Executive summary 1
2.0 Objectives 5
3.0 Methodology 5
4.0 Designing and development of database 10
5.0 Database promotion, resource sharing and networking 15
5.1 Stakeholders’ workshop 15
6.0 Analytical report on the funding pattern of equipment 17
6.1 Funding agency-wise analysis o f projects and equipments 18
6.2 Coverage of implementing institutions 20
6.3 Beneficiary institutions 21
6.4 Gender representation among PIs 21
6.5 Cost range-wise analysis o f overall purchase of equipments 23
6.6 Funding pattern o f equipments 24
6.7 Acquisition pattern of import vs indigenous equipments 25
6.8 Resource sharing o f equipments 26
6.9 Region-wise distribution of equipments 27
6.9.1 City-wise distribution 27
6.9.2 State-wise distribution 29
7.0 Recommendations 31
8.0 References 35
4

Table 1
Table 2
Table 3
Table 4
Table 5
Table 6
Table 7
Table 8
Table 9
Table 10
Table 11
Table 12
Table 13
Table 14
List of Tables
Year-wise break-up of projects ...6
Distribution of projects by states . 6
Evaluation of survey responses .1 0
Agencies that provided funds for the acquisition of scientific equipments . 1 8
Funding support by central and S&T departments/agencies .1 9
Ranking of agencies according to coverage of institutions .2 0
Distribution of equipments and grant funding by top 10 institutions .2 2
Gender Representation Among PIs .2 3
Acquisition pattern of equipments - imported vs indigenous .2 5
Distribution of equipments funding by type of cities .2 6
Distribution of equipments with a total grant funding of Rs 3000 and above
received by select cities .2 8
State-wise grant funding by top six states ..29
Equipment Funding received by the three North-Eastern states ..29
Ranking of states by equipments grant funding during 2008-09 to 2010-11 .3 0
(ii)
(iii)
5

List of Figures
Figure 1 Dispersal of projects by states ...7
Figure 2 Sample filled in Survey Questionnaire .. .9
Figure 3 Database of Scientific Equipments . 1 1
Figure 4 Details in the database with respect to EMR project .1 2
Figure 5 Details with respect to equipment purchased under EMR project . 1 3
Figure 6 Classification of equipments under different categories . 1 4
Figure 7 Inaugural Session: Stakeholders’ Workshop .1 6
Figure 8 Ranking of funding agencies according to grants allocation for equipment .2 0
Figure 9 Cost range-wise grants allocation .2 3
Figure 10 Year-wise equipment funding support .2 3
Figure 11 Acquisition pattern of import vs indigenous pattern of equipments .2 5
Figure 12 Current status and sharing of equipments purchased under projects .2 6
Figure 13 City-wise distribution of grant funding of equipments .2 8
List of Annexures
Annexure I Survey questionnaire
Annexure II Database search tips
Annexure III Report on stakeholders’ workshop
Annexure IV List of equipments each costing Rs 50 lakh and above
Annexure V Distribution of funding for equipments by cities
(iv)
6
1.0 EXECUTIVE SUMMARY
The progress of science and the competitive position of a nation’s science base depend
upon the availability and access of advanced research infrastructure. Scientific equipments
forms an important component of research infrastructure and enables scientists to carry
out development of research. In a wider perspective, it is critical to recognize that
scientific equipments and research infrastructure are intimately associated with policy
frameworks that facilitate and enable procurement, maintenance and disposal of scientific
equipments, and management systems for providing information on accessibility and
sharing of trained manpower.
The National Science and Technology Management Information System, a division of the
Department of Science and Technology, Government of India, has initiated a nation-wide
study for development of database of equipment funded under R&D projects and other
S&T research infrastructure schemes of the Central Government during the period 2008
09 to 2010-11.
The task of surveying and data collection exercise was carried out and with the
cooperation of over 793 project investigators and heads of institutions. The study has
resulted in the creation of a web-based database presenting details of 431 extramural
research projects and other S&T infrastructure schemes such as Fund for Improvement of
S&T Infrastructure in Universities and Higher Educational Institutions (FIST) having 890
items of specialized; multi-disciplinary and multi-user equipments each costing Rs 10 lakh
and above from 179 academic institutions and R&D organisations located across the
country.
The study has also analyzed the data received from project investigators and prepared a
report covering the funding pattern of equipment, city- and state-wise distribution, and
gender representation, among other. A summary of which is given below for quick
reference. Recommendations and suggestions that emerged from the study are given at
the end of the report.
Findings and recommendations are based on responses to the questionnaire received from
project investigators, universities and higher educational institutions representing 431
projects sanctioned during the period 2008-09 to 2010-11. It is, therefore, presumed that
the information furnished by nodal officers was authentic and accurate in all respects.
7
Findings at a Glance
> Coverage of study: The survey covered 1564 projects each costing Rs 50 lakh and above
spread over 570 institutions across the country. It found that of the 1197 responses
received, 431 projects had equipments each costing Rs 10 lakh and above and 766 projects
with either no equipments or having equipment each costing less than Rs 10 lakh.
> Equipment grant funding by scientific agencies. During the period 2008-09 to
2010-11, the total grant for obtaining 890 items of equipments under 431 projects were Rs
54,564 lakh.
o Department of Science and Technology (DST) Rs 24518 lakh;
o Ministry of Communication and Information Technology (MOCIT) Rs 12573 lakh;
o Department of Biotechnology (DBT) Rs 9512 lakh;
o Ministry of New and Renewable Energy (MNRE) Rs 2468 lakh; and
o Department of Scientific and Industrial Research (DSIR) Rs 2160 lakh
are the five largest contributors and they together accounted for about 94% of the total
equipment funding during the period.
> Recipient Institutions. Maximum funding support for obtaining equipments was
sanctioned to
o Indian Institute of Technology Bombay (Rs 6700 lakh); followed by
o Indian Institute of Technology Madras (Rs 6353 lakh);
o Indian Institute of Science Bangalore (Rs 5065 lakh);
o Indian Institute of Technology Delhi (2999 lakh);
o Eco Recycling Limited (Rs 2110 lakh);
o National Centre for Cell Science (Rs 1842 Lakh);
o Inter-University Accelarator Centre (Rs 1436 lakh);
o Calcutta University (Rs 1137 lakh);
o Centre for Biochemical Magnetic Resonance (Rs 1059 lakh); and
o Indian Institute of Technology Kanpur (Rs 962 lakh).
These ten institutions together received Rs 29664 lakh accounting for 54% of total
funding.
8
> Cost range of equipment. The maximum number of R&D equipment obtained was in
the cost range of Rs 10 to 25 lakh (428 items at a total cost of Rs 6784 lakh) constituting
12% of the total cost of equipment; Rs 25 to 50 lakh (225 items at Rs 8156 lakh)
constituting 15% of total cost; Rs 50 to Rs 75 Lakh (71 items at Rs 4336 lakh) 8%; Rs 75
lakh to Rs 1 Crore (44 items at Rs 3841 lakh) 7%; and Rs 1 crore and above (122 items at
Rs 31446 lakh) constituting 58% of total cost of equipment, indicating a greater support to
high value equipment.
> Gender representation among PIs. The study of gender-wise allocation of projects
has revealed that there were 75 female and 328 male PIs (403) representing 431 projects
having equipments each costing Rs 10 lakh and above; the percentage of female
representation of these projects has been 19 compared to that of 81 of male PIs.
> Purchase of equipment. The study also revealed that majority of the equipments was
imported (94% at a total cost of Rs 51345 lakh) as against indigenously manufactured
equipment (6% at a total cost of 3219 lakh).
> Sharing of Equipment. An analysis of the data received from PIs revealed that of the
890 items of equipments installed and operational at various institutions across the
country, 624 items (70%) are already shared indoors or PIs willing to share with outside
researchers/agencies. The 266 items (30%) of equipments purchased or indigenously
made are used only for internal research purposes and/or configured to be used as per the
requirement of the project or internal training purposes.
> City-wise Distribution. The city-wise analysis has revealed that equipments funding
was dispersed among the 261 institutions located in 80 cities and towns in the country.
Among these locations, 66 institutions based in seven metropolitan cities, viz. Bangalore,
New Delhi, Chennai, Hyderabad, Mumbai, Kolkata, and Pune received about 71% of the
total funding; and the rest in other 73 cities and towns gained about 29% of the total grant
support.
> State-wise Distribution. About 80% of the equipment funding was received by the
institutions located in six states, Maharashtra (Rs 14192 lakh), Tamil Nadu (Rs 8645
lakh), New Delhi (Rs 7365 lakh), Karnataka (Rs 6448 lakh) West Bengal, (Rs 4028 lakh)
and Kerala (Rs 2989 lakh). The share of three north-eastern states, viz. Assam, Manipur,
and Meghalaya accounted for only 2% of the total funding.
9

Study at a GlancePeriod under study 2008-09 to 2010-11
Total number of projects 1564Funding agencies 14Number of Institutions 573Number of States/UTs 30
Outcome of Data Collection ExerciseNumber of project-based responses 1197Number of projects having
equipments each costing Rs 10 lakh
and above
431
Number of projects having
equipments each costing less than
Rs 10 lakh or no equipments
766
PI-based responses (Total Number of
PIs)
403 [75 female and 328 male PIs]
Total Grant for equipments Rs 54,564 lakh
Funding agencies 14Number of Institutions 179Number of cities associated 79Number of states associated 23
Term s to read DenoteshereinafterPROJECTS Extramural sponsored research and other S&T infrastructure schemesPIs Project InvestigatorsEQUIPMENTS Scientific equipments each costing Rs 10 Lakh and aboveFUNDING AGENCIES Ministries and Departments of Government of IndiaINSTITUTIONS Project Implementing Institutions, universities, and higher education
institutionsPERIOD OF STUDY 2008-09 to 2010-11
10
2.0 OBJECTIVES
> Conduct a study for development of a database of scientific equipments, valued over Rs 10
lakh, supported under extramural research projects and other S&T infrastructure
schemes, each costing Rs 50 lakh and above approved for funding by Central Government
agencies and departments during the period 2008-09 to 2010-11;
> Develop a searchable database; provide access to; enable sharing and using science
equipment among scientific community, institutions and research personnel
3.0 METHODOLOGY
At the project start-up, the team developed an initial plan with potential approaches for data
collection, timeline, and action steps as below:
3.1 Identification o f projects
(i) The study started off with a creation of a catalogue of projects in accordance with
the study objectives. It identified a total of 1564 projects funded under extramural
sponsored research and other S& T infrastructure schemes such as Fund for Improvement
of S& T Infrastructure in Universities and Higher Educational Institutions, each costing Rs
50 lakh and above.
The year-wise break-up of projects funded by the central government ministries and
departments and the state-wise break-up of projects located across 30 Indian states/UTs
are given in Table 1, Table 2 and Map 1, respectively.
11
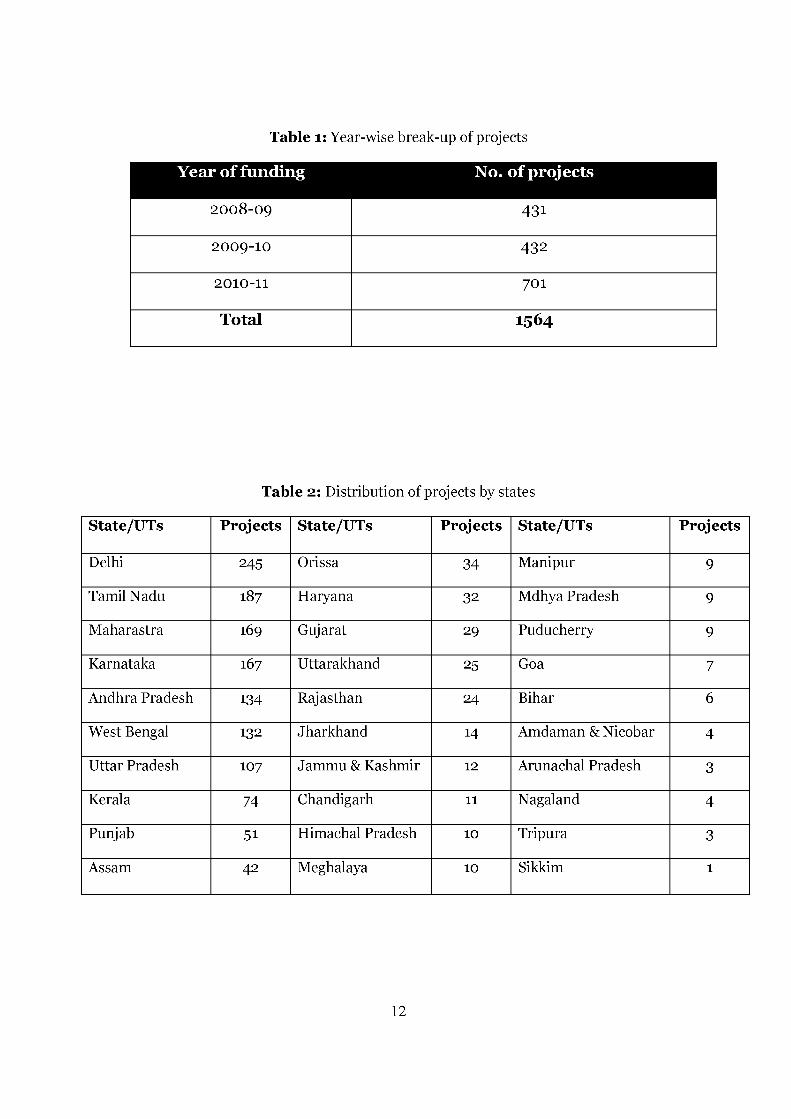
Table 1: Year-wise break-up of projects
Year o f funding No. o f projects
2008-09 431
2009-10 432
2010-11 701
Total 1564
Table 2: Distribution of projects by states
State/UTs Projects State/UTs Projects State/UTs Projects
Delhi 245 Orissa 34 Manipur 9
Tamil Nadu 187 Haryana 32 Mdhya Pradesh 9
Maharastra 169 Gujarat 29 Puducherry 9
Karnataka 167 Uttarakhand 25 Goa 7
Andhra Pradesh 134 Rajasthan 24 Bihar 6
West Bengal 132 Jharkhand 14 Amdaman & Nicobar 4
Uttar Pradesh 107 Jammu & Kashmir 12 Arunachal Pradesh 3
Kerala 74 Chandigarh 11 Nagaland 4
Punjab 51 Himachal Pradesh 10 Tripura 3
Assam 42 Meghalaya 10 Sikkim 1
12

Figure 1: Dispersal of projects by states
The numbers indicate projects each costing Rs 50 Lakh and above
13

3.2 Survey Form
A survey form was designed keeping in view the objective of the project and in
consultation with the Local Project Advisory Committee constituted for the project
(Annexure I). The form contained two portions: viz. (i) project related information, and
(ii) equipment related questions such as name of equipment purchased under the project,
cost of each equipment, date of purchase of equipment, source of purchase
(imported/indigenous); equipment make & model, major specifications, equipment
capability, resource sharing, performance of equipment, etc.
3.3 Coverage o f project implementing institutions for data collection
The target group for equipment data collection was principal investigators, heads of
departments of universities and higher education institutions who have undertaken the
projects during the period 2008-09 to 2010-11.
The data collection was carried out in two phases as under:
Phase I - Preparatory survey: The survey questionnaires with respect to 1564 projects were
forwarded to the PIs and heads of departments of research institutions, universities and
higher education institutions via email and post.
Phase II - Data collection phase: In this phase, survey was conducted through field visits
and in-depth interactions and interviews were held with PIs/nodal officers/heads of
institutions.
These institutions consisted of universities, engineering colleges, medical colleges and
hospitals, national research laboratories, scientific and industrial research organizations.
Phase III - Stakeholders’ workshop: In order to provide an opportunity to project
investigators and scientists to share experiences related to scientific equipments; promote
the Equipments Database and facilitate a culture of sharing scientific equipment; and
evolve a standardized interoperable database of scientific equipment, a stakeholders’
workshop was organized during the project period.
14

3.4 Outcome o f Data Collection Exercise
The survey received 1197 responses from 1564 projects. (A sample survey questions along
with data received from a respondent is given below)
DATABASE OF EQUIPMENT SUPPORTED
UNDER EXTRAM URAL R&D PROJECTS
SANCTIONED DURING 2008-09 TO 2010-11
Knowledge Partners
A m * TtRt. D jrtw n Seih Bitxk. - ’TO|! Cftvvtnment lodijIHC Complex. 1 rxihi Rcvid. K B IX-p.irtmeni ol S« t t r x r A Te< hnology New Delhi r S f h Ndiiorul S< ienc*• Jnd Technology
Mjndgvm ent Information SyUem
1. P R O J E C T D E TA ILSP ro je c t t it le
Funding A g e n c y — S ch em e & Sanction year
D evelopm ent o f G lycogen synthase kinase - 3B inhibitors for
neurogenesis in neurodegenerative disorders. DBT-R& D . 2010-11
Nam e with com p le te address o f P ro jec t In ves tiga to r / Head o f th e Institution
Dr M. Ramanathan. Principal. P.S.G. C ollege o f Pharm acy. Peelamedu,
Coim batore - 641004. Tamil Nadu
P ro je c t c o s t (Rs in lakhs) 66 11
11. PLE A S E F ILL IN D ETAILS OF EQUIPM ENT PURCH ASED UNDER TH IS PR O JE C T
leach costing Rs 10 Lakhs and above ONL Y\N am e o f equipm ent(Please use separate form for each equipment)
M “U H-» mode KzcvJ-Cri K>c\£,V\t'y CAincl £ p C £ i m > C \ 0 i - t U . r t c f t c c o i i e t .
C o s t o f th e Equipment [{Js'/'US Dollars/Euros] S q A 1 - f ? « :
D ate o f purchase o f equipment O A .ii . A n ilr j fp m en t Imported/Indigenous p o s te dEquipm ent M ake/Model
[e.g. FE/Philips XL 30[
M ajor Specifications
[ e g SE detector; GSED detector ']
The.tYoo^uhe.'t j (3\0
HJqU dfiuMb+T-j rneynoclnovnci'tor*, <. C<?)'cL(_ rui-nae °-( aco-iooonrv^, *
W rite a line about equipm ent capability ([e.g. 3D imaging o f biological specimens^
£WciU-k«Jivc dpuMrrti-tuJlvc, c'VcducxMoy-i o f bini h/itrsA. JZa-mpUA .
P resen t location o f th e equipment [Dept/Lab/Site where it is installed/ operational]
r^otecu{go I iro /o o 'U , U/b , p e p e f t tr r je w t o f PUo'iyr\acolaa-\ . u (‘a l l f a V n t p h a w y ia r v .
A. Perfo rm ance o f eauiDment ^ W V ’(Specify whether the equipment is functional as on date. I f Not. please indicate the reason by tick marking the boxes below:
0 Equipment not available fo r use due to non-availability o f spare parts
□ Equipment ou tdated/unserviceabie/identified as obso lete hence condem ned
D C onsequen t to the p ro ject completion, equipm ent not operated due to lack o f qualified m anpower
D An y o ther reason (p lease specify )
■̂ 3. W hether the eauiDment is shared presen tly \ Q ^ es / □ No
I f not shared presently, would you like to share it with outside researchers/organizations in future? D Y es / D No
I f No. please tick mark the reason:
□ Lack o f ded icated instrument specific techn ica l person to supervise the operation fo r external usage
G Apprehension o ve r the sa fe ty o f soph isticated/costly equipment
□ B ecau se the equipm ent is purchased exclusive ly fo r internal usage
D Th e instrument requ ires consumables fo r analysis/sample preparation, hence incurs additional cos ts
□ An y o th er reason (P I sp ec ify )
C. P lea se indicate w hether a log book/database o f users is maintained to track usage o f equipm ent
Y esx f No [If yes. indicate equipment usage rating in term s o f percentage:
Internal feo %: External i 0 V Free tim e ^ y -
C > *--- I a/ t//* ' .<<// ] oSignature (P I/Authorized signatory) / *4>,' D ate j2 i il)l£
Figure 2: Sample filled in Survey Questionnaire
15

As can be seen from the Table 3 below, during the course of Phase 2 (2008-09 to 2010-11), from
1564 survey questionnaires, a total of 1197 responses were received. The study found that of the
1197 responses, 431 projects carried 890 items of equipment each costing Rs 10 lakhs and above;
and no equipment or equipment worth less than Rs 10 lakh under the remaining 766 projects.
Table 3 : Evaluation of survey responses
Item Phase 1 Phase 2 Total
3.5 Processing and Analysis o f data
The details of 890 equipment items were keyed in a specially designed template using
MySQL-enabled database as per the requirement of the study. Using this structure, data
analysis were performed based on specific criteria such as year-wise break-up, funding
agency-wise break-up, institution-wise break-up, city- and state-wise break-up,
equipment cost-wise break-up, gender-wise outcome, and so on.
3.6 Limitations o f the study
Despite all efforts to achieve cent per cent data collection, the response rate was 77 per
cent. While attempts are being made in collecting the remaining 23%, a few could not be
received due to the following reasons:
> PIs were transferred/no longer associated with the organization/retired/expired;
> Project confidential/projects not approved/projects abandoned
16

Therefore, the strength of data collection and subsequent analysis are purely based on the 1197
project-based responses.
4.0 DESIGNING AND DEVELOPMENT OF DATABASE
A web-accessible framework using the LAMP platform was designed and developed with a query-
based retrieval methodology based on the meta data fields (Figure 3). The acronym LAMP stands
for Linux, Apache, MySQL, and PHP. Linux is a computer operating system assembled under the
model of free and open source software development and distribution; Apache a free open source
software which runs over 50% of the world’s web servers; while MySQL is a powerful database
management system used for organizing and retrieving data on a virtual platform; PHP is an open
source web scripting language that is widely used to build dynamic webpages.
Department o f Science & TechnologyNational Science and Technology Management Information System - NSTMIS Government of India HOME I ABOUT THE DATABASE I HOW TO SEARCH I FEEDBACK I LOGIN
Database of EquipmentDatabase o f Equipment supported under Extramural R&D projects and Research Infrastructure programmes • '
SEARCH FOR
EnterText
- 1 Extramural R&D projects
"■ Research in fras tructure programmes
® All Projects
Any Field
Search Reset Advanced Search
I*
T
Browse by category of equ ipm ent T
From year T To year ▼
Select State _________________________
Andaman and Nicobar Islands
Andhra Pradesh
ArunachalPradesh
" Press Ctrl button to select m u ltip le entries
http://equipment-nstmis-dst.org/
Figure 3: Database of Scientific Equipments
17
4.1 Organization of the database
The database contains details of projects having equipments each costing Rs 10 lakh and
above located across the country. The details of both projects and equipments are
organized and can be accessed through a variety of search options. For example, the
‘Search For’ box allows users to look for details of a specific equipment, institution, project
title, funding agency and/or any free text search.
As for the structure of the database, each record has been organized under three groups as
given in the following section:
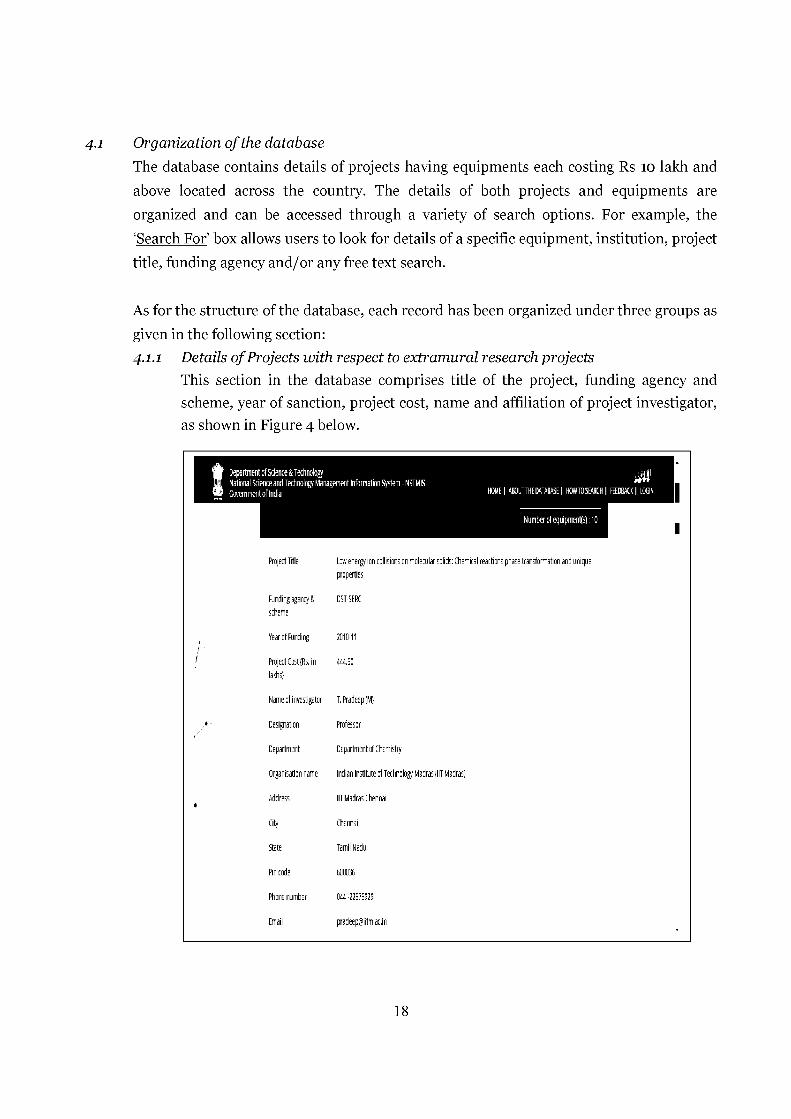
4.1.1 Details o f Projects with respect to extramural research projects
This section in the database comprises title of the project, funding agency and
scheme, year of sanction, project cost, name and affiliation of project investigator,
as shown in Figure 4 below.
EDepartment of Science & TechnologyNational Science and Technology Management Information System - N5TMI5 Government of India HOM E | ABOUT THE DATABASE | HOWTOSEARCH | FEEDBACK | LOGIN
Number of equipmentts): 10
Project Title Low energy ion collisions on molecular solids: Chemical reactions phase transformation and uniqueproperties
Funding agency S scheme
DST-SERC
Year of Funding 2010-11
Project Cost (Es. in lakhs)
444.50
Name of investigator T .Pradeep(M )
Designation Professor
Department Department of Chemistry
Organisation name Indian Institute of Technology Madras (IIT Madras)
Address IIT Madras Chennai
City Chennai
State Tamil Nadu
Pin code 600036
Phone number 044-22575323
Email [email protected]
18
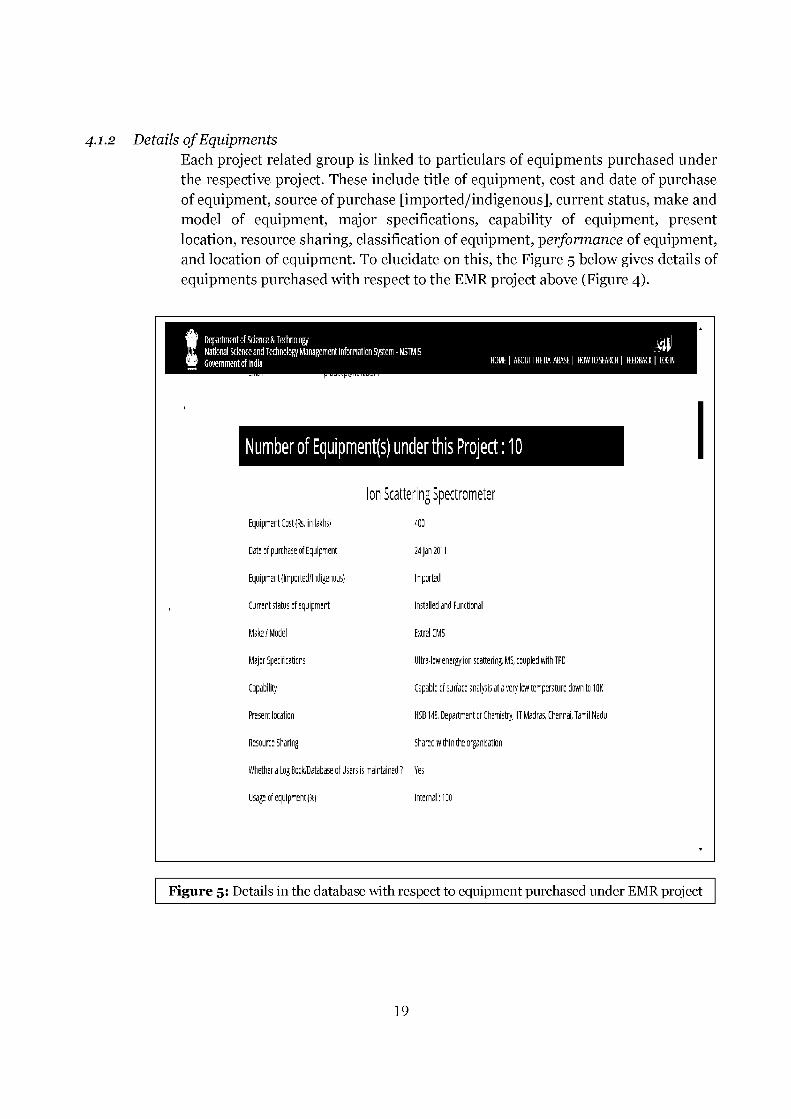
4-1-2 Details o f EquipmentsEach project related group is linked to particulars of equipments purchased under the respective project. These include title of equipment, cost and date of purchase of equipment, source of purchase [imported/indigenous], current status, make and model of equipment, major specifications, capability of equipment, present location, resource sharing, classification of equipment, performance of equipment, and location of equipment. To elucidate on this, the Figure 5 below gives details of equipments purchased with respect to the EMR project above (Figure 4).
EDepartment o f Science & TechnologyNational Science and Technology Management Information System - N5TMI5 Government o f India HOME | AE O U T TH E DATABASE | HOW TOSEARCH | FEEDBACK | LOGIN
Number of Equipment(s) under this Project: 10
Ion Scattering Spectrom eterE q u ip m e n t C o st(R s , in lakhs)
D a te o f p u rc h a s e o f E q u ip m e n t
E q u ip m e n t { Im p o rte d /In d ig e n o u s )
C u rre n t s ta tu s o f e q u ip m e n t
M a t e /M o d e l
M a jo r S pec ifications
C a p a b ility
P re s e n t lo c atio n
R esourc e S h a rin g
2 4 Jan 2011
Im p o rte d
In s ta lle d an t) F u n c tio n a l
E xtrel CMS
U ltra - lo w e n e rg y ion sc a tte rin g , M S, co u p le d w ith TPD
C ap a b le o f su rfa c e an a lys is a t a v e ry lo w te m p e ra tu re d o w n to 1 0K
H S E 148, D e p a r tm e n t o f C h em is try , IIT M a d ra s , C h en n a i, T a m il N a d u
S h a re d w ith in th e o rg a n is a tio n
W h e th e r a Log B o o k /D a ta b a s e o f Users is m a in ta in e d ? Yes
U sage o f e q u ip m e n t ( 1 ) In te r n a l: 100
Figure 5: Details in the database with respect to equipment purchased under EMR project
19

4.1.3 Classification o f EquipmentsA classification scheme has been devised to make the equipment data retrieval as specific as possible. Under the scheme, each item of equipment in the database has been classified into 18 categories of equipment as shown in Figure 6:
Figure 6: Classification of equipments under different categories1. A n a lytica l Instru m en ts
2. C h ro m ato g rap h y
3 . D im en sio n al Instru m en ts
4 . F iltra tio n and W ater P u rificatio n
5 . Im agin g eq uip m en t
6 . L ab o ra to ry autom ation
7. L ab o ra to ry eq uip m en t
8 . L ab o ra to ry safety
9 . L ab o ra to ry S p ectro p h o to m eter
10 .L ab o rato ry su p p lies
11. M ic r o s c o p y -------------
12 .P ro d u ct a n d M ateria l T estin g
13 .R eco rd ers and L o ggers
14 .S am p le P rep aration a n d L iq u id H an d lin g
15 .S ep aration s
16 .S p ectro sco p y
17.T est and M easu rem en t E q uip m en t
18 .O th er
20
A drop-down list of categories has been given to facilitate access to equipments
classified under specific category as listed in the Figure. The search page displays a
list of equipment under the category ‘Spectroscopy along with date of acquisition,
institution name and location. Each link presents particulars of equipment as
shown in Figure 6.
4.1.4 Search Mechanisms
The database makes searchable over 890 items of equipments and can be accessed
through a wide range of search options including simple search terms as well as
complex search combinations using boolean operators (AND, OR, NOT) in various
permutations and combinations. For example, the ‘Search For’ box allows users to
look for details of a specific equipment, institution, project title, funding agency,
location, free text or keywords. ‘Browse by category” box limits search by selecting
the category of equipment. Other search facilities include (i) selecting range of year
of purchase of equipment; (ii) Selecting state where a specific organization is
located.
To further refine search, an ‘Advanced Search’ interface has been devised to enable
filter function by using the connectors — AND and OR. When AND is used, for
example, “Indian Institute of Technology” AND “Analytical instruments” would
only return records that contain both these terms. And, when OR is used, for
example, “Indian Institute of Technology” OR “Analytical instruments” would
return records that contain either of these terms.
Other features include provision to highlight search terms in the display record
and Search button to begin search, and a Reset button to clear the search page.
Queries conducted in the search button may be case insensitive, i.e., a word
entered in lower case will match words entered in upper case, lower case, or mixed
case.
In order to best facilitate users to search database effectively, a search tips
document has been prepared and given in Annexure II
5.0 DATABASE PROMOTION, RESOURCE SHARING AND NETWORKING
5.1 Statkeholders’ Workshop
A stakeholders’ workshop was organized on 30 August 2016 at India Habitat Centre,
Lodhi Road, New Delhi, with a view to provide a platform to project investigators and
scientists to share views and provide inputs leading to policy actions for strengthening the
21

database. The workshop was inaugurated by Prof. Ashutosh Sharma, Secretary,
Department of Science and Technology, Government of India. Dr Parveen Arora, Head
(CHORD-NSTMIS), Department of Science and Technology, Government of india gave
the opening remarks. The objectives of the workshop were to
> Provide an opportunity to project investigators and scientists to share experiences
related to scientific equipments;
> Promote the Equipments Database and facilitate a culture of sharing scientific
equipments thereby promoting scientific collaboration among institutions;
> Evolve a standardized interoperable database of scientific equipments
Figure 7: Inaugural Session: Stakeholders’ WorkshopDr Parveen Arora, Head (CHORD-NSTMIS), Department of Science and Technology,
Government of India; Dr Ajay Mathur, Director-General, TERI; Prof. Ashutosh Sharma,
Secretary, Department of Science and Technology, Government of India; Mr Prabir
Sengupta, Distinguished Fellow and Director, TERI.
A large number of participants from government institutions engaged in R&D, academia,
project investigators among others took part in the workshop. The workshop programme
and the deliberations are given in Annexure III.
22
ANALYTICAL REPORT ON THE
FUNDING PATTERN OF EQUIPMENT
23

6.0 FUNDING PATTERN OF EQUIPMENTS
6.1 Funding Agency-wise Analysis o f Projects and Equipments
Government of India supports and invests in scientific research through various projects
and programmes. One of the key components budgeted for funding is for the acquisition
of multi-user research equipments and support of research facilities at established
institutions. Table 4 below lists the 14 major funding agencies through which Government
of India provided funds allocation for the acquisition of scientific equipments under
extramural sponsored research and other S&T infrastructure schemes during the period
2008-09 to 2010-11.
Table 4: Agencies that provided funds for the acquisition of scientific equipments
Sl No. Abbreviation Name of Funding Agency
1 DAE Department of Atomic Energy
2 DBT Department of Biotechnology
3 DOC Department of Coal
4 DRDO Defence Research and Development Organisation
5 DSIR Department of Scientific and Industrial Research
6 DST Department of Science and Technology
7 ICMR Indian Council of Medical Research
8 ISRO Indian Space Research Organisation
9 MNRE Ministry of New and Renewable Energy
10 MOCIT Ministry of Communications & Information Technology
11 MOEF Ministry of Environment and Forests
12 MOES Ministry of Earth Sciences
13 MOP Ministry of Power
14 MOS Ministry of Steel
The Table 5 below shows agency-wise funding for obtaining equipments under the
projects. As can be seen, during the period 2008-09 to 2010-11, the total funding support
for obtaining 890 items of equipments by the 14 Central and S&T Departments/Agencies
were Rs 54564 lakh.
24

during 2008-09 to 2010-11
Table 5: Funding support by Central and S&T Departments/Agencies for obtaining equipments
Funding
Agency
No. of Projects
(each costing
Rs 50 lakh and
above)
Equipments
(each costing
Rs 10 lakh and
above)
Equipment
cost
(Rs in lakh)
% of total
equipment
funding
Average cost
per equipment
(Rs in lakh)
DST 173 380 24518 44-94 64.52
MOCIT 39 151 12573 23.04 83.27
DBT 148 224 9512 17.43 42.46
MNRE 21 62 2468 4.52 39.81
DSIR 4 10 2160 3.96 216.04
MOEF 2 2 755 1.38 377.65
ICMR 11 17 564 1.03 33.18
DAE 8 9 503 0.92 55.94
DRDO 9 9 410 0.75 45.51
DOC 2 2 362 0.66 181.00
MOES 4 10 358 0.66 35.83
MOS 3 6 172 0.32 28.74
MOP 4 3 133 0.24 44.29
ISRO 3 5 73 0.13 14.64
TOTAL 431 890 54564 100.00 61.30
It may be noted that the Department of Science and Technology was the largest contributor with
Rs 24518 lakh (45%), followed by the Ministry of Communication and Information Technology Rs
12573 lakh (23%), Department of Biotechnology Rs 9512 lakh (17%), Ministry of New and
Renewable Energy Rs 2468 lakh (5%), and Department of Scientific and Industrial Research Rs
2160 lakh (4%) and they together accounted for 94% of the total equipment funding.
25
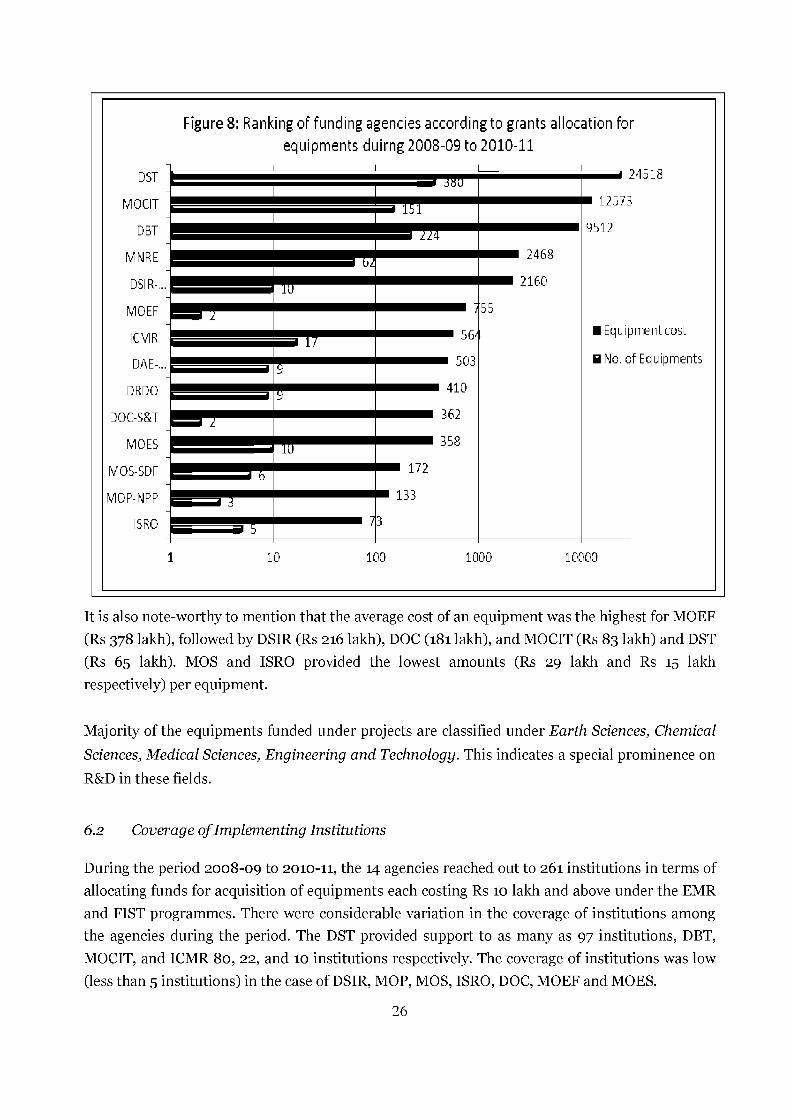
It is also note-worthy to mention that the average cost of an equipment was the highest for MOEF
(Rs 378 lakh), followed by DSIR (Rs 216 lakh), DOC (181 lakh), and MOCIT (Rs 83 lakh) and DST
(Rs 65 lakh). MOS and ISRO provided the lowest amounts (Rs 29 lakh and Rs 15 lakh
respectively) per equipment.
Majority of the equipments funded under projects are classified under Earth Sciences, Chemical
Sciences, Medical Sciences, Engineering and Technology. This indicates a special prominence on
R&D in these fields.
6.2 Coverage of Implementing Institutions
During the period 2008-09 to 2010-11, the 14 agencies reached out to 261 institutions in terms of
allocating funds for acquisition of equipments each costing Rs 10 lakh and above under the EMR
and FIST programmes. There were considerable variation in the coverage of institutions among
the agencies during the period. The DST provided support to as many as 97 institutions, DBT,
MOCIT, and ICMR 80, 22, and 10 institutions respectively. The coverage of institutions was low
(less than 5 institutions) in the case of DSIR, MOP, MOS, ISRO, DOC, MOEF and MOES.
26

Table 6: Ranking of agencies according to coverage of institutions during 2008-09 to 2010-11
Funding
agency
Number of
Institutions
Number of
PI s
No. of
Projects
No. of
Equipments
Equipment
cost
DST 97 159 173 380 24518
MOCIT 22 36 39 151 12573
DBT 80 137 148 224 9512
MNRE 18 21 21 62 2468
DSIR 4 4 4 10 2160
MOEF 2 2 2 2 755
ICMR 10 11 11 17 564
DAE 6 8 8 9 503
DRDO 7 9 9 9 410
DOC 2 2 2 2 362
MOES 2 4 4 10 358
MOS 4 3 3 6 172
MOP 4 4 4 3 133
ISRO 3 3 3 5 73
TOTAL 261 403 431 890 54564
Table 6 also shows that during the period under study, a total of 403 PIs were given funding
support for obtaining equipments each costing Rs 10 lakh and above under projects. Among the
agencies, the outreach to scientists was the highest in the case of DST, which provided support to
159 PIs, followed by DBT (137 PIs), MOCIT (36 PIs) MNRE (21) ICMR (11 PIs) and so on.
6.3 Beneficiary Institutions
As shown in Table 7 below, the 10 institutions together received 297 items of equipment at a total
cost of Rs 29664 lakh accounting for 54% of total funding. Indian Institute of Technology Bombay
got the highest funding support (Rs 6700 lakh) followed by Indian Institute of Technology
Madras (Rs 6353 lakh), Indian Institute of Science Bangalore (Rs 5065 lakh), Indian Institute of
Technology Delhi (Rs 2999 lakh), and so on.
27
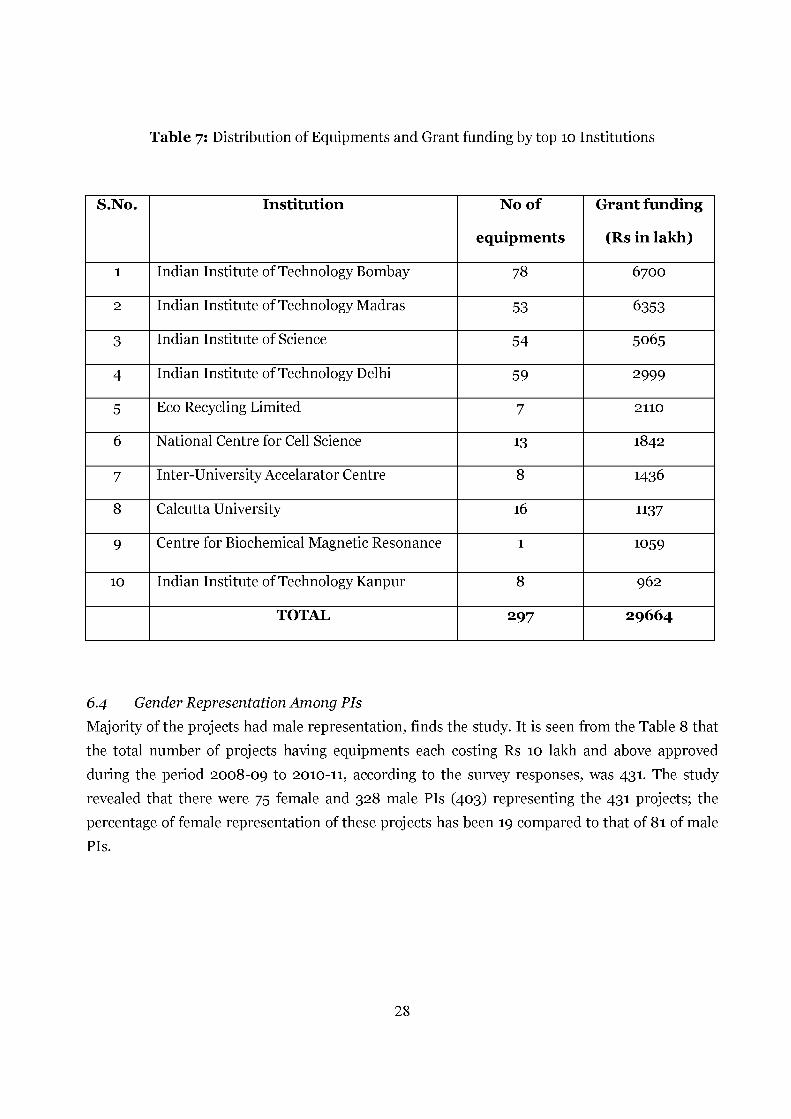
Table 7: Distribution of Equipments and Grant funding by top 10 Institutions
S.No. Institution No of Grant funding
equipments (Rs in lakh)
1 Indian Institute of Technology Bombay 78 6700
2 Indian Institute of Technology Madras 53 6353
3 Indian Institute of Science 54 5065
4 Indian Institute of Technology Delhi 59 2999
5 Eco Recycling Limited 7 2110
6 National Centre for Cell Science 13 1842
7 Inter-University Accelarator Centre 8 1436
8 Calcutta University 16 1137
9 Centre for Biochemical Magnetic Resonance 1 1059
10 Indian Institute of Technology Kanpur 8 962
TOTAL 297 29664
6.4 Gender Representation Among PIs
Majority of the projects had male representation, finds the study. It is seen from the Table 8 that
the total number of projects having equipments each costing Rs 10 lakh and above approved
during the period 2008-09 to 2010-11, according to the survey responses, was 431. The study
revealed that there were 75 female and 328 male PIs (403) representing the 431 projects; the
percentage of female representation of these projects has been 19 compared to that of 81 of male
PIs.
28

Table 8: Gender representation of projects each costing Rs 50 lakh and above and having
equipment each costing Rs 10 lakh and above
Gender of PIs PI-basedrepresentation
Project-basedrepresentation
Number of
Equipments
Funding
support (Rs. In lakh)
Female 75 87 143 8729
Male 328 344 747 45835
Total 403 431 890 54564
6.5 Cost range-wise analysis o f overall purchase of equipments
The amount sanctioned to procure equipments and cost-wise number of equipments is analyzed
for the period 2008-09 to 2010-11. Funding support to obtain these equipments varied
extensively, ie. from Rs 10 lakh to more than a crore of rupees. Consequently, the funds allocated
to all these equipments obtained were grouped into five categories according to the total cost of
the equipment, viz. Rs 10-25 lakh; Rs 26-50 lakh; Rs 51 to 75 lakh; Rs 76 lakh to 1 crore; and Rs 1
crore and above as shown in the Figure below. Details of high valued equipments costing Rs 50
lakh and above along with Funding agency, Acquisition type, Institution and State are furnished
in Annexure IV.
29

As is seen in the Figure, the maximum number of R&D equipments obtained (428 at a total cost of Rs 6784 lakh) was in the cost range of Rs 10 to 25 lakh constituting 12% of the total grant for equipment; 225 equipments items at a cost of Rs 8156 lakh were in the cost range of Rs 26 to 50 (15%); 71 items at Rs 4336 lakh in the range of 51 to Rs 75 lakh (8 %); 44 items at Rs 3841 lakh in the range of Rs 76 to Rs 1 crore (7%); 122 items at Rs 31446 lakh in the range of cost range of above Rs 1 crore constituting 58%.
The number of equipments decreased with increase in the sanctioned cost range of Rs 10 lakh to
Rs 1 crore. The figure also indicates the allocation of maximum grant for acquisition of high-cost
equipment was in this cost range of Rs 1 crore and above.
6.6 Funding pattern of equipments
The total approved cost for equipments varied for 2008-09 (Rs 12777 lakh); 2009-10 (Rs 12116
lakh); and 2010-11 (Rs 29670 lakh)
30

There has been an increasing trend in both the number of equipments and approved cost with
substantial increase in funding between the period 2008-09, 2009-10 and for the period 2010-11.
However, the period 2009-10 witnessed a small decrease in both the number of equipments (230
nos.) and total approved cost of equipment (Rs. 12116 lakh) indicated a drop in support both in
terms of equipment and funding.
6.7 Acquisition pattern of import vs indigenous equipments
More money spent on imported items of equipments compared to indigenous. According to the
survey responses, the amount spent on acquisition from indigenous and foreign sources during
the period 2008-09 to 2010-11 is given in Table 9. It is revealed from the study that majority of
the equipments were imported 806 (91%) at a cost of Rs 51345 lakh as against indigenously
manufactured equipment 84 (9%) at the cost of Rs 3219 lakh.
__________Table 9: Acquisition pattern of equipments - import vs indigenous___________Year of funding Imported Indigenous
Cost o f equipment (Rs in lakh)
Number of equipments
Cost o f equipment (Rs in lakh)
Number of equipments
2008-09 12243 215 534 172009-10 11467 211 649 192010-11 27634 380 2036 48Total 51345 806 3219 84
Number of equipments
2008-09 2009-10 2010-11
M Im ported B Indigenous
Figure 11: Acquisition pattern of import vs indigenous pattern of equipments
31
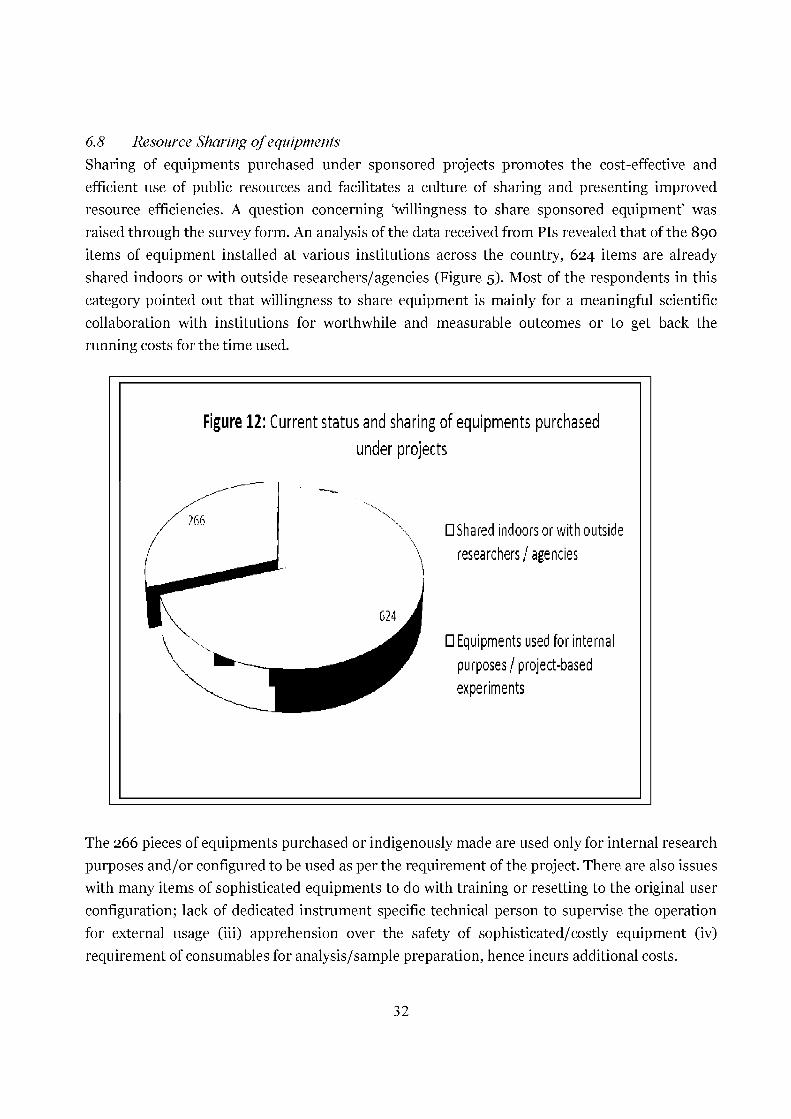
6.8 Resource Sharing o f equipments
Sharing of equipments purchased under sponsored projects promotes the cost-effective and
efficient use of public resources and facilitates a culture of sharing and presenting improved
resource efficiencies. A question concerning ‘willingness to share sponsored equipment’ was
raised through the survey form. An analysis of the data received from PIs revealed that of the 890
items of equipment installed at various institutions across the country, 624 items are already
shared indoors or with outside researchers/agencies (Figure 5). Most of the respondents in this
category pointed out that willingness to share equipment is mainly for a meaningful scientific
collaboration with institutions for worthwhile and measurable outcomes or to get back the
running costs for the time used.
Figure 12: Current status and sharing of equipments purchasedunder projects
□ Shared indoors or w ith outside
researchers/ agencies
□ Equipments used fo r internal
pu rposes/p ro jec t-based
experim ents
The 266 pieces of equipments purchased or indigenously made are used only for internal research
purposes and/or configured to be used as per the requirement of the project. There are also issues
with many items of sophisticated equipments to do with training or resetting to the original user
configuration; lack of dedicated instrument specific technical person to supervise the operation
for external usage (iii) apprehension over the safety of sophisticated/costly equipment (iv)
requirement of consumables for analysis/sample preparation, hence incurs additional costs.
32
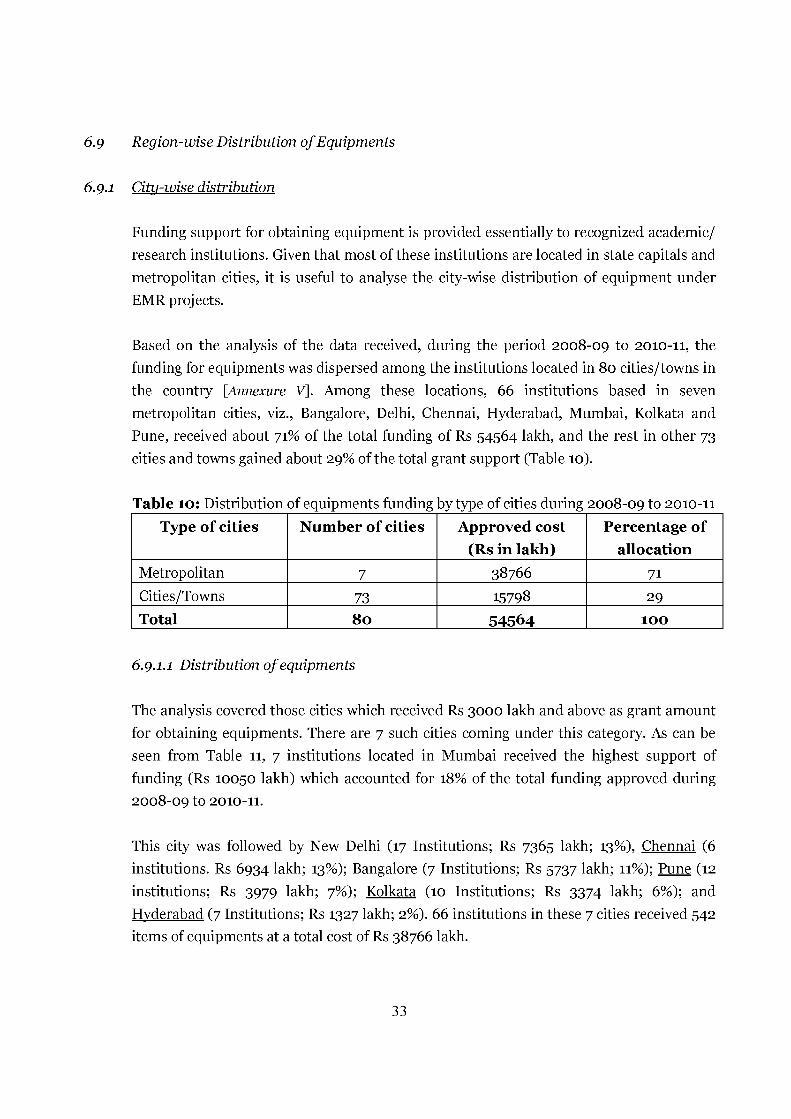
6.9 Region-wise Distribution o f Equipments
6.9.1 City-wise distribution
Funding support for obtaining equipment is provided essentially to recognized academic/
research institutions. Given that most of these institutions are located in state capitals and
metropolitan cities, it is useful to analyse the city-wise distribution of equipment under
EMR projects.
Based on the analysis of the data received, during the period 2008-09 to 2010-11, the
funding for equipments was dispersed among the institutions located in 80 cities/towns in
the country [Annexure V]. Among these locations, 66 institutions based in seven
metropolitan cities, viz., Bangalore, Delhi, Chennai, Hyderabad, Mumbai, Kolkata and
Pune, received about 71% of the total funding of Rs 54564 lakh, and the rest in other 73
cities and towns gained about 29% of the total grant support (Table 10).
Table 10: Distribution of equipments funding by type of cities during 2008-09 to 2010-11
Type of cities Number of cities Approved cost
(Rs in lakh)Percentage of
allocation
Metropolitan 7 38766 71Cities/Towns 73 15798 29Total 80 54564 100
6.9.1.1 Distribution o f equipments
The analysis covered those cities which received Rs 3000 lakh and above as grant amount
for obtaining equipments. There are 7 such cities coming under this category. As can be
seen from Table 11, 7 institutions located in Mumbai received the highest support of
funding (Rs 10050 lakh) which accounted for 18% of the total funding approved during
2008-09 to 2010-11.
This city was followed by New Delhi (17 Institutions; Rs 7365 lakh; 13%), Chennai (6
institutions. Rs 6934 lakh; 13%); Bangalore (7 Institutions; Rs 5737 lakh; 11%); Pune (12
institutions; Rs 3979 lakh; 7%); Kolkata (10 Institutions; Rs 3374 lakh; 6%); and
Hyderabad (7 Institutions; Rs 1327 lakh; 2%). 66 institutions in these 7 cities received 542
items of equipments at a total cost of Rs 38766 lakh.
33

Table 11: Distribution of equipments with a total grant funding of Rs 3000 and
above received by select cities
City Number of
Institutions
Number of
equipments
Equipment
cost (Rs in
% of total
grant funding
lakh)
Mumbai 7 102 10050 18
New Delhi 17 149 7365 13
Chennai 6 68 6934 13
Bangalore 7 66 5737 11
Pune 12 57 3979 7
Kolkata 10 57 3374 6
Hyderabad 7 43 1327 2
Total 66 542 38766 71
These cities together received about 71% of total grant funding from the central government
agencies during 2008-09 to 2010-11. Distribution of funding for equipment by all the 80 cities
during 2008-2010 is given in Annexure IV.
Figure 13: City-wise distribution of grant funding equipments
B Bangalore B New Delhi M Chennai B Hyderabad B Mumbai B Kolkata M Pune
34

6.9-2 State-wise Distribution
The state-wise grant funding for equipment by the central government agencies is shown in Table
12. The table shows the ranking of states in terms of range of grant funded to each state. About
80% (Rs 43,666 lakh) of total funding of Rs 54564 lakh was approved to the institutions located
in six states. Maharashtra topped the list with a grant funding of Rs 14192 lakh, followed by Tamil
Nadu (Rs 8645 lakh), Delhi (Rs 7365 lakh) Karnataka (Rs 6448 lakh), West Bengal (Rs 4028
lakh), and Kerala (Rs 2989 lakh). These states together accounted for about 80% of total number
of equipments (633) during 2008-09 to 2010-11.
Table 12: State-wise grant funding by top six states
State Number of Grant Funding Percentage of funding
Equipments (Rs in lakh)
Maharashtra 167 14192 26.0
Tamil Nadu 108 8645 15.8
Delhi 149 7365 13.5Karnataka 81 6448 11.8
West Bengal 77 4028 7.4Kerala 51 2989 5.5
TOTAL 633 43666 80.0
Institutions located in the remaining 18 states/UTs, had received about Rs 10,897 Lakh of grant
funding for a total of 257 items of equipments. The states receiving a grant funding less than Rs
500 lakh are Puducherry, Himachal Pradesh, Goa, Haryana, Manipur, Chandigarh, Meghalaya,
Jammu and Kashmir, and Jharkhand. These 10 states together had 36 items of equipment and
accounted for only 2% (Rs 1000.44 lakh) of total grant funding.
6.9.2.1 Equipment funding for North-Eastern Region
During the period, the three states in the north-eastern region, viz. Assam, Manipur, and
Meghalaya accounted for only 2.4% (Rs 1289 lakh) of the total grant funding.
Table 13: Equipment Funding received by the three North-Eastern States
StateNumber of
Equipment
Grant Funding
(Rs in lakh)Percentage of
Funding
Assam 32 1139 2.1
Manipur 4 103 0.2
Meghalaya 1 47 0.1
Total 37 1289.0 2.4
35
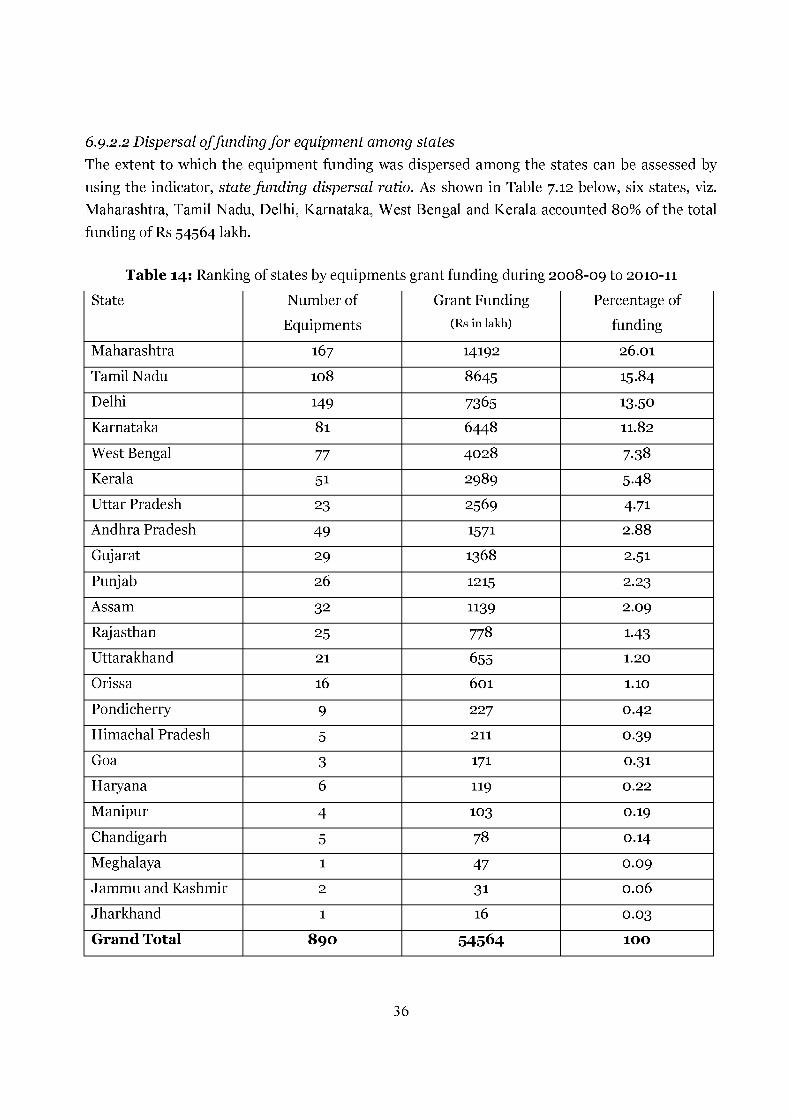
6.92.2 Dispersal o f funding for equipment among states
The extent to which the equipment funding was dispersed among the states can be assessed by
using the indicator, state funding dispersal ratio. As shown in Table 7.12 below, six states, viz.
Maharashtra, Tamil Nadu, Delhi, Karnataka, West Bengal and Kerala accounted 80% of the total
funding of Rs 54564 lakh.
Table 14: Ranking of states by equipments grant funding during 2008-09 to 2010-11
State Number of
Equipments
Grant Funding
(Rs in lakh)
Percentage of
funding
Maharashtra 167 14192 26.01
Tamil Nadu 108 8645 15.84
Delhi 149 7365 13.50
Karnataka 81 6448 11.82
West Bengal 77 4028 7.38
Kerala 51 2989 5.48
Uttar Pradesh 23 2569 4.71
Andhra Pradesh 49 1571 2.88
Gujarat 29 1368 2.51
Punjab 26 1215 2.23
Assam 32 1139 2.09
Rajasthan 25 778 1.43
Uttarakhand 21 655 1.20
Orissa 16 601 1.10
Pondicherry 9 227 0.42
Himachal Pradesh 5 211 0.39
Goa 3 171 0.31
Haryana 6 119 0.22
Manipur 4 103 0.19
Chandigarh 5 78 0.14
Meghalaya 1 47 0.09
Jammu and Kashmir 2 31 0.06
Jharkhand 1 16 0.03
Grand Total 890 54564 100
36

7.0 RECOMMENDATIONS
The “Development of Database of Equipment Funded under Extramural R&D Projects” is an
important and useful project for both the government and the scientific research fraternity. The
database depicts the progress and research trends in various sectors of scientific research and
development. Following inferences were derived while conducting the survey:
1. Institutionalization of central hub facility of equipments;
2. Optimal utilization of scientific resources through resource sharing;
3. Appropriate maintenance of scientific resources;
4. Avoiding duplication effort to procure the same equipment by the same
organization/department;
5. Challenges experienced by the PI, while procuring or importing certain equipments;
6. Enhancing collaborative research in cross-disciplinary areas;
7. Providing appropriate capacity building for technically handling equipments;
8. Exchange of technical experts to handle certain sensitive equipments;
9. Identifying local vendors or indigenous manufacturers for maintenance, supplying
spare parts
10. Outcomes of research
11. Remuneration to technical staff
12. Release of funds/instalments
Recommendation 1 : Centralized repository/Central lab facilities
Major equipments purchased from various projects are generally of large significance and
hence their proper utilization is very crucial. Most efficient utilization of these equipment
can be made by:
i) making them as a part of central lab facilities covering multidisciplinary
areas of research by the host Institute;
ii) developing ways to share the facilities with other institutes/individual
researchers and students to enhance research and training;
Recommendation 2 : Optimum usage of equipment/resource sharing
During the survey, it was strongly felt that equipment purchased against projects and
programmes should be optimally used for research purpose. After the completion of the
project, if the equipment is lying unused then it should be allowed to be used by other
37
research organizations or researchers against a nominal fee, so that the maintenance of
the equipment can be carried out.
PIs and Heads of Departments should announce/publicise, through the database,
information on auctioning, donating, transferring of old/obsolete equipment thereby
facilitating optimum utilization of equipment.
Recommendation 3: Maintenance o f scientific resources
During the survey, it was realized that there is a need for appropriate maintenance of these
scientific equipment. AM C should be renewed to increase the life span of the equipment.
Periodic upgradation of the equipment would be required, wherever it is possible. Separate
funds should be allocated or the respective institution should spend from their own corpus.
Upgrading equipment
As technology becomes obsolete due to rapid technological advances, additional financial
support is required for upgrading the equipment to maintain its technical standard.
Upgrading the equipment may be required even after completion of project.
Maintenance of equipment
There should be a special grant programme for renewal of annual maintenance costs for
equipment, especially spare parts and accessories. Many a time, equipments remain
unutilized because of lack of maintenance or inadequate maintenance which can even lead
to accidents and health problems.
Recommendation 4: Avoiding duplication o f purchase o f same equipment by the same
organization
Recommendation 5: Exploring the right vendor offering right cost for the equipment
Recommendation 6: Enhance collaborative research in cross-disciplinary areas
The database will facilitate a culture of sharing scientific equipments thereby promoting
scientific collaboration among institutions
Recommendation 7: Manpower training
Government needs to additionally invest in training of laboratory manpower for operating
the specialized / state-of-the-art equipment. This will be useful in optimal utilization of
38
the equipment; as also retention of trained professionals for the full term of the project
thereby preventing delay in the timely completion of the project;
There should be provision for organizing capacity building programmes at different levels
such as from Technical Assistant to Lab Attendant level;
After completion of a project, the trained technical expert should be absorbed in the same
organisation or to be shifted to other organization/centre. Because in many cases, after the
completion of project, the technical experts are no longer available and as a result the
equipment is lying idle in the organization.
Recommendation 8: Exchange o f technical experts to handle certain sensitive
equipmentIf there is a paucity of technical experts to handle sensitive equipment, then
there could be an exchange programme between institutions can be devised.
Recommendation q: To identify to local vendors or indigenous manufacturers for
maintenance, supplying spare parts
Obtaining imported equipments, in many cases, was time consuming due to fluctuations
in foreign exchange rate and at times lack of stock of the required equipment parts. There
are quite a number of other constraints when it comes to purchase of equipments.
One possible solution could be to encourage indigenous manufacture of equipment by the
Government. For this, a conducive policy framework and guidelines needs to be in place.
Recommendation 10: Outcomes o f Research
Scientific agencies of central government support scientific and technological research in
the form of extramural or sponsored R&D projects. Measurement of outcome of these
projects is necessary to assess value for money invested in these projects. While we may
have many yardsticks for such measurement, we have found following could be used as
standard for all projects:
> Research papers published and presented
> PhDs produced
> New principle/theory developed
> Instruments /products developed
39

Recommendation 11: Remuneration to technical staff
Staff in the technical category is not willing to work with the current salary structure fixed
for JRF or SRF by the Government. The salary given is very low as compared to what is
offered in the corporate or public sector undertakings. Government may look into the
present salary structure for JRF or SRF for consideration.
Recommendation 12: Release of funds/instalments
Enormous delay in releasing funds/instalments by the funding agency obstruct processing
of equipment purchase. This leads to delay in timely project completion. The government
may look into the current system and consider incorporating specific payment schedule in
the project contract.
40
8.0 REFERENCES
1. Directories of Extramural Research and Development Projects 2008-09, 2009-10 and
2010-11
2. FIST programme 2008, 2009 and 2010. Department of Science and Technology,
Governmentof India
41


![From: Montie Young [montieyoung@ev1.net] Jonathan G ...Allard, Wayne CO R 224-5941 224-6471 Campbell, Ben Nighthorse CO R 224-5852 228-4609 Dodd, Christopher J. CT D 224-2823 224-1083](https://static.fdocuments.in/doc/165x107/609bfa156780b67dff5623ee/from-montie-young-montieyoungev1net-jonathan-g-allard-wayne-co-r-224-5941.jpg)