Project Activity Report for Emmet County
39
ASSET MANAGEMENT 2011 Pavement Ratings Northwest Michigan Council of Governments North Region Office P.O. Box 506 1088 M-32 East Traverse City, MI 49685-0506 Gaylord, MI 49735 Phone: (231) 929-5000 Phone: (888) 304-MDOT (6368 Fax: (231) 929-5012 Fax: (989) 731-0536 Web: www.nwm.org Web: www.michigan.gov/mdot
Transcript of Project Activity Report for Emmet County

ASSET MANAGEMENT
2011 Pavement Ratings
Northwest Michigan Council of Governments North Region Office P.O. Box 506 1088 M-32 East Traverse City, MI 49685-0506 Gaylord, MI 49735 Phone: (231) 929-5000 Phone: (888) 304-MDOT (6368 Fax: (231) 929-5012 Fax: (989) 731-0536 Web: www.nwm.org Web: www.michigan.gov/mdot

2011 Asset Management Report Page 1 Northwest Michigan Council of Governments
Acknowledgements The 2011 transportation asset management data collection effort in northwest Lower Michigan would not have been possible without the participation and commitment of the following individuals: Burt Thompson – Antrim County Road Commission Nancy Roseman – Benzie County Road Commission Andrew Perkette – Benzie County Road Commission Patrick Harmon – Charlevoix County Road Commission Brian Gutowski – Emmet County Road Commission Brent Shank – Emmet County Road Commission Bill LaCross – City of Petoskey Mary Gillis – Grand Traverse County Road Commission John Rogers – Grand Traverse County Road Commission Heather Jamison – Grand Traverse County Road Commission Mark Jones – City of Traverse City Jamie Woodhams – Kalkaska County Road Commission Jeff Root - Kalkaska County Road Commission Jim Johnson – Leelanau County Road Commission Jerry Peterson – Manistee County Road Commission Sharon Johnson – Manistee County Road Commission Jack Garber – City of Manistee Kathie Boyle – City of Manistee Brandon Prince - City of Manistee Kelly Bekken – Missaukee County Road Commission Dennis Nebo – Missaukee County Road Commission Alan Cooper – Wexford County Road Commission Karl Hanson – Wexford County Road Commission Bruce DeWitt – City of Cadillac Lyn Zuiderveen – Cadillac Transportation Service Center, MDOT Kim Mikula – Gaylord Transportation Service Center, MDOT Jeff Hunt – Traverse City Transportation Service Center, MDOT Richard Duell – Northeast Michigan Council of Governments Michael P. Woods – Northwest Michigan Council of Governments Many thanks as well to the State of Michigan Transportation Asset Management Council and the staff from the Michigan Department of Transportation for their leadership, support, and commitment to this strategic initiative.

2011 Asset Management Report Page 2 Northwest Michigan Council of Governments
Table of Contents
I. PROGRAM OVERVIEW ............................................................................................................... 3
WHAT IS PAVEMENT ASSET MANAGEMENT? .................................................................................... 3 HISTORICAL BACKGROUND ............................................................................................................. 3 HOW IS MDOT USING THE ASSET MANAGEMENT APPROACH FOR TRANSPORTATION PLANNING? ..... 4 WHAT ROLE DOES THE NORTHWEST MICHIGAN COUNCIL OF GOVERNMENTS PLAY IN
TRANSPORTATION ASSET MANAGEMENT? ....................................................................................... 4
II. ELEMENTS OF PAVEMENT MANAGEMENT ............................................................................ 6
III. ASSET MANAGEMENT ROAD ASSESSMENT TOOLS ........................................................... 6
IV. REGIONAL DATA COLLECTION PROCESS ......................................................................... 11
V. EXPLORING THE DATA COLLECTION RESULTS ................................................................. 12
ANTRIM COUNTY ......................................................................................................................... 12 BENZIE COUNTY .......................................................................................................................... 14 CHARLEVOIX COUNTY .................................................................................................................. 16 EMMET COUNTY .......................................................................................................................... 18 GRAND TRAVERSE COUNTY ......................................................................................................... 20 KALKASKA COUNTY ..................................................................................................................... 22 LEELANAU COUNTY ..................................................................................................................... 24 MANISTEE COUNTY ...................................................................................................................... 26 MISSAUKEE COUNTY .................................................................................................................... 28 WEXFORD COUNTY ...................................................................................................................... 30 REGIONAL SUMMARY ................................................................................................................... 32
VI. DATA USE & APPLICATION................................................................................................. 366
VII. MORE INFORMATION ABOUT TRANSPORTATION ASSET MANAGEMENT ................... 366
ADDITIONAL RESOURCES ........................................................................................................... 366 CONTACT INFORMATION ............................................................................................................. 377

2011 Asset Management Report Page 3 Northwest Michigan Council of Governments
I. PROGRAM OVERVIEW
What Is Pavement Asset Management? Pavement Asset Management is a process for collecting surface condition data about the existing road network and managing pavement conditions based on strategic goals outlined by the MDOT and local road agencies. It is a systematic process of inventory, scenario evaluation, and action that results in selecting the best method for identifying, prioritizing, and implementing road construction projects. Ultimately, asset management is a planning tool that is used by transportation agencies to make the most efficient use of public resources for the purposes of improving road infrastructure in a community. The major elements of asset management are:
Establishing goals and objectives through the development of a strategic plan
Collecting data to measure progress toward achieving the established goals and objectives
Using management systems to control various processes
Developing appropriate performance measures
Identifying standards and benchmarks
Developing alternative analysis procedures
Making decisions based on these results and developing an appropriate program
Implementing the program
Monitoring and reporting results of actions taken
Historical Background The 1991 Intermodal Surface Transportation Efficiency Act (ISTEA) was the first legislation to systematically address asset management and require state departments of transportation to develop management systems for bridge, congestion, intermodal, pavement, public transportation, and safety assets. The legislation also included performance measures and an opportunity for enhanced public involvement and input in the transportation planning process. The impetus for this legislation was a call for greater accountability and investment in the country’s transportation network from voters and elected officials. The Governmental and Performance Results Act of 1993 defined the direction of the process further by requiring federal agencies to develop a five-year strategic plan and to revise it at least every three years. The law also required the development of a performance plan. Executive Order 12893 of 1994 required the systematic analysis of benefits and costs for federal infrastructure projects. States were encouraged to follow the same procedures. The intent behind this order was to allow for the development of a list of comparable project alternatives that would lead to the best one being implemented. In 1994, the Governmental Accounting Standards Board (GASB) Concepts Statement No. 2, Service Efforts and Accomplishments Reporting stated that government entities should ideally be following the same strategic process for planning, implementing, and evaluating projects. In 1999, GASB’s Statement 34 established expanded guidelines for reporting financial data for state and local governments. The new guidelines require government-wide assessment of net assets and depreciation, including infrastructure. The basis of this guideline rests in the understanding that a

2011 Asset Management Report Page 4 Northwest Michigan Council of Governments
community has an obligation as the fiduciary of public infrastructure and public resources, to set goals for management of that infrastructure. The impacts of GASB 34 require an up-to-date inventory of assets, a manner to perform condition assessments at least once every three years, a way to measure the results, and an estimate of the costs to maintain and preserve the assets at a determined condition level. An asset management system is one framework that provides a process to preserve the utility of infrastructure, and to promote effective stewardship of the community’s resources and quality of life.
How Is MDOT Using The Asset Management Approach For Transportation Planning? MDOT is using asset management strategically and systematically. The development of the process is ongoing, and as advances are made in technology, better data and processing capabilities will undoubtedly improve the process and outcomes. MDOT has incorporated the major elements of asset management into five fundamental components of sound management:
Policy Goals and Objectives
Information and Data Collection
Planning and Programming
Program Delivery
Monitoring and Reporting
The activities associated with these five elements are described in Figure 1 below. MDOT uses an integrated, automated decision support tool called the Transportation Management System (TMS). TMS has the capability to identify condition, analyze use patterns, and determine deficiencies of the transportation infrastructure. Ideally, MDOT envisions the TMS as a single, unified management application that uses a logical, relational database.
What Role Does The Northwest Michigan Council of Governments Play In Transportation Asset Management? Section (4) of Act 499 of the Public Acts of 2002”…the state planning and development regions shall provide qualified technical assistance to the Council.” In 2003, MDOT’s newly formed Asset Management Council, which was appointed by the State Transportation Commission, contracted statewide with the 21 regional planning agencies and metropolitan planning organizations to coordinate local pavement conditions assessments for the federal-aid road system in their region as a component of the State’s asset management program. Each of these agencies was responsible for working with MDOT to provide training and education to local officials and staff, scheduling and participating in collection efforts with the road agencies and MDOT officials, and analyzing and reporting data. As the regional planning agency for northwest Lower Michigan, NWMCOG coordinated asset management activities in Antrim, Benzie, Charlevoix, Emmet, Grand Traverse, Kalkaska, Leelanau, Manistee, Missaukee, and Wexford Counties.

2011 Asset Management Report Page 5 Northwest Michigan Council of Governments
PRIORITIZATION ANALYSIS 5-YEAR PROGRAM
DECISION-MAKING & PROGRAM
DEVELOPMENT Architectural Program Develop Transportation
Programs Five-Year Road & Bridge
Program Program/Project Management
Systems
IMPLEMENT PLAN TRANSPORT Field Manager
MONITORING & REPORTING Highway Performance
Monitoring System Internet/Intranet Michigan Transportation
Facts and Figures National Bridge Inventory Newsletters Sufficiency
DATA COLLECTION Architecture Project Bridge Condition Framework Global Positioning Highway Performance
Monitoring System Sufficiency/Distress Traffic
MANAGEMENT SYSTEMS
INTEGRATION Transportation Management Systems Bridge Congestion Intermodal Maintenance Pavement Public Transportation Safety
DEVELOPMENT OF ALTERNATIVES
PERFORMANCE MEASURES
AND STANDARDS Quality Engineering Transportation
Management Systems
Figure 1 – MDOT’s Transportation Asset Management Model

2011 Asset Management Report Page 6 Northwest Michigan Council of Governments
II. ELEMENTS OF PAVEMENT MANAGEMENT A major goal of a road management agency is to ensure that roads are comfortable, safe, and maintained economically. Both environmental impacts, such as weather and aging, and structural impacts, such as traffic load and volume, affect the way a pavement surface deteriorates. Some pavements deteriorate at a faster rate than others. A full scale, comprehensive assessment of road conditions includes collecting and assessing data about the following characteristics: roughness (ride), surface distress (condition), surface skid characteristics, and structure (pavement strength and deflection). Planners can look at pavement data to develop short- and long-range plans that take available resources and budget constraints into account. At the local government level, some of these assessments are managed informally. MDOT uses a simplified visual surface pavement evaluation system called PASER as one component of its pavement management program.
III. ASSET MANAGEMENT ROAD ASSESSMENT TOOLS The PASER system is a visual evaluation tool to measure and classify road surfaces based on their surface condition and appearance. There are seven different acceptable surface types within the PASER system: Asphalt, Concrete, Composite, Sealcoat, Brick, Gravel, or Unimproved. Each surface type has its own rating criteria based on the unique characteristics of that surface type. For example, when evaluating the condition of Asphalt, the extent of surface defects, surface deformation, cracking, patches, and potholes are visually assessed. PASER evaluation criteria translate into condition values that are numeric and range from 1 to 10. Generally, ratings of 5-10 are considered “good,” while ratings from 1-4 are considered “poor.” The rating system is described more specifically in Figure 2 below.
Figure 2 – Pavement Surface Evaluation and Rating System1
SURFACE RATING
VISIBLE DISTRESS
GENERAL CONDITION/
TREATMENT MEASURES
10 Excellent
None.
New construction.
9
Excellent
None.
Recent overlay. Like new.
8
Very Good
No longitudinal cracks except reflection of paving joints. Occasional transverse cracks, widely spaced (40’ or greater). All cracks sealed or tight (open less than ¼”).
Recent sealcoat or new cold mix. Little or no maintenance required.
1 Asphalt-PASER Manual – Pavement Surface Evaluation and Rating. 2002. Wisconsin Transportation
Information Center. Madison, WI.

2011 Asset Management Report Page 7 Northwest Michigan Council of Governments
7
Good
Very slight or no raveling, surface shows some traffic wear. Longitudinal cracks (open ¼”) due to reflection or paving joints. Transverse cracks (open ¼”) spaced 10’ or more apart, little or slight crack raveling. No patching or very few patches in excellent condition.
First signs of aging. Maintain with routine crack filling.
6
Good
Slight raveling (loss of fines) and traffic wear. Longitudinal cracks (open ¼” to ½”), some spaced less than 10’. First sign of block cracking. Slight to moderate flushing or polishing. Occasional patching in good condition.
Show signs of aging. Sound structural condition. Could extend life with sealcoat.
5
Fair
Moderate to severe raveling (loss of fine and coarse aggregate). Longitudinal and transverse cracks (open ½”) show first signs of slight raveling and secondary cracks. First signs of longitudinal cracks near pavement edge. Block cracking up to 50% of surface. Extensive to severe flushing or polishing. Some patching or edge wedging in good condition.
Surface aging. Sound structural condition. Needs sealcoat or non-structural overlay (less than 2”).
4
Fair
Severe surface raveling. Multiple longitudinal and transverse cracking with slight raveling. Longitudinal cracking in wheel path. Block cracking (over 50% of surface). Patching in fair condition. Slight rutting or distortions (1/2” to 1” deep).
Significant aging and first signs of need for strengthening. Would benefit from structural overlay (2” or more).
3
Poor
Closely spaced longitudinal and transverse cracks often showing raveling and crack erosion. Severe block cracking. Some alligator cracking (less than 25% of surface). Patches in fair to poor condition. Moderate rutting or distortion (1” or 2” deep). Occasional potholes.
Needs patching and repair prior to major overlay. Milling and removal of deterioration extends the life of overlay.
2
Very Poor
Alligator cracking (over 25% of surface). Severe distortions (over 2” deep). Extensive patching in poor condition. Potholes.
Severe deterioration. Needs reconstruction with extensive base repair. Pulverization of old pavement is effective.
1
Failed
Severe distress with extensive loss of surface integrity.
Failed. Needs total reconstruction.

2011 Asset Management Report Page 8 Northwest Michigan Council of Governments
To summarize, ratings of 8-10 require little or no maintenance, aside from routine, day-to-day activities such as street sweeping, drainage clearing, gravel shoulder grading, and sealing cracks to prevent water seepage. The photographs below are examples of roads in the routine maintenance category. Routine, Little or No Maintenance – Ratings 8-10. Source: Asphalt PASER Manual. Transportation Information Center, University of Wisconsin-Madison.
The picture in the upper left shows a newly constructed road which would be given a rating of 10. The upper right picture shows a recent overlay making this road a rating of 9. The picture to the left would be rated an 8 because a recent slurry seal was applied. Similarly the picture in the bottom right corner had a chip seal put down giving the road surface a rating of 8. The picture in the bottom left corner would also be rated an 8 for its surface which needs almost no maintenance. Notice the widely spaced sealed cracks.

2011 Asset Management Report Page 9 Northwest Michigan Council of Governments
Ratings of 5-7 require capital preventative maintenance. These are roads that are beginning to show the first signs of wear. The roads are still structurally supported, but the surface may be starting to deteriorate. Capital preventative maintenance fixes protect the pavement structure and slow the rate of deterioration, which maintains and improves the functional condition of the road. The photographs below show roads in the capital preventative maintenance category. Capital or Preventative Maintenance – Ratings 5-7. Source: Asphalt PASER Manual. Transportation Information Center, University of Wisconsin-Madison. The upper left picture is an example of a surface rated 7. This road has tight longitudinal cracks and sealed transverse cracks that are 10’to 40’ apart. The picture in the upper right shows a rating 6 due to it’s slight surface raveling and tight cracks that are less than 10’ apart. Other surface defects that start to show up in a rating of 6 are moderate flushing (shown middle left) and early signs of block cracking (shown middle right). Examples of surface defect from rating 5 are block cracking with open cracks (shown bottom left) and extensive wedges and patched that are in good condition (shown bottom right).

2011 Asset Management Report Page 10 Northwest Michigan Council of Governments
Ratings of 1-4 require structural improvements such as resurfacing or major reconstruction. The photographs below are examples of roads that need structural improvements. Structural Improvements – Ratings 1-4. Source: Asphalt PASER Manual. Transportation Information Center, University of Wisconsin-Madison.
The four pictures to the left are all examples of surface defects that could appear in a rating of 4. They include: rutting up to 1”, extensive block cracking, patches in good condition, and severe raveling with extreme loss of aggregate. The picture below is an example of rating 3 showing patches in poor condition. Other defects for rating 3 include alligator cracking, rutting 1” to 2”, and crack erosion
The pictures below show road surfaces with ratings of 2 and 1. Examples of defects from rating 2 include rutting greater than 2”, patches in very poor condition, and extensive alligator cracking. Surface defects for a rating of 1 include: extensive loss of surface, numerous potholes, and severe alligator cracking.
2011 Asset Management Report Page 11 Northwest Michigan Council of Governments
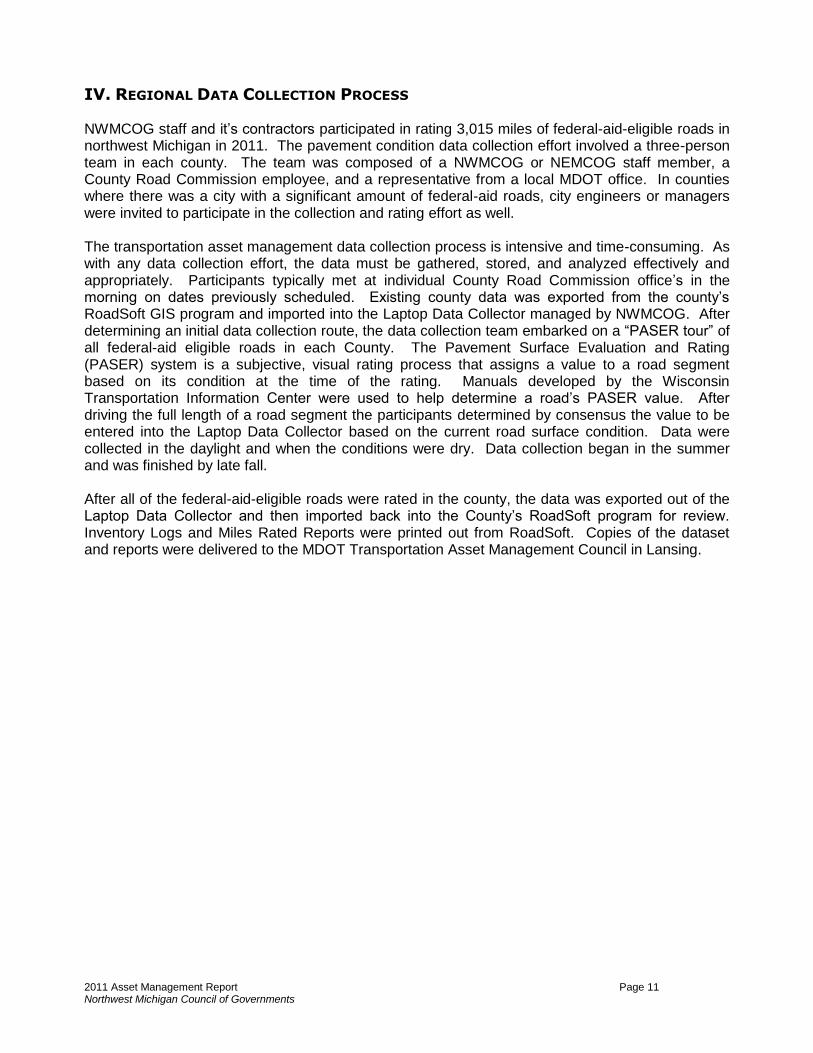
IV. REGIONAL DATA COLLECTION PROCESS NWMCOG staff and it’s contractors participated in rating 3,015 miles of federal-aid-eligible roads in northwest Michigan in 2011. The pavement condition data collection effort involved a three-person team in each county. The team was composed of a NWMCOG or NEMCOG staff member, a County Road Commission employee, and a representative from a local MDOT office. In counties where there was a city with a significant amount of federal-aid roads, city engineers or managers were invited to participate in the collection and rating effort as well. The transportation asset management data collection process is intensive and time-consuming. As with any data collection effort, the data must be gathered, stored, and analyzed effectively and appropriately. Participants typically met at individual County Road Commission office’s in the morning on dates previously scheduled. Existing county data was exported from the county’s RoadSoft GIS program and imported into the Laptop Data Collector managed by NWMCOG. After determining an initial data collection route, the data collection team embarked on a “PASER tour” of all federal-aid eligible roads in each County. The Pavement Surface Evaluation and Rating (PASER) system is a subjective, visual rating process that assigns a value to a road segment based on its condition at the time of the rating. Manuals developed by the Wisconsin Transportation Information Center were used to help determine a road’s PASER value. After driving the full length of a road segment the participants determined by consensus the value to be entered into the Laptop Data Collector based on the current road surface condition. Data were collected in the daylight and when the conditions were dry. Data collection began in the summer and was finished by late fall. After all of the federal-aid-eligible roads were rated in the county, the data was exported out of the Laptop Data Collector and then imported back into the County’s RoadSoft program for review. Inventory Logs and Miles Rated Reports were printed out from RoadSoft. Copies of the dataset and reports were delivered to the MDOT Transportation Asset Management Council in Lansing.

2011 Asset Management Report Page 12 Northwest Michigan Council of Governments
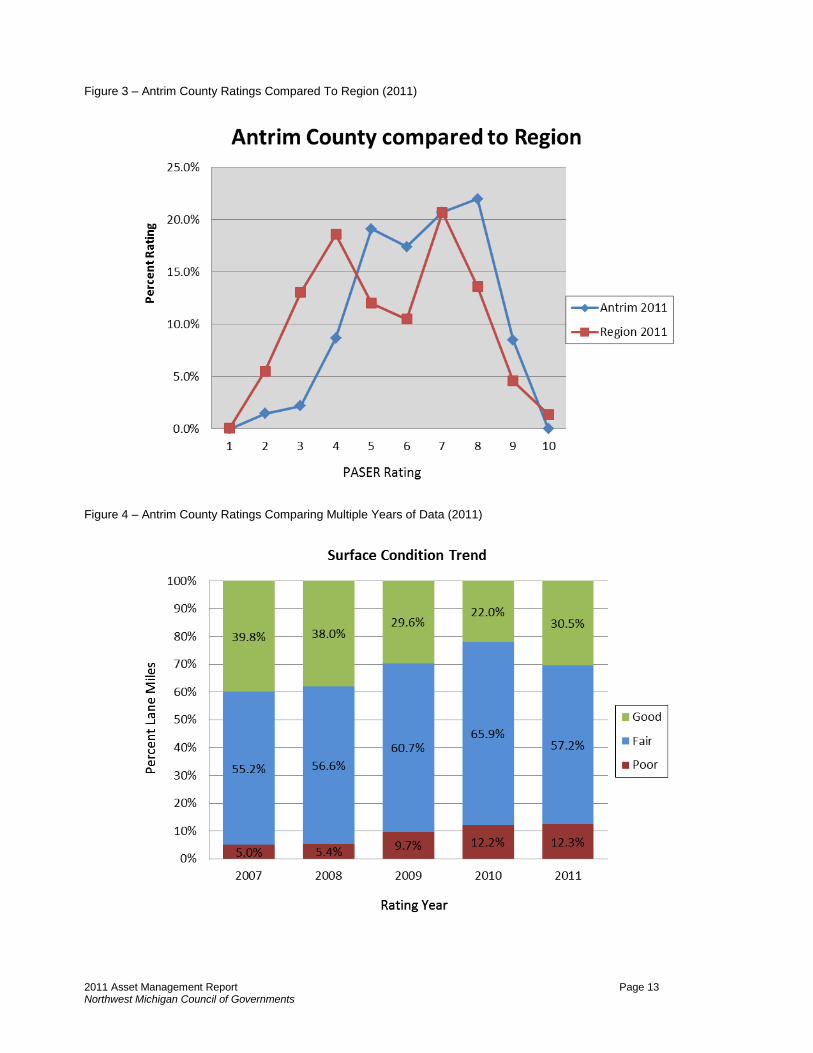
V. EXPLORING THE DATA COLLECTION RESULTS Antrim County Data was collected on 315 miles of federal-aid roads in Antrim County from May 25 and June 6, 2011. Staff present for the rating included Burt Thompson, Engineer/Manager, Antrim County Road Commission; Jeff Hunt, Traverse City Transportation Service Center, MDOT North Region; and Richard Duell, Deputy Director, Northeast Michigan Council of Governments. Map 1 displays the surface ratings for Antrim County’s roads. Figure 3 shows the PASER values for Antrim County’s roads and how they compared to the average regional PASER values. 30.5% of the roads rated in Antrim County received a PASER value of 8-10 (Good). Only 12.3% of Antrim County’s roads were rated 1-4 (Poor). This percentage is significantly lower than the regional median of 33.8%. Additionally, 57.2% of the roads rated were given a rating of 5-7 (Fair), among the ten counties in the region this was the second highest percentage of roads rated 5-7. Figure 4 shows a comparison of the last four years of data collected.
Map 1 – Antrim County PASER Values (2011)
2011 Asset Management Report Page 13 Northwest Michigan Council of Governments
Figure 3 – Antrim County Ratings Compared To Region (2011)
Figure 4 – Antrim County Ratings Comparing Multiple Years of Data (2011)
2011 Asset Management Report Page 14 Northwest Michigan Council of Governments
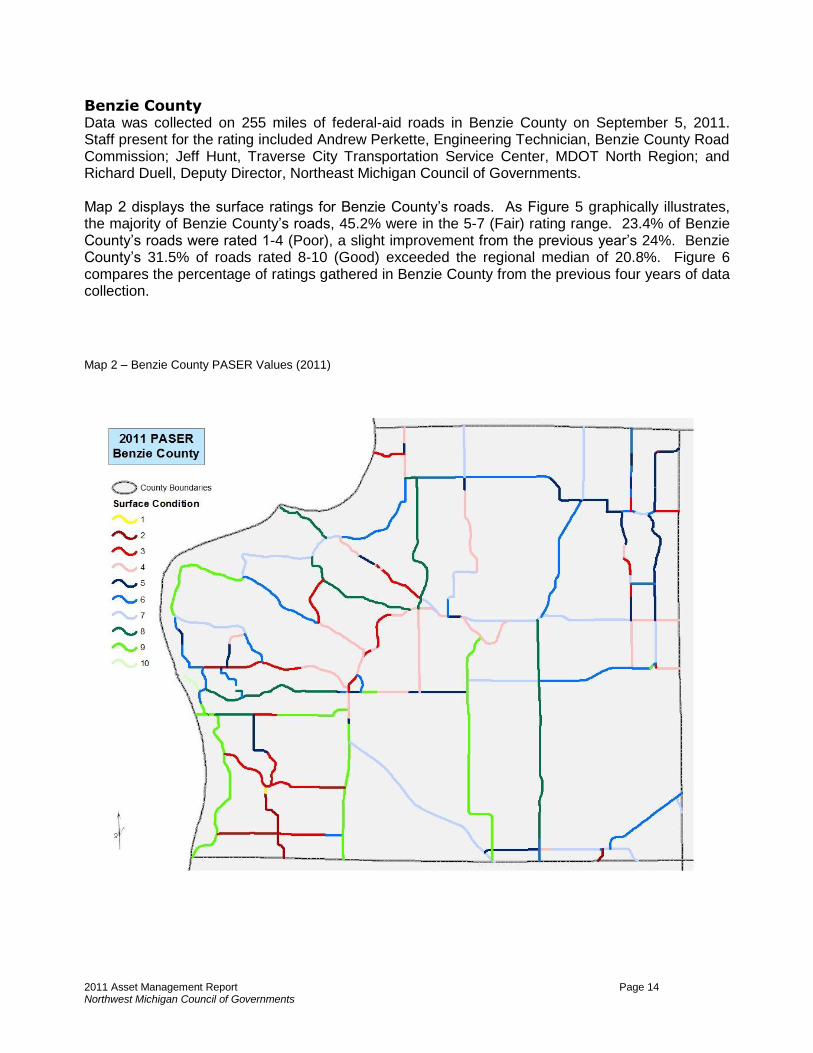
Benzie County Data was collected on 255 miles of federal-aid roads in Benzie County on September 5, 2011. Staff present for the rating included Andrew Perkette, Engineering Technician, Benzie County Road Commission; Jeff Hunt, Traverse City Transportation Service Center, MDOT North Region; and Richard Duell, Deputy Director, Northeast Michigan Council of Governments. Map 2 displays the surface ratings for Benzie County’s roads. As Figure 5 graphically illustrates, the majority of Benzie County’s roads, 45.2% were in the 5-7 (Fair) rating range. 23.4% of Benzie County’s roads were rated 1-4 (Poor), a slight improvement from the previous year’s 24%. Benzie County’s 31.5% of roads rated 8-10 (Good) exceeded the regional median of 20.8%. Figure 6 compares the percentage of ratings gathered in Benzie County from the previous four years of data collection.
Map 2 – Benzie County PASER Values (2011)

2011 Asset Management Report Page 15 Northwest Michigan Council of Governments
Figure 5 – Benzie County Ratings Compared To Region (2011)
Figure 6 – Benzie County Ratings Comparing Multiple Years of Data (2011)

2011 Asset Management Report Page 16 Northwest Michigan Council of Governments
Charlevoix County Data was collected on 227 miles of federal-aid roads in Charlevoix County from August 16 - 18, 2011. Staff present for the rating included Patrick Harmon, Manager, Charlevoix County Road Commission; Jeff Hunt, Traverse City Transportation Service Center, MDOT North Region; and Richard Duell, Deputy Director, Northeast Michigan Council of Governments. Map 3 displays the surface ratings for Charlevoix County’s roads. As Figure 7 graphically illustrates, 46.9% of Charlevoix’s roads, were rated 5-7 (Fair) which was close to the regional average of 45.4%. PASER values of 1-4 (Poor) were given to 31.9% of Charlevoix’s rated roads. PASER values of 8-10 (Good) were given to 21.2% of the county’s rated roads. The number of miles in the “good” category have been increasing, while the number of miles in the “poor” category have been decreasing, since 2009. Figure 8 shows a comparison of the last four years of data collected.
Map 3 – Charlevoix County PASER Values (2011)

2011 Asset Management Report Page 17 Northwest Michigan Council of Governments
Figure 7 – Charlevoix County Ratings Compared To Region (2011)
Figure 8 – Charlevoix County Ratings Comparing Multiple Years of Data (2011)

2011 Asset Management Report Page 18 Northwest Michigan Council of Governments
Emmet County Data was collected on 328 miles of federal-aid roads in Emmet County on August 21st and 27th, 2011. Staff present for the rating included Brent Shank, Operations Engineer, Emmet County Road Commission; Rob Hall, Gaylord Transportation Service Center, MDOT North Region; and Richard Duell, Deputy Director, Northeast Michigan Council of Governments. Map 4 displays the surface ratings for Emmet County’s roads. As Figure 9 graphically illustrates, 42.3% of Emmet County’s roads were rated 5-7 (Fair), a slight increase from the previous year’s 39.4%. PASER values of 8-10 (Good) were given to 11.2% of Emmet’s roads which is among the lowest percentage in the region. This is reflected in the 46.4% of Emmet County’s roads that were rated 1-4 (Poor), which is among the highest percentage in the region. Figure 10 compares the percentages of PASER values collected in the last four years.
Map 4 – Emmet County PASER Values (2011)

2011 Asset Management Report Page 19 Northwest Michigan Council of Governments
Figure 9 – Emmet County Ratings Compared to Region (2011)
Figure 10 – Emmet County Ratings Comparing Multiple Years of Data (2011)

2011 Asset Management Report Page 20 Northwest Michigan Council of Governments
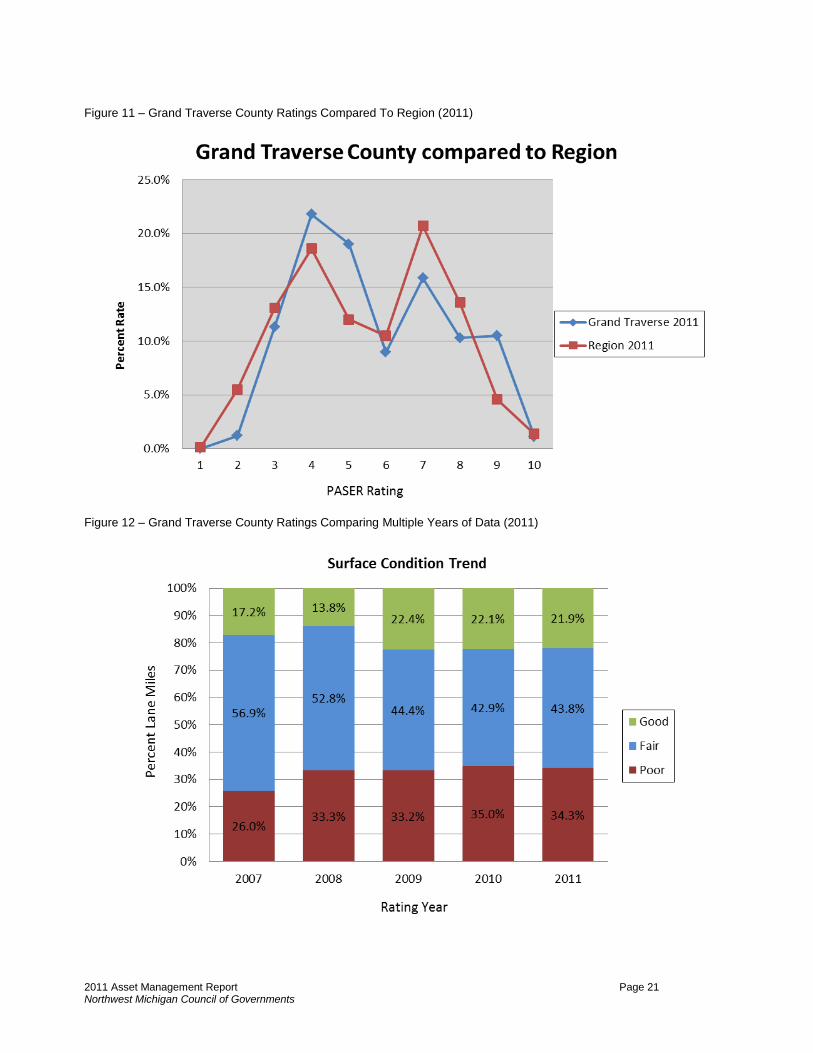
Grand Traverse County Data was collected on 395 miles of federal-aid roads in Grand Traverse County from May 31 - June 02, 2011. Staff present for the rating included John Rogers, Grand Traverse County Road Commission (for county roads only); John Travis, Department of Public Works, City of Traverse City (for City roads only); Jeff Hunt, Traverse City Transportation Service Center, MDOT North Region; and Richard Duell, Deputy Director, Northeast Michigan Council of Governments. Map 5 displays the surface ratings for Grand Traverse County’s roads. As Figure 11 graphically illustrates, 43.8% of Grand Traverse County’s roads were rated 5-7 (Fair), a slight increase from the previous year’s 42.9%. This percentage is close to the regional median of 45.4% of roads in this rating range. The County’s percentage of roads rated 1-4 (Poor), 34.3%, was slightly higher than the regional median percentage of 33.8%. 21.9% of the County’s roads were rated 8-10 (Good). Figure 12 shows a comparison of the percentages of ratings from the last four years of data collection.
Map 5 – Grand Traverse County PASER Values (2011)
2011 Asset Management Report Page 21 Northwest Michigan Council of Governments
Figure 11 – Grand Traverse County Ratings Compared To Region (2011)
Figure 12 – Grand Traverse County Ratings Comparing Multiple Years of Data (2011)

2011 Asset Management Report Page 22 Northwest Michigan Council of Governments
Kalkaska County Data was collected on 240 miles of federal-aid roads in Kalkaska County on June 22-23, 2011. Staff present for the rating included Jamie Woodhams, Kalkaska County Road Commission; Jeff Hunt, MDOT Traverse City Transportation Service Center; and Richard Duell, Deputy Director, Northeast Michigan Council of Governments. Map 6 displays the surface ratings for Kalkaska County’s roads. As Figure 13 graphically illustrates 49.8% of Kalkaska’s roads were rated 5-7 (Fair), a 6.8% increase over the previous year’s 43%. 13.8% of Kalkaska’s roads were rated 8-10 (Good), which is a decrease from the previous year’s 17.7%. The remaining 36.3% of Kalkaska County’s roads were rated 1-4 (Poor). Figure 14 compares the ratings gathered from the last seven years of data collection.
Map 6 – Kalkaska County PASER Values (2011)

2011 Asset Management Report Page 23 Northwest Michigan Council of Governments
Figure 13 – Kalkaska County Ratings Compared To Region (2011)
Figure 14 – Kalkaska County Ratings Comparing Multiple Years of Data (2011)

2011 Asset Management Report Page 24 Northwest Michigan Council of Governments
Leelanau County Data was collected on 268 miles of federal-aid roads in Leelanau County on June 8th and 9th, 2011. Staff present for the rating included Jim Johnson, Engineer, Leelanau County Road Commission; Jeff Hunt, MDOT Traverse City Transportation Service Center; and Richard Duell, Deputy Director, Northeast Michigan Council of Governments. Map 7 displays the surface ratings for Leelanau County’s roads. As Figure 15 graphically illustrates, the percentage of the County’s roads that were rated 8-10 (Good) was 27.9%, this was a slight decrease from the previous year’s 28.3%. This percentage was higher than the regional median of 20.8%. Additionally, 39.7% of the County’s roads were rated 5-7 (Fair). This percentage was below the regional median of 45.4%. PASER values of 1-4 (Poor) were given to 32.4% of the County’s roads; compared to a regional median of 33.8% for this rating range. Figure 16 shows a comparison of the percentage of ratings from the last four years of data collection.
Map 7 – Leelanau County PASER Values (2011)

2011 Asset Management Report Page 25 Northwest Michigan Council of Governments
Figure 15 – Leelanau County Ratings Compared To Region (2011)
Figure 16 – Leelanau County Ratings Comparing Multiple Years of Data (2011)

2011 Asset Management Report Page 26 Northwest Michigan Council of Governments
Manistee County Data was collected on 376 miles of federal-aid roads in Manistee County on August 23rd and 24th, 2011. Staff present for the rating included Sharon Johnson, Manistee County Road Commission; Lyn Zuiderveen, Cadillac Transportation Service Center, MDOT North Region; Karl Hanson, Engineer, Wexford County Road Commission; and Richard Duell, Deputy Director, Northeast Michigan Council of Governments. Map 8 displays the surface ratings for Manistee County’s roads. As Figure 17 graphically illustrates, Manistee County had 33.6% of roads rated 5-7 (Fair). Additionally, 41.5% of roads were rated 1-4 (Poor); considerably higher than the regional median of 33.8%. PASER values of 8-10 (Good) were given to 25% of roads in the County, which is an 8% improvement from last year. Figure 18 compares the PASER values collected in the last four years.
Map 8 – Manistee County PASER Values (2011)

2011 Asset Management Report Page 27 Northwest Michigan Council of Governments
Figure 17 – Manistee County Ratings Compared To Region (2011)
Figure 18 – Manistee County Ratings Comparing Multiple Years of Data (2005)

2011 Asset Management Report Page 28 Northwest Michigan Council of Governments
Missaukee County Data was collected on 275 miles of federal-aid roads in Missaukee County September 21, 2011. Staff present for the rating included Dennis Nebo, Missaukee County Road Commission; Lyn Zuiderveen, Cadillac Transportation Service Center, MDOT North Region; and Richard Duell, Deputy Director, Northeast Michigan Council of Governments. Map 9 displays the surface ratings for Missaukee County’s roads. As Figure 19 graphically illustrates, 28.6% of roads were given PASER values of 5-7 (Fair). This was much lower than the regional median of 45.4% of roads rated in this range. PASER values of 8-10 (Good) were given to 18.6% of roads which is a considerable increase from 8.9% of roads rated last year. 52.7% of Missaukee’s roads were rated in the 1-4 (Poor) rating range. Although this is a 6% decrease from the last two years, the county’s roads are still rated significantly lower than the regional median of 33.8% and possesses the highest percentage in the Poor rating range among the ten counties. Figure 20 shows a comparison of the last four years of data collected.
Map 9 – Missaukee County PASER Values (2011)

2011 Asset Management Report Page 29 Northwest Michigan Council of Governments
Figure 19 – Missaukee County Ratings Compared To Region (2011)
Figure 20 – Missaukee County Rating Comparing Multiple Years of Data (2011)
2011 Asset Management Report Page 30 Northwest Michigan Council of Governments
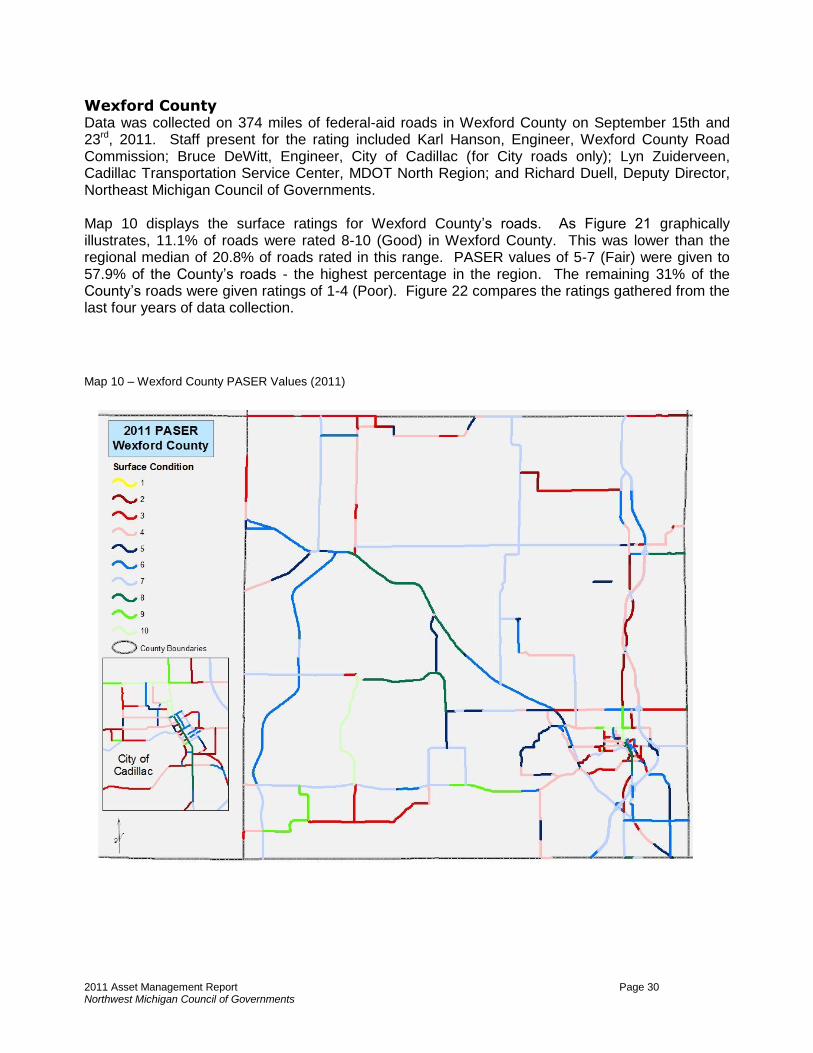
Wexford County Data was collected on 374 miles of federal-aid roads in Wexford County on September 15th and 23rd, 2011. Staff present for the rating included Karl Hanson, Engineer, Wexford County Road Commission; Bruce DeWitt, Engineer, City of Cadillac (for City roads only); Lyn Zuiderveen, Cadillac Transportation Service Center, MDOT North Region; and Richard Duell, Deputy Director, Northeast Michigan Council of Governments. Map 10 displays the surface ratings for Wexford County’s roads. As Figure 21 graphically illustrates, 11.1% of roads were rated 8-10 (Good) in Wexford County. This was lower than the regional median of 20.8% of roads rated in this range. PASER values of 5-7 (Fair) were given to 57.9% of the County’s roads - the highest percentage in the region. The remaining 31% of the County’s roads were given ratings of 1-4 (Poor). Figure 22 compares the ratings gathered from the last four years of data collection.
Map 10 – Wexford County PASER Values (2011)

2011 Asset Management Report Page 31 Northwest Michigan Council of Governments
Figure 21 – Wexford County Ratings Compared To Region (2011)
Figure 22 – Wexford County Ratings Comparing Multiple Years of Data (2011)
2011 Asset Management Report Page 32 Northwest Michigan Council of Governments
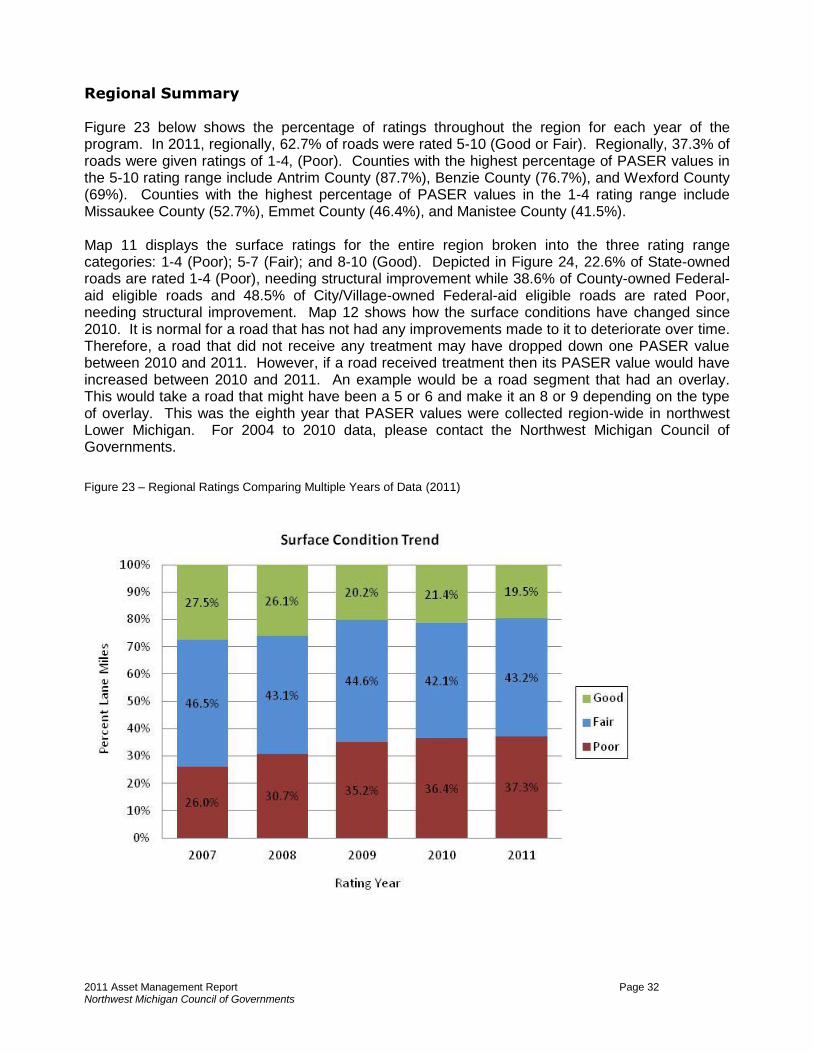
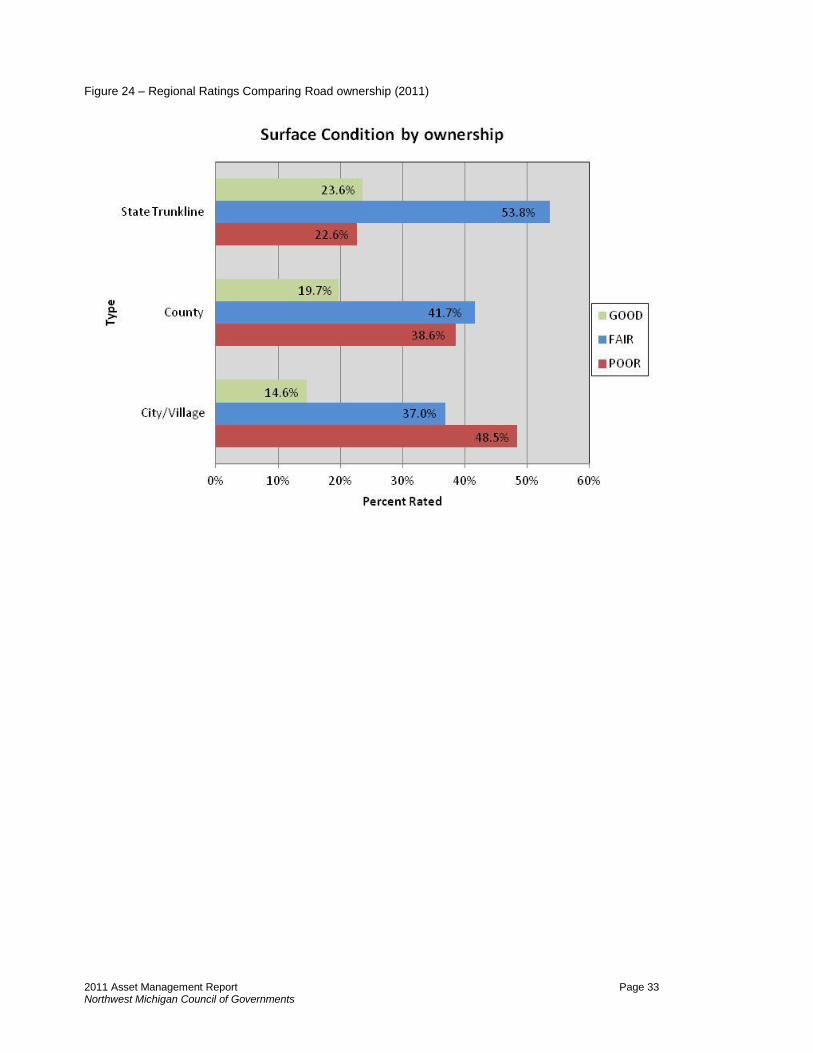
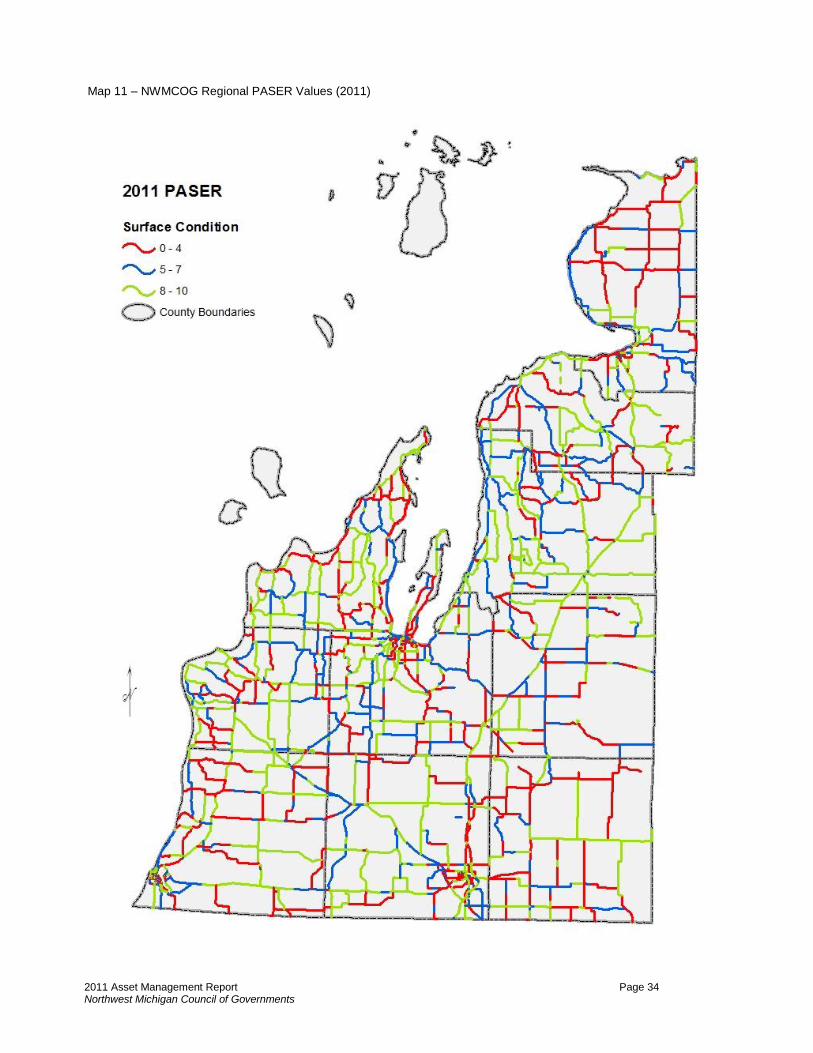
Regional Summary Figure 23 below shows the percentage of ratings throughout the region for each year of the program. In 2011, regionally, 62.7% of roads were rated 5-10 (Good or Fair). Regionally, 37.3% of roads were given ratings of 1-4, (Poor). Counties with the highest percentage of PASER values in the 5-10 rating range include Antrim County (87.7%), Benzie County (76.7%), and Wexford County (69%). Counties with the highest percentage of PASER values in the 1-4 rating range include Missaukee County (52.7%), Emmet County (46.4%), and Manistee County (41.5%). Map 11 displays the surface ratings for the entire region broken into the three rating range categories: 1-4 (Poor); 5-7 (Fair); and 8-10 (Good). Depicted in Figure 24, 22.6% of State-owned roads are rated 1-4 (Poor), needing structural improvement while 38.6% of County-owned Federal-aid eligible roads and 48.5% of City/Village-owned Federal-aid eligible roads are rated Poor, needing structural improvement. Map 12 shows how the surface conditions have changed since 2010. It is normal for a road that has not had any improvements made to it to deteriorate over time. Therefore, a road that did not receive any treatment may have dropped down one PASER value between 2010 and 2011. However, if a road received treatment then its PASER value would have increased between 2010 and 2011. An example would be a road segment that had an overlay. This would take a road that might have been a 5 or 6 and make it an 8 or 9 depending on the type of overlay. This was the eighth year that PASER values were collected region-wide in northwest Lower Michigan. For 2004 to 2010 data, please contact the Northwest Michigan Council of Governments.
Figure 23 – Regional Ratings Comparing Multiple Years of Data (2011)
2011 Asset Management Report Page 33 Northwest Michigan Council of Governments
Figure 24 – Regional Ratings Comparing Road ownership (2011)
2011 Asset Management Report Page 34 Northwest Michigan Council of Governments
Map 11 – NWMCOG Regional PASER Values (2011)

2011 Asset Management Report Page 35 Northwest Michigan Council of Governments
Map 12 – Change in Surface Rating from 2009 to 2011 (2011)

2011 Asset Management Report Page 36 Northwest Michigan Council of Governments
VI. DATA USE & APPLICATION MDOT will use this pavement assessment data for their transportation asset management program. Local units of government are encouraged to use this data to develop their own strategic and departmental plans or asset management strategy as well. Combining the data provided in this report with local sewer and water information, or data about other utilities, can provide a comprehensive perspective of public infrastructure and can lead to an increase in effective and coordinated management. To access digital files related to the data presented in this report, contact the Northwest Michigan Council of Governments or your local Road Commission office.
VII. MORE INFORMATION ABOUT TRANSPORTATION ASSET MANAGEMENT
Additional Resources Michigan Transportation Facts and Figures. MDOT, December 1999 Reaching Public Goals: Managing Government for Results. National Performance Review, October 1996. Governing Performance and Results Act of 1993. US Congress, 1993. Executive Order 12893: principles for Federal Infrastructure Investments. President William J. Clinton, White House, January 26, 1994. Concepts Statement No. 2, Service Efforts and Accomplishments Reporting. Governmental Accounting Standards Board, April 1994. MCL 247.651g Statement No. 34, “Overview.” Governmental Accounting Standards Board, no date given in document. Asset Management Primer. US Department of Transportation, December 1999. New Rules for Reporting Infrastructure Information To Be Enacted For State & Local Governments. Governmental Accounting Standards Board Newsletter, April 19, 1999. Michigan Department of Transportation 1997 Business Plan. MDOT, 1997; Revised 1999. Measuring and Improving Infrastructure Performance. National Research Council, 1995. Serving The American Public: Best Practices In Performance Measurement. National Performance Review, June 1997. 21
st Century Asset Management: Executive Summary. Center for Infrastructure and Transportation Studies,
Rensselaer Polytechnic Institute, October 1997. Pay Now Or Pay Later: Controlling Cost Of Ownership Through The Service Life Of Public Buildings. National Research Council, 1991. Life Cycle Cost Analysis in Pavement Design. US Department of Transportation/ Federal Highway Administration, September 1998.
2011 Asset Management Report Page 37 Northwest Michigan Council of Governments
Contact Information For further information on the Michigan Department of Transportation’s Asset Management Program, please contact the appropriate person listed below or contact MDOT by phone at (517) 373-2240 or send an email to [email protected] For information about data or the data collection process for northwest Lower Michigan, please contact the Northwest Michigan Council of Governments by phone at (231) 929-5000 or email Michael P. Woods at [email protected]. This report is also available on NWMCOG’s website free of charge at www.nwm.org MDOT Web Site www.michigan.gov/mdot Then click on “Projects and Programs” Then click on “Asset Management” Asset Management Process General Information
William Tansil (517) 335-2639 [email protected] Asset Management Council
Brian Sanada (517) 373-2220 [email protected] Development of Strategic Plans State Long Range Plan Polly Kent (517) 373-9193 [email protected] Transportation Policy Plan Polly Kent (517) 373-9193 [email protected] Data Collection Michigan Geographic Framework Joyce Newell (517) 335-2237 [email protected] Global Positioning/Geographic Information Systems Gil Chesbro (517) 335-2963 [email protected] Traffic Data Dave Schade (517) 335-2914 [email protected]

2011 Asset Management Report Page 38 Northwest Michigan Council of Governments
Contact Information (continued) Use of Management Systems Transportation Management System Ron Vibbert (517) 373-9561 [email protected] Bridge Management System Bob Kelley (517) 322-1398 [email protected] Pavement Management System Pat Schafer (517) 322-1766 [email protected] Public Transportation Management System Kathy Urda (517) 335-2575 [email protected] Safety Management System
Bob Rios (517) 335-1187 [email protected] Congestion Management System Intermodal Management System Gary Endres (517) 335-4583 [email protected] Alternative Analysis Procedures Road Quality Forecasting System Prioritization Process Craig Newell (517) 373-9074 [email protected]