Project 97251-CLO Final Report: Akalura Lake Sockeye ... · Akalura Lake Sockeye Salmon R ......
37
Restoration Project Final Rt Akalura Lake Sockeye Salmon R Restoration Project 9725 Final Report Exxon Valdez Oil SDill e 1, Lewis G. Coggins, Jr. Nicholas H. Sagalkin Alaska Department of Fish and Division of Commercial Fish 21 1 Mission Road Kodiak, Alaska 99615 October 1999 YOrt storation Game :ries I
-
Upload
truongphuc -
Category
Documents
-
view
213 -
download
0
Transcript of Project 97251-CLO Final Report: Akalura Lake Sockeye ... · Akalura Lake Sockeye Salmon R ......

Restoration Project Final Rt
Akalura Lake Sockeye Salmon R
Restoration Project 9725 Final Report
Exxon Valdez Oil SDill
e
1,
Lewis G . Coggins, Jr. Nicholas H. Sagalkin
Alaska Department of Fish and Division of Commercial Fish
21 1 Mission Road Kodiak, Alaska 99615
October 1999
YOrt
storation
Game :ries
I

Akalura Lake Sockeye Salmon R storation
Restoration Project 9725 1 Final Report
4
Studv History: Restoration Project 9725 1 continues the effol FisWShellfish Study Number 27, which concluded in 1996. T investigations on KendSkilak Lakes in Cook Inlet with Red Island. A final report on FIS No.27 was published by D.C. Sc Fisheries Rehabilitation, Enhancement and Development Rep Sockeye Salmon Overescapement. Subsequent studies focusel continuing field data collection and population monitoring wi Information Report (No. 5595-15) published by Schmidt, D.C Kodiak Island lakes have been included in these reports, howl collection and limited data analyses have also been prepared: Swanton et al. 1995 and 1996; Swanton et al. (In review). Tht data, analyses, and conclusions relative only to Akalura Lake
Abstract: This report documents the final year of sockeye sal investigations at Akalura Lake on Kodiak Island. Smolt prod1 to appear depressed relative to pre-oil spill conditions with a i 193,750 fish during 1997. The 1997 season marks the fifth co sockeye escapement was below the minimum escapement go2 increasing trend in smolt per adult productivity in recent year composition suggests that rearing conditions have improved. based on smolt outmigrations indicate a fairly robust run. Fin; evaluations of mark-recapture population estimation methods including consideration of delayed dye mortality effects.
Kev Words: Akalura Lake, escapement, Kodiak Island, mark Oncorhynchus nerka, smolt production, sockeye salmon.
Proiect Data: The data collected in this and previous years' i smolt mark-recapture data, sockeye smolt age, weight, and le] data, weir counts of adult and smolt passage, and escapement resides in computerized data files (Excel and RBASE) and ir Alaska Department of Fish and Game, Kodiak, AK. Contact 1 Alaska Department of Fish and Game, Division of Commerci Kodiak, AK 99615,907-486-1848.
Citation: Coggins, L.G., Jr., and N.H. Sagalkin. 1998. Akalura Lake sc
Vuldez Oil Spill Restoration Final Report (Restoratior Department of Fish and Game, Division of Commerci
1
s initiated in 1990 with e study coupled parallel nd Akalura Lakes on Kodiak midt and K.E. Tarbox within the rt series (No. 136) entitled on restoration efforts essentially I an interim ADF&G Regional et al. 1995. Studies conducted on Jer reports solely on Kodiak's data larrett et al. 1993a, 1993b; following final report includes nvestigations.
non (Oncorhynchus nerka) smolt :tion from Akalura Lake continues tal outmigration estimate of hsecutive year in which adult of 40,000 fish. However, the as well as smolt size and age urthermore, the 1998 forecasts Ily, this report summarizes :ompleted during 1996 and 1997,
recapture population estimation,
westigations include: sockeye gth data, scale samples, climate Ige composition. All data currently slide collections maintained by the 'ick Sagalkin or Patti Nelson @ 1 Fisheries, 21 1 Mission Road,
:keye salmon restoration, Exxon Project 9725 I), Alaska d Fisheries, Kodiak, Alaska.

TABLE OF CONTENTS
LIST OF TABLES .................................................................................................................
LIST OF FIGURES ...............................................................................................................
LIST OF APPENDICES ........................................................................................................
EXECUTIVE SUMMARY ...................................................................................................
INTRODUCTION .................................................................................................................
Objectives ..................................................................................................................
METHODS ............................................................................................................................
Smolt Trap and Weir Descriptions ............................................................................
Smolt Enumeration ....................................................................................................
Age, Weight, and Length Sampling ...........................................................................
Mark-Recapture Experiments .................................................................................... . . Delayed Mortality Estlmabon ....................................................................................
Climate Observations .................................................................................................
DATA ANALYSIS ................................................................................................................
Smolt Population Estimation . . .....................................................................................
RESULTS ..............................................................................................................................
Smolt and Dolly Varden Outmigrations
Smolt Trap Evaluation ...............................................................................................
....................................................................
Climate Observations .................................................................................................
DISCUSSION ........................................................................................................................
CONCLUSIONS ....................................................................................................................
LITERATURE CITED ..........................................................................................................
APPENDIX A ........................................................................................................................
11 ..
iii ... 111
iv
1
2
3
3
3
4
4
4
5
5
6
6
8
8
9
10
10
11
13
A- 1

LIST OF TABLES
Table
1 .
2.
3.
4.
Estimated number of sockeye salmon smolt outmigrat ng from Akalura Lake by year and age class, 1990-1997 .....................................................................
Adult sockeye salmon escapement and estimated smo outmigration from Akalura Lake by brood year and age class, 1985-1995 .............................................
Length, weight, and condition factor of Akalura Lake ockeye salmon smolts, 1997 ...............................................................................................................
Comparison of the true and estimated trap efficiency d smolt outmigration during 1996 and 1997. The 1997 estimat s are both unadjusted and adjusted for estimated delayed dye mo I lity ...................................
LIST OF FIGURES I Figure
1. Map depicting location of Akalura Lake, Kodiak Island,
1997 ....................................... 2. Trap and weir configurations at Akalura Lake, 1996 and
Alaska.. ............................
class and brood 3. Sockeye salmon escapement and smolt production by age year, 1986-1994 ...............................................................................................................
4. Sockeye salmon smolt outmigration timing by age class,
5. Mean length, weight, and condition factor of sockeye smolts
Akalura Lake, 1997 ..............
from Akalura Lake, brood years 1987-1995 ...........................................................................................
6. Cumulative proportion of sockeye salmon smolt outmigration and cumulative number of outmigrant Dolly Varden by day, Akalura Lak :, 1997 ..................................
7. True and estimated trap capture efficiencies at Akalura Lake during 1996 and 1997 .................................................................................................................................
16
17
18
19
&
20
21
22
23
24
25
26
... 111 I

LIST OF APPENDICES
Avvendix
A.l. Estimated number of sockeye salmon smolt outmigra Lake by temporal strata, age class, and year, 1996-19
A.2. Akalura Lake sockeye salmon smolt catch, trap captu estimates, and weir catches, 1997 ...............................
A.3. Daily climatological observations, water temperature monitored at the Akalura field station. 1997 ..............
iv
ing from Akalura 7 ........................................... A-1
e efficiency ............................................. A-2
and water depth ............................................. A-3

EXECUTIVE SUMMARY
Sockeye salmon smolt studies funded by the Exxon Valdez ( began in 1990 and continued through 1996 to evaluate the ef overescapements in Red and Akalura Lakes Parrett et al. 19 1996). This report documents an additional year of study in : Trustee Council to further evaluate the recovery of sockeye z Akalura Lake.
Based on the numbers of sockeye smolt counted leaving Aki relative to pre-oil spill production, it appears that the recove1 overescapement event is not yet complete. Additionally, 199 that the lower bound escapement goal was not reached for ac Lake. However, the health of the lake environment appears ti increasing trend in smolt per adult productivity in recent yea lower proportion of older age smolt counted during 1997. Fu observed during 1996, the 1998 run is forecast to be relative1
During 1996 and 1997, evaluations of mark-recapture metho were conducted at Akalura Lake using concurrent total weir estimation trials. Although these investigations have increast smolt, they have also highlighted biases with our trap-efficie further study. Finally, in combination with a new smolt estin review), the effects of delayed dye marking mortality are eva
il Spill (EVOS) Trustee Council ects of sockeye salmon I3a, 1993b; Swanton et al. 1995 and >97 authorized by the EVOS dmon smolt production fiom
ura during 1997 (193,750 fish) ' of Akalura Lake from the marks the fifth consecutive year
Ilt sockeye returning to Akalura be improving considering the ; as well as the size of smolt and the thermore, based on smolt numbers ' strong.
s of smolt population estimation ounts and mark-recapture 1 our understanding of estimating cy estimation methods that require %tor detailed by Carlson et al. (In uated.

INTRODUCTION I
In 1989, crude oil spilled from the MN &on VuZdez d many of the traditional salmon fishing grounds within the Kodiak Manageme A; Barrett and Monkiewicz 1989). This contamination resulted in the closure or s on of salmon fisheries area- wide, and sockeye salmon escapement goals were co eeded (overescapement) in several systems including Afognak, Akalura, Frazer,
The 1989 Akalura escapement was 1 16,000 comp 60,000 goal (Barrett et al. 1993a). Sockeye salmon production has been de (Koenings and Burkett 1987) and the excessive decline in freshwater productivity (Edmundson et al. 1994, have documented that excessive escapements composition and biomass by overloading the juvenile sockeye salmon fry. These changes can reduce overwinter sockeye salmon fry al, extend freshwater rearing for additional years, and affect multiple brood ye
Swanton et al. (1996) documented a steady d Akalura between 1990 and 1993. Smolt o ed in 1994 and 1995 compared to the 1993, however they rem 1990 and 1991. Coincident with the decrease in smolt that smolt size in Akalura Lake had also declined. Furth and poor growth of outmigrating smol production continued to lag behind p observed between 1990 and 1993
An additional year of study was c escapements of 2,010 and 7,898 beginning, it was determined th failure to meet the lower bound would constitute continued inj
It was recognized prior to the typical number of outmigrant smolt outmigration via a weir concurrently with the census in 1996 and continuing throu conducted, and mark-rec
Juvenile sockeye are mo (Groot and Margolis 19 Alaskan systems inspi 1942). Predator c and Morton 1943 make them more

at Akalura is the Dolly Varden (Sulvelinus mulmu). Therefore, Varden was also estimated.
abundance and length of Dolly
completed in 1996. the mark-recapture evaluation This report documents the results of the 1997 study along wit'l
Objectives
I. Estimate the abundance-at-age of sockeye smolt emig ating from Akalura Lake during 1997.
during 1997.
conducting a smolt outmigration census via a weir d 'ng 1996 and 1997.
Varden (Sulvelinus rnulrnu) greater than 250mm in le via the weir for as long as practicable during 1997. i 2. Estimate the age, weight, and length of sockeye smolt emigrating from Akalura Lake
3. Estimate smolt outmigration with standard mark-reca ture methods while concurrently
4. Enumerate the abundance and estimate the mean len of downstream migrant Dolly
METHODS I
Smolt Trap and Weir Descriptions I
During 1997, a single Canadian fan trap was op approximately 5.6 km downstream of the Akal 1). The trap was equipped with a flow through livebox measuring 1.5 m 1 m high. Perforated-plate leads were attached to the trap opening extend A stream bank and 1.9 m to the right bank (Figure 2). The lead to the ri the stream bank and prohibited smolt passage on this side of the tr approximately 30% of the stream width. Add installed and fitted with leads spanning the remainin stream. Collectively, the weir and trap captured 100% of outmigrant smolt. R the remainder of this document are the sum outmigration. Due to the near completion of the smolt o on by June 12, the trap was removed and the right bank lead of the weir extended fully right bank. This weir configuration continued to enumerate smolt until June 25.
The 1997 trap/weir configuration was modi was suspected that the right bank weir lead excessively during 1996 (Figure 2).
3 I

Smolt Enumeration I
Smolt enumeration was completed by individual species as fish were removed from the liveboxes; an exception was when smolt capture rates the crew's ability (> 10,000 fish per hour) to hand tally fish and a catch-weight The catch-weight method was conducted by transferring the catch by dip attached to a spring scale suspended over the stream by an was individually weighed, with fish immediately traps. Approximately every tenth dip net load was counting by species a dipnet netted basket suspended trap site. All
Age, Weight, and Length Sampling I
Up to 70 sockeye salmon smolt were sampled daily for age, and length (AWL), five days a week (dependent upon smolt availability). To minimize bi in the live-box were stirred immediately before being removed for sampling. fish was anesthetized with MS-222 and a scale smear from the preferred area and mounted on a standard microscope slide for ageing. Smolt digital balance and tip-of-snout to After sampling, all smolt were was conducted using a European notation (KOO 1962).
Weekly up to 100 data. The 250 mm effective sockeye hook and line.
Mark-Recapture Experiments I
Trap efficiency was estimated at least weekly dependent availability. The procedure (referred to as a dye test) involved releasing up to 500 1 km upstream of the trap location in a low velocity water flow area ( < O S were scheduled so that the release time was approximately 2200 hrs. collected from the trap within three days and often within one flow through live box with perforated sides was used to Transport
4

aerators. At the release sites, smolts were placed into instre& minutes before transfer into a continuously-oxygenated dye s dye to 57 L of water for another 30 minutes. After dyeing, th~ minutes in an instream perforated live box with lid, and then for release across the stream channel. At each step in the proc those that behaved abnormally were destroyed. Following t h c were checked for three or more days for recoveries. All recap the unmarked fish catch and were not included in the daily tr;
was performed using backpacks and 19 L plastic buckets equi ped with battery-powered 1 Delayed Mortaliiy Estimation
Experiments conducted at both Red and Akalura Lakes demc mortality rates between dyed and un-dyed smolt (Swanton et In order to adjust for this potential bias in mark-recapture est delayed mortality of dyed fish was estimated concurrent with review; Thedinga et al. 1994). To accomplish this, an additio the smolt to be released. Smolt used for the mortality experk those released, except never released. The smolt were held in live box and checked daily for 5 days; mortalities were recon
Climate Observations
Air and stream temperatures PC), stream height (cm), percer wind direction were recorded at approximately 1800 hr. or 01
5
~~
live boxes and heid for about 30 llution of 1.9 g Bismark Brown Y smolt were held for about 60 llaced in water filled 19 L buckets :ss, the smolt were counted, and release of dyed fish, the liveboxes ures were recorded separately from p or weir catch totals.
lstrated a significant difference in 11. 1996; Swanton et al. In review). nates of the smolt outmigration, each dye test (Carlson et al. In al 100 smolt were dyed along with ent were handled identically to 3 covered instream flow through ed and removed from the live box.
cloud cover, wind velocity, and 30 hr.
DATA ANALYSIS
SMOLT POPULATION ESTIMATION
The following variables are defined in the development of thc (Carlson et al. In review):
stratum or period index (release event paired with a re age index. number of strata (h = 1,2, . . ., L). number of marked releases in stratum h. total number of marked releases (= C Mh). number of marked recoveries in h. number of unmarked smolt captured in h. total population size of smolt in h, excluding marked mortality. total population size of smolt, excluding marked relea number of age j smolt sampled in h. number of smolt sampled in h. proportion of age j smolt in h. total population size of age j smolt in h, excluding ma total population size of age j smolt, excluding marked
The approximately unbiased estimator of the total population as
with variance
The estimate of U is therefore
6
smolt population estimator
:overy period).
:leases and minus observed
es (= C Uh).
ked releases. releases (=C q h ) ,
within each stratum (Uh) is given

with variance estimate
v( 6) = v( fib) . (4)
The 95% confidence intervals were estimated two separate ways each detailed in Carlson et al. (In review). The first was to use the standard formula
i! f 1.96Jv(Ij)
which assumes that i! is asymptotically normally distribute, parametric bootstrap procedure assuming the hypergeometril
To adjust the strata abundance estimates for delayed mortalii first calculated as:
where sh is the estimated mark survival, ah is the remaining Ah is the initial number of marked smolt held. The estimatec for recapture in stratum h is
M h = M h i h ,
Finally, substituting kh in place of Mh in equations 1-5 pro’ for delayed mortality.
To estimate the number of emigrating smolt by age class dul each age is first estimated as
with estimated variance
. The second was to use a distribution.
r . an estimate of mark-survival is
lumber of live fish with marks, and number of marked smolt available
(7)
ides population estimates adjusted
ng each stratum h, the proportion of
V ( i j j h ) = Gjh(l - i j j h )
Ah
7

Within each stratum, the total population size by age class is 4
fijh = uhejh, ^ ^
with estimated variance ignoring the covariance term
v( f i j h ) = fi*2v( l+jh) + v( f i h ) i j h 2 .
Finally, the total population size of each age class among all ~
with estimated variance
Condition factor for each smolt sampled was estimated using
K = - I O , - w 5 L3
where k is smolt condition factor, W is weight in grams, an( tail) in millimeters.
RESULTS
Smolt and Dol& Varden Outmigrations
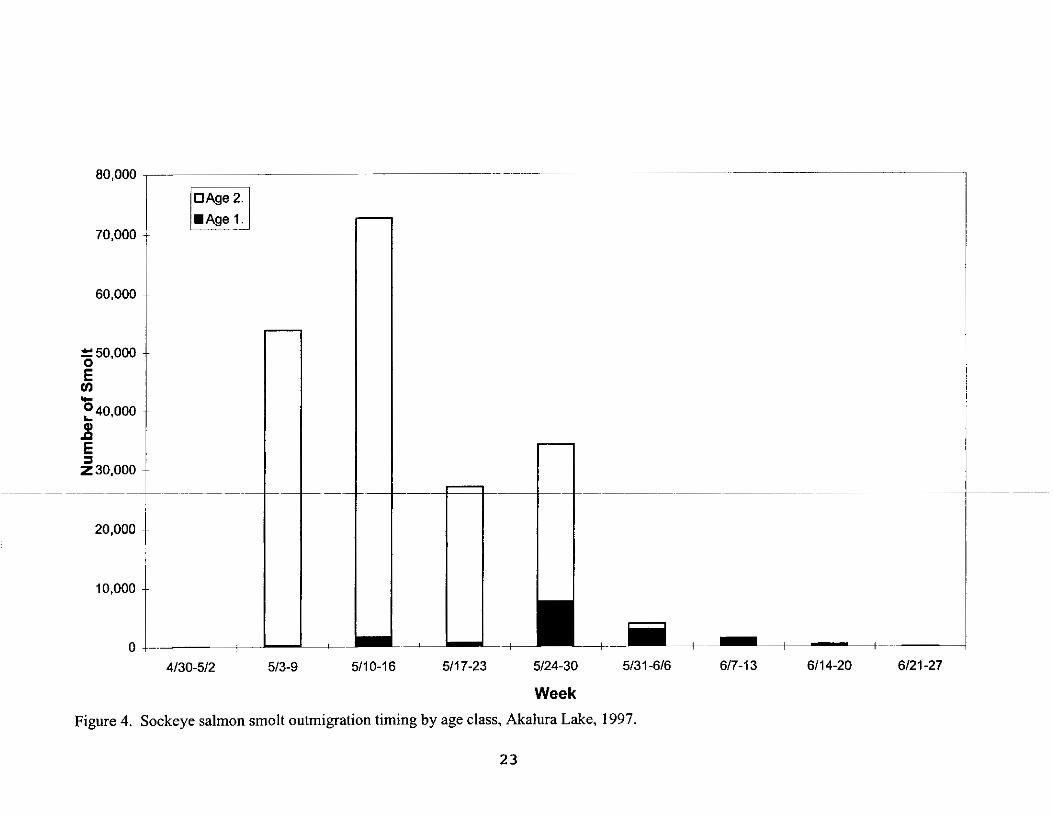
A total of 193,750 sockeye salmon smolt were counted throu majority of which were age-2. fish (92%) from the 1994 broc Appendices A.1 and A.2). Most smolt outmigrated during thc
8
stimated as
xata is estimated as
(14)
L = length (tip-of-snout to fork-of-
h the weir during 1997; the I year (Tables 1-2; Figure 3; time period 3 - 30 May with peak

age-2. outmigration occurring during the week beginning and peak age-1 . outmigration
During 1997, average sockeye smolt length varied from to 92 mm (age-3.) with corresponding weights of 1.7 g and 6.3 g for age-0. and (Table 3). The average size of age-1. smolt emigrating from the and 4.8 g) was approximately 7 mm longer and 1 g heavier than from the 1988- 92 brood years (75 mm and 3.8 g; Figure 5). smolts from the 1992-94 brood years (92 mm and 6.4 g) was size of age-2. smolt from the 1987-91 brood
A total of 14,093 Dolly Varden greater than April through 3 1 May 1997 when adult weir Dolly Varden (Figure 6). Interestingly, the smolt outmigration, though approximately Dolly Varden was 345 mm (95% CI 201 Varden were observed regurgitating
during the week beginning 24 May (Figure 4).
both above and below the weir.
Examination of the ratios of smolt produced from brood year (smolts/adult) indicates a substantial drop in lake productivity associated with the event relative to the 1988 brood year (Table 2). This low productivity ratio overescapement event that has persisted through the 1992 smolt per adult productivity evident from the 1993 - 1995 recovering.
Smolt Trap Evaluation I I
The overall estimated smolt outmigration differed from the outmigration by 71,195 (relative error 35%) in 1996 and 13,389 (unadjusted for dye error 7%) or 7,990 (adjusted for dye mortality; relative error 4%) in trap efficiency was under-estimated in all time strata except the first outmigration in strata 2-6, and an under-estimate Figure 7). During 1997, trap efficiency estimates substantial differences occurring in only the adjusted smolt outmigration estimates were (within the confidence bounds) for strata estimates were minor, ranging from 0% estimates differed little.
With the exception of the first stratum in 1996, smolt outmigiation estimates tend to be positively biased due to negatively biased estimates of trap This was particularly true during 1996 in strata 2-6, but also evident in 1997 for strata
9 I

Climate Observations
Climate data collected during 1997 are reported in Appendix
DISCUSSION
Overescapement Impacts
Overall, smolt production at Akalura Lake continues to appe; levels (brood years 1987-88). The 1997 smolt outmigration F (245,821 smolt) and a 12% decrease from the 1990-96 avera] causal mechanisms that could explain this response inchdink secondary production within the lake, competition with stick within the lake, a large predator population (Dolly Varden), (
excessive 1989 escapement did not appear to initially impact based on size and composition of lake zooplankters in 1990 ( subsequent zooplankton biomass decreased by 50% in 1991 ; 1992. Decreases in zooplankton biomass coincided with a sh outmigrating smolts (Barrett et al. 1993b). Changes in smolt linked to poor growth of age-2. and age-3. smolt, further sug: 1993b).
A total of 14,093 Dolly Varden > 250 mm were counted out^ 1997. Prior to statehood, the U. S. Fish and Wildlife Service destroyed Dolly Varden at many salmon producing systems I
1934; Turner 1936; Culbertson 1938; Ferrandini 1939; Petry annual catches of Dolly Varden from Akalura Lake ranging 1 this historic data, the numbers of Dolly Varden observed dur large. However, this observation is confounded by the fact th reports were possibly due to fishing efforts over the entire se lengths.
Signs of Recovery
Continued assessments of secondary production in 1994 and community in Akalura Lake recovered sufficiently to recom escapement goal of 60,000 (Edmundson et al. 1994). Edmun that competition among sockeye and stickleback could poter however the effects of this competition would likely be appa is depressed. The increased ratio of smoltladult production fi the large smolt size and low proportion of age-3. smolts obsr
10
3.
lepressed relative to pre-oil spill 22% less than observed in 1996
:220,357 smolt). There are many Intimed damage to primary and ack (Gasterosteus aculeatus) ow brood year escapements. The : macrozooplankton community; mundson et al. 1994). However, I continued to be depressed in in the age composition of : composition have also been iting lack of food (Barrett et al.
rating from Akalura Lake during WS) periodically captured and Kodiak Island (Hungerford 193 1, 42). These efforts reported ween 6,387 and 34,734. Based on ; 1997 do not appear excessively the catches reported in FWS In and composed of fish of all
95 suggest that the zooplankton nd targeting the upper bound )n et al. (1994) also suggested Ily limit sockeye production; It only when zooplankton biomass 1 the 1993-1995 brood years and :d during the 1996-1998

outmigrations, support this recommendation and suggest that eshwater productivity is continuing to improve.
Smolt Estimation
This project led to the development of a refined smolt esti ng with the dye mortality adjustment proposed by Carlson et al. (In review). Co molt estimates with weir counts and mark detectability experiments have give ht into smolt outmigration estimates. However, as is apparent in the 1996 evalu this paper, all sources of estimation bias have not been removed. For exampl true smolt population within each strata, as measured by the weir, fell out ence interval of the estimate generated by the trap efficiency, mark-rec eral sources of error may have affected trap efficiencies observed in 1996 an 97. Trap efficiencies are estimated by recapturing marked fish collected , if there are differences in vulnerability between the outmigrating populati efficiency will not be estimated. This could occur ar age class is more capable of avoiding the trap than other age classes redation of marked fish by Dolly Varden or avian predators may viol recapture. Furthermore, it is possible that behavi efficiencies. Smolt may become “trap-shy’’ (Kre part of the same outmigrating diel population ( possible that the magnitude of the outmigratin efficiency. For example, in 1996 all estimates which had the highest smolt population. Simil biased during slower outmigration and negati to the fact that it is more difficult to observe particular, if outmigation numbers get too 1 overcrowding) using weights and it becom estimates during 1997 were much closer made to the trap in 1996 helped correct two years it is difficult to make any conclusive judgements.
f
While a detailed run reconstruction Akalura Lake, escapement data and the assumption of an exploitation rate allows the of total run. Assuming that fish returning to Akalura Lake were exploited at a rate of the last 5 years (1993-1997), the total runs have ranged between approximately 62,000 (1993). However, even if these estimated runs were allowed to Akalura Lake, the lower bound escapement goal would have been
CONCLUSIONS I
Although trapping methods vary, smolt enumeration and subsequent smolt population estimation (Carlson estimator) methods have been adopted in most of Kodiak’s smolt research projects. While necessary (e.g.,
11

estimates are close to the true population.
This study supports previous research on sockeye salmon ovt subsequent diminished production (e.g., Kyle et al. 1988). W increased nutrient loading, there are system limits beyond wk equate to increased production. These results further provide affect multiple brood years by altering multiple (juvenile) ye; production through overgrazing. Recovery from such interaci rebuild the forage base and reduce the overall population of j In consequence, escapement goals, particularly post-overesca relation to the forage base (macrozooplankton) of a system.
Trends in the ratio of smolt production to brood year escapen productivity of Akalura Lake as a result of the 1989 overesca improved smolt production ratios in recent years suggest that the time to capitalize on the lake’s rearing potential by ensuri volume estimates of Akalura Lake (45.1~10~ m’) suggest apt 486,864 to 1,239,700. Using the average (863,282 smolt) a n c survival of lo%, allows for production of approximately SO,( Edmundson et al. (1994) similarly calculated an estimated pr salmon based upon 2,300 adults per euphotic volume. Allow in an escapement of 40,000-50,000 adults.
Based on a conservative estimate of smolt-to-adult survival ( exploitation rate of So%, the adult run to Akalura Lake durin 30,000 fish of which 15,000 fish will escape to spawn. This 1 improvement over escapements observed since 1993 (exclud lower bound escapement goal of 40,000.
It is likely that over time sockeye production will rebound to significant escapements. However, the continued monitoring essential so that appropriate rehabilitation efforts, changes in evaluated to hasten the recovery of the Akalura sockeye run.
better trap efficiency testing), comparisons of estimates to true smolt outmigration indicate that
1
h 11
e
ti 1
U g
I n IF
ir
1 u
3
0
11
1 k? e 1
12
,escapement, overgrazing and ile increased escapements provide ch excess fish do not necessarily vidence that overescapements : classes and suppressing secondary ons requires time in order to venile salmon rearing in the lake. ement, should be viewed in
ent strongly indicate damage to the ement event. Furthermore, kis system is in recovery. Now is lg adequate escapements. Euphotic tential smolt production from a conservative smolt to adult 10 adult sockeye salmon. duction of 100,000 adult sockeye 1g for a 50% harvest rate will result
0%; Koenings et al. 1993) and an 1998 should be approximately
vel of escapement would be an 1g 1997), but it is still far below the
Ire-oil spill levels given continued )f this system’s productivity is khery management, or both can be

LITERATURE CITED
Barrett, B.M., and B.E. Monkiewicz. 1989. A survey of th salmon fishing grounds for oil spill contaminants, 1989. Regional Information Report 4K89-25. Alas Game, Division of Commercial Fisheries, Kodiak,
Barrett, B.M., P.A. Roche, andC.0. Swanton. 1993a. SOC nerka smolt investigations at Red, Akalura, and UF response to the 1989 M N Exxon Vuldez Oil Spill, Information Report 4K93-1. Alaska Department o Commercial Fisheries, Kodiak, Alaska.
Barrett, B.M., C.O. Swanton, andP.A.Nelson. 1993b. SOC timing, and growth characteristics for Red, Akalur; Regional Information Report 4K93-32. Alaska Del Division of Commercial Fisheries, Kodiak, Alaska
Carlson, S.R., L.G. Coggins, Jr., and C.O. Swanton. In Re for mark-recapture estimation of salmon smolt
Culbertson, J.S. 1938. Report of operations - Kodiak-Afo Interior, Fish and Wildlife Service, Juneau, Ala
Delacy, A.C., and W.M. Morton. 1943. Taxonomy rnalrna and Salvelinus alpinus, of the Karluk drain, SOC. 72:?9-91.
Edmundson, J.A., L.E. White, S.G. Honnold, and G.B. K sockeye salmon production in Akalura lake. Regio 17. Alaska Department of Fish and Game, Divisio Juneau, Alaska. 1
Ferrandini, R.A. 1939. Kodiak-Afognak District: 1939 rep Department of the Interior, Fish and Wildlife Servi
Hungerford, H.H. 193 1. Report of operations - Kodiak-Afl the Interior, Fish and Wildlife Service, Juneau, Ala
Hungerford, H.H. 1934. Report of operations - Kodiak-Afl the Interior, Fish and Wildlife Service, Juneau, Ala
INPFC (International North Pacific Fisheries Commission, Vancouver, British Columbia.
13
E Kodiak Management Area 16 April to 17 September, ca Department of Fish and Alaska.
[eye salmon Oncorhynchus lper Station Lakes conducted in 1990-1992. Regional FFish and Game, Division of
:keye salmon smolt abundance, t, and Frazer Lakes, 1993. mrtment of Fish and Game,
riew. A simple stratified design S.
nak District. Department of the
)its of the charrs, Salvelinus Ige system. Trans. A m . Fish.
le. 1994. Assessment of lal Information Report 5594- I of Commercial Fisheries,
ort of fishery operations. ce, Juneau, Alaska.
Jgnak District. Department of Ska.
~gnak District. Department of ska.
). 1963. Annual Report 1961.

King, B.E., L.K. Brannian, and K. E. Tarbox. 1991. Kena 1990-91. Regional Information Report No. 2S91-I and Game, Division of Commercial Fisheries M a Anchorage, Alaska.
Koenings, J.P., and G.B. Kyle. 1991. Collapsed populatic zooplankton in response to heavy juvenile sockeyl foraging. International Symposium on Biological Wild Salmonids, Nanaimo, B. C.
Koenings, J.P., H. Geiger, and J. Hasbrouck. 1993. Smolt sockeye salmon: effects of length and latitude afte Aquat. Sci. 50:600-611.
Koo, T.S.Y. 1962. Age designation in salmon. Pages 37-r salmon. University of Washington Press, Seattle.
Krebs, C.J. 1989. Ecological Methodology. Harper Collir
Kyle, G.B., J.P. Koenings, and B.M. Barrett, 1988. Densi responses to an introduced run of sockeye salmon Lake, Kodiak Island, Alaska. Canadian Journal of 45:856-867.
McConnell, R.J., and G.R. Snyder. 1972. Key to field ide juvenile salmonids in the Pacific Northwest. Natic Circular 366. National Oceanic and Atmospheric
Meacham, C.P., and J.H. Clark. 1979. Management to inc production. Pages 377-386 in: H. Clepper (ed.). I fisheries management. Sport Fishing Institute, WS
Petry, C. 1942. Annual report of operation in the Kodiak the Interior, Fish and Wildlife Service, Juneau, AI
Schmidt, D.C., K.E. Tarbox, B.M. Barrett, L.K. Branniar J. M. Edmundson, S.G. Honnold, B.E. King, G.B, and C.O. Swanton. 1993. Sockeye salmon overesc Spill StateFederal Natural Resource Damage As3 (FisWShellfish Study Number 27), Alaska Depart Commercial Fisheries Management and Develop1
LITERATURE CITED (Cont 1 d B It
,I e I.
- I
t
1
14
nued)
River sockeye smolt studies, , Alaska Department of Fish igement and Development,
LS and delayed recovery of salmon (Oncorhynchus nerka) nteractions of Enhanced and
to-adult survival patterns of entering sea. Can. J. Fish.
3 in: Studies of Alaska red
i. 654 pp.
y dependent trophic level :Oncorhynchus nerka) at Frazer Fisheries and Aquatic Sciences
dification of anadromous la1 Marine Fisheries Service idministration, Seattle.
‘ease anadromous salmon .edator-prey systems in ihington, D.C.
htrict, 1942. Department of ska.
S.R. Carlson, J.A. Edmundson, Kyle, P.A. Roche, P. Shields, qxment, &on VaIdez Oil ssment Final Report lent of Fish and Game, lent Division, Soldotna, Alaska.

LITERATURE CITED (Co
Swanton, C.O., B.M. Barrett, and P.A. Nelson. 1995. S estimates, emigration timing, and size at age F a r Lakes, 1994. Regional Information of Fish and Game, Division of Commercial Fishe
Swanton, C.O., P.A. Nelson, and L.G. Coggins, Jr. 1996. estimates, emigration timing, and size at age Frazer Lakes, 1995. Regional Information Report Fish and Game, Division of Commercial F
Swanton, C.O., L.G. Coggins, Jr., and S.G. Honnol salmon (Oncorhynchus nerka) overescapements o rearing fry abundance, smolt production, and adul Archipelago lakes as caused by the Exxon Valdez Spill Natural Resource Damage Assessment Final 96258), Alaska Department of Fish and Game, Co Management and Development Division, Kodiak,
Turner, C. 1936. Report of operations-Kodiak-Afognak Interior, Fish and Wildlife Service, Juneau, Alaska
Thedinga, J.F., M.L. Murphy, S.W. Johnson, J.M. Lorenz, Determination of salmonid smolt yield with Alaska, to predict effects of glacial flooding. No Management 14:837-851.
Trautman, M.B. 1973. A guide to the collection salmon in Alaska with an illustrated key. National Technical Memorandum ABFL-2. Administration, Seattle.
15
med)
:ye smolt population teristics for Red, Akalura, and K95-26. Alaska Department :s, Kodiak, Alaska.
ockeye smolt population teristics for Red, Akalura, and K96-16. Alaska Department of Kodiak, Alaska.
view. Effects of sockeye zooplankton communities, returns within Kodiak Nil Spill. Exxon Valdez Oil Leport (Restoration Project unercial Fisheries daska.
strict. Department of the
and K.V. Koski. 1994. $crew traps in the Situk River, American Journal of Fisheries
ication of pre-smolt Pacific rlarine Fisheries Services c and Atmospheric

Table 1. Estimated number of sockeye salmon smolt outmigrati4g from Akalura Lake by year and age class, 1990-1997,
Smolt Number and Relative Percent Tota
Year 0. 1. 2. 3. 4. Estimi Popula Outmigration of Smolt by Age Class
1990 0 0.0%
1991 0 0.0%
1992 21 0.0%
1993 0 0.0%
1994 128 0.1%
1995 0 0.0%
1996 0 0.0%
1997 196 0.1%
60,107 394,652 0 13.2% 86.8% 0.0%
8,172 270,867 2,181 2.9% 96.3% 1%
2,173 180.557 8,561 1.1% 94.4% 4.5%
2,150 57,512 5,624 3.3% 88.0% 8.6%
71.495 91,296 8,996 41.6% 53.1% 5.2%
60,654 71.187 268 45.9% 53.9% 0.2%
15,639 228,766 1,416 6.4% 93.1% 0.6%
14,874 178,680 0 7.7% 92.2% 0.0%
0 0%
0 0%
0 0%
80 0%
0 0%
0 0%
0 0%
0 0.0%
454.7
281,2
191,3
65.36
171,9
132.1
2458
193.7
a Italicized standard error and confidence intervals from bootsk The 1996 and 1997 smolt outmigrations were enumerated via precision are not available.
b
16
on 95% CI e SE Lower Upper
9 56,896 343,243 566,275 61,043 363,054 590,669 a
0 23,741 234,688 327.752 24,426 237,050 333.251
3 11,098 169,560 213,066 11,067 170,497 214,448
i 7,104 51,443 79,289 7,045 52,862 79,763
5 9,569 153.159 190.671 9,839 154,112 192,359
0 9,339 113,806 150,414 9,882 115.939 154,980
1 b
0 b
pping methods. I counting weir. Estimates of

from Akalura Lake by brood year and age class, 198 Table 2. Adult sockeye salmon escapement and estimated s olt outmigration 7-
Brood Smolt Numbers by Age and Percel Year Escapement 0. 1. 2. 3.
1985
1986
1987
1988
1989
1990
1991
1992
1993
1994
1995
1996
1997
6
9,800
6.1 16
38,618
116,029
47,181
44,189
63,269
30,692
13,681
2,010
7,898
18.140
a
a
a
a
0
0
21
0
128
0
0
196
a a a
a a 0
a 394,652 2.181
60,107 270,867 8,561 17.7% 79.8% 2.5%
8,172 180.557 5,624 4.2% 92.9% 2.9%
2,173 57,512 8.996 3.2% 83.7% 13.1%
2.150 91,296 268 2.3% 97.4% 0.3%
71,495 71,187 1,416 49.6% 49.4% 1.0%
60,654 228,766 0
15,639 178,680
14.874
c
a Smolt migration not monitored. Incomplete brood year data.
' Smolt of this age class have not outmigrated. Akalura weir not operated in 1985.
17
.1995.
- Total Srnolts/Adult
I Yo
%
%
%
b
b
b
339,615
194,354
68,681
93,736
144,099
289.548
194,319
14,874
b
8.8
1.7
1.5
2.1
2.3
9.4
14.2
7.4

Table 3. Length, weight, and condition factor o f Akalura Lake sockeye salmon smolts, 1997.
Length (mm) Weight (9) Condition Stat Sample Standard Sample Standard Sample Standard
Age Week Size Mean Error Size Mean Error Size Mean Error
0 23 6 57.5 2.1 6 1.6 0.2 6 0.8 0.0 0 24 3 61.7 3.4 3 1.9 0.4 3 0.8 0.0 0 25 1 50.0 -- I 1 . I 1 0.9 _ _ __
1 19 1 91.0 _ _ 1 6.3 1 0.8 1 20 8 85.6 1.8 8 5.0 0.4 8 0.8 0.0 1 21 5 80.2 1.0 4 3.8 0.1 4 0.8 0.0 1 22 78 81.3 0.4 78 4.4 0.1 78 0.8 0.0 I 23 116 82.0 0.5 116 4.7 0.1 116 0.8 0.0 I 24 115 84.3 0.5 115 5.1 0.1 115 0.8 0.0
_ _ _ _
1 25 38 75.1 1.7 38 3.8 0.3 38 0.9 0.0 -- 0.9 f f 5 6.5 e. 1 3 0.8 0.6 2 20 338 91.1 0.2 338 6.0 0.0 338 0.8 0.0 2 21 201 91.3 0.3 172 6.2 0.1 172 0.8 0.0 2 22 271 92.3 0.3 271 6.5 0.1 271 0.8 0.0 2 23 39 90.4 1.0 39 6.2 0.2 39 0.8 0.0 2 24 19 95.5 0.8 19 7.4 0.2 19 0.9 0.0 2 25 1 87.0 .. 1 5.5 _ _ 1 0.8 __
~ -
18

Table 4. Comparison of the true and estimated trap efficiency and smolt outmigration during 1996 and 1997. The 1997 estimates are both unadjusted and adjusted for estimated delayed dye mortality.
~ ~~ ~
Smolt Outmigration Date Trap Efficiency Estimated 95% C.I. b
Year Stratum Starting Ending Estimated True a dye mortality Estimated Lower Upper True a
1996 1 511 0 511 5 28.7% 19.5% 76.815 66,481 87.149 113,864 2 5/16 5/22 15.3% 32.5% 52,919 42,268 63,569 25,074 3 5/23 5/28 6.0% 4 5/29
1 1.4% 614
59.833 39,350 80,316 32,404 13.1% 36.7%
5 615 611 1 10.5% 29.3% 18,485 13,885 23.085 6.728 62.068 48,569 75,567 22,497
6 611 2 611 7 10.1% 29.8% 2,512 1,730 3,295 870
d
1997 1 4/30 511 1 20.5% 21.9% 4% 63,991 53.782 76,128 60,511 (Unadjusted) 2 511 2 511 9 20.4% 18.3% 0% 74,161 63,407 88.317 83.265
3 5/20 5/26 16.6% 23.9% 6% 4
40,709 33,642 48,616 28.504 5/27 612 18.3% 20.0% 0% 19,501 16,392 23,121 17.978
5 613 6/12 6.0% 17.7% 6% 8,092 5,743 1 1,462 2.806
1997 1 4/30 511 1 21.4% 21.9% 4% 61,499 51,531 73,143 60.51 1 (Adjusted) 2 511 2 511 9 20.4% 18.3% 0% 74,161 62,926 87,391 83.265
3 5/20 5/26 17.6% 23.9% 6% 38,283 31,724 47,369 28,504 4 5/27 612 18.3% 20.0% 0% 19,501 16.248 23,409 17,978 5 613 6/12 6.3% 17.7% 6% 7,610 5,488 10,890 2,806
a True smolt outmigration is the number of smolt counted through the weir, and true trap efficiency is the quotient of the total strata trap catch and the total strata weir count x 100. Confidence intervals in 1996 were estimated assuming a normal distribution, and confidence intervals for 1997 data were estimated using boostrap techniques. Starting and ending dates were established based on mark-recapture trials. Dye mortality trials to adjust smolt outmigration estimates; estimates were not conducted in 1996.
19

,' '- /I ,(
i
i
I oz
't
c

1996 Trap and Weir Configuratio
I n 1997 Trap and Weir Configuratic
\ SV I 1
now
1
Figure 2.Trap and weir configurations at Akalura Lake, 1s
21
j and 1997.

I
t
I
c 0)
I
I
0 0
0
0
0
0
0
0
0
0
0
0
ln 0
ln I
-t *
0
0
m
0
m
N
0
N
9
9
9
0
0
8 9
9
5:
m
m
!2
t 3 t +
t
x 0
0
0
9
0
0
LD
8 -
N
N
c I
0
0
0
0
0
0
0
0
W
9
0-
8 r-
tn

Wei
ght (
9)
.A
o-
w~
~c
nr
n~
mw
o
t~~~~t..++t+
2
W
-4
m
Leng
th (m
m)
00
00
00
0
22
~a
cn
mo
~

c
@4 L
r
0 0 9
2 , , , ,
1. '.
I... -_
.. ..
0
0
N
0
0.
c

60% , I
O E s t i m a t e d Trap 1 Efficiencv 1
50% +
40% 4 E c a! .- $ 30% +
20%
10%
0%
35%
30%
25% E - C a!
$ 20% YI n e
15%
10%
0%
+True Trap Efficiency
n
40% -
1 I stratum 1 I stratum 2 stratum 3 stratul I I
~
n! i i
O E s t i m a t e d Trap ~
Efkiency 1 ,
1996
I I I stratum 5 stratum 6
1997 O E s t i m a t e d Trap ~
I
I I I I stratum 1 stratum 2 stratum 3 stratum 5
Figure 7. True and estimated trap capture efficiencies at Akalurd Lake during 1996 and 1997.
26 i I

APPENDIX A I

Appendix A.1. Estimated number of sockeye salmon smolt outmigrating from Akalura Lake by temporal strata, age class, and year, 1996-1997.
Year Stratum' Start End Stratum Date:
I996 I996 1996 I996 I996 1996 1996
2 1 4/26 5/2
513 519
4 5/17 5/23 3 5/10 5/16
5 5/24 5/30 6 5/31 6/6 7 6/7 6/13
Population ' 95% CI Estimate SE Lower Upper
0 0 0 0 0
0 0 0 0 0 0 0
0
0 0 0 0
0 0
0 0
0 0 0 0 0 0 0
Age-I I Age2 I Population 95% CI Population Estimate SE Lower Upper Estimate SE Lower Upper Estimate SE Lower Upper
I I
95% CI Population 95% CI
0
4.294 895
624 3,468 2.642 3,017
0 0 0 5 0 5 5 335 239 1,552 43,356 358 42,655 44.057
1,333 1,681 6.908 114,231 1,512 111,268 117,194 194 243 1.005 20,657 194 20,276 21.038 603 2.285 4.650 34,214 603 33,032 35,397 463 1.936 3.749 15.810 463 14,903 16,716 75 2.869 3,165 487 75 339 635
0 0 0 0 128 128 0 378
0 0
0 0
0 0
0 0
0 0
0 0
0 0 0 0
1.288 740 0 2.738
I I I I 1997 1 I997 2 I997 3 I997 4 I997 5
997 7 997 6
997 8
4/30
5/10 5/3
5/17 5/24 5/3 1
6/14 6/7
512 0 5/9 0
0 0
0 0
5/16 0
0 0
5/23 0
0 0 0
5/30 0 0 0 0
0
6/6 151 60 33 0 0
269 6/13 32 18 0 68 6/20 11 11 0 33
0 0
1.681 587 238 237
656 7.648 763
290
2,918 143 1,223 46 434 16
0 0 703 53.536
0 21
530 2,832 71.003
6,152 9.144 26,572 88 1,224 26,352
2,637 3,199 981 1,133 1,313 202 403 465 11
0 21 237 53,071
290 25.7&1 587 69,852
763 25.076 137 713 43 11
118 0
54.001 21
72.154 26.920 28.068 1,249 286 33
: o 0 0 0 I O 0 0
0 0
0 0 0 0
0
0 0 0
0 0 0
0 0 0
0 0
0 0 0 0 0
0 0
a Strata defined by statistical week. b Population estimates derived from weir counts.
A-1

Appendix A.2. Akalura Lake sockeye salmon smolt catch, efficiency estimates, and weir catches, 1997
Date Trap Catch Released Recovered Daily
4/30 51 1 512 513 514 515 516 5ff 518 519
511 0 511 1 511 2 511 3 511 4 511 5 511 6 511 7 511 8 511 9 5/20 512 1 5122 5/23 5/24 5/25 5/26 5127 5/28 5/29 5/30 5/31 611 612 613 614 615 616 6R 618 619
0 0 2
15 13 37
569 248
4,204 5,886 1,639
631 782
1,384 4,269 2,377
504 5,699
125 69
105 349 874 750 663
2,346 1,724 1,594 1,133
305 162 90
117 198 45 52 50 46 89
105 67
487
550
51 9
530
520
61 3: I
3: 71
3 3 1
4 4
1
-Continued- A-2
20.5%
20.4%
16.6%
18.3%
6.0%
Estimated Weir Trap Efficiency Catch
1 7
13 146 68
260 2,076 1.138
18.232 31,854 4,626 2,090 4.387
13.486 37,669
8,764 1,662
16,359 598 340 553
1.745 3.91 3 3,500 2,404 7,940 8.449 6,699 6,645 1,199
884 880 620
1,051 353 334 31 9 493 410 304 31 0 86

Appendix A.2. (page 2 of 2) I
Daily Date Trap Catch Released Recovered
611 1 22 611 2 1 1 611 3 6/14
Trap Pulled
611 5 611 6 611 7 611 8 611 9 6/20 6/21 6/22 6/23 6/24 6/25 6/26 6/27
Total 39,360 2,606 42E
A- 3
Estimated Weir rrap Efficiency Catch
92 105 150 157 51 109 46 42 17 34 13 16 20 21 10
Weir Pulled
16% 193,750

Appendix A.3. Daily climatological observations, water temp rature, and water depth monitored at the Akalura field station, 1997. e
1 Stream Temperature Cloud Wind
Date Time Air (“C) Water (“C) Cover % Direction Speed (qPH) (cm) Comments Gauge
511 512 513 514 515 516 5/7 518 519
5/10 5/11 511 2 511 3 5/14 511 5 511 6 511 7 511 8 511 9 5/20 512 1 5/22 5/23 5/24 5/25 5/26 5/27 5/28 5/29 5/30 5/31 611 6/2 613 614 615 616 6l7 618 619
18:OO 18:OO 18:OO 18:OO 18:OO 18:OO 18:OO 18:OO 18:OO 18:OO 18:OO 18:OO 18:OO 18:00 18:OO 18:OO 18:OO 18:OO 18:OO 18:OO 18:OO 18:OO 18:OO 18:OO 18:OO 18:OO 18:OO 18:OO 18:OO 18:OO 18:OO 18:OO 18:OO 18:OO 18:OO 18:OO 18:OO 18:OO 18:OO 18:OO
10 10 16 13 14 12 11 13 10 11 7 7 7 7 11 7 8 8 8 12 9 15 16 13 17 18 17 17 11 14 14 13 17 13 15 15 15 13 13 12
6 6
10 8
8 9 9 9 9 9 8 7 8 7 8 7 7 9 8 8 8 11 12 11 13 14 15 13 12 13 14 13 14 14 14 14 12 14 13 13 I d
100 30 30 60 65 25 75 90 100 90 100 100 100 75 100 100 50 95 100 100 50 0 0 0 0 0
40 100 80 80 0 0 95 95 100 100 65 80 95 100
SE SE NW SE SE S
SE SE S
SE SE NW S
VAR SE SE sw SE SE
VAR VAR
N VAR
S CALM NW NE NE SE
CALM SW S
CALM S N
CALM sw
CALM S
CALM
10-1
5-1 0 5 5 5 15 25 15 15 10 10 10 10
10 CAL
45 45 45 45 44 44 44 44 44 Weather changing rapidly 44 44 47 45 47 47 48 48 48 48 48 48 48 47 47 47 47 46 46 45 45 44 44 44 44 45 45 45 43 42 42
rain
rain
6/10 18:OO 13 . . 100 NE 42 -Continued- I
A-4

Appendix A.3. (page 2 of 2)
Temperature Cloud Wind Date Time Air (“C) Water (“C) Cover % Direction Speed ( 6/11 18:OO 11 13 100 S 5 6/12 611 3 611 4 611 5 611 6 611 7 611 8 611 9 6/20 6/21 6/22 6/23 6/24 6/25 6/26 6/27 6/28 6/29 6/30
18:OO 18:OO 18:OO 18:OO 18:OO 18:OO 8:OO 8:OO 8:OO 8:OO 8:OO 8:OO 8:OO 8:OO 8:OO 8:OO 8:OO 8:OO
11 13 100 11 13 75 10 12 100 13 10
14 75 13 100
12 14 40 9 12 90 9 12 0 10 12 100 9 13 0 11 13 0 12 13 100 10 13 100 11 13 100 14 14 50 12 14 0 13 14 0 11 14 15
SE S
SE S
CALM S
NW CALM CALM
N CALM CALM CALM CALM N
NW CALM CALM VAR
10 15 25 5
CAL 15 5
CAL CAL
CAL CAL CAL CAL
<E <:
CAL CAL
5
A-5
Stream
42 42 43 42
I 42 42 41
I 41 I 41
42 I 41 I 40 I 40 I 40
40 39
I 39 I 39
39
rain rain