The Pequest Trout Hatchery & Natural Resource Education Center is operated by the Department

PROJECT 4: HATCHERY TROUT EVALUATIONS
Grant # F-73-R-37
Report Period July 1, 2014 to June 30, 2015
John Cassinelli Senior Fisheries Research Biologist
IDFG Report Number 15-07 April 2015

Annual Performance Report
July 1, 2014 to June 30, 2015
Grant # F-73-R-37
Project 4: Hatchery Trout Evaluations
Subproject #1: Improving Returns of Hatchery Catchable Rainbow Trout Including Evaluations of Statewide Exploitation Rates, Hatchery Rearing Density, Hatchery Size
Grading, and Magnum versus Standard Catchable Releases
Subproject #2: Relative Performance of Triploid Kokanee Salmon in Idaho Lakes and Reservoirs
Subproject #3: Relative Performance of Triploid Westslope Cutthroat Trout in Alpine
Lakes
By
John Cassinelli
Idaho Department of Fish and Game 600 South Walnut Street
P.O. Box 25 Boise, ID 83707
IDFG Report Number 15-07 April 2015

i
TABLE OF CONTENTS Page
ANNUAL PERFORMANCE REPORT ......................................................................................... 1 SUBPROJECT #1: IMPROVING RETURNS OF HATCHERY CATCHABLE RAINBOW
TROUT INCLUDING EVALUATIONS OF STATEWIDE EXPLOITATION RATES, HATCHERY REARING DENSITY, HATCHERY SIZE GRADING, AND MAGNUM VERSUS STANDARD CATCHABLE RELEASES ................................................................. 1
ABSTRACT ................................................................................................................................. 1 INTRODUCTION ........................................................................................................................ 2
Study Questions ....................................................................................................................... 4 METHODS .................................................................................................................................. 4
Study Sites ............................................................................................................................... 4 Rearing Density ....................................................................................................................... 4
American Falls Fish Hatchery ................................................................................................ 5 Hagerman Fish Hatchery ...................................................................................................... 5 Nampa Fish Hatchery ............................................................................................................ 5
Size Grading ............................................................................................................................ 6 American Falls Fish Hatchery ................................................................................................ 6 Hagerman Fish Hatchery ...................................................................................................... 6 Nampa Fish Hatchery ............................................................................................................ 6
Magnums ................................................................................................................................. 7 Tagging .................................................................................................................................... 7 Data Analysis ........................................................................................................................... 8
RESULTS ................................................................................................................................... 9 Statewide Exploitation .............................................................................................................. 9
Release Years 2011 and 2012 .............................................................................................. 9 Release Year 2013 ............................................................................................................... 9
Rearing Density ..................................................................................................................... 10 Size and Rank at Release ...................................................................................................... 10 Tag Reporting Rate ................................................................................................................ 11
DISCUSSION............................................................................................................................ 11 Statewide Exploitation ............................................................................................................ 11 Rearing Density ..................................................................................................................... 11 Size and Rank at Release ...................................................................................................... 12 Tag Reporting Rate ................................................................................................................ 13
RECOMMENDATIONS ............................................................................................................. 14 ACKNOWLEDGEMENTS ......................................................................................................... 15 LITERATURE CITED ................................................................................................................ 16 ANNUAL PERFORMANCE REPORT ....................................................................................... 27 SUBPROJECT #2: RELATIVE PERFORMANCE OF TRIPLOID KOKANEE SALMON IN
IDAHO LAKES AND RESERVOIRS .................................................................................... 27 ABSTRACT ............................................................................................................................... 27 INTRODUCTION ...................................................................................................................... 28 OBJECTIVES ........................................................................................................................... 29 METHODS ................................................................................................................................ 30

ii
Study Sites ............................................................................................................................. 30 Collecting Eggs/Spawning ..................................................................................................... 30 Hatchery Rearing ................................................................................................................... 30 Sampling ................................................................................................................................ 31 Data Analysis ......................................................................................................................... 31
RESULTS / DISCUSSION ........................................................................................................ 31 ACKNOWLEDGEMENTS ......................................................................................................... 33 LITERATURE CITED ................................................................................................................ 34 ANNUAL PERFORMANCE REPORT ....................................................................................... 38 SUBPROJECT #3: RELATIVE PERFORMANCE OF TRIPLOID WESTSLOPE
CUTTHROAT TROUT IN ALPINE LAKES .......................................................................... 38 ABSTRACT ............................................................................................................................... 38 INTRODUCTION ...................................................................................................................... 39
Study Objective ...................................................................................................................... 40 METHODS ................................................................................................................................ 40
Egg Collection / Rearing ........................................................................................................ 40 Fish Marking / Stocking .......................................................................................................... 41 Study Sites ............................................................................................................................. 41 Fish Sampling ........................................................................................................................ 41 Habitat ................................................................................................................................... 42 Data Analysis ......................................................................................................................... 42
RESULTS ................................................................................................................................. 42 DISCUSSION............................................................................................................................ 42 ACKNOWLEDGEMENTS ......................................................................................................... 44 LITERATURE CITED ................................................................................................................ 47 APPENDICES ........................................................................................................................... 49

iii
LIST OF TABLES Page
Table 1. Total nonreward tags released by water body, hatchery, treatment and
date in 2013. Harvest (Exploitation) and Total Catch (Total Use) are through the first year at large and shown as of January, 1 2015 with associated 90% confidence intervals (C.I.). ........................................................ 19
Table 2. Mean density index (DI, lbs/ft3/inch), flow index (FI, lbs/GPM/ft3) across the entire rearing period by hatchery and treatment for tagged catchable Rainbow Trout in 2011 and 2012. Length is the mean total length (mm) at the time of stocking (with 95% confidence intervals in parentheses). ................. 22
Table 3. Current list of waters and stocking numbers for early Kokanee Salmon. Selected study sites for evaluating switching to triploid-only stocking (treatment) are shown in bold font. ..................................................................... 36
Table 4. Net-hours, CPUE, and age distribution of diploid (2N) and triploid (3N) Kokanee Salmon in two control and two treatment lakes for sample years 2012, 2013, and 2014. ....................................................................................... 36
Table 5. Stocking locations for diploid (2N) and triploid (3N) Westslope Cutthroat Trout in 2011 and 2013. ..................................................................................... 45

iv
LIST OF FIGURES Page
Figure 1. Total catch rate for all lakes and reservoirs versus all community ponds
stocked in 2011, 2012, and 2013. ...................................................................... 23 Figure 2. Cumulative percentage caught versus days-at-large (in first year at large)
for tagged hatchery catchable trout that were released in lakes/reservoirs, community ponds, and rivers in 2013 and subsequently caught. ........................ 23
Figure 3. Catch by density index (top panel) and catch by flow index (bottom panel) for all study groups released across all waters in both 2011 and 2012, combined. .......................................................................................................... 24
Figure 4. Percent of density rearing study fish reported by anglers versus total length at release for each hatchery. Data is for both 2011 and 2012 release years combined and represents individual fish length and catch rather than averages by release group. .............................................................. 25
Figure 5. Scatter plot of mean total catch of density rearing study hatchery catchable Rainbow Trout released from American Falls, Hagerman, and Nampa fish hatcheries across 13 lakes/reservoirs in 2011 and 2012 versus water surface area for each water stocked. ............................................ 25
Figure 6. Mean percent of tags that were caught vs. length at tagging of all hatchery catchable trout released in 2011, 2012, and 2013. The shaded gray areas show the number of tagged fish released each year and is plotted on the secondary Y axis. ........................................................................ 26
Figure 7. Total catch rate for magnum (13-inch) versus standard (10-inch) catchables at 10 common reservoirs in southeast Idaho. Fish were stocked in 2013. ................................................................................................. 26
Figure 8. Catch per unit effort for Kokanee sampling at all four study waters in 2012, 2013, and 2014. ....................................................................................... 37
Figure 9. Length distribution (by percent) of Kokanee Salmon across the four different study water bodies. These distributions represent “baseline” samples taken in the summer of 2012, 2013, and 2014. .................................... 37
Figure 10. Catch per unit effort (fish/net-hour) of diploid and triploid Westslope Cutthroat Trout vs. stocking density (fish/acre) for all study waters stocked in 2011 and sampled in 2014. ............................................................... 46
LIST OF APPENDICES
Appendix A. Harvest and total catch of tagged hatchery catchable Rainbow Trout released in 2011 and 2012 by water and IDFG region. Harvest and catch estimates for each water represent the average rates for all releases within that year. For treatment- and date-specific return rates by water, see appropriate yearly Hatchery Trout Evaluation Reports. ............................... 50

1
ANNUAL PERFORMANCE REPORT SUBPROJECT #1: IMPROVING RETURNS OF HATCHERY CATCHABLE RAINBOW
TROUT INCLUDING EVALUATIONS OF STATEWIDE EXPLOITATION RATES, HATCHERY REARING DENSITY, HATCHERY SIZE GRADING, AND MAGNUM VERSUS STANDARD
CATCHABLE RELEASES
State of: Idaho Grant No.: F-73-R-37 Fishery Research Project No.: 4 Title: Hatchery Trout Evaluations Subproject #1: Improving Returns of Hatchery
Catchable Rainbow Trout Contract Period: July 1, 2014 to June 30, 2015
ABSTRACT
Idaho Department of Fish and Game (IDFG) hatcheries are integral to managing coldwater sportfishing opportunities in Idaho. A comprehensive evaluation of hatchery catchable trout exploitation rates in Idaho’s put-and-take fisheries has been lacking. This project is intended to (1) evaluate catch and harvest rates of the most-stocked waters statewide, and (2) conduct research focusing on hatchery rearing techniques to increase return-to-creel of catchable Rainbow Trout Oncorhynchus mykiss. Since 2011, IDFG has released roughly 30,000 T-bar anchor tagged catchables annually in an effort to facilitate the project goals. Research specific to hatchery rearing techniques has been year-specific and included studies of raceway rearing density (2011 and 2012), size grading (2013 going forward), and magnum vs. standard catchables (2013 going forward). This report serves as a completion report for the density rearing study as well as an update report for 2013 tagging including size grading, size-at-release, and statewide exploitation. Fish released as part of the density rearing study were reared at high (0.3 lbs/ft3/inch), medium (0.23 lbs/ft3/inch), and low (0.15 lbs/ft3/inch) raceway densities at three Idaho hatcheries and released into common lakes and reservoirs in 2011 and 2012. Resulting catch data showed that rearing density was not a significant factor in determining subsequent catch, yet fish length and surface area of the water stocked were. Larger fish and smaller waters resulted in increased total catch. Beyond the density study, average harvest and total catch for catchable Rainbow Trout across all evaluated waters was 23.4% (± 2.9%) and 30.0% (± 3.7%) respectively, for all tags released in 2013 and reported within 365 days of release. Harvest and total catch for 13 community ponds was 36.0% (± 5.2%) and 54.0% (± 7.3%), respectively. Additionally, we evaluated catch based on length at release. Catch increased with increasing fish length, and from 200 mm to 305 mm there was roughly a 7% increase in catch rates for each 25 mm increase in length at stocking. Magnum catchables (305 or 330 mm, average) were released alongside standard (254 mm average) catchables at 10 southeast Idaho reservoirs and showed a greater than two-fold increase in return-to-creel. Magnum evaluations are ongoing and will be further reported in future reports. Author: John Cassinelli Senior Fisheries Research Biologist

2
INTRODUCTION
Idaho Department of Fish and Game (IDFG) hatcheries are integral to managing coldwater sportfishing opportunities in Idaho. IDFG’s “resident” (non-anadromous) hatchery program consists of 10 hatcheries that raise up to 18 strains of salmonids for inland coldwater fisheries. In 2009, Idaho resident hatcheries stocked over 17.6 million fish in over 500 waters (Frew 2010), including about 2.2 million “catchable” Rainbow Trout Oncorhynchus mykiss. Producing catchable Rainbow Trout (typically stocked at an average size of 254 mm) accounts for over 50% of the annual resident hatchery budget and about 84% of the total weight of fish stocked annually. Hagerman, Nampa, and American Falls fish hatcheries provide the majority of IDFG catchable trout, with Hagerman providing nearly half. According to the default catchables stocking request list, Rainbow Trout are planted in approximately 290 waters throughout Idaho. Despite the high number of waters stocked with catchables, a relatively small number of waters account for the majority of fish stocked. For example, five waters (Cascade, American Falls, Blackfoot, Chesterfield reservoirs, and Lake Walcott) account for 14% of the total annual catchable production, and 30 waters account for 50% of total production
Current hatchery production capacity and funding are not increasing, while demand for
hatchery catchable trout remains steady or is increasing. Considering the costs associated with stocking catchable trout, a comprehensive evaluation of hatchery catchable exploitation rates (i.e. return-to-creel) in Idaho’s predominant put-and-take fisheries is needed. Total hatchery production is an insufficient measure to determine whether hatcheries are successful. Instead, hatchery success should be measured in terms of contribution to harvest (Blankenship and Daniels 2004). Recent IDFG studies have begun to evaluate return-to-creel on a statewide basis using angler-caught tagged fish (Meyer et al. 2010). These evaluations were mainly intended to evaluate regional fisheries management objectives and establish typical exploitation rates for warm-water and cold-water fisheries. Meyer et al. (2010) estimated exploitation rates for hatchery catchable Rainbow Trout in four of the top-10 waters stocked but in only six of the top-20 waters stocked. While this is an improvement in evaluating success, only a small number of waters have been evaluated over several years, so relatively little is known about variation in return-to-creel rates between years in our major stocked fisheries. Given the current economic climate for IDFG hatchery funding, efforts to ensure that hatchery programs remain efficient while producing a quality product for Idaho anglers are of high priority.
One of the key metrics defining a “quality” hatchery trout should be measured in terms of
contribution to angler return-to-creel (either catch or harvest). More information on return-to-creel rates of catchable Rainbow Trout is currently needed. Exploitation rates of Idaho’s most prominent stocked fisheries may identify locations were catch objectives are met or where stocking is not providing the intended benefit. This information may identify underperforming fisheries or poor fish performance. Decisions about effective allocation of catchable trout could subsequently improve the efficiency of the resident hatchery system and directly benefit anglers by increasing return-to-creel of catchable trout. This type of monitoring and evaluation program will be critical to guide the decision-making process and implement changes in allocating catchable Rainbow Trout production.
In addition to the primary goal of determining exploitation rates for major catchable trout
fisheries, evaluating rearing methods to increase return-to-creel is also important. Rearing conditions and culture techniques vary across hatcheries and can affect post-stocking survival and return-to-creel. Differences in rearing conditions such as raceway density (Elrod et al. 1989) or feed type (Barnes et al. 2009) can affect the quality and return-to-creel of hatchery fish. The effect of rearing density on postrelease survival of hatchery salmonids has been widely studied

3
for Chinook Salmon O. tshawytscha (Martin and Wertheimer 1989), Coho Salmon O. kisutch (Fagerlund et al. 1981; Schreck et al. 1985; Banks 1992) and Steelhead Trout (Tipping et al. 2004). Results are often inconsistent and difficult to interpret and may differ between species, brood years, and hatcheries (reviewed in Ewing and Ewing 1995). While rearing density effects on postrelease survival have been studied for anadromous Pacific salmonids, few studies are available for inland trout species. Previous studies have mainly focused on in-hatchery performance of Cutthroat Trout O. clarkii (Kindschi and Koby 1994, Wagner et al. 1997), Lake Trout Salvelinus namaycush (Soderberg and Krise 1986), and Rainbow Trout (Kindschi et al. 1991; Wagner et al. 1996; Procarione et al. 1999). These studies generally concluded that rearing fish at high densities often results in lower survival, decreased growth, decreased food conversion rates, and reduced health.
Managing basic resources such as rearing space, water flows, and rearing densities are
important for hatchery operations (Banks and LaMotte 2002). Optimizing rearing density is one technique that may help enhance recruitment of hatchery-reared fish from stocked fisheries (Elrod et al. 1989). Lower rearing densities may increase the yield of stocked fish, or provide an economic benefit to hatcheries if losses from disease outbreaks are reduced. Rearing fish at lower densities means that fewer total fish will be produced, and return rates from low-density groups must be high enough to compensate for the reduced numbers of trout stocked (Martin and Wertheimer 1989).
In addition to optimizing rearing densities, other rearing factors such as size-at-release
may influence return-to-creel rates. The current target length for a catchable trout released from an IDFG hatchery is 10 inches (254 mm). Previous studies have shown a strong correlation between increased size-at-release and increased return-to-creel for hatchery trout (Mullan 1956; Wiley et al. 1993; Yule et al. 2000). While larger trout may return to the creel at a higher rate, it is also important to note that rearing fish to a larger size comes with significant increases in rearing costs, and it is important to find a balance between size-at-release, rearing costs, and return-to-creel. Additional rearing tools such as size grading can be used as a means to select for larger fish from a given rearing container at the time of release. By selecting the larger fish for release, smaller fish can be retained and given additional rearing time to increase their size. Size grading has been shown to have varying benefits in hatchery rearing. Grading was shown to be an effective tool to decrease variance and increase overall size of hatchery Yellow Perch Perca flavescens (Wallat et al. 2005) and increase growth in hatchery Atlantic Salmon Salmo salar (Gunnes 1976). However, grading was shown to have no growth benefit in Arctic Charr Salvelinus alpinus (Wallace and Kolbeinshavn 1988) and was concluded to not be recommended as a standard rearing procedure to increase weight gain in rearing Brook Trout Salvelinus fontinalis, Brown Trout Salmo trutta, and Rainbow Trout (Pyle 1966).
As operating costs continue to increase, rearing fish more efficiently will become more
important. Encouraging innovation and experimentation in hatcheries will help these facilities respond to new goals and culture techniques (Blankenship and Daniels 2004). Evaluating how rearing techniques affect return-to-creel could aid in developing strategies to raise fish more effectively. Additionally, continued monitoring of return-to-creel rates associated with variables such as strain and ploidy of hatchery-reared Rainbow Trout, season-of-release, and size-at-release are convenient evaluations that are by-products of large scale exploitation and paired hatchery rearing evaluations.

4
Study Questions
This project consists of two major components: (1) a statewide evaluation of catch and harvest rates of the most-stocked waters, and (2) research experiments focusing on hatchery rearing techniques to increase total catch of catchable trout. The following outlines the primary and secondary goals related to these two components: Primary Goal (Catch and Harvest Rates): Allocate hatchery resources to maximize benefit to anglers from hatchery Rainbow Trout stocked in Idaho waters.
Objectives: • Determine the average catch and harvest rates of catchable Rainbow Trout in at
least the top 50% of waters stocked (as determined by the total trout stocked) for release years 2011 – 2014. o Describe contribution from community ponds (2011 – 2013).
Secondary Goal (Hatchery Rearing Techniques): Increase hatchery production efficiency by modifying rearing practices to maximize catch and harvest rates.
Objectives: • Evaluate total catch rates of Rainbow Trout reared at three different raceway
densities. • Evaluate total catch rates of Rainbow Trout that are graded prior to release vs.
non-graded controls. • Evaluate total catch benefit from releasing magnum-sized catchables (average
325 mm, and 305 mm) vs. standard-sized catchables (average 250 mm).
METHODS
Study Sites
Study sites were selected based on data in the yearly IDFG Default Catchables Request List. Waters were ranked according to total number of catchable Rainbow Trout stocked annually and chosen to evaluate locations that comprise at least 50% of the total catchables stocked annually. Many study sites played a dual purpose in evaluating exploitation rates, as well as being used for one or more of the experiments on rearing density treatments, size grading, and comparisons of length and length-rank at release. Additional waters were added, as resources allowed, to evaluate to the level of 60% of waters stocked and to add additional waters to increase sample sizes for rearing density and size grading comparisons. Exploitation was evaluated as both “total caught” (any fish kept or released) and “harvested” (only fish that were kept).
Rearing Density
Catchable Rainbow Trout were raised in 2011 and 2012 from eggs purchased from Troutlodge Inc., using an all-female triploid stock commonly purchased for IDFG hatchery facilities. Density trials were conducted at the three IDFG facilities (Hagerman, Nampa, and American Falls fish hatcheries) that produce the majority of catchables stocked in Idaho. Rearing parameters specific to each facility are outlined below.

5
American Falls Fish Hatchery
At American Falls Fish Hatchery, study fish were reared on 13°C spring water in single-pass fashion. Fry were started in concrete vats (5.3 m × 1.2 m × 0.8 m) and were fed using a combination of hand-feeding and belt-feeders. After reaching approximately 440 fish/kg, fish were inventoried using pound counts and moved to outdoor concrete raceways (30 m × 2.4 m × 0.6 m sections). Fish were reared in these raceways and hand-fed for the remainder of the rearing period.
Hagerman Fish Hatchery
At Hagerman Fish Hatchery, study fish were reared on 15°C spring water. Fry were started in indoor concrete vats (4.3 m × 0.8 m × 0.6 m). After reaching approximately 50 mm, fish were inventoried using pound counts and moved to small outdoor concrete raceways (30 m × 1.1 m × 0.5 m). After reaching 75 mm, fish were again inventoried and moved to large concrete raceways (30 m × 2.4 m × 0.6 m sections). Upon reaching 200 mm, fish were inventoried for a final time and moved to larger concrete raceways (30 m × 3.7 m × 0.6 m sections), where they were raised for the remainder of the rearing period. Fish were fed by hand until reaching 100 mm in the large raceways, at which time they were fed mechanically with a tractor-pulled feed cart.
Nampa Fish Hatchery
At Nampa Fish Hatchery, study fish were raised on single-pass water from a spring source at 15°C. Density treatment groups were hatched into small concrete outdoor raceways (7.6 m × 1.5 m × 0.6 m sections) and fed using a combination of hand-feeding and belt feeders on a 12-hour timer. After reaching approximately 150 fish/kg, fish were inventoried using pound counts and moved to large outdoor concrete raceways (30 m × 3.7 m × 0.6 m sections) and hand-fed for the remainder of the rearing period.
Both density index (DI; lb/ft3/in) and flow index (FI; lb/gpm/ft3) were monitored for each
raceway throughout the rearing process following the calculations of Piper et al. (1982). The values of these two metrics are reported in Standard English units for ease of interpretation. Although in this study only DI was manipulated, FI was also monitored because both metrics can affect post-release performance (Elrod et al. 1989), and adjustments in DI inherently adjusts FI as well, although not at a direct 1:1 ratio.
The facilities included in this study typically target a maximum DI of 0.30 lb/ft3/in for
catchable trout, based on past fish culture experience. Three rearing density treatments were targeted: 0.15 (low), 0.25 (medium), and 0.30 (high) lb/ft3/in. To account for possible hatchery effects, all three treatment groups were administered at each of the three facilities in 2011 and 2012, with the exception of Hagerman Fish Hatchery in 2011 which only had two treatment groups (low and high). This study was purposefully implemented within the constraints of normal IDFG hatchery operations. As such, the goal was not to maintain a constant raceway density throughout the study, because that would have required almost constant evaluation of fish size and associated adjustments to density in the raceways. Instead, the goal was to periodically approach but not exceed the specified maximum density index for each treatment during the rearing period. Raceway densities and fish sizes were monitored closely to minimize size differences between treatment groups and hatcheries.

6
Tagging methods are outlined in the tagging section below. Two hundred fish from each treatment group were tagged for each stocking event. All three hatcheries stocked study groups into the same seven waters in 2011 and the same six waters in 2012. Stocking events occurred in the spring and early summer, which corresponds with when IDFG stocks the majority of hatchery catchable trout annually. Surface area (km2) of all stocked waters was calculated using ArcGIS software; surface areas ranged from 0.11 to 30.47 km2.
Size Grading
A prerelease size grading evaluation was started at American Falls, Hagerman, and Nampa fish hatcheries in 2013. The study was designed as a paired study at each facility and all tagged, graded fish that were stocked had a group of traditionally-reared, non-graded, tagged catchable trout (Troutlodge, all-female) stocked into the same water body at the same time. Graded treatment raceways and non-graded control raceways were reared on similar water sources at similar flow and densities. At each facility, a group of fish was graded in the spring (April–June) and a group was graded in the summer/fall (July/August–September/October). Each grade group had an initial grading event where fish that were 10 inches or greater were targeted to be graded off and stocked out. Remaining fish were reared for a four-week period followed by a second grading event, and graded fish were again stocked. Remaining fish were reared an additional four weeks and subsequently stocked. At each grading event and at final stocking, up to four release locations (per hatchery) received graded and non-graded tagged fish that represented up to 10% of the total release at each release location during that time interval. Each hatchery’s rearing and grading strategy is outlined below.
American Falls Fish Hatchery
At American Falls, there was one treatment (graded) and one control (non-graded) raceway in the spring and one treatment and one control raceway in the fall. The spring treatment group received their first grade/stocking in early April, their second grade/stocking in early May, and the remaining fish were stocked in early June. The fall group received their first grade/stocking in September, their second grade/stocking in October, and the remaining fish were stocked in November. Fish were graded using passive grading crowder racks crowded from the upper and lower end of the treatment raceways.
Hagerman Fish Hatchery
At Hagerman, there were two treatment and two control raceways in the spring (one 2N and one 3N) and one treatment and one control raceway in the summer/fall. One spring treatment group received their first grade/stocking in early April, their second grade/stocking in early May, and the remaining fish were stocked in early June. The other spring treatment group received their first grade/stocking in late April, their second grade/stocking in late May, and the remaining fish were stocked in late June. The summer/fall group received their first grade/stocking in July, their second grade/stocking in September, and the remaining fish were stocked in October. Initially, both passive grading crowder racks and active pumping of fish across a grading rack fixed to a sorting tower were used, but the staff determined using passive racks crowded from the top and bottom of the raceway was the most efficient grading method.
Nampa Fish Hatchery
At Nampa, there were two treatment and two control raceways in the spring and one treatment and one control raceway in the summer/fall. Both spring treatment groups received

7
their first grade/stocking in mid-April, their second grade/stocking in mid-May, and the remaining fish were stocked in mid-June. The summer/fall group received their first grade/stocking in July, their second grade/stocking in August, and the remaining fish were stocked in September. Initial groups (spring) were graded by pumping fish across a grading rack fixed to a tower. For fall grading, both passive crowd-racks and active pump grading were used.
Magnums
In addition to evaluating size grading, in 2013 we evaluated the relationship between size-at-release and subsequent catch. To accomplish this, 13 inch (330 mm) average sized catchable trout were reared at American Falls Fish Hatchery and released into 10 southeast Idaho reservoirs. These tagged “magnum” catchables were released with groups of tagged standard 10-inch fish in the summer of 2013. Each release group (treatment magnum and control standard catchables) contained 200 tagged fish.
Tagging
Trout were crowded within raceways, then collected with dip nets to be tagged. Crowding fish helped ensure a random sample of fish from the entire raceway and possibly reduce size-selected bias. Trout were individually measured for total length (mm) and tagged using 70 mm (51 mm of tubing) fluorescent orange/red T-bar anchor tags treated with an algaecide and manufactured by Floy® (2011 and 2013) and Hallprint® (2012). Lengths of all tagged fish were collected to evaluate effects of size-at-release on tag returns. Trout were returned to submerged enclosures or unoccupied raceway sections and allowed to recover overnight. Tagged catchables were then loaded by dip net onto stocking trucks and transported to stocking locations. Mortalities and shed tags were collected and recorded prior to loading fish for transport. After stocking, truck tanks were checked for shed tags.
Site-specific exploitation rates were determined using the normal requested stock of fish
whenever possible, originating from the typical facility. In these locations, fish were marked from the normal production lot raceways. Tagged fish were loaded with the normal production fish, allowed to mix, and were stocked using standard release methods. For additional comparisons, Nampa, Hagerman, and American Falls fish hatcheries stocked density trial fish in locations they normally do not stock. In these cases, tagged fish were transported alone, without additional production fish. For the grading evaluation, stocking groups were split 50:50 between treatment and control raceways with representative groups of tagged fish coming from each. For the magnum component, magnum and standard catchables groups from American Falls Fish Hatchery were tagged and released independently at study waters, in conjunction with other hatchery’s releases into the same waters.
Anchor tags were labeled with “IDFG” and tag reporting phone number (IDFG 1-866-
258-0338) on one side, with the unique tag number on the reverse side. Anglers could report tags using the IDFG “Tag-You’re-It” phone system and website, at regional IDFG offices, or by mail.
Meyer et al. (2012) estimated average non-reward tag reporting rates for hatchery
Rainbow Trout in Idaho at about 49.4% with year/site-specific ranges from 33.5 to 75.2%. The wide range observed suggests reporting rates at individual water bodies may continue to vary widely. Using reward tags to correct for tag return rates over time may reduce this inaccuracy and ensure exploitation rates are accurately calculated. Reward tags were used to monitor potential declines in tag reporting rates that can occur over time if anglers lose interest or

8
become “swamped” by too many tags (Henny and Burnham 1976). Additionally, few tags have been used to evaluate return-to-creel from community ponds, so whether the average reporting rate differed from other water types was unknown. A subset of waters was chosen to receive reward tags in addition to standard non-reward tags. In locations that received reward tags, rewards were distributed at a constant rate of 10% of the total tags stocked. Reward tags were identical to non-reward tags in size, shape and color in 2011, but contained additional text (“Reward”) and the amount (“$50”). In 2012, 2013, and 2014 the original 2011 batch of reward tags was used but did not necessarily match the non-reward tags in color. Tags of $50 were used because they have shown sufficiently high reporting rates (88.4%) for catchable rainbow without the added cost of $100 or $200 tags (Meyer et al. 2012).
Data Analysis
Angler tag return rate (λ) was estimated using the relative reporting rate of non-reward tags relative to that of high-reward tags (Pollock et al. 2001). The associated variance was calculated according to Henny and Burnham (1976) and used to generate 90% confidence intervals (CIs). Statewide average reporting rate for Rainbow Trout found in Meyer et al. (2012) was calculated using $50, $100 and $200 reward tags,
NtNrRtRr
//
=λ
where Rt and Rr are the number of standard tags released and reported, respectively. Nt and Nr are the number of high-reward tags released and reported, respectively. Tag reporting rates changing over time from previous studies was a concern, and the average tag reporting rate might be different for heavily fished community ponds. Tag reporting rates were calculated separately for community ponds and all other waters. Reporting rates (based on $50 tags) were then corrected to account for the fact that only about 88.4% of $50 tags are actually reported, using data from Meyer et al. (2012). Angler tag return rate was only based on tag returns from waters where both non-reward and reward tags were stocked (always a 10:1 ratio). Tag reporting rates were calculated separately for each year.
Harvest was calculated both within the first year (365 days) and second year (366 to 730
days) after stocking, following the methods of Meyer et al. (2010). The annual unadjusted harvest rate (u) was calculated as the number of non-reward tagged fish reported as harvested within one year of tagging, divided by the number of non-reward tags released. Unadjusted harvest and total catch were adjusted (uʹ) by incorporating the average angler tag reporting rate (λ), first year tag loss (Tagl), and tagging mortality (Tagm) for Rainbow Trout tagged as part of this study. Extensive Floy®-tagging from 2006 to 2009 presented in Meyer et al. (2010) found values for all three variables of λ = 49.4, Tagl = 8.2%, and Tagm = 0.8%. Estimates were calculated for each individual stocking event using the formula:
𝑢𝑢′ =
𝑢𝑢𝜆𝜆(1 − 𝑇𝑇𝑇𝑇𝑇𝑇𝑙𝑙)(1 − 𝑇𝑇𝑇𝑇𝑇𝑇𝑚𝑚)
Variance for the denominator in the above equation was estimated using the
approximate formula for the variance of a product in Yates (1953). Variance for u’ was calculated using the approximate formula for the variance of a ratio (Yates 1953) and was used to derive 90% CIs. A more complete description of these methods and the associated formulas is described in Meyer et al. (2010).

9
Because some anglers release fish voluntarily, harvest estimates may not necessarily
characterize the utilization of fish by anglers (Quinn 1996). To account for catch-and-release in addition to harvest, we also calculated “total catch.” For this, we changed uʹ to include the total number of fish caught for each release group, including those harvested and released. Calculations were otherwise performed as described above.
Comparisons of tag returns across various treatments were done using general linear
models. Each release event was considered a single unit of observation for these analyses. The dependent variable in the model was the adjusted total angler catch for each particular release event. Independent variables varied based on the specific study. Plausible first-order interaction terms were also included as potential independent variables. All possible subset models were evaluated, and Akaike’s information criteria (AIC) was used to rank the best model. Analyses were conducted using the SAS statistical software package (SAS 2009) with an α value of 0.05.
RESULTS
Statewide Exploitation
Release Years 2011 and 2012
Data associated with returns from fish released in 2011 and 2012 were reported in the 2014 Resident Hatchery Research Report (Cassinelli and Koenig 2013). Catch and harvest of hatchery catchable Rainbow Trout released in 2011 and 2012, and caught in the first and second year-at-large can be found in Appendix A. Fish tagged and released in 2014 have not yet been at-large in waters for the required 365 day period to be fully evaluated and are therefore not discussed herein.
Release Year 2013
In 2013, 30,366 nonreward tagged hatchery catchables were released across 46 waters statewide and included 165 individual tag groups (Table 1). By January 1, 2015, anglers returned 3,315 of these tags (within 365 days of each individual stocking). Harvest and total catch varied widely (0-100%) across all waters (Table 1). On average, statewide harvest and total catch (± 90% C.I.) for hatchery catchables across the waters we evaluated was 23.4% (± 2.9%) and 30.0% (± 3.7%), respectively, for all tags released in 2013 and reported within 365 days of release. During 2013, tagged catchables were released into 13 community ponds over 43 tagging events. On average, harvest and total catch for these community ponds was 36.0% (± 5.2%) and 54.0% (± 7.3%), respectively. However, estimated harvest for individual tag groups varied widely across ponds, ranging from 0% to 100% (Table 1). The increased returns from community ponds compared to larger lakes and reservoirs have been observed across all years of the study (Figure 1).
Catchable trout in community ponds and rivers were caught relatively quickly after
stocking, but not as quickly as in past years. The mean and median days-at-large for community ponds were 42 and 20 days, respectively. The mean and median days-at-large for rivers were 31 and 15 days, respectively. Catchables in lakes and reservoirs had more of a delayed catch with mean and median days-at-large of 95 and 56 days, respectively (Figure 2).

10
The statewide average total length (± 95% C.I.) of catchable Rainbow Trout tagged during 2013 was 260 ± 0.3 mm (10.2 in) when measured across all waters and hatcheries. However, total length varied among hatcheries and was likely influenced by tagging date (later tagged fish being larger), and the rearing hatchery of origin.
Rearing Density
Overall, catchable Rainbow Trout averaged 252 mm in length at the time of stocking across both years of the study. Mean length of hatchery- and treatment-specific release groups ranged from 235 to 270 mm and differed slightly between hatcheries and density treatments in both years (Table 2). For the 2011 release events from all three hatcheries, low-density fish were slightly larger than both medium- and high-density fish, but this difference was most pronounced at Nampa Fish Hatchery. For the 2012 release events from Hagerman and American Falls fish hatcheries, low-density fish were slightly larger than both medium- and high-density fish, while at Nampa Fish Hatchery medium density fish were the largest (Table 2).
Adjusted return-to-creel ranged from 0 to 80% across all stocking events. The best
general linear model for explaining the variation in angler catch (based on AIC scores) included DI, FI, fish length, hatchery, and surface area of the water being stocked (R2 = 0.31, F = 7.75, df = 6, P <0.0001). Despite the inclusion of all of these variables in the best model, results showed that angler catch was not significantly influenced by either DI, FI, or rearing hatchery. However, there was a trend towards increased angler catch with decreased DI (Figure 3). Angler catch rates were significantly influenced by the mean length of fish at stocking (F = 17.89; df = 1; P <0.0001) and by the size of the water stocked (F = 30.27; df = 1; P <0.0001). The percent of fish that were caught increased as mean fish length at stocking increased (Figure 4) and as the size of water decreased (Figure 5).
Size and Rank at Release
Continuing the analysis started with the fish released in 2011, we analyzed fish length and length-rank for fish released in 2013. Length of fish at tagging ranged from 118 to 418 mm, with 90% of fish between 214 and 320 mm. Length at tagging varied across release groups. Length and rank were binned into 10% groups. From 200 to 330 mm there was roughly a 5-7% increase in catch rates for each 25 mm increase in length at tagging (Figure 6). Similar to 2011, but unlike 2012, individual’s percent length rank within a release group was not correlated with catch rates.
Results of the size-graded releases were mixed. The grading process included a
learning curve on best methods and hatchery staff got better at grading the more they did it. Early attempts included actively grading pumped fish across a grate in the pumping tower as well as passive crowd rack grading, but the passive method was settled on as the most effective through trial and error. Our method of grade/release, rear, grade/release, rear, release resulted in larger fish being released from grade groups early in the process but by the end, the controls had typically caught or passed the treatment group in average size, resulting in similar net returns for the two groups. The mean catch rate for all releases that were graded was 27.7% (± 3.6%) while the mean return rates for all control releases was 25.5% (± 3.4%). Although not statistically significant, graded fish tended to have slightly higher average returns.
During their first year at large, magnum catchables were caught at a 120% higher rate
than the standard 10-inch fish, on average across the 10 waters stocked (73.0% [± 10.0%] and 33.3% [± 5.2%], respectively; Figure 7).

11
Tag Reporting Rate
We released $50 reward tags across 11 waters, with three of these waters considered community ponds. The statewide overall average tag reporting rate for catchable hatchery Rainbow Trout in 2013 was 39.9%.
DISCUSSION
Statewide Exploitation
Our estimates of overall statewide harvest (23.4%) and total catch (30.0%) of hatchery catchable trout released in 2013 remain similar to the statewide estimates for fish released in 2011 and 2012.
2013 marked the final year of our three-year evaluation of community pond angler use.
As in previous years, estimated total catch for community ponds varied widely across ponds in 2013. These results suggest a highly variable rate of community pond use, but similar to 2011 and 2012, overall community pond catch rate (54.0%) was nearly double the catch rate for lakes, reservoirs, and rivers combined (28.5%). These results suggest that overall, community ponds provide a significant fishing opportunity for Idaho anglers, exhibiting the most efficient means of getting catchables from the raceways to angler creels.
The mean number of days-at-large for catchables released into community ponds (42
days) and rivers (31 days) was lower than for lakes/reservoirs (95 days) in 2013, just as it has been in 2011 and 2012. Most community ponds are small water bodies that receive a high amount of fishing effort. The high amount of effort coupled with high total catch rates results in the majority of fish being caught in a shorter amount of time. In rivers, survival post stocking likely plays a large role in catch rates. High and Meyer (2009) found that 85% of radio tagged and 75% of T-bar anchor tagged catchable Rainbow Trout were no longer available to anglers four weeks post-stocking in an Idaho river. These results indicate that although total catch rates in rivers are relatively low (when compared to community ponds), the days-at-large also remain low because fish that are not caught in a short period of time have a low survival rate. Conversely, survival in the lakes and reservoirs we studied appears to be higher, as the mean days-at-large was nearly three months.
Rearing Density
The effects of raceway rearing density on pre-release performance of hatchery trout are well documented and show that reduced rearing density typically include improved survival, growth, condition factor, and food conversion efficiency (Soderberg and Krise 1986; Kindschi et al. 1991; Kindschi and Koby 1994; Procarione et al. 1999; Wagner et al. 1997). With so many studies showing positive effects of reduced densities on in-hatchery performance, it seems reasonable to expect these positive effects to carry over to post-release performance. However, rearing density did not result in a significant increase in return-to-creel of catchable Rainbow Trout stocked into Idaho lakes and reservoirs in this study. While a trend towards increased return-to-creel with decreased rearing densities was observed, the model indicated that DI itself was not a significant predictor of angler catch.
Ultimately, angler catch was most strongly influenced by the length of fish at stocking,
with larger fish generating higher return-to-creel. Previous studies have shown strong positive

12
correlations between size-at-release and return-to-creel for hatchery trout (see next section of this report). The size of the water stocked was also important in determining angler catch rates, with angler catch inversely related to water size. Similarly, Ashe et al. (2014) found that in Maine waters, water body size was the most influential factor they measured in determining angler catch of hatchery Brook Trout, with smaller waters providing higher return rates. Perhaps this relationship is simply a function of stocking density (Miko et al. 1995), since encounter rates of catchables are likely to be lower for anglers in large waters unless angling effort increases commensurate with increasing water size, and this is often not the case. Alternatively, catchable survival may decline in larger waters if their physiological needs and habitat requirements are not adequately met.
As expected, rearing densities for our treatment groups fluctuated greatly during the
rearing period, as well as between hatcheries. All three hatcheries did a good job of achieving the specified separation goal of the density treatments (50%, 75%, and 100% of the maximum treatment value), but overall density treatments were lower than the designated treatment levels. While the insignificance of both DI and rearing hatchery on angler return-to-creel indicates that these fluctuations were not a significant factor in determining whether or not a fish was caught, it is interesting to note that the hatchery with the highest DI values (Nampa) had the lowest average return-to-creel and smallest fish. I tested for an interaction between fish length at release and DI and found that to be non-significant. While it would seem intuitive that fish reared at higher densities might have lower growth rates, for this study, that effect was mitigated by controlling feed rates in an attempt to standardize fish length at stocking across density treatments. Kavanagh and Olson (2014) found that Steelhead Trout reared at lower densities had increased growth and were larger both at the time of release and as returning adults. Had we not controlled feeding rates to minimize differences in size at stocking, we would likely have found a more direct effect of density on growth and size-at-release, which in turn would have likely affected angler catch rates between treatments.
In summary, our study has shown that lowering hatchery rearing density to levels well
below those recommended by Piper et al. (1982) does not significantly benefit return-to-creel of catchable Rainbow Trout. Instead, return-to-creel was positively influenced by releasing larger fish and releasing fish in smaller reservoirs. Fisheries managers should consider these relationships when using return-to-creel rates to prioritize allotments of stocked trout.
Size and Rank at Release
Since this statewide evaluation started in 2011, hatcheries have continued to do a good job of meeting the goal of producing catchable Rainbow Trout at the requested 10-inch average length. While the average length of catchable trout has been achieved, length has been variable within and between hatcheries. Length-at-stocking is influenced by tagging date, rearing hatchery, and the rearing period, all of which can affect size throughout the stocking season. Variation in hatchery catchable Rainbow Trout length using current rearing techniques should be expected. Within any production lot, there is a genetic basis for slow growth in some fish (Westers 2001). Additionally, culture techniques to reduce size variation (such as hand-feeding, demand feeders, or grading) are not commonly employed in large IDFG facilities.
As it has been throughout this evaluation, length of fish at tagging (and subsequent
stocking) was highly correlated with angler catch rates again in 2013. Similar to previous years, we showed that between eight and 12 inches, there is about a 10% increase in catch rate per each inch increase in length at stocking. Similarly, Yule et al. (2000) showed a direct correlation between larger size-at-stocking and increased return-to-creel for hatchery catchable Rainbow
13
Trout stocked into two reservoirs. This relationship was the driver for both the grading and magnum versus standard catchable evaluations. Grading of fish prior to release was tested as a means to release larger, more consistently sized catchable Rainbow Trout. This was effective in reducing the variation in mean length at release and releasing larger fish early in the process, but after two grading events the remaining fish were generally smaller than control fish. As a result, overall angler catch rates from graded treatment raceways were only slightly better than those from the control raceways. This grading work was repeated in 2014 and the effectiveness of pre-release grading will be further evaluated after those fish have been available in the fisheries for a year post-release.
The magnum catchables showed angler catch rates that were 120% higher than the 10-
inch standard sized fish. These increases in return-to-creel were even higher than expected based on our catch by release size model. While numerous studies have shown increased angler returns with increased fish size, few have examined why larger fish return at higher rates. However, these larger magnums are likely caught at a much higher rate due to increased survival post-stocking and increased catchability. Moving into 2014, we repeated the 13-inch magnum side-by-side comparison at American Falls Fish Hatchery and started producing 12-inch magnums at a production level at Nampa Fish Hatchery. Both groups will be evaluated against the 10-inch standards moving forward, with the hope of moving more of our production for larger lakes and reservoirs towards the 12-inch average.
The role that rank plays in return-to-creel is still not fully understood. Our results are
somewhat contradictory in that the influence of raceway rank appeared negligible in 2011, more important in 2012, and again negligible in 2013. In 2013, with the magnum catchables included, we increased the size range of tagged releases. This provided a better opportunity to further evaluate the size/rank relationship across a broader size range and it appears that size is the most important of the two factors, as the 13-inch magnum fish returned at rates similar or higher than predicted from earlier models based on 10-inch average sized releases. Had rank been more important in determining returns, one would have expected a drop off in return to creel of 13-inch fish when they were released as the average size, instead of as the top 10%. However, return rates remained very similar in both scenarios.
Tag Reporting Rate
Prior to 2012, the overall tag reporting rate did not appear to change much from that reported previously by Meyer et al. (2012), who found that non-reward average reporting rate for hatchery trout was 49.4%. However, 2012 tags were reported at a rate of 33.1% in their first year at large. This represented a 30% decrease in reporting rate from that of 2011 tags. However, in 2013 the tag reporting rate increased back to 39.0% indicating that year-specific tag reporting rates will likely continue to fluctuate based on waters receiving reward tags. It should be noted that tag reporting rates will likely fluctuate each year by chance alone, and whether there is a long-term trend in increasing or decreasing reporting rates will likely take years to definitively recognize. Considering the minimal number of reward tags needed each year to calculate tag reporting rate annually, $50 reward tags should be released each year that the Tag You’re It program is used for broad-scale evaluations of catchable trout return-to-creel. Fluctuations in year to year reporting rate do influence estimates of catch and harvest. If yearly fluctuations are more influenced by the year-specific waters used to calculate reporting rates and less influenced by actual variation in the overall rates that anglers report tags, that could be problematic. Monitoring reporting rates over multiple years at multiple waters will aid in answering that question.

14
RECOMMENDATIONS
1. Continue collecting and compiling tag returns. a. November 2014 completed three years at large for the 2011 tag groups, two year
at large for 2012 tags, and one year at large for 2013 tags.
2. Further evaluate statewide exploitation through continued tagging in release year 2014 across the top 50% to 60% (quantitatively) of waters stocked. This part of the evaluation will be completed after 2014.
3. Further evaluate hatchery rearing techniques to assess if decreased size variation and a
larger size-at-stocking are feasible rearing objectives resulting in a significant increase in return-to-creel. a. Grading a subset of hatchery catchables prior to release in 2013 is currently
being evaluated and this evaluation was repeated during the 2014 release. b. Magnum releases were expanded in 2014 and will be further evaluated alongside
standard catchables.
4. Continue releasing $50 reward tags at low rates each year to assess whether reporting rates by anglers fluctuate through time or trend downward.

15
ACKNOWLEDGEMENTS
I would like to acknowledge the hard work and dedication of Joe Thiessen, Shane Knipper, Patrick Kennedy, Kevin Meyer, Rick Raymondi, Tony Lamansky, Kristi Stevenson, Dennis Daw, Kevin Nelson, Luke Teraberry, Ryan Schiferl, and Steve Elle for assisting with tagging fish. I would also like to thank Regional Managers for recommendations and help designing and implementing the study as well as Regional Staff for their assistance tagging. Additionally, I would like to thank Kevin Yelton and the staff at American Falls Hatchery, Joe Chapman and the staff at Hagerman State Hatchery, and Rick Alsager and the staff at Nampa Hatchery for all their assistance tagging, rearing, and releasing fish. I would also like to thank Tony Lamansky for the development and continued technical support of the Microsoft™ Access® database that stores all tagging events and returns. A big thank you goes to Liz Mamer, Kristi Stevenson, and Debi Jensen for all their hard work managing the database and the constant tag return information. I also thank Ryan Hardy and Kristin Wright for editing this report. Funding for this work was provided by anglers and boaters through their purchase of Idaho fishing licenses, tags, and permits, and from federal excise taxes on fishing equipment and boat fuel through the Sport Fish Restoration Program.

16
LITERATURE CITED
Ashe, W., J. Seiders, and S. Davis. 2014. Fishery final report, series 14-1. Habitat variables influencing the return of hatchery-reared fall-yearling Brook Trout in Maine waters. Maine Department of Inland Fisheries and Wildlife.
Banks, J. L. 1992. Effects of density and loading on Coho Salmon during hatchery rearing and
after release. The Progressive Fish-Culturist 54:137-147. Banks, J. L., and E. M. LaMotte. 2002. Effects of four density levels on tule fall Chinook Salmon
during hatchery rearing and after release. North American Journal of Fisheries Management 64:24-33.
Barnes, M. E., G. Simpson, and D. J. Durben. 2009. Post-stocking harvest of catchable-sized
Rainbow Trout enhanced by dietary supplementation with a fully fermented commercial yeast culture during hatchery rearing. North American Journal of Fisheries Management 29:1287-1295.
Blankenship, H. L., and E. Daniels. 2004. A scientific and systematic redesign of Washington
state salmonid hatcheries. American Fisheries Society Symposium 44:561-572. Cassinelli, J., and M. Koenig. 2013. Idaho Department of Fish and Game. Annual Performance
Report Number 13-04. Boise. Elrod, J. H., D. E. Ostergaard, and C. P. Schneider. 1989. Effect of rearing density on post-
stocking survival of Lake Trout in Lake Ontario. The Progressive Fish Culturist 51:189-193.
Ewing, R. D., and S. K. Ewing. 1995. Review of the effects of rearing density on survival to
adulthood of Pacific salmon. The Progressive Fish Culturist 57:1-25. Fagerlund, U. H. M., J. R. McBride, and E. T. Stone. 1981. Stress-related effects of hatchery
rearing density on Coho Salmon. Transactions of the American Fisheries Society 110:644-649.
Frew, T. S. 2010. Resident fish hatcheries 2010 annual report. Idaho Department of Fish and
Game, Annual Report 11-119, Boise. Gunnes, K. 1976. Effect of size grading young Atlantic Salmon (Salmo salar) on subsequent
growth. Aquaculture 9:381-386. Henny, C. J., and K. P. Burnham. 1976. A reward band study of mallards to estimate band
reporting rates. The Journal of Wildlife Management 40:1-14. High B., and K. A. Meyer. 2009. Survival and dispersal of hatchery triploid Rainbow Trout in an
Idaho river. North American Journal of Fisheries Management 29:1797-1805. Kavanagh, M., and D. E. Olson. 2014. The effects of rearing density on growth, fin erosion,
survival, and migration behavior of hatchery winter Steelhead. North American Journal of Fisheries Management. 76:323-332.

17
Kindschi, G. A., and R. F. Koby, Jr. 1994. Performance and oxygen consumption of Snake River Cutthroat Trout reared at four densities with supplemental oxygen. The Progressive Fish Culturist 56:13-18.
Kindschi, G. A., C. E. Smith, and R. F. Koby, Jr. 1991. Performance of two strains of Rainbow
Trout reared at four densities with supplemental oxygen. The Progressive Fish Culturist 53:203-209.
Martin, R. M., and A. Wertheimer. 1989. Adult production of Chinook Salmon reared at different
densities and released as two smolt sizes. The Progressive Fish Culturist 51:194-200. Meyer, K. A., F. S. Elle, T. Lamansky, E. R. J. M. Mamer, and A. E. Butts. 2012. A reward-
recovery study to estimate tagged-fish reporting rates by Idaho anglers. North American Journal of Fisheries Management 32:696-703.
Meyer, K. A., F. S. Elle, T. Lamansky, and E. R. J. M. Mamer. 2010. Idaho Department of Fish
and Game, Annual Performance Report 10-12. Boise. Miko, D. A., H. L. Schramm, S. D. Arey, and J. A. Dennis. 1995. Determination of stocking
densities for satisfactory put-and-take Rainbow Trout fisheries. North American Journal of Fisheries Management 15: 823-829.
Mullan, J. W. 1956. The comparative returns of various sizes of trout stocked in Massachusetts
streams. The Progressive Fish-Culturist 18(1):35-38. Piper, R. G., I. B. McElwain, L. E. Orme, J. P. McCraren, L. G. Fowler, and J. R. Leonard. 1982.
Fish hatchery management. U.S. Fish and Wildlife Service, Washington, D.C. Pollock, K. H., J. M. Hoenig, W. S. Hearn, and B. Calingaert. 2001. Tag reporting rate
estimation: 1. An evaluation of the high-reward tagging method. North American Journal of Fisheries Management 21:521-532.
Procarione, L. S., T. P. Barry, and J. A. Malison. 1999. Effect of high rearing densities and
loading rates on the growth and stress responses of juvenile Rainbow Trout. North American Journal of Aquaculture 61:91-96.
Pyle, E. A. 1966. The effect of grading on the total weight gained by three species of trout. The
Progressive Fish-Culturist 28(1):29-32. Quinn, S. P. 1996. Trends in regulatory and voluntary catch-and-release fishing. Pages 152-162
in L. E. Miranda, and D. R. DeVries, editors. Multidimensional approaches to reservoir fisheries management. American Fisheries Society, Symposium 16, Bethesda, Maryland.
SAS Institute Inc. 2009. The SAS system for Windows. Release 9.2. SAS Institute Inc., Cary
NC. Schreck, C. B., R. Patino, C. K. Pring, J. R. Winton, and J. E. Holway. 1985. Effects of rearing
density on indices of smoltification and performance of Coho Salmon, Oncorhynchus kisutch. Aquaculture 45:345-358.
18
Soderberg, R. W., and W. F. Krise. 1986. Effects of rearing density on growth and survival of Lake Trout. The Progressive Fish-Culturist 48:30-32.
Tipping, J. M., J. B. Byrne, and T. D. Hillson. 2004. The effect of juvenile rearing density on
adult returns of summer Steelhead. North American Journal of Aquaculture 66:319-324. Wagner, E. J., S. S. Intelmann, and M. D. Routledge. 1996. The effects of fry rearing density on
hatchery performance, fin condition, and agonistic behavior of Rainbow Trout Oncorhynchus mykiss fry. Journal of the World Aquaculture Society 27:264-274.
Wagner, E. J., T. Jeppsen, R. Arndt, M. D. Routledge, and Q. Bradwisch. 1997. Effects of
rearing density upon cutthroat trout hematology, hatchery performance, fin erosion, and general health and condition. The Progressive Fish-Culturist 59:173-187.
Wallace, J. C., and A. G. Kolbeinshavn. 1988. The effect of size grading on subsequent growth
in fingerling Arctic Charr, Salvelinus alpinus (L.). Aquaculture 73(1-4):97-100. Wallat, G. K., L. G. Tiu, H. P. Wang, D. Rapp, and C. Leighfield. 2005. The effects of size
grading on production efficiency and growth performance of Yellow Perch in earthen ponds. North American Journal of Fisheries Management 67:34-41.
Westers, H. 2001. Production. Pages 31-89 in G. A. Wedemeyer, editor. Fish hatchery
management, second edition. American Fisheries Society, Bethesda, Maryland. Wiley, R. W., R. A. Whaley, J. B. Satake, and M. Fowden. 1993. Assessment of stocking
hatchery trout: a Wyoming perspective. North American Journal of Fisheries Management 13(1):160-170.
Yates, F. 1953. Sampling methods for censuses and surveys, Second Edition. Charles Griffin
and Co. Ltd., London. Yule, D. L., R. A. Whaley, P. H. Mavrakis, D. D. Miller, and S. A. Flickinger. 2000. Use of strain,
season of stocking, and size at stocking to improve fisheries for Rainbow Trout in reservoirs with walleyes. North American Journal of Fisheries Management 20:10-18.

19
Table 1. Total nonreward tags released by water body, hatchery, treatment and date in 2013. Harvest (Exploitation) and Total Catch (Total Use) are through the first year at large and shown as of January, 1 2015 with associated 90% confidence intervals (C.I.).
Region Water Body Hatchery Tagging Date Treatment Tags
Released Harvested Harvested b/c tagged Released Estimate 90% C.I. Estimate 90% C.I.
1 Fernan Lake Mullan 16-May-13 Production 200 34 1 3 53.1% 11.7% 59.4% 12.5%
6-Jun-13 299 17 3 2 17.8% 5.4% 23.0% 6.2%
23-Oct-13 299 19 5 8 19.9% 5.7% 32.4% 7.6%
22-Apr-13 25 1 0 0 12.5% 14.5% 12.5% 14.5%
20-May-13 25 0 0 0 0.0% 0.0%
Grading Ctrl 397 5 0 1 3.9% 2.1% 4.7% 2.3%Grading Tx 400 23 5 5 18.0% 4.8% 25.8% 5.9%Grading Ctrl 199 3 0 0 4.7% 3.2% 4.7% 3.2%Grading Tx 199 9 0 0 14.1% 5.7% 14.1% 5.7%Grading Ctrl 100 4 0 1 12.5% 7.4% 15.6% 8.2%Grading Tx 100 1 0 0 3.1% 3.7% 3.1% 3.7%Grading Ctrl 199 4 0 1 6.3% 3.7% 7.9% 4.2%
Grading Tx 199 8 1 0 12.6% 5.3% 14.1% 5.7%
Grading Ctrl 180 4 0 1 6.9% 4.1% 8.7% 4.6%
Grading Tx 179 6 0 2 10.5% 5.1% 14.0% 5.9%
Grading Ctrl 399 14 1 3 11.0% 3.6% 14.1% 4.2%
Grading Tx 397 15 1 0 11.8% 3.8% 12.6% 3.9%
Grading Ctrl 200 7 1 0 10.9% 5.0% 12.5% 5.3%
Grading Tx 200 6 0 0 9.4% 4.6% 9.4% 4.6%
Grading Ctrl 397 29 1 2 22.8% 5.5% 25.2% 5.9%
Grading Tx 396 43 3 3 33.9% 7.1% 38.7% 7.7%
Grading Ctrl 180 8 1 0 13.9% 5.9% 15.6% 6.3%
Grading Tx 180 5 1 1 8.7% 4.6% 12.2% 5.5%
Grading Ctrl 228 6 0 2 8.2% 4.0% 11.0% 4.7%
Grading Tx 230 5 1 1 6.9% 3.7% 9.6% 4.4%
Grading Ctrl 358 36 2 4 31.4% 7.0% 36.7% 7.7%
Grading Tx 355 35 1 2 30.8% 6.9% 33.5% 7.3%
Grading Ctrl 25 2 0 2 25.0% 20.2% 50.0% 27.6%
Grading Tx 25 3 0 2 37.5% 24.3% 62.5% 30.3%
Grading Ctrl 30 2 0 4 20.8% 16.9% 62.5% 27.9%
Grading Tx 30 7 0 1 72.9% 29.7% 83.4% 31.3%
Grading Ctrl 30 4 0 0 41.7% 23.3% 41.7% 23.3%
Grading Tx 30 4 0 1 41.7% 23.3% 52.1% 25.8%
Grading Ctrl 25 0 0 0 0.0% 0.0%
Grading Tx 25 1 0 0 12.5% 14.5% 12.5% 14.5%
Grading Ctrl 30 4 0 0 41.7% 23.3% 41.7% 23.3%
Grading Tx 30 1 1 0 10.4% 12.1% 20.8% 16.9%
Grading Ctrl 30 6 0 3 62.5% 27.9% 93.8% 32.8%
Grading Tx 30 1 1 2 10.4% 12.1% 41.7% 23.3%
Grading Ctrl 25 2 0 0 25.0% 20.2% 25.0% 20.2%
Grading Tx 25 2 0 1 25.0% 20.2% 37.5% 24.3%
Grading Ctrl 30 2 0 1 20.8% 16.9% 31.3% 20.5%
Grading Tx 30 4 0 1 41.7% 23.3% 52.1% 25.8%
Grading Ctrl 30 7 0 0 72.9% 29.7% 72.9% 29.7%
Grading Tx 30 5 0 2 52.1% 25.8% 72.9% 29.7%
Grading Ctrl 30 3 0 2 31.3% 20.5% 52.1% 25.8%
Grading Tx 30 1 0 3 10.4% 12.1% 41.7% 23.3%
Grading Ctrl 30 5 0 0 52.1% 25.8% 52.1% 25.8%
Grading Tx 30 4 1 4 41.7% 23.3% 93.8% 32.8%
Grading Ctrl 25 2 0 1 25.0% 20.2% 37.5% 24.3%
Grading Tx 25 2 0 1 25.0% 20.2% 37.5% 24.3%
Grading Ctrl 30 5 0 2 52.1% 25.8% 72.9% 29.7%Grading Tx 30 1 0 2 10.4% 12.1% 31.3% 20.5%Grading Ctrl 30 2 0 2 20.8% 16.9% 41.7% 23.3%Grading Tx 30 6 0 1 62.5% 27.9% 72.9% 29.7%
19-Jun-13
19-Jun-13
24-Apr-13
19-Jun-13
Boise River
12-Aug-13
12-Aug-13
12-Aug-13
Nampa
12-Aug-13
18-Oct-13
Soldier Meadows Res Hagerman
29-May-13
Hagerman
10-Jun-13
19-Jun-13
24-Apr-13
ProductionClearwater
29-May-13
10-Jun-13
3-Apr-13
Winchester Lake
Mann Lake Hagerman
Moose Creek Res Hagerman
Spring Valley Res Hagerman
29-May-13
10-Jun-13
30-Apr-13
10-Jun-13
Hordemann Pond
13-May-13
24-Apr-13
19-Jun-13
24-Apr-13
Arrowrock Res Hagerman
12-Aug-13
Adjusted Exploitation Adjusted Total UseDisposition
Deyo Res Clearwater Production
2
3B

20
Region Water Body Hatchery Tagging Date Treatment Tags
Released Harvested Harvested b/c tagged Released Estimate 90% C.I. Estimate 90% C.I.
Grading Ctrl 50 0 0 0 0.0% 0.0%
Grading Tx 50 0 0 0 0.0% 0.0%
Grading Ctrl 100 2 0 0 6.3% 5.2% 6.3% 5.2%
Grading Tx 100 0 0 0 0.0% 0.0%
13-Mar-13 25 3 0 0 37.5% 24.3% 37.5% 24.3%
10-Apr-13 25 3 0 0 37.5% 24.3% 37.5% 24.3%
Grading Ctrl 12 0 0 1 0.0% 26.0% 29.5%
Grading Tx 12 1 0 1 26.0% 29.5% 52.1% 40.0%
9-Oct-13 Production 25 2 0 0 25.0% 20.2% 25.0% 20.2%
Indian Creek Nampa 8-Oct-13 Production 50 6 0 0 37.5% 17.5% 37.5% 17.5%
Grading Ctrl 400 47 3 10 36.7% 7.4% 46.9% 8.7%
Grading Tx 400 46 4 11 35.9% 7.3% 47.7% 8.8%
Grading Ctrl 150 44 2 13 36.2% 7.5% 48.5% 9.0%
Grading Tx 150 56 4 5 46.1% 8.7% 53.5% 9.6%
Magnums Tx 200 46 5 2 71.9% 14.0% 82.8% 15.3%
Magnums Ctrl 200 23 0 5 35.9% 9.4% 43.8% 9.0%
Grading Ctrl 150 20 0 2 41.7% 11.4% 45.8% 12.0%Grading Tx 150 16 2 1 33.3% 10.1% 39.6% 11.1%Grading Ctrl 150 19 3 0 39.6% 11.1% 45.8% 12.0%Grading Tx 150 27 1 3 56.3% 13.1% 64.6% 14.5%Grading Ctrl 20 7 1 2 109.4% 41.4% 156.3% 45.2%Grading Tx 20 9 1 2 140.7% 44.3% 187.5% 46.2%
10-Apr-13 Production 45 0 0 1 0.0% 6.9% 8.1%
Grading Ctrl 20 0 4 0 0.0% 62.5% 33.7%
Grading Tx 20 3 0 1 46.9% 29.9% 62.5% 33.7%
Grading Ctrl 22 4 0 0 56.8% 31.0% 56.8% 31.0%
Grading Tx 22 2 0 0 28.4% 22.8% 28.4% 22.8%
8-Oct-13 Production 50 6 0 2 41.7% 19.3% 55.6% 22.0%
Grading Ctrl 35 8 0 2 71.4% 27.5% 89.3% 30.1%
Grading Tx 35 2 0 0 17.9% 14.6% 17.9% 14.6%
Grading Ctrl 25 7 0 0 87.5% 34.6% 87.5% 34.6%
Grading Tx 25 5 0 0 62.5% 30.3% 62.5% 30.3%
Grading Ctrl 135 18 0 2 41.7% 11.9% 46.3% 12.6%Grading Tx 135 20 0 3 46.3% 12.6% 53.3% 13.5%Grading Ctrl 135 18 0 2 41.7% 11.9% 46.3% 12.6%Grading Tx 135 14 0 2 32.4% 10.4% 37.0% 11.2%Grading Ctrl 25 5 0 0 62.5% 30.3% 62.5% 30.3%Grading Tx 25 4 0 1 50.0% 27.6% 62.5% 30.3%
20-Jun-13 25 9 1 0 112.5% 37.8% 125.0% 39.1%12-Jul-13 48 6 0 0 39.1% 18.2% 39.1% 18.2%31-Jul-13 50 12 0 0 75.0% 24.0% 75.0% 24.0%28-Sep-13 50 6 0 0 37.5% 17.5% 37.5% 17.5%
Grading Ctrl 40 8 0 6 62.5% 24.4% 109.4% 30.7%
Grading Tx 40 7 1 4 54.7% 23.0% 93.8% 28.9%
Grading Ctrl 400 11 0 0 8.6% 3.2% 8.6% 3.2%
Grading Tx 400 14 1 0 10.9% 3.6% 11.7% 3.8%
Hayspur 3N 400 9 0 0 7.0% 2.9% 7.0% 2.9%
6-May-13 51 4 1 5 24.5% 14.1% 61.3% 21.7%6-Jun-13 50 13 0 2 81.3% 24.8% 93.8% 26.4%
11-Sep-13 3 0 5 19.1% 12.8% 51.0% 20.4%6-May-13 100 10 0 1 31.3% 11.7% 34.4% 12.2%26-Aug-13 49 0 0 0 0.0% 0.0%
Grading Ctrl 180 26 1 5 45.1% 11.1% 55.6% 12.5%Grading Tx 180 34 2 3 59.0% 12.9% 67.7% 14.0%Grading Ctrl 180 39 3 2 67.7% 14.0% 76.4% 15.0%
Grading Tx 180 34 0 5 59.0% 12.9% 67.7% 14.0%Grading Ctrl 246 25 2 0 31.8% 8.1% 34.3% 8.4%Grading Tx 248 34 0 2 42.9% 9.6% 45.4% 9.9%Grading Ctrl 400 37 7 10 28.9% 6.4% 42.2% 8.1%Grading Tx 400 41 2 8 32.0% 6.8% 39.9% 7.8%Grading Ctrl 150 3 0 0 6.3% 4.3% 6.3% 4.3%Grading Tx 150 9 0 1 18.8% 7.5% 20.8% 7.9%
3M
Cascade Res Nampa 21-May-13
Council Park Pond Nampa Production
Fischer Pond Nampa Production
Horsethief Res Nampa
20-Jun-13
1-Oct-13
Lost Valley Res Nampa 19-Jun-13
Warm Lake Nampa
20-May-13
12-Jul-13
Sage Hen Res Nampa
21-May-13
15-Jul-13
Ten Mile Pond Nampa
23-Apr-13
Production
Wilson Springs Pond Nampa 22-Apr-13
1-Oct-13
Payette Greenbelt Pond Nampa
20-May-13
17-Jun-13
Riverside Pond Nampa
23-Apr-13
17-Jun-13
Disposition Adjusted Exploitation Adjusted Total Use
3B
Big Trinity Lake Hagerman 23-Jul-13
Crane Falls Res Hagerman 2-Apr-13
Duff Lane Pond Nampa
Production
20-May-13
Lucky Peak Res
Nampa
23-Apr-13
18-Jun-13
American Falls 14-Jun-13
Manns Creek Res Nampa
24-Apr-13
20-May-13

21
Region Water Body Hatchery Tagging Date Treatment Tags
Released Harvested Harvested b/c tagged Released Estimate 90% C.I. Estimate 90% C.I.
Grading Ctrl 69 0 0 0 0.0% 0.0%
Grading Tx 70 0 0 0 0.0% 0.0%Grading Ctrl 30 2 0 0 20.8% 16.9% 20.8% 16.9%Grading Tx 30 0 0 0 0.0% 0.0%
Heagle Park Pond Mackay 3-Jun-13 Production 50 3 0 2 18.8% 12.5% 31.3% 16.0%Grading Ctrl 90 11 0 2 38.2% 13.5% 45.1% 14.7%Grading Tx 90 21 0 0 72.9% 18.6% 72.9% 18.6%Grading Ctrl 263 11 1 0 13.1% 4.8% 14.3% 5.0%Grading Tx 262 6 0 1 7.2% 3.5% 8.4% 3.8%
Magnums Tx 200 53 2 4 82.8% 15.3% 92.2% 16.3%Magnums Ctrl 201 12 1 3 6.5% 6.5% 24.9% 7.6%Magnums Tx 200 38 1 1 59.4% 12.5% 62.5% 12.9%
Magnums Ctrl 200 9 0 1 14.1% 5.6% 15.6% 6.0%Grading Ctrl 399 2 0 4 1.6% 1.3% 4.7% 2.3%Grading Tx 400 9 0 4 7.0% 2.9% 10.2% 3.5%Grading Ctrl 199 6 0 2 9.4% 4.6% 12.6% 5.3%Grading Tx 200 6 0 0 9.4% 4.6% 9.4% 4.6%Grading Ctrl 399 8 0 2 6.3% 2.7% 7.8% 3.0%Grading Tx 400 18 1 2 14.1% 4.2% 16.5% 4.6%Grading Ctrl 90 0 0 0 0.0% 0.0%Grading Tx 90 3 0 2 10.4% 7.1% 17.4% 9.1%Grading Ctrl 100 0 0 0 0.0% 0.0%Grading Tx 100 3 1 0 9.4% 6.4% 12.5% 7.4%
Grading Ctrl 200 30 4 13 46.9% 10.9% 73.5% 14.2%Grading Tx 198 27 4 10 42.6% 10.3% 64.7% 13.2%
Grading Ctrl 400 2 0 0 1.6% 1.3% 1.6% 1.3%
Grading Tx 399 3 0 1 2.4% 1.6% 3.1% 1.9%
14-May-13 50 3 1 0 18.8% 12.5% 25.0% 14.4%14-Jun-13 50 0 0 1 0.0% 6.3% 7.3%17-Sep-13 50 1 0 2 6.3% 7.3% 18.8% 12.5%
Rangen 75 2 0 5 8.3% 6.9% 29.2% 12.8%Skretting 75 3 0 6 12.5% 8.4% 37.5% 14.5%
Grading Ctrl 400 7 1 13 5.5% 2.5% 16.4% 4.6%Grading Tx 399 10 0 13 7.8% 3.0% 18.0% 4.8%
Magnums Tx 151 29 5 4 50.1% 11.7% 65.6% 13.7%Magnums Ctrl 180 9 1 7 15.6% 6.3% 29.5% 8.8%Grading Ctrl 145 3 0 0 6.5% 4.4% 6.5% 4.4%Grading Tx 149 4 2 0 8.4% 5.0% 12.7% 6.1%Grading Ctrl 150 22 2 7 45.8% 12.0% 64.6% 14.5%Grading Tx 150 8 3 4 16.7% 7.0% 31.3% 9.8%Grading Ctrl 50 8 4 7 50.0% 20.0% 118.8% 29.1%Grading Tx 52 7 3 15 42.1% 18.1% 150.3% 31.3%Grading Ctrl 48 7 2 7 45.6% 19.5% 104.2% 28.0%Grading Tx 50 9 1 7 56.3% 21.1% 106.3% 27.8%
Magnums Tx 200 32 2 6 50.0% 11.3% 62.5% 12.9%Magnums Ctrl 299 14 0 10 14.6% 4.8% 25.1% 6.5%
Rangen 50 3 2 0 18.8% 12.5% 31.3% 16.0%Skretting 50 5 1 0 31.3% 16.0% 37.5% 17.5%
Grading Ctrl 100 11 2 0 34.4% 12.2% 40.6% 13.3%Grading Tx 100 10 1 1 31.3% 11.7% 37.5% 12.8%Grading Ctrl 25 2 0 0 25.0% 20.2% 25.0% 20.2%Grading Tx 25 1 0 0 12.5% 14.5% 12.5% 14.5%Grading Ctrl 150 3 1 2 6.3% 4.3% 12.5% 6.1%
Grading Tx 149 0 1 0 0.0% 2.1% 2.5%
Magnums Tx 200 38 3 8 59.4% 12.5% 76.6% 14.5%
Magnums Ctrl 200 12 1 0 18.8% 6.6% 20.3% 6.9%Magnums Tx 200 37 1 5 57.8% 12.3% 67.2% 13.4%
Magnums Ctrl 200 22 0 1 34.4% 9.1% 35.9% 9.4%
7-May-13
16-Oct-13
Snake River American Falls
Twin Lakes Res American Falls
5
American Falls Res American Falls
Bear River Grace
Production
Chesterfield Res Hagerman
Deep Creek Res American Falls
Devils Creek Res Hagerman
6-Sep-13
Edson Fichter Pond American Falls
5-Apr-13
Glendale Res American Falls 24-Jun-13
Montpelier Rearing Pond Grace 17-Oct-13
Pleaseantview Res American Falls
Salmon Falls Creek Res Hagerman
2-Apr-13
6-May-13
9-Sep-13
Stone Res American Falls
3-Apr-13
7-May-13
Hagerman 24-Jul-13
Oakley Res
Hagerman 30-Apr-13
American Falls 19-Jun-13
Roseworth Res American Falls 17-Jun-13
Rose Pond American Falls
12-Jun-13
17-Jun-13
Weston Res American Falls 24-Jun-13
4
Lake Cleveland
16-Oct-13
17-Jun-13
10-Jun-13
17-Oct-13
8-May-13
6-Nov-13
17-Oct-13
Sublett Res American Falls
Disposition Adjusted Exploitation Adjusted Total Use
Blair Trail Res Hagerman 13-May-13
Crystal Lake American Falls 17-Sep-13

22
Table 2. Mean density index (DI, lbs/ft3/inch), flow index (FI, lbs/GPM/ft3) across the entire
rearing period by hatchery and treatment for tagged catchable Rainbow Trout in 2011 and 2012. Length is the mean total length (mm) at the time of stocking (with 95% confidence intervals in parentheses).
Region Water Body Hatchery Tagging Date Treatment Tags
Released Harvested Harvested b/c tagged Released Estimate 90% C.I. Estimate 90% C.I.
Magnums Tx 180 13 0 9 22.6% 7.6% 38.2% 10.1%
Magnums Ctrl 180 10 0 2 17.4% 6.6% 20.8% 7.3%20-Jun-13 200 23 2 6 35.9% 9.4% 48.4% 11.1%1-Aug-13 100 20 0 2 62.5% 16.5% 68.8% 17.4%
Grading Ctrl 300 0 0 0 0.0% 0.0%Grading Tx 300 0 0 0 0.0% 0.0%Grading Ctrl 394 7 2 0 5.6% 2.5% 7.1% 2.9%Grading Tx 401 4 0 0 3.1% 1.9% 3.1% 1.9%Grading Ctrl 90 6 1 0 20.8% 10.0% 24.3% 10.8%Grading Tx 90 3 0 0 10.4% 7.1% 10.4% 7.1%Grading Ctrl 100 10 2 3 31.3% 11.7% 46.9% 14.3%Grading Tx 100 12 6 3 37.5% 12.8% 65.6% 17.0%
Magnums Tx 199 27 3 7 42.4% 10.3% 58.1% 12.4%Magnums Ctrl 200 21 1 9 32.8% 8.9% 48.4% 11.1%
4-Jul-13 100 13 0 6 40.6% 13.3% 59.4% 16.1%11-Sep-13 150 24 0 4 50.0% 12.6% 58.3% 13.7%
Magnums Tx 200 52 5 3 81.3% 15.1% 93.8% 16.5%Magnums Ctrl 200 26 4 6 40.6% 10.0% 56.3% 12.1%Grading Ctrl 100 4 1 0 12.5% 7.4% 15.6% 8.2%
Grading Tx 100 3 0 0 9.4% 6.4% 9.4% 6.4%
Grading Ctrl 100 3 0 0 10.4% 7.1% 10.4% 7.1%
Grading Tx 100 2 1 0 6.9% 5.8% 10.4% 7.1%
Grading Ctrl 100 2 1 0 6.3% 5.2% 9.4% 6.4%
Grading Tx 100 2 0 0 6.3% 5.2% 6.3% 5.2%
Grading Ctrl 90 3 0 1 10.4% 7.1% 13.9% 8.2%Grading Tx 90 2 0 0 6.9% 5.8% 6.9% 5.8%
Snake River Henry's Fork Ashton 6-Jun-13 Production 198 10 0 0 15.8% 6.0% 15.8% 6.0%
Mosquito Flat Res Mackay 25-Jun-13 Production 148 12 0 2 25.3% 8.8% 29.6% 9.5%20-Jun-13 150 6 0 2 12.5% 6.1% 16.7% 7.0%15-Jul-13 100 2 0 1 6.3% 5.2% 9.4% 6.4%5-Aug-13 80 4 0 1 15.6% 9.1% 19.5% 10.2%
Grading Ctrl 150 11 1 0 22.9% 8.3% 25.0% 8.7%Grading Tx 149 3 0 0 6.3% 4.3% 6.3% 4.3%Grading Ctrl 150 2 0 1 4.2% 3.5% 8.3% 4.9%Grading Tx 150 7 1 2 14.6% 6.6% 20.8% 7.9%
7
Salmon River Sawtooth Production
Stanley Lake Nampa
12-Jul-13
12-Aug-13
6
Production
Island Park Res Hagerman
24-Jul-13
Jim Moore Pond American Falls
4-Apr-13
Mackay Res American Falls
Rigby Lake Production
Ririe Res American Falls
Snake River American Falls
17-Sep-13
17-Sep-13
Snake River (Upper) American Falls 12-Jun-13
Disposition Adjusted Exploitation Adjusted Total Use
Ashton Res American Falls 24-Jun-13
Birch Creek Mackay
23-Oct-13
17-Oct-13
19-Jun-13
Ashton
13-Jun-13
12-Jun-13
DI FI Length (mm) DI FI Length (mm) DI FI Length (mm)
Low 0.10 0.32 258 (± 1) 0.10 0.50 268 (± 1) 0.13 0.29 256 (± 1) 261 (± 1)Medium 0.13 0.49 255 (± 1) - - - 0.20 0.50 248 (± 1) 251 (± 1)
High 0.16 0.67 253 (± 1) 0.21 0.79 254 (± 1) 0.25 0.59 241 (± 1) 250 (± 1)Hatchery mean 256 (± 1) 261 (± 1) 248 (± 1) 255 (± 1)
Low 0.09 0.36 252 (± 1) 0.11 0.54 270 (± 1) 0.11 0.26 240 (± 1) 254 (± 1)Medium 0.15 0.56 251 (± 1) 0.15 0.66 260 (± 1) 0.18 0.48 243 (± 1) 252 (± 1)
High 0.19 0.59 243 (± 1) 0.19 0.84 250 (± 1) 0.24 0.49 235 (± 1) 243 (± 1)Hatchery mean 249 (± 1) 260 (± 1) 240 (± 1) 252 (± 1)
Release year 2011
Release year 2012
Hagerman Fish Hatchery Nampa Fish Hatchery Treatment mean
Density treatment
American Falls Fish Hatchery

23
Figure 1. Total catch rate for all lakes and reservoirs versus all community ponds stocked
in 2011, 2012, and 2013.
Figure 2. Cumulative percentage caught versus days-at-large (in first year at large) for
tagged hatchery catchable trout that were released in lakes/reservoirs, community ponds, and rivers in 2013 and subsequently caught.

24
Figure 3. Catch by density index (top panel) and catch by flow index (bottom panel) for all
study groups released across all waters in both 2011 and 2012, combined.

25
Figure 4. Percent of density rearing study fish reported by anglers versus total length at
release for each hatchery. Data is for both 2011 and 2012 release years combined and represents individual fish length and catch rather than averages by release group.
Figure 5. Scatter plot of mean total catch of density rearing study hatchery catchable
Rainbow Trout released from American Falls, Hagerman, and Nampa fish hatcheries across 13 lakes/reservoirs in 2011 and 2012 versus water surface area for each water stocked.
0%
5%
10%
15%
20%
25%
30%
35%
160 180 200 220 240 260 280 300 320 340 360 380
Perc
ent o
f fish
repo
rted
(non
-corre
cted
)
Fish length (mm)
American FallsHagermanNampa

26
Figure 6. Mean percent of tags that were caught vs. length at tagging of all hatchery
catchable trout released in 2011, 2012, and 2013. The shaded gray areas show the number of tagged fish released each year and is plotted on the secondary Y axis.
Figure 7. Total catch rate for magnum (13-inch) versus standard (10-inch) catchables at 10
common reservoirs in southeast Idaho. Fish were stocked in 2013.
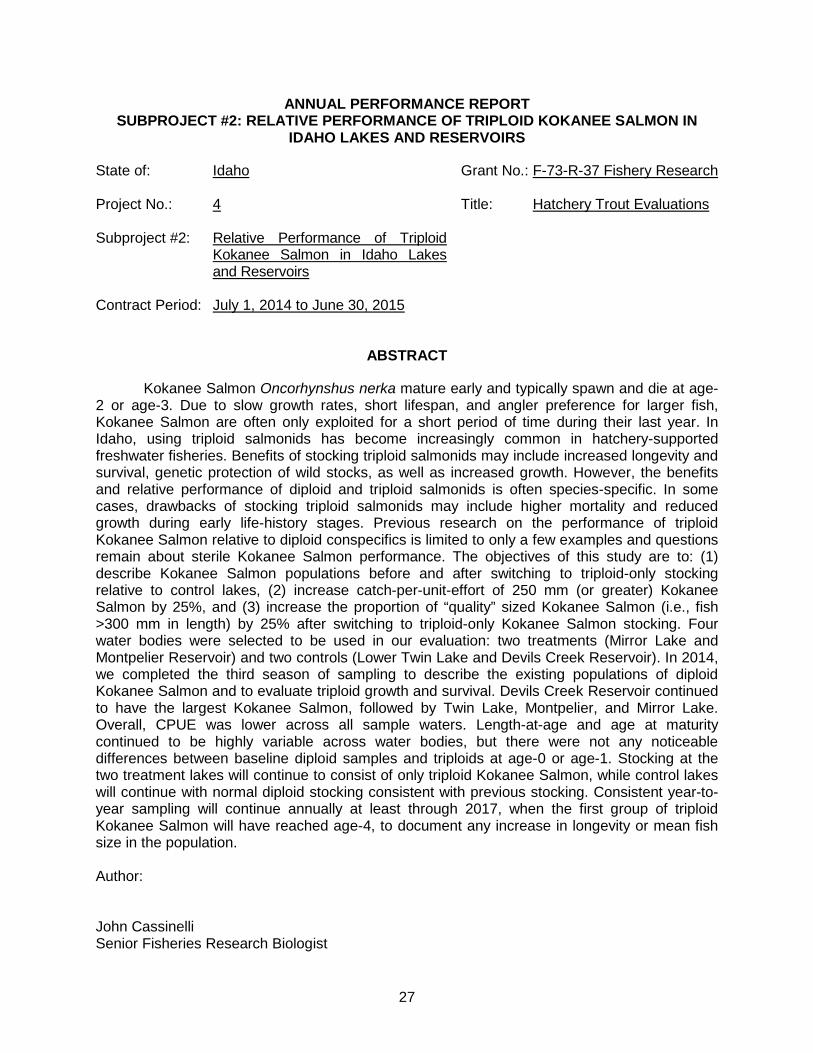
27
ANNUAL PERFORMANCE REPORT SUBPROJECT #2: RELATIVE PERFORMANCE OF TRIPLOID KOKANEE SALMON IN
IDAHO LAKES AND RESERVOIRS
State of: Idaho Grant No.: F-73-R-37 Fishery Research Project No.: 4 Title: Hatchery Trout Evaluations Subproject #2: Relative Performance of Triploid
Kokanee Salmon in Idaho Lakes and Reservoirs
Contract Period: July 1, 2014 to June 30, 2015
ABSTRACT
Kokanee Salmon Oncorhynshus nerka mature early and typically spawn and die at age-2 or age-3. Due to slow growth rates, short lifespan, and angler preference for larger fish, Kokanee Salmon are often only exploited for a short period of time during their last year. In Idaho, using triploid salmonids has become increasingly common in hatchery-supported freshwater fisheries. Benefits of stocking triploid salmonids may include increased longevity and survival, genetic protection of wild stocks, as well as increased growth. However, the benefits and relative performance of diploid and triploid salmonids is often species-specific. In some cases, drawbacks of stocking triploid salmonids may include higher mortality and reduced growth during early life-history stages. Previous research on the performance of triploid Kokanee Salmon relative to diploid conspecifics is limited to only a few examples and questions remain about sterile Kokanee Salmon performance. The objectives of this study are to: (1) describe Kokanee Salmon populations before and after switching to triploid-only stocking relative to control lakes, (2) increase catch-per-unit-effort of 250 mm (or greater) Kokanee Salmon by 25%, and (3) increase the proportion of “quality” sized Kokanee Salmon (i.e., fish >300 mm in length) by 25% after switching to triploid-only Kokanee Salmon stocking. Four water bodies were selected to be used in our evaluation: two treatments (Mirror Lake and Montpelier Reservoir) and two controls (Lower Twin Lake and Devils Creek Reservoir). In 2014, we completed the third season of sampling to describe the existing populations of diploid Kokanee Salmon and to evaluate triploid growth and survival. Devils Creek Reservoir continued to have the largest Kokanee Salmon, followed by Twin Lake, Montpelier, and Mirror Lake. Overall, CPUE was lower across all sample waters. Length-at-age and age at maturity continued to be highly variable across water bodies, but there were not any noticeable differences between baseline diploid samples and triploids at age-0 or age-1. Stocking at the two treatment lakes will continue to consist of only triploid Kokanee Salmon, while control lakes will continue with normal diploid stocking consistent with previous stocking. Consistent year-to-year sampling will continue annually at least through 2017, when the first group of triploid Kokanee Salmon will have reached age-4, to document any increase in longevity or mean fish size in the population. Author: John Cassinelli Senior Fisheries Research Biologist

28
INTRODUCTION
Kokanee Salmon Oncorhynchus nerka are an important recreational species in reservoirs and lakes across the western United States and Canada (Rieman and Myers 1992). Kokanee Salmon may support high yield fisheries or provide a forage base for large piscivores (Wydoski and Bennett 1981). While Kokanee Salmon are important to the harvest-oriented anglers and for providing trophy fisheries, managing for healthy Kokanee Salmon populations is often problematic (Beattie and Clancey 1991). Harvest rates of Kokanee Salmon are heavily influenced by growth rates, population density, and fish size. Since the majority of Kokanee Salmon populations in Idaho are found in oligotrophic lakes or reservoirs, growth rates are relatively low, especially when population densities exceed 50 fish/ha (Rieman and Maiolie 1995). Additionally, Kokanee Salmon mature early and typically spawn and die at age-3 or age-4 (Johnston et al. 1993). Due to slow growth rates, short life span, and angler's preference for larger fish, Kokanee Salmon are often only exploited for a short period of time during their last year.
In Idaho, hatchery-reared diploid Kokanee Salmon are stocked to supplement wild
populations and to provide put/grow/take fisheries. Using triploid salmonids has become increasingly common in hatchery-supported freshwater fisheries. Triploids are functionally sterile, and the common assertion is that sterility provides a fisheries or aquaculture benefit (Teuscher et al. 2003). Benefits of stocking triploids may include increased longevity and survival (Ihssen et al. 1990), genetic protection of wild stocks (Rohrer and Thorgaard 1986), as well as increased growth (Habicht et al. 1994; Sheehan et al. 1999). However, the benefits and relative performance of diploid and triploid salmonids is often species-specific. In some cases, drawbacks of stocking triploids may include higher mortality and reduced growth during early life-history stages (Myers and Hershberger 1991). For example, triploid Rainbow Trout often survive at lower rates in some reservoirs, even when stocked at “catchable” sizes (Koenig and Meyer 2011), or when mixed-sex fry are stocked in alpine lakes (Koenig et al. 2011). Additionally, past pressure treatment trials indicated survival to eye-up for triploid Kokanee Salmon egg lots are at least 10% lower than diploid control groups (Koenig 2011), requiring more eggs be collected to meet stocking requests.
Previous research on the performance of triploid Kokanee Salmon relative to diploid
conspecifics is limited to only a few examples. Parkinson and Tsumura (1988) evaluated hormone-sterilized Kokanee Salmon in three lakes, and found that sterilized fish survived at only 10% the rate of control fish to maturity. Despite low early survival, sterilized Kokanee Salmon survived longer than the normal life span, but no size advantage was ever achieved.
Johnston et al. (1993) performed a similar evaluation (in one lake) also using hormone-
sterilized Kokanee Salmon. Their results showed very low catch of treated Kokanee Salmon at age-1 and age-2, but catch increased relative to controls after age-3. Despite unusual longevity to age-7, they reported that the total catch of treated Kokanee Salmon was always lower than controls, even over the long term. Total catch of treated Kokanee Salmon was about 30-75% less than controls over a seven-year period, while most control fish were returned within four years. Similar to Parkinson and Tsumura (1988), sterile Kokanee Salmon in this study did not show any growth advantage.
In 2005, the Idaho Department of Fish and Game (IDFG) began a multiyear study to
examine relative growth and survival of triploid and diploid Kokanee Salmon across five lakes and reservoirs. Diploid and triploid Kokanee Salmon were stocked together in each reservoir in similar numbers during spring 2005 and sampled from 2007-2009. Results from the 2007

29
sample (which recaptured the majority of fish) indicated that 73% of recaptured marked fish were diploid and that there was no size difference between diploid and triploid groups. This study had limited triploid-induction rates (79%) and few recaptured marked fish. As a result of these limitations, significant uncertainty about the relative performance of diploid and triploid Kokanee Salmon remains. More recently, Canadian biologists have been experimenting with triploid Kokanee Salmon in sport fish applications. Initial studies in several lakes stocked only with triploid Kokanee Salmon indicate triploid Kokanee Salmon do not produce the same quality fisheries as lakes stocked exclusively with diploid fish (Mike Ramsay, BC Ministry of Forests, Lands and Natural Resource Operations, personal communication). Ramsay has concluded that triploid Kokanee Salmon experience much higher mortality at younger age-classes and lower growth rates, preventing triploid Kokanee Salmon from ever achieving the intended goal of larger, older fish.
Although these previous studies provide good information, they have some obvious
limitations. Each study was only performed in 1-3 lakes, with no definitive marks to differentiate diploid and triploid fish, making comparisons of catch between groups difficult. In addition, Parkinson and Tsumura (1988), Johnston et al. (1993), and Koenig and Meyer (2011) all compared treatment and control fish stocked in the same lakes, where competition could have been a factor. Finally, the data from Mike Ramsay do not include information describing the fishery before switching to triploid only. Despite the growing body of evidence against using triploid Kokanee Salmon for managing sport fisheries, questions remain about their performance.
While triploid Kokanee Salmon would obviously not increase natural production, their
increased longevity may be beneficial for extending recreational fishing opportunities over the long term. Enhanced longevity may provide additional sportfishing opportunity in subsequent years after semelparous diploids would have already perished. Greater longevity could ultimately result in larger size from a longer growth period and possibly higher yield, since Kokanee Salmon are thought to be increasingly susceptible to angling as length increases (Rieman and Maiolie 1995). We are interested in whether the benefits of stocking triploid Kokanee Salmon in put/grow/take fisheries would outweigh the detriments of lower egg eye-up rates and potentially poorer initial survival as seen by Parkinson and Tsumura (1988). The objective of this study is to compare relative performance of Kokanee Salmon fisheries before and after converting to triploid Kokanee Salmon stocking. More specifically, the goal of this study is to enhance the longevity of Kokanee Salmon through sterilization by at least one year and thereby increase harvest rates by at least 25%.
OBJECTIVES
1. Describe Kokanee Salmon populations before and after switching to triploid-only stocking relative to control lakes.
2. Increase CPUE of 250 mm (or greater) Kokanee Salmon by 25%. 3. Increase the proportion of “quality” sized Kokanee Salmon (PSD; Kokanee Salmon >300
mm) by 25% after switching to triploid-only Kokanee Salmon stocking.

30
METHODS
Study Sites
Since this evaluation focuses on comparing fisheries after converting to triploid-only stocking, study sites were chosen from those currently stocked with Kokanee Salmon. Few locations were suitable for research purposes, as we did not want to risk collapsing any particularly popular sport fisheries, and sites had to be of manageable size for cost and sampling efficiency. Additionally, naturally reproducing populations of Kokanee Salmon may confound results and make interpreting treatment effects difficult. Based on these selection criteria, Mirror Lake and Montpelier Reservoir were chosen as treatment waters, while Lower Twin Lake and Devils Creek Reservoir were chosen as control waters (Table 3).
The existing populations of normally stocked diploid Kokanee Salmon in Montpelier
Reservoir and Mirror Lake served as the baseline from which to compare the treatment of switching to stocking only triploid Kokanee Salmon. One season (2012) of initial sampling was conducted to describe the existing populations (length distributions, age classes, growth rates) of diploid Kokanee Salmon at all four water bodies. After this initial sampling, stocking at the treatment lakes was switched to stocking only triploid Kokanee Salmon, while control lakes continued with normal diploid stocking, consistent with previous years. Since a particular cohort of Kokanee Salmon will not impact the fishery until at least a year after stocking, a second season of monitoring in 2013 served essentially as an additional year of baseline data for the existing populations, both in treatment and control waters.
Collecting Eggs/Spawning
The second triploid treatment and diploid control groups were spawned in September of 2013 during normally scheduled weir operations on the Deadwood River. Kokanee Salmon from normal production were used for the diploid control groups. Triploid production lots were made using pressure-treatment on site. The recipe used was a treatment of 9500 psi at 350 Celsius-minutes after fertilization for five minutes. Since this is an ongoing study, additional treatment and control groups will be spawned in identical fashion from 2014 through at least 2016.
Hatchery Rearing
Fertilized eggs were flown to Cabinet Gorge Fish Hatchery where they were reared until the eyed egg stage. Diploid and triploid test groups received year-specific otolith thermal marks to distinguish them from naturally produced diploid Kokanee Salmon, and from subsequent year classes to ensure correct age identification. Thermal marks were confirmed prior to stocking. Stocking lots for Devils Creek and Montpelier reservoirs were transferred to Mackay Fish Hatchery to complete rearing, while Cabinet Gorge Fish Hatchery reared Kokanee Salmon for Mirror and Lower Twin lakes.
Prior to stocking, 100 triploid blood samples and 10 diploid samples were collected to
check triploid-induction rates. Blood samples were collected by severing the caudal peduncle of each fish and immersing it in a tube filled with Alsever's solution. Samples were shipped to North Carolina State University for analysis by flow cytometry. At the time of stocking, mean total length (mm) and weight (g) were collected from 100 individual fish in each study group.
31
Sampling
Kokanee Salmon sampling began in 2012 and will continue annually through at least 2017, when the first group of triploids reach age-4. Net locations for sampling fish were initially randomly assigned, recorded by GPS, and repeated in proceeding years. The limnetic zone of each lake was divided into numbered squares and a random number generator was used to select three squares that will serve as monitoring locations where one net will be placed. One net was fished for one night at each of the three locations at each water, for a total annual fishing effort of three net-nights per lake. This will be repeated in subsequent years to help reduce random variation in CPUE between years. Sampling effort may increase if catch rates are low and more samples are needed to adequately characterize the populations.
Kokanee Salmon are sampled each year during the period ranging from mid-June to
mid-July, after waters have begun to stratify, around the timing of the new moon phase. Fish are collected using experimental net curtains suspended at the depth of the thermocline. Experimental net curtains measure 55 m long by 6 m deep. Two of the three nets were “small” mesh and were composed of panels ranging from 19 to 64 mm bar mesh monofilament, while the third net was “medium” mesh composed of panels ranging from 64 to 152 mm bar mesh monofilament. Panels were randomly positioned on nets during manufacturing.
Data Analysis
Standing Kokanee Salmon stocks before and after switching to triploid-only stocking were described in terms of fish size distribution and catch rates. Mean CPUE at each lake was calculated as the average catch rate (fish/hour) across the total number of nets. Size-at-age and mean total length were used to characterize stock structure in each lake. Sectioned otolith samples were examined to determine fish age, and thermal marks are used to describe the age structure of the populations in each lake.
RESULTS / DISCUSSION
Baseline samples of diploid Kokanee Salmon were collected from all four waters in 2012 and 2013. In 2014, two year classes of treatment fish (age-0 and age-1) were present in treatment waters. Sampling effort and age structure of sampled fish were similar in 2014 to previous sample years (Table 4) while CPUE dropped at all four waters in 2014 (Figure 8). Length frequencies and length-at-age were similar to past years, with no noticeable shifts (Figure 9).
As it was in 2012 and 2013, length at age was highly variable across waters in 2014 with
Devil’s Creek Reservoir again showing the highest growth rates (largest length-at-age) and Mirror Lake again showing the lowest growth (smallest length-at-age). Average length-at-age-2 varied by 259 mm between the two water bodies in 2013 (449 mm vs. 190 mm). Similar to 2011, and 2012, Lower Twin Lake again showed high growth while Montpelier Reservoir showed more moderate growth (Table 4). Additionally, the larger, faster growing fish of Devil’s Creek Reservoir and Lower Twin Lake continue to appear to mature and spawn at an earlier age, as very few fish over the age of two were sampled, while there were again many age-3 Kokanee Salmon in the slow growing Mirror Lake population. Older age at maturity associated with slower growth rates is well established in the literature (Grover 2005).

32
Catch-per-unit-effort remained somewhat consistent from 2012 to 2013, but was significantly lower in 2014. Montpelier Reservoir continued to have the lowest CPUE and Mirror Lake remained the highest. The overall drop in CPUE is somewhat surprising considering water levels were good and sampling was conducted during similar times and moon phases as previous years.
Future reports will contain more detailed information in regards to this study as the
treatment and control groups mature and become more apparent in the overall populations.

33
ACKNOWLEDGEMENTS
I would like to acknowledge Joe Thiessen, Eric Herrera, Erin Larson, Rick Raymondi, Liz Mamer, and Kristi Stevenson for assisting with sample collection. I would like to thank Steve Elle, Kristi Stevenson, and Liz Mamer for their help with aging otoliths. I thank Kristi Stevenson for mounting, slicing, and imaging otoliths. I would also like to thank Bob Becker and the staff at Nampa Fish Hatchery for their assistance collecting and pressure shocking Kokanee Salmon eggs at Deadwood Reservoir. Additionally, I would like to thank John Rankin and the staff at Cabinet Gorge Hatchery and Pat Moore and the staff at Mackay Hatchery for their work rearing and releasing fish. I also thank Ryan Hardy and Kristin Wright for editing this report. Funding for this work was provided by anglers and boaters through their purchase of Idaho fishing licenses, tags, and permits, and from federal excise taxes on fishing equipment and boat fuel through the Sport Fish Restoration Program.

34
LITERATURE CITED
Beattie, W. D., and P. T. Clancey. 1991. Effects of Mysis relicta on the zooplankton community and Kokanee Salmon population of Flathead Lake, Montana. American Fisheries Society Symposium 9:39-48.
Grover, M. C. 2005. Changes in size and age at maturity in a population of Kokanee Salmon
Oncorhynchus nerka during a period of declining growth conditions. Journal of Fish Biology 66(1):122-134.
Habicht, C., J. E. Seeb, R. B. Gates, I. R. Brock, and C. A. Olito. 1994. Triploid Coho Salmon
outperform diploid and triploid hybrids between Coho Salmon and Chinook Salmon during their first year. Canadian Journal of Fisheries and Aquatic Sciences 51:31-37.
Ihssen, P. E., L. R. McKay, I. McMillan, and R. B. Phillips. 1990. Ploidy manipulation and
gynogenesis in fishes: cytogenetic and fisheries applications. Transactions of the American Fisheries Society 119:698-717.
Johnston, N. T., E. A. Parkinson, and K. Tsumura. 1993. Longevity and growth of hormone-
sterilized Kokanee Salmon. North American Journal of Fisheries Management 13:284-290.
Koenig, M. K. 2011. Idaho Department of Fish and Game. Annual performance report number
11-07. Boise. Koenig, M. K., and K. A. Meyer. 2011. Relative performance of diploid and triploid catchable
Rainbow Trout stocked in Idaho lakes and reservoirs. North American Journal of Fisheries Management 31:605-613.
Koenig, M. K., J. R. Kozfkay, K. A. Meyer, and D. J. Schill. 2011. Performance of diploid and
triploid Rainbow Trout stocked in Idaho alpine lakes. North American Journal of Fisheries Management 31:124-133.
Myers, J. M., and W. K. Hershberger. 1991. Early growth and survival of heat shocked and
tetraploid-derived triploid Rainbow Trout. Aquaculture 96:97-101. Parkinson, E. A., and K. Tsumura. 1988. Growth and survival of hormone-sterilized Coho
Oncorhynchus kisutch and Kokanee Salmon Salmon O. nerka in a lacustrine environment. Canadian Journal of Fisheries and Aquatic Sciences 45:1490-1494.
Rieman, B. E., and D. Myers. 1992. Influence of fish density and relative productivity on growth
of Kokanee Salmon in ten oligotrophic lake and reservoirs in Idaho. Transactions of the American Fisheries Society 121:178-191.
Rieman, B. E., and M. A. Maiolie. 1995. Kokanee Salmon population density and resulting
fisheries. North American Journal of Fisheries Management 15:229-237. Rohrer, R. L., and G. H. Thorgaard. 1986. Evaluation of two hybrid trout strains in Henry’s Lake,
Idaho, and comments on the potential use of sterile triploid hybrids. North American Journal of Fisheries Management 6:367-371.

35
Sheehan, R. J., S. P. Shasteen, A. V. Suresh, A. R. Kapuscinski, and J. E. Seeb. 1999. Better growth in all-female diploid and triploid Rainbow Trout. Transactions of the American Fisheries Society 128:491-498.
Teuscher, D. M., D. J. Schill, D. J. Megargle, and J. C. Dillon. 2003. Relative survival and
growth of triploid and diploid Rainbow Trout in two Idaho reservoirs. North American Journal of Fisheries Management 23:983-988.
Wydoski, R. S., and D. H. Bennett. 1981. Forage species in lakes and reservoirs of the western
United States. Transaction of the American Fisheries Society 110:764-771.

36
Table 3. Current list of waters and stocking numbers for early Kokanee Salmon. Selected study sites for evaluating switching to triploid-only stocking (treatment) are shown in bold font.
Table 4. Net-hours, CPUE, and age distribution of diploid (2N) and triploid (3N) Kokanee
Salmon in two control and two treatment lakes for sample years 2012, 2013, and 2014.
Region Lake Name Hatchery Number Comments
01 Hauser L. Cabinet Gorge 0 Stocking discontinued01 Hayden L. Cabinet Gorge 100,000 Fishery risk?01 Lower Twin L. Cabinet Gorge 60,000 Study site - CONTROL01 Mirron L. Cabinet Gorge 5,000 Study site - TREATMENT01 Spirit L. Cabinet Gorge 0 Stocking discontinued3B Arrowrock Res. Mackay 50,000 Too big, fishery risk3B Lucky Peak Res. Mackay 200,000 Too big, fishery risk3M Cascade Res Mackay 250,000 Too big, natural production3M Payette L. Mackay 460,000 Too big, natural production3M Warm L. Cabinet Gorge 50,000 Natural production, 3N already04 Anderson Ranch Res. Mackay 0 Stocking discontinued05 Devils Creek Res. Mackay 7,000 Study site - CONTROL05 Montpelier Res. Mackay 6,000 Study site - TREATMENT06 Island Park Res. Mackay 250,000 Too big, fishery risk06 Ririe Res. Mackay 210,000 Too big, fishery risk
Age 0 Age 1 Age 2 Age 3Montpelier Res. 2N 105.8 1.63 109 203 277 337
Devils Creek Res. 3N 49.1 3.60 121 317 459 NAMirror Lake 2N 46.5 4.10 100 160 205 246
Lower Twin Lake 3N 89.8 3.00 106 293 389 NAMontpelier Res. 2N 54.5 1.27 112 220 274 NA
Devils Creek Res. 3N 47.0 4.68 115 317 467 500Mirror Lake 2N 45.5 4.37 104 159 205 235
Lower Twin Lake 3N 45.0 1.82 104 289 393 NAMontpelier Res. 2N 40.0 0.65 105 228 282 314
Devils Creek Res. 3N 45.3 1.08 103 277 449 NAMirror Lake 2N 47.3 1.27 103 185 199 240
Lower Twin Lake 3N 48.5 0.72 97 263 387 410
2014
Net-Hours
CPUEMean Length-At-Age (mm)
2012
2013
Sample Year
Water Body Treatment

37
Figure 8. Catch per unit effort for Kokanee sampling at all four study waters in 2012, 2013, and 2014.
Figure 9. Length distribution (by percent) of Kokanee Salmon across the four different
study water bodies. These distributions represent “baseline” samples taken in the summer of 2012, 2013, and 2014.

38
ANNUAL PERFORMANCE REPORT SUBPROJECT #3: RELATIVE PERFORMANCE OF TRIPLOID WESTSLOPE CUTTHROAT
TROUT IN ALPINE LAKES State of: Idaho Grant No.: F-73-R-37 Fishery Research Project No.: 4 Title: Hatchery Trout Evaluations Subproject #3: Relative Performance of Triploid
Westslope Cutthroat Trout in Alpine Lakes
Contract Period: July 1, 2014 to June 30, 2015
ABSTRACT
High mountain lakes are an important component of Idaho’s recreation economy, drawing an estimated 40,000 anglers each year. Currently, Westslope Cutthroat Trout (WCT) Oncorhynchus clarkii lewisi compose 57% of the requested trout stocked in Idaho high mountain lakes, followed second by all-female triploid (Troutlodge) rainbow trout (23%). Until recently, WCT stocking comprised an even larger proportion of high lakes stocking, but an increased desire for stocking triploid trout led to a reduced number of WCT requested. Since triploid Cutthroat Trout stocks have not been available, all-female triploid Rainbow Trout have become the default choice where sterile trout are desired. The goal of this study was to examine catch per unit effort and length-at-age of both diploid and triploid hatchery WCT in relation to stocking density (and other environmental variables) in an effort to develop stocking recommendations for triploid WCT in alpine lakes. In both the summer of 2011 and 2013, we aerial-stocked a group of central Idaho high mountain lakes with either diploid or triploid WCT fry that were marked with an adipose fin clip. Three years post-stocking we returned to sample study fish using both angling and floating gillnets. Study fish were recovered from 26 of the 30 lakes sampled in 2014. Mean catch per gillnet hour of effort was similar for both diploid and triploid stocking groups (0.164 and 0.150, respectively) as was mean length-at-age (284 mm, diploid; 286 mm, triploid). At this point in the study, triploid WCT seem like a viable alternative to diploid fish that can escape from stocked lakes and compete and breed with native salmonids. In 2016, fish from the second year of stocking (2013) will be sampled and a full analysis will be completed including stocking guidelines. Author: John Cassinelli Senior Fisheries Research Biologist

39
INTRODUCTION
Fishing opportunities in alpine lakes can be highly rewarding and anglers visiting alpine lakes typically express high levels of satisfaction with their fishing experience (WGF 2002; IDFG 2007). High mountain lakes are an important component of Idaho’s recreational economy, drawing an estimated 40,000 anglers each year (IDFG 2007). According to a 2003 economic survey, recreational fishing at Idaho’s mountain lakes generated over 59,000 trips with over $10M in associated statewide retail sales (IDFG unpublished data). While economic benefits of fishing alpine lakes are considerable, the costs associated to stock these lakes annually is relatively low. For example, in 2008 the McCall Fish Hatchery stocked 170,070 fry in 215 mountain lakes with an average flight cost of $67.91 and feed cost of $42, per lake (Frew 2008).
The IDFG Fisheries Management Plan includes a goal for alpine lakes that states they
will be managed “to reduce impacts to native species in and downstream from alpine lakes.” Trout introduced to high mountain lakes have been identified as a risk to native salmonids in downstream habitats by establishing exotic source populations in headwater locations (Adams et al. 2001). Triploid salmonids are functionally sterile and may be a useful tool for managing alpine lake fisheries. Sterility avoids genetic introgression with native stocks while allowing for recreational harvest opportunity (Kozfkay et al. 2006, Dillon et al. 2000) and may prolong longevity of stocked fish (Parkinson and Tsumura 1988; Johnston et al. 1993; Warrillow et al. 1997). Because of these attributes, in 2001, IDFG established a policy to only stock triploid Rainbow Trout Oncorhynchus mykiss in stocked fisheries where diploid hatchery fish may pose a genetic risk to native trout populations (IDFG 2007).
Currently, Westslope Cutthroat Trout (WCT) O. clarkii lewisi compose 57% of the
requested trout to be stocked in Idaho high mountain lakes, followed second by all-female triploid (Troutlodge) rainbow trout (23%). Westslope Cutthroat Trout stocked throughout Idaho originate from the IDFG broodstock facility at Cabinet Gorge Fish Hatchery, initially derived from the King’s Lake stock in British Columbia. However, fishery managers concerned with conserving native WCT are interested in preventing hatchery WCT stocked into mountain lakes from breeding with wild native Cutthroat Trout and redband trout O. mykiss in downstream habitats. Concerns over such risks to native fish species have increased requests for triploid trout and until recently all-female triploid Rainbow Trout were the default choice where sterile trout are desired.
Lower survival for stocked triploid salmonids (compared to their diploid counterparts) has
been found in all-female Rainbow Trout fry (Brock et al. 1994), fingerling Rainbow Trout (Simon et al. 1993) and fingerling Coho Salmon O. kisutch (Rutz and Baer 1996). Previous IDFG research on using mixed-sex rainbow trout (Hayspur strain) in high mountain lakes found significantly lower survival to age-3 and age-4 for triploids relative to diploids in the same lakes (Koenig et al. 2011). Overall, the return of triploid trout in alpine lakes in Idaho was low compared to diploid trout, with diploids accounting for 0.68 of the total marked fish caught. Generally, a 1.5-2:1 ratio of diploid:triploid returns can be expected for mixed-sex rainbow trout, based on several years of stocking and surveys. Despite potential lower survival compared to diploids, triploid trout remain a useful alternative to reduce genetic impacts to wild trout when stocking sport fish.
Historically, “trial and error” was the most common strategy for stocking high mountain lakes throughout western states. Due to their relative inaccessibility, quantitative models and stocking decisions based on regular fisheries surveys remain rare according to a recent survey of high lake fisheries managers across several western states (Meyer and Schill 2007). They

40
found most of the changes in mountain lake stocking practices have focused around utilizing more native species, reducing stocking where natural recruitment occurs, and reducing impacts to native amphibians. Yet, stocking strategies are remarkably similar between states. Most lakes, including those in Idaho, are mainly stocked with either Rainbow Trout or a subspecies of Cutthroat Trout, generally on a rotation of every 2-4 years. About 600,000 fry are stocked into 677 mountain lakes on a rotating basis across Idaho. Most stocked lakes receive fish every 3 years (82%) with some every 2 (16%) or 1 (3%) years. Fish are typically stocked by aircraft at 25-50 mm in mid- or late-summer, at typical densities of 50-200 fish/acre (Meyer and Schill 2007). Survey data to describe fish populations and angling pressure is difficult to obtain on a frequent enough basis to accurately adjust stocking rates across hundreds of lakes. In short, HML stocking practices are based on generalized data and may not be optimal for each lake. In this respect, a quantitative model for triploid WCT using stocking density to predict fish performance will be valuable for managing Idaho alpine lakes.
Fredericks et al. (2002) developed a model to maximize growth and abundance by
adjusting stocking rates based on high mountain lake productivity and size in north Idaho. However, this model was localized to northern Idaho and applicable to only diploid fish. Research into refining stocking strategies to improve mountain lake fisheries while minimizing impacts to native salmonids remains important – especially as manager’s interest in stocking triploid WCT increases. Given the potential lower survival rates for triploid trout, stocking density guidelines in alpine lakes should be developed specifically for triploid WCT. These guidelines could help ensure fisheries of satisfactory quality while still retaining conservation benefits of triploid westslope cutthroat trout.
Study Objective
1. Examine relationships between gillnet CPUE and length-at-age of both diploid and triploid WCT to stocking density (and other environmental variables) to develop stocking guidelines in alpine lakes.
METHODS
This study began in 2011 and will continue through 2016. For the first year of the study, egg collection, spawning, and rearing began in May 2011, were followed by marking and stocking of test fish in August 2011. Sampling to collect age-3 marked fish occurred in 2014. This process was to be duplicated with another egg take and stocking in 2012, but fish experienced high mortality prior to release; as such, there was no 2012 treatment group. A subsequent group of eggs were collected and stocked in 2013 and those fish will be sampled in the summer of 2016.
Egg Collection / Rearing
In both 2011 and 2013, sterile WCT eggs were created at Cabinet Gorge Fish Hatchery using standard spawning techniques followed by pressure treatment to induce triploidy. Approximately 120 female WCT were used to collect about 100,000 triploid eggs to then rear into fry, assuming roughly 50% survival to the eyed egg stage (based on previous IDFG Salmonid triploid work). Eggs were pressure treated at 300 Celsius-minutes after fertilization at 9,500 psi for 5 minutes duration (Kozfkay et al. 2006). Each pressure treated batch contained eggs from 20-30 females. After eye-up, eggs were transferred to the McCall Fish Hatchery for

41
rearing. Normal diploid WCT were obtained in the same fashion, with the exception of the pressure treatment process. These fish were reared separately from the triploid group.
Fish Marking / Stocking
Diploid and triploid test fish were marked during rearing at McCall Fish Hatchery. Both diploid and triploid fish were marked with adipose fin clips to denote inclusion in this study and to separate them from other previously stocked or naturally produced fish in study lakes. Diploid and triploid marked fish were stocked into separate lakes so as to avoid any potential competition between the groups that might influence performance and survival (Kozfkay et al. 2006). Because groups were stocked in separate lakes, one mark was sufficient to denote inclusion in the study.
Prior to stocking, 100 triploid blood samples and 10 diploid blood samples were collected to check triploid-induction rates. Blood samples were collected by severing the caudal peduncle of each fish and immersing it in a tube filled with Alsever's solution. Samples were shipped to North Carolina State University for analysis by flow cytometry.
At the time of stocking, fish from both the triploid and diploid groups were sampled to
describe the mean length (mm), weight (g) and condition factor (K = (Wg)/L3cm) prior to stocking.
Fish were stocked by aircraft by McCall Fish Hatchery staff as part of the routine 2011 and 2013 stocking requests for the specified lakes. The number of marked fish stocked in each lake was determined by the standard annual request for that location. This approach resulted in a range of stocking densities (Table 5).
Study Sites
In 2011, a subset of lakes was selected from the IDFG alpine lake stocking request. Two groups of 16 lakes were stocked with either marked diploid or marked triploid WCT for a total of 32 lakes in the first year of stocking. In 2013, an additional 22 (11 diploid and 11 triploid) lakes were stocked to increase the sample size of the experiment to include more locations. Lakes were chosen throughout central Idaho to encompass a wide geographical range. Candidate lakes occurring in clusters were prioritized to maximize the number of study sites while minimizing travel time between sites to allow more locations to be sampled during the season (Table 5).
Fish Sampling
All lakes were sampled three years after stocking so that fish could grow to a desired catchable size. In 2014, sampling assistance was required from Regional fisheries staff to sample all lakes in the study each year. Nampa Research staff developed a standardized sampling protocol and coordinated sampling among Regional fisheries staffs. Similar regional assistance will be needed for 2016 sampling. Lakes are sampled using a combination of angling and gillnets. Two, three, or four gillnets were used per lake depending on lake size. Floating experimental gillnets consisting of nylon mesh panels of 19, 25, 30, 33, 38, and 48 mm bar mesh (46 m long and 1.5 m deep) were set overnight to collect fish. Additional samples were collected using fly and spinning tackle to increase sample size of study fish. Data collected from captured fish includes: species, total length (mm), weight (g), and any marks.

42
Habitat
Lake surveys included habitat parameters that might be related to fish growth or density such as surface water temperature, mean depth (m), maximum depth, indicators of angler use, number and characteristics of inlets and outlets, and shoreline habitat characteristics. Lake elevation will be determined using topographic maps or GPS. Lake area will be measured using aerial photos and Arc GIS software.
Data Analysis
Mean catch rate (CPUE) was calculated as the average catch rate (fish/hour) for the total number of net-hours fished at each water. Mean length-at-age for all study fish captured at each water was also calculated to compare diploid and triploid groups.
Once data from all sample years is collected, potential relationships between physical
lake features, access difficulty, and characteristics of triploid WCT will be identified. Stocking density models for diploid and triploid WCT will also be compared to examine any significant differences that might exist which could be useful for determining future stocking guidelines.
RESULTS
Triploid induction rates were 100% in both years of the study. Size at clipping was very similar for the two study groups in 2011. The average length and weight at clipping of the diploid fish was 42.8 mm and 0.85 g, respectively. The average length and weight of triploid fish was 44.2 mm and 0.87 g, respectively. The diploid and triploid groups had similar average K at 0.0108 and 0.0101, respectively.
In 2013, again the two study groups were similar in length with diploid fish averaging
42.0 mm and triploid fish averaging 41.1 mm. However, diploid fish weighed significantly more at 0.86 g, while the average weight of the triploid fish was only 0.50 g. This resulted in a more marked difference in K between the two groups with the diploid group having an average K of 0.1161 and the triploid group having an average K of 0.0072.
Of the 32 lakes stocked in 2011, 30 of the lakes were sampled in the summer of 2014
(15 diploid and 15 triploid lakes). Nampa Research staff sampled 11 lakes in 2014 while IDFG Region 2 staff sampled 7 lakes and Region 3M staff sampled 13 lakes. Of the diploid waters sampled, 14 of the 15 contained study fish. Average diploid WCT length was 284 mm across all waters sampled and total CUPE was 0.164 (fish/net/hour). Of the 15 triploid waters sampled, 12 contained study fish. Average triploid WCT length was 286 mm across all waters stocked and total CPUE was 0.150 (fish/net/hour). Angling effort and success across study waters was highly variable based on when the lake was sampled. Therefore, fish captured by angling were used to aide in size structure of study fish, but were not used in any CPUE calculations, due to inconsistent effort. When plotted against stocking density, CPUE curves were similar for both diploid and triploid WCT (Figure 10).
DISCUSSION
Fish size similarities prior to release in 2011 are a promising indicator that in-hatchery performance (growth, feed conversions, etc.) between diploid and triploid WCT were similar.

43
However, the 2013 triploid fish were significantly lighter than their diploid counterparts, despite being similar in length. The triploid fish had a lower condition factor and likely had decreased feed conversions than the diploid fish in 2013. Piper et al. (1982) indicates that based on ideal WCT condition, the ideal weight for a 4.25 cm fish (average size of all fish released across both years of the study) is 0.744 grams. While the triploid group was well below ideal weight and condition in 2013, the other three groups (diploid and triploid 2011, diploid 2013) were slightly above ideal weight and condition. The effects this may have on post-release survival remain to be determined, since fish stocked in 2013 will not be sampled until 2016.
First year sampling results indicate that there was no difference in post release performance between diploid and triploid WCT. Both CPUE and average length at age were similar between the two groups. Additionally, CPUE compared to stocking density shows that both groups have similar densities three years post release, when stocked at similar densities.
In 2016, fish from the second year of stocking (2013) will be sampled to increase study
sample size. Upon collection of these additional data, a full comparison between diploid and triploid WCT will be completed as well as an evaluation of lake habitat parameters and their role in potentially influencing fish survival and abundance.

44
ACKNOWLEDGEMENTS
I would like to acknowledge Joe Thiessen, Rick Raymondi, Dennis Daw, Patrick Kennedy, Liz Mamer, Luke Teraberry, Kevin Nelson, Tony Lamansky, Kevin Meyer, Dan Schill, Cody Mallet, Debi Jensen, Ryan Schiferl, and Forrest Bohlen for assisting with field data collection and fish clipping. I would like to thank John Rankin and the staff at Cabinet Gorge Fish Hatchery for egg collection and their assistance in pressure treating fish for sterilization. I would also like to thank both Jaime Mitchell and Joel Patterson and the staff at McCall Fish Hatchery for their assistance rearing, clipping, and releasing fish. I also thank Ryan Hardy and Kristin Wright for editing this report. Funding for this work was provided by anglers and boaters through their purchase of Idaho fishing licenses, tags, and permits, and from federal excise taxes on fishing equipment and boat fuel through the Sport Fish Restoration Program.

45
Table 5. Stocking locations for diploid (2N) and triploid (3N) Westslope Cutthroat Trout in 2011 and 2013.
IDFG Region Lake Name Treatment
Number of Fish Stocked
Lake Surface Hectares
Stocking Density (fish/Ha)
2 Hurst L 2N 500 1.36 367.62 Mirror L 2N 500 2.10 238.12 Kelly L #03 (Kelly #4 Upper) 2N 500 2.75 181.82 Trilby L #01 (Low er) 2N 500 5.34 93.62 Saddle Lake 2N 500 4.93 101.42 Burnt Knob L (Low er) 2N 500 1.47 340.1
3M Six Basin L #02 2N 1000 7.70 129.93M Black L 2N 2500 10.45 239.23M Upper California L 2N 500 0.65 769.23M Pete Creek L #03 2N 500 0.71 704.23M Kimberly L #02 2N 750 1.18 635.63M Union L 2N 1000 3.37 296.73M Tule L 2N 500 3.51 142.53M Creek L 2N 500 2.41 207.53M Hidden L 2N 1000 4.45 224.73M Tw enty Mile L #02 (East) 2N 1000 6.93 144.32 Wiseboy L (Low er) 3N 500 1.13 442.52 Crescent L 3N 500 2.27 220.32 Mirror L 3N 500 3.28 152.42 Burnt Knob L (Upper) 3N 500 1.15 434.82 Trilby L #03 (Upper) 3N 500 5.94 84.22 Lake Creek L #02 (South) 3N 1000 7.52 133.02 Spread Point L (Goodman) 3N 1000 9.27 107.9
3M Six Basin L #01 3N 500 1.55 322.63M Satan L 3N 1500 2.01 746.33M Tw in L #02 3N 500 2.57 194.63M Middle California L 3N 1000 0.90 1111.13M Bear L 3N 1000 1.77 565.03M Cooks L 3N 1000 2.31 432.93M Pete Creek L #02 3N 500 2.67 187.33M Tw enty Mile L #01 (North) 3N 1000 6.55 152.7
2 East Maude Lake 2N 500 1.92 260.42 Mud Lake 2N 500 1.83 273.22 Fire Lake 2N 500 1.07 467.32 Mecca L (3 Links West) 2N 500 3.82 130.9
3M Lost Lake 2N 1000 1.87 534.83M Fish Lake #1 2N 700 2.77 252.73M Quartz Lake #1 2N 500 0.86 581.43M Tamarack Creek Lake #1 2N 500 1.93 259.13M Upper Pistol Lake 2N 1000 6.05 165.33M Rice Lake (Blue Point) 2N 500 2.22 225.23M Morehead Lake 2N 500 3.29 152.02 Maude Lake (West) 3N 500 2.53 197.62 Surprise Creek #4 (Seven L) 3N 500 1.61 310.62 Chimney (Florence) Lake 3N 500 12.08 41.42 Neck Island (3 Links North) 3N 500 4.42 113.1
3M Hidden Lake 3N 500 4.06 123.23M Fish Lake #3 3N 700 3.02 231.83M Quartz Lake #5 3N 500 0.68 735.33M Tamarack Creek Lake #3 3N 500 0.35 1428.63M Curtis Creek Lake 3N 1000 4.3 232.63B Bernard Lake #01 3N 1000 7.06 141.63B Honeymoon Lake 3N 500 1.58 316.5
2011 Stocking
2013 Stocking

46
Figure 10. Catch per unit effort (fish/net-hour) of diploid and triploid Westslope Cutthroat Trout vs. stocking density (fish/acre) for all study waters stocked in 2011 and sampled in 2014.

47
LITERATURE CITED
Adams, S. B., C. A. Frissell, and B. E. Rieman. 2001. Geography of invasions in mountain streams: consequences of headwater lake fish introductions. Ecosystems 4: 296-307.
Brock, I. V., P. A. Hansen, D. N. McBride, and A. C. Havens. 1994. Culture and performance of
triploid rainbow trout in Alaska. Transactions of the North American Wildlife and Natural Resources Conference 59:263-273.
Dillon, J. C., D. J. Schill, and D. M. Teuscher. 2000. Relative return of triploid and diploid
Rainbow Trout stocked in eighteen Idaho streams. North American Journal of Fisheries Management. 20(1):1-9.
Fredericks, J., M. Liter, N. Horner, and C. Corsi. 2002. Federal aid in fish restoration 1999 job
performance report. IDFG, Annual Report 01-11. Boise. Frew, T. 2008. Resident fish hatcheries 2008 annual report. Idaho Department of Fish and
Game, Annual Report 09-112, Boise. IDFG (Idaho Department of Fish and Game). 2007. Fisheries Management Plan 2007-20012.
Idaho Department of Fish and Game. Boise. Johnston, N. T., E. A. Parkinson, and K. Tsumura. 1993. Longevity and growth of hormone-
sterilized kokanee. North American Journal of Fisheries Management 13:284-290. Koenig, M. K., J. R. Kozfkay, K. A. Meyer and D. J. Schill. 2011. Performance of diploid and
triploid rainbow trout stocked in Idaho alpine lakes, North American Journal of Fisheries Management 31: 124-133.
Kozfkay, J. R., J. C. Dillon, and D. J. Schill. 2006. Routine use of sterile fish in salmonid sport
fisheries. Fisheries 31(8):392-401. Meyer, K. A., and D. J. Schill. 2007. Multistate high mountain lake summit. IDFG, Annual Report
07-55. Boise. Parkinson, E. A., and K. Tsumura. 1988. Growth and survival of hormone-sterilized coho
Oncorhynchus kisutch and kokanee salmon O. nerka in a lacustrine environment. Canadian Journal of Fisheries and Aquatic Sciences 45:1490-1494.
Piper, R. G., I. B. McElwain, L. E. Orme, J. P. McCraren, L. G. Fowler, and J. R. Leonard. 1982.
Fish hatchery management. U.S. Fish and Wildlife Service, Washington, D.C. Rutz, D. S., and C. C. Baer. 1996. Comparative performance of stocked mixed-sex and all-
female rainbow trout and triploid coho salmon in landlocked lakes in Southcentral Alaska, 1994 and 1995. Alaska Department of Fish and Game, Fishery Data Series No. 96-23, Anchorage.
Simon, D. C., C. G. Scalet, and J. C. Dillon. 1993. Field performance of triploid and diploid
rainbow trout in South Dakota ponds. North American Journal of Fisheries Management 13:134-140.

48
Warrillow, J. A., D. C. Josephson, W. D. Youngs, and C. C. Krueger. 1997. Differences in sexual maturity and fall emigration between diploid and triploid brook trout Salvelinus fontinalis in an Adirondack lake. Canadian Journal of Fisheries and Aquatic Sciences 54:1808-1812.
WGF (Wyoming Game and Fish Department). 2002. Annual progress report for projects in the
2001 work schedule. Wyoming Game and Fish Department, Cheyenne.

49
APPENDICES

50
Appendix A. Harvest and total catch of tagged hatchery catchable Rainbow Trout released in 2011 and 2012 by water and IDFG region. Harvest and catch estimates for each water represent the average rates for all releases within that year. For treatment- and date-specific return rates by water, see appropriate yearly Hatchery Trout Evaluation Reports.
Region Water BodyWater Surface
Area (km2)Harvest Estimate
Catch Estimate
Harvest Estimate
Catch Estimate
Bull Moose Lake 33.5% 40.5% - -Calder Pond - - 5.7% 5.7%
Clee Creek Pond - - 14.1% 22.6%Crystal Lake 0.043 5.0% 5.9% - -
Day Rock Pond - - 82.6% 96.8%Fernan Lake 1.377 5.8% 8.8% 22.9% 27.2%
Freeman Lake 16.2% 17.4% - -Gold Creek Pond - - 0.0% 0.0%
Hauser Lake 2.183 7.8% 9.0% - -Hayden Lake 24.6% 36.1% - -Jewel Lake 64.3% 71.3% - -
Lucky Friday Pond - - 46.0% 48.9%Post Falls Park Pond 0.002 - - 53.3% 72.8%
Robinson Lake 31.1% 38.0% - -Smith Lake 39.1% 41.4% - -
Steamboat Pond - - 11.3% 11.3%Deer Creek Reservoir 0.259 11.2% 12.6% 23.4% 25.5%
Deyo Reservoir 0.208 - - - -Dworshak Reservoir 59.318 11.4% 13.1% - -Elk Creek Reservoir 0.306 35.9% 49.2% 23.3% 31.0%
Hordeman Pond 0.003 42.0% 43.5% - -Lake Waha - - 14.1% 16.9%Mann Lake 0.392 17.4% 29.3% 16.2% 20.8%
Moose Creek Reservoir 0.106 36.3% 45.4% 20.6% 26.9%Palouse River Dredge Pond 18.4% 18.4% - -
Robinson Pond 0.009 52.2% 70.1% - -Snake River Levee Pond 50.9% 69.5% - -
Soldier's Meadow Reservoir 0.454 - - 6.5% 6.5%Spring Valley Reservoir 0.192 61.0% 69.2% 32.0% 36.3%
Winchester Lake 0.348 43.5% 57.3% 32.5% 38.1%
2
2012 Releases2011 Releases
1
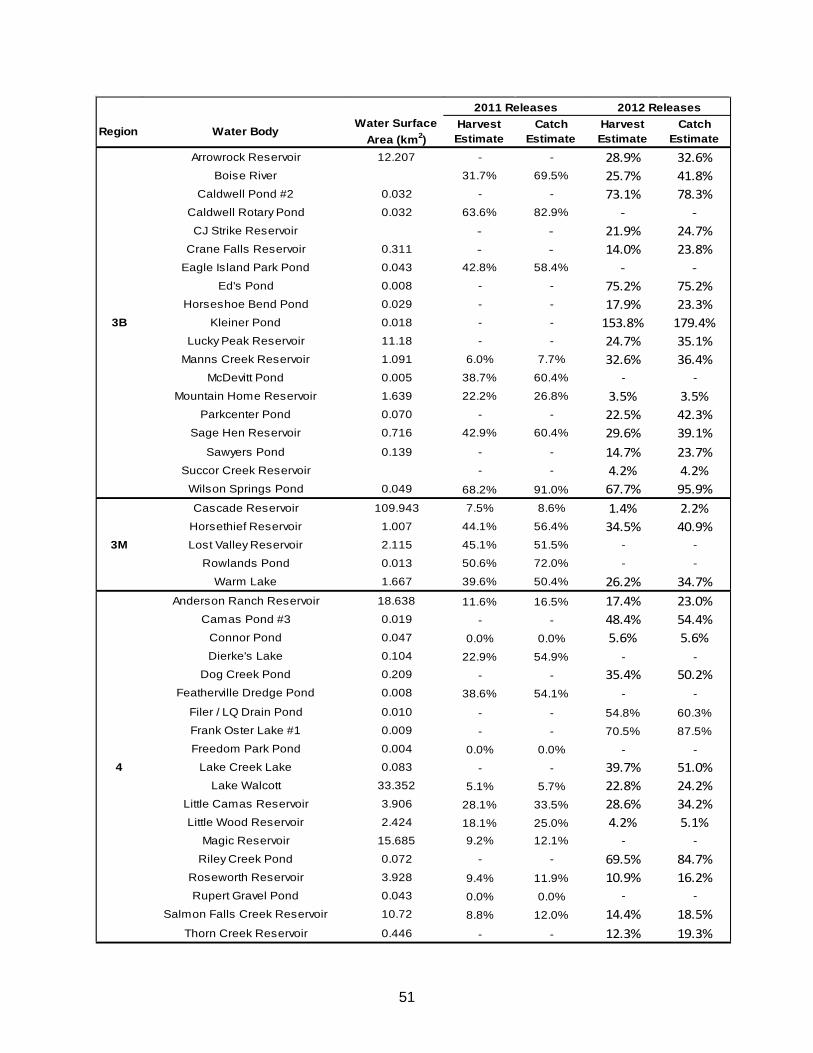
51
Region Water BodyWater Surface
Area (km2)Harvest Estimate
Catch Estimate
Harvest Estimate
Catch Estimate
Arrowrock Reservoir 12.207 - - 28.9% 32.6%Boise River 31.7% 69.5% 25.7% 41.8%
Caldwell Pond #2 0.032 - - 73.1% 78.3%Caldwell Rotary Pond 0.032 63.6% 82.9% - -CJ Strike Reservoir - - 21.9% 24.7%
Crane Falls Reservoir 0.311 - - 14.0% 23.8%Eagle Island Park Pond 0.043 42.8% 58.4% - -
Ed's Pond 0.008 - - 75.2% 75.2%Horseshoe Bend Pond 0.029 - - 17.9% 23.3%
Kleiner Pond 0.018 - - 153.8% 179.4%Lucky Peak Reservoir 11.18 - - 24.7% 35.1%
Manns Creek Reservoir 1.091 6.0% 7.7% 32.6% 36.4%McDevitt Pond 0.005 38.7% 60.4% - -
Mountain Home Reservoir 1.639 22.2% 26.8% 3.5% 3.5%Parkcenter Pond 0.070 - - 22.5% 42.3%
Sage Hen Reservoir 0.716 42.9% 60.4% 29.6% 39.1%Sawyers Pond 0.139 - - 14.7% 23.7%
Succor Creek Reservoir - - 4.2% 4.2%Wilson Springs Pond 0.049 68.2% 91.0% 67.7% 95.9%Cascade Reservoir 109.943 7.5% 8.6% 1.4% 2.2%
Horsethief Reservoir 1.007 44.1% 56.4% 34.5% 40.9%Lost Valley Reservoir 2.115 45.1% 51.5% - -
Rowlands Pond 0.013 50.6% 72.0% - -
Warm Lake 1.667 39.6% 50.4% 26.2% 34.7%Anderson Ranch Reservoir 18.638 11.6% 16.5% 17.4% 23.0%
Camas Pond #3 0.019 - - 48.4% 54.4%Connor Pond 0.047 0.0% 0.0% 5.6% 5.6%Dierke's Lake 0.104 22.9% 54.9% - -
Dog Creek Pond 0.209 - - 35.4% 50.2%Featherville Dredge Pond 0.008 38.6% 54.1% - -
Filer / LQ Drain Pond 0.010 - - 54.8% 60.3%Frank Oster Lake #1 0.009 - - 70.5% 87.5%Freedom Park Pond 0.004 0.0% 0.0% - -
Lake Creek Lake 0.083 - - 39.7% 51.0%Lake Walcott 33.352 5.1% 5.7% 22.8% 24.2%
Little Camas Reservoir 3.906 28.1% 33.5% 28.6% 34.2%Little Wood Reservoir 2.424 18.1% 25.0% 4.2% 5.1%
Magic Reservoir 15.685 9.2% 12.1% - -
Riley Creek Pond 0.072 - - 69.5% 84.7%Roseworth Reservoir 3.928 9.4% 11.9% 10.9% 16.2%Rupert Gravel Pond 0.043 0.0% 0.0% - -
Salmon Falls Creek Reservoir 10.72 8.8% 12.0% 14.4% 18.5%Thorn Creek Reservoir 0.446 - - 12.3% 19.3%
4
2011 Releases 2012 Releases
3B
3M

52
Region Water BodyWater Surface
Area (km2)Harvest Estimate
Catch Estimate
Harvest Estimate
Catch Estimate
American Falls Reservoir 223.691 12.4% 17.1% 12.3% 14.6%Bear River - - 11.0% 28.1%
Blackfoot Reservoir 68.356 35.8% 43.3% 7.9% 10.9%Chesterfield Reservoir 5.041 5.8% 9.0% 3.2% 6.7%Deep Creek Reservoir 0.505 18.8% 32.0% 7.1% 8.5%Devils Creek Reservoir 0.344 25.3% 35.7% 12.5% 16.0%
Birch Creek - - 39.6% 52.9%Blue Creek Reservoir - - 41.1% 43.9%East Harriman Pond - - 46.4% 43.3%
Henry's Fork - - 14.2% 20.2%Island Park Reservoir 30.465 25.0% 30.8% 2.2% 3.4%
Jim Moore Pond 0.543 - - 25.4% 36.7%Mackay Reservoir 4.744 36.0% 53.1% 18.4% 23.5%
Rigby Lake 0.135 - - 40.4% 53.9%Roberts Gravel Pond - - 47.9% 50.8%
Ryder Park Pond 0.005 89.1% 126.2% 59.4% 69.3%Snake River (Upper) R6 - - 34.0% 38.8%
Star Hope Lake 0.005 - - 0.0% 0.0%Stoddard Mill Pond - - 32.4% 56.6%Trail Creek Pond 0.007 52.9% 71.8% - -
Hyde Pond 0.004 - - 16.9% 46.1%Kids Creek Pond 0.002 25.5% 47.4% - -
Salmon River 10.9% 24.3% 15.3% 19.8%Stanley Lake 0.713 15.8% 26.2% 14.1% 26.2%
5
6
7
2011 Releases 2012 Releases

53
Prepared by: Approved by: IDAHO DEPARTMENT OF FISH AND GAME John Cassinelli Daniel J. Schill Senior Fisheries Research Biologist Fisheries Research Manager James P. Fredericks, Chief Bureau of Fisheries