Projeconofpaddyproduconusing cropmodel)Aquarop4.0basedon ... fileOutline! • Introduc.on! •...
23
Projec’on of paddy produc’on using crop model Aquarop 4.0 based on RCP6.0 scenario in Java Island Dara Kasihairani 1 , Dodo Gunawan 2 1 School of Meteorology Climatology and Geophysics (STMKG) Jl. Perhubungan 1 No.5 Bintaro, Tangerang, Indonesia 2 Meteorological Climatology and Geophysical Agency Jl. Angkasa 1 No. 2 Kemayoran, Jakarta, Indonesia STMKG
-
Upload
duongthien -
Category
Documents
-
view
214 -
download
0
Transcript of Projeconofpaddyproduconusing cropmodel)Aquarop4.0basedon ... fileOutline! • Introduc.on! •...
Projec'on of paddy produc'on using crop model Aquarop 4.0 based on RCP-‐6.0 scenario in Java Island
Dara Kasihairani 1, Dodo Gunawan 2
1 School of Meteorology Climatology and Geophysics (STMKG)
Jl. Perhubungan 1 No.5 Bintaro, Tangerang, Indonesia 2 Meteorological Climatology and Geophysical Agency Jl. Angkasa 1 No. 2 Kemayoran, Jakarta, Indonesia
STMKG
Outline • Introduc.on • Data and Method • Result and Analysis • Conclusion
School of Meteorology Climatology and Geophysics, Indonesia
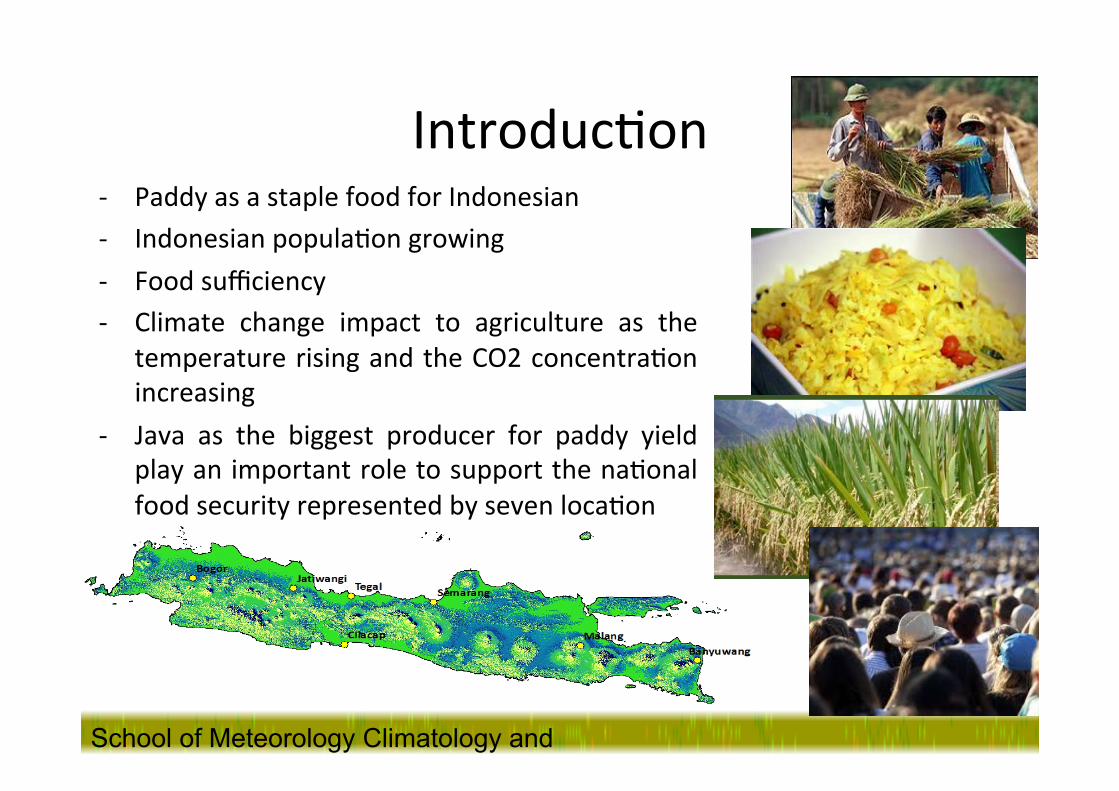
Introduc.on -‐ Paddy as a staple food for Indonesian -‐ Indonesian popula.on growing -‐ Food sufficiency -‐ Climate change impact to agriculture as the
temperature rising and the CO2 concentra.on increasing
-‐ Java as the biggest producer for paddy yield play an important role to support the na.onal food security represented by seven loca.on
School of Meteorology Climatology and Geophysics, Indonesia
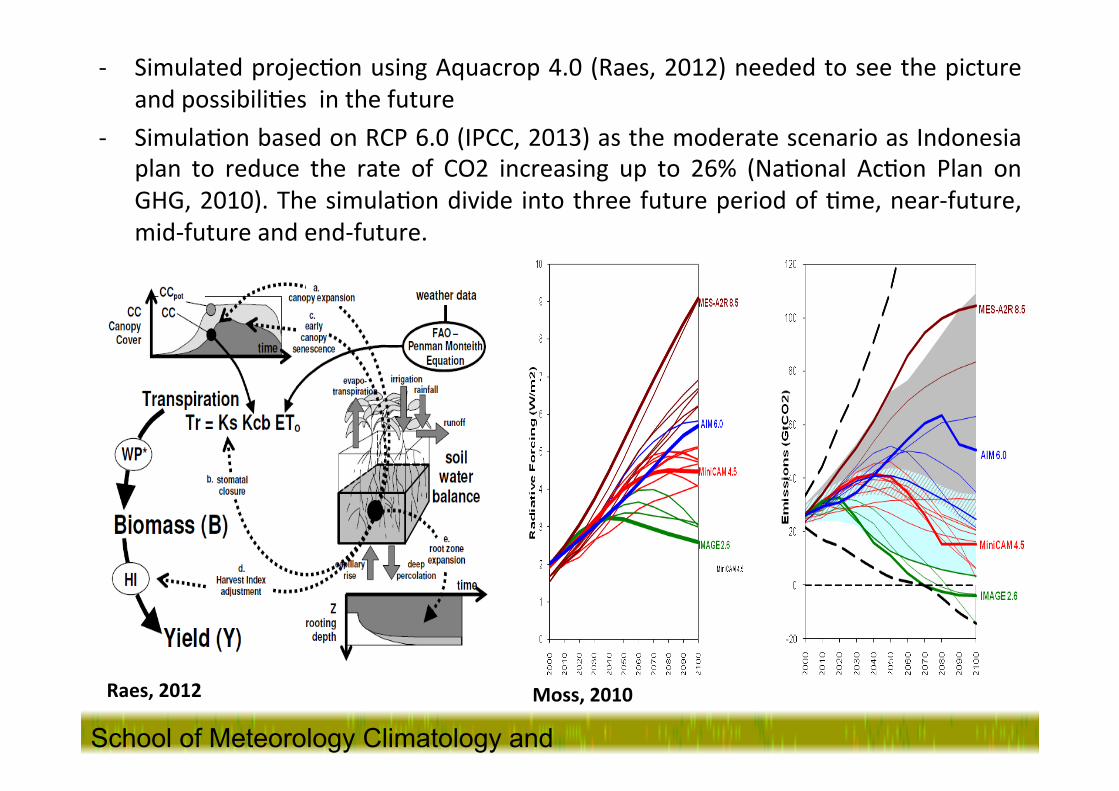
-‐ Simulated projec.on using Aquacrop 4.0 (Raes, 2012) needed to see the picture and possibili.es in the future
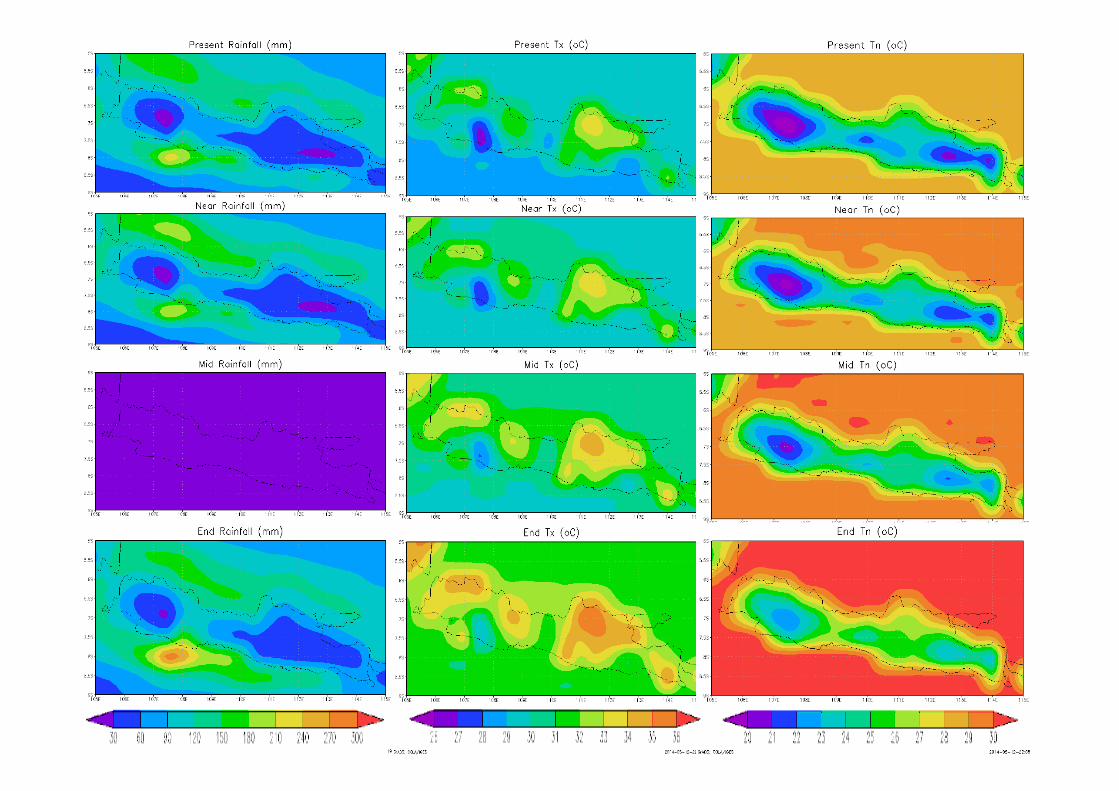
-‐ Simula.on based on RCP 6.0 (IPCC, 2013) as the moderate scenario as Indonesia plan to reduce the rate of CO2 increasing up to 26% (Na.onal Ac.on Plan on GHG, 2010). The simula.on divide into three future period of .me, near-‐future, mid-‐future and end-‐future.
School of Meteorology Climatology and Geophysics, Indonesia
Moss, 2010 Raes, 2012
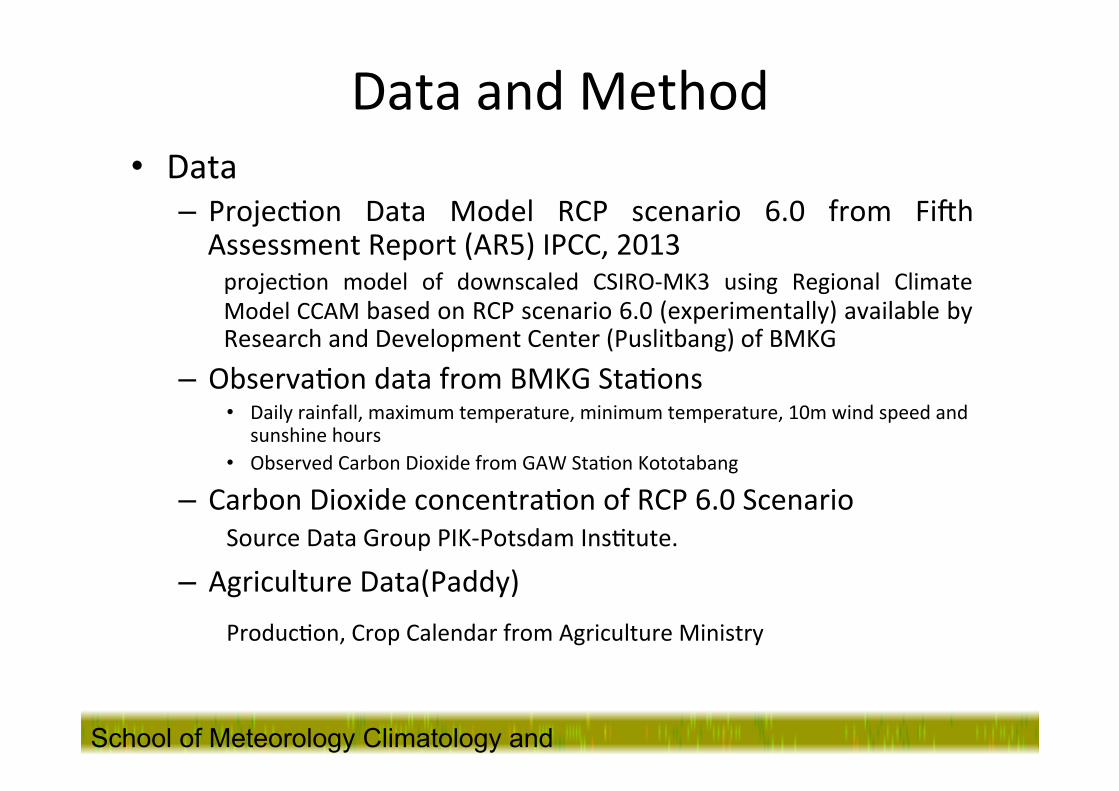
Data and Method • Data
– Projec.on Data Model RCP scenario 6.0 from FiVh Assessment Report (AR5) IPCC, 2013 projec.on model of downscaled CSIRO-‐MK3 using Regional Climate Model CCAM based on RCP scenario 6.0 (experimentally) available by Research and Development Center (Puslitbang) of BMKG
– Observa.on data from BMKG Sta.ons • Daily rainfall, maximum temperature, minimum temperature, 10m wind speed and
sunshine hours • Observed Carbon Dioxide from GAW Sta.on Kototabang
– Carbon Dioxide concentra.on of RCP 6.0 Scenario Source Data Group PIK-‐Potsdam Ins.tute.
– Agriculture Data(Paddy) Produc.on, Crop Calendar from Agriculture Ministry
School of Meteorology Climatology and Geophysics, Indonesia
School of Meteorology Climatology and Geophysics, Indonesia
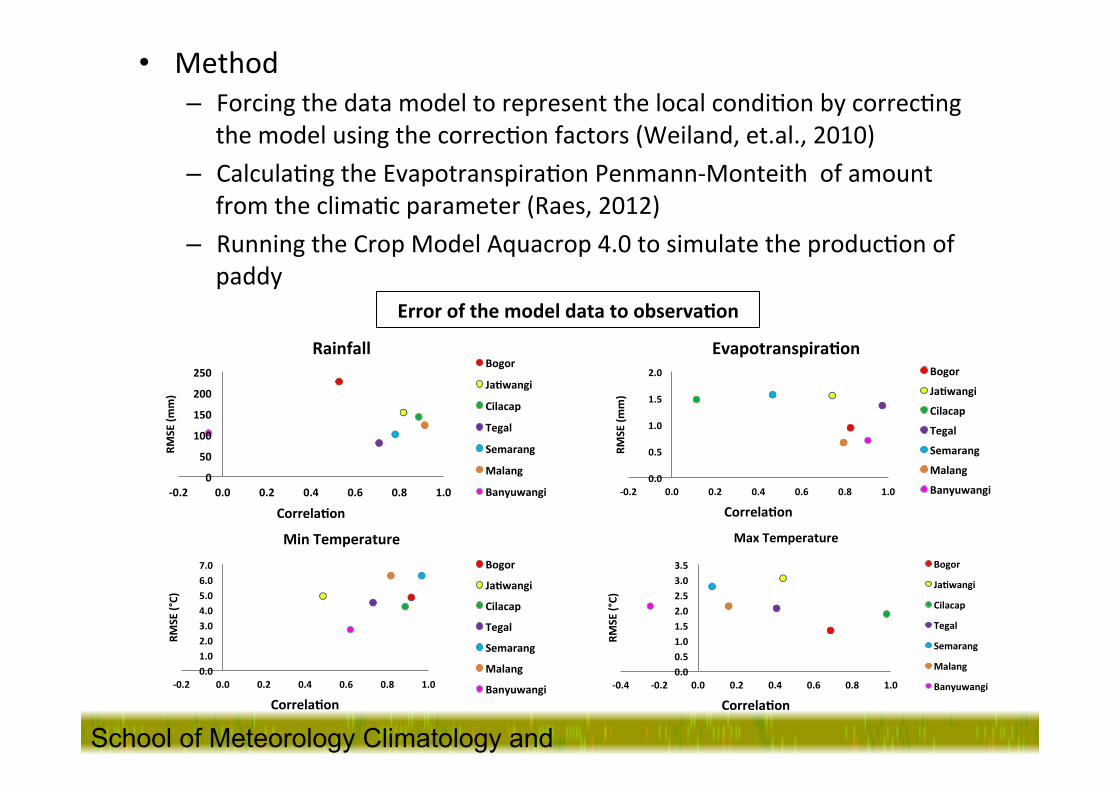
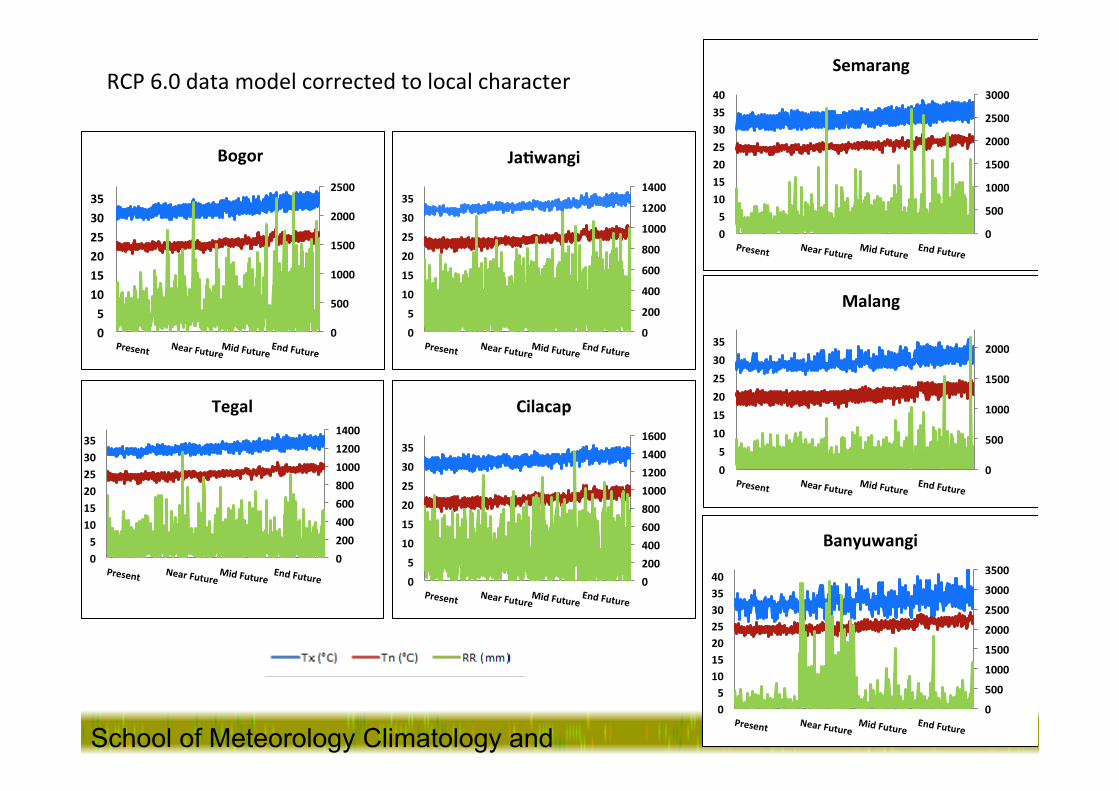
• Method – Forcing the data model to represent the local condi.on by correc.ng
the model using the correc.on factors (Weiland, et.al., 2010) – Calcula.ng the Evapotranspira.on Penmann-‐Monteith of amount
from the clima.c parameter (Raes, 2012) – Running the Crop Model Aquacrop 4.0 to simulate the produc.on of
paddy
0
50
100
150
200
250
-‐0.2 0.0 0.2 0.4 0.6 0.8 1.0
RMSE (m
m)
Correla'on
Rainfall Bogor
Ja'wangi
Cilacap
Tegal
Semarang
Malang
Banyuwangi
0.0 0.5 1.0 1.5 2.0 2.5 3.0 3.5
-‐0.4 -‐0.2 0.0 0.2 0.4 0.6 0.8 1.0
RMSE (°C)
Correla'on
Max Temperature
Bogor
Ja'wangi
Cilacap
Tegal
Semarang
Malang
Banyuwangi 0.0 1.0 2.0 3.0 4.0 5.0 6.0 7.0
-‐0.2 0.0 0.2 0.4 0.6 0.8 1.0
RMSE (°C)
Correla'on
Min Temperature Bogor
Ja'wangi
Cilacap
Tegal
Semarang
Malang
Banyuwangi
0.0
0.5
1.0
1.5
2.0
-‐0.2 0.0 0.2 0.4 0.6 0.8 1.0
RMSE (m
m)
Correla'on
Evapotranspira'on Bogor
Ja'wangi
Cilacap
Tegal
Semarang
Malang
Banyuwangi
Error of the model data to observa'on

RESULT AND
DISCUSSION
School of Meteorology Climatology and Geophysics, Indonesia
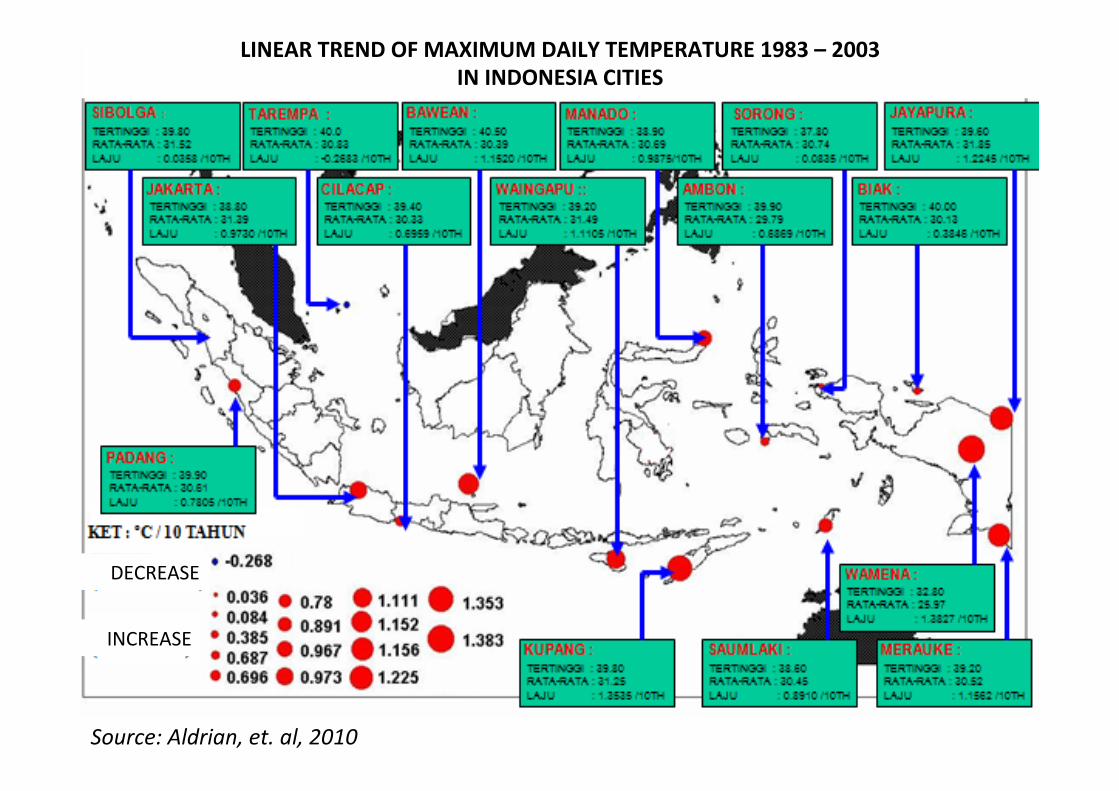
LINEAR TREND OF MAXIMUM DAILY TEMPERATURE 1983 – 2003 IN INDONESIA CITIES
DECREASE
INCREASE
Source: Aldrian, et. al, 2010
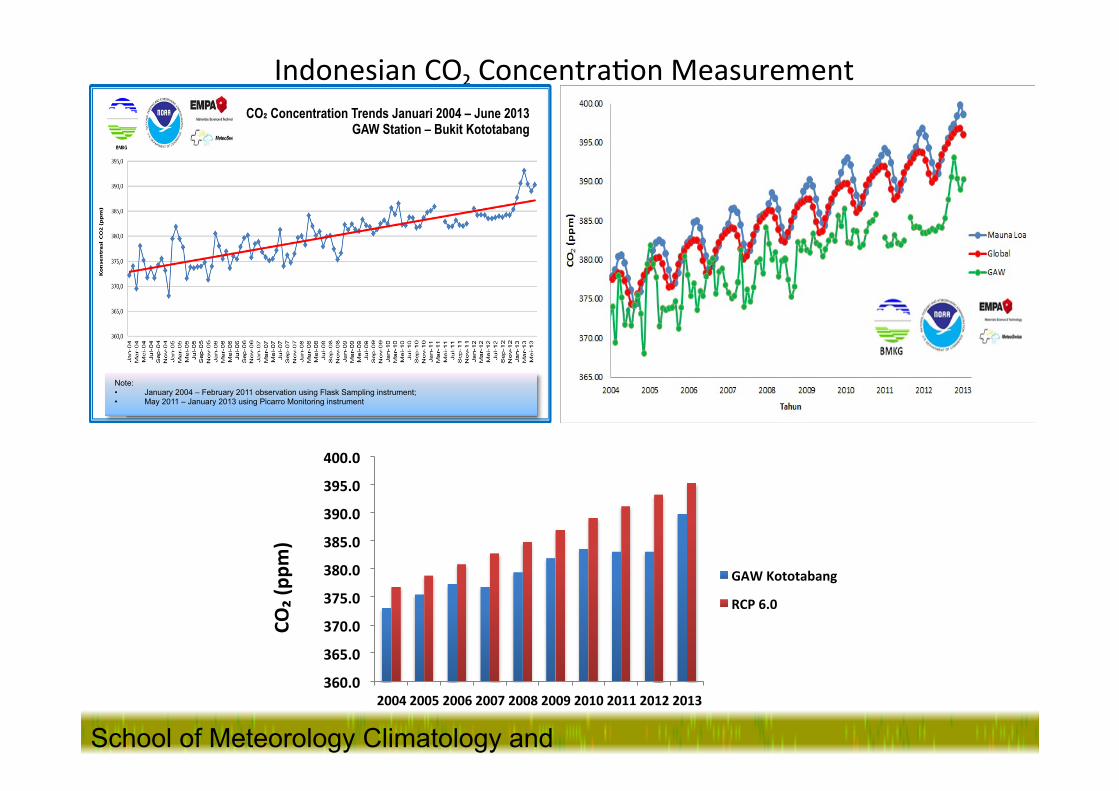
Indonesian CO₂ Concentra.on Measurement
School of Meteorology Climatology and Geophysics, Indonesia
CO₂ Concentration Trends Januari 2004 – June 2013 GAW Station – Bukit Kototabang
Note: • January 2004 – February 2011 observation using Flask Sampling instrument; • May 2011 – January 2013 using Picarro Monitoring instrument
360.0
365.0
370.0
375.0
380.0
385.0
390.0
395.0
400.0
2004 2005 2006 2007 2008 2009 2010 2011 2012 2013
CO₂ (pp
m)
GAW Kototabang
RCP 6.0
Java’s climate figure in The RCP 6.0 scenario
School of Meteorology Climatology and Geophysics, Indonesia
School of Meteorology Climatology and Geophysics, Indonesia
School of Meteorology Climatology and Geophysics, Indonesia
RCP 6.0 data model corrected to local character
0
500
1000
1500
2000
2500
0 5 10 15 20 25 30 35
Present Near Future Mid Future
End Future
Bogor
0
200
400
600
800
1000
1200
1400
0
5
10
15
20
25
30
35
Present Near Future Mid Future
End Future
Ja'wangi
0 200 400 600 800 1000 1200 1400 1600
0
5
10
15
20
25
30
35
Present Near Future Mid Future
End Future
Cilacap
0
500
1000
1500
2000
0 5 10 15 20 25 30 35
Present Near Future Mid Future
End Future
Malang
0
500
1000
1500
2000
2500
3000
3500
0 5 10 15 20 25 30 35 40
Present Near Future Mid Future
End Future
Banyuwangi 0 200 400 600 800 1000 1200 1400
0 5 10 15 20 25 30 35
Present Near Future Mid Future
End Future
Tegal
0
500
1000
1500
2000
2500
3000
0 5 10 15 20 25 30 35 40
Present Near Future Mid Future
End Future
Semarang
School of Meteorology Climatology and Geophysics, Indonesia
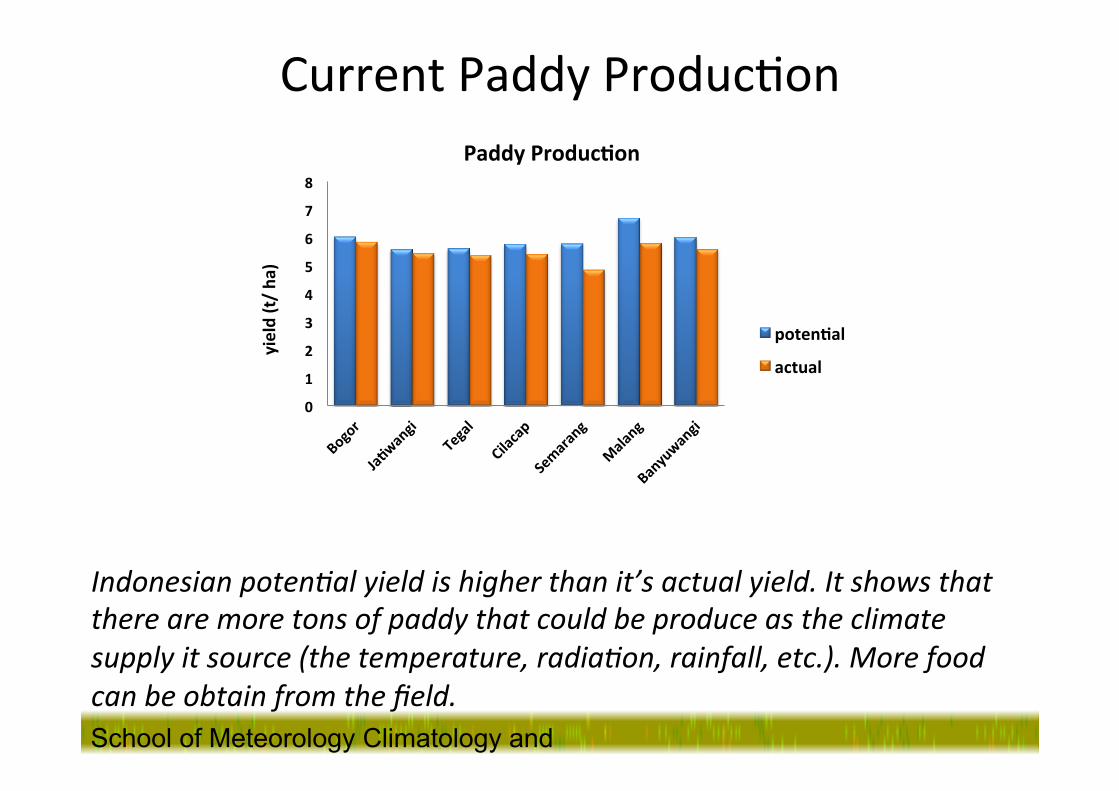
Current Paddy Produc.on
Indonesian potenKal yield is higher than it’s actual yield. It shows that there are more tons of paddy that could be produce as the climate supply it source (the temperature, radiaKon, rainfall, etc.). More food can be obtain from the field.
0
1
2
3
4
5
6
7
8
yield (t/ ha
)
Paddy Produc'on
poten'al
actual
School of Meteorology Climatology and Geophysics, Indonesia
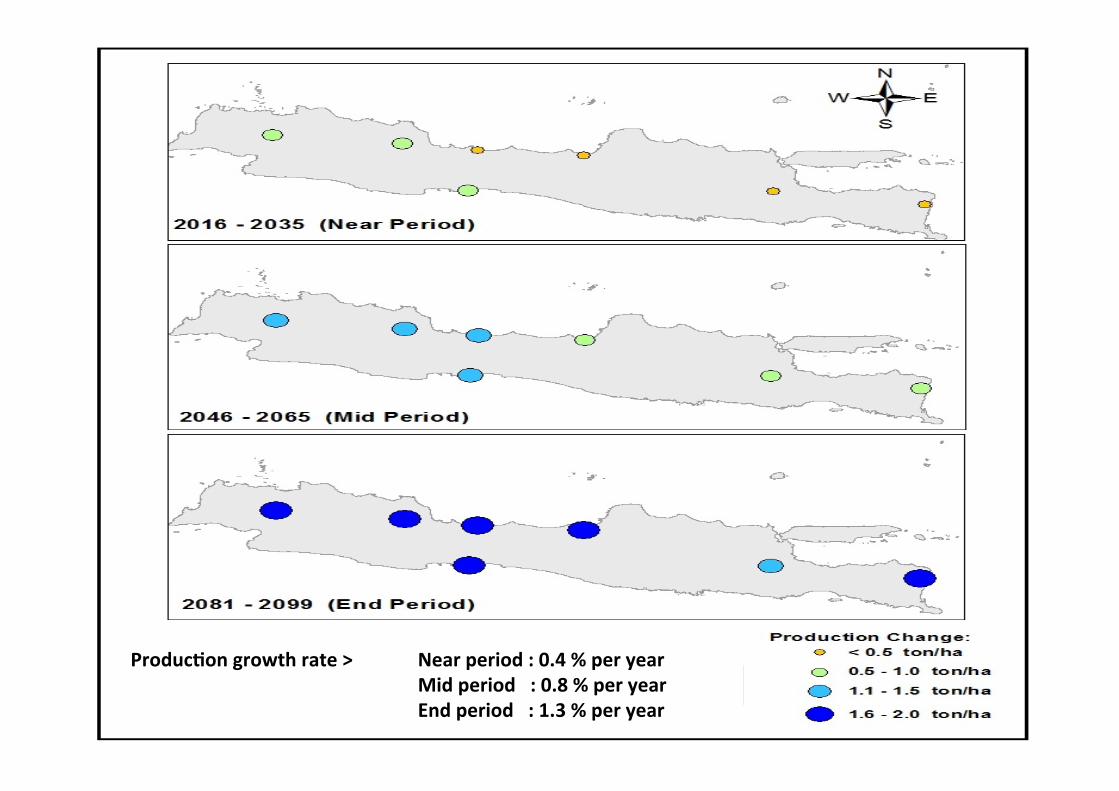
Produc'on growth rate > Near period : 0.4 % per year Mid period : 0.8 % per year End period : 1.3 % per year
School of Meteorology Climatology and Geophysics, Indonesia
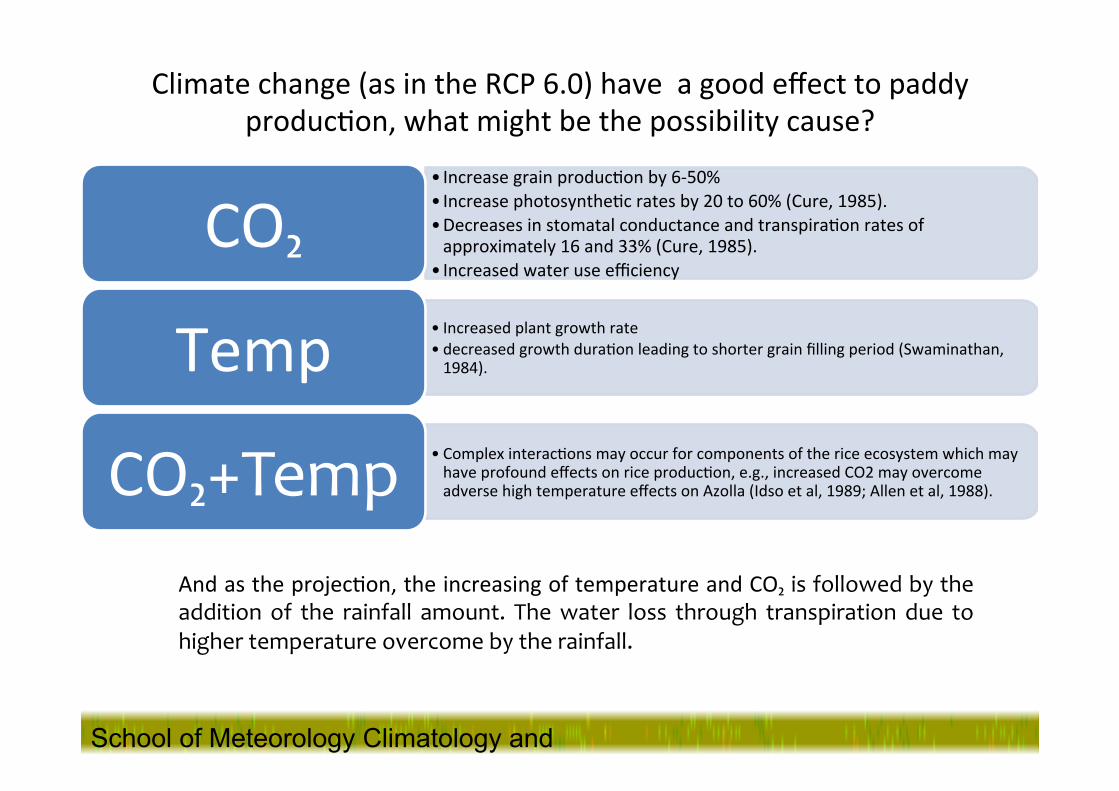
Climate change (as in the RCP 6.0) have a good effect to paddy produc.on, what might be the possibility cause?
• Increase grain produc.on by 6-‐50% • Increase photosynthe.c rates by 20 to 60% (Cure, 1985). • Decreases in stomatal conductance and transpira.on rates of approximately 16 and 33% (Cure, 1985).
• Increased water use efficiency CO₂
• Increased plant growth rate • decreased growth dura.on leading to shorter grain filling period (Swaminathan, 1984). Temp
• Complex interac.ons may occur for components of the rice ecosystem which may have profound effects on rice produc.on, e.g., increased CO2 may overcome adverse high temperature effects on Azolla (Idso et al, 1989; Allen et al, 1988). CO₂+Temp
And as the projec.on, the increasing of temperature and CO₂ is followed by the addition of the rainfall amount. The water loss through transpiration due to higher temperature overcome by the rainfall.
Uncertain.es of the Study
• The environment of agriculture might also change
• The variability of each season will affect the plants and the schedule of plan.ng (IFAP, 2008)
• The change of climate might also change the disease, pest and or outbreak pahern.
School of Meteorology Climatology and Geophysics, Indonesia
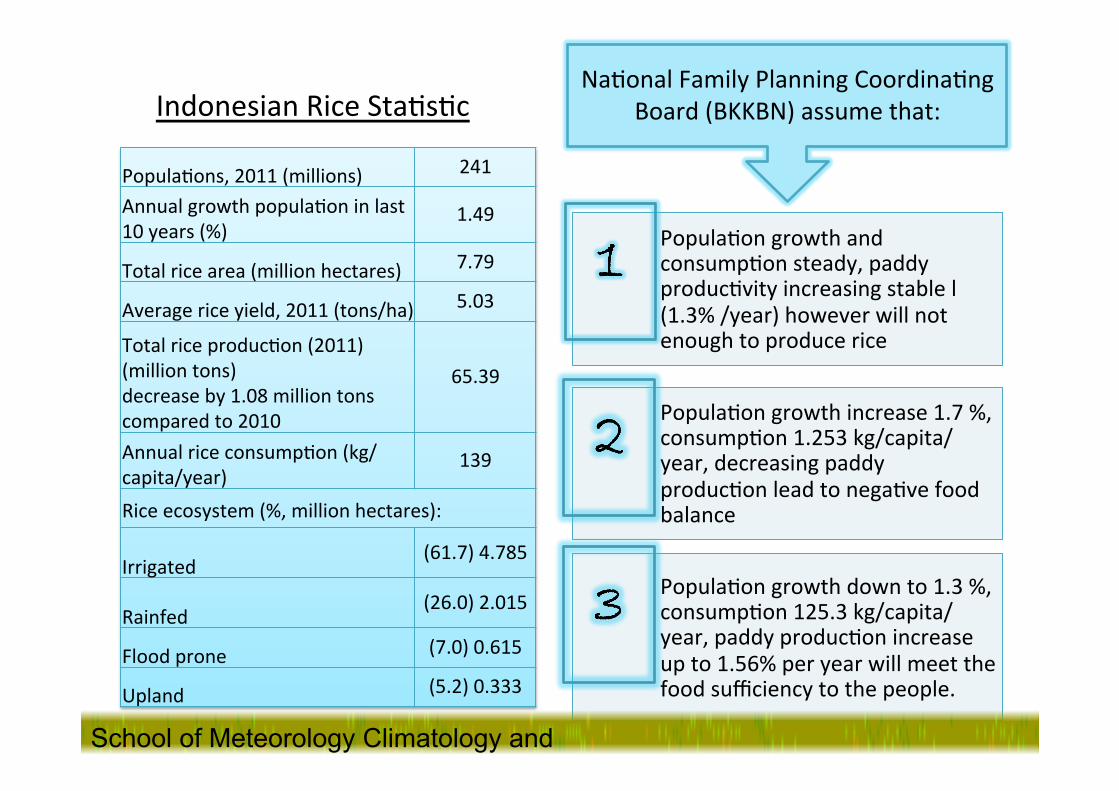
Popula.ons, 2011 (millions) 241
Annual growth popula.on in last 10 years (%)
1.49
Total rice area (million hectares) 7.79
Average rice yield, 2011 (tons/ha) 5.03
Total rice produc.on (2011) (million tons) decrease by 1.08 million tons compared to 2010
65.39
Annual rice consump.on (kg/capita/year)
139
Rice ecosystem (%, million hectares):
Irrigated (61.7) 4.785
Rainfed (26.0) 2.015
Flood prone (7.0) 0.615
Upland (5.2) 0.333
Indonesian Rice Sta.s.c
Popula.on growth and consump.on steady, paddy produc.vity increasing stable l (1.3% /year) however will not enough to produce rice
Popula.on growth increase 1.7 %, consump.on 1.253 kg/capita/year, decreasing paddy produc.on lead to nega.ve food balance
Popula.on growth down to 1.3 %, consump.on 125.3 kg/capita/year, paddy produc.on increase up to 1.56% per year will meet the food sufficiency to the people.
Na.onal Family Planning Coordina.ng Board (BKKBN) assume that:
Source: Ministry of Agriculture School of Meteorology Climatology and Geophysics, Indonesia
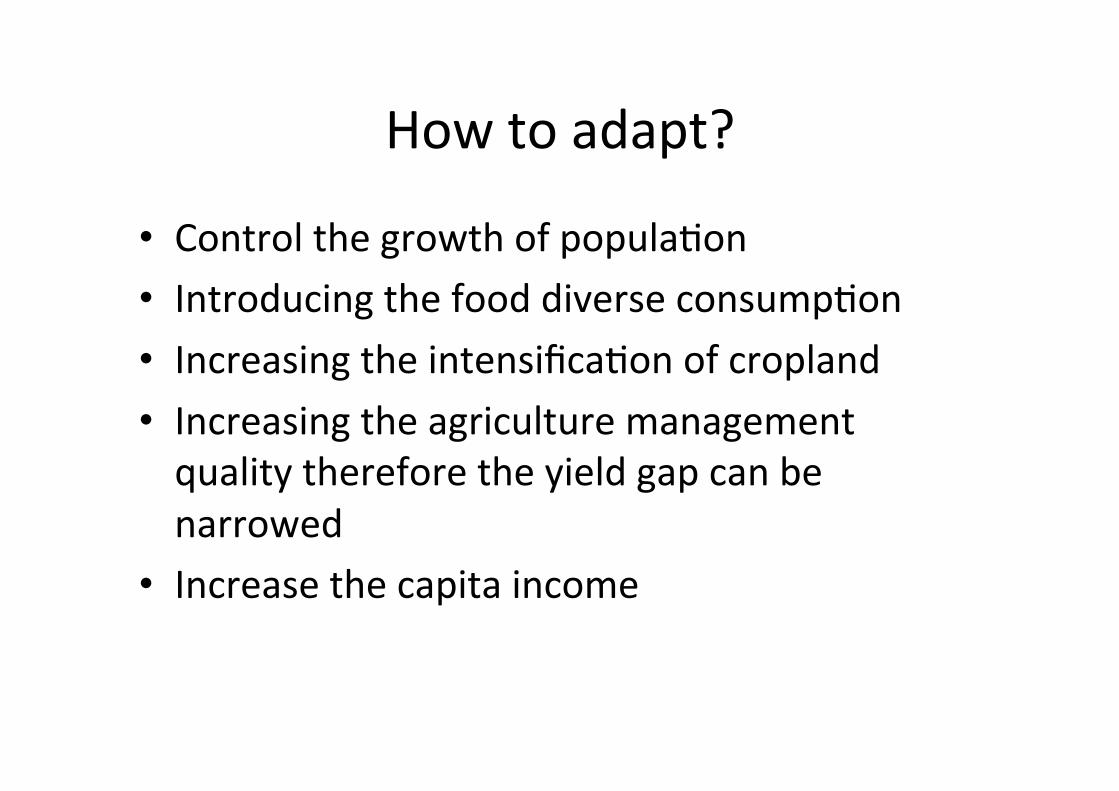
How to adapt?
• Control the growth of popula.on • Introducing the food diverse consump.on • Increasing the intensifica.on of cropland • Increasing the agriculture management quality therefore the yield gap can be narrowed
• Increase the capita income
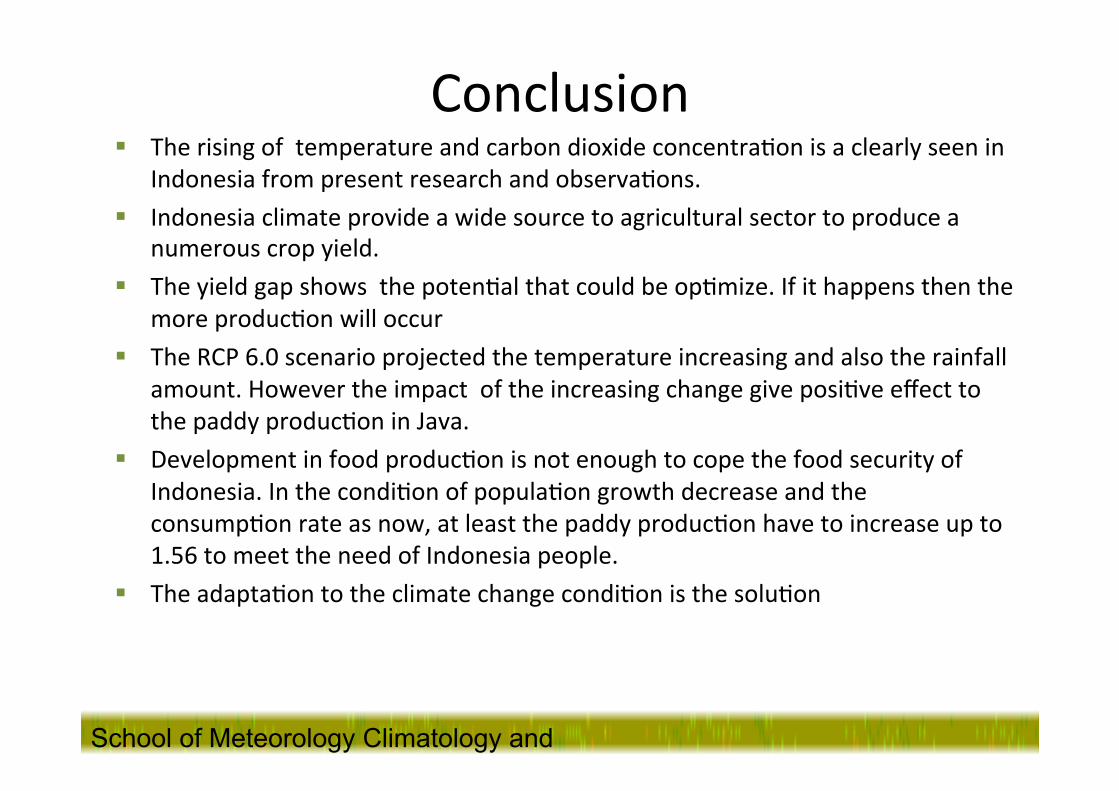
Conclusion § The rising of temperature and carbon dioxide concentra.on is a clearly seen in
Indonesia from present research and observa.ons. § Indonesia climate provide a wide source to agricultural sector to produce a
numerous crop yield. § The yield gap shows the poten.al that could be op.mize. If it happens then the
more produc.on will occur § The RCP 6.0 scenario projected the temperature increasing and also the rainfall
amount. However the impact of the increasing change give posi.ve effect to the paddy produc.on in Java.
§ Development in food produc.on is not enough to cope the food security of Indonesia. In the condi.on of popula.on growth decrease and the consump.on rate as now, at least the paddy produc.on have to increase up to 1.56 to meet the need of Indonesia people.
§ The adapta.on to the climate change condi.on is the solu.on
School of Meteorology Climatology and Geophysics, Indonesia

THANK YOU
School of Meteorology Climatology and Geophysics, Indonesia
References • Agriculture Ministry of Indonesia, hhp://aplikasi.deptan.go.id/bdsp/index.asp • Aldrian, Edvin, Mimin Karmini dan Budiman. 2011. Adaptasi dan MiKgasi Perubahan Iklim di Indonesia.
Pusat Perubahan Iklim dan Kualitas Udara, Kedepu.an Bidang Klimatologi, BMKG. BMKG, Jakarta. • Annex B. Glossary of Terms. 2007. IPCC. • Amien, Is.qlal, Popi Redjekiningrum, Budi Kar.wa and Woro Es.ningtyas. 1999. Simulated Rice Yields as
Affected by Interannual Climate Variability and Possible Climate Change in Java. Center for Soil and Agroclimate Research, Bogor, Indonesia.
• BKKBN. Analisis Dampak Kependudukan terhadap Ketahanan Pangan. Kajian Dampak Lingkungan, 2011/2012.
• BPS. hhp://www.bps.go.id/tnmn_pgn.php accessed27 November 2013. • FAO. hhp://faostat.fao.org/site/291/default.aspx accessed6 November 2013. • F. C. Sperna Weiland, L. P. H. van Beek, J. C. J. Kwadijk, and M. F. P. Bierkens. 2010. The Ability of A GCM-‐
Forced Hydrological Model to Reproduce Global Discharge Variability. Hydrology and Earth System Science Journal., 14, p. 1595-‐1621.
• Hardjowigeno, Sarwono, Fahmuddin Agus, A. Adimiharja, A. M. Fagi dan Wiwik H. 2004. Morfologi dan Klasifikasi Tanah Sawah. Pusat Peneli.an dan Pengembangan Tanah dan Agroklimat (Puslitbangtanak), Jawa Barat.
• Heddy, Suwasono. 2010. Agroekosistem: Permasalahan Lingkungan Pertanian Bagian Pertama. PT. RajaGrafindo Persada, Jakarta.
• Issue Brief p. 1-‐6. 2008. Climate Change: Impacts on Global Agriculture. WMO-‐IFAP, IFAP.
School of Meteorology Climatology and Geophysics, Indonesia
• IRRI Rice Knowledge Bank. www.knowledgebank.irri.org/ diakses tanggal 9 November 2013 • IPCC. hhp://www.ipcc.ch/ diakses tanggal 29 September 2013.
%20An%20Updated%20Descrip.on%20of%20the%20Conformal-‐Cubic%20Atmospheric%20Model.pdf • Na.onal Development Planning Board (BAPPENAS).Presiden.al Regula.on on Na.onal Ac.on Plan on
Greenhouse Gasses (Perpres RAN – GRK). 2010 • Makarim, A Karim dan E. Suharta.k. 2009. Morfologi dan Fisiologi Tanaman Padi. Balai Besar Peneli.an
Tanaman Padi. • McGregor, John L. dan R. Dix. An Updated Descrip.on of the Conformal-‐Cubic Atmospheric Model.
CSIRO. hhp://meteo.edu.vn/DATA/Books/High%20Resolu.on%20Numerical%20Modelling%20of%20the%20Atmosphere%20and%20Ocean/4Moss, Richard H., Jae A. Edmonds, Kathy A. Hibbard, Mar.n R. Manning, Steven K. Rose, Detlef P. van Vuuren, Timothy R. Carter, Seita Emori, Mikiko Kainuma, Tom Kram, Gerald A. Meehl, John F. B. Mitchell, Nebojsa Nakicenovic, Keywan Riahi, Steven J. Smith, Ronald J. Stouffer, Allison M. Thomson, John P. Weyant & Thomas J. Wilbanks. 2010. PERSPECTIVES : The Next GeneraKon of Scenarios for Climate Change Research and Assessment. Nature: Vol 463j11 February 2010jdoi:10.1038/nature08823.
• Novianto, Muhammad Addip. 2013. Study on Morphological Changes of Starch AccumulaKon in Indica Rice Grain Under High Temperature. Thesis: Master’s Program in Plant Produc.on Science Major in Biological Produc.on Science Graduate School of Agriculture, Ibaraki University, Japan.
• Olszyk, D. M., and K. T. Ingram. 1993. Effects of UV-‐B and Global Climate Change on Rice ProducKon: The EPA/IRRI CooperaKve Research Plan. The Philippines: Interna.onal Rice Research Ins.tute.
• Pujihar., Yulia, Junita Barus dan Bambang Wijayanto. 2008. Seri buku inovasi: TP/01/2008, Teknologi Budidaya P A D I. Balai Besar Pengkajian dan Pengembangan Teknologi Pertanian. Badan Peneli.an dan Pengembangan Pertanian.
School of Meteorology Climatology and Geophysics, Indonesia
• Raes, Dirk, Pasquale Steduto, Theodore C. Hsiao, and Elias Fereres. 2012. AquaCrop Version 4.0 Chapter 1. AquaCrop – FAO Crop-‐Water ProducKvity Model to Simulate Yield Response to Water, Reference Manual. FAO.
• Raes, Dirk. 2012. ETo Calculator: EvapotranspiraKon from A Reference Surface, Reference Manual Version 3.2. Food and Agriculture Organiza.on of the United Na.ons, Land and Water Division. FAO, Via delle Terme di Caracalla, Rome, Italy.
• Reichler, Thomas and Junsu Kim. 2008. How Well Do Coupled Models Simulate Today’s Climate?. American Meteorological Society Journals, March 2008, p. 303-‐311.
• RCP Concentra.on Calcula.ons and Data Final Version, background data, acknowledgements and further info. hhp://www.pik-‐potsdam.de/~mmalte/rcps/ diakses tanggal 16 Desember 2013.
• Schmidt, F., 1977. Variable fine mesh in spectral global model. Beitr. Phys. Atmos., 50, 211–217. • Steduto, P., D. Raes, T. C. Hsiao, E. Fereres, L. Heng, G. Izzi and J. Hoogeveen. 2011. AquaCrop: a
new model for crop predicKon under water deficit condiKons. Op.ons Méditerranéennes, 286 Series A, No. 80.
• Susandi, Armi, Mamad T. dan Irma Nurlela. 2008. Fenomena Perubahan Iklim dan Dampaknya Terhadap Ketahanan Pangan di Indonesia. Seminar Padi Nasional.
• Van Vuuren, D., K. Riahi, S. Smith, M. Meinshausen, Michael Mastrandrea and Richard Moss. 2009. RCP Extension White Paper. Task Group on Data and Scenarios for Impact and Climate Analysis (TGICA) of the IPCC. IPCC.
• Vergara, S.B. 1976. Physiological anf morphplogical adaptability of rice varieKes to climate. In Climate and Rice. IRRI, Philippines.
• WMO-‐No. 134. Guide to Agricultural Meteorological PracKces Updated in 2012.
School of Meteorology Climatology and Geophysics, Indonesia