Proj of Fm Final
86
1 : Managed by : Gujarat Law Society
Transcript of Proj of Fm Final
8/8/2019 Proj of Fm Final
http://slidepdf.com/reader/full/proj-of-fm-final 1/86
1
: Managed by :
Gujarat Law Society
8/8/2019 Proj of Fm Final
http://slidepdf.com/reader/full/proj-of-fm-final 2/86
2
Project report on:
Prepared by:- Practical study report on:
Mahindra and Mahindra limited
Prepared by:-
Zinzuwadia charmi c..
S.Y. B.B.A.
Roll no.-320
Submitted To:-
G.L.S. Institute of Business Administrative
´Prof. Swati Modiµ
8/8/2019 Proj of Fm Final
http://slidepdf.com/reader/full/proj-of-fm-final 3/86
3
PREFACE
TTr r uuee lleeaar r nniinngg hhaa p p p peennss oouutt oof f eexx p peer r iieennccee aanndd oo b bsseer r vvaattiioonn.. AAnndd f f oor r
mmoor r ee iimm p pr r oovveemmeenntt,, nneeww ttoooollss aanndd tteecchhnniiqquueess hhaavvee b beeeenn ddeevveelloo p peedd ttoo mmeeeett tthhee nneeeeddss oof f mmooddeer r nn b buussiinneessss wwhhiicchh wwoor r k k ss iinn ccoomm p plleexx
eennvviir r oonnmmeenntt.. AAss aa p paar r tt oof f tthhee SS..YY.. BB..BB..AA.. ssyyllllaa b buuss,, p pr r aaccttiiccaall ssttuuddiieess
hheell p p uuss ttoo lliinnk k ccllaassssr r oooomm k k nnoowwlleeddggee wwiitthh p pr r aaccttiiccaall sscceennaar r iioo..
BBuussiinneessss mmaannaaggeemmeenntt iiss aann aaccttiivviittyy iinnvvoollvviinngg p pllaannnniinngg,, ddeecciissiioonn
mmaak k iinngg aanndd mmoosstt iimm p poor r ttaanntt iiss iittss iimm p plleemmeennttaattiioonn tthhr r oouugghh iinntteer r aaccttiioonn
aammoonngg iinnddiivviidduuaallss wwiitthh tthhee hheell p p oof f ddiissccuussssiioonnss aanndd eexxcchhaannggeess oof f iiddeeaass
aanndd eexx p peer r iieenncceess aanndd tthhuuss r r eessuullttss iinnttoo p pr r aaccttiiccaall aa p p p plliiccaattiioonn oof f tthhee aannnnuuaall
r r ee p poor r tt oof f tthhr r eeee ssuucccceessssiivvee yyeeaar r ss wwhhiicchh aar r ee p puutt iinn ttooggeetthheer r iinn aa llooggiiccaall
f f oor r mmaatt..
SSoo ttoo k k nnooww b baassiiccaallllyy hhooww tthhee p pr r oof f eessssiioonnaall mmaannaaggeer r ss wwoor r k k oouutt iinn
iinndduussttr r iieess,, f f iinnaanncciiaall ccoonncceer r nnss ccaann b bee cclleeaar r llyy k k nnoowwnn.. II hhoo p pee tthhiiss p pr r eesseennttaattiioonn wwiillll b bee uusseef f uull ttoo aallll ccoonncceer r nneedd..

8/8/2019 Proj of Fm Final
http://slidepdf.com/reader/full/proj-of-fm-final 4/86
4
ACKNOWLEDGEMENT
TThhr r oouugghh tthhiiss aacck k nnoowwlleeddggeemmeenntt,, II eexx p pr r eessss mmyy ggr r aattiittuuddee ttoowwaar r ddss aallll
tthhoossee p peeoo p pllee wwhhoo hheell p peedd mmee iinn p pr r ee p paar r iinngg tthhiiss p pr r oo j jeecctt r r ee p poor r tt wwhhiicchh hhaass
b beeeenn aa ggr r eeaatt lleeaar r nniinngg eexx p peer r iieennccee..
FFiir r sstt oof f aallll II wwoouulldd lliik k ee ttoo tthhaannk k tthhee DDiir r eeccttoor r M M r r . . V V aad d i i B Bhhaai i P P aat t eel l
aanndd ssiinncceer r ee tthhaannk k ss ttoo P P r r oo f f . . S S wwaat t i i M M ood d i i wwhhoo gguuiiddeedd mmee tthhr r oouugghhoouutt tthhee
p pr r oo j jeecctt aanndd aallssoo p pr r oovviiddeedd vvaalluuaa b bllee ssuuggggeessttiioonnss aanndd eennccoouur r aaggeemmeenntt aass
aanndd wwhheenn nneeeeddeedd..
II aamm hheeaar r tt f f uullllyy tthhaannk k f f uull ttoo mmyy ccl l aassssmmaat t eess aannd d mm y y F F aammi i l l y y
mmeemmbbeer r ss wwhhoo wweer r ee ssuu p p p poor r ttiivvee dduur r iinngg tthhee p pr r ee p paar r aattiioonn oof f tthhiiss r r ee p poor r tt..
8/8/2019 Proj of Fm Final
http://slidepdf.com/reader/full/proj-of-fm-final 5/86
5
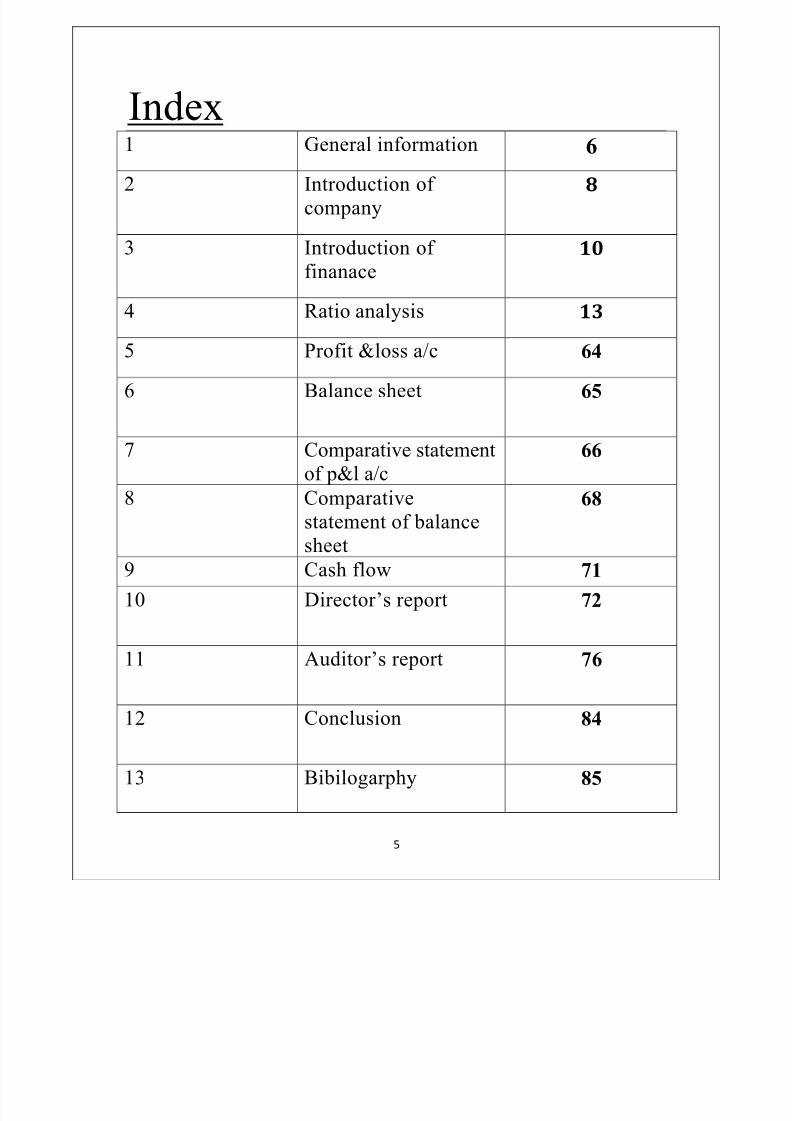
Index1 General information 6
2 Introduction of
company8
3 Introduction of
finanace10
4 Ratio analysis 13
5 Profit &loss a/c 64
6 Balance sheet 65
7 Comparative statement
of p&l a/c66
8 Comparative
statement of balancesheet
68
9 Cash flow 71
10 Director¶s report 72
11 Auditor¶s report 76
12 Conclusion 84
13 Bibilogarphy 85

8/8/2019 Proj of Fm Final
http://slidepdf.com/reader/full/proj-of-fm-final 6/86
6
General Information1)Board of directors A.K Nanda
A S Ganguly
Anupam Puri
Deepak S Parekh
M M Murugappan
Nadir B Godrej
Narayanan Vaghul
R K Kulkarni
2)Bankers
Bank of America N.A
Bank of BarodaBank of India
Central Bank
Central Bank of India
HDFC Bank Limited
State Bank of India
Union Bank of India
3)Auditor
Deloitte Haskins & Sells
8/8/2019 Proj of Fm Final
http://slidepdf.com/reader/full/proj-of-fm-final 7/86
7
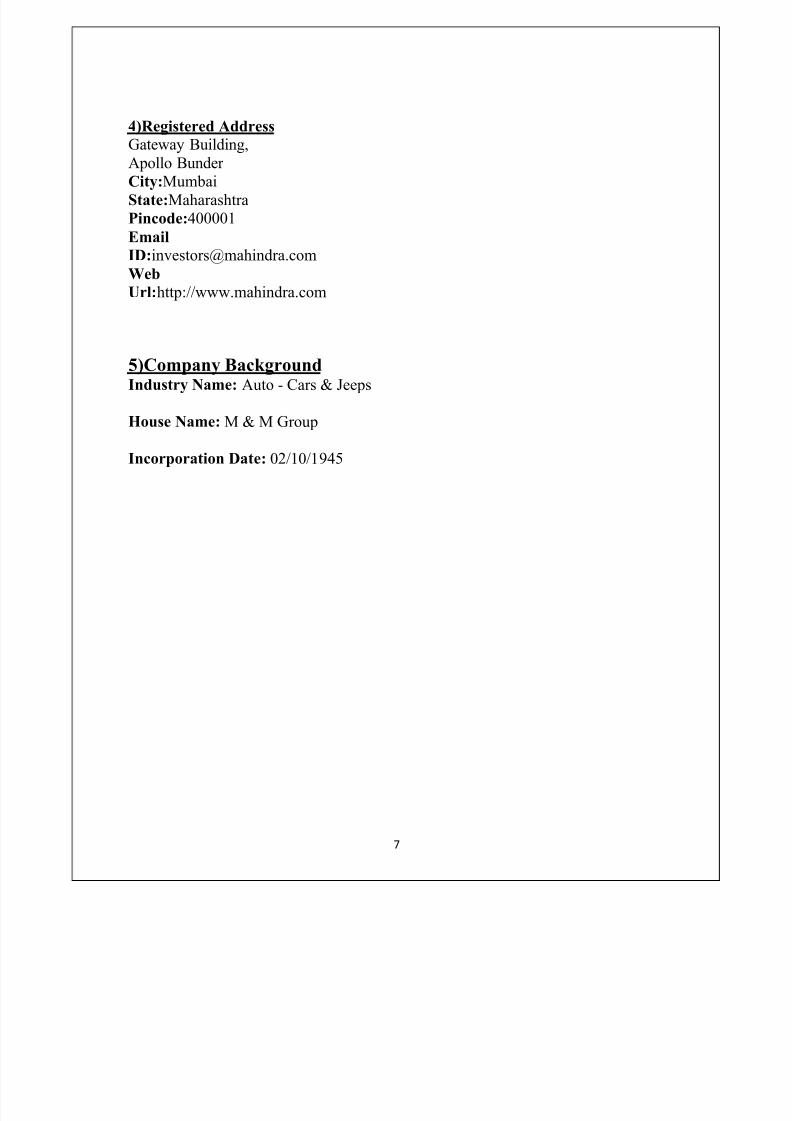
4)Registered Address
Gateway Building,
Apollo Bunder
City:Mumbai
State:Maharashtra
Pincode:400001
Web
Url:http://www.mahindra.com
5)Company Background
Industry Name: Auto - Cars & Jeeps
House Name:M & M Group
Incorporation Date: 02/10/1945

8/8/2019 Proj of Fm Final
http://slidepdf.com/reader/full/proj-of-fm-final 8/86
8
A)Introduction of company
The Company was Incorporated and converted into Public Limited in 1955 at
Mumbai. The Company Manufacture Jeep type vehicles, petrol industrial engines,industrial process control instruments and flow meters. Trading in steel and
manufacture of professional grade electronic components.
Jeeps are manufactured under a license and an agreement with Willys Motors Inc.,
Toledo, Ohio, U.S.A., for whom the Company also acts as exclusive distributors
for the whole of India for their entire range of vehicles including utility vans,
cargo/personnel carriers and pick-up trucks.

8/8/2019 Proj of Fm Final
http://slidepdf.com/reader/full/proj-of-fm-final 9/86
9
B) Brief History& Background
Few groups can identify as closely with India's destiny and
industrial progress as the Mahindra Group. In fact, Mahindra is
like a microcosm of India. Both were born around the same time,
had the same aspirations and both experienced the inevitable
troughs
And crests in the journey towards their goals. And both continue to
march on the path to progress and global recognition.
The birth of Mahindra & Mahindra began when K.C. Mahindra
visited the United States of America as Chairman of the IndiaSupply Mission. He met Barney Roos, inventor of the rugged
'general purpose vehicle' or Jeep and had a flash of inspiration:wouldn't a
vehicle that had proved its invincibility on the battlefields of World
War II be ideal for India's rugged terrain and its kutcha rural roads?
Swift action followed thought. The Mahindra brothers joined hands
with a distinguished gentleman called Ghulam Mohammed. And, onOctober 2
nd, 1945, Mahindra & Mohammed was set up as a franchise
for assembling jeeps from Willys, USA.
Two years later, India became an independent nation and Mahindra
& Mohammed changed its name to Mahindra & Mahindra.
Since then, Mahindra & Mahindra has grown steadily in size and
stature and evolved into a Group that occupies a premier position inalmost all key sectors of the economy. The Group's history is
studded with milestones.
For Mahindra & Mahindra, this translates into many more milestones to
be set up before it rests. If ever.
8/8/2019 Proj of Fm Final
http://slidepdf.com/reader/full/proj-of-fm-final 10/86
8/8/2019 Proj of Fm Final
http://slidepdf.com/reader/full/proj-of-fm-final 11/86
11
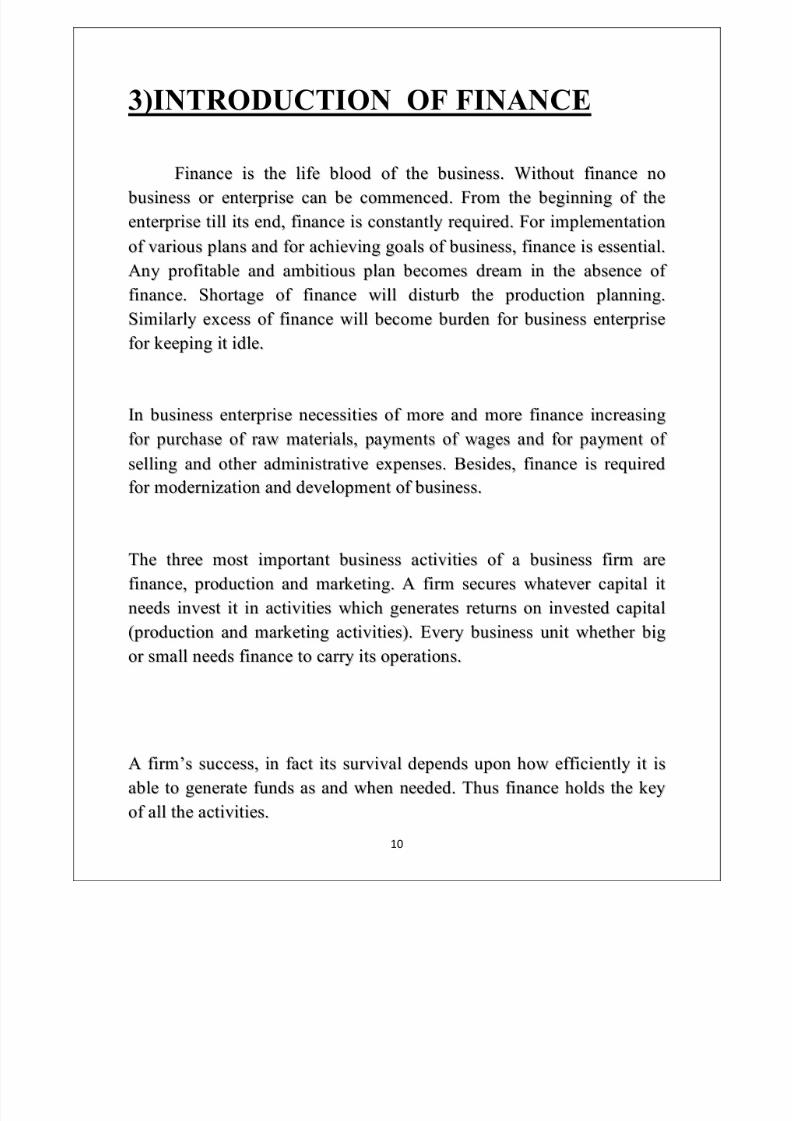
Meaning of financial activities:
FFiinnaannccee mmeeaannss mmoonneeyy uusseedd b byy ccoomm p paannyy p pr r oovviiddeedd b byy tthhee
sshhaar r eehhoollddeer r ss oor r b byy llooaannss ii..ee,, iitt iiss aa ssttuuddyy oof f mmoonneeyy mmaannaaggeemmeenntt aanndd
p pr r oovviissiioonn oof f mmoonneeyy wwhheenn iitt iiss r r eeqquuiir r eedd ..
Definition of FinancialManagement:
³³FFiinnaannccee´́ iiss aa wwoor r dd f f r r oomm FFr r eenncchh llaanngguuaaggee.. TThhee mmeeaanniinngg oof f tthhiiss
wwoor r dd iiss eevveer r cchhaannggiinngg.. IInn 1177tthh
cceennttuur r yy tthhee tteer r mm ³³f f iinnaannccee´́ wwaass ccoonnssiiddeer r eedd
aass ³³mmoonneeyylleennddeer r ss´́.. BBuutt nnooww iitt iiss ccoonnssiiddeer r eedd aass ³³f f iinnaanncciiaall
aaddmmiinniissttrraattiioonn´́.. TThhee mmeeaanniinngg aanndd ddeef f iinniittiioonn cchhaannggeess aaccccoor r ddiinngg ttoo cciir r ccuummssttaanncceess..
AAccccoor r ddiinngg ttoo WWhheeeelleerr::
µµFFiinnaanncciiaall MMaannaaggeemmeenntt iiss tthhee b buussiinneessss aaccttiivviittyy wwhhiicchh iiss ccoonncceer r nn
wwiitthh aaccqquuiissiittiioonn aanndd ccoonnsseer r vvaattiioonn oof f ccaa p piittaall f f uunnddss iinn mmeeeettiinngg f f iinnaanncciiaall nneeeeddss aanndd oovveer r aallll oo b b j jeeccttiivveess oof f b buussiinneessss eenntteer r p pr r iissee¶¶..
TThhuuss f f iinnaanncciiaall mmaannaaggeemmeenntt iiss ccoonncceer r nneedd wwiitthh tthhee aaccqquuiissiittiioonn,,
aar r r r aannggeemmeenntt,, iinnvveessttmmeenntt,, ddiissttr r ii b buuttiioonn aanndd ccoonnttr r ooll oovveer r tthhee b buussiinneessss
f f iinnaannccee.. WWhhaatt ssoo eevveer r iiss ddoonnee b byy f f iinnaannccee mmaannaaggeer r iiss k k nnoowwnn aass f f iinnaanncciiaall
mmaannaaggeemmeenntt..
8/8/2019 Proj of Fm Final
http://slidepdf.com/reader/full/proj-of-fm-final 12/86
12
A) IMPORTANCE OF FINANCE IN
MODERN WORLD:
WWiitthhoouutt f f iinnaannccee nnoo aaccttiivviittyy iiss p poossssii b bllee.. AAccccoor r ddiinngg ttoo SS..CC..
K K uucchhhhaall ³³MMoonneeyy iiss aa p piivvoott,, aar r oouunndd iitt aallll eeccoonnoommiicc aaccttiivviittiieess aar r ee
cclluusstteer r ́́ .. AAccqquuiissiittiioonn aanndd uuttiilliizzaattiioonn oof f f f iinnaannccee aar r ee tthhee mmaaiinn ccoomm p poonneennttss
oof f f f iinnaanncciiaall mmaannaaggeemmeenntt.. ³³BBuutt uuttiilliizzaattiioonn oof f f f iinnaannccee iinn wwr r oonngg ddiir r eeccttiioonn
wwiillll ddeeccr r eeaassee tthhee p pr r oof f iittaa b biilliittyy aanndd p pr r eessttiiggee oof f uunniitt.. AAnndd eennttiir r ee ssuucccceessss
aanndd p pr r ooggr r eessss oof f b buussiinneessss ddee p peennddss oonn eef f f f eeccttiivvee f f iinnaannccee f f uunnccttiioonnss..
The Importance of finance function can be pointed out as
under:
oo IInn tthhee b buussiinneessss p puur r cchhaassee,, oof f R R aaww mmaatteer r iiaall,, PPllaanntt aanndd MMaacchhiinneer r yy,,
LLaanndd aanndd BBuuiillddiinngg,, b beenneef f iitt oof f sscciieennttiif f iicc p puur r cchhaassee ccaann oonnllyy b bee
oo b bttaaiinneedd oonnllyy iif f f f iinnaannccee f f uunnccttiioonn iiss iiddeeaall..
oo TThhee aaiimm oof f b buussiinneessss iiss ttoo mmaak k ee p pr r oof f iitt p pr r oommootteer r aar r ee aallwwaayyss k k eeee p piinngg
iiddeeaa oof f eexx p paannssiioonn,, f f oor r ggeettttiinngg p pr r oof f iitt..
oo ³³CCuussttoommeerr ssaattiissf f aaccttiioonn iiss oouurr MMoottttoo´́.. IItt iiss ttr r uuee b buutt f f oor r tthhiiss,,
ccuussttoommeer r sseer r vviiccee cceennttr r ee aar r ee r r eeqquuiir r eedd.. IItt iiss vveer r yy cclleeaar r tthhaatt wwiitthhoouutt
f f iinnaannccee f f uunnccttiioonnss tthhee iiddeeaa oof f ccuussttoommeer r sseer r vviiccee cceennttr r ee b beeccoommeess
mmeer r eellyy aa ddr r eeaamm..
TT
hh
uu
ss,,
iinn
b b
uu
ssiinn
eessss,,
f f iinn
aann
ccee
f f uu
nn
ccttiioo
nn
iiss
aann
iimm
p p
oo
r r ttaann
tt
aaccttiivv
iittyy
.
. OOtthheer r aaccttiivviittiieess oof f b buussiinneessss ddee p peenndd oonn f f iinnaanncciiaall mmaatttteer r ss.. TThhaatt iiss
wwhhyy f f iinnaannccee iiss ccoomm p paar r eedd wwiitthh tthhee b blloooodd cciir r ccuullaattiioonn oor r lliif f ee lliinnee oof f
b buussiinneessss aanndd iinndduussttr r yy..

8/8/2019 Proj of Fm Final
http://slidepdf.com/reader/full/proj-of-fm-final 13/86
13
4)Ratio analysis
INTRODUCTION
OBJECTIVE:
To understand the information contained in financial statements
with a view to know the strength or weaknesses of the firm and to make
forecast about the future prospects of the firm and thereby enabling the
financial analyst to take different decisions regarding the operations of
the firm.
RATIO ANALYSIS:
Fundamental Analysis has a very broad scope. One aspect looks
at the general (qualitative) factors of a company. The other side
considers tangible and measurable factors (quantitative). This means
crunching and analyzing numbers from the financial statements. If used
in conjunction with other methods, quantitative analysis can produce
excellent results.
MEANING OF RATIO:
A ratio is one figure express in terms of another figure. It is a
mathematical yardstick that measures the relationship two figures, which
are related to each other and mutually interdependent. Ratio is express
by dividing one figure by the other related figure. Thus a ratio is an
expression relating one number to another. It is simply the quotient of two numbers. It can be expressed as a fraction or as a decimal or as a
pure ratio or in absolute figures as ³ so many times´. As accounting ratio
is an expression relating two figures or accounts or two sets of account
heads or group contain in the financial statements.
8/8/2019 Proj of Fm Final
http://slidepdf.com/reader/full/proj-of-fm-final 14/86
14
ADVANTAGES OF RATIO ANALYSIS
Financial ratios are essentially concerned with the identification of
significant accounting data relationships, which give the decision-maker insights into the financial performance of a company. The advantages of
ratio analysis can be summarized as follows:
Ratios facilitate conducting trend analysis, which is important for
decision
making and forecasting.
Ratio analysis helps in the assessment of the liquidity, operating
efficiency, profitability and solvency of a firm.
Ratio analysis provides a basis for both intra-firm as well as inter-
firm
comparisons.
The comparison of actual ratios with base year ratios or standard ratios helpsthe management analyze the financial performance of the firm
8/8/2019 Proj of Fm Final
http://slidepdf.com/reader/full/proj-of-fm-final 15/86
15
LIMITATIONS OF RATIO ANALYSIS
Ratio analysis has its limitations. These limitations are described below:
1] Information problems Ratios require quantitative information for analysis but it is not
decisive about analytical
output .
The figures in a set of accounts are likely to be at least several
months out of
date, and so might not give a proper indication of the company¶s current
financial
position. Where historical cost convention is used, asset valuations in
the balance sheet
could be misleading. Ratios based on this information will not
be very useful for
decision-making.
2]Comparison
of
performance
over
time
When comparing performance over time, there is need to
consider the changes
in price. The movement in performance should be in line with
the changes in
price.
When comparing performance over time, there is need to
consider the changes
in technology. The movement in performance should be in line
with the changes
in technology.
Changes in accounting policy may affect the comparison of
results between different accounting years as misleading.
8/8/2019 Proj of Fm Final
http://slidepdf.com/reader/full/proj-of-fm-final 16/86
16
When comparing performance over time, there is need to
consider the changes in price. The movement in performance
should be in line with the changes in price.
When comparing performance over time, there is need toconsider the changes in technology. The movement in
performance should be in line with the changes in technology.
Changes in accounting policy may affect the comparison of
results between different accounting years as misleading.
3] Inter-firm comparison
Companies may have different capital structures and to
make comparison of performance when one is all equity
financed and another is a geared company it may not be a good
analysis.
Selective application of government incentives to various
companies may also distort intercompany comparison.
comparing the performance of two enterprises may be
misleading When comparing performance over time, there is need to
consider the changes in price. The movement in performance
should be in line with the changes in price.
When comparing performance over time, there is need to
consider the changes in technology. The movement in
performance should be in line with the changes in technology.
Changes in accounting policy may affect the comparison of results between different accounting years as misleading.

8/8/2019 Proj of Fm Final
http://slidepdf.com/reader/full/proj-of-fm-final 17/86
17
CCllaassssiif f iiccaattiioonn oof f R R aattiiooss::
AAss p peer r r r eeqquuiir r eemmeenntt oof f vvaar r iioouuss uusseer r ss ((f f oor r ee..gg.. sshhoor r tt tteer r mm ccr r eeddiittoor r ss,,
mmaannaaggeemmeenntt,, iinnvveessttoor r ss)) tthhee r r aattiiooss mmaayy b bee ccllaassssiif f iieedd iinn f f oolllloowwiinngg
ggr r oouu p pss::
PPrroof f iittaabbiilliittyy
R R aattiiooss
LLiiqquuiiddiittyy
R R aattiiooss
LLeevveerraaggee
R R aattiiooss
AAccttiivviittyy R R aattiiooss
GGr r oossss PPr r oof f iitt
R R aattiioo
CCuur r r r eenntt R R aattiiooss DDee b btt EEqquuiittyy
R R aattiioo
SSttoocck k TTuur r nnoovveer r
R R aattiiooss
N Neett PPr r oof f iitt R R aattiioo LLiiqquuiidd R R aattiioo PPr r oo p pr r iieettaar r yy R R aattiioo WWoor r k k iinngg
CCaa p piittaall
TTuur r nnoovveer r R R eettuur r nn oonn sshhaar r ee--
hhoollddeer r ss f f uunndd
CCaa p piittaall GGeeaar r iinngg
R R aattiioo
TToottaall AAsssseettss
TTuur r nnoovveer r
OO p peer r aattiinngg R R aattiioo LLoonngg tteer r mm f f uunnddss
ttoo f f iixxeedd AAsssseettss
BBooook k VVaalluuee PPeer r
SShhaar r ee
EExx p peennsseess R R aattiioo DDee b bttoor r ss R R aattiioo
R R eettuur r nn oonn ccaa p piittaall
eemm p pllooyyeedd
CCr r eeddiittoor r ss R R aattiioo
EEaar r nniinnggss p peer r
sshhaar r ee DDiivviiddeenndd p peer r
sshhaar r ee
PPr r iiccee EEaar r nniinngg
8/8/2019 Proj of Fm Final
http://slidepdf.com/reader/full/proj-of-fm-final 18/86
18
PPrroof f iittaabbiilliittyy R R aattiioo ::
aa.. GGrroossss PPrroof f iitt R R aattiioo:: MMeeaanniinngg:: -- TThhiiss r r aattiioo sshhoowwss tthhee r r eellaattiioonnsshhii p p b beettwweeeenn GGr r oossss PPr r oof f iitt aanndd N Neett ssaalleess..
OObb j jeeccttiivvee:: -- TThhee mmaaiinn OO b b j jeeccttiivvee oof f ccoomm p puuttiinngg tthhiiss r r aattiioo iiss ttoo f f iinndd
oouutt tthhee eef f f f iicciieennccyy wwiitthh wwhhiicchh p pr r oodduuccttiioonn oor r p puur r cchhaassee oo p peer r aattiioonn aar r ee
ccaar r r r iieedd oonn..
Components: - There are 2 components of this ratio which are as
under:
Gross profit is the excess of net sales over cost of cost sold
i.e. Net sales (-) cost of goods sold.Cost of goods sold =
Opening stock + Net purchase (purchase ±purchase return)
+ Direct Expenses (purchase related expenses) - Closing
stock.Net sales which is gross sales (both cash and credit)
± Sales return.
CCaallccuullaattiioonn::--
This ratio is calculated by dividing the gross profit by
net sales. It is expressed as percentage. In the form of a
formula this ratio may be expressed as under:
y Formula: -
Gross Profit = Gross Profit * 100
Net Sales
8/8/2019 Proj of Fm Final
http://slidepdf.com/reader/full/proj-of-fm-final 19/86
19
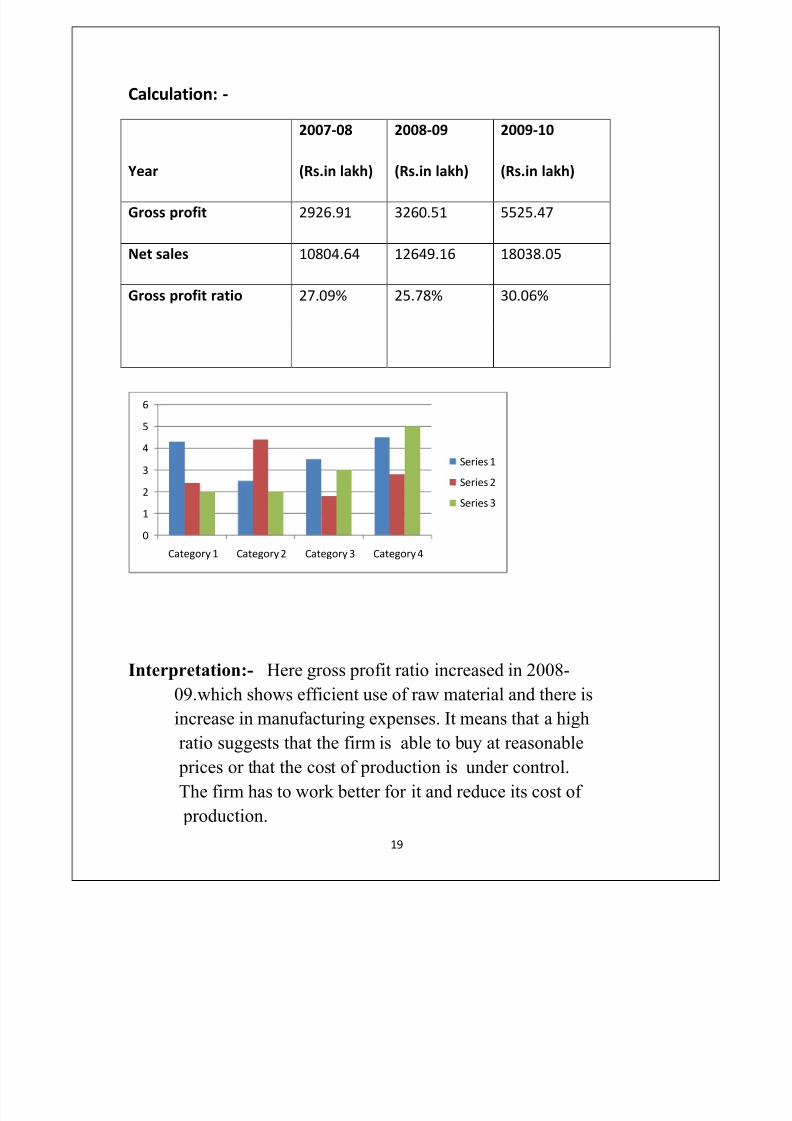
Calculation: -
Year
2007-08
(Rs.in lakh)
2008-09
(Rs.in lakh)
2009-10
(Rs.in lakh)
Gross profit 2926.91 3260.51 5525.47
Net sales 10804.64 12649.16 18038.05
Gross profit ratio 27.09% 25.78% 30.06%
Interpretation:- Here gross profit ratio increased in 2008-
09
.which shows efficient use of raw material and there isincrease in manufacturing expenses. It means that a high
ratio suggests that the firm is able to buy at reasonable
prices or that the cost of production is under control.
The firm has to work better for it and reduce its cost of
production.
0
1
2
3
4
5
6
Category 1 Category 2 Category 3 Category 4
Series 1
Series 2
Series 3
8/8/2019 Proj of Fm Final
http://slidepdf.com/reader/full/proj-of-fm-final 20/86
20
b. Net Profit Ratio: Meaning:-
This ratio measures the relationship between net profit
& net sales.
Objective:-
The main objective of computing this ratio is to find the
overall profitability due to various factors such as
operational efficiency, trading on equity etc.
Components:-
There are two components of this ratio which are as
under:
1. Net Profit
2. Net Sales
Calculation:-
This ratio is calculated by dividing the next profit by net
sales. It is expressed as percentage. In the form of a
formula this ratio may be expressed as under:
Formula: -
Net Profit Ratio = Net Profit * 100
Net Sales
8/8/2019 Proj of Fm Final
http://slidepdf.com/reader/full/proj-of-fm-final 21/86
21
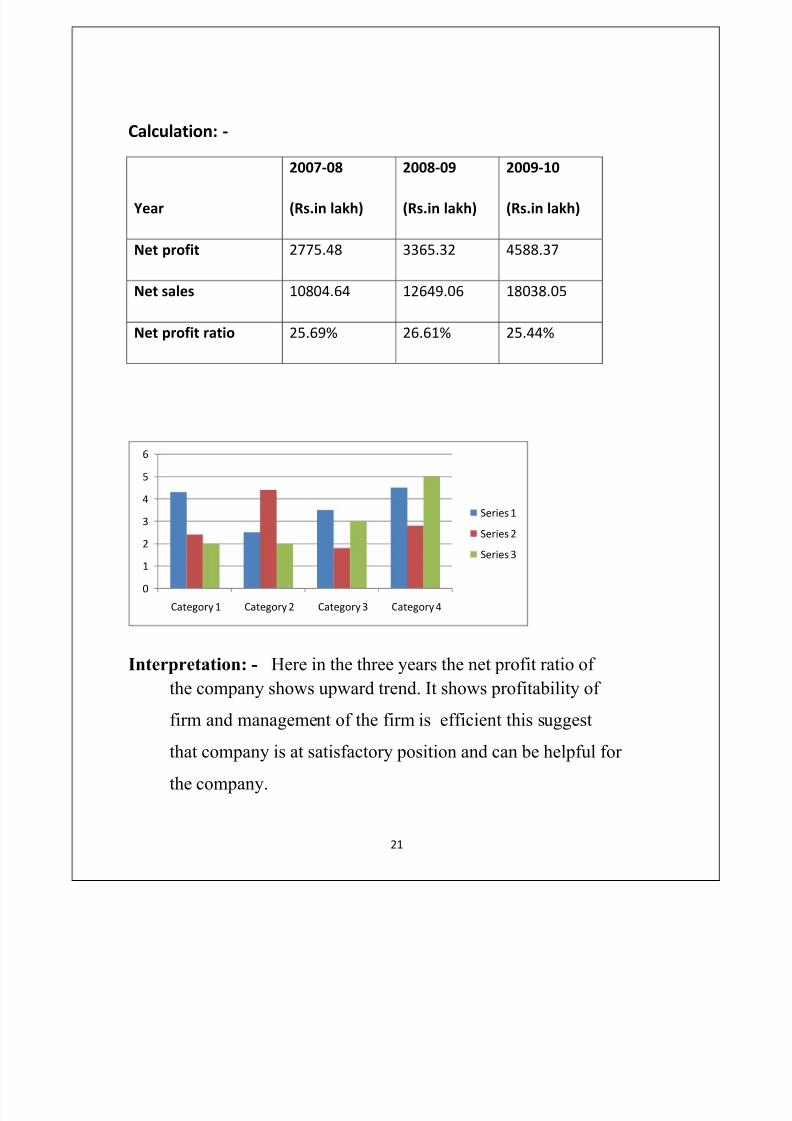
Calculation: -
Year
2007-08
(Rs.in lakh)
2008-09
(Rs.in lakh)
2009-10
(Rs.in lakh)
Net profit 2775.48 3365.32 4588.37
Net sales 10804.64 12649.06 18038.05
Net profit ratio 25.69% 26.61% 25.44%
Interpretation: - Here in the three years the net profit ratio of
the company shows upward trend. It shows profitability of
firm and management of the firm is efficient this suggest
that company is at satisfactory position and can be helpful for
the company.
0
1
2
3
4
5
6
Category 1 Category 2 Category 3 Category 4
Series 1
Series 2
Series 3
8/8/2019 Proj of Fm Final
http://slidepdf.com/reader/full/proj-of-fm-final 22/86
22
c.Return on Shareholder¶s Fund:
Meaning:-
This ratio measures a relationship between net profit after interest, tax and preference dividend and equity shareholder¶s
funds.
Objective:-
The objective of calculating this ratio is to find out how
efficiently the funds supplies by the equity shareholder¶s have
been used.
Components:-
There are two components of this ratio they are as under:
1. Net Profit after Interest, Tax & Preference dividend
2. Equity Shareholder¶s Fund which means Equity Share Capital +
Reserves & Surplus ± Fictitious Assets
Calculation:-
This ratio is computed by dividing the net profit after interest &
tax and preference dividend by equity shareholder¶s fund. It is
expressed as percentage. In the form of a formula this ratio may
be expressed as under:
Formula: -
Return on Eq. sh. holders fund = Profit after tax *100
Equity share holders fund

8/8/2019 Proj of Fm Final
http://slidepdf.com/reader/full/proj-of-fm-final 23/86
23
Calculation:-
Year
2007-08
(Rs.in lakh)
2008-09
(Rs.in lakh)
2009-10
(Rs.in lakh)
Net profit(PAT) 1136.37 836.78 2087.75
Shareholders fund 4332.54 5255.53 7818.76
Returns 26.20% 15.94% 26.69%
Interpretation: -
Return on equity share holder fund was 1136.37%in 2007-08 which
decreased 836.78% and again increased to 2087.75% it indicates that
fund which is provided by the owners have been not used properly by
the firm which can be unsatisfactory for the company in the future.
0
1
2
3
4
5
6
Category 1 Category 2 Category 3 Category 4
Series 1
Series 2
Series 3
8/8/2019 Proj of Fm Final
http://slidepdf.com/reader/full/proj-of-fm-final 24/86
24
c. Operating Ratio: Meaning:-
This ratio measures a relationship between operating cost and
net sales.
Objective:-
The main objective of computing this ratio is to find out the
operating efficiency with which production or purchase &
selling operations are carried on.
Components:-
There are two components of this ratio which are as under:
A. Cost of Goods Sold
B. Other Operating expenses
Ex. Administrative expenses, selling & distribution expenses,
interest on short term loans, discount allowed and bed debts, netsales (Gross Sales ± Sales Return).
Calculation:-
This ratio is calculated by dividing the operating cost by net
sales. This ratio is expressed as percentage. In the form of a
formula this ratio may be expressed as under:
Operating Ratio =
*100

8/8/2019 Proj of Fm Final
http://slidepdf.com/reader/full/proj-of-fm-final 25/86
25
Calculation:
year
2007-08
(Rs.in lakh)
2008-09
(Rs.in lakh)
2009-10
(Rs.in lakh)
Cogs 7906.04 9463.68 12529.20
Operating exp 2296.97 2612.49 3134.29
Net sales 10804.64 12649.06 18038.05
Operating ratio 94.43% 95.47% 86.84%
Interpretation:-
This ratio indicates an average operating cost incurred on sales
of goods worth rs. 100. Lower the ratio, greater is the operating
profit to cover the operating expense to pay dividend and to
create reserves & vice-versa.
0
1
2
3
4
5
6
Category 1 Category 2 Category 3 Category 4
Series 1
Series 2
Series 3

8/8/2019 Proj of Fm Final
http://slidepdf.com/reader/full/proj-of-fm-final 26/86
26
d. Expenses Ratio: Meaning:-
This ratio measures the relationship between different types of
ratio with expenses & net sales.
Objective:-
The main objective of computing different types of expenses the
incurrence of different types of expenses.
Components:-
There are two components of this ratio which are as under:
1. Different type of expenses
2. Net Sales
Calculation:-
This ratio is calculated by dividing different types of expenses
by the net sales. This ratio is expressed as a percentage. In the
form of a formula this ratio may be expressed as under:
Expense Ratio =
×100
8/8/2019 Proj of Fm Final
http://slidepdf.com/reader/full/proj-of-fm-final 27/86
27
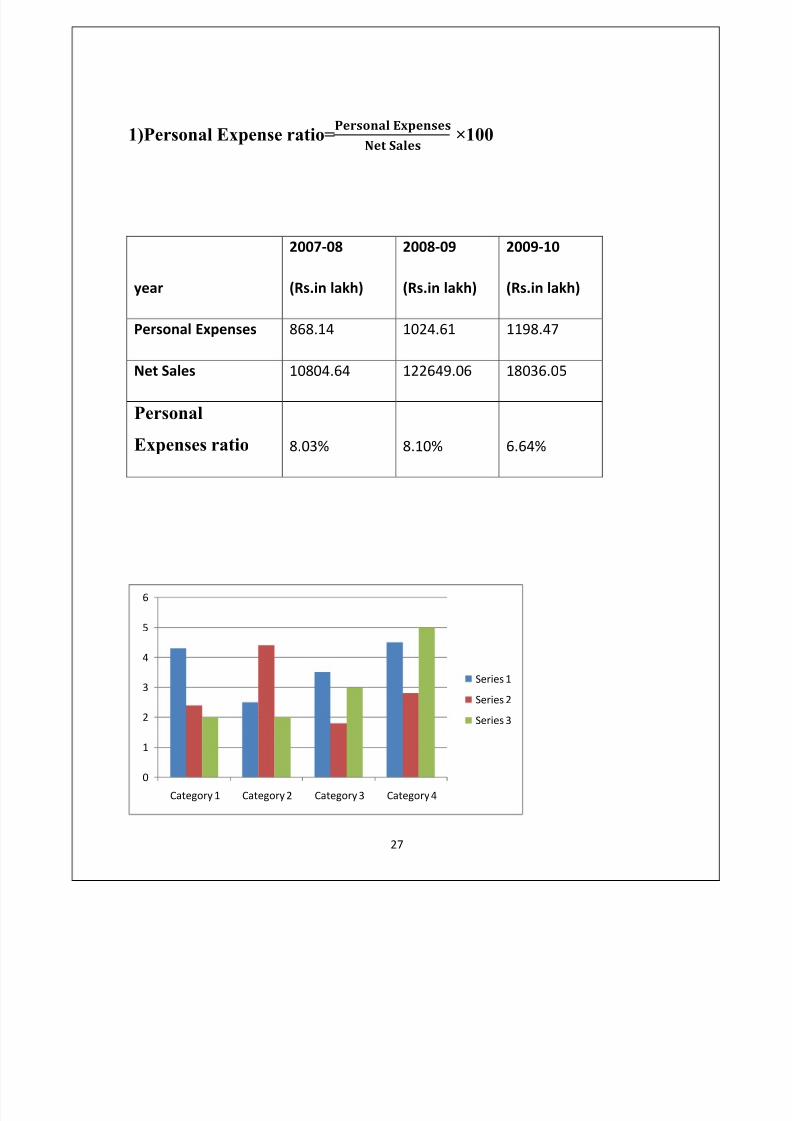
1)Personal Expense ratio=
×100
year
2007-08
(Rs.in lakh)
2008-09
(Rs.in lakh)
2009-10
(Rs.in lakh)
Personal Expenses 868.14 1024.61 1198.47
Net Sales 10804.64 122649.06 18036.05
Personal
Expenses ratio 8.03% 8.10% 6.64%
0
1
2
3
4
5
6
Category 1 Category 2 Category 3 Category 4
Series 1
Series 2
Series 3
8/8/2019 Proj of Fm Final
http://slidepdf.com/reader/full/proj-of-fm-final 28/86
28
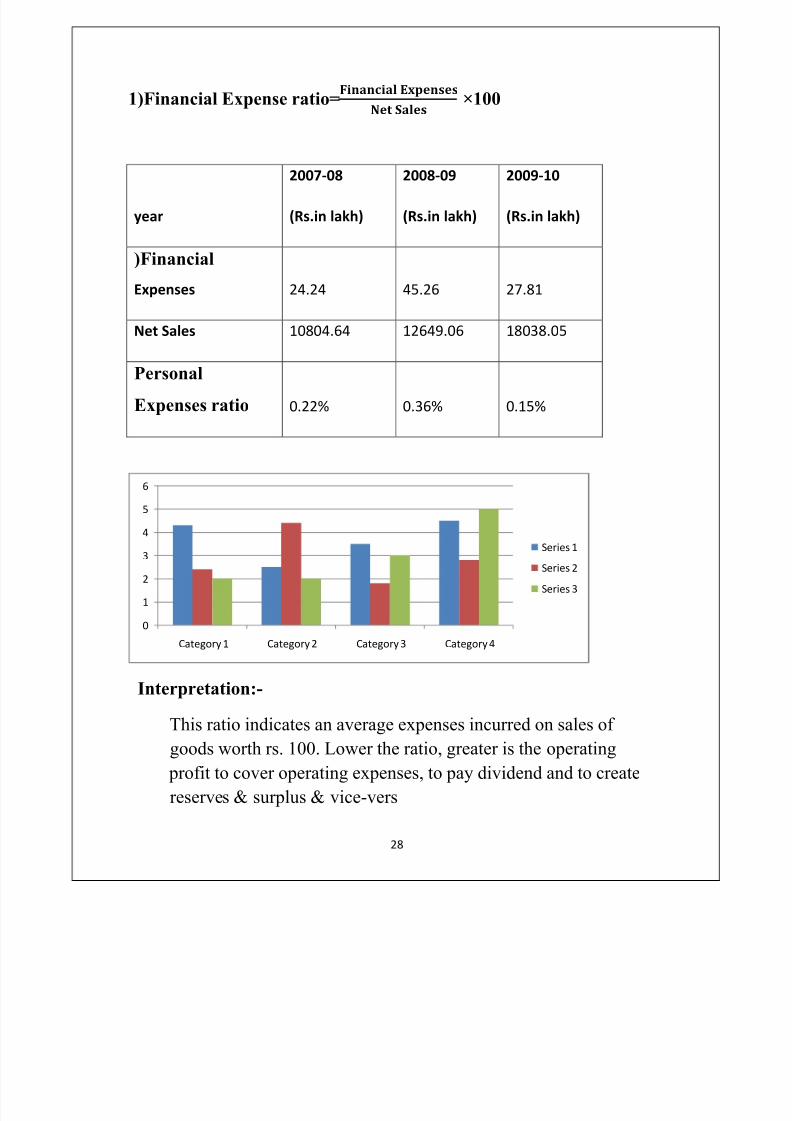
1)Financial Expense ratio=
×100
year
2007-08
(Rs.in lakh)
2008-09
(Rs.in lakh)
2009-10
(Rs.in lakh)
)Financial
Expenses 24.24 45.26 27.81
Net Sales 10804.64 12649.06 18038.05
Personal
Expenses ratio 0.22% 0.36% 0.15%
Interpretation:-
This ratio indicates an average expenses incurred on sales of
goods worth rs. 100. Lower the ratio, greater is the operating
profit to cover operating expenses, to pay dividend and to create
reserves & surplus & vice-vers
0
1
2
3
4
5
6
Category 1 Category 2 Category 3 Category 4
Series 1
Series 2
Series 3
8/8/2019 Proj of Fm Final
http://slidepdf.com/reader/full/proj-of-fm-final 29/86
29
e. Return on Capital Employee:
Meaning:-
This ratio measures a relationship between not profit before
interest & tax and capital employed.
Objective:-
The objective of calculating this ratio is to find out how
efficiently the long term fund supplied by the creditors &
shareholders has been used.
Components:-
There are two Components of this ratio which are as under:
1. Net Profit Before Interest & Tax
2. Capital Employed Which Refers to Long Term Fund Supplied
by the long term creditors & shareholders.
It comprises the long term debts & shareholder¶s fund.
Calculation:-
This ratio is calculated by dividing the net profit before interest
& tax by capital employed. This is expressed as percentage. In
the form of a formula this ratio may be expressed as under:
Return on Capital Employed =
× 100
8/8/2019 Proj of Fm Final
http://slidepdf.com/reader/full/proj-of-fm-final 30/86
30
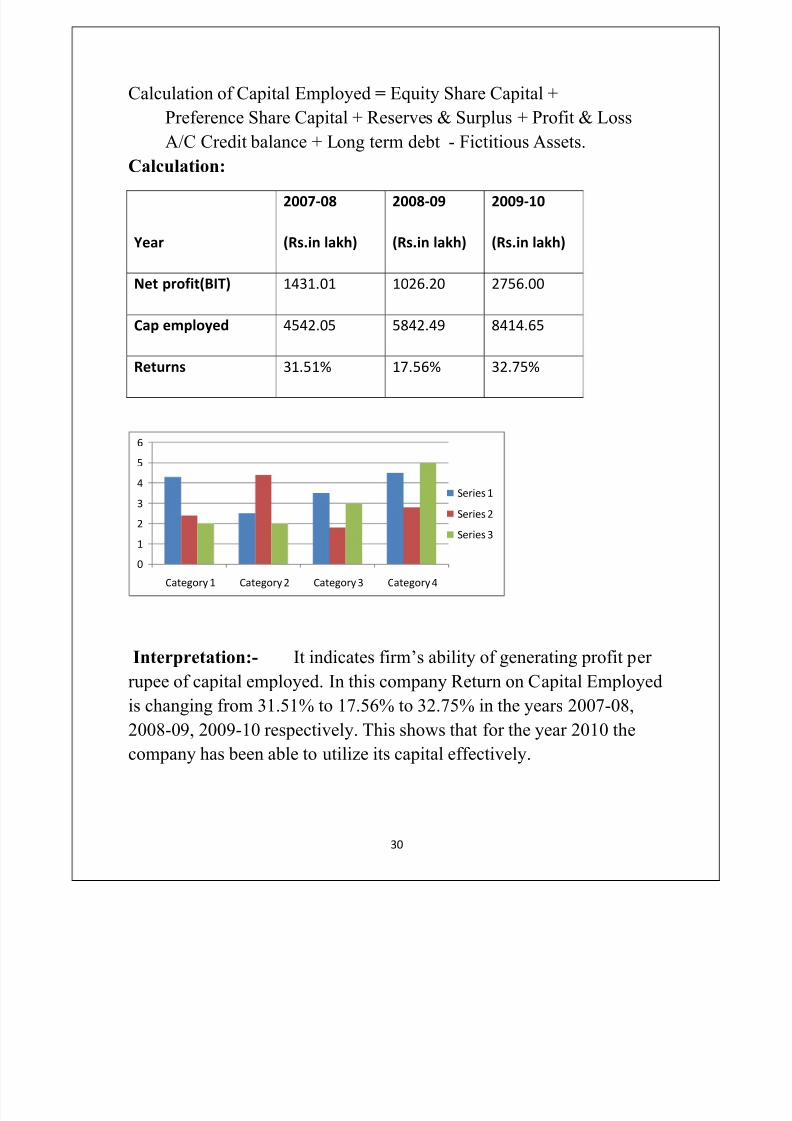
Calculation of Capital Employed = Equity Share Capital +
Preference Share Capital + Reserves & Surplus + Profit & Loss
A/C Credit balance + Long term debt - Fictitious Assets.
Calculation:
Year
2007-08
(Rs.in lakh)
2008-09
(Rs.in lakh)
2009-10
(Rs.in lakh)
Net profit(BIT) 1431.01 1026.20 2756.00
Cap employed 4542.05 5842.49 8414.65
Returns 31.51% 17.56% 32.75%
Interpretation:- It indicates firm¶s ability of generating profit per
rupee of capital employed. In this company Return on Capital Employed
is changing from 31.51% to 17.56% to 32.75% in the years 2007-08,
2008-09, 2009-10 respectively. This shows that for the year 2010 the
company has been able to utilize its capital effectively.
0
1
2
3
4
5
6
Category 1 Category 2 Category 3 Category 4
Series 1
Series 2
Series 3
8/8/2019 Proj of Fm Final
http://slidepdf.com/reader/full/proj-of-fm-final 31/86
31
Earning per share :
Meaning:-
This ratio measures the earnings available to an equityshareholder on a per share basis.
Objective:-
The objective of computing this ratio is to find out the
profitability of the firm on per equity share basis.
Components:-
There are two components of this ratio which are as under:
1. Net Profit after Interest, Tax & Preference dividend
2. No. of equity Shares
Calculation:-
This ratio is calculated by regarding the net profit after interest,
tax and preference dividend by the no. of equity shares. It is
expressed as absolute figure. In the form of a formula this ratio
may be expressed as under:
Formula: -
Earning per share = net profit preference divideNo. of equity shares
8/8/2019 Proj of Fm Final
http://slidepdf.com/reader/full/proj-of-fm-final 32/86
32
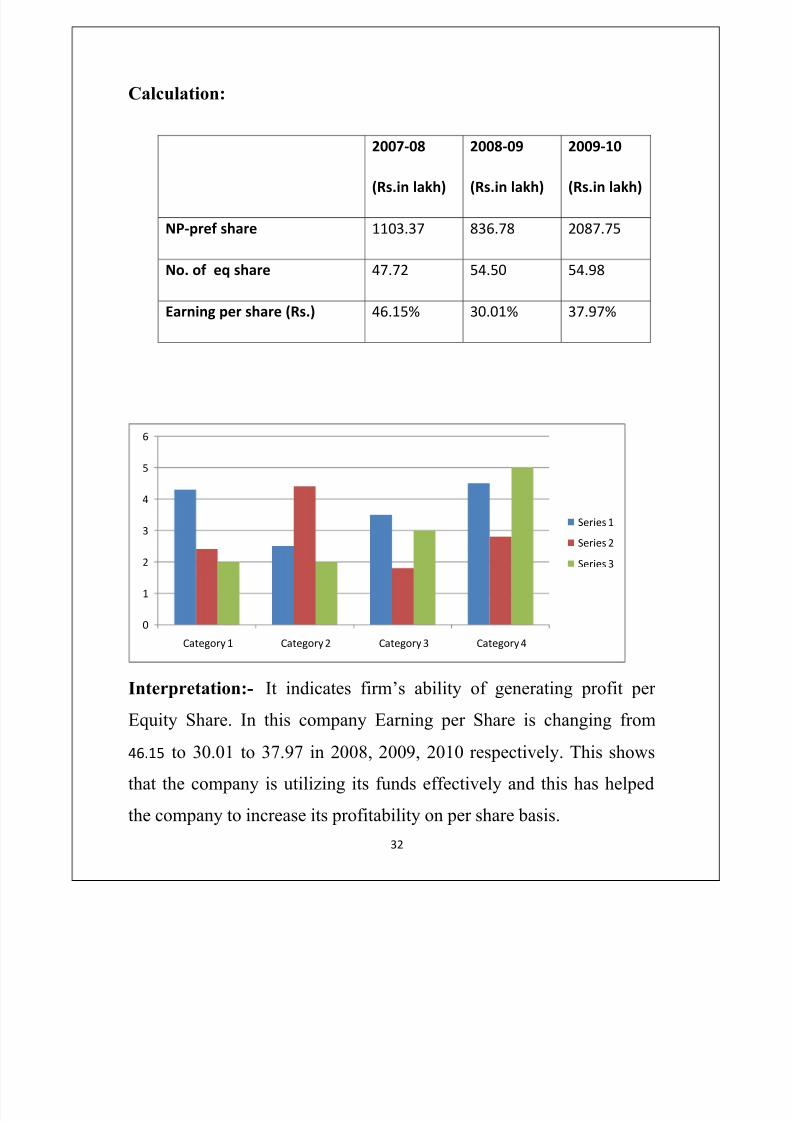
Calculation:
2007-08
(Rs.in lakh)
2008-09
(Rs.in lakh)
2009-10
(Rs.in lakh)
NP-pref share 1103.37 836.78 2087.75
No. of eq share 47.72 54.50 54.98
Earning per share (Rs.) 46.15% 30.01% 37.97%
Interpretation:- It indicates firm¶s ability of generating profit per
Equity Share. In this company Earning per Share is changing from
46.15 to 30.01 to 37.97 in 2008, 2009, 2010 respectively. This shows
that the company is utilizing its funds effectively and this has helped
the company to increase its profitability on per share basis.
0
1
2
3
4
5
6
Category 1 Category 2 Category 3 Category 4
Series 1Series 2
Series 3
8/8/2019 Proj of Fm Final
http://slidepdf.com/reader/full/proj-of-fm-final 33/86
33
Dividend per share:
Meaning:-
This ratio measures relationship between dividend and no. of equity
shares.
Objective:-
The objective of computing this ratio is to find out net distributed
profit
after interest, tax and preference dividend to equity shareholders.
Components:-
There are two components of this ratio which are as under:
1. Dividend paid to equity shareholders
2. No. of equity shares
Calculation:-
This ratio is calculated by dividing dividend paid to equity
shareholders by no. of equity shares. It is expressed as absolute
figure. In the form of a formula this ratio can be expressed as
under:
Formula: -
Dividend per share = total dividend declared
No. of shares
8/8/2019 Proj of Fm Final
http://slidepdf.com/reader/full/proj-of-fm-final 34/86
34
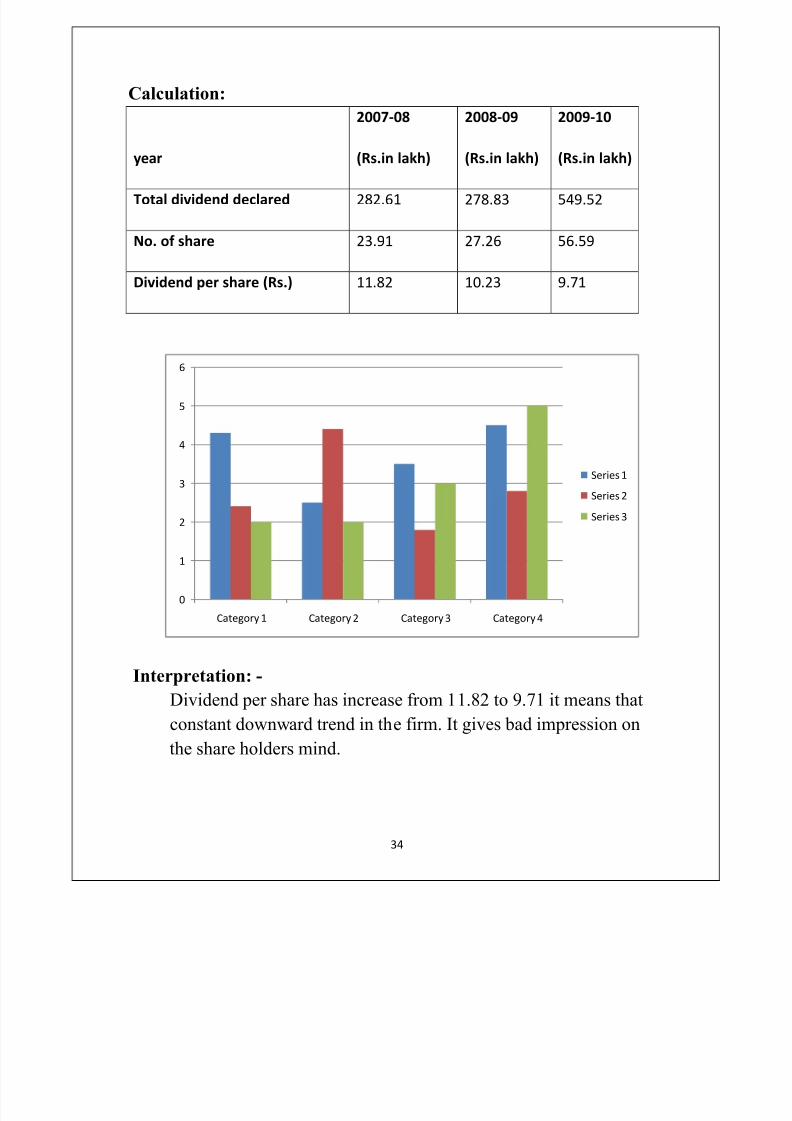
Calculation:
year
2007-08
(Rs.in lakh)
2008-09
(Rs.in lakh)
2009-10
(Rs.in lakh)
Total dividend declared 282.61 278.83 549.52
No. of share 23.91 27.26 56.59
Dividend per share (Rs.) 11.82 10.23 9.71
Interpretation: -
Dividend per share has increase from 11.82 to 9.71 it means thatconstant downward trend in the firm. It gives bad impression on
the share holders mind.
0
1
2
3
4
5
6
Category 1 Category 2 Category 3 Category 4
Series 1
Series 2
Series 3
8/8/2019 Proj of Fm Final
http://slidepdf.com/reader/full/proj-of-fm-final 35/86
35
f. Price earning ratio: Meaning:-
This ratio measures relationship between market value of equityshares & earning per share.
Objective:-
The objective of computing this ratio is to find out expected
return on investment in equity shares.
Components:-
There are two components of this ratio which are as under:
1. Market price per equity share
2. Earnings per share
Calculation:-
This ratio is calculated by dividing market price per equity share
by earning per share. It is expressed has an absolute this figure.
In the form of a formula this ratio may be expressed as under:
Formula: -
Price earning ratio = market value per share
Earning per share
8/8/2019 Proj of Fm Final
http://slidepdf.com/reader/full/proj-of-fm-final 36/86
36
Calculation:
year
2007-08
(Rs.in lakh)
2008-09
(Rs.in lakh)
2009-10
(Rs.in lakh)
Market price 721 394.5 1154
Earning per share 44.9 30.01 36.10
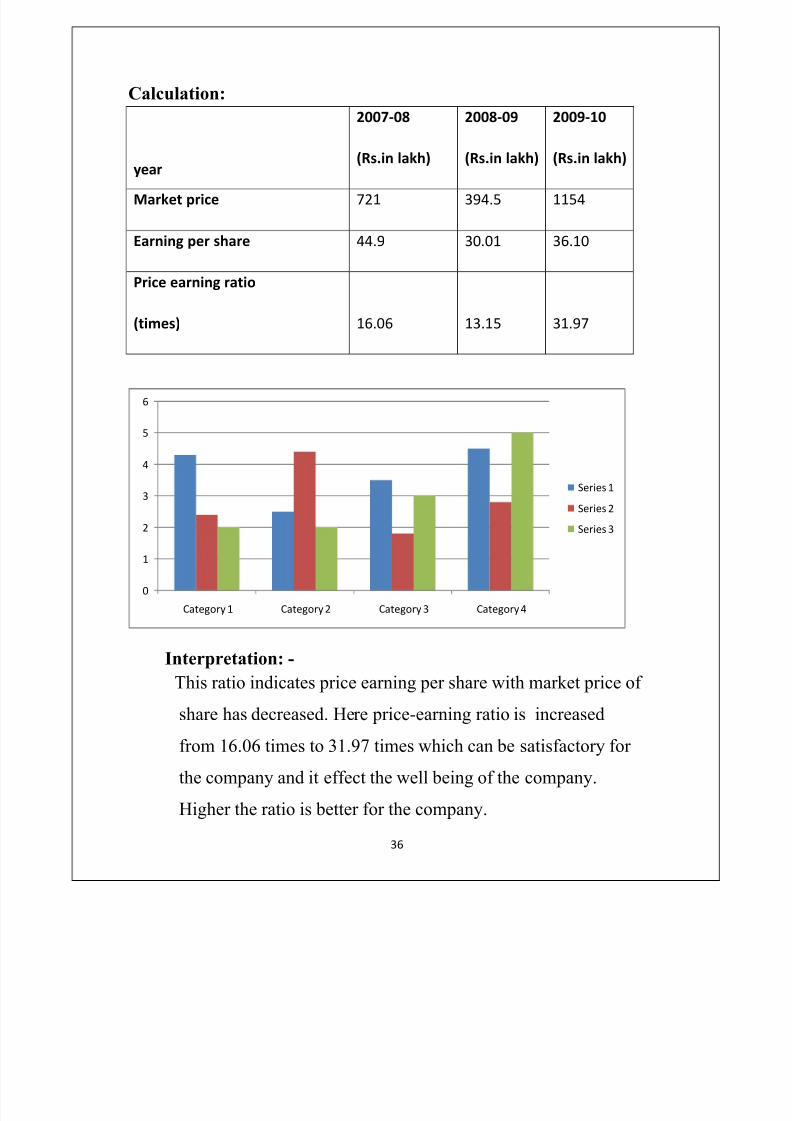
Price earning ratio
(times) 16.06 13.15 31.97
Interpretation: -
This ratio indicates price earning per share with market price of
share has decreased. Here price-earning ratio is increased
from 16.06 times to 31.97 times which can be satisfactory for
the company and it effect the well being of the company.
Higher the ratio is better for the company.
0
1
2
3
4
5
6
Category 1 Category 2 Category 3 Category 4
Series 1
Series 2
Series 3
8/8/2019 Proj of Fm Final
http://slidepdf.com/reader/full/proj-of-fm-final 37/86
37
Liquidity Ratio:
a. Current ratio:
Meaning:-
This ratio establishes a relationship between current assets &
current liabilities.
Objective:-
The objective of computing this ratio is to find the ability of
the firm to meet its short term obligation & to reflect the
short term financial strength or solvency of the firm.
Components:-
There are two components of this ratio which are as under:
1. Current Assets: Current Assets means the assets which are convertible in too cash
within a year & include the following:
y Cash balance, Marketable securities, Bills Receivables(less
provisions), Prepaid expenses, advanced payment of tax,
Bank balance, Debtors(less provisions), Stock of all types
(raw-materials, work in progress, Finished goods), Short termloans and advances(debit balance), Incomes due but not
received.
The provision for bed debt & or bills is deducted from the total
amount of trade.
8/8/2019 Proj of Fm Final
http://slidepdf.com/reader/full/proj-of-fm-final 38/86
38
2. Current Liabilities: A current liability means the liabilities which are the expected to
be matured within a year and include the following.
y Creditors, Bills payable, short term loans & advances,
Provision for taxation, Bank overdraft, and income received
in advances, unclaimed dividend.
Calculation:-
This ratio is calculated by dividing the current assets by current
liabilities. This ratio is usually express as pure ratio.
Ex. 2:1
A form of a formula this ratio may be express as under.
Formula: -
Current ratio = Current asset
Current liabilities
8/8/2019 Proj of Fm Final
http://slidepdf.com/reader/full/proj-of-fm-final 39/86
39
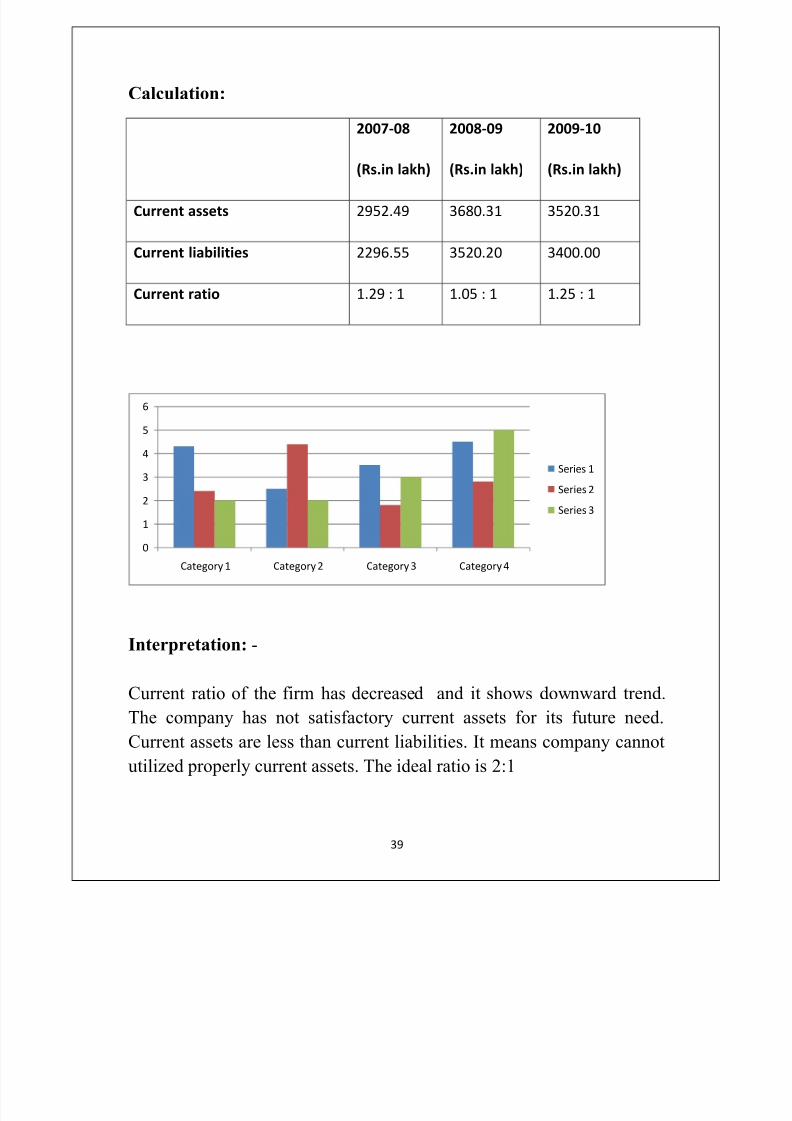
Calculation:
2007-08
(Rs.in lakh)
2008-09
(Rs.in lakh)
2009-10
(Rs.in lakh)
Current assets 2952.49 3680.31 3520.31
Current liabilities 2296.55 3520.20 3400.00
Current ratio 1.29 : 1 1.05 : 1 1.25 : 1
Interpretation: -
Current ratio of the firm has decreased and it shows downward trend.The company has not satisfactory current assets for its future need.
Current assets are less than current liabilities. It means company cannot
utilized properly current assets. The ideal ratio is 2:1
0
1
2
3
4
5
6
Category 1 Category 2 Category 3 Category 4
Series 1
Series 2
Series 3
8/8/2019 Proj of Fm Final
http://slidepdf.com/reader/full/proj-of-fm-final 40/86
40
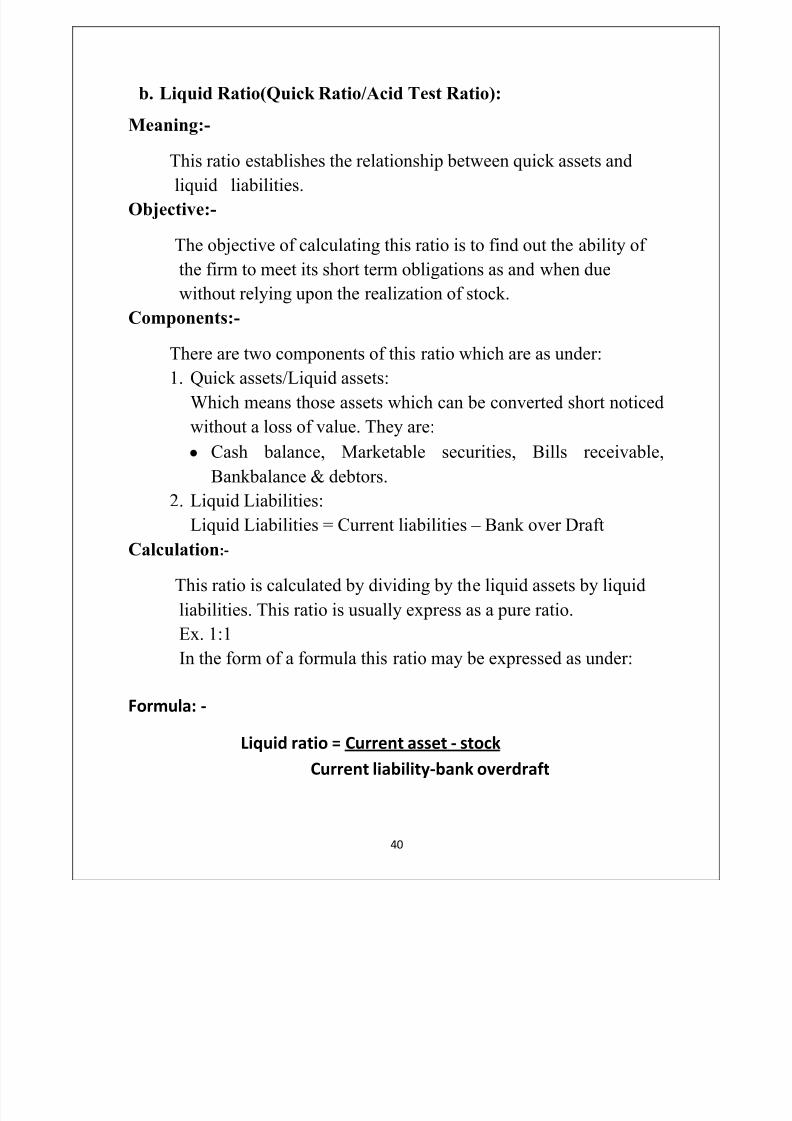
b. Liquid Ratio(Quick Ratio/Acid Test Ratio):
Meaning:-
This ratio establishes the relationship between quick assets and
liquid liabilities.
Objective:-
The objective of calculating this ratio is to find out the ability of
the firm to meet its short term obligations as and when due
without relying upon the realization of stock.
Components:-
There are two components of this ratio which are as under:1. Quick assets/Liquid assets:
Which means those assets which can be converted short noticed
without a loss of value. They are:
y Cash balance, Marketable securities, Bills receivable,
Bankbalance & debtors.
2. Liquid Liabilities:
Liquid Liabilities = Current liabilities ± Bank over DraftCalculation:-
This ratio is calculated by dividing by the liquid assets by liquid
liabilities. This ratio is usually express as a pure ratio.
Ex. 1:1
In the form of a formula this ratio may be expressed as under:
Formula: -
Liquid ratio = Current asset - stock
Current liability-bank overdraft
8/8/2019 Proj of Fm Final
http://slidepdf.com/reader/full/proj-of-fm-final 41/86
41
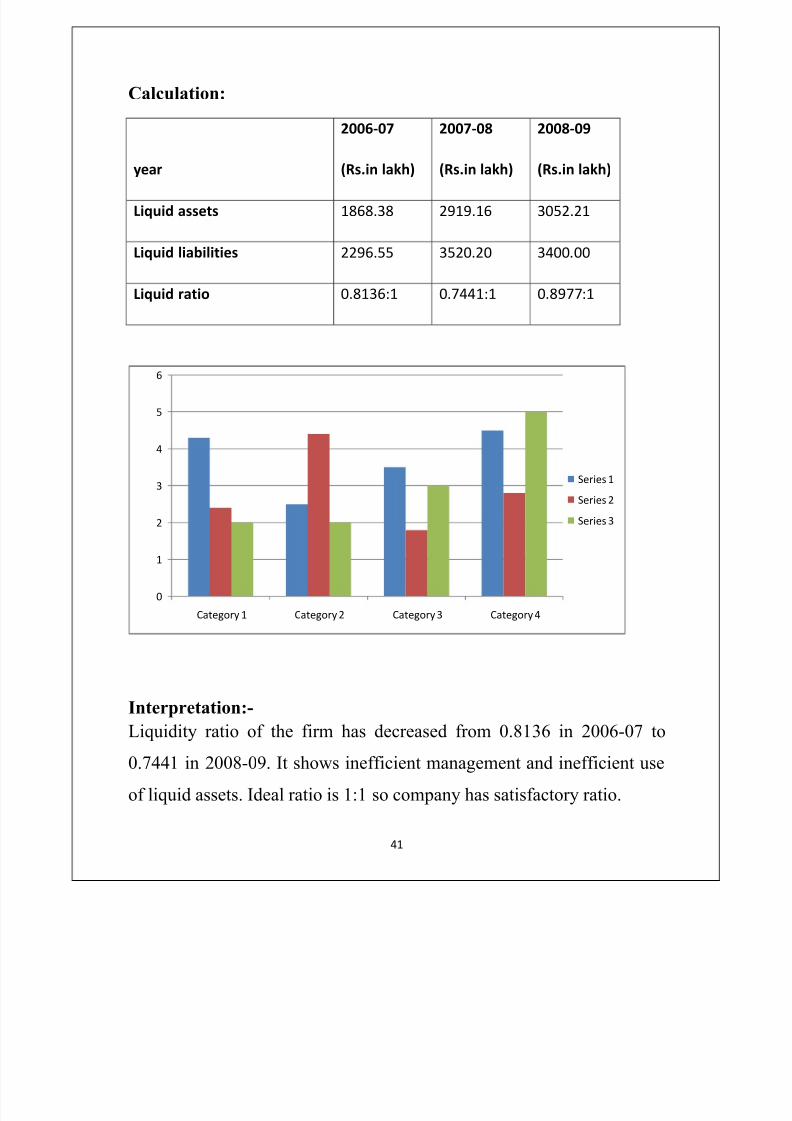
Calculation:
year
2006-07
(Rs.in lakh)
2007-08
(Rs.in lakh)
2008-09
(Rs.in lakh)
Liquid assets 1868.38 2919.16 3052.21
Liquid liabilities 2296.55 3520.20 3400.00
Liquid ratio 0.8136:1 0.7441:1 0.8977:1
Interpretation:-
Liquidity ratio of the firm has decreased from 0.8136 in 2006-07 to
0.7441 in 2008-09. It shows inefficient management and inefficient use
of liquid assets. Ideal ratio is 1:1 so company has satisfactory ratio.
0
1
2
3
4
5
6
Category 1 Category 2 Category 3 Category 4
Series 1
Series 2
Series
3
8/8/2019 Proj of Fm Final
http://slidepdf.com/reader/full/proj-of-fm-final 42/86
42
Activity Ratio:
Introduction:
This ratio measures the effectiveness with which a firm uses its
available resources. These ratios are also called turnover ratios since
they indicate the speed with which the resources are converted in to
sales. Usually the following activity ratios are calculated.
1. Stock Turnover Ratio
2. Working Capital Turnover Ratio
3. Total Assets Turnover Ratio
4. Book Value per Share Ratio
5. Debtors Ratio
6. Creditors Ratio
8/8/2019 Proj of Fm Final
http://slidepdf.com/reader/full/proj-of-fm-final 43/86
43
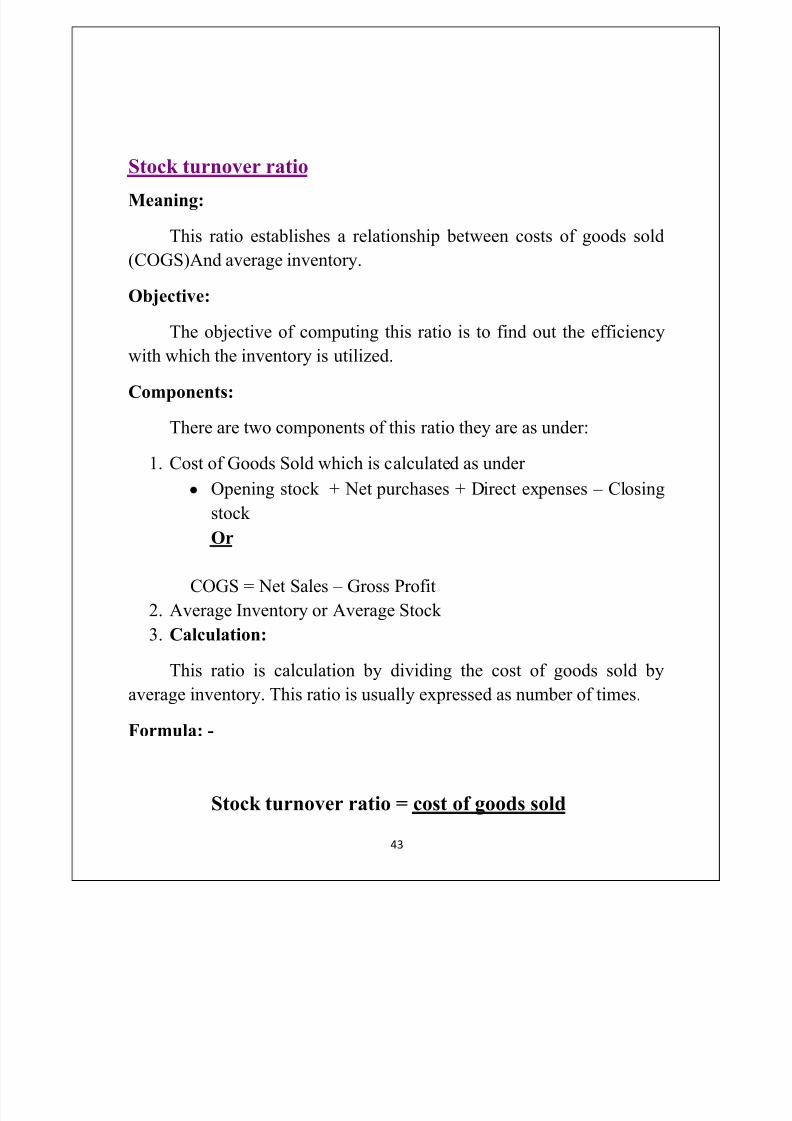
Stock turnover
ratio
Meaning:
This ratio establishes a relationship between costs of goods sold
(COGS)And average inventory.
Objective:
The objective of computing this ratio is to find out the efficiency
with which the inventory is utilized.
Components:
There are two components of this ratio they are as under:
1. Cost of Goods Sold which is calculated as under
y Opening stock + Net purchases + Direct expenses ± Closing
stock
Or
COGS = Net Sales ± Gross Profit
2. Average Inventory or Average Stock
3. Calculation: This ratio is calculation by dividing the cost of goods sold by
average inventory. This ratio is usually expressed as number of times.
Formula: -
Stock turnover ratio = cost of goods sold

8/8/2019 Proj of Fm Final
http://slidepdf.com/reader/full/proj-of-fm-final 44/86
44
Average inventory
Calculation: -
year
2006-07
(Rs.in lakh)
2007-08
(Rs.in lakh)
2008-09
(Rs.in lakh)
Cost of goods sold 7906.04 9463.68 12529.97
Average inventories 981.30 1072.39 1124.71
Stock turnover ratio (times) 8.66 8.82 8.82
Interpretation:
This ratios signifies that the average stock is turned over eight times
during the year. If figure for cost of sales are not available, then the ratiomay be calculated on the basis of sales. The ratio is very important in
judging the ability of management with which it can move the stock.
The higher the turnover ratio the more profitability the business would
be. Thus,a firm should have neither a very high nor a very low stock
turnover ratio.
0
1
2
3
4
5
6
Category 1 Category 2 Category 3 Category 4
Series 1
Series 2
Series 3
8/8/2019 Proj of Fm Final
http://slidepdf.com/reader/full/proj-of-fm-final 45/86
45
Working capital
turn
over
ratio
Meaning:-
This ratio establishes a relationship between net sales &
working capital.
Objective:-
The objective of computing this ratio is to find out the efficiency
with which the working capital is utilized.
Components:-
There are two components of this ratio which are as under:
1. Net Sales which means Gross Profit ± Sales Return
2. Working Capital which means Current Assets ± Current Liabilities
Calculation:-
This ratio is calculated by dividing the net profit by the working
capital. This ratio is usually expressed as no. of times. In the
form of a formula this ratio may be expressed as under.
Formula: -
Working Capital Turnover ratio =
8/8/2019 Proj of Fm Final
http://slidepdf.com/reader/full/proj-of-fm-final 46/86
46
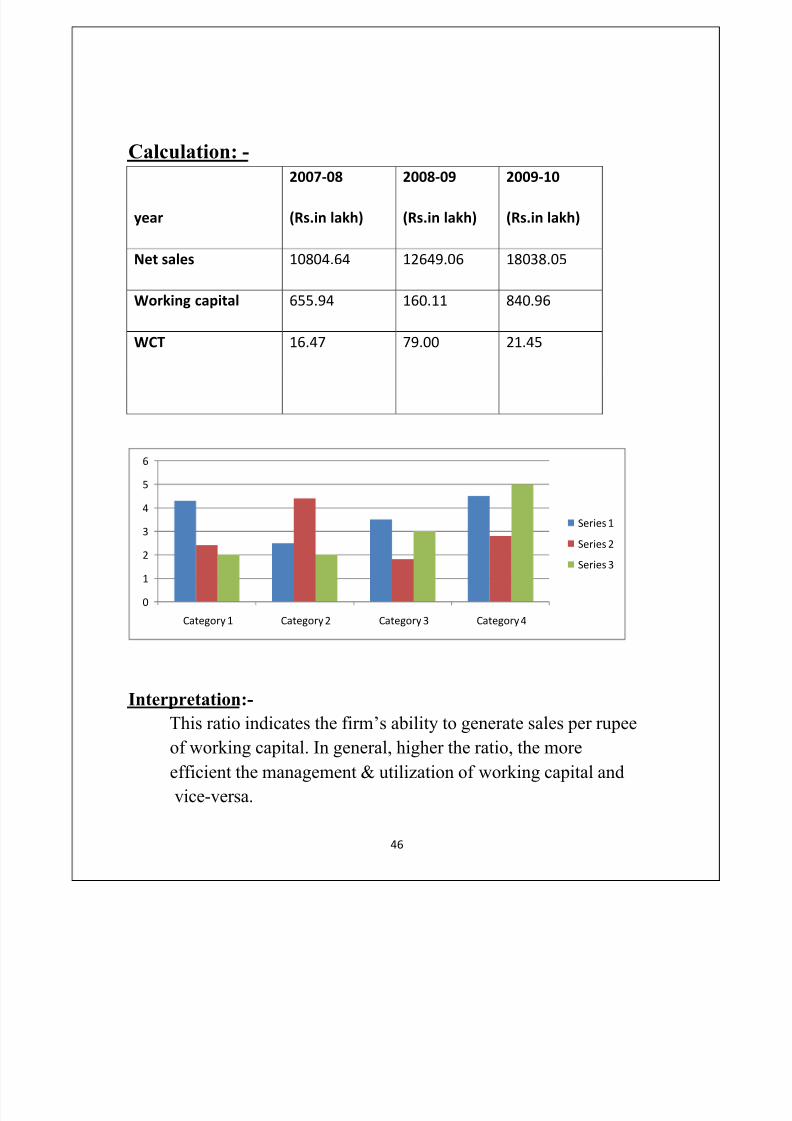
Calculation: -
year
2007-08
(Rs.in lakh)
2008-09
(Rs.in lakh)
2009-10
(Rs.in lakh)
Net sales 10804.64 12649.06 18038.05
Working capital 655.94 160.11 840.96
WCT 16.47 79.00 21.45
Interpretation:- This ratio indicates the firm¶s ability to generate sales per rupee
of working capital. In general, higher the ratio, the more
efficient the management & utilization of working capital and
vice-versa.
0
1
2
3
4
5
6
Category 1 Category 2 Category 3 Category 4
Series 1
Series 2
Series 3
8/8/2019 Proj of Fm Final
http://slidepdf.com/reader/full/proj-of-fm-final 47/86
47
Total Turnover Ratio
Meaning:
This ratio measures the overall performance or activity of the
business enterprise.
Objective:
The objective of calculating this ratio is to point out the efficiency
or inefficiency in the use of total assets.
Components:
There are two components of this ratio which
1. Net Sales2. Total Assets
Calculation:
This ratio is calculated by dividing net sales by total assets.
Total Assets Turnover Ratio =
8/8/2019 Proj of Fm Final
http://slidepdf.com/reader/full/proj-of-fm-final 48/86
48
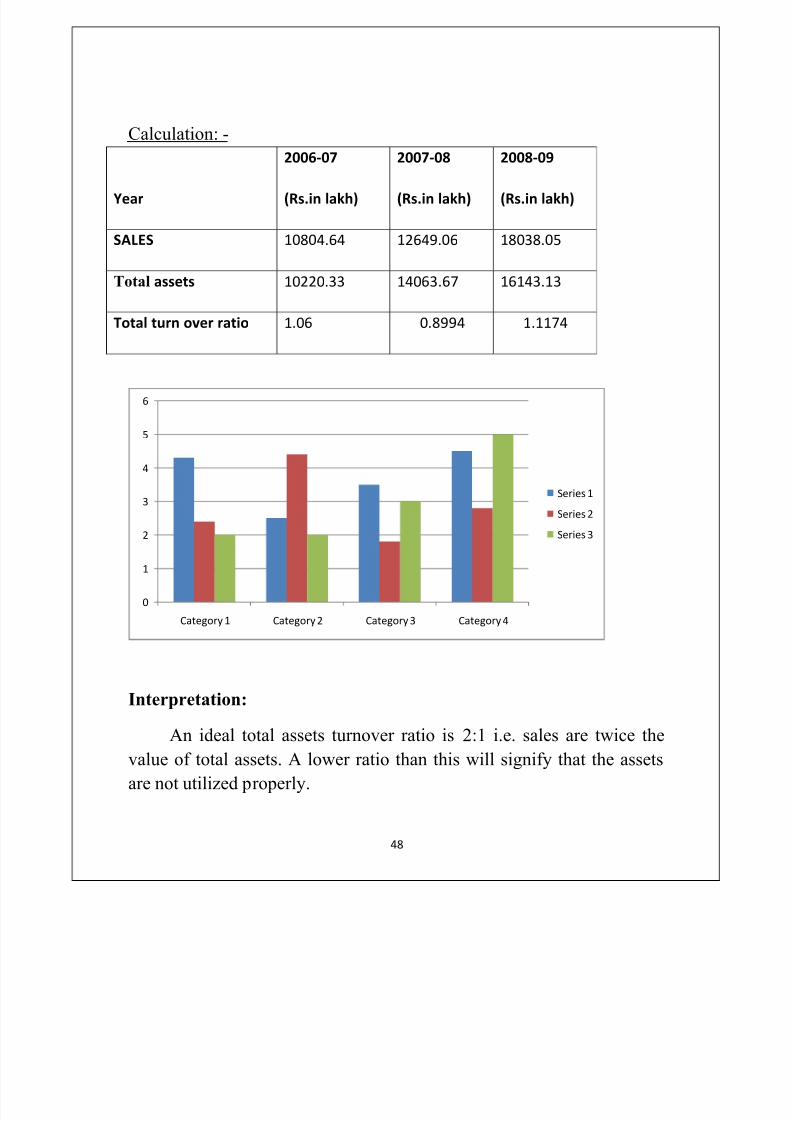
Calculation: -
Year
2006-07
(Rs.in lakh)
2007-08
(Rs.in lakh)
2008-09
(Rs.in lakh)
SALES 10804.64 12649.06 18038.05
Total assets 10220.33 14063.67 16143.13
Total turn over ratio 1.06 0.8994 1.1174
Interpretation:
An ideal total assets turnover ratio is 2:1 i.e. sales are twice the
value of total assets. A lower ratio than this will signify that the assets
are not utilized properly.
0
1
2
3
4
5
6
Category 1 Category 2 Category 3 Category 4
Series 1
Series 2
Series 3

8/8/2019 Proj of Fm Final
http://slidepdf.com/reader/full/proj-of-fm-final 49/86
49
Book Value Per Share
Meaning:
This ratio establishes relationship between equity share capital &
reserves and surplus with no. of shares.
Objective:
The objective of computing this ratio is to find out the proportion
of share capital & reserves & surplus with no. of equity shares.
Components:
There are two components of this ratio
1. Equity share capital & reserves and surplus
2. No. of equity shares
Calculation:
This ratio is computed by dividing equity share capital & reserves
& surplus by no. of equity shares. It is expressed as an absolute figure.
Book Value per Share Ratio =

8/8/2019 Proj of Fm Final
http://slidepdf.com/reader/full/proj-of-fm-final 50/86
50
Calculation: -
Year
2007-08
(Rs.in lakh)
2008-09
(Rs.in lakh)
2009-10
(Rs.in lakh)
Eq. shares+Resrves &
surplus 4350.07 5262.08 7826.77
No. of eq shares 23.91 27.26 56.89
Book valueper share 181.94 193.03 138.31
Interpretation:
In general higher the ratio better it is because this ratio measures
relationship between share capital and reserves & surplus with no. of
equity shares. In the most of the companies the amount of equity share
capital remains constant & the value of reserves & surplus charges.
Whenever company has high amount of profits, the value of reserves &
surplus will increase. Therefore higher book value per share means high
amount of profitability.
0
1
2
3
4
5
6
Category 1 Category 2 Category 3 Category 4
Series 1
Series 2
Series 3
8/8/2019 Proj of Fm Final
http://slidepdf.com/reader/full/proj-of-fm-final 51/86
51
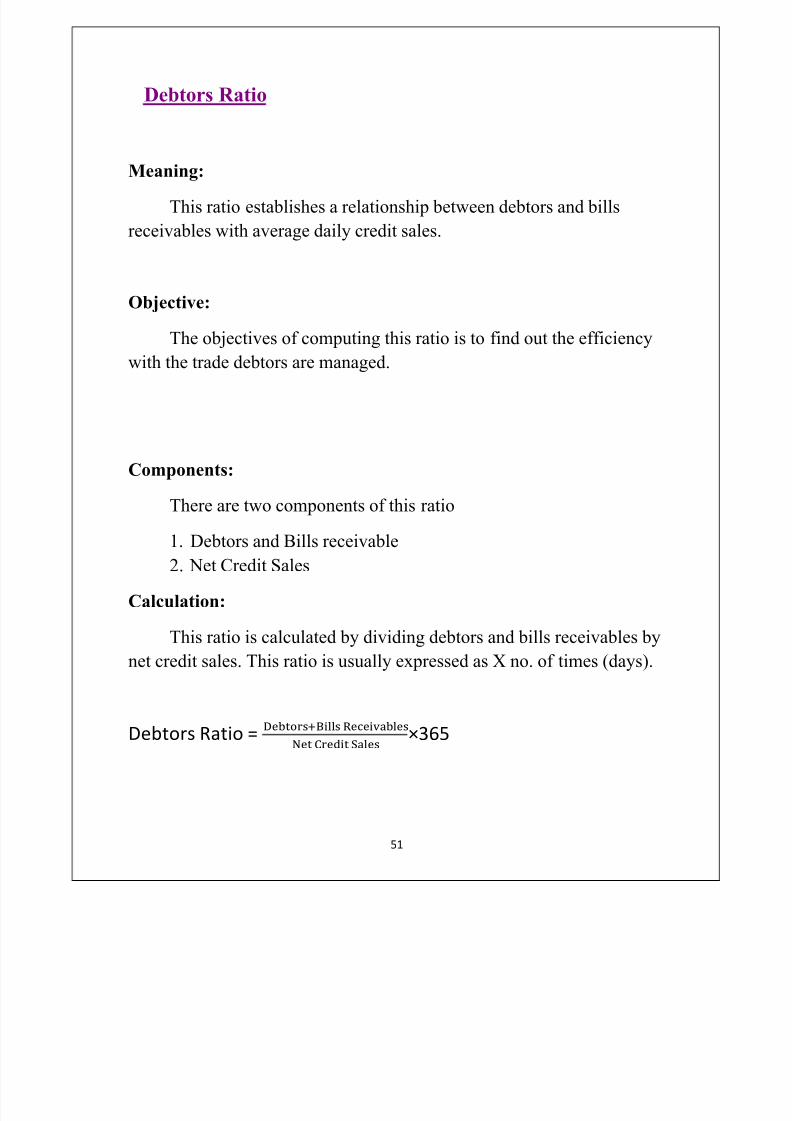
Debtors Ratio
Meaning:
This ratio establishes a relationship between debtors and bills
receivables with average daily credit sales.
Objective:
The objectives of computing this ratio is to find out the efficiency
with the trade debtors are managed.
Components:
There are two components of this ratio
1. Debtors and Bills receivable
2. Net Credit Sales
Calculation:
This ratio is calculated by dividing debtors and bills receivables by
net credit sales. This ratio is usually expressed as X no. of times (days).
Debtors Ratio =
×365
8/8/2019 Proj of Fm Final
http://slidepdf.com/reader/full/proj-of-fm-final 52/86
52
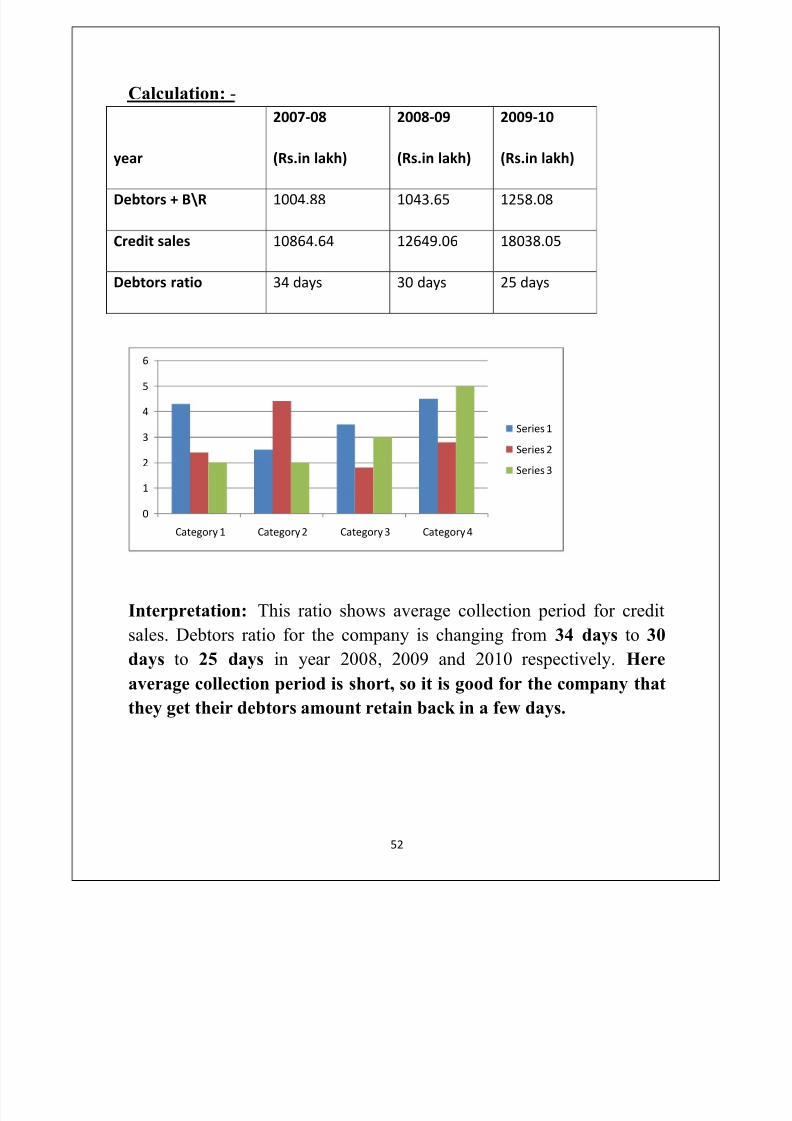
Calculation: -
year
2007-08
(Rs.in lakh)
2008-09
(Rs.in lakh)
2009-10
(Rs.in lakh)
Debtors + B\R 1004.88 1043.65 1258.08
Credit sales 10864.64 12649.06 18038.05
Debtors ratio 34 days 30 days 25 days
Interpretation: This ratio shows average collection period for credit
sales. Debtors ratio for the company is changing from 34 days to 30
days to 25 days in year 2008, 2009 and 2010 respectively. Here
average collection period is short, so it is good for the company that
they get their debtors amount retain back in a few days.
0
1
2
3
4
5
6
Category 1 Category 2 Category 3 Category 4
Series 1
Series 2
Series 3
8/8/2019 Proj of Fm Final
http://slidepdf.com/reader/full/proj-of-fm-final 53/86
53
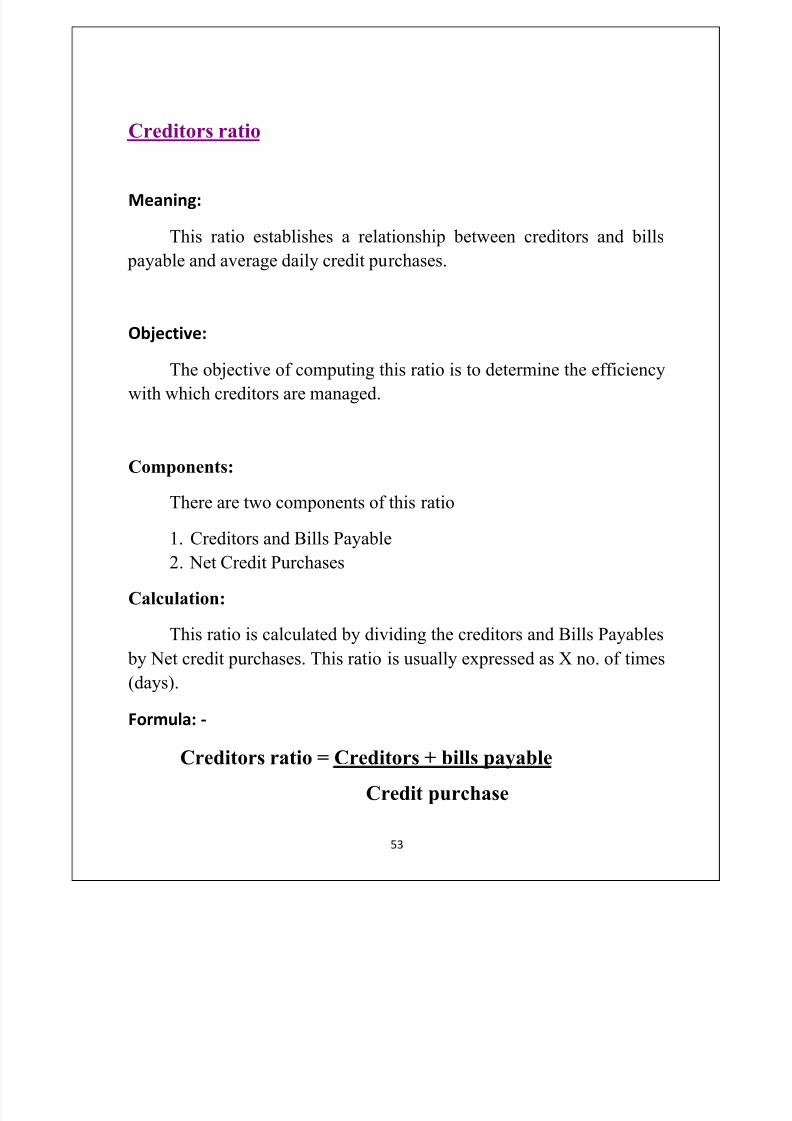
Creditors ratio
Meaning:
This ratio establishes a relationship between creditors and bills
payable and average daily credit purchases.
Objective:
The objective of computing this ratio is to determine the efficiency
with which creditors are managed.
Components:
There are two components of this ratio
1. Creditors and Bills Payable
2. Net Credit Purchases
Calculation:
This ratio is calculated by dividing the creditors and Bills Payables
by Net credit purchases. This ratio is usually expressed as X no. of times
(days).
Formula: -
Creditors ratio = Creditors + bills payable
Credit purchase
8/8/2019 Proj of Fm Final
http://slidepdf.com/reader/full/proj-of-fm-final 54/86
54
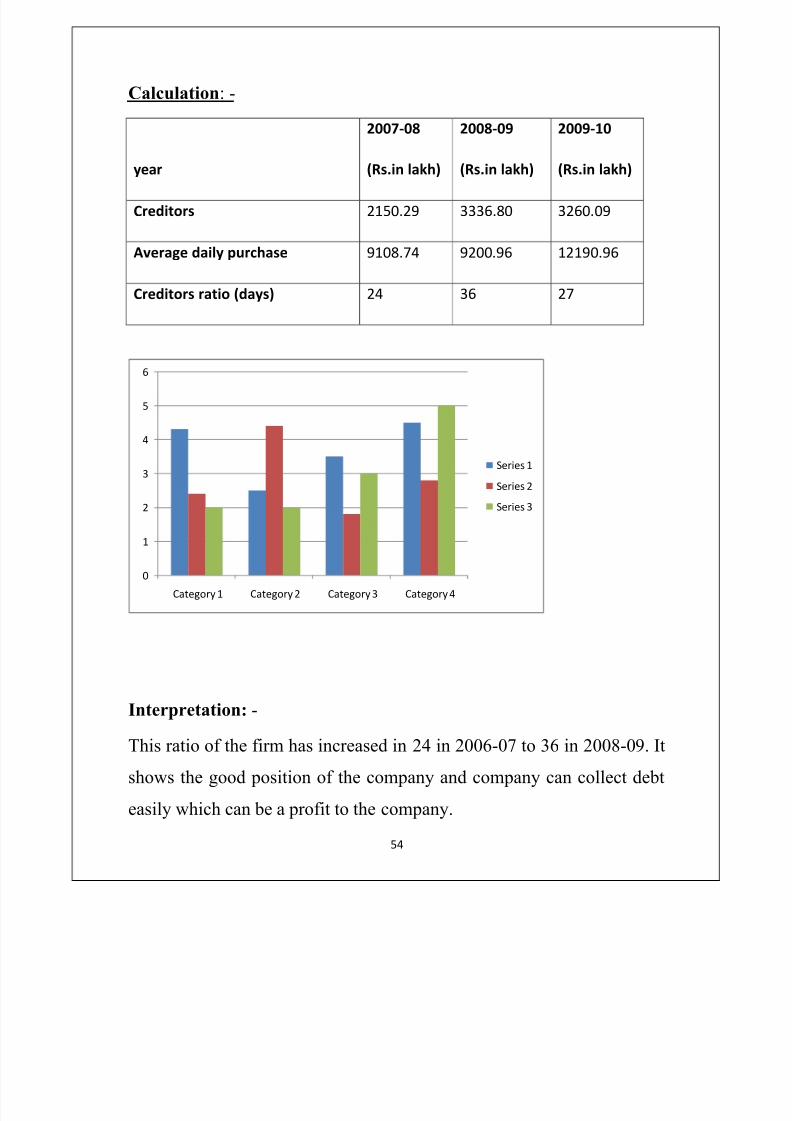
Calculation: -
year
2007-08
(Rs.in lakh)
2008-09
(Rs.in lakh)
2009-10
(Rs.in lakh)
Creditors 2150.29 3336.80 3260.09
Average daily purchase 9108.74 9200.96 12190.96
Creditors ratio (days) 24 36 27
Interpretation: -
This ratio of the firm has increased in 24 in 2006-07 to 36 in 2008-09. It
shows the good position of the company and company can collect debt
easily which can be a profit to the company.
0
1
2
3
4
5
6
Category 1 Category 2 Category 3 Category 4
Series 1
Series 2
Series 3
8/8/2019 Proj of Fm Final
http://slidepdf.com/reader/full/proj-of-fm-final 55/86
55
Leverage Ratio
Capital Structure Ratio (Capital Gearing Ratio)
Meaning:
Capital structure of a company consist of a verity of securities
Ex. Equity share & preference share which satisfy its share capitalrequirements while by other securities such as debentures, warrants etc.
the company satisfies its access requirement of long term capital &
borrowed capital, leverage ratios are calculated. Sum of the leverage
ratios are as under.
1. Debt equity ratio
2. Proprietary ratio
3. Capital Gearing ratio
4. Long term funds to fixed assets ratio
8/8/2019 Proj of Fm Final
http://slidepdf.com/reader/full/proj-of-fm-final 56/86
56
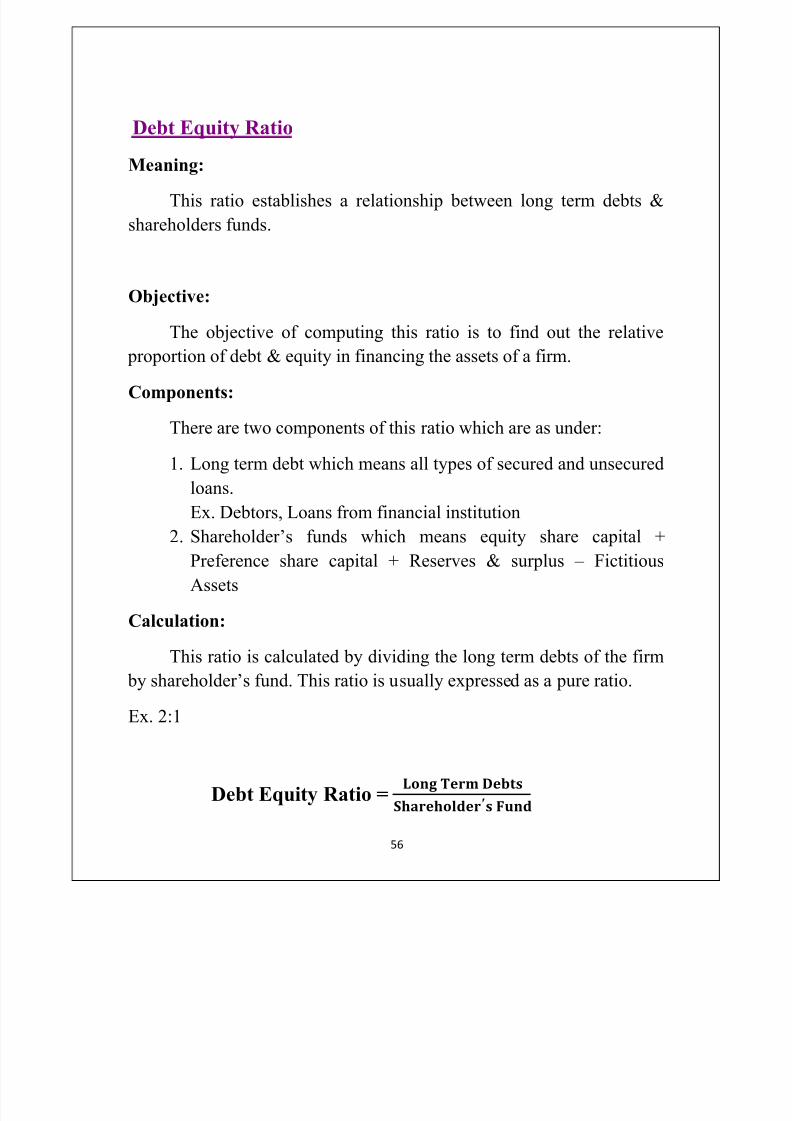
Debt Equity Ratio
Meaning:
This ratio establishes a relationship between long term debts &
shareholders funds.
Objective:
The objective of computing this ratio is to find out the relative
proportion of debt & equity in financing the assets of a firm.
Components:
There are two components of this ratio which are as under:
1. Long term debt which means all types of secured and unsecured
loans.
Ex. Debtors, Loans from financial institution
2. Shareholder¶s funds which means equity share capital +
Preference share capital + Reserves & surplus ± Fictitious
Assets
Calculation:
This ratio is calculated by dividing the long term debts of the firm
by shareholder¶s fund. This ratio is usually expressed as a pure ratio.
Ex. 2:1
Debt Equity Ratio =
8/8/2019 Proj of Fm Final
http://slidepdf.com/reader/full/proj-of-fm-final 57/86
57
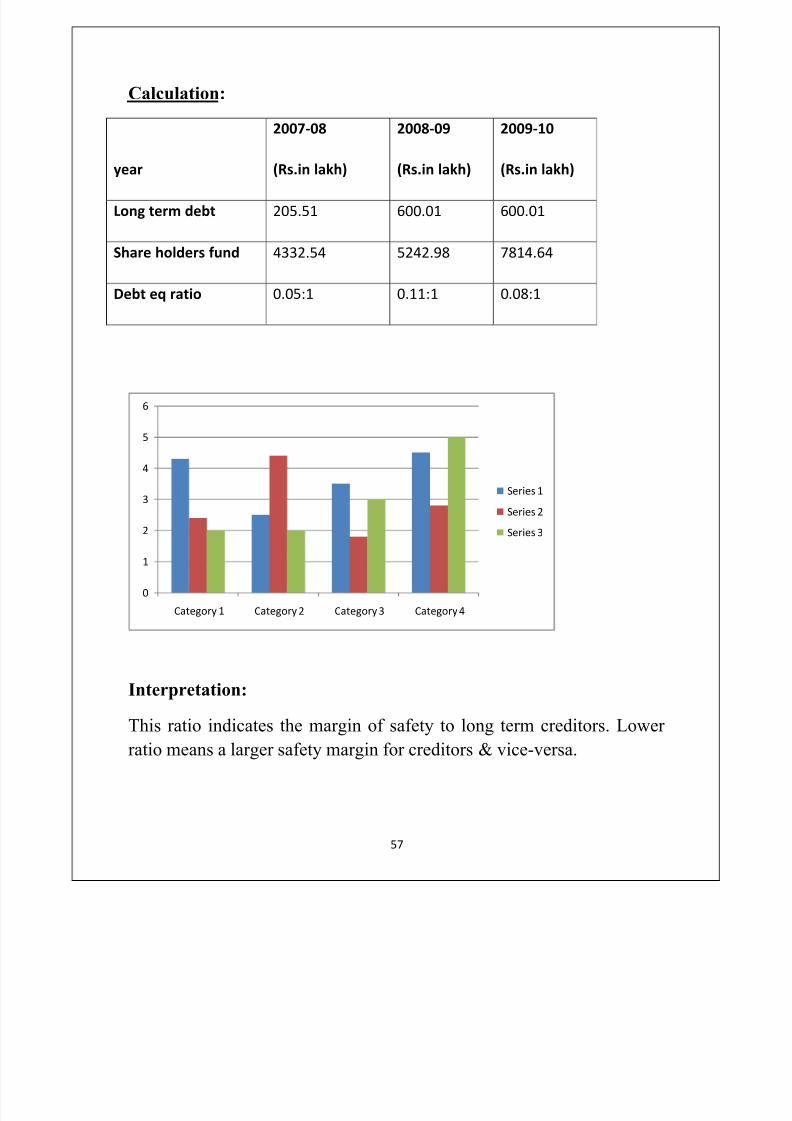
Calculation:
year
2007-08
(Rs.in lakh)
2008-09
(Rs.in lakh)
2009-10
(Rs.in lakh)
Long term debt 205.51 600.01 600.01
Share holders fund 4332.54 5242.98 7814.64
Debt eq ratio 0.05:1 0.11:1 0.08:1
Interpretation:
This ratio indicates the margin of safety to long term creditors. Lower
ratio means a larger safety margin for creditors & vice-versa.
0
1
2
3
4
5
6
Category 1 Category 2 Category 3 Category 4
Series 1
Series 2
Series 3
8/8/2019 Proj of Fm Final
http://slidepdf.com/reader/full/proj-of-fm-final 58/86
58
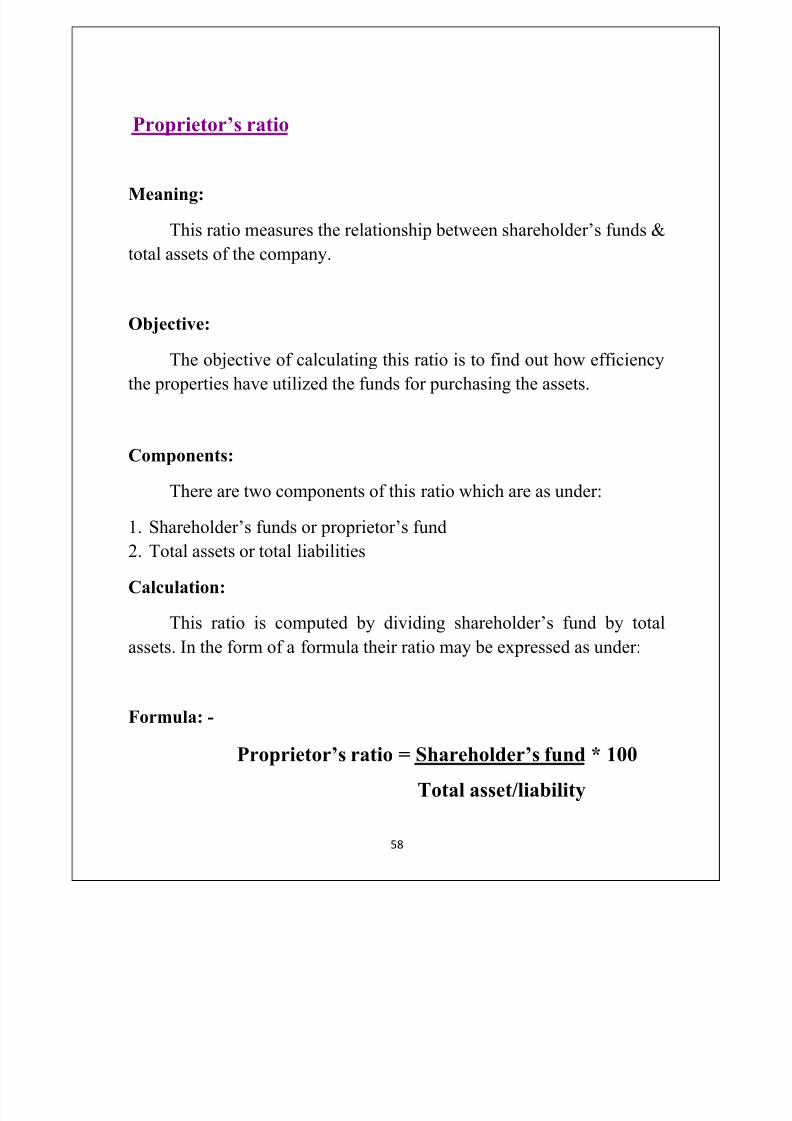
Proprietor¶s ratio
Meaning:
This ratio measures the relationship between shareholder¶s funds &
total assets of the company.
Objective:
The objective of calculating this ratio is to find out how efficiency
the properties have utilized the funds for purchasing the assets.
Components:
There are two components of this ratio which are as under:
1. Shareholder¶s funds or proprietor¶s fund2. Total assets or total liabilities
Calculation:
This ratio is computed by dividing shareholder¶s fund by total
assets. In the form of a formula their ratio may be expressed as under:
Formula: -
Proprietor¶s ratio = Shareholder¶s fund * 100
Total asset/liability
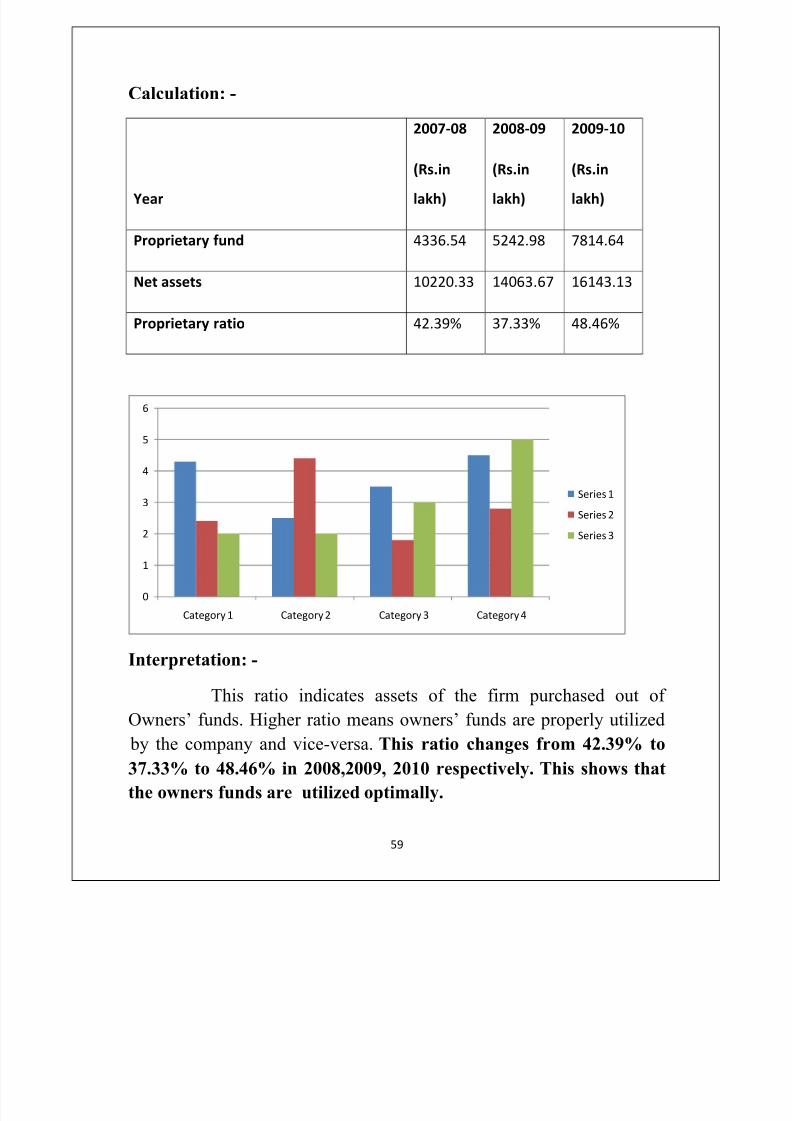
8/8/2019 Proj of Fm Final
http://slidepdf.com/reader/full/proj-of-fm-final 59/86
59
Calculation: -
Year
2007-08
(Rs.inlakh)
2008-09
(Rs.inlakh)
2009-10
(Rs.inlakh)
Proprietary fund 4336.54 5242.98 7814.64
Net assets 10220.33 14063.67 16143.13
Proprietary ratio 42.39% 37.33% 48.46%
Interpretation: -
This ratio indicates assets of the firm purchased out of Owners¶ funds. Higher ratio means owners¶ funds are properly utilized
by the company and vice-versa. This ratio changes from 42.39% to
37.33% to 48.46% in 2008,2009, 2010 respectively. This shows that
the owners funds are utilized optimally.
0
1
2
3
4
5
6
Category 1 Category 2 Category 3 Category 4
Series 1
Series 2
Series 3

8/8/2019 Proj of Fm Final
http://slidepdf.com/reader/full/proj-of-fm-final 60/86
60
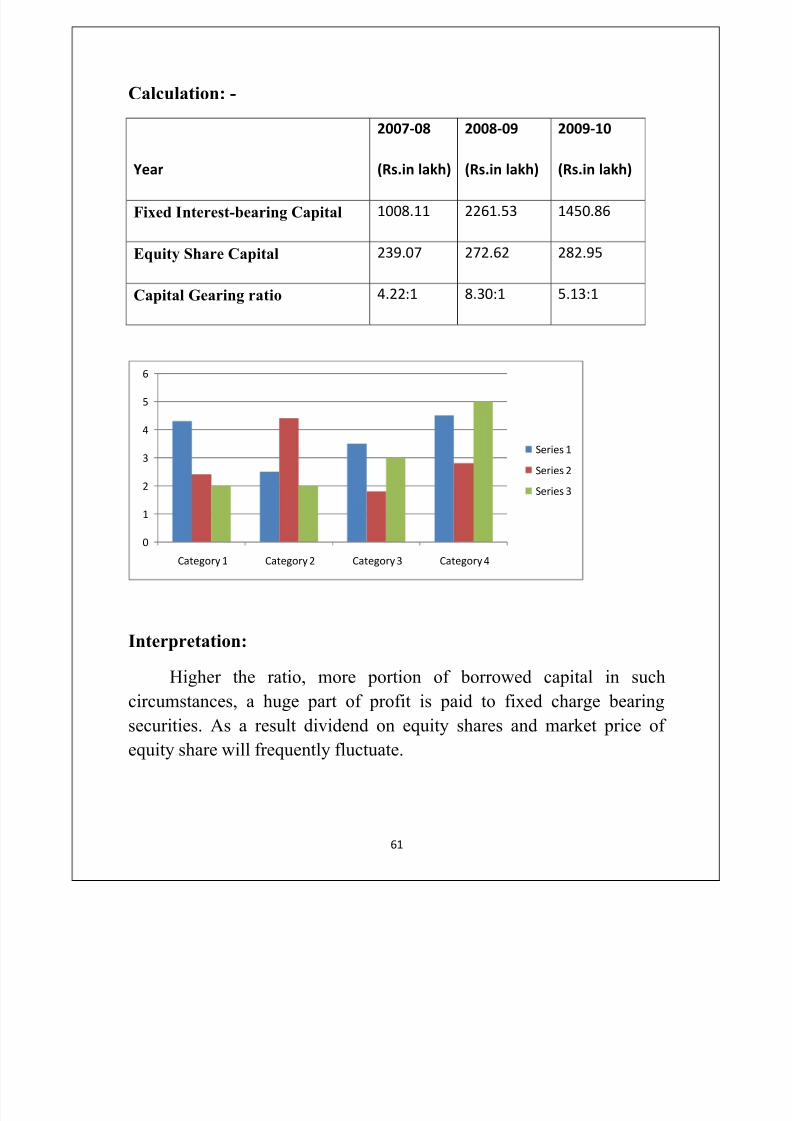
Capital Gearing Ratio
Meaning:
This ratio measures a relationship between equity shares capitaland fixed interest bearing capital.
Objectives:
The objective of computing this ratio is to find out the proportion
between fixed interest bearing capital & equity share capital.
Components:
There are two components of this ratio which are as under:
1. Fixed interest bearing capital (preference share capital,
debenture, long term loan)
2. Equity share capital
Calculation:
This ratio is calculated by dividing fixed increased bearing capital
by equity share capital. This ratio is expressed as a pure ratio. In the
form of a formula this ratio may be expressed as under:
Capital Gearing Ratio =
8/8/2019 Proj of Fm Final
http://slidepdf.com/reader/full/proj-of-fm-final 61/86
61
Calculation: -
Year
2007-08
(Rs.in lakh)
2008-09
(Rs.in lakh)
2009-10
(Rs.in lakh)
Fixed Interest-bearing Capital 1008.11 2261.53 1450.86
Equity Share Capital 239.07 272.62 282.95
Capital Gearing ratio 4.22:1 8.30:1 5.13:1
Interpretation:
Higher the ratio, more portion of borrowed capital in such
circumstances, a huge part of profit is paid to fixed charge bearingsecurities. As a result dividend on equity shares and market price of
equity share will frequently fluctuate.
0
1
2
3
4
5
6
Category 1 Category 2 Category 3 Category 4
Series 1
Series 2
Series 3
8/8/2019 Proj of Fm Final
http://slidepdf.com/reader/full/proj-of-fm-final 62/86
62
Long term fund to fixed asset ratio
Meaning:
This ratio measures a relationship between long term funds to fixed
assets.
Objective:
With the help of this ratio one can move how efficiently the long
term funds have been invested in fixed assets.
Components:
There are two components of this ratio which are as under:
1. Shareholder¶s funds + Long term debts
2. Fixed assets
Calculation:
This ratio is calculated by dividing shareholder¶s funds & longterm debts by fixed assets. It is expressed as pure ratio.
Formula:
Long Term Funds to
Fixed Assets Ratio =
Here, Shareholder¶s Funds = Preference share + Reserves & Surplus +
Equity Share Capital + Profit and Loss A/c credit balance ± Fictitious
Assets
And Long Term Debts = Debenture and Long Term Loan

8/8/2019 Proj of Fm Final
http://slidepdf.com/reader/full/proj-of-fm-final 63/86
63
Calculation: -
year
2007-08
(Rs.in lakh)
2008-09
(Rs.in lakh)
2009-10
(Rs.in lakh)
Long term funds 2587.06 4052.76 2880.15
Fixed assets 2360.09 3216.33 3707.72
Long term funds to fixed ratio 1.096:1 1.26:1 0.78:1
Interpretation: -
Long-term ratio decreased from 1.096 to 1.26. It has shown fall inthe ratio. The fixed assets should always be acquired out of long-term
funds, meaning thereby that this ratio should not be less than 100. The
company has not achieved a good ratio as it shows a downward trend.
0
1
2
3
4
5
6
Category 1 Category 2 Category 3 Category 4
Series 1
Series 2
Series 3

8/8/2019 Proj of Fm Final
http://slidepdf.com/reader/full/proj-of-fm-final 64/86
64
Common Size Analysis
Ratio analysis is a part another useful way of analyzing financial
statement is to convert them into common size statement by expressing
absolute rupee amounts into percentages. When this method is pursued
the income statement exhibits each expense item or group of expense.
Items as a percentage of net sales and net sales are taken at 100 percent.
Similarly, each individual asset and liability respectively statement are
prepared. His ways are referred to as common size statement.
5) Common Size Statement of Profit & Loss Account
Particular
Amount in Corer % of Sales
2007-08 2008-09 2009-10 07-08 08-09 09-10
Sales 10804.64 12649.0618038.0
5100 100 100
(-)C.O.G.S. 7906.04 9463.68 12529.20 73.17 74.82 69.46
GP 5525.47 3260.51 2926.91 51.14 25.78 16.23
(-) Admini.
Exp.8612.23 10298.84 13544.68 79.71 81.42 75.09
(-) Selling
Exp.1608.96 1777.34 2161.74 14.89 14.05 11.98
(-)FinancialExp. 262.9 336.77 398.59 2.57 2.66 2.21
Net Profit
8/8/2019 Proj of Fm Final
http://slidepdf.com/reader/full/proj-of-fm-final 65/86
65
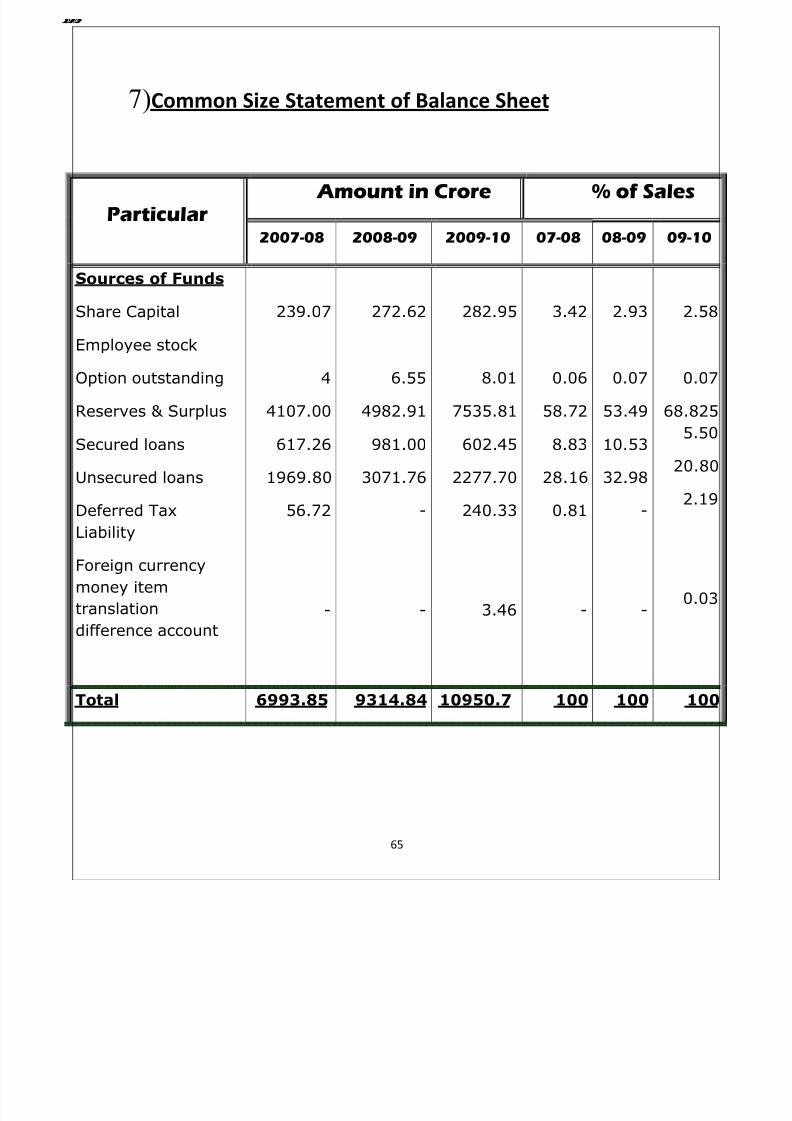
7)Common Size Statement of Balance Sheet
Particular
Amount in Crore % of Sales
2007-08 2008-09 2009-10 07-08 08-09 09-10
Sources of Funds
Share Capital
Employee stock
Option outstanding
Reserves & Surplus
Secured loans
Unsecured loans
Deferred Tax
Liability
Foreign currency
money item
translation
difference account
239.07
4
4107.00
617.26
1969.80
56.72
-
272.62
6.55
4982.91
981.00
3071.76
-
-
282.95
8.01
7535.81
602.45
2277.70
240.33
3.46
3.42
0.06
58.72
8.83
28.16
0.81
-
2.93
0.07
53.49
10.53
32.98
-
-
2.5
0.0
68.82
5.5
20.8
2.1
0.0
Total 6993.85 9314.84 10950.7 100 100 10
8/8/2019 Proj of Fm Final
http://slidepdf.com/reader/full/proj-of-fm-final 66/86
66
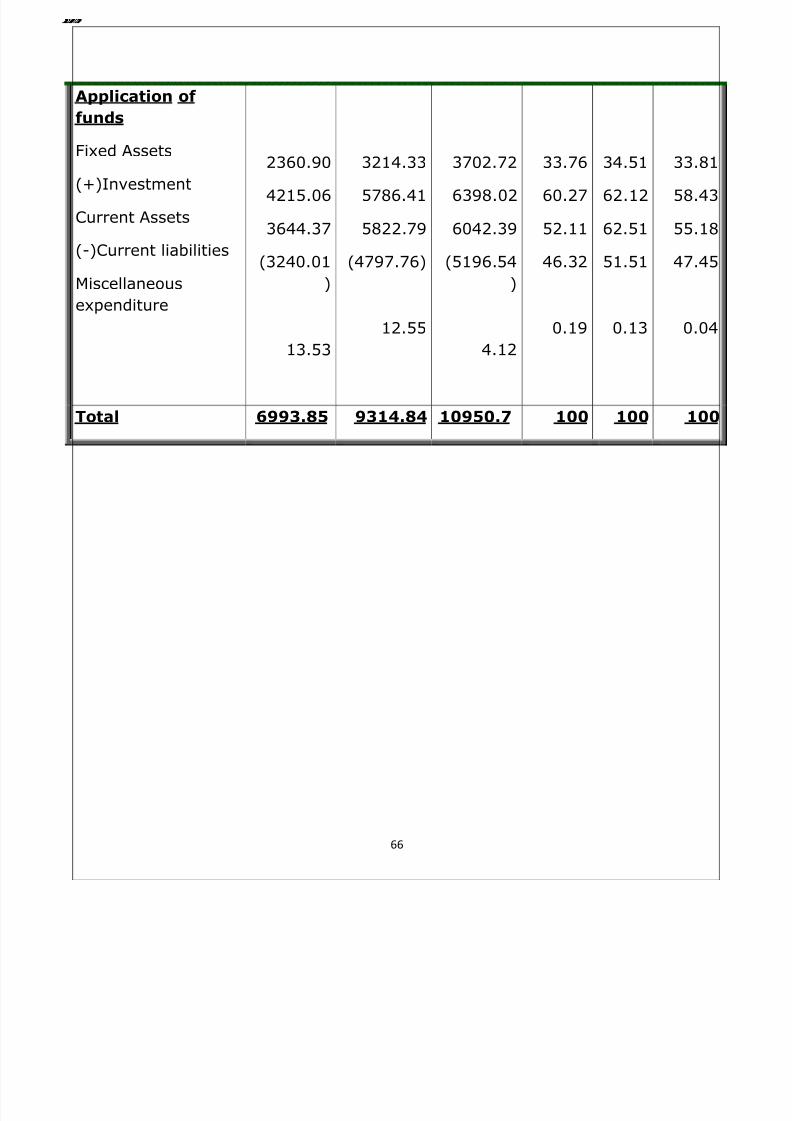
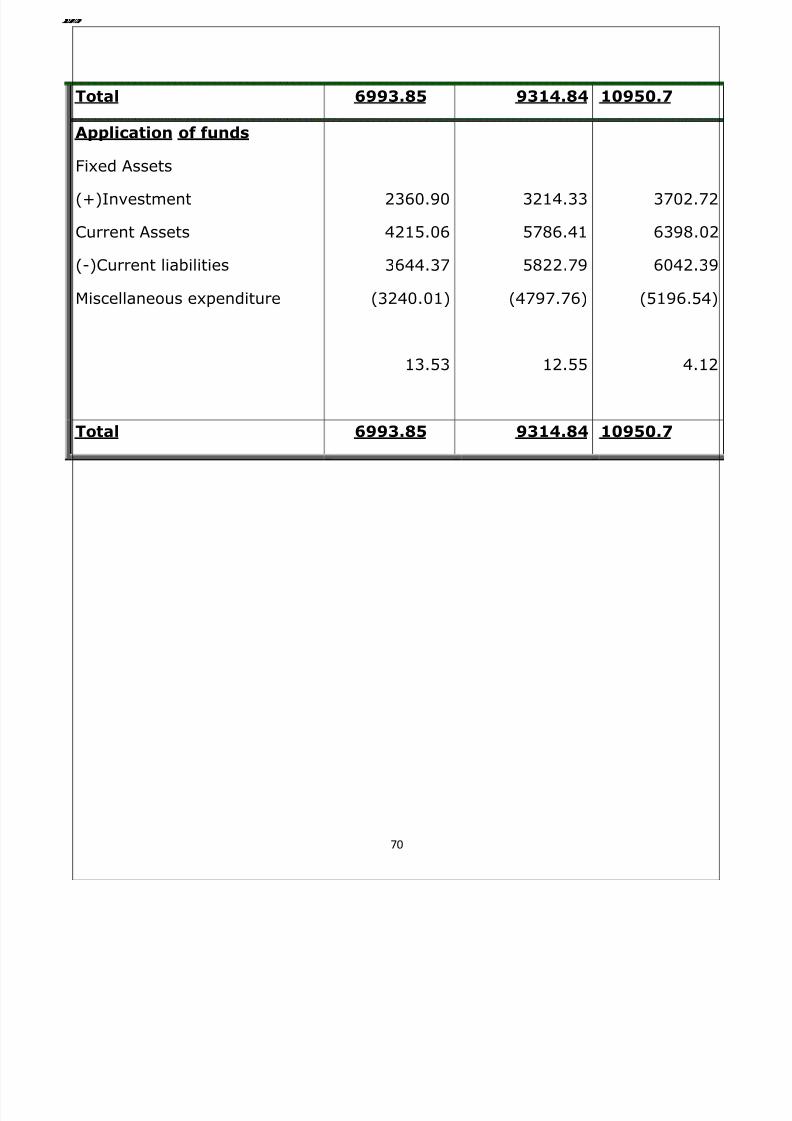
Application of
funds
Fixed Assets
(+)Investment
Current Assets
(-)Current liabilities
Miscellaneous
expenditure
2360.90
4215.06
3644.37
(3240.01
)
13.53
3214.33
5786.41
5822.79
(4797.76)
12.55
3702.72
6398.02
6042.39
(5196.54
)
4.12
33.76
60.27
52.11
46.32
0.19
34.51
62.12
62.51
51.51
0.13
33.8
58.4
55.1
47.4
0.0
Total 6993.85 9314.84 10950.7 100 100 10
8/8/2019 Proj of Fm Final
http://slidepdf.com/reader/full/proj-of-fm-final 67/86
67
Comparative Statement Analysis
A simple method of tracing periodic changes in the financial performance of a company is to comparative statements. Comparative
financial statements will contain items at least for two periods. Changes
increases or decreases in income statement and balance sheet over
period can be shown on two ways:
(1) Aggregate Changes
(2) Proportional Changes
Aggregate changes can be indicated by drawing special column for
aggregate amount or percentage or both of increase or decrease. Relative
or prepositional, changes, and other hand are shown by recording
percentage calculation in relation to a common base in special columns.For example in the case of profit and loss statement, sales figure is
assumed to be shown. Such percentages are generally based on value of
total assets. In order to show the working capital position the current
liabilities are shown as deduction from current assets.
8/8/2019 Proj of Fm Final
http://slidepdf.com/reader/full/proj-of-fm-final 68/86
68
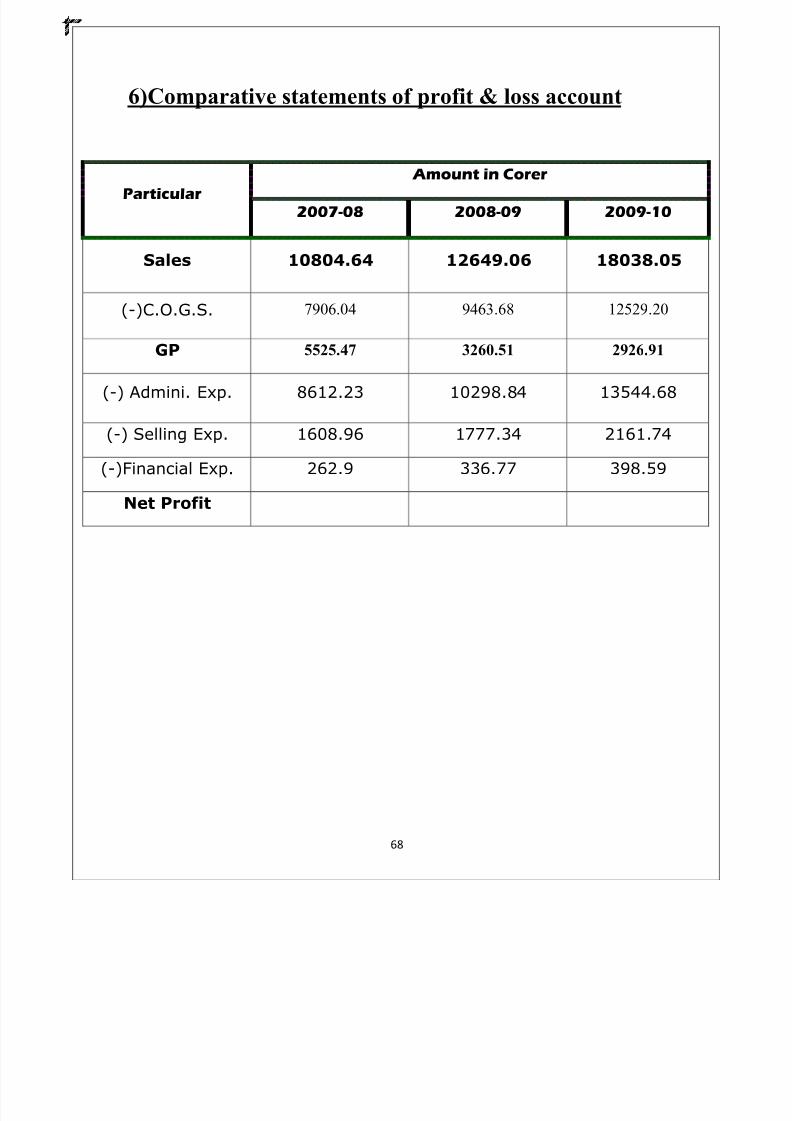
6)Comparative statements of profit & loss account
Particular Amount in Corer
2007-08 2008-09 2009-10
Sales 10804.64 12649.06 18038.05
(-)C.O.G.S. 7906.04 9463.68 12529.20
GP 5525.47 3260.51 2926.91
(-) Admini. Exp. 8612.23 10298.84 13544.68
(-) Selling Exp. 1608.96 1777.34 2161.74
(-)Financial Exp. 262.9 336.77 398.59
Net Profit
8/8/2019 Proj of Fm Final
http://slidepdf.com/reader/full/proj-of-fm-final 69/86
69
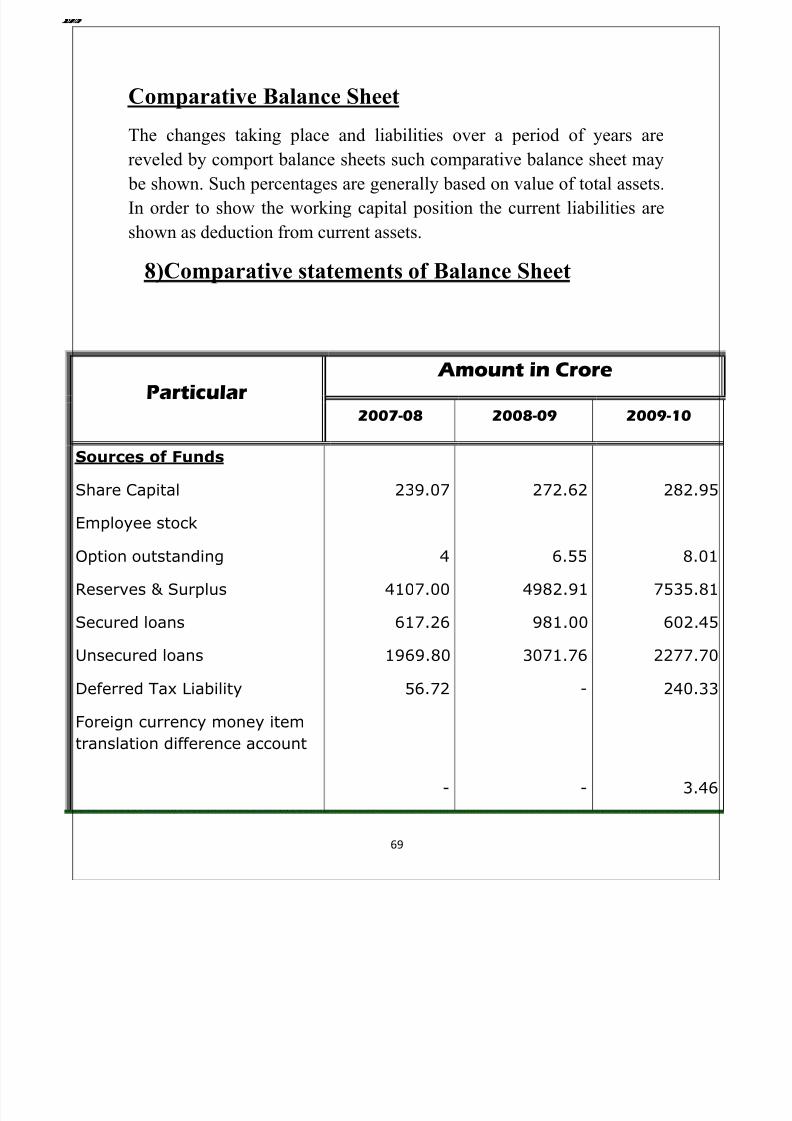
Comparative Balance Sheet
The changes taking place and liabilities over a period of years are
reveled by comport balance sheets such comparative balance sheet may
be shown. Such percentages are generally based on value of total assets.
In order to show the working capital position the current liabilities are
shown as deduction from current assets.
8)Comparative statements of Balance Sheet
Particular
Amount in Crore
2007-08 2008-09 2009-10
Sources of Funds
Share Capital
Employee stock
Option outstanding
Reserves & Surplus
Secured loans
Unsecured loans
Deferred Tax Liability
Foreign currency money item
translation difference account
239.07
4
4107.00
617.26
1969.80
56.72
-
272.62
6.55
4982.91
981.00
3071.76
-
-
282.9
8.0
7535.8
602.4
2277.7
240.3
3.4
8/8/2019 Proj of Fm Final
http://slidepdf.com/reader/full/proj-of-fm-final 70/86
70
Total 6993.85 9314.84 10950.7
Application of funds
Fixed Assets
(+)Investment
Current Assets
(-)Current liabilities
Miscellaneous expenditure
2360.90
4215.06
3644.37
(3240.01)
13.53
3214.33
5786.41
5822.79
(4797.76)
12.55
3702.7
6398.0
6042.3
(5196.54
4.1
Total 6993.85 9314.84 10950.7
8/8/2019 Proj of Fm Final
http://slidepdf.com/reader/full/proj-of-fm-final 71/86
71
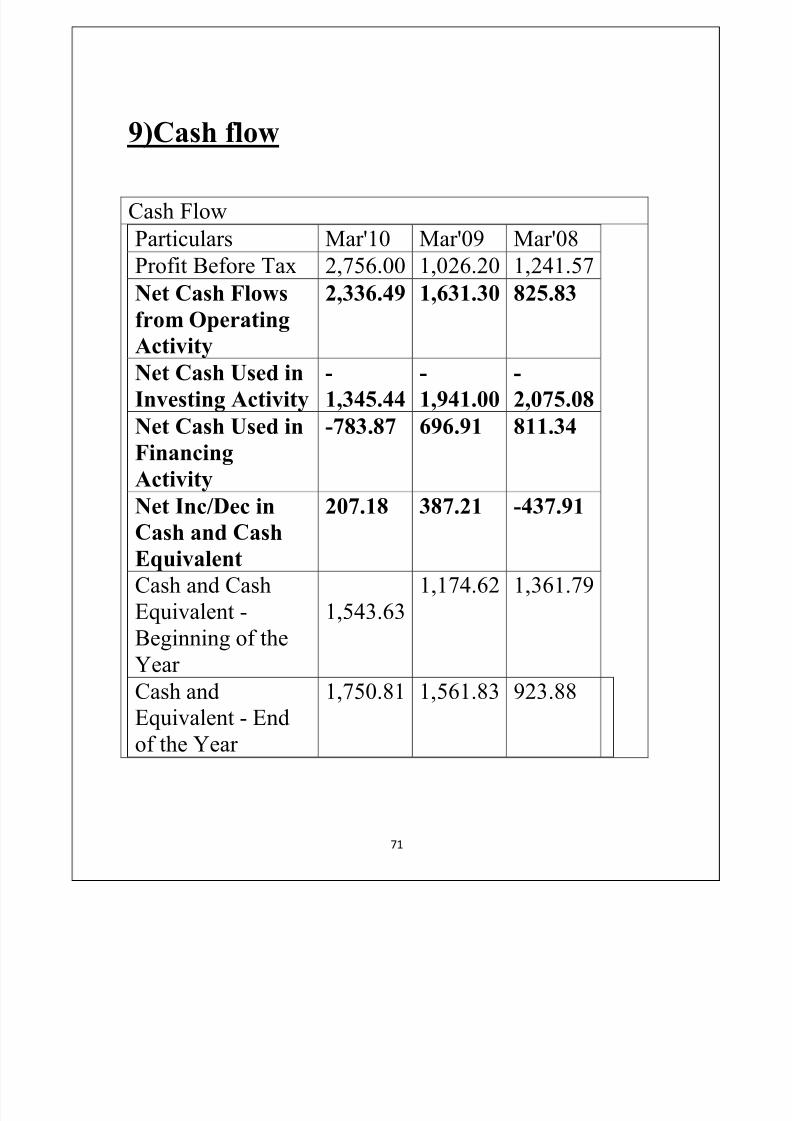
9)Cash flow
Cash Flow
Particulars Mar'10 Mar'09 Mar'08
Profit Before Tax 2,756.00 1,026.20 1,241.57
Net Cash Flows
from Operating
Activity
2,336.49 1,631.30 825.83
Net Cash Used in
Investing Activity
-
1,345.44
-
1,941.00
-
2,075.08
Net Cash Used in
Financing
Activity
-783.87 696.91 811.34
Net Inc/Dec in
Cash and Cash
Equivalent
207.18 387.21 -437.91
Cash and Cash
Equivalent -
Beginning of the
Year
1,543.63
1,174.62 1,361.79
Cash andEquivalent - End
of the Year
1,75
0.81 1,56
1.83 923
.88
8/8/2019 Proj of Fm Final
http://slidepdf.com/reader/full/proj-of-fm-final 72/86
72
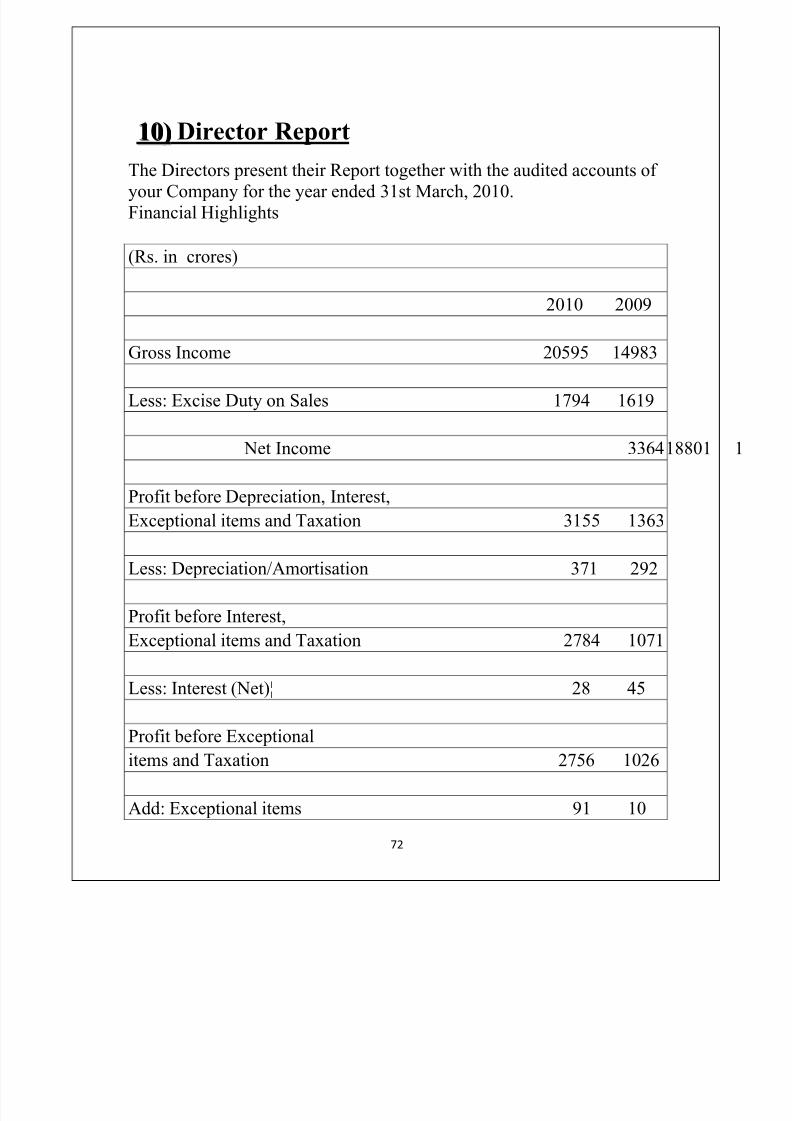
1100)) Director Report
The Directors present their Report together with the audited accounts of your Company for the year ended 31st March, 2010.
Financial Highlights
(Rs. in crores)
2010 2009
Gross Income 20595 14983
Less: Excise Duty on Sales 1794 1619
Net Income 18803364
Profit before Depreciation, Interest,
Exceptional items and Taxation 3155 1363
Less: Depreciation/Amortisation 371 292
Profit before Interest,
Exceptional items and Taxation 2784 1071
Less: Interest (Net)¦ 28 45
Profit before Exceptional
items and Taxation 2756 1026
Add: Exceptional items 91 10
8/8/2019 Proj of Fm Final
http://slidepdf.com/reader/full/proj-of-fm-final 73/86
73
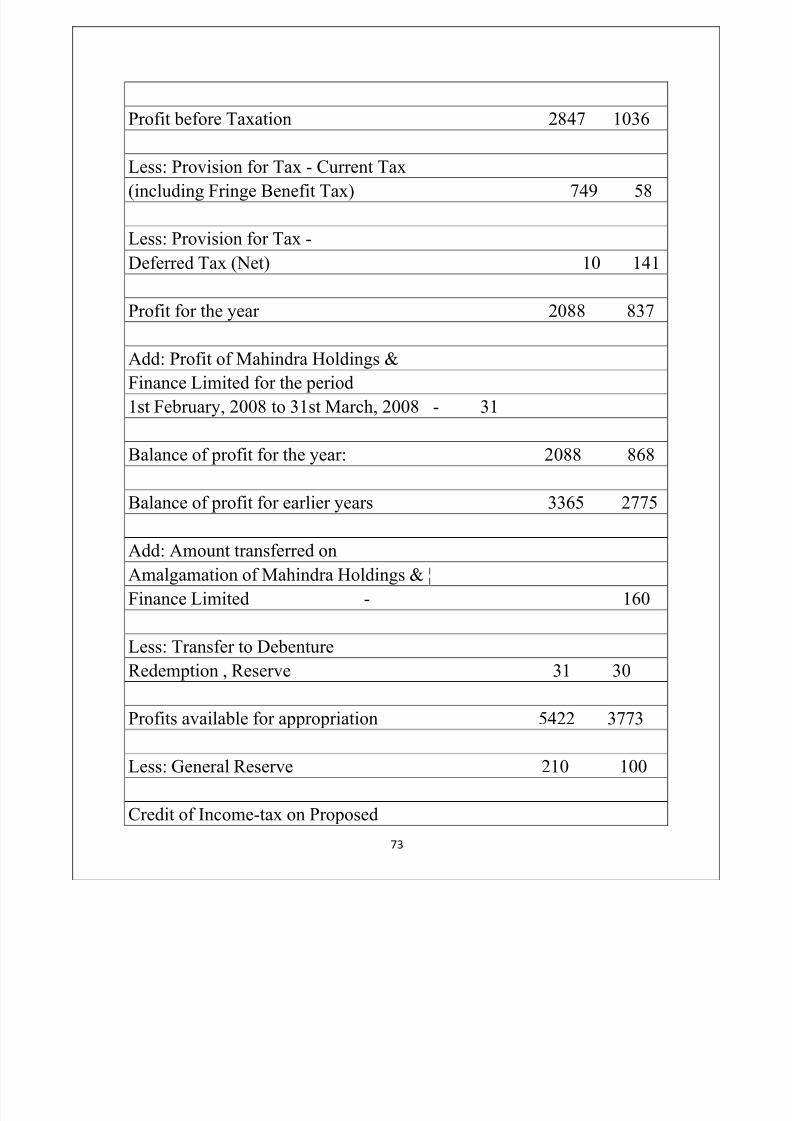
Profit before Taxation 2847 1036
Less: Provision for Tax - Current Tax(including Fringe Benefit Tax) 749 58
Less: Provision for Tax -
Deferred Tax (Net) 10 141
Profit for the year 2088 837
Add: Profit of Mahindra Holdings &
Finance Limited for the period
1st February, 2008 to 31st March, 2008 - 31
Balance of profit for the year: 2088 868
Balance of profit for earlier years 3365 2775
Add: Amount transferred on
Amalgamation of Mahindra Holdings & ¦
Finance Limited - 160
Less: Transfer to Debenture
Redemption , Reserve 31 30
Profits available for appropriation 5422 3773
Less: General Reserve 210 100
Credit of Income-tax on Proposed
8/8/2019 Proj of Fm Final
http://slidepdf.com/reader/full/proj-of-fm-final 74/86
74
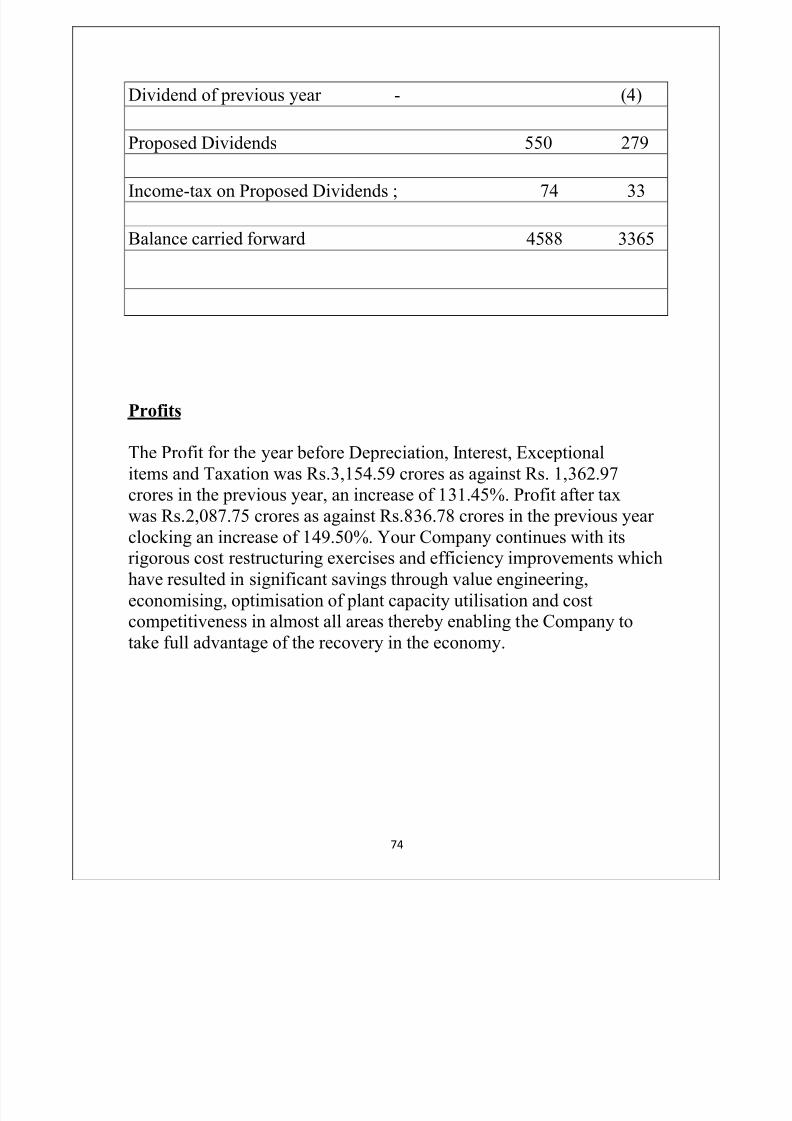
Dividend of previous year - (4)
Proposed Dividends 550 279
Income-tax on Proposed Dividends ; 74 33
Balance carried forward 4588 3365
Profits
The Profit for the year before Depreciation, Interest, Exceptional
items and Taxation was Rs.3,154.59 crores as against Rs. 1,362.97
crores in the previous year, an increase of 131.45%. Profit after tax
was Rs.2,087.75 crores as against Rs.836.78 crores in the previous year
clocking an increase of 149.50%. Your Company continues with itsrigorous cost restructuring exercises and efficiency improvements which
have resulted in significant savings through value engineering,
economising, optimisation of plant capacity utilisation and costcompetitiveness in almost all areas thereby enabling the Company to
take full advantage of the recovery in the economy.
8/8/2019 Proj of Fm Final
http://slidepdf.com/reader/full/proj-of-fm-final 75/86
75
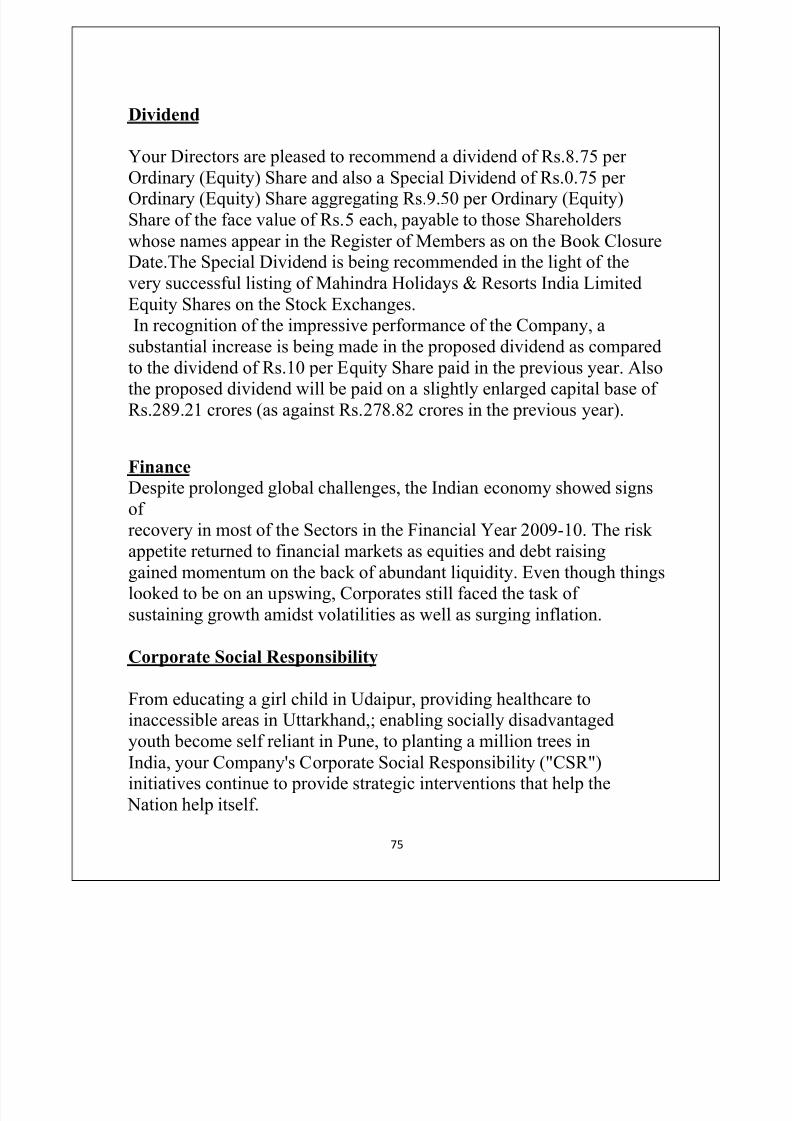
Dividend
Your Directors are pleased to recommend a dividend of Rs.8.75 per
Ordinary (Equity) Share and also a Special Dividend of Rs.0.75 per Ordinary (Equity) Share aggregating Rs.9.50 per Ordinary (Equity)
Share of the face value of Rs.5 each, payable to those Shareholders
whose names appear in the Register of Members as on the Book ClosureDate.The Special Dividend is being recommended in the light of the
very successful listing of Mahindra Holidays & Resorts India Limited
Equity Shares on the Stock Exchanges.
In recognition of the impressive performance of the Company, a
substantial increase is being made in the proposed dividend as comparedto the dividend of Rs.10 per Equity Share paid in the previous year. Also
the proposed dividend will be paid on a slightly enlarged capital base of
Rs.289.21 crores (as against Rs.278.82 crores in the previous year).
Finance
Despite prolonged global challenges, the Indian economy showed signs
of
recovery in most of the Sectors in the Financial Year 2009-10. The risk appetite returned to financial markets as equities and debt raising
gained momentum on the back of abundant liquidity. Even though things
looked to be on an upswing, Corporates still faced the task of
sustaining growth amidst volatilities as well as surging inflation.
Corporate Social Responsibility
From educating a girl child in Udaipur, providing healthcare toinaccessible areas in Uttarkhand,; enabling socially disadvantaged
youth become self reliant in Pune, to planting a million trees in
India, your Company's Corporate Social Responsibility ("CSR")initiatives continue to provide strategic interventions that help the
Nation help itself.
8/8/2019 Proj of Fm Final
http://slidepdf.com/reader/full/proj-of-fm-final 76/86
76
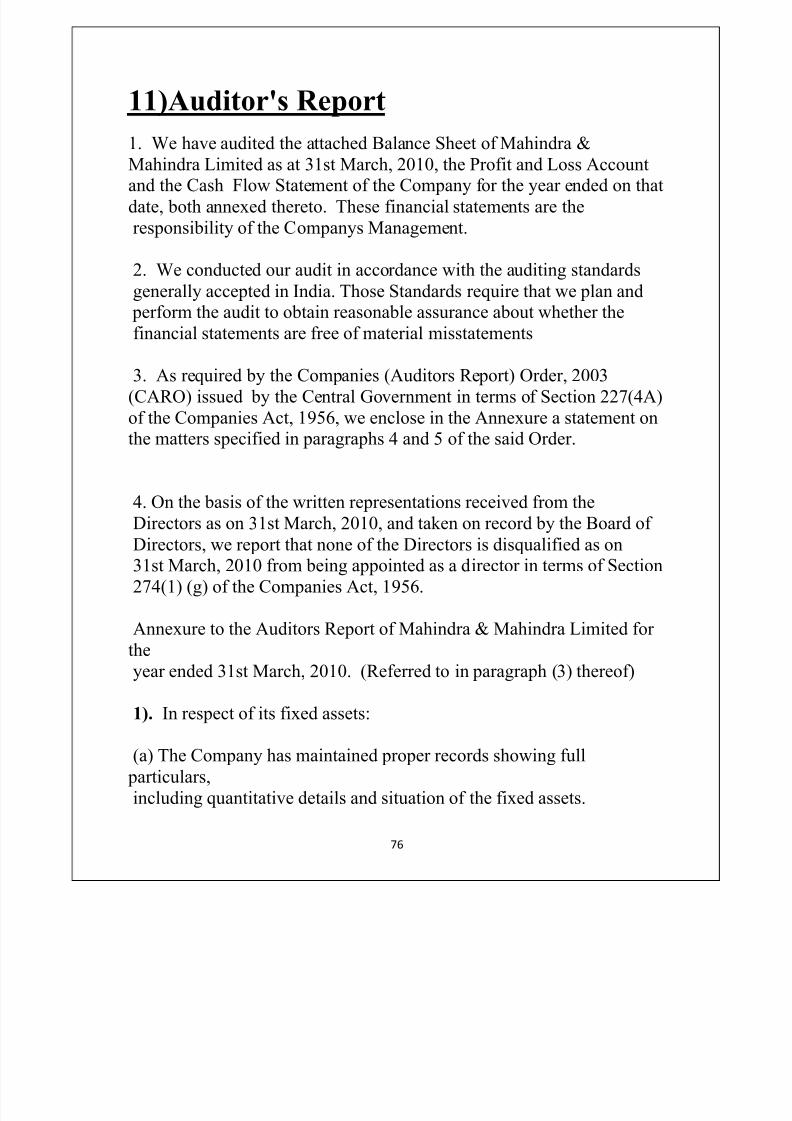
11)Auditor's Report
1. We have audited the attached Balance Sheet of Mahindra &
Mahindra Limited as at 31st March, 2010, the Profit and Loss Accountand the Cash Flow Statement of the Company for the year ended on that
date, both annexed thereto. These financial statements are the
responsibility of the Companys Management.
2. We conducted our audit in accordance with the auditing standards
generally accepted in India. Those Standards require that we plan and perform the audit to obtain reasonable assurance about whether the
financial statements are free of material misstatements
3. As required by the Companies (Auditors Report) Order, 2003
(CARO) issued by the Central Government in terms of Section 227(4A)
of the Companies Act, 1956, we enclose in the Annexure a statement onthe matters specified in paragraphs 4 and 5 of the said Order.
4. On the basis of the written representations received from the
Directors as on 31st March, 2010, and taken on record by the Board of Directors, we report that none of the Directors is disqualified as on
31st March, 2010 from being appointed as a director in terms of Section
274(1) (g) of the Companies Act, 1956.
Annexure to the Auditors Report of Mahindra & Mahindra Limited for
the
year ended 31st March, 2010. (Referred to in paragraph (3) thereof)
1). In respect of its fixed assets:
(a) The Company has maintained proper records showing full
particulars,
including quantitative details and situation of the fixed assets.
8/8/2019 Proj of Fm Final
http://slidepdf.com/reader/full/proj-of-fm-final 77/86
77
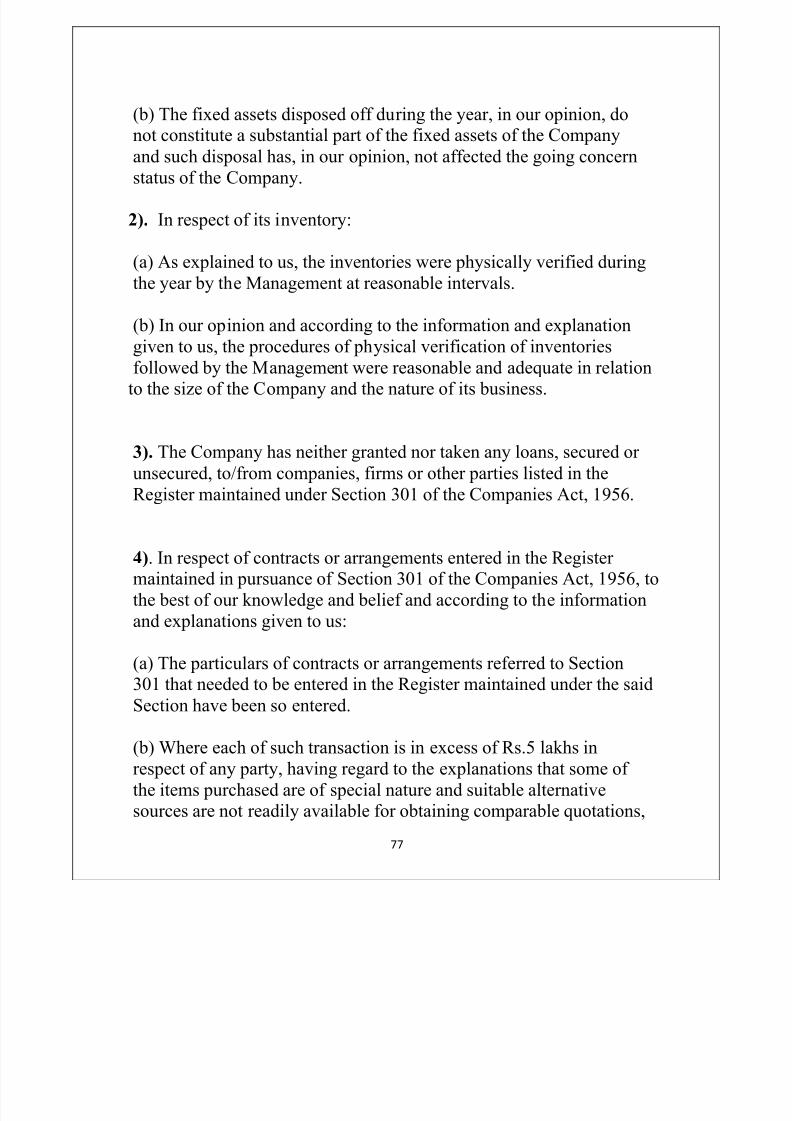
(b) The fixed assets disposed off during the year, in our opinion, donot constitute a substantial part of the fixed assets of the Company
and such disposal has, in our opinion, not affected the going concern
status of the Company.
2). In respect of its inventory:
(a) As explained to us, the inventories were physically verified during
the year by the Management at reasonable intervals.
(b) In our opinion and according to the information and explanation
given to us, the procedures of physical verification of inventoriesfollowed by the Management were reasonable and adequate in relation
to the size of the Company and the nature of its business.
3). The Company has neither granted nor taken any loans, secured or
unsecured, to/from companies, firms or other parties listed in the
Register maintained under Section 301 of the Companies Act, 1956.
4). In respect of contracts or arrangements entered in the Register maintained in pursuance of Section 301 of the Companies Act, 1956, to
the best of our knowledge and belief and according to the information
and explanations given to us:
(a) The particulars of contracts or arrangements referred to Section
301 that needed to be entered in the Register maintained under the said
Section have been so entered.
(b) Where each of such transaction is in excess of Rs.5 lakhs in
respect of any party, having regard to the explanations that some of
the items purchased are of special nature and suitable alternative
sources are not readily available for obtaining comparable quotations,

8/8/2019 Proj of Fm Final
http://slidepdf.com/reader/full/proj-of-fm-final 78/86
78
the transactions have been mad at prices which are prima facie
reasonable having regard to the prevailing market prices at therelevant time.
5). In our opinion, the Company has an adequate internal audit systemcommensurate with the size and the nature of its business.
6). We have broadly reviewed the books of account maintained by theCompany pursuant to the rules made by the Central Government for the
maintenance of cost records under Section 209(1) (d) of the Companies
Act, 1956 in respect of manufacture of motor vehicles and tractors and
are of the opinion that prima facie the prescribed accounts and records
have been made and maintained.
7). According to the information and explanations given to us in
respect of statutory dues:
(a) The Company has generally been regular in depositing undisputed
dues, including Provident Fund, Investor Education and Protection
Fund, Employees State Insurance, Income-tax, Sales Tax, Wealth Tax,Service Tax, Value Added Tax, Customs Duty, Excise Duty, Cess and
other material statutory dues applicable to it with the appropriate
authorities.
(b) There were no undisputed amounts payable in respect of Income-
tax, Wealth Tax, Customs Duty, Excise Duty, Cess and other material
statutory dues in arrears as at 31st March, 2010 for a period of more
than six months from the date they became payable.
Significant Accounting Policies
8/8/2019 Proj of Fm Final
http://slidepdf.com/reader/full/proj-of-fm-final 79/86
79
ACCOUNTING CONVENTION.
The financial statements are prepared under the historical cost
convention, on an accrual basis, in accordance with generally
accepted accounting principles and applicable accounting standards
as notified under the Companies Rules 2006.
USE OF ESTIMATES
The preparation and presentation of financial starements in
conformity with generally accepted accounting principles requires
making of estimates and assumptions that affect the reported amounts
of assets and liabilities and disclosures of contingent assets and
liabilities at the date of the financial statements and the reportedamounts of revenues and expenses during the reporting year.
Differences between the actual results and estimates are recognized in
the year in which the results are known/materialized.
REVENUE RECOGNITION
8/8/2019 Proj of Fm Final
http://slidepdf.com/reader/full/proj-of-fm-final 80/86
80
Sale of products are recognized when risk and rewards of ownership
of the products are passed onto the customers, which is generally on
the dispatch of goods. Sales are exclusive of sales tax. License Fee is
accounted based on terms of contract. Interest income is recognizedon time proportion basis.
FIXED ASSETS AND DEPR ICIATION/ AMOR TIZATION
Fixed assets are stated at cost of acquisition less accumulated
depreciation and impairment, if any. Cost is inclusive of freight,
duties, taxes and other directly attributable cost incurred to bring the
assets their working condition for intended use. Depreciation is
charged using straight-line method based on the useful lives of the
fixed assets as estimated by the management as specified below or the
rates specified in accordance with the provisions of Schedule XIV of
the Companies Act 1956 whichever is higher.
Buildings - 20 to 30 years
Plant & Machinery- 5-18 years
Furniture & Fixtures- 10-15 years
Office equipments- 1-5 years
Moulds & Dyes - 1-3 years
Vehicles - 4-8 years
Depreciation is charged on a pro-rata basis for assets purchased/sold
during the year. Individual fixed assets costing less than ` 5000 are
8/8/2019 Proj of Fm Final
http://slidepdf.com/reader/full/proj-of-fm-final 81/86
81
depreciated in full, in the year of purchase. Cost of lease hold land is
amortized over the period of the lease or management estimates
whichever is lower.
INVENTOR IES
Inventories consist of raw and packing materials, stores and spares, work
in progress and finished goods. Inventories are valued at lower of cost
and net realizable value. Cost of Inventories is determined on weighted
average basis.
BORROWING COST
Borrowing cost directly attributable to acquisition or construction of
qualifying assets (i.e.- those fixed assets which necessarily take asubstantial period of time for their intended use) are capitalized. Other
borrowing costs are recognized as an expense in the period in which
they are incurred.
LEASES
8/8/2019 Proj of Fm Final
http://slidepdf.com/reader/full/proj-of-fm-final 82/86
82
Lease payments under operating lease are recognized as an expense in
the profit and loss a/c on a straight line basis over the lease term.
RESEAR CH AND DEVLOPMENT
Capital expenditure on R&D is capitalized as fixed assets. All revenue
expenditure on R&D is charged off to the respective heads in P&L a/c in
the year in which it is incurred.
FOREIGN EXCHANGE TRANSACTIONS
Transactions in foreign currencies are recorded at the exchange rates
prevailing on the date of transaction. Monetary items dominated in
foreign currencies are stated at the exchange closing rate. Incase of
monetary items covered by forward exchange contracts, the premium or discount arising at the inception of such a forward exchange contract is
amortized as expense or income over the life of the contract and
difference between the year and the rate on the date of the contract is
recognized as exchange difference in P&L a/c.
8/8/2019 Proj of Fm Final
http://slidepdf.com/reader/full/proj-of-fm-final 83/86
83
TAXATION
Income tax expense comprise of current tax, fringe benefit tax(i.e:
amount of tax for the year determined in accordance with the income tax
laws) and deferred tax charge or credit (reflecting the tax effect of timing differences between accounting income and taxable income for
the year). The deferred tax charge or credit and the corresponding
deferred tax liabilities and/or assets are recognized using the tax rates
that have been enacted or substantively enacted by the balanced sheet
date. Deferred tax rates are recognized only to the extent there is
reasonable certainty that the assets can be realized in future. However
where there is unabsorbed depreciation or carry forward losses under taxation laws, deferred tax assets are recognized only if there is virtual
certainty of realization of such assets. Deferred tax assets are reviewed
as at each balance sheet date and are written down or up to reflect the
amount that is reasonably/virtually certain (as the case may be ) to be
realized. The Fringe benefit tax has been calculated and accounted for in
accordance with the provisions of the Income Tax Act, 1961 and the
guidance note on accounting for fringe benefit tax issued by the Instituteof Chartered Accountants of India.
8/8/2019 Proj of Fm Final
http://slidepdf.com/reader/full/proj-of-fm-final 84/86
84
12)Conclusion
From the analysis of three years published data of Mahindra and
Mahindra ltd one find that it is professionally well managed company.it
has enough experience of business when I read aanual report of three
years of the company and after analysis the figure of three years I find
that current year is best for the company compared to last two years.
Company has well established Financial System and because of
that its market position is very strong.
At least, I would like to give my best wishes to the company and I also
wish company make splendid success and achieve glorious moments.
13)Bibilography
8/8/2019 Proj of Fm Final
http://slidepdf.com/reader/full/proj-of-fm-final 85/86
85
This report has been prepared with the help of annual reports and
website detailed information is as below:
MAHINDRA & MAHINDRA LIMITED ANNUAL
REPORT 2007-2008
MAHINDRA & MAHINDRA LIMITED ANNUAL
REPORT 2008-2009
MAHINDRA & MAHINDRA LIMITED ANNUALREPORT 2009-2010
Website:-
www.mahindra and mahindara .com

8/8/2019 Proj of Fm Final
http://slidepdf.com/reader/full/proj-of-fm-final 86/86