Progressive failure of sheeted rock slopes: the 20092010 ... · alyzing progressive rock slope...
16
Progressive failure of sheeted rock slopes: the 2009–2010 Rhombus Wall rock falls in Yosemite Valley, California, USA Greg M. Stock, 1 * Stephen J. Martel, 2 Brian D. Collins 3 and Edwin L. Harp 4 1 National Park Service, Yosemite National Park, El Portal, California, USA 95318 2 Department of Geology and Geophysics, University of Hawaii, Honolulu, Hawaii, USA 96822 3 U.S. Geological Survey, Landslide Hazard Program, Menlo Park, California, USA 94025 4 U.S. Geological Survey, Landslide Hazard Program, Golden, Colorado, USA 80225 Received 1 June 2011; Revised 3 December 2011; Accepted 5 December 2011 *Correspondence to: G. M. Stock, National Park Service, Yosemite National Park, Resources Management and Science, 5083 Foresta Road, PO Box 700, El Portal, California 95318, USA. E-mail: [email protected] ABSTRACT: Progressive rock-fall failures in natural rock slopes are common in many environments, but often elude detailed quantitative documentation and analysis. Here we present high-resolution photography, video, and laser scanning data that document spatial and temporal patterns of a 15-month-long sequence of at least 14 rock falls from the Rhombus Wall, a sheeted granitic cliff in Yosemite Valley, California. The rock-fall sequence began on 26 August 2009 with a small failure at the tip of an overhanging rock slab. Several hours later, a series of five rock falls totaling 736 m 3 progressed upward along a sheeting joint behind the overhanging slab. Over the next 3 weeks, audible cracking occurred on the Rhombus Wall, suggesting crack propagation, while visual monitoring revealed opening of a sheeting joint adjacent to the previous failure surface. On 14 September 2009 a 110 m 3 slab detached along this sheeting joint. Additional rock falls between 30 August and 20 November 2010, totaling 187 m 3 , radiated outward from the initial failure area along cliff (sub)parallel sheeting joints. We suggest that these progressive failures might have been related to stress redistributions accompanying propagation of sheeting joints behind the cliff face. Mechanical analyses indicate that tensile stresses should occur perpendicular to the cliff face and open sheeting joints, and that sheeting joints should propagate parallel to a cliff face from areas of stress concentrations. The analyses also account for how sheeting joints can propagate to lengths many times greater than their depths behind cliff faces. We posit that as a region of failure spreads across a cliff face, stress concentrations along its margin will spread with it, promoting further crack propagation and rock falls. Published in 2011. This article is a US Government work and is in the public domain in the USA. KEYWORDS: rock fall; progressive failure; sheeting joints; crack propagation; Yosemite National Park Introduction Progressive failures are common on natural rock slopes and within excavated tunnels (Eberhardt et al., 2004; Kemeny, 2005; Rosser et al., 2007; Jaboyedoff et al., 2009). The term ‘progressive’ generally refers to time-dependent structural changes that act to reduce slope stability and ultimately lead to slope failure (Terzaghi, 1950). Here, we use the term to describe failure progressions in space as well as time; e.g. subsequent failures that occur along the perimeter of a previous failure. Progressive slope failures have long been recognized in the field of soil mechanics, wherein failure initiates at a point along a potential sliding surface and propagates outwards from it, with propagation driven primarily by redistribution of shear stresses (Bishop, 1967; Bjerrum, 1967). A similar phenomenon involving progressive rupture along faults is referred to as ‘stress triggering’ in the field of seismotectonics (Stein et al., 1997). In hard rock slopes, progressive failure typically involves the time-dependent propagation of discontinuities in the rock, e.g. cracks, joints, faults, and fissures (Terzaghi, 1962). Time- dependent failures along discontinuities can occur for several reasons, including weathering of the failure surface, viscous deformation of fracture-filling material, and subcritical crack growth (Atkinson, 1984; Kemeny, 2005; Petley et al., 2005). Time-dependent failure along discontinuities can also result from fracture propagation through intact rock ‘bridges’ that separate pre-existing discontinuities (Einstein et al., 1983; Goodman and Kieffer, 2000; Eberhardt et al., 2004; Kemeny, 2005; Kim and Kemeny, 2009). Here we consider a related mechanism, that of propagation of sheeting joints (also known as ‘exfoliation’ joints) driven both by areal tensile stresses perpendicular to a sheeted cliff face and by localized stress concentrations arising from geometrical changes to the cliff face resulting from previous rock falls. Sheeting joints are opening mode rock fractures that form (sub)parallel to topographic surfaces. They are gently curved, occur most commonly where the topography is convex, and EARTH SURFACE PROCESSES AND LANDFORMS Earth Surf. Process. Landforms (2011) Published in 2011 by John Wiley and Sons, Ltd. Published online in Wiley Online Library (wileyonlinelibrary.com) DOI: 10.1002/esp.3192
Transcript of Progressive failure of sheeted rock slopes: the 20092010 ... · alyzing progressive rock slope...
EARTH SURFACE PROCESSES AND LANDFORMSEarth Surf. Process. Landforms (2011)Published in 2011 by John Wiley and Sons, Ltd.Published online in Wiley Online Library(wileyonlinelibrary.com) DOI: 10.1002/esp.3192
Progressive failure of sheeted rock slopes: the2009–2010 Rhombus Wall rock falls in YosemiteValley, California, USAGreg M. Stock,1* Stephen J. Martel,2 Brian D. Collins3 and Edwin L. Harp41 National Park Service, Yosemite National Park, El Portal, California, USA 953182 Department of Geology and Geophysics, University of Hawaii, Honolulu, Hawaii, USA 968223 U.S. Geological Survey, Landslide Hazard Program, Menlo Park, California, USA 940254 U.S. Geological Survey, Landslide Hazard Program, Golden, Colorado, USA 80225
Received 1 June 2011; Revised 3 December 2011; Accepted 5 December 2011
*Correspondence to: G. M. Stock, National Park Service, Yosemite National Park, Resources Management and Science, 5083 Foresta Road, PO Box 700, El Portal,California 95318, USA. E-mail: [email protected]
ABSTRACT: Progressive rock-fall failures in natural rock slopes are common in many environments, but often elude detailedquantitative documentation and analysis. Here we present high-resolution photography, video, and laser scanning data thatdocument spatial and temporal patterns of a 15-month-long sequence of at least 14 rock falls from the Rhombus Wall, a sheetedgranitic cliff in Yosemite Valley, California. The rock-fall sequence began on 26 August 2009 with a small failure at the tip of anoverhanging rock slab. Several hours later, a series of five rock falls totaling 736m3 progressed upward along a sheeting joint behindthe overhanging slab. Over the next 3weeks, audible cracking occurred on the Rhombus Wall, suggesting crack propagation, whilevisual monitoring revealed opening of a sheeting joint adjacent to the previous failure surface. On 14 September 2009 a 110m3 slabdetached along this sheeting joint. Additional rock falls between 30 August and 20 November 2010, totaling 187m3, radiatedoutward from the initial failure area along cliff (sub)parallel sheeting joints. We suggest that these progressive failures might havebeen related to stress redistributions accompanying propagation of sheeting joints behind the cliff face. Mechanical analysesindicate that tensile stresses should occur perpendicular to the cliff face and open sheeting joints, and that sheeting joints shouldpropagate parallel to a cliff face from areas of stress concentrations. The analyses also account for how sheeting joints can propagateto lengths many times greater than their depths behind cliff faces. We posit that as a region of failure spreads across a cliff face, stressconcentrations along its margin will spread with it, promoting further crack propagation and rock falls. Published in 2011. This articleis a US Government work and is in the public domain in the USA.
KEYWORDS: rock fall; progressive failure; sheeting joints; crack propagation; Yosemite National Park
Introduction
Progressive failures are common on natural rock slopes andwithin excavated tunnels (Eberhardt et al., 2004; Kemeny,2005; Rosser et al., 2007; Jaboyedoff et al., 2009). The term‘progressive’ generally refers to time-dependent structuralchanges that act to reduce slope stability and ultimately leadto slope failure (Terzaghi, 1950). Here, we use the term todescribe failure progressions in space as well as time; e.g.subsequent failures that occur along the perimeter of a previousfailure.Progressive slope failures have long been recognized in the
field of soil mechanics, wherein failure initiates at a point alonga potential sliding surface and propagates outwards from it,with propagation driven primarily by redistribution of shearstresses (Bishop, 1967; Bjerrum, 1967). A similar phenomenoninvolving progressive rupture along faults is referred to as ‘stresstriggering’ in the field of seismotectonics (Stein et al., 1997).In hard rock slopes, progressive failure typically involves the
time-dependent propagation of discontinuities in the rock,e.g. cracks, joints, faults, and fissures (Terzaghi, 1962). Time-dependent failures along discontinuities can occur for severalreasons, including weathering of the failure surface, viscousdeformation of fracture-filling material, and subcritical crackgrowth (Atkinson, 1984; Kemeny, 2005; Petley et al., 2005).Time-dependent failure along discontinuities can also resultfrom fracture propagation through intact rock ‘bridges’ thatseparate pre-existing discontinuities (Einstein et al., 1983;Goodman and Kieffer, 2000; Eberhardt et al., 2004; Kemeny,2005; Kim and Kemeny, 2009). Here we consider a relatedmechanism, that of propagation of sheeting joints (alsoknown as ‘exfoliation’ joints) driven both by areal tensilestresses perpendicular to a sheeted cliff face and by localizedstress concentrations arising from geometrical changes to thecliff face resulting from previous rock falls.
Sheeting joints are opening mode rock fractures that form(sub)parallel to topographic surfaces. They are gently curved,occur most commonly where the topography is convex, and
G. M. STOCK ET AL.
can extend in plane at least 200m (Gilbert, 1904; Matthes,1930; Jahns, 1943; Bahat et al., 1999). Sheeting joints occurfrom within a meter of the modern surface to depths in excessof 100m and typically develop independent of the grain scalerock structure (Jahns, 1943). They are most widespread ingranitic rocks and gneisses, but have also been observed in maficintrusive rocks, sandstones, marbles, and tuffs (Holzhausen,1989). High compressive stresses parallel to the surfaceconsistently have been either inferred from field observa-tions (buckling of rock slabs bounded by sheeting joints)or measured where sheeting joints are prominent (Martel,2006, 2011). Sheeting joints have been observed to formin quarries (Jahns, 1943; Holzhausen, 1989), and severallines of evidence suggest that many sheeting joints inYosemite are geologically young, with some nucleating,opening, and propagating historically (Martel, 2006, 2011,and references therein). We suggest that the geometry ofsheeting joints, and the mechanical factors controlling howsheeting joints grow, are important considerations when an-alyzing progressive rock slope failures, and present as anexample a well-documented sequence of rock falls inYosemite Valley.Although progressive slope failures are relatively common,
quantitative field studies remain scarce, particularly for naturalrock slopes. This is probably due to the difficulty in anticipatingthese events and ensuring that quantitative reference points arein place and accurately located prior to failure. Recent studiesof progressive slope failures have utilized terrestrial laser scan-ning (lidar), which provides high-resolution topographic data(Rosser et al., 2007; Jaboyedoff et al., 2009; Kemeny and Kim,2009). Laser scanning is a valuable tool for quantitative, high-resolution investigation of slope failures, particularly whenrepeat scans bracket failure events (Collins and Sitar, 2005,2008; Rosser et al., 2005; Abellán et al., 2006; Oppikoferet al., 2008; Rabatel et al., 2008; Stock et al., 2011).Here we describe a 1.2-year-long sequence of 15 rock falls
from the Rhombus Wall, a sheeted granitic cliff in easternYosemite Valley, California, USA (Figure 1), which occurredsporadically between 26 August 2009 and 20 November2010. We documented the progressive nature of these eventswith a combination of visual monitoring, repeat high-resolutiondigital photography, video, and airborne and terrestrial laserscanning data collected between rock-fall events. Thesequence of rock falls in time, coupled with their distributionon the cliff, provide insight into the nature of progressive failureof sheeted rock slopes, and the stress redistribution and associ-ated crack propagation that might accompany these failures.We also explore the mechanics of sheeting joint propagationto develop a better understanding of the stress conditionssurrounding the Rhombus Wall rock falls.
Progressive Rock Falls in Yosemite Valley
With its nearly 1-km-tall glacially steepened cliffs and fracturedgranite walls, rock falls are common in Yosemite National Park.From 1857 to 2010, 836 mass wasting events were documen-ted in the park, including rock falls, rock slides, debris flows,etc. (Wieczorek and Snyder, 2004, and additional unpublishedobservations). Of these documented events, 72% were rockfalls and rock slides from the cliffs of Yosemite Valley, a14 km-long glacially carved valley in Cretaceous granitic rocksof the Sierra Nevada mountain range that was deglaciatedapproximately 15–17 ka (Matthes, 1930; Huber, 1987).A network of regional discontinuities (fractures and dikes)
forms the dominant geologic structure of Yosemite Valley and
Published in 2011 by John Wiley and Sons, Ltd.
the surrounding area (Matthes, 1930; Huber, 1987; Matasciet al., 2011). Although these regional discontinuities play animportant role in controlling the local topography, the mostcommon fractures exposed in Yosemite are sheeting jointsformed (sub)parallel to modern topographic surfaces (Matthes,1930; Huber, 1987; Bahat et al., 1999; Martel, 2006, 2011).Rock falls in Yosemite Valley commonly detach along sheetingjoints (Wieczorek and Snyder, 1999, 2004; Stock et al., 2011).Sheeting joints are ubiquitous at the site of the Rhombus Wallrock falls (Figure 1), although other regional fractures and dikesare also present there.
A review of historical rock falls (Wieczorek and Snyder,2004, and additional unpublished observations) yields numer-ous examples of progressive rock falls in Yosemite Valley, inwhich a series of two or more rock falls occurred from adjacentlocations on a cliff face (i.e. the failure surface of each subse-quent rock fall shared a perimeter with a previous rock fall)within a 1-year time period. Most of these rock falls originatedalong sheeting joints; recent examples include the 1998–1999Glacier Point rock falls above Curry Village (Wieczorek andSnyder, 1999), rock falls from Half Dome in July of 2006, theOctober 2008 Glacier Point rock falls above the Ledge Trail(Stock et al., 2011), and rock falls from El Capitan in Octoberof 2010. In addition, several historical rock falls in YosemiteValley have been associated either with observed crack propa-gation or with cracking sounds – presumably reflecting crackpropagation – prior to failure. Following the third rock fall fromGlacier Point between November 1998 and June 1999, Wiec-zorek and Snyder (1999) observed crack propagation occurringin an adjacent sheet of rock, probably due to stress redistribu-tion in the cliff after the 13 June 1999 rock fall. Audible crack-ing preceded the 16 November 1980 rock fall from above theYosemite Falls Trail, which caused three fatalities and at least11 injuries (Wieczorek and Snyder, 2004), and also theOctober 2008 rock falls from Glacier Point, which damaged25 visitor cabins in Curry Village and caused minor injuries(Stock et al., 2011).
Given the possibility of remotely monitoring fracture propa-gation, either through direct observation of cliffs (Wieczorekand Snyder, 1999; Ishikawa et al., 2004) or through remotemethods such as acoustic or seismic monitoring (Zimmeret al., 2012), quantitative documentation of fracture propaga-tions and time-dependent rock falls can be an important steptowards predicting future rock falls (Rosser et al., 2007). Thesequence of rock falls from the Rhombus Wall, documentedin high resolution, provides insight into processes that driveprogressive rock falls from natural rock slopes.
Remote Sensing Data Acquisition and Analysis
High-resolution photography and video
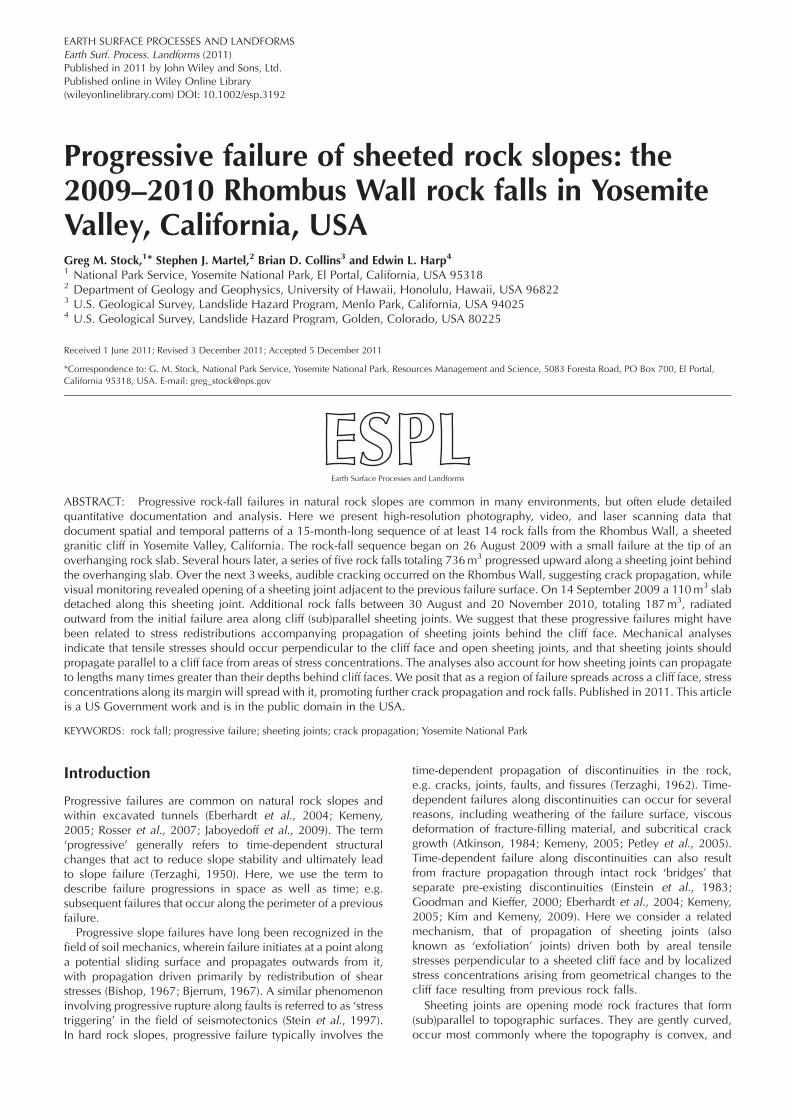
High-resolution digital photographs of the rock-fall sourcearea and adjacent cliff before, during, and after each majorrock fall event aided our quantitative analysis of the Rhom-bus Wall rock falls. We obtained pre-rock fall images fromgigapixel panoramic photographs of Yosemite Valley (Figure 1(B)), which can be zoomed-in on to reveal the rock-fallsource area prior to failure (Figure 1(C)). Stock et al. (2011)provide details of the acquisition of these photos, which areavailable for viewing at http://www.xrez.com/case-studies/national-parks/yosemite-extreme-panoramic-imaging-project/.Because most of the Rhombus Wall rock falls occurred dur-ing daylight hours, and often in quick succession, park visi-tors and employees captured numerous high-resolution
Earth Surf. Process. Landforms (2011)
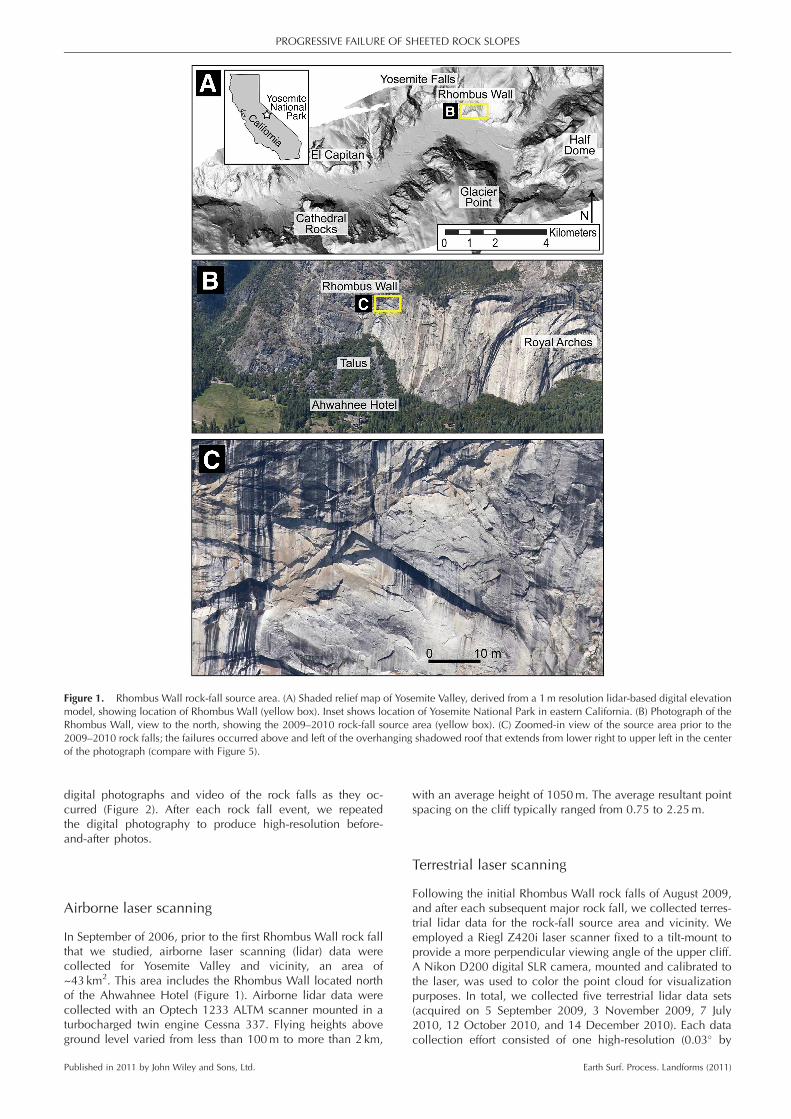
Figure 1. Rhombus Wall rock-fall source area. (A) Shaded relief map of Yosemite Valley, derived from a 1m resolution lidar-based digital elevationmodel, showing location of Rhombus Wall (yellow box). Inset shows location of Yosemite National Park in eastern California. (B) Photograph of theRhombus Wall, view to the north, showing the 2009–2010 rock-fall source area (yellow box). (C) Zoomed-in view of the source area prior to the2009–2010 rock falls; the failures occurred above and left of the overhanging shadowed roof that extends from lower right to upper left in the centerof the photograph (compare with Figure 5).
PROGRESSIVE FAILURE OF SHEETED ROCK SLOPES
digital photographs and video of the rock falls as they oc-curred (Figure 2). After each rock fall event, we repeatedthe digital photography to produce high-resolution before-and-after photos.
Airborne laser scanning
In September of 2006, prior to the first Rhombus Wall rock fallthat we studied, airborne laser scanning (lidar) data werecollected for Yosemite Valley and vicinity, an area of~43 km2. This area includes the Rhombus Wall located northof the Ahwahnee Hotel (Figure 1). Airborne lidar data werecollected with an Optech 1233 ALTM scanner mounted in aturbocharged twin engine Cessna 337. Flying heights aboveground level varied from less than 100m to more than 2 km,
Published in 2011 by John Wiley and Sons, Ltd.
with an average height of 1050m. The average resultant pointspacing on the cliff typically ranged from 0.75 to 2.25m.
Terrestrial laser scanning
Following the initial Rhombus Wall rock falls of August 2009,and after each subsequent major rock fall, we collected terres-trial lidar data for the rock-fall source area and vicinity. Weemployed a Riegl Z420i laser scanner fixed to a tilt-mount toprovide a more perpendicular viewing angle of the upper cliff.A Nikon D200 digital SLR camera, mounted and calibrated tothe laser, was used to color the point cloud for visualizationpurposes. In total, we collected five terrestrial lidar data sets(acquired on 5 September 2009, 3 November 2009, 7 July2010, 12 October 2010, and 14 December 2010). Each datacollection effort consisted of one high-resolution (0.03� by
Earth Surf. Process. Landforms (2011)
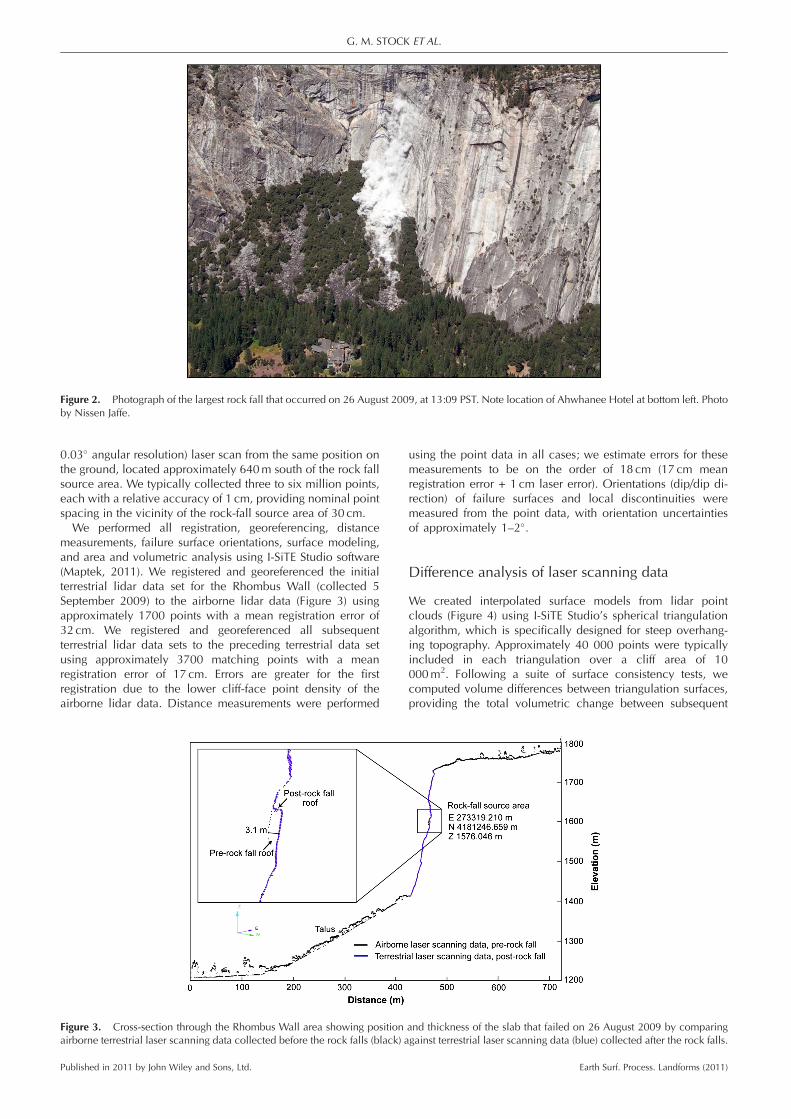
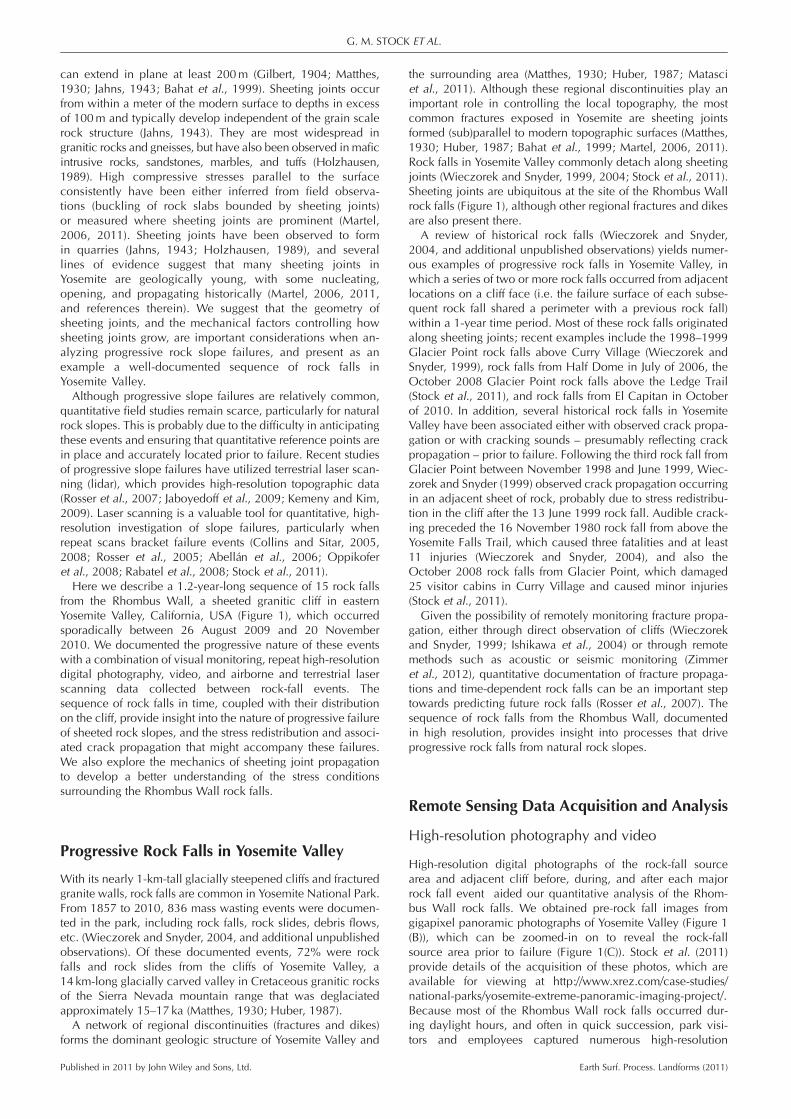
Figure 2. Photograph of the largest rock fall that occurred on 26 August 2009, at 13:09 PST. Note location of Ahwhanee Hotel at bottom left. Photoby Nissen Jaffe.
G. M. STOCK ET AL.
0.03� angular resolution) laser scan from the same position onthe ground, located approximately 640m south of the rock fallsource area. We typically collected three to six million points,each with a relative accuracy of 1 cm, providing nominal pointspacing in the vicinity of the rock-fall source area of 30 cm.We performed all registration, georeferencing, distance
measurements, failure surface orientations, surface modeling,and area and volumetric analysis using I-SiTE Studio software(Maptek, 2011). We registered and georeferenced the initialterrestrial lidar data set for the Rhombus Wall (collected 5September 2009) to the airborne lidar data (Figure 3) usingapproximately 1700 points with a mean registration error of32 cm. We registered and georeferenced all subsequentterrestrial lidar data sets to the preceding terrestrial data setusing approximately 3700 matching points with a meanregistration error of 17 cm. Errors are greater for the firstregistration due to the lower cliff-face point density of theairborne lidar data. Distance measurements were performed
Figure 3. Cross-section through the Rhombus Wall area showing positionairborne terrestrial laser scanning data collected before the rock falls (black) a
Published in 2011 by John Wiley and Sons, Ltd.
using the point data in all cases; we estimate errors for thesemeasurements to be on the order of 18 cm (17 cm meanregistration error + 1 cm laser error). Orientations (dip/dip di-rection) of failure surfaces and local discontinuities weremeasured from the point data, with orientation uncertaintiesof approximately 1–2�.
Difference analysis of laser scanning data
We created interpolated surface models from lidar pointclouds (Figure 4) using I-SiTE Studio’s spherical triangulationalgorithm, which is specifically designed for steep overhang-ing topography. Approximately 40 000 points were typicallyincluded in each triangulation over a cliff area of 10000m2. Following a suite of surface consistency tests, wecomputed volume differences between triangulation surfaces,providing the total volumetric change between subsequent
and thickness of the slab that failed on 26 August 2009 by comparinggainst terrestrial laser scanning data (blue) collected after the rock falls.
Earth Surf. Process. Landforms (2011)
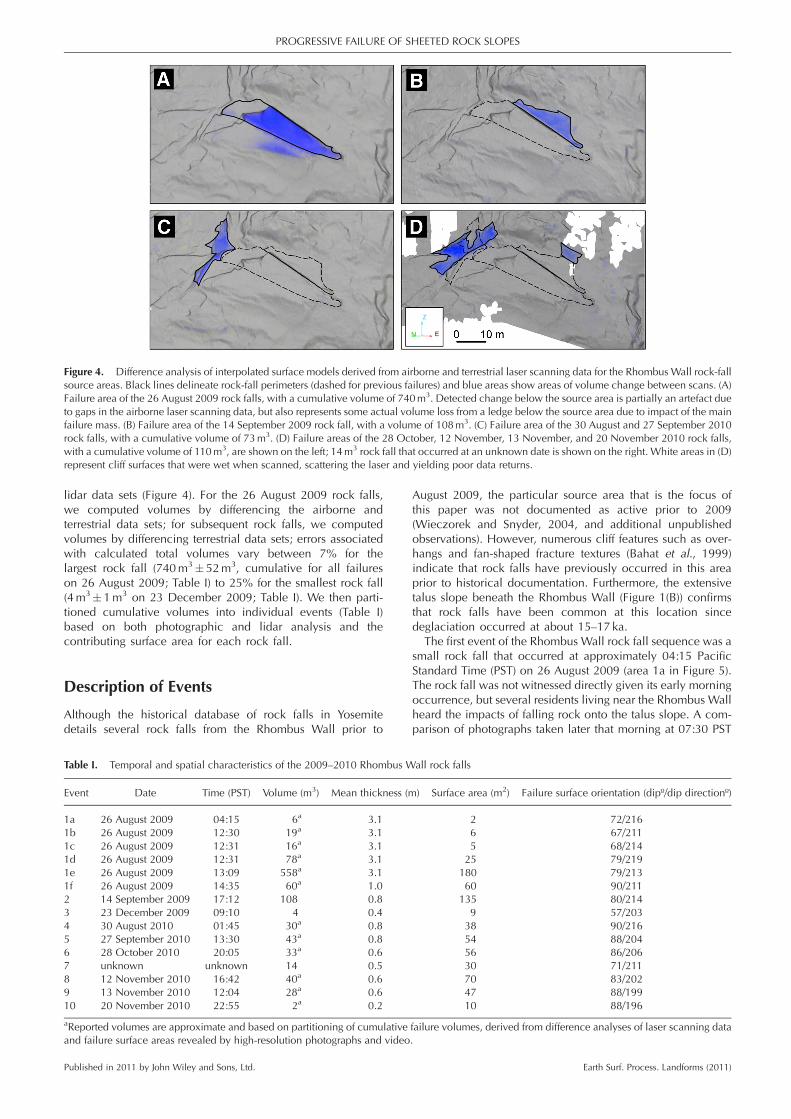
Figure 4. Difference analysis of interpolated surface models derived from airborne and terrestrial laser scanning data for the Rhombus Wall rock-fallsource areas. Black lines delineate rock-fall perimeters (dashed for previous failures) and blue areas show areas of volume change between scans. (A)Failure area of the 26 August 2009 rock falls, with a cumulative volume of 740m3. Detected change below the source area is partially an artefact dueto gaps in the airborne laser scanning data, but also represents some actual volume loss from a ledge below the source area due to impact of the mainfailure mass. (B) Failure area of the 14 September 2009 rock fall, with a volume of 108m3. (C) Failure area of the 30 August and 27 September 2010rock falls, with a cumulative volume of 73m3. (D) Failure areas of the 28 October, 12 November, 13 November, and 20 November 2010 rock falls,with a cumulative volume of 110m3, are shown on the left; 14m3 rock fall that occurred at an unknown date is shown on the right. White areas in (D)represent cliff surfaces that were wet when scanned, scattering the laser and yielding poor data returns.
PROGRESSIVE FAILURE OF SHEETED ROCK SLOPES
lidar data sets (Figure 4). For the 26 August 2009 rock falls,we computed volumes by differencing the airborne andterrestrial data sets; for subsequent rock falls, we computedvolumes by differencing terrestrial data sets; errors associatedwith calculated total volumes vary between 7% for thelargest rock fall (740m3�52m3, cumulative for all failureson 26 August 2009; Table I) to 25% for the smallest rock fall(4m3� 1m3 on 23 December 2009; Table I). We then parti-tioned cumulative volumes into individual events (Table I)based on both photographic and lidar analysis and thecontributing surface area for each rock fall.
Description of Events
Although the historical database of rock falls in Yosemitedetails several rock falls from the Rhombus Wall prior to
Table I. Temporal and spatial characteristics of the 2009–2010 Rhombus W
Event Date Time (PST) Volume (m3) Mean thickness (m
1a 26 August 2009 04:15 6a 3.11b 26 August 2009 12:30 19a 3.11c 26 August 2009 12:31 16a 3.11d 26 August 2009 12:31 78a 3.11e 26 August 2009 13:09 558a 3.11f 26 August 2009 14:35 60a 1.02 14 September 2009 17:12 108 0.83 23 December 2009 09:10 4 0.44 30 August 2010 01:45 30a 0.85 27 September 2010 13:30 43a 0.86 28 October 2010 20:05 33a 0.67 unknown unknown 14 0.58 12 November 2010 16:42 40a 0.69 13 November 2010 12:04 28a 0.610 20 November 2010 22:55 2a 0.2
aReported volumes are approximate and based on partitioning of cumulativeand failure surface areas revealed by high-resolution photographs and video
Published in 2011 by John Wiley and Sons, Ltd.
August 2009, the particular source area that is the focus ofthis paper was not documented as active prior to 2009(Wieczorek and Snyder, 2004, and additional unpublishedobservations). However, numerous cliff features such as over-hangs and fan-shaped fracture textures (Bahat et al., 1999)indicate that rock falls have previously occurred in this areaprior to historical documentation. Furthermore, the extensivetalus slope beneath the Rhombus Wall (Figure 1(B)) confirmsthat rock falls have been common at this location sincedeglaciation occurred at about 15–17 ka.
The first event of the Rhombus Wall rock fall sequence was asmall rock fall that occurred at approximately 04:15 PacificStandard Time (PST) on 26 August 2009 (area 1a in Figure 5).The rock fall was not witnessed directly given its early morningoccurrence, but several residents living near the Rhombus Wallheard the impacts of falling rock onto the talus slope. A com-parison of photographs taken later that morning at 07:30 PST
all rock falls
) Surface area (m2) Failure surface orientation (dipº/dip directionº)
2 72/2166 67/2115 68/214
25 79/219180 79/21360 90/211
135 80/2149 57/203
38 90/21654 88/20456 86/20630 71/21170 83/20247 88/19910 88/196
failure volumes, derived from difference analyses of laser scanning data.
Earth Surf. Process. Landforms (2011)
G. M. STOCK ET AL.
with the gigapixel panoramic images of the Rhombus Wall ac-quired prior to the rock fall (Figure 1(B), 1(C)) reveals that thefailure occurred at the inside corner of an alcove roof beneathan overhanging rock slab (area 1a in Figure 5; Figure 6). Stressconcentrations can be expected at corners such as this in rock(Holister, 1967; Muller and Martel, 2000; Barber, 2002). Thefailure surface showed mostly freshly broken rock with raggededges and no clearly defined pre-existing structural discontinu-ities. Local water staining on the newly exposed surface, how-ever, indicates that a fracture behind the rock mass was openand conducting water, and had partially detached the rockmass from the cliff prior to failure.Several hours later, beginning at approximately 12:30 PST, a
series of three rock falls, separated in time by approximately20–60 seconds, began at the initial failure area and propagatedup and to the west (areas 1b, 1c, and 1d in Figure 5) along asub-planar, near-vertical sheeting joint (Table I) that closelymirrored the orientation of the cliff face prior to failure. A parkvisitor captured the rock fall at 12:31 PST on high-definitionvideo (Figure 7). Analysis of this video reveals a sudden
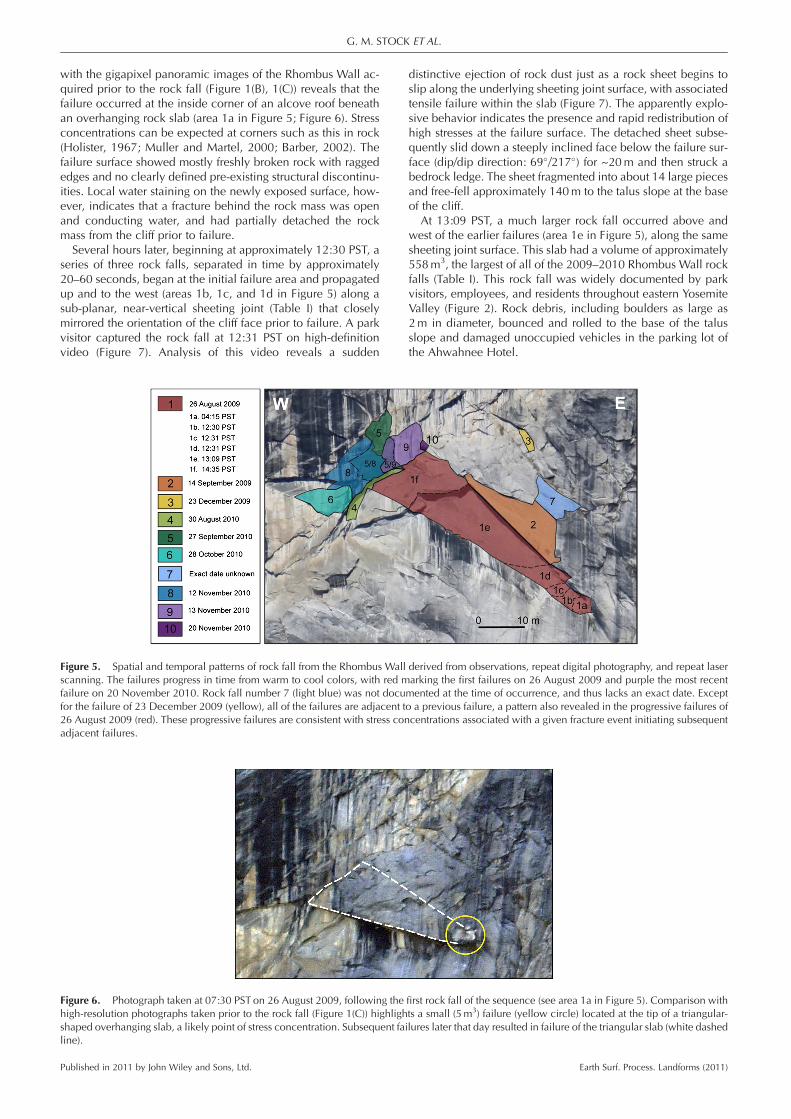
Figure 5. Spatial and temporal patterns of rock fall from the Rhombus Wallscanning. The failures progress in time from warm to cool colors, with red mfailure on 20 November 2010. Rock fall number 7 (light blue) was not docufor the failure of 23 December 2009 (yellow), all of the failures are adjacent t26 August 2009 (red). These progressive failures are consistent with stress conadjacent failures.
Figure 6. Photograph taken at 07:30 PST on 26 August 2009, following thehigh-resolution photographs taken prior to the rock fall (Figure 1(C)) highlighshaped overhanging slab, a likely point of stress concentration. Subsequent faline).
Published in 2011 by John Wiley and Sons, Ltd.
distinctive ejection of rock dust just as a rock sheet begins toslip along the underlying sheeting joint surface, with associatedtensile failure within the slab (Figure 7). The apparently explo-sive behavior indicates the presence and rapid redistribution ofhigh stresses at the failure surface. The detached sheet subse-quently slid down a steeply inclined face below the failure sur-face (dip/dip direction: 69�/217�) for ~20m and then struck abedrock ledge. The sheet fragmented into about 14 large piecesand free-fell approximately 140m to the talus slope at the baseof the cliff.
At 13:09 PST, a much larger rock fall occurred above andwest of the earlier failures (area 1e in Figure 5), along the samesheeting joint surface. This slab had a volume of approximately558m3, the largest of all of the 2009–2010 Rhombus Wall rockfalls (Table I). This rock fall was widely documented by parkvisitors, employees, and residents throughout eastern YosemiteValley (Figure 2). Rock debris, including boulders as large as2m in diameter, bounced and rolled to the base of the talusslope and damaged unoccupied vehicles in the parking lot ofthe Ahwahnee Hotel.
derived from observations, repeat digital photography, and repeat laserarking the first failures on 26 August 2009 and purple the most recentmented at the time of occurrence, and thus lacks an exact date. Excepto a previous failure, a pattern also revealed in the progressive failures ofcentrations associated with a given fracture event initiating subsequent
first rock fall of the sequence (see area 1a in Figure 5). Comparison withts a small (5m3) failure (yellow circle) located at the tip of a triangular-ilures later that day resulted in failure of the triangular slab (white dashed
Earth Surf. Process. Landforms (2011)
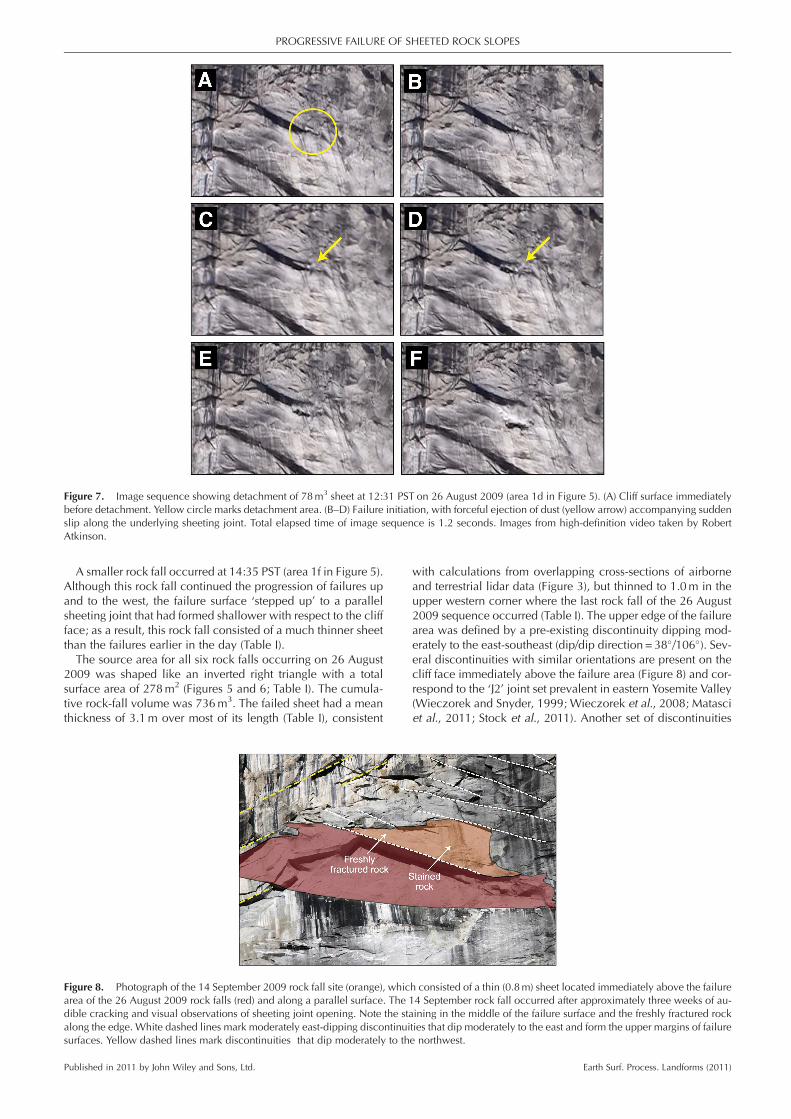
Figure 7. Image sequence showing detachment of 78m3 sheet at 12:31 PST on 26 August 2009 (area 1d in Figure 5). (A) Cliff surface immediatelybefore detachment. Yellow circle marks detachment area. (B–D) Failure initiation, with forceful ejection of dust (yellow arrow) accompanying suddenslip along the underlying sheeting joint. Total elapsed time of image sequence is 1.2 seconds. Images from high-definition video taken by RobertAtkinson.
PROGRESSIVE FAILURE OF SHEETED ROCK SLOPES
A smaller rock fall occurred at 14:35 PST (area 1f in Figure 5).Although this rock fall continued the progression of failures upand to the west, the failure surface ‘stepped up’ to a parallelsheeting joint that had formed shallower with respect to the cliffface; as a result, this rock fall consisted of a much thinner sheetthan the failures earlier in the day (Table I).The source area for all six rock falls occurring on 26 August
2009 was shaped like an inverted right triangle with a totalsurface area of 278m2 (Figures 5 and 6; Table I). The cumula-tive rock-fall volume was 736m3. The failed sheet had a meanthickness of 3.1m over most of its length (Table I), consistent
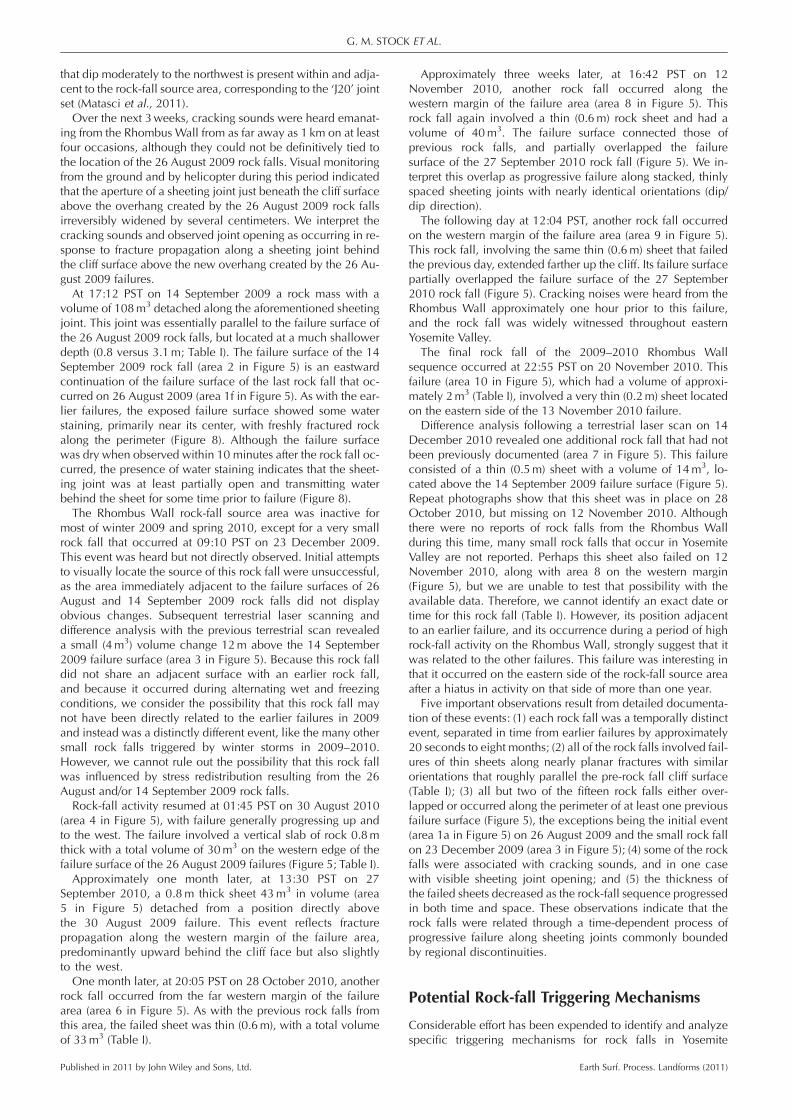
Figure 8. Photograph of the 14 September 2009 rock fall site (orange), whicarea of the 26 August 2009 rock falls (red) and along a parallel surface. Thedible cracking and visual observations of sheeting joint opening. Note the stalong the edge. White dashed lines mark moderately east-dipping discontinuisurfaces. Yellow dashed lines mark discontinuities that dip moderately to th
Published in 2011 by John Wiley and Sons, Ltd.
with calculations from overlapping cross-sections of airborneand terrestrial lidar data (Figure 3), but thinned to 1.0m in theupper western corner where the last rock fall of the 26 August2009 sequence occurred (Table I). The upper edge of the failurearea was defined by a pre-existing discontinuity dipping mod-erately to the east-southeast (dip/dip direction =38�/106�). Sev-eral discontinuities with similar orientations are present on thecliff face immediately above the failure area (Figure 8) and cor-respond to the ‘J2’ joint set prevalent in eastern Yosemite Valley(Wieczorek and Snyder, 1999; Wieczorek et al., 2008; Matasciet al., 2011; Stock et al., 2011). Another set of discontinuities
h consisted of a thin (0.8m) sheet located immediately above the failure14 September rock fall occurred after approximately three weeks of au-aining in the middle of the failure surface and the freshly fractured rockties that dip moderately to the east and form the upper margins of failuree northwest.
Earth Surf. Process. Landforms (2011)
G. M. STOCK ET AL.
that dip moderately to the northwest is present within and adja-cent to the rock-fall source area, corresponding to the ‘J20’ jointset (Matasci et al., 2011).Over the next 3weeks, cracking sounds were heard emanat-
ing from the Rhombus Wall from as far away as 1 km on at leastfour occasions, although they could not be definitively tied tothe location of the 26 August 2009 rock falls. Visual monitoringfrom the ground and by helicopter during this period indicatedthat the aperture of a sheeting joint just beneath the cliff surfaceabove the overhang created by the 26 August 2009 rock fallsirreversibly widened by several centimeters. We interpret thecracking sounds and observed joint opening as occurring in re-sponse to fracture propagation along a sheeting joint behindthe cliff surface above the new overhang created by the 26 Au-gust 2009 failures.At 17:12 PST on 14 September 2009 a rock mass with a
volume of 108m3 detached along the aforementioned sheetingjoint. This joint was essentially parallel to the failure surface ofthe 26 August 2009 rock falls, but located at a much shallowerdepth (0.8 versus 3.1m; Table I). The failure surface of the 14September 2009 rock fall (area 2 in Figure 5) is an eastwardcontinuation of the failure surface of the last rock fall that oc-curred on 26 August 2009 (area 1f in Figure 5). As with the ear-lier failures, the exposed failure surface showed some waterstaining, primarily near its center, with freshly fractured rockalong the perimeter (Figure 8). Although the failure surfacewas dry when observed within 10 minutes after the rock fall oc-curred, the presence of water staining indicates that the sheet-ing joint was at least partially open and transmitting waterbehind the sheet for some time prior to failure (Figure 8).The Rhombus Wall rock-fall source area was inactive for
most of winter 2009 and spring 2010, except for a very smallrock fall that occurred at 09:10 PST on 23 December 2009.This event was heard but not directly observed. Initial attemptsto visually locate the source of this rock fall were unsuccessful,as the area immediately adjacent to the failure surfaces of 26August and 14 September 2009 rock falls did not displayobvious changes. Subsequent terrestrial laser scanning anddifference analysis with the previous terrestrial scan revealeda small (4m3) volume change 12m above the 14 September2009 failure surface (area 3 in Figure 5). Because this rock falldid not share an adjacent surface with an earlier rock fall,and because it occurred during alternating wet and freezingconditions, we consider the possibility that this rock fall maynot have been directly related to the earlier failures in 2009and instead was a distinctly different event, like the many othersmall rock falls triggered by winter storms in 2009–2010.However, we cannot rule out the possibility that this rock fallwas influenced by stress redistribution resulting from the 26August and/or 14 September 2009 rock falls.Rock-fall activity resumed at 01:45 PST on 30 August 2010
(area 4 in Figure 5), with failure generally progressing up andto the west. The failure involved a vertical slab of rock 0.8mthick with a total volume of 30m3 on the western edge of thefailure surface of the 26 August 2009 failures (Figure 5; Table I).Approximately one month later, at 13:30 PST on 27
September 2010, a 0.8m thick sheet 43m3 in volume (area5 in Figure 5) detached from a position directly abovethe 30 August 2009 failure. This event reflects fracturepropagation along the western margin of the failure area,predominantly upward behind the cliff face but also slightlyto the west.One month later, at 20:05 PST on 28 October 2010, another
rock fall occurred from the far western margin of the failurearea (area 6 in Figure 5). As with the previous rock falls fromthis area, the failed sheet was thin (0.6m), with a total volumeof 33m3 (Table I).
Published in 2011 by John Wiley and Sons, Ltd.
Approximately three weeks later, at 16:42 PST on 12November 2010, another rock fall occurred along thewestern margin of the failure area (area 8 in Figure 5). Thisrock fall again involved a thin (0.6m) rock sheet and had avolume of 40m3. The failure surface connected those ofprevious rock falls, and partially overlapped the failuresurface of the 27 September 2010 rock fall (Figure 5). We in-terpret this overlap as progressive failure along stacked, thinlyspaced sheeting joints with nearly identical orientations (dip/dip direction).
The following day at 12:04 PST, another rock fall occurredon the western margin of the failure area (area 9 in Figure 5).This rock fall, involving the same thin (0.6m) sheet that failedthe previous day, extended farther up the cliff. Its failure surfacepartially overlapped the failure surface of the 27 September2010 rock fall (Figure 5). Cracking noises were heard from theRhombus Wall approximately one hour prior to this failure,and the rock fall was widely witnessed throughout easternYosemite Valley.
The final rock fall of the 2009–2010 Rhombus Wallsequence occurred at 22:55 PST on 20 November 2010. Thisfailure (area 10 in Figure 5), which had a volume of approxi-mately 2m3 (Table I), involved a very thin (0.2m) sheet locatedon the eastern side of the 13 November 2010 failure.
Difference analysis following a terrestrial laser scan on 14December 2010 revealed one additional rock fall that had notbeen previously documented (area 7 in Figure 5). This failureconsisted of a thin (0.5m) sheet with a volume of 14m3, lo-cated above the 14 September 2009 failure surface (Figure 5).Repeat photographs show that this sheet was in place on 28October 2010, but missing on 12 November 2010. Althoughthere were no reports of rock falls from the Rhombus Wallduring this time, many small rock falls that occur in YosemiteValley are not reported. Perhaps this sheet also failed on 12November 2010, along with area 8 on the western margin(Figure 5), but we are unable to test that possibility with theavailable data. Therefore, we cannot identify an exact date ortime for this rock fall (Table I). However, its position adjacentto an earlier failure, and its occurrence during a period of highrock-fall activity on the Rhombus Wall, strongly suggest that itwas related to the other failures. This failure was interesting inthat it occurred on the eastern side of the rock-fall source areaafter a hiatus in activity on that side of more than one year.
Five important observations result from detailed documenta-tion of these events: (1) each rock fall was a temporally distinctevent, separated in time from earlier failures by approximately20 seconds to eight months; (2) all of the rock falls involved fail-ures of thin sheets along nearly planar fractures with similarorientations that roughly parallel the pre-rock fall cliff surface(Table I); (3) all but two of the fifteen rock falls either over-lapped or occurred along the perimeter of at least one previousfailure surface (Figure 5), the exceptions being the initial event(area 1a in Figure 5) on 26 August 2009 and the small rock fallon 23 December 2009 (area 3 in Figure 5); (4) some of the rockfalls were associated with cracking sounds, and in one casewith visible sheeting joint opening; and (5) the thickness ofthe failed sheets decreased as the rock-fall sequence progressedin both time and space. These observations indicate that therock falls were related through a time-dependent process ofprogressive failure along sheeting joints commonly boundedby regional discontinuities.
Potential Rock-fall Triggering Mechanisms
Considerable effort has been expended to identify and analyzespecific triggering mechanisms for rock falls in Yosemite
Earth Surf. Process. Landforms (2011)
PROGRESSIVE FAILURE OF SHEETED ROCK SLOPES
(Wieczorek and Jäger, 1996; Wieczorek and Snyder, 2004;Wieczorek et al., 2008). Although many rock falls aretemporally correlated with specific meteorological events suchas rainfall, snowmelt, or freeze–thaw events, or with seismi-cally induced ground shaking, these temporal correlations donot always point to a clearly defined mechanical trigger.Furthermore, many rock falls cannot be reliably correlatedwith such ‘recognized’ triggers, even when closely observed.Thirty-three percent of all documented rock falls in Yosemiteare reported as having ‘unrecognized’ triggers (Wieczorekand Snyder, 2004, and additional unpublished observations).Such an absence of recognized triggers, while not unusual(Sanderson et al., 1996), probably reflects incompleteunderstanding of subtle changes that can occur alongdiscontinuities.The 2009–2010 Rhombus Wall rock falls occurred over a
wide variety of meteorological conditions, and many of therock falls cannot be temporally correlated with a recognizedtriggering mechanism. The rock falls on 26 August 2009revealed some seepage on the failure surface, but it is unclearwhether this water triggered these failures or whether the failureoccurred for other reasons and simply revealed seepage thatwas present beneath the failed sheet. Most of the subsequentrock falls from the Rhombus Wall were dry failures, suggestingthat water did not act as a trigger. Dry failures are relativelycommon in granitic landscapes with sheeting joints, and mightbe related to diurnal and/or annual changes in temperatureand/or humidity (Chau and Shao, 2006; Vargas et al., 2009;Nara et al., 2010); it is interesting to note that most of theRhombus Wall rock falls occurred during what are typicallywarm and dry months in Yosemite Valley (August throughNovember; Table I). In any case, the time-dependent progres-sive nature of these rock falls is not easily attributable toelevated water pressures. Considering the many rock falls inYosemite Valley (and elsewhere) that lack recognized triggers,we suggest that a rock fall might not have an easily recogniz-able trigger if the failure process involves subcritical crackpropagation (Bahat et al., 1999).Our visual observations, high-resolution photographs, and
lidar data analyses demonstrate that the majority of failuresurfaces for the 2009–2010 Rhombus Wall rock falls wereformed by interconnected sheeting joints (Figure 5; Table I).The characteristic presence of water stains on the failuresurfaces demonstrates that most of the joints behind thefailed sheets were at least partially open and conductingwater prior to failure (Figure 8). However, observations thatmany of the failed slabs were bounded on the top byregional discontinuities, and that many failure surfacesexhibited freshly fractured rock along the perimeters(Figure 8), suggest that the failed slabs were attached at theirmargins prior to failure.As presented in the Introduction, time-dependent failure of
rock slopes can occur for several reasons, including weatheringof failure surfaces, subcritical crack growth, and fracturepropagation through intact rock bridges (Einstein et al., 1983;Atkinson, 1984; Eberhardt et al., 2004; Kemeny, 2005; Kimand Kemeny, 2009). These processes might have contributedto the Rhombus Wall rock falls. However, the observations de-scribed above suggest that the Rhombus Wall rock falls werefundamentally related to sheeting joints formed (sub)parallelto the surface, and perhaps involved the propagation of thesejoints into areas of previously intact rock. Below, we examinethe mechanics of sheeting joint propagation to gain insight intothe stresses around the Rhombus Wall and the role stress con-centrations associated with sheeting joints might have playedin triggering the progression of rock falls from the RhombusWall.
Published in 2011 by John Wiley and Sons, Ltd.
Mechanical Analysis of Sheeting JointPropagation
Our conceptual model for the involvement of sheeting jointpropagation in the Rhombus Wall rock falls is based on severalkey field observations:
(1) Sheeting joints are opening-mode fractures that develop(sub)parallel to a rock face (Martel, 2006, 2011).
(2) The near-parallelism of sheeting joints to currenttopographic surfaces, the presence of thin, loose rock slabsbounded by sheeting joints in areas recently scoured byglaciers, and related field observations indicate that manysheeting joints in Yosemite are geologically young, withsome nucleating, opening, and propagating historically(Martel, 2006, 2011, and references therein).
(3) The cliff face and a (sub)parallel sheeting joint constituteessentially the entire front and back, respectively, of eachrock slab that separated and fell during the 2009–2010Rhombus Wall rock falls. Given the similar geometriesand failure surface orientations of the slabs (Table I),sheeting joints appear to be essential contributors to theRhombus Wall rock falls.
(4) The presence of freshly fractured rock either along or at themargin of sheeting joints at the Rhombus Wall rock-fallsource area indicates that fracturing during the initial stagesof failure involved sheeting joints.
Since the rock fracture process involves the nucleation,propagation, and termination of fractures (Lawn, 1993), theobservations above suggest that the Rhombus Wall failuresmight have involved the propagation of sheeting joints in-planeinto pre-existing regional discontinuities, and/or out-of-planeeither to the cliff surface or into pre-existing regionaldiscontinuities. To examine the factors that cause sheetingjoints to open and propagate parallel to a cliff face at shallowdepths, and to evaluate the role this process may have playedin the Rhombus Wall rock falls, we considered the mechanicsof three salient aspects of the failures: (1) the stresses that drivethe propagation of sheeting joints and hence trigger rock falls;(2) sheeting joint geometry, which then dictates the geometryof the rock falls; and (3) the progressive nature of the failures.
Stresses that drive sheeting joints
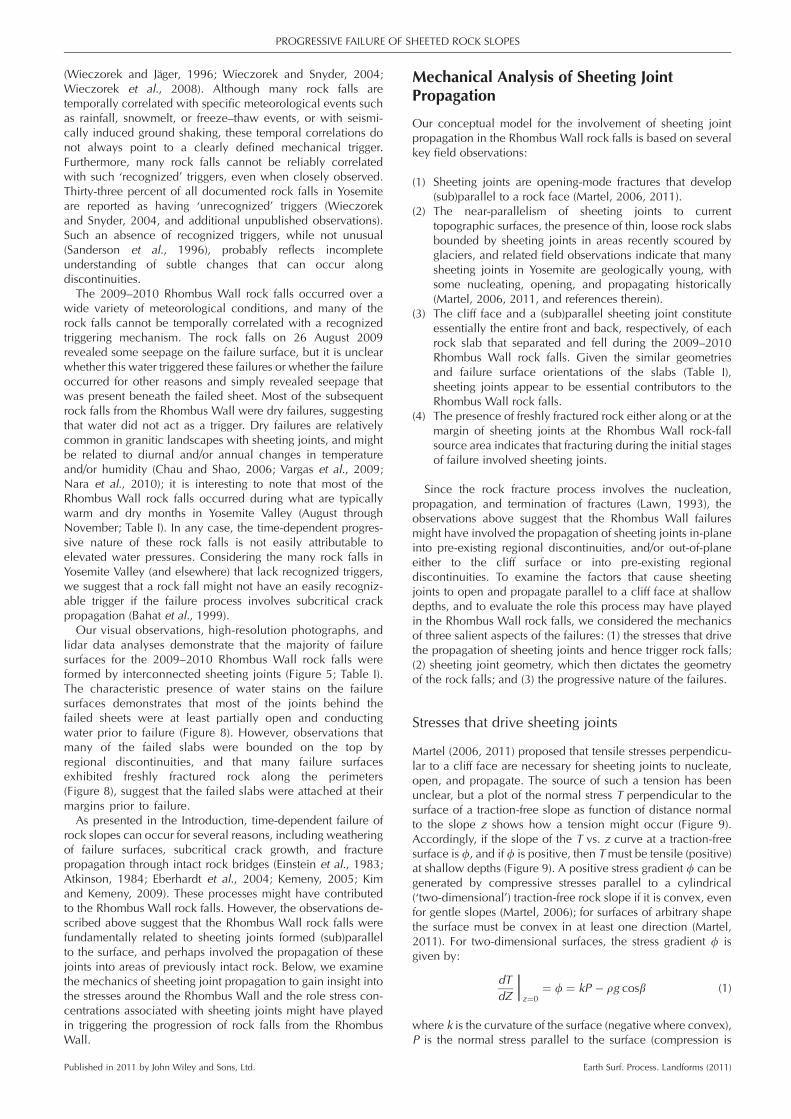
Martel (2006, 2011) proposed that tensile stresses perpendicu-lar to a cliff face are necessary for sheeting joints to nucleate,open, and propagate. The source of such a tension has beenunclear, but a plot of the normal stress T perpendicular to thesurface of a traction-free slope as function of distance normalto the slope z shows how a tension might occur (Figure 9).Accordingly, if the slope of the T vs. z curve at a traction-freesurface is f, and if f is positive, then Tmust be tensile (positive)at shallow depths (Figure 9). A positive stress gradient f can begenerated by compressive stresses parallel to a cylindrical(‘two-dimensional’) traction-free rock slope if it is convex, evenfor gentle slopes (Martel, 2006); for surfaces of arbitrary shapethe surface must be convex in at least one direction (Martel,2011). For two-dimensional surfaces, the stress gradient f isgiven by:
dTdZ jz¼0
¼ f ¼ kP � rg cosb (1)
where k is the curvature of the surface (negative where convex),P is the normal stress parallel to the surface (compression is
Earth Surf. Process. Landforms (2011)
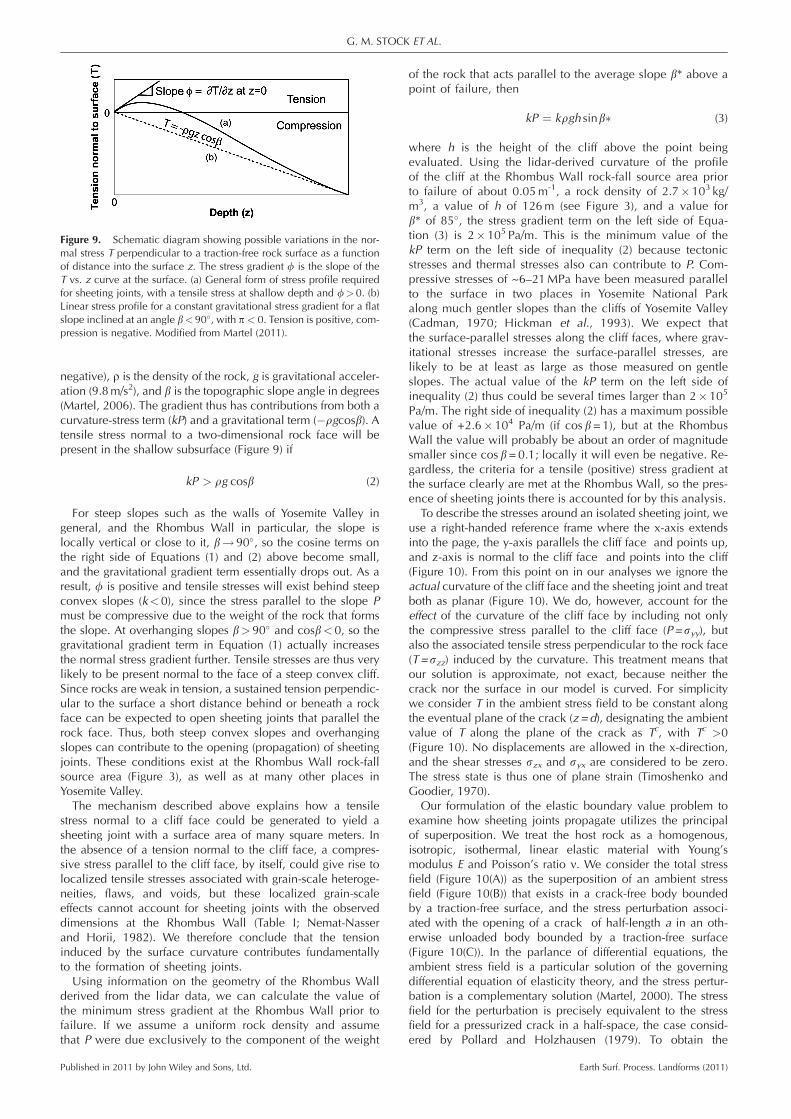
Figure 9. Schematic diagram showing possible variations in the nor-mal stress T perpendicular to a traction-free rock surface as a functionof distance into the surface z. The stress gradient f is the slope of theT vs. z curve at the surface. (a) General form of stress profile requiredfor sheeting joints, with a tensile stress at shallow depth and f>0. (b)Linear stress profile for a constant gravitational stress gradient for a flatslope inclined at an angle b<90�, with p < 0. Tension is positive, com-pression is negative. Modified from Martel (2011).
G. M. STOCK ET AL.
negative), r is the density of the rock, g is gravitational acceler-ation (9.8m/s2), and b is the topographic slope angle in degrees(Martel, 2006). The gradient thus has contributions from both acurvature-stress term (kP) and a gravitational term (�rgcosb). Atensile stress normal to a two-dimensional rock face will bepresent in the shallow subsurface (Figure 9) if
kP > rg cosb (2)
For steep slopes such as the walls of Yosemite Valley ingeneral, and the Rhombus Wall in particular, the slope islocally vertical or close to it, b!90�, so the cosine terms onthe right side of Equations (1) and (2) above become small,and the gravitational gradient term essentially drops out. As aresult, f is positive and tensile stresses will exist behind steepconvex slopes (k< 0), since the stress parallel to the slope Pmust be compressive due to the weight of the rock that formsthe slope. At overhanging slopes b> 90� and cosb< 0, so thegravitational gradient term in Equation (1) actually increasesthe normal stress gradient further. Tensile stresses are thus verylikely to be present normal to the face of a steep convex cliff.Since rocks are weak in tension, a sustained tension perpendic-ular to the surface a short distance behind or beneath a rockface can be expected to open sheeting joints that parallel therock face. Thus, both steep convex slopes and overhangingslopes can contribute to the opening (propagation) of sheetingjoints. These conditions exist at the Rhombus Wall rock-fallsource area (Figure 3), as well as at many other places inYosemite Valley.The mechanism described above explains how a tensile
stress normal to a cliff face could be generated to yield asheeting joint with a surface area of many square meters. Inthe absence of a tension normal to the cliff face, a compres-sive stress parallel to the cliff face, by itself, could give rise tolocalized tensile stresses associated with grain-scale heteroge-neities, flaws, and voids, but these localized grain-scaleeffects cannot account for sheeting joints with the observeddimensions at the Rhombus Wall (Table I; Nemat-Nasserand Horii, 1982). We therefore conclude that the tensioninduced by the surface curvature contributes fundamentallyto the formation of sheeting joints.Using information on the geometry of the Rhombus Wall
derived from the lidar data, we can calculate the value ofthe minimum stress gradient at the Rhombus Wall prior tofailure. If we assume a uniform rock density and assumethat P were due exclusively to the component of the weight
Published in 2011 by John Wiley and Sons, Ltd.
of the rock that acts parallel to the average slope b* above apoint of failure, then
kP ¼ krgh sinb� (3)
where h is the height of the cliff above the point beingevaluated. Using the lidar-derived curvature of the profileof the cliff at the Rhombus Wall rock-fall source area priorto failure of about 0.05m-1, a rock density of 2.7�103 kg/m3, a value of h of 126m (see Figure 3), and a value forb* of 85�, the stress gradient term on the left side of Equa-tion (3) is 2� 105 Pa/m. This is the minimum value of thekP term on the left side of inequality (2) because tectonicstresses and thermal stresses also can contribute to P. Com-pressive stresses of ~6–21MPa have been measured parallelto the surface in two places in Yosemite National Parkalong much gentler slopes than the cliffs of Yosemite Valley(Cadman, 1970; Hickman et al., 1993). We expect thatthe surface-parallel stresses along the cliff faces, where grav-itational stresses increase the surface-parallel stresses, arelikely to be at least as large as those measured on gentleslopes. The actual value of the kP term on the left side ofinequality (2) thus could be several times larger than 2� 105
Pa/m. The right side of inequality (2) has a maximum possiblevalue of +2.6�104 Pa/m (if cos b= 1), but at the RhombusWall the value will probably be about an order of magnitudesmaller since cos b= 0.1; locally it will even be negative. Re-gardless, the criteria for a tensile (positive) stress gradient atthe surface clearly are met at the Rhombus Wall, so the pres-ence of sheeting joints there is accounted for by this analysis.
To describe the stresses around an isolated sheeting joint, weuse a right-handed reference frame where the x-axis extendsinto the page, the y-axis parallels the cliff face and points up,and z-axis is normal to the cliff face and points into the cliff(Figure 10). From this point on in our analyses we ignore theactual curvature of the cliff face and the sheeting joint and treatboth as planar (Figure 10). We do, however, account for theeffect of the curvature of the cliff face by including not onlythe compressive stress parallel to the cliff face (P=syy), butalso the associated tensile stress perpendicular to the rock face(T=szz) induced by the curvature. This treatment means thatour solution is approximate, not exact, because neither thecrack nor the surface in our model is curved. For simplicitywe consider T in the ambient stress field to be constant alongthe eventual plane of the crack (z = d), designating the ambientvalue of T along the plane of the crack as Tc, with Tc >0(Figure 10). No displacements are allowed in the x-direction,and the shear stresses szx and syx are considered to be zero.The stress state is thus one of plane strain (Timoshenko andGoodier, 1970).
Our formulation of the elastic boundary value problem toexamine how sheeting joints propagate utilizes the principalof superposition. We treat the host rock as a homogenous,isotropic, isothermal, linear elastic material with Young’smodulus E and Poisson’s ratio n. We consider the total stressfield (Figure 10(A)) as the superposition of an ambient stressfield (Figure 10(B)) that exists in a crack-free body boundedby a traction-free surface, and the stress perturbation associ-ated with the opening of a crack of half-length a in an oth-erwise unloaded body bounded by a traction-free surface(Figure 10(C)). In the parlance of differential equations, theambient stress field is a particular solution of the governingdifferential equation of elasticity theory, and the stress pertur-bation is a complementary solution (Martel, 2000). The stressfield for the perturbation is precisely equivalent to the stressfield for a pressurized crack in a half-space, the case consid-ered by Pollard and Holzhausen (1979). To obtain the
Earth Surf. Process. Landforms (2011)
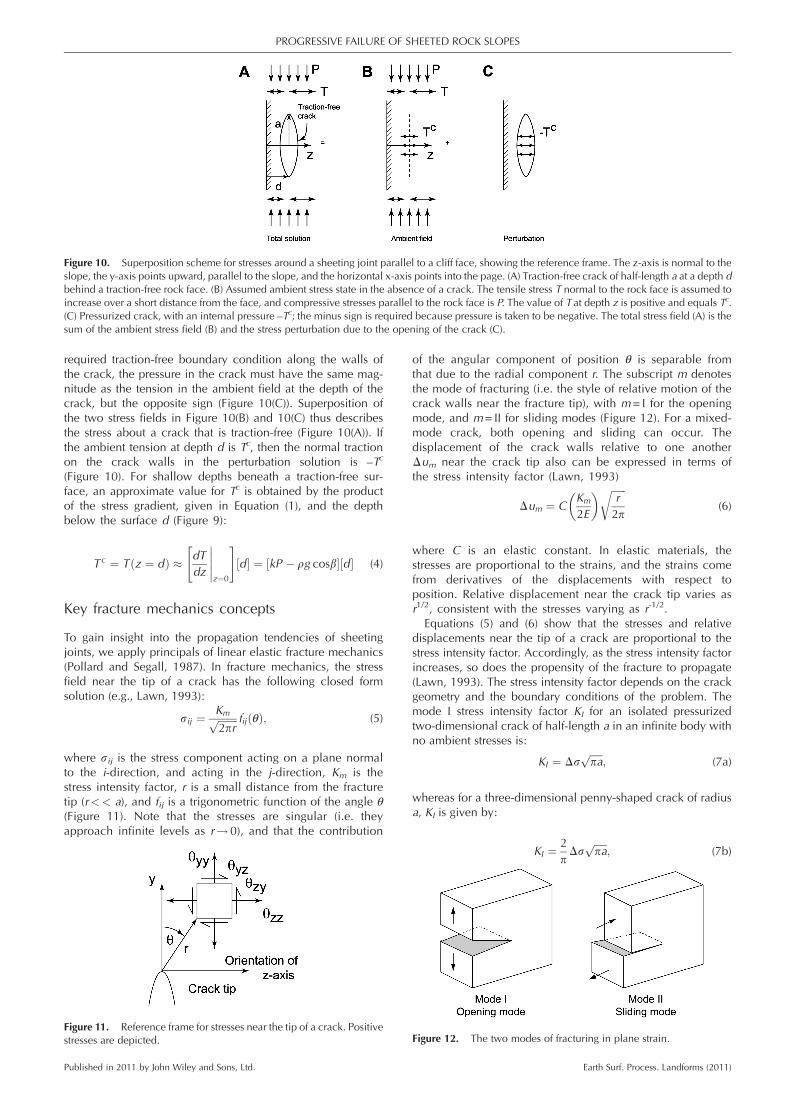
Figure 10. Superposition scheme for stresses around a sheeting joint parallel to a cliff face, showing the reference frame. The z-axis is normal to theslope, the y-axis points upward, parallel to the slope, and the horizontal x-axis points into the page. (A) Traction-free crack of half-length a at a depth dbehind a traction-free rock face. (B) Assumed ambient stress state in the absence of a crack. The tensile stress T normal to the rock face is assumed toincrease over a short distance from the face, and compressive stresses parallel to the rock face is P. The value of T at depth z is positive and equals Tc.(C) Pressurized crack, with an internal pressure –Tc; the minus sign is required because pressure is taken to be negative. The total stress field (A) is thesum of the ambient stress field (B) and the stress perturbation due to the opening of the crack (C).
PROGRESSIVE FAILURE OF SHEETED ROCK SLOPES
required traction-free boundary condition along the walls ofthe crack, the pressure in the crack must have the same mag-nitude as the tension in the ambient field at the depth of thecrack, but the opposite sign (Figure 10(C)). Superposition ofthe two stress fields in Figure 10(B) and 10(C) thus describesthe stress about a crack that is traction-free (Figure 10(A)). Ifthe ambient tension at depth d is Tc, then the normal tractionon the crack walls in the perturbation solution is –Tc
(Figure 10). For shallow depths beneath a traction-free sur-face, an approximate value for Tc is obtained by the productof the stress gradient, given in Equation (1), and the depthbelow the surface d (Figure 9):
Tc ¼ T z ¼ dð Þ � dTdz
z¼0
#d½ � ¼ kP � rg cosb½ � d½ �
�����"
(4)
Key fracture mechanics concepts
To gain insight into the propagation tendencies of sheetingjoints, we apply principals of linear elastic fracture mechanics(Pollard and Segall, 1987). In fracture mechanics, the stressfield near the tip of a crack has the following closed formsolution (e.g., Lawn, 1993):
sij ¼ Kmffiffiffiffiffiffiffiffi2pr
p fij θð Þ; (5)
where sij is the stress component acting on a plane normalto the i-direction, and acting in the j-direction, Km is thestress intensity factor, r is a small distance from the fracturetip (r<< a), and fij is a trigonometric function of the angle θ(Figure 11). Note that the stresses are singular (i.e. theyapproach infinite levels as r!0), and that the contribution
Figure 11. Reference frame for stresses near the tip of a crack. Positivestresses are depicted.
Published in 2011 by John Wiley and Sons, Ltd.
of the angular component of position θ is separable fromthat due to the radial component r. The subscript m denotesthe mode of fracturing (i.e. the style of relative motion of thecrack walls near the fracture tip), with m= I for the openingmode, and m= II for sliding modes (Figure 12). For a mixed-mode crack, both opening and sliding can occur. Thedisplacement of the crack walls relative to one anotherΔum near the crack tip also can be expressed in terms ofthe stress intensity factor (Lawn, 1993)
Δum ¼ CKm
2E
� � ffiffiffiffiffiffir2p
r(6)
where C is an elastic constant. In elastic materials, thestresses are proportional to the strains, and the strains comefrom derivatives of the displacements with respect toposition. Relative displacement near the crack tip varies asr1/2, consistent with the stresses varying as r-1/2.
Equations (5) and (6) show that the stresses and relativedisplacements near the tip of a crack are proportional to thestress intensity factor. Accordingly, as the stress intensity factorincreases, so does the propensity of the fracture to propagate(Lawn, 1993). The stress intensity factor depends on the crackgeometry and the boundary conditions of the problem. Themode I stress intensity factor KI for an isolated pressurizedtwo-dimensional crack of half-length a in an infinite body withno ambient stresses is:
KI ¼ Δsffiffiffiffiffipa
p; (7a)
whereas for a three-dimensional penny-shaped crack of radiusa, KI is given by:
KI ¼ 2pΔs
ffiffiffiffiffipa
p; (7b)
Figure 12. The two modes of fracturing in plane strain.
Earth Surf. Process. Landforms (2011)
G. M. STOCK ET AL.
(Lawn, 1993). In both cases Δs is the driving pressure:
Δs ¼ sambientzz � scrack walls
zz (8)
The half-length or radius a thus defines the crack geometry,and the driving pressure Δs, which equals Tc here, comes fromthe boundary conditions of the perturbation problem (Equation(4); Figure 10(c)). The similar forms of Equations (7a) and (7b)indicates that an analysis of a two-dimensional crack canalso provide at least qualitative insight into the behavior ofa three-dimensional penny-shaped crack that resembles asheeting joint.We note that the stress intensity factor for a traction-free
crack under tension (Figure 10(A)) can be the same as for apressurized crack (Figure 10(C)). This is because the drivingpressures can be the same, even though the stress fields farfrom the cracks can be very different. In other words, theconditions at the tips of a crack opening in tension can beindistinguishable from those at the tips of a pressurized crack.The behavior of a pressurized crack thus is useful in under-standing propagation of a dry sheeting joint.
Propagation paths for sheeting joints
The relative displacement of the walls of a rock fracture near itstip can be used to predict the propagation paths of the fracture.Equation (6) shows that the stress intensity factors can be usedto describe the near-tip relative displacements, hence thepredicted propagation paths can be couched in terms of stressintensity factors.The mode II stress intensity factor KII describes near-tip
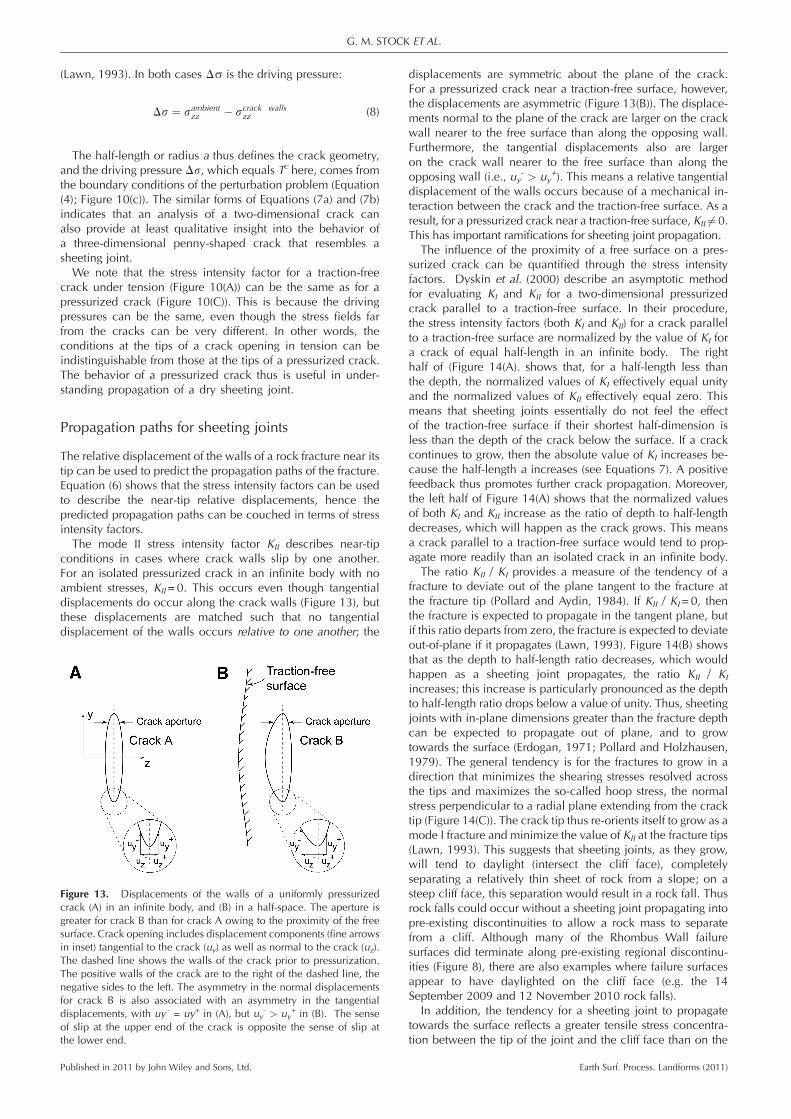
conditions in cases where crack walls slip by one another.For an isolated pressurized crack in an infinite body with noambient stresses, KII=0. This occurs even though tangentialdisplacements do occur along the crack walls (Figure 13), butthese displacements are matched such that no tangentialdisplacement of the walls occurs relative to one another; the
Figure 13. Displacements of the walls of a uniformly pressurizedcrack (A) in an infinite body, and (B) in a half-space. The aperture isgreater for crack B than for crack A owing to the proximity of the freesurface. Crack opening includes displacement components (fine arrowsin inset) tangential to the crack (uy) as well as normal to the crack (uz).The dashed line shows the walls of the crack prior to pressurization.The positive walls of the crack are to the right of the dashed line, thenegative sides to the left. The asymmetry in the normal displacementsfor crack B is also associated with an asymmetry in the tangentialdisplacements, with uy - = uy+ in (A), but uy
- > uy+ in (B). The sense
of slip at the upper end of the crack is opposite the sense of slip atthe lower end.
Published in 2011 by John Wiley and Sons, Ltd.
displacements are symmetric about the plane of the crack.For a pressurized crack near a traction-free surface, however,the displacements are asymmetric (Figure 13(B)). The displace-ments normal to the plane of the crack are larger on the crackwall nearer to the free surface than along the opposing wall.Furthermore, the tangential displacements also are largeron the crack wall nearer to the free surface than along theopposing wall (i.e., uy
- > uy+). This means a relative tangential
displacement of the walls occurs because of a mechanical in-teraction between the crack and the traction-free surface. As aresult, for a pressurized crack near a traction-free surface, KII 6¼0.This has important ramifications for sheeting joint propagation.
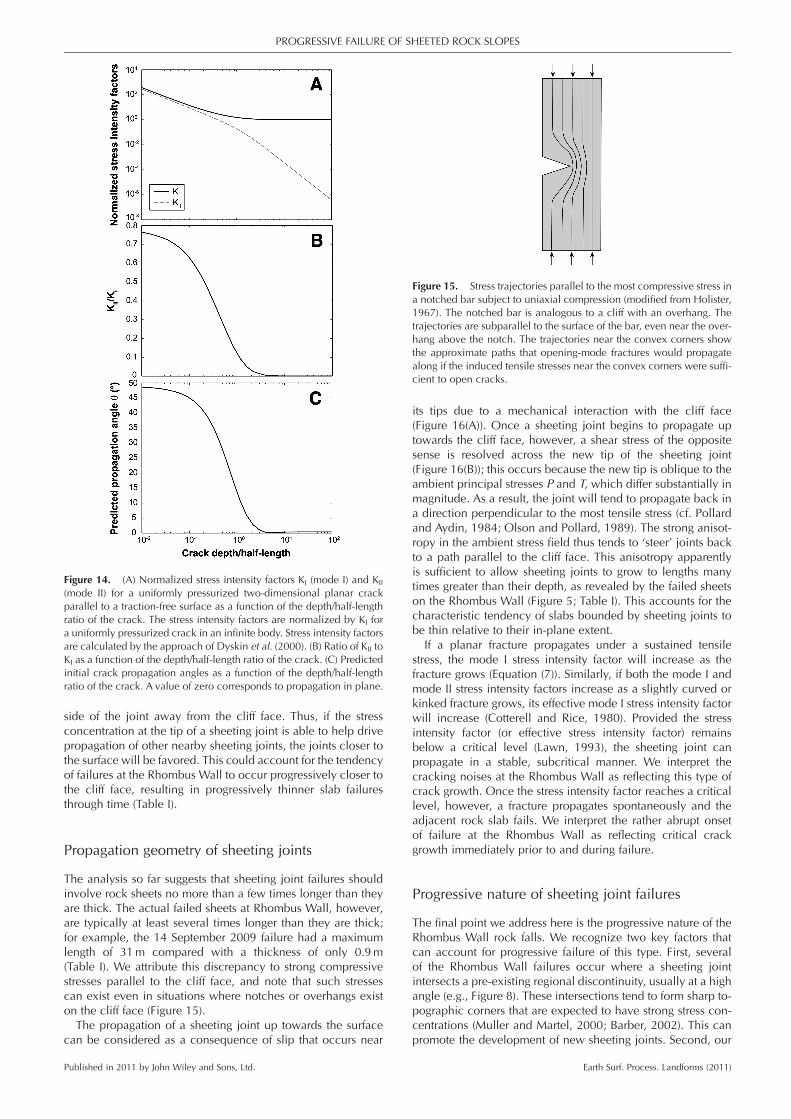
The influence of the proximity of a free surface on a pres-surized crack can be quantified through the stress intensityfactors. Dyskin et al. (2000) describe an asymptotic methodfor evaluating KI and KII for a two-dimensional pressurizedcrack parallel to a traction-free surface. In their procedure,the stress intensity factors (both KI and KII) for a crack parallelto a traction-free surface are normalized by the value of KI fora crack of equal half-length in an infinite body. The righthalf of (Figure 14(A). shows that, for a half-length less thanthe depth, the normalized values of KI effectively equal unityand the normalized values of KII effectively equal zero. Thismeans that sheeting joints essentially do not feel the effectof the traction-free surface if their shortest half-dimension isless than the depth of the crack below the surface. If a crackcontinues to grow, then the absolute value of KI increases be-cause the half-length a increases (see Equations 7). A positivefeedback thus promotes further crack propagation. Moreover,the left half of Figure 14(A) shows that the normalized valuesof both KI and KII increase as the ratio of depth to half-lengthdecreases, which will happen as the crack grows. This meansa crack parallel to a traction-free surface would tend to prop-agate more readily than an isolated crack in an infinite body.
The ratio KII / KI provides a measure of the tendency of afracture to deviate out of the plane tangent to the fracture atthe fracture tip (Pollard and Aydin, 1984). If KII / KI=0, thenthe fracture is expected to propagate in the tangent plane, butif this ratio departs from zero, the fracture is expected to deviateout-of-plane if it propagates (Lawn, 1993). Figure 14(B) showsthat as the depth to half-length ratio decreases, which wouldhappen as a sheeting joint propagates, the ratio KII / KI
increases; this increase is particularly pronounced as the depthto half-length ratio drops below a value of unity. Thus, sheetingjoints with in-plane dimensions greater than the fracture depthcan be expected to propagate out of plane, and to growtowards the surface (Erdogan, 1971; Pollard and Holzhausen,1979). The general tendency is for the fractures to grow in adirection that minimizes the shearing stresses resolved acrossthe tips and maximizes the so-called hoop stress, the normalstress perpendicular to a radial plane extending from the cracktip (Figure 14(C)). The crack tip thus re-orients itself to grow as amode I fracture and minimize the value of KII at the fracture tips(Lawn, 1993). This suggests that sheeting joints, as they grow,will tend to daylight (intersect the cliff face), completelyseparating a relatively thin sheet of rock from a slope; on asteep cliff face, this separation would result in a rock fall. Thusrock falls could occur without a sheeting joint propagating intopre-existing discontinuities to allow a rock mass to separatefrom a cliff. Although many of the Rhombus Wall failuresurfaces did terminate along pre-existing regional discontinu-ities (Figure 8), there are also examples where failure surfacesappear to have daylighted on the cliff face (e.g. the 14September 2009 and 12 November 2010 rock falls).
In addition, the tendency for a sheeting joint to propagatetowards the surface reflects a greater tensile stress concentra-tion between the tip of the joint and the cliff face than on the
Earth Surf. Process. Landforms (2011)
igure 15. Stress trajectories parallel to the most compressive stress innotched bar subject to uniaxial compression (modified from Holister,967). The notched bar is analogous to a cliff with an overhang. Theajectories are subparallel to the surface of the bar, even near the over-ang above the notch. The trajectories near the convex corners showe approximate paths that opening-mode fractures would propagatelong if the induced tensile stresses near the convex corners were suffi-ient to open cracks.
Figure 14. (A) Normalized stress intensity factors KI (mode I) and KII
(mode II) for a uniformly pressurized two-dimensional planar crackparallel to a traction-free surface as a function of the depth/half-lengthratio of the crack. The stress intensity factors are normalized by KI fora uniformly pressurized crack in an infinite body. Stress intensity factorsare calculated by the approach of Dyskin et al. (2000). (B) Ratio of KII toKI as a function of the depth/half-length ratio of the crack. (C) Predictedinitial crack propagation angles as a function of the depth/half-lengthratio of the crack. A value of zero corresponds to propagation in plane.
PROGRESSIVE FAILURE OF SHEETED ROCK SLOPES
side of the joint away from the cliff face. Thus, if the stressconcentration at the tip of a sheeting joint is able to help drivepropagation of other nearby sheeting joints, the joints closer tothe surface will be favored. This could account for the tendencyof failures at the Rhombus Wall to occur progressively closer tothe cliff face, resulting in progressively thinner slab failuresthrough time (Table I).
Propagation geometry of sheeting joints
The analysis so far suggests that sheeting joint failures shouldinvolve rock sheets no more than a few times longer than theyare thick. The actual failed sheets at Rhombus Wall, however,are typically at least several times longer than they are thick;for example, the 14 September 2009 failure had a maximumlength of 31m compared with a thickness of only 0.9m(Table I). We attribute this discrepancy to strong compressivestresses parallel to the cliff face, and note that such stressescan exist even in situations where notches or overhangs existon the cliff face (Figure 15).The propagation of a sheeting joint up towards the surface
can be considered as a consequence of slip that occurs near
Published in 2011 by John Wiley and Sons, Ltd.
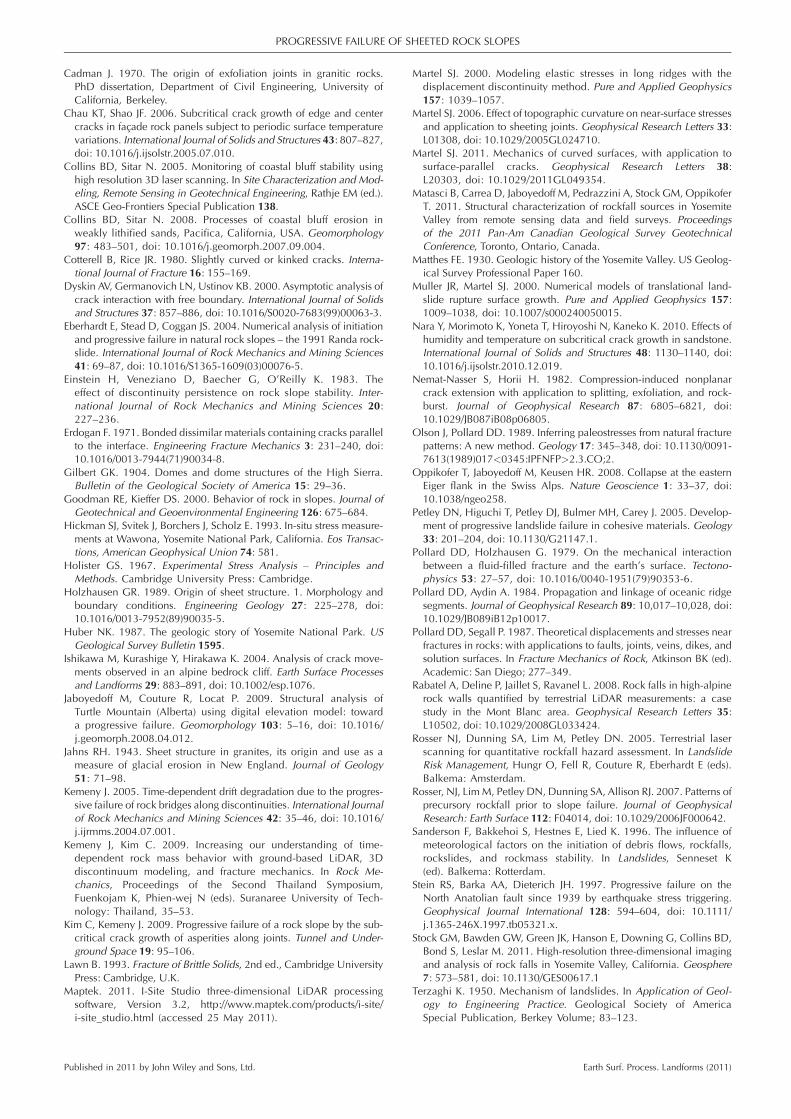
Fa1trhthac
its tips due to a mechanical interaction with the cliff face(Figure 16(A)). Once a sheeting joint begins to propagate uptowards the cliff face, however, a shear stress of the oppositesense is resolved across the new tip of the sheeting joint(Figure 16(B)); this occurs because the new tip is oblique to theambient principal stresses P and T, which differ substantially inmagnitude. As a result, the joint will tend to propagate back ina direction perpendicular to the most tensile stress (cf. Pollardand Aydin, 1984; Olson and Pollard, 1989). The strong anisot-ropy in the ambient stress field thus tends to ‘steer’ joints backto a path parallel to the cliff face. This anisotropy apparentlyis sufficient to allow sheeting joints to grow to lengths manytimes greater than their depth, as revealed by the failed sheetson the Rhombus Wall (Figure 5; Table I). This accounts for thecharacteristic tendency of slabs bounded by sheeting joints tobe thin relative to their in-plane extent.
If a planar fracture propagates under a sustained tensilestress, the mode I stress intensity factor will increase as thefracture grows (Equation (7)). Similarly, if both the mode I andmode II stress intensity factors increase as a slightly curved orkinked fracture grows, its effective mode I stress intensity factorwill increase (Cotterell and Rice, 1980). Provided the stressintensity factor (or effective stress intensity factor) remainsbelow a critical level (Lawn, 1993), the sheeting joint canpropagate in a stable, subcritical manner. We interpret thecracking noises at the Rhombus Wall as reflecting this type ofcrack growth. Once the stress intensity factor reaches a criticallevel, however, a fracture propagates spontaneously and theadjacent rock slab fails. We interpret the rather abrupt onsetof failure at the Rhombus Wall as reflecting critical crackgrowth immediately prior to and during failure.
Progressive nature of sheeting joint failures
The final point we address here is the progressive nature of theRhombus Wall rock falls. We recognize two key factors thatcan account for progressive failure of this type. First, severalof the Rhombus Wall failures occur where a sheeting jointintersects a pre-existing regional discontinuity, usually at a highangle (e.g., Figure 8). These intersections tend to form sharp to-pographic corners that are expected to have strong stress con-centrations (Muller and Martel, 2000; Barber, 2002). This canpromote the development of new sheeting joints. Second, our
Earth Surf. Process. Landforms (2011)
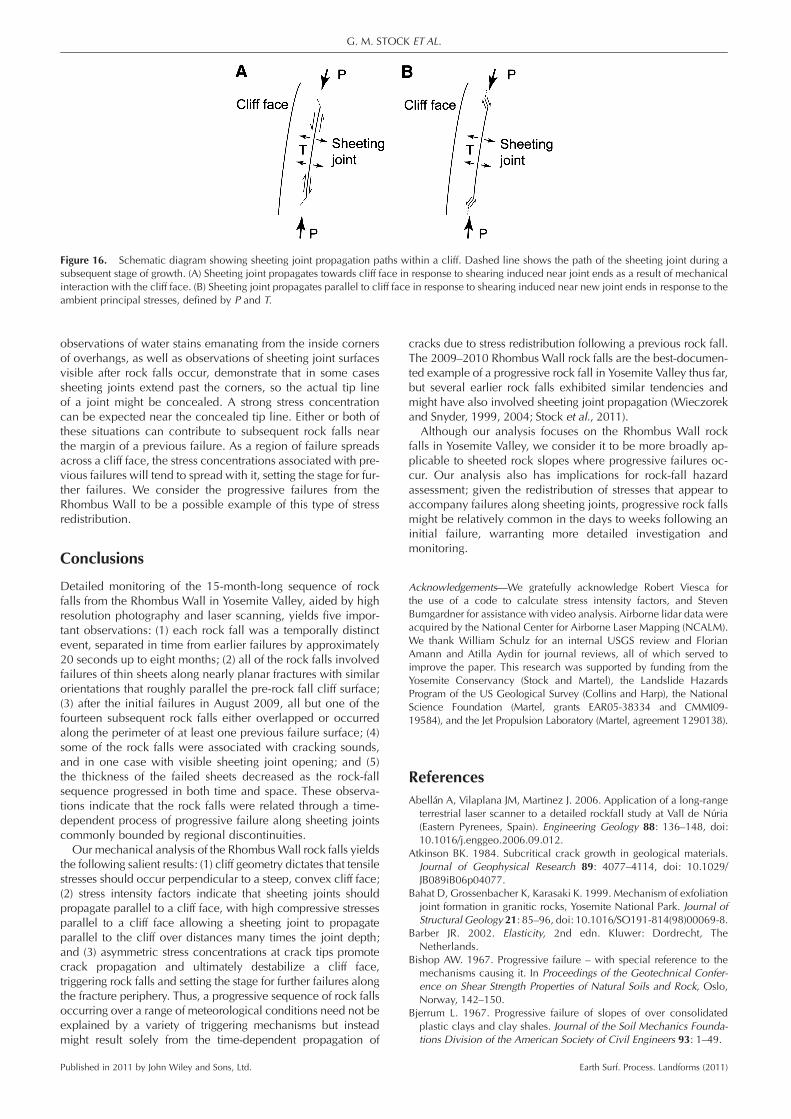
Figure 16. Schematic diagram showing sheeting joint propagation paths within a cliff. Dashed line shows the path of the sheeting joint during asubsequent stage of growth. (A) Sheeting joint propagates towards cliff face in response to shearing induced near joint ends as a result of mechanicalinteraction with the cliff face. (B) Sheeting joint propagates parallel to cliff face in response to shearing induced near new joint ends in response to theambient principal stresses, defined by P and T.
G. M. STOCK ET AL.
observations of water stains emanating from the inside cornersof overhangs, as well as observations of sheeting joint surfacesvisible after rock falls occur, demonstrate that in some casessheeting joints extend past the corners, so the actual tip lineof a joint might be concealed. A strong stress concentrationcan be expected near the concealed tip line. Either or both ofthese situations can contribute to subsequent rock falls nearthe margin of a previous failure. As a region of failure spreadsacross a cliff face, the stress concentrations associated with pre-vious failures will tend to spread with it, setting the stage for fur-ther failures. We consider the progressive failures from theRhombus Wall to be a possible example of this type of stressredistribution.
Conclusions
Detailed monitoring of the 15-month-long sequence of rockfalls from the Rhombus Wall in Yosemite Valley, aided by highresolution photography and laser scanning, yields five impor-tant observations: (1) each rock fall was a temporally distinctevent, separated in time from earlier failures by approximately20 seconds up to eight months; (2) all of the rock falls involvedfailures of thin sheets along nearly planar fractures with similarorientations that roughly parallel the pre-rock fall cliff surface;(3) after the initial failures in August 2009, all but one of thefourteen subsequent rock falls either overlapped or occurredalong the perimeter of at least one previous failure surface; (4)some of the rock falls were associated with cracking sounds,and in one case with visible sheeting joint opening; and (5)the thickness of the failed sheets decreased as the rock-fallsequence progressed in both time and space. These observa-tions indicate that the rock falls were related through a time-dependent process of progressive failure along sheeting jointscommonly bounded by regional discontinuities.Our mechanical analysis of the RhombusWall rock falls yields
the following salient results: (1) cliff geometry dictates that tensilestresses should occur perpendicular to a steep, convex cliff face;(2) stress intensity factors indicate that sheeting joints shouldpropagate parallel to a cliff face, with high compressive stressesparallel to a cliff face allowing a sheeting joint to propagateparallel to the cliff over distances many times the joint depth;and (3) asymmetric stress concentrations at crack tips promotecrack propagation and ultimately destabilize a cliff face,triggering rock falls and setting the stage for further failures alongthe fracture periphery. Thus, a progressive sequence of rock fallsoccurring over a range of meteorological conditions need not beexplained by a variety of triggering mechanisms but insteadmight result solely from the time-dependent propagation of
Published in 2011 by John Wiley and Sons, Ltd.
cracks due to stress redistribution following a previous rock fall.The 2009–2010 Rhombus Wall rock falls are the best-documen-ted example of a progressive rock fall in Yosemite Valley thus far,but several earlier rock falls exhibited similar tendencies andmight have also involved sheeting joint propagation (Wieczorekand Snyder, 1999, 2004; Stock et al., 2011).
Although our analysis focuses on the Rhombus Wall rockfalls in Yosemite Valley, we consider it to be more broadly ap-plicable to sheeted rock slopes where progressive failures oc-cur. Our analysis also has implications for rock-fall hazardassessment; given the redistribution of stresses that appear toaccompany failures along sheeting joints, progressive rock fallsmight be relatively common in the days to weeks following aninitial failure, warranting more detailed investigation andmonitoring.
Acknowledgements—We gratefully acknowledge Robert Viesca forthe use of a code to calculate stress intensity factors, and StevenBumgardner for assistance with video analysis. Airborne lidar data wereacquired by the National Center for Airborne Laser Mapping (NCALM).We thank William Schulz for an internal USGS review and FlorianAmann and Atilla Aydin for journal reviews, all of which served toimprove the paper. This research was supported by funding from theYosemite Conservancy (Stock and Martel), the Landslide HazardsProgram of the US Geological Survey (Collins and Harp), the NationalScience Foundation (Martel, grants EAR05-38334 and CMMI09-19584), and the Jet Propulsion Laboratory (Martel, agreement 1290138).
ReferencesAbellán A, Vilaplana JM, Martinez J. 2006. Application of a long-rangeterrestrial laser scanner to a detailed rockfall study at Vall de Núria(Eastern Pyrenees, Spain). Engineering Geology 88: 136–148, doi:10.1016/j.enggeo.2006.09.012.
Atkinson BK. 1984. Subcritical crack growth in geological materials.Journal of Geophysical Research 89: 4077–4114, doi: 10.1029/JB089iB06p04077.
Bahat D, Grossenbacher K, Karasaki K. 1999. Mechanism of exfoliationjoint formation in granitic rocks, Yosemite National Park. Journal ofStructural Geology 21: 85–96, doi: 10.1016/SO191-814(98)00069-8.
Barber JR. 2002. Elasticity, 2nd edn. Kluwer: Dordrecht, TheNetherlands.
Bishop AW. 1967. Progressive failure – with special reference to themechanisms causing it. In Proceedings of the Geotechnical Confer-ence on Shear Strength Properties of Natural Soils and Rock, Oslo,Norway, 142–150.
Bjerrum L. 1967. Progressive failure of slopes of over consolidatedplastic clays and clay shales. Journal of the Soil Mechanics Founda-tions Division of the American Society of Civil Engineers 93: 1–49.
Earth Surf. Process. Landforms (2011)
PROGRESSIVE FAILURE OF SHEETED ROCK SLOPES
Cadman J. 1970. The origin of exfoliation joints in granitic rocks.PhD dissertation, Department of Civil Engineering, University ofCalifornia, Berkeley.
Chau KT, Shao JF. 2006. Subcritical crack growth of edge and centercracks in façade rock panels subject to periodic surface temperaturevariations. International Journal of Solids and Structures 43: 807–827,doi: 10.1016/j.ijsolstr.2005.07.010.
Collins BD, Sitar N. 2005. Monitoring of coastal bluff stability usinghigh resolution 3D laser scanning. In Site Characterization and Mod-eling, Remote Sensing in Geotechnical Engineering, Rathje EM (ed.).ASCE Geo-Frontiers Special Publication 138.
Collins BD, Sitar N. 2008. Processes of coastal bluff erosion inweakly lithified sands, Pacifica, California, USA. Geomorphology97: 483–501, doi: 10.1016/j.geomorph.2007.09.004.
Cotterell B, Rice JR. 1980. Slightly curved or kinked cracks. Interna-tional Journal of Fracture 16: 155–169.
Dyskin AV, Germanovich LN, Ustinov KB. 2000. Asymptotic analysis ofcrack interaction with free boundary. International Journal of Solidsand Structures 37: 857–886, doi: 10.1016/S0020-7683(99)00063-3.
Eberhardt E, Stead D, Coggan JS. 2004. Numerical analysis of initiationand progressive failure in natural rock slopes – the 1991 Randa rock-slide. International Journal of Rock Mechanics and Mining Sciences41: 69–87, doi: 10.1016/S1365-1609(03)00076-5.
Einstein H, Veneziano D, Baecher G, O’Reilly K. 1983. Theeffect of discontinuity persistence on rock slope stability. Inter-national Journal of Rock Mechanics and Mining Sciences 20:227–236.
Erdogan F. 1971. Bonded dissimilar materials containing cracks parallelto the interface. Engineering Fracture Mechanics 3: 231–240, doi:10.1016/0013-7944(71)90034-8.
Gilbert GK. 1904. Domes and dome structures of the High Sierra.Bulletin of the Geological Society of America 15: 29–36.
Goodman RE, Kieffer DS. 2000. Behavior of rock in slopes. Journal ofGeotechnical and Geoenvironmental Engineering 126: 675–684.
Hickman SJ, Svitek J, Borchers J, Scholz E. 1993. In-situ stress measure-ments at Wawona, Yosemite National Park, California. Eos Transac-tions, American Geophysical Union 74: 581.
Holister GS. 1967. Experimental Stress Analysis – Principles andMethods. Cambridge University Press: Cambridge.
Holzhausen GR. 1989. Origin of sheet structure. 1. Morphology andboundary conditions. Engineering Geology 27: 225–278, doi:10.1016/0013-7952(89)90035-5.
Huber NK. 1987. The geologic story of Yosemite National Park. USGeological Survey Bulletin 1595.
Ishikawa M, Kurashige Y, Hirakawa K. 2004. Analysis of crack move-ments observed in an alpine bedrock cliff. Earth Surface Processesand Landforms 29: 883–891, doi: 10.1002/esp.1076.
Jaboyedoff M, Couture R, Locat P. 2009. Structural analysis ofTurtle Mountain (Alberta) using digital elevation model: towarda progressive failure. Geomorphology 103: 5–16, doi: 10.1016/j.geomorph.2008.04.012.
Jahns RH. 1943. Sheet structure in granites, its origin and use as ameasure of glacial erosion in New England. Journal of Geology51: 71–98.
Kemeny J. 2005. Time-dependent drift degradation due to the progres-sive failure of rock bridges along discontinuities. International Journalof Rock Mechanics and Mining Sciences 42: 35–46, doi: 10.1016/j.ijrmms.2004.07.001.
Kemeny J, Kim C. 2009. Increasing our understanding of time-dependent rock mass behavior with ground-based LiDAR, 3Ddiscontinuum modeling, and fracture mechanics. In Rock Me-chanics, Proceedings of the Second Thailand Symposium,Fuenkojam K, Phien-wej N (eds). Suranaree University of Tech-nology: Thailand, 35–53.
Kim C, Kemeny J. 2009. Progressive failure of a rock slope by the sub-critical crack growth of asperities along joints. Tunnel and Under-ground Space 19: 95–106.
Lawn B. 1993. Fracture of Brittle Solids, 2nd ed., Cambridge UniversityPress: Cambridge, U.K.
Maptek. 2011. I-Site Studio three-dimensional LiDAR processingsoftware, Version 3.2, http://www.maptek.com/products/i-site/i-site_studio.html (accessed 25 May 2011).
Published in 2011 by John Wiley and Sons, Ltd.
Martel SJ. 2000. Modeling elastic stresses in long ridges with thedisplacement discontinuity method. Pure and Applied Geophysics157: 1039–1057.
Martel SJ. 2006. Effect of topographic curvature on near-surface stressesand application to sheeting joints. Geophysical Research Letters 33:L01308, doi: 10.1029/2005GL024710.
Martel SJ. 2011. Mechanics of curved surfaces, with application tosurface-parallel cracks. Geophysical Research Letters 38:L20303, doi: 10.1029/2011GL049354.
Matasci B, Carrea D, Jaboyedoff M, Pedrazzini A, Stock GM, OppikoferT. 2011. Structural characterization of rockfall sources in YosemiteValley from remote sensing data and field surveys. Proceedingsof the 2011 Pan-Am Canadian Geological Survey GeotechnicalConference, Toronto, Ontario, Canada.
Matthes FE. 1930. Geologic history of the Yosemite Valley. US Geolog-ical Survey Professional Paper 160.
Muller JR, Martel SJ. 2000. Numerical models of translational land-slide rupture surface growth. Pure and Applied Geophysics 157:1009–1038, doi: 10.1007/s000240050015.
Nara Y, Morimoto K, Yoneta T, Hiroyoshi N, Kaneko K. 2010. Effects ofhumidity and temperature on subcritical crack growth in sandstone.International Journal of Solids and Structures 48: 1130–1140, doi:10.1016/j.ijsolstr.2010.12.019.
Nemat-Nasser S, Horii H. 1982. Compression-induced nonplanarcrack extension with application to splitting, exfoliation, and rock-burst. Journal of Geophysical Research 87: 6805–6821, doi:10.1029/JB087iB08p06805.
Olson J, Pollard DD. 1989. Inferring paleostresses from natural fracturepatterns: A new method. Geology 17: 345–348, doi: 10.1130/0091-7613(1989)017<0345:IPFNFP>2.3.CO;2.
Oppikofer T, Jaboyedoff M, Keusen HR. 2008. Collapse at the easternEiger flank in the Swiss Alps. Nature Geoscience 1: 33–37, doi:10.1038/ngeo258.
Petley DN, Higuchi T, Petley DJ, Bulmer MH, Carey J. 2005. Develop-ment of progressive landslide failure in cohesive materials. Geology33: 201–204, doi: 10.1130/G21147.1.
Pollard DD, Holzhausen G. 1979. On the mechanical interactionbetween a fluid-filled fracture and the earth’s surface. Tectono-physics 53: 27–57, doi: 10.1016/0040-1951(79)90353-6.
Pollard DD, Aydin A. 1984. Propagation and linkage of oceanic ridgesegments. Journal of Geophysical Research 89: 10,017–10,028, doi:10.1029/JB089iB12p10017.
Pollard DD, Segall P. 1987. Theoretical displacements and stresses nearfractures in rocks: with applications to faults, joints, veins, dikes, andsolution surfaces. In Fracture Mechanics of Rock, Atkinson BK (ed).Academic: San Diego; 277–349.
Rabatel A, Deline P, Jaillet S, Ravanel L. 2008. Rock falls in high-alpinerock walls quantified by terrestrial LiDAR measurements: a casestudy in the Mont Blanc area. Geophysical Research Letters 35:L10502, doi: 10.1029/2008GL033424.
Rosser NJ, Dunning SA, Lim M, Petley DN. 2005. Terrestrial laserscanning for quantitative rockfall hazard assessment. In LandslideRisk Management, Hungr O, Fell R, Couture R, Eberhardt E (eds).Balkema: Amsterdam.
Rosser, NJ, Lim M, Petley DN, Dunning SA, Allison RJ. 2007. Patterns ofprecursory rockfall prior to slope failure. Journal of GeophysicalResearch: Earth Surface 112: F04014, doi: 10.1029/2006JF000642.
Sanderson F, Bakkehoi S, Hestnes E, Lied K. 1996. The influence ofmeteorological factors on the initiation of debris flows, rockfalls,rockslides, and rockmass stability. In Landslides, Senneset K(ed). Balkema: Rotterdam.
Stein RS, Barka AA, Dieterich JH. 1997. Progressive failure on theNorth Anatolian fault since 1939 by earthquake stress triggering.Geophysical Journal International 128: 594–604, doi: 10.1111/j.1365-246X.1997.tb05321.x.
Stock GM, Bawden GW, Green JK, Hanson E, Downing G, Collins BD,Bond S, Leslar M. 2011. High-resolution three-dimensional imagingand analysis of rock falls in Yosemite Valley, California. Geosphere7: 573–581, doi: 10.1130/GES00617.1
Terzaghi K. 1950. Mechanism of landslides. In Application of Geol-ogy to Engineering Practice. Geological Society of AmericaSpecial Publication, Berkey Volume; 83–123.
Earth Surf. Process. Landforms (2011)

G. M. STOCK ET AL.
Terzaghi K. 1962. Stability of steep slopes on hard unweathered rock.Geotechnique 12: 251–263.
Timoshenko SP, Goodier JN. 1970. Theory of Elasticity. McGraw-Hill:New York.
Vargas Jr EA, Chavez E, Gusmão L, Amaral C. 2009. Is thermal fatigue apossible mechanism for failures of some rock slopes in Rio deJaneiro, Brazil? American Rock Mechanics Association, 43rd USRock Mechanics Symposium, Asheville, North Carolina, 09–126.
Wieczorek GF, Jäger S. 1996. Triggering mechanisms and depositionalrates of postglacial slope movement processes in the Yosemite Valley,California. Geomorphology 5: 17–31, doi: 10.1016/0169-555X(95)0012-I.
Wieczorek GF, Snyder JB. 1999. Rock falls from Glacier Point aboveCamp Curry, Yosemite National Park, California. U. S. Geological
Published in 2011 by John Wiley and Sons, Ltd.
Survey Open-File Report 99–385, http://pubs.usgs.gov/of/1999/ofr-99-0385/pdf.
Wieczorek GF, Snyder JB. 2004. Historical rock falls in YosemiteNational Park, California. U.S. Geological Survey Open-File Report03–491, http://pubs.usgs.gov/of/2003/ofr-03-491.pdf.
Wieczorek GF, Stock GM, Reichenbach P, Snyder JB, Borchers JW,Godt JW. 2008. Investigation and hazard assessment of the 2003and 2007 Staircase Falls rock falls, Yosemite National Park,California, USA. Natural Hazards and Earth System Sciences 8:421–432, www.nat-hazards-earth-syst-sci.net/8/421/2008/.
Zimmer V, Collins BD, Stock GM, Sitar N. 2012. Rock fall dynamicsand deposition: An integrated analysis of the 2009 Ahwiyah Pointrock fall, Yosemite National Park, USA. Earth Surface Processes andLandforms (in press).
Earth Surf. Process. Landforms (2011)


![Tribal [Progressive Rock Band Music] · Comment: Progressive Rock Band Music dedicated to my son Isaac Esteban Peretz on free- sc or es .com listen to the audio share your interpretation](https://static.fdocuments.in/doc/165x107/605bcacce3924c37482d09ee/tribal-progressive-rock-band-music-comment-progressive-rock-band-music-dedicated.jpg)