Progressive Damage and Failure Prediction of Open Hole ...
18
Progressive Damage and Failure Prediction of Open Hole Tension and Open Hole Compression Specimens Ashith P. K. Joseph * and Anthony M. Waas † University of Michigan, Ann Arbor, MI, 48109, USA. Wooseok Ji ‡ Ulsan National Institute of Science and Technology, Ulsan, S. Korea Evan J. Pineda § NASA Glenn Research Center, Cleveland, OH, 44113 Salvatore Liguore ¶ and Steven Wanthal k Boeing Research & Technology, St. Louis, MO, 63166, USA. ** Progressive damage and failure in open hole composite laminate coupons under tensile and compressive loading conditions is modeled using Enhanced Schapery Theory (EST). The input parameters required for EST are obtained using standard coupon level test data and are interpreted in conjunction with finite element (FE) based simulations. The ca- pability of EST to perform the open hole strength prediction accurately is demonstrated using three different layups of IM7/8552 carbon fiber composite. A homogenized approach uses a single composite shell element to represent the entire laminate in the thickness di- rection and this requires the fiber direction fracture toughness to be modeled as a laminate property. The results obtained using the EST method agree quite well with experimental results. I. Introduction The deformation response of laminated fiber reinforced composite panels with open holes can be used to assess modeling tools used in structural integrity and damage tolerance (SIDT) studies. Davidson et al 1 presented a unified model for the open hole tension (OHT) and open hole compression (OHC) strength predictions using Enhanced Schapery Theory 2 (EST). The EST model is used in the present study to deter- mine the damage and failure evolution in open hole compression and tension specimens made of IM7/8552 material. EST is proven to be an effective way of modeling the in-plane micro damage and failure evolution in composite laminates. Ability of this model to predict the strength of coupons with holes and notches under remote uniaxial loading conditions has been reported in the literature. 2, 1 In EST, the pre-peak non-linearity caused by micro damage in plies is modeled using polynomial functions which represent how the shear and transverse lamina moduli get affected by the development of micro damage in the polymer matrix. Upon reaching a critical limit in micro damage accumulation, the subsequent failure which is represented as a * Graduate Student Research Assistant, Department of Aerospace Engineering, 2036 FXB † Felix Pawlowski Collegiate Professor, Department of Aerospace Engineering, 3044 FXB, AIAA Fellow. ‡ Assistant Professor, School of Mechanical and Nuclear Engineering, 301-3 1st Engr. Bldg., AIAA Member § Aerospace Research Engineer, Mechanics and Life Prediction Branch, 21000 Brookpark Rd., MS 49-7, AIAA Member ¶ Technology Manager, Structures Technology, St. Louis, MO k Technical Fellow, Boeing R & T, St. Louis, MO. ** Copyright c 2015, by Ashith Joseph, Anthony M. Waas, Wooseok Ji, Evan Pineda, Salvatore Liguore and Steven Wanthal. Published by the American Institute of Aeronautics and Astronautics, Inc., with permission. 1 of 18 American Institute of Aeronautics and Astronautics Downloaded by University of Michigan - Duderstadt Center on December 14, 2017 | http://arc.aiaa.org | DOI: 10.2514/6.2015-0466 56th AIAA/ASCE/AHS/ASC Structures, Structural Dynamics, and Materials Conference 5-9 January 2015, Kissimmee, Florida 10.2514/6.2015-0466 Copyright © 2015 by Copyright © 2015 by Ashith Joseph, Anthony M. Waas, Wooseok Ji, Evan Pineda, Salvatore Liguore and Steven Wanthal. Published by the American Institute of Aeronautics and Astronautics, Inc., with permission.. Published by the American Institute of Aeronautic AIAA SciTech Forum
Transcript of Progressive Damage and Failure Prediction of Open Hole ...

Progressive Damage and Failure Prediction of Open
Hole Tension and Open Hole Compression Specimens
Ashith P. K. Joseph∗ and Anthony M. Waas†
University of Michigan, Ann Arbor, MI, 48109, USA.
Wooseok Ji‡
Ulsan National Institute of Science and Technology, Ulsan, S. Korea
Evan J. Pineda§
NASA Glenn Research Center, Cleveland, OH, 44113
Salvatore Liguore¶ and Steven Wanthal‖
Boeing Research & Technology, St. Louis, MO, 63166, USA. ∗∗
Progressive damage and failure in open hole composite laminate coupons under tensileand compressive loading conditions is modeled using Enhanced Schapery Theory (EST).The input parameters required for EST are obtained using standard coupon level test dataand are interpreted in conjunction with finite element (FE) based simulations. The ca-pability of EST to perform the open hole strength prediction accurately is demonstratedusing three different layups of IM7/8552 carbon fiber composite. A homogenized approachuses a single composite shell element to represent the entire laminate in the thickness di-rection and this requires the fiber direction fracture toughness to be modeled as a laminateproperty. The results obtained using the EST method agree quite well with experimentalresults.
I. Introduction
The deformation response of laminated fiber reinforced composite panels with open holes can be usedto assess modeling tools used in structural integrity and damage tolerance (SIDT) studies. Davidson etal1 presented a unified model for the open hole tension (OHT) and open hole compression (OHC) strengthpredictions using Enhanced Schapery Theory2 (EST). The EST model is used in the present study to deter-mine the damage and failure evolution in open hole compression and tension specimens made of IM7/8552material.
EST is proven to be an effective way of modeling the in-plane micro damage and failure evolution incomposite laminates. Ability of this model to predict the strength of coupons with holes and notches underremote uniaxial loading conditions has been reported in the literature.2,1 In EST, the pre-peak non-linearitycaused by micro damage in plies is modeled using polynomial functions which represent how the shear andtransverse lamina moduli get affected by the development of micro damage in the polymer matrix. Uponreaching a critical limit in micro damage accumulation, the subsequent failure which is represented as a
∗Graduate Student Research Assistant, Department of Aerospace Engineering, 2036 FXB†Felix Pawlowski Collegiate Professor, Department of Aerospace Engineering, 3044 FXB, AIAA Fellow.‡Assistant Professor, School of Mechanical and Nuclear Engineering, 301-3 1st Engr. Bldg., AIAA Member§Aerospace Research Engineer, Mechanics and Life Prediction Branch, 21000 Brookpark Rd., MS 49-7, AIAA Member¶Technology Manager, Structures Technology, St. Louis, MO‖Technical Fellow, Boeing R & T, St. Louis, MO.∗∗Copyright c©2015, by Ashith Joseph, Anthony M. Waas, Wooseok Ji, Evan Pineda, Salvatore Liguore and Steven Wanthal.
Published by the American Institute of Aeronautics and Astronautics, Inc., with permission.
1 of 18
American Institute of Aeronautics and Astronautics
Dow
nloa
ded
by U
nive
rsity
of
Mic
higa
n -
Dud
erst
adt C
ente
r on
Dec
embe
r 14
, 201
7 | h
ttp://
arc.
aiaa
.org
| D
OI:
10.
2514
/6.2
015-
0466
56th AIAA/ASCE/AHS/ASC Structures, Structural Dynamics, and Materials Conference
5-9 January 2015, Kissimmee, Florida
10.2514/6.2015-0466
Copyright © 2015 by Copyright © 2015 by Ashith Joseph, Anthony M.
Waas, Wooseok Ji, Evan Pineda, Salvatore Liguore and Steven Wanthal. Published by the American Institute of Aeronautics and Astronautics, Inc., with permission.. Published by the American Institute of Aeronautics and Astronautics, Inc., with permission.
AIAA SciTech Forum

negative tangent to the slope of the stress-strain response (post peak region) is modeled using crack bandtheory.3 Details of the EST formulation can be found in Pineda and Waas, 2013.2
In this study, the composite laminate is modeled using shell elements and this ensures computationalefficiency of the model. Previous studies with EST have considered fiber direction fracture toughness asa material property even when all the layers are modeled using a single shell element. In the presentapproach this property is calculated as a function of the composite layup according to an approach suggestedby Camanho and Catalanotti.4 EST predictions are compared against open hole tension and open holecompression test data as well as with the test results published in NIAR test report5 for three differentlayups of IM7/8552 material.
II. Finite Element Modeling
Standard dimensions as per ASTM-D5766 is used for the finite element modeling of the open hole speci-mens. Dimensions and boundary conditions used for modeling are shown in figure 1. Out of plane degrees offreedom of all the nodes are restricted and the boundary conditions are applied on the left and right edgesof the model. Nodes on the left edge are prevented from in-plane rotation and movement in x-direction,while prescribed displacement values in the x-direction and fixed in-plane rotation conditions are appliedto the nodes on the right edge. EST is implemented as a user material subroutine (VUMAT) within theAbaqus/explicit solver and the in-plane failure of the laminate is modeled using 4-noded reduced integrationshell elements (S4R). The same model is used for the open hole compression simulation with the remoteloading direction being reversed. The failure/fracture properties used are dependent on the local stress state(tension vs. compression) and this aspect is incorporated in EST. Mesh sizes were determined based ona convergence study of the stress field near the hole and also by considering the element size restrictionsimposed by the crack band model.
Three different layups are considered for this study and the layups are listed in table 1. Differences inthe layer interfaces and the directional stiffness of the layups allows to test the applicability of the ESTmodel and also understand it’s limitations. The exact same mesh and modeling approach is used for allthree layups and it was also found in the study that depending on the layup mesh refinement requirementscould be different. The mesh chosen here gives a converged gradient stress field near the hole for all threelayups.
II.A. Input Parameters
All input parameters required for EST are obtained using coupon level tests and in some cases, using inversecalculations using FE models of the coupon tests. Schapery microdamage functions are crucial for accuratemodeling of pre-peak matrix non-linearity and these functions control the change in transverse and shearmoduli as function of the micro cracks in the matrix.6,7 ±45 tension tests are used to characterize the elasticdamage response of the matrix according to the procedure give in Ng et al.8 While shear microdamagefunction is determined directly from the test data, tranverse microdamage function is calculated using avirtual test of the RUC with the matrix equivalent stress strain response backed out from the ±45 testdata as an input.8 Microdamage functions are expressed as fifth order polynomials and table2 shows thecoefficients of the polynomials calculated using the above mentioned method. Micro damage functions incompression are assumed to be same as that in tension for the analyses presented here.
Table3 summarizes the lamina strength and fracture input parameters used in the model. Virtual testingis used for calculating fiber direction compressive strength (due to kinking). Fiber misalignment angle of 1.2,which is the typical value found in industrial composites,9 is used in the compressive strength calculation doneusing micromechanics. Details of such a calculation are outlined in Davidson et al.1 Different longitudinalstuffness (E11) values are used in tension and compression as observed in the experiments and also reportedin the literature.5
One of the critical factors in modeling the progressive failure using a crack band approach is estimatingthe correct fracture toughness values as they control the post peak softening behavior and hence the failureevolution. Fiber direction fracture toughness of the 0 layer can be obtained using a single edge notch tension(SENT) test/simulation, of the [90/0]s specimen as reported in Boyd et al.10 This value is then scaled fordifferent layups as discussed in the following section, using the approach suggested by.4 For compressiveloading, fiber direction overstress fracture toughness is not known and it is assumed to be about 25% of
2 of 18
American Institute of Aeronautics and Astronautics
Dow
nloa
ded
by U
nive
rsity
of
Mic
higa
n -
Dud
erst
adt C
ente
r on
Dec
embe
r 14
, 201
7 | h
ttp://
arc.
aiaa
.org
| D
OI:
10.
2514
/6.2
015-
0466
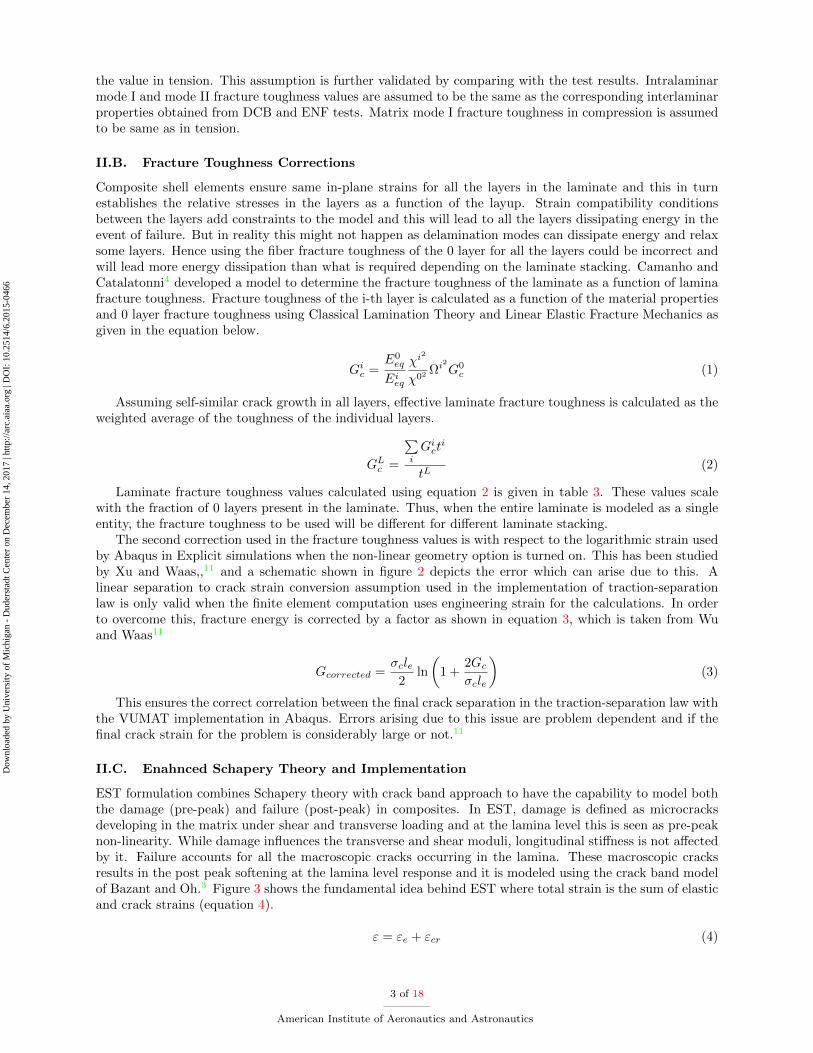
the value in tension. This assumption is further validated by comparing with the test results. Intralaminarmode I and mode II fracture toughness values are assumed to be the same as the corresponding interlaminarproperties obtained from DCB and ENF tests. Matrix mode I fracture toughness in compression is assumedto be same as in tension.
II.B. Fracture Toughness Corrections
Composite shell elements ensure same in-plane strains for all the layers in the laminate and this in turnestablishes the relative stresses in the layers as a function of the layup. Strain compatibility conditionsbetween the layers add constraints to the model and this will lead to all the layers dissipating energy in theevent of failure. But in reality this might not happen as delamination modes can dissipate energy and relaxsome layers. Hence using the fiber fracture toughness of the 0 layer for all the layers could be incorrect andwill lead more energy dissipation than what is required depending on the laminate stacking. Camanho andCatalatonni4 developed a model to determine the fracture toughness of the laminate as a function of laminafracture toughness. Fracture toughness of the i-th layer is calculated as a function of the material propertiesand 0 layer fracture toughness using Classical Lamination Theory and Linear Elastic Fracture Mechanics asgiven in the equation below.
Gic =
E0eq
Eieq
χi2
χ02Ωi2G0
c (1)
Assuming self-similar crack growth in all layers, effective laminate fracture toughness is calculated as theweighted average of the toughness of the individual layers.
GLc =
∑i
Gict
i
tL(2)
Laminate fracture toughness values calculated using equation 2 is given in table 3. These values scalewith the fraction of 0 layers present in the laminate. Thus, when the entire laminate is modeled as a singleentity, the fracture toughness to be used will be different for different laminate stacking.
The second correction used in the fracture toughness values is with respect to the logarithmic strain usedby Abaqus in Explicit simulations when the non-linear geometry option is turned on. This has been studiedby Xu and Waas,,11 and a schematic shown in figure 2 depicts the error which can arise due to this. Alinear separation to crack strain conversion assumption used in the implementation of traction-separationlaw is only valid when the finite element computation uses engineering strain for the calculations. In orderto overcome this, fracture energy is corrected by a factor as shown in equation 3, which is taken from Wuand Waas11
Gcorrected =σcle
2ln
(1 +
2Gc
σcle
)(3)
This ensures the correct correlation between the final crack separation in the traction-separation law withthe VUMAT implementation in Abaqus. Errors arising due to this issue are problem dependent and if thefinal crack strain for the problem is considerably large or not.11
II.C. Enahnced Schapery Theory and Implementation
EST formulation combines Schapery theory with crack band approach to have the capability to model boththe damage (pre-peak) and failure (post-peak) in composites. In EST, damage is defined as microcracksdeveloping in the matrix under shear and transverse loading and at the lamina level this is seen as pre-peaknon-linearity. While damage influences the transverse and shear moduli, longitudinal stiffness is not affectedby it. Failure accounts for all the macroscopic cracks occurring in the lamina. These macroscopic cracksresults in the post peak softening at the lamina level response and it is modeled using the crack band modelof Bazant and Oh.3 Figure 3 shows the fundamental idea behind EST where total strain is the sum of elasticand crack strains (equation 4).
ε = εe + εcr (4)
3 of 18
American Institute of Aeronautics and Astronautics
Dow
nloa
ded
by U
nive
rsity
of
Mic
higa
n -
Dud
erst
adt C
ente
r on
Dec
embe
r 14
, 201
7 | h
ttp://
arc.
aiaa
.org
| D
OI:
10.
2514
/6.2
015-
0466

The area indicated by S in the figure accounts for the energy dissipated due to microdamage evolution.Gc/le term shows the energy dissipated in the case of failure, where Gc is the fracture toughness of thematerial and le is the element characteristic length used in the finite element implementation. The EST for-mulation developed by Pineda and Waas2 is used here and this accounts for three major failure mechanisms:matrix mode I cracking, matrix mode II cracking and axial fiber failure (mode I). Therefore the total workpotential of the model can be expressed as a sum of the elastic strain energy, microdamage potential S andthe failure potentials denoted by Sm
I , SmII and Sf
I . Using CLT this total work potential can be written as,
W =1
2(E11ε
211 + E22(S)ε222 +G12(S)γ212) +Q12ε11ε22 + Sm
I + SmII + Sf
I (5)
According to the assumption of Schapery theory, E22 and G12, are functions of Schapery microdamgepotential, S. Their evolution is shown in the equation 6, where es and gs are the functions measured usingthe approach discussed earlier, in the input parameters section.
E22 = E220es(S)
G12 = G120gs(S)(6)
Total energy of the system should be constant with respect to the damage/failure potentials. Thisprinciple is used for obtaining the microdamage evolution equation in terms of Sr=S(1/3) as shown inequation 7.
ε222E220desdSr
+ γ212G120dgsdSr
= −6S2r (7)
EST assumes that the damage mechanism won’t be active until a transition from damage to failure iseffected. The Hashin-Rotem failure criteria are used for determining the failure initiation point. Fiber failurecriteria is considered to be independent of the matrix failure criteria and it is give by equation 8, while thematrix mode I and mode II failure are connected and the mixed mode failure criteria for the matrix is givenby, 9.
(ε11XT
)2
= 1, ε11 ≥ 0(ε11XC
)2
= 1, ε11 < 0
(8)
(ε22YT
)2
+(γ12Z
)2= 1, ε22 ≥ 0(
ε22YC
)2
+(γ12Z
)2= 1, ε22 < 0
(9)
When a failure criterion is met, degraded secant stiffness can be computed according to equation 10.These equations can be derived with the help of figure 3. Mesh objectivity of the model is obtained bysmearing the crack energy over the element dimension le, perpendicular to the crack direction.
E11 = E110XT (ε11F − ε11)
ε11(ε11F −XT ), ε11F =
2GfIC
E110XT
E22 = E∗22
YT (ε22F − ε22)
ε11(ε22F − YT ), ε11F =
2GmIC
E∗22YT
G12 = G∗12
Z(γ12F − γ12)
γ12(γ12F − Z), γ12F =
2GmIIC
G∗12Z
(10)
Larger element characteristic length le can cause the area under the stress strain curve to decrease andcan cause a vertical stress drop at a critical value. An element of length larger than this critical value will
4 of 18
American Institute of Aeronautics and Astronautics
Dow
nloa
ded
by U
nive
rsity
of
Mic
higa
n -
Dud
erst
adt C
ente
r on
Dec
embe
r 14
, 201
7 | h
ttp://
arc.
aiaa
.org
| D
OI:
10.
2514
/6.2
015-
0466

lead to physically incorrect snap-back behavior. The critical element length to prevent this condition is givenby,
le < min
2Gf
IC
E110X2T
,2Gm
IC
E∗22Y
2T
,2Gm
IIC
G∗12Z
2
(11)
Mesh size should be carefully chosen when working with crack band model so that the issues related tonegative post-peak slope can be avoided. In this study mesh size was chosen such that it is one order ofmagnitude less than the crack band element characteristic length given in equation 11.
III. Results and Discussion
All the open hole tension and compression tests were carried out as per ASTM standards D5766 andD6484 respectively. Extensometer of 2” gage length was used for measuring the displacements at pointslocated 1” away from the hole on each side in the loading direction. Displacements are measured from thefinite element models at the locations corresponding to extensometer heads to compare the load-displacementresponse with the test data for all the cases. Progression of failure events are also listed along with the load-displacement plots. Sequence of failure initiations are the same between the layups, but the extensometerdisplacements corresponding to these events are different between laminates as it depends on the stressdistribution near the hole. As we go from stiffer to softer laminates, 0 layer fiber failure initiation occursat higher displacement value. This has to be expected since the softer laminate will have a smaller stressconcentration near the hole. For an open hole coupon under tensile loading, transverse failure initiation in90 layer is the first failure event in all the laminates and this degrades the transverse stiffness in that layerwhich in turn increases the stresses in the 45 and 0 layers. Increased stress in the 45 layer forces it to havea transverse/shear failure initiation and this leads to a fiber failure initiation in the 0 layer. This sequenceof events lead to the final complete failure of the 0 layer in fiber direction and two-piece failure ensues.
Load-displacement comparison for the stiff 50/40/10 laminate is shown in figure 4. Strength predictedby EST is within the error bounds of the experiment, however there is a mismatch in the slope of the curve.Experimental data shows a small stiffening behavior while EST shows some non-linear softening behaviordue to the matrix microdamage evolution and also due to the progressive failure in 90 and 45 layers. Thestiffening effect seen in the experiment can be attributed to the elastic stiffening of the carbon fibers reportedin the literature,7 while the EST model does not account for this behavior of the fibers. However this effectis not very significant and is not observed in open hole testing of the other layups. Final failure patterns inall the layers of the laminate are compared with the actual failed specimen in figure 5. Within the limitationof a shell theory, EST is able to capture the failure patterns quite accurately.
The peak load predicted by EST for the medium stiff 25/50/25 laminate is about 11% higher than thetest results (figure6). Compared to the other 2 layups, this layup has the most number of 45/90 interfacesand hence this is more prone to delamination because of the earlier in-plane failure initiation in 90 and45 layers. Hence allowing delamination mode of failure is critical in getting an accurate prediction for thislayup. In order for the EST simulation to match with the test result, fiber direction fracture toughness canbe further reduced which is an indirect way of accounting for the energy loss due to delamination. Finalfailure pattern for this layup is also compared with the test specimen in figure 7.
For the soft 10/80/10 laminate, EST under-predicts the peak load as shown in figure 8. +45/-45 interfacespresent in this particular layup differentiates it from the other layups. +45/-45 interface offers more resistancetowards delamination than all the other interfaces present. In order to account for this extra resistance, fiberdirection fracture toughness can be increased so that EST prediction matches with the test data. Increasingthe fiber direction fracture toughness from 8.6N/mm to 12.0N/mm makes the prediction close to the testresult. Final failure pattern shown in figure 9 agrees very well with the failure of the actual test specimen.
The sequence of failure events are seen to change when the remote loading changes from tension tocompression. Since the transverse failure strain in compression is fairly large, fiber failure initiation becomesthe first failure event which is shortly followed by the transverse/shear failure initiation in the 45 layer.Final catastrophic failure occurs due to the complete fiber failure in the 0 layer under compression. Paststudies have shown the micromechanics of open hole failure in compression, captured through a global-localapproach, sometimes referred to in the literature as an embedded element method. Fiber kink banding isdominant and this is accurately captured in the open hole models by Ahn and Waas12 and also by Davidsonet al.1
5 of 18
American Institute of Aeronautics and Astronautics
Dow
nloa
ded
by U
nive
rsity
of
Mic
higa
n -
Dud
erst
adt C
ente
r on
Dec
embe
r 14
, 201
7 | h
ttp://
arc.
aiaa
.org
| D
OI:
10.
2514
/6.2
015-
0466

In the present studies, the kink banding toughness is modeled as the overstress fiber direction toughnessin compression. The open hole compression strength prediction for the 50/40/10 laminate agrees well withthe test results as shown in figure 11. The trend for compressive strength predictions are similar to thetensile cases. Compressive strength of the 25/50/25 is over-predicted (figure 12) similar to it’s tensilecounterpart. For the softer 10/80/10 laminate, EST under-predicts the strength as shown in figure 14. Finalpattern comparisons for the 50/40/10, 25/50/25 and 10/80/10 laminates are shown in figures 11, 13 and15, respectively. Load-displacement curves for all the open hole compression cases show a significant non-linear behavior, while the EST model shows mild nonlinearity. This difference can be due to the difference inmatrix non-linearity between tensile and compressive loading cases. In this study matrix non-linear behavioris assumed be the same in both tension and compression. Figures 16 and 17, and table 4 summarizes resultsof the open hole strength predictions for all the laminates.
IV. Conclusion
Enahnced Schapery Theory (EST) is a computationally efficient effective model for capturing the in-planefailure in a composite laminate with stress concentrations due to holes/notches. All the layers in a compositelaminate can be modeled using a single shell element in this approach which reduces the computational timeby a large margin. Capability of the EST model to predict the open hole strength from coupon level test datais demonstrated for the three different layups of IM7/8552 material. Another advantage of EST is the unifiedmodeling approach for both tension and compression. Within the limitations of a shell model, agreement ofthe predictions with the test results is excellent. The difficulties and limitation of using a shell model forfailure analysis are also addressed here. When delamination becomes a key failure mechanism, error in thepredictions can be high. In those instances, this can be overcome to a certain extent by scaling the fiberdirection fracture toughness as a laminate property as demonstrated here. A more physically reasonableapproach would be introducing cohesive elements between the EST shell layers at the critical interfaces toaccount for the delamination. This approach will be computationally more expensive than the single shellEST approach, but still much faster than modeling with 3D elements. This modeling strategy is currentlybeing investigated.
V. Acknowledgments
The authors are grateful for sponsorship from the Boeing company. Useful discussions with Steve Precup,Mostafa Rassaian and Gerry Mabson are gratefully acknowledged.
References
1Davidson, P., Pineda, E. J., Heinrich, C., and Waas, A. M., “A unified model for predicting the open hole tensile andcompressive strengths of composite laminates for aerospace applications,” AIAA/ASME/ASCE/AHS/ASC 54th Structures,Structural Dynamics, and Materials Conference, Boston, MA, 2013.
2Pineda, E. J. and Waas, A. M., “Numerical implementation of a multiple-ISV thermodynamically-based work potentialtheory for modeling progressive damage and failure in fiber-reinforced laminates,” International Journal of Fracture, Vol. 182,No. 1, 2013, pp. 93–122.
3Bazant, Z. P. and Oh, B. H., “Crack band theory for fracture of concrete,” Materiaux et constructions, Vol. 16, No. 93,pp. 155–177.
4Camanho, P. P. and Catalanotti, G., “On the relation between the mode I fracture toughness of a compoiste laminate andthat of a 0 py; Analytical model and Experimental Validation,” Engineering Fracture Mechanics, Vol. 78, 2011, pp. 2535–2546.
5Marlette, K., “Hexcel 8552 IM7 Unidrectional Prepreg 190 gsm & 35Qualification Material Poperty Data Report,” Ncamptest report cam-rp-2009-015 rev a, NIAR, Wichita State university, 2011.
6Schapery, R. A., “A theory of mechanical behavior of elastic media with growing damage and other changes in structure,”Journal of Mechanics and Physics of Solids, Vol. 38, No. 2, 1990, pp. 215–153.
7Sicking, D. L., Mechanical characterization of nonlinear laminated composites with transverse crack growth, Ph.D. thesis,Texas A&M University, College Station, Texas, 1992.
8Ng, W. H., Salvi, A. G., and Waas, A. M., “Characterization of the in-situ non-linear shear response of laminatedfiber-reinforced composites,” Composites Science and Technology, Vol. 70, 2010, pp. 1126–1134.
9Sutcliffe, M. P. F., Lemanski, S. L., and Scott, A. E., “Measurement of fiber waviness in industrial composite components,”Composites Science and Technology, Vol. 72.
10Boyd, S., Ji, W., Joseph, A. P. K., and Waas, A. M., “Single edge notch tension test on cross-ply laminated compositesfor intralaminar fracture properties,” 55th AIAA/ASME/ASCE/AHS/SC Structures, Structural Dynamics, and MaterialsConference, National Harbor, Maryland, 2014.
6 of 18
American Institute of Aeronautics and Astronautics
Dow
nloa
ded
by U
nive
rsity
of
Mic
higa
n -
Dud
erst
adt C
ente
r on
Dec
embe
r 14
, 201
7 | h
ttp://
arc.
aiaa
.org
| D
OI:
10.
2514
/6.2
015-
0466

11Xu, W. and Waas, A. M., “On the crack band model and its practical implementation in commercial finite elementcodes,” Engineering Fracture Mechanics (to be published), 2014.
12Ahn, J. H. and Waas, A. M., “Prediction of compressive failure in laminated composites at room and elevated tempera-ture,” AIAA Journal , Vol. 40, No. 2, 2002, pp. 346–358.
Figure 1. Finite element model
Table 1. List of laminates studied
7 of 18
American Institute of Aeronautics and Astronautics
Dow
nloa
ded
by U
nive
rsity
of
Mic
higa
n -
Dud
erst
adt C
ente
r on
Dec
embe
r 14
, 201
7 | h
ttp://
arc.
aiaa
.org
| D
OI:
10.
2514
/6.2
015-
0466

Table 2. Schapery microdamage functions
8 of 18
American Institute of Aeronautics and Astronautics
Dow
nloa
ded
by U
nive
rsity
of
Mic
higa
n -
Dud
erst
adt C
ente
r on
Dec
embe
r 14
, 201
7 | h
ttp://
arc.
aiaa
.org
| D
OI:
10.
2514
/6.2
015-
0466
Table 3. Material properties for EST
9 of 18
American Institute of Aeronautics and Astronautics
Dow
nloa
ded
by U
nive
rsity
of
Mic
higa
n -
Dud
erst
adt C
ente
r on
Dec
embe
r 14
, 201
7 | h
ttp://
arc.
aiaa
.org
| D
OI:
10.
2514
/6.2
015-
0466

Figure 2. Fracture toughness correction for logarithmic strain
Figure 3. Stress-strain response of EST element
Table 4. Open hole tension/compression results summary
10 of 18
American Institute of Aeronautics and Astronautics
Dow
nloa
ded
by U
nive
rsity
of
Mic
higa
n -
Dud
erst
adt C
ente
r on
Dec
embe
r 14
, 201
7 | h
ttp://
arc.
aiaa
.org
| D
OI:
10.
2514
/6.2
015-
0466
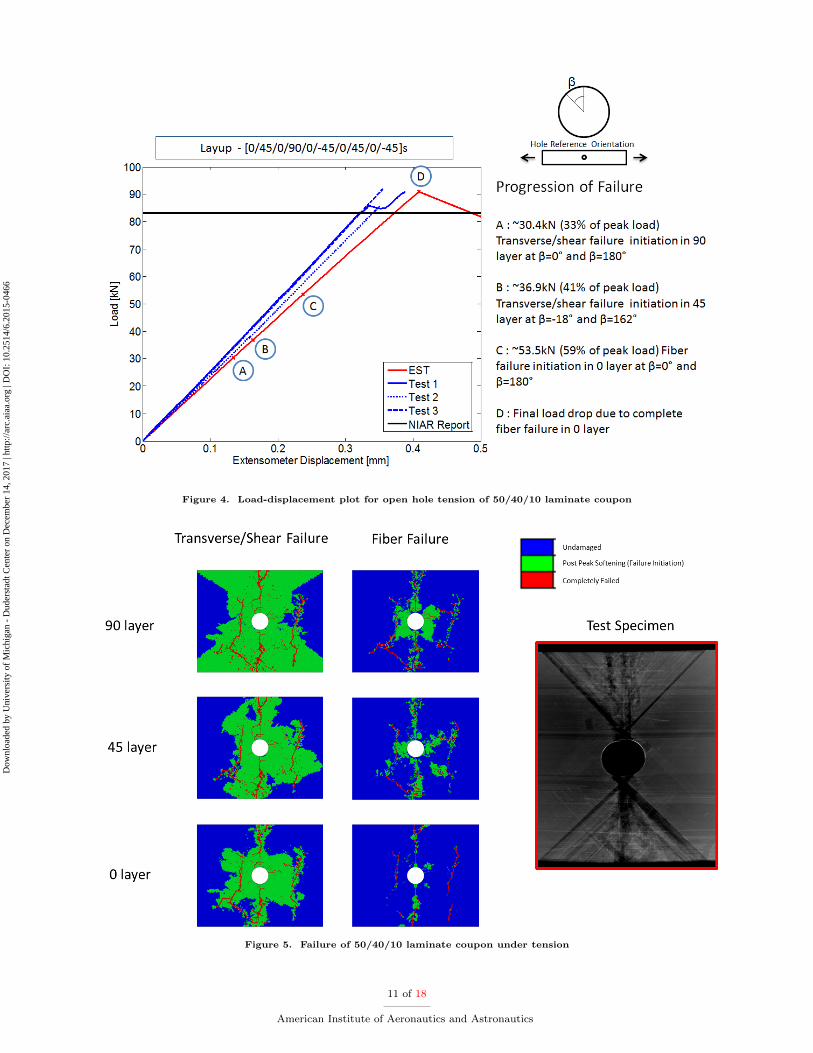
Figure 4. Load-displacement plot for open hole tension of 50/40/10 laminate coupon
Figure 5. Failure of 50/40/10 laminate coupon under tension
11 of 18
American Institute of Aeronautics and Astronautics
Dow
nloa
ded
by U
nive
rsity
of
Mic
higa
n -
Dud
erst
adt C
ente
r on
Dec
embe
r 14
, 201
7 | h
ttp://
arc.
aiaa
.org
| D
OI:
10.
2514
/6.2
015-
0466

Figure 6. Load-displacement plot for open hole tension of 25/50/25 laminate coupon
Figure 7. Failure of 25/50/25 laminate coupon under tension
12 of 18
American Institute of Aeronautics and Astronautics
Dow
nloa
ded
by U
nive
rsity
of
Mic
higa
n -
Dud
erst
adt C
ente
r on
Dec
embe
r 14
, 201
7 | h
ttp://
arc.
aiaa
.org
| D
OI:
10.
2514
/6.2
015-
0466

Figure 8. Load-displacement plot for open hole tension of 10/80/10 laminate coupon
Figure 9. Failure of 10/80/10 laminate coupon under tension
13 of 18
American Institute of Aeronautics and Astronautics
Dow
nloa
ded
by U
nive
rsity
of
Mic
higa
n -
Dud
erst
adt C
ente
r on
Dec
embe
r 14
, 201
7 | h
ttp://
arc.
aiaa
.org
| D
OI:
10.
2514
/6.2
015-
0466
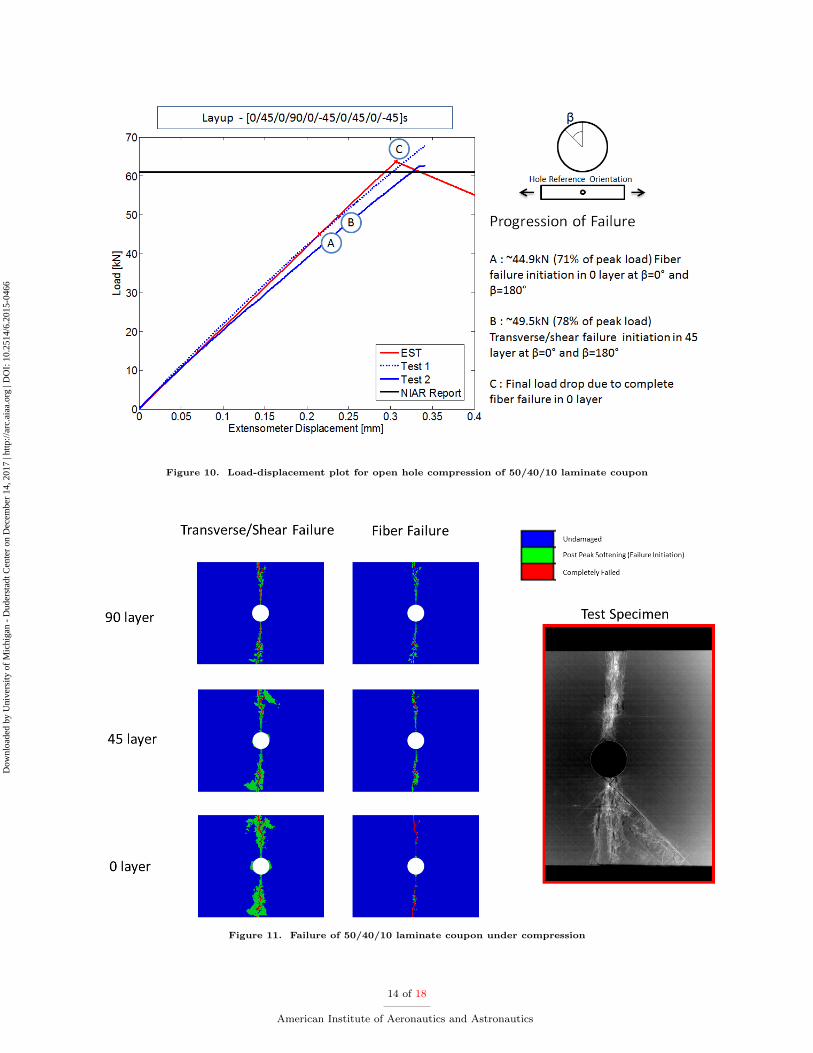
Figure 10. Load-displacement plot for open hole compression of 50/40/10 laminate coupon
Figure 11. Failure of 50/40/10 laminate coupon under compression
14 of 18
American Institute of Aeronautics and Astronautics
Dow
nloa
ded
by U
nive
rsity
of
Mic
higa
n -
Dud
erst
adt C
ente
r on
Dec
embe
r 14
, 201
7 | h
ttp://
arc.
aiaa
.org
| D
OI:
10.
2514
/6.2
015-
0466

Figure 12. Load-displacement plot for open hole compression of 25/50/25 laminate coupon
Figure 13. Failure of 25/50/25 laminate coupon under compression
15 of 18
American Institute of Aeronautics and Astronautics
Dow
nloa
ded
by U
nive
rsity
of
Mic
higa
n -
Dud
erst
adt C
ente
r on
Dec
embe
r 14
, 201
7 | h
ttp://
arc.
aiaa
.org
| D
OI:
10.
2514
/6.2
015-
0466

Figure 14. Load-displacement plot for open hole compression of 10/80/10 laminate coupon
Figure 15. Failure of 10/80/10 laminate coupon under compression
16 of 18
American Institute of Aeronautics and Astronautics
Dow
nloa
ded
by U
nive
rsity
of
Mic
higa
n -
Dud
erst
adt C
ente
r on
Dec
embe
r 14
, 201
7 | h
ttp://
arc.
aiaa
.org
| D
OI:
10.
2514
/6.2
015-
0466

Figure 16. Open hole tension predictions compared with experiments
17 of 18
American Institute of Aeronautics and Astronautics
Dow
nloa
ded
by U
nive
rsity
of
Mic
higa
n -
Dud
erst
adt C
ente
r on
Dec
embe
r 14
, 201
7 | h
ttp://
arc.
aiaa
.org
| D
OI:
10.
2514
/6.2
015-
0466

Figure 17. Open hole compression predictions compared with experiments
18 of 18
American Institute of Aeronautics and Astronautics
Dow
nloa
ded
by U
nive
rsity
of
Mic
higa
n -
Dud
erst
adt C
ente
r on
Dec
embe
r 14
, 201
7 | h
ttp://
arc.
aiaa
.org
| D
OI:
10.
2514
/6.2
015-
0466


![A Generic Scheme for Progressive Point Cloud Codinggopi/PAPERS/TVCGYan.pdf · In Gumhold et al.’s work [19] a prediction tree is built up for each input model to facilitate prediction](https://static.fdocuments.in/doc/165x107/5e845309673e385524513ba0/a-generic-scheme-for-progressive-point-cloud-coding-gopipapers-in-gumhold-et.jpg)