PROGRESSIVE COLLAPSE RESISTANCE OF STEEL BUILDING...
44
PROGRESSIVE COLLAPSE RESISTANCE OF STEEL BUILDING FLOORS FINAL REPORT By Abolhassan Astaneh-Asl Brant Jones Yongkuan Zhao Ricky Hwa With Contributions from: David McCallen and Charles Noble of Lawrence Livermore National Laboratory REPORT NUMBER: UCB/CEE-STEEL-2001/03 DEPARTMENT OF CIVIL AND ENVIRONMENTAL ENGINEERING COLLEGE OF ENGINEERING UNIVERSITY OF CALIFORNIA AT BERKELEY Report to the Sponsors: American Institute of Steel Construction August 2001 This is a 99% Version of Final Report of a UC- Berkeley research project supported by AISC. It is submitted to AISC for its review and comments within 30 days. The report should not be distributed to others outside AISC. The information cannot be used in anyway until the report is finalized and submitted to AISC as “Final Report” by Principal Investigator: A. Astaneh-Asl. October 23, 2001
Transcript of PROGRESSIVE COLLAPSE RESISTANCE OF STEEL BUILDING...
PROGRESSIVE COLLAPSE RESISTANCE OF STEEL BUILDING FLOORS
FINAL REPORT
By
Abolhassan Astaneh-Asl
Brant Jones
Yongkuan Zhao
Ricky Hwa
With Contributions from:
David McCallen and Charles Noble
of Lawrence Livermore National Laboratory
REPORT NUMBER: UCB/CEE-STEEL-2001/03 DEPARTMENT OF CIVIL AND ENVIRONMENTAL ENGINEERING COLLEGE OF ENGINEERING UNIVERSITY OF CALIFORNIA AT BERKELEY
Report to the Sponsors: American Institute of Steel Construction
August 2001
This is a 99% Version of Final Report of a UC-Berkeley research project supported by AISC. It is submitted to AISC for its review and comments within 30 days. The report should not be distributed to others outside AISC. The information cannot be used in anyway until the report is finalized and submitted to AISC as “Final Report” by Principal Investigator: A. Astaneh-Asl. October 23, 2001

FLOOR CATENARY ACTION TO PREVENT PROGRESSIVE COLLAPSE OF STEEL
STRUCTURES
FINAL REPORT
Abolhassan Astaneh-Asl, Ph.D., P.E. Professor and Principal Investigator
Department of Civil and Environmental Engineering University of California, Davis Hall
Berkeley CA 94720-1710
Brant Jones Master of Science Graduate Student Research Assistant
Yongkuan Zhao
Associate Professor at Zhaoquing University, Peoples Republic of China and Visiting Scholar, University of California at Berkeley (2001)
Ricky Hwa
Undergraduate Student Research Assistant
With Contributions from:
David B. McCallen and Charles Noble
Of the Lawrence Livermore National Laboratory
Report to the American Institute of Steel Construction
REPORT NUMBER: UCB/CEE-STEEL-01/03 DEPARTMENT OF CIVIL AND ENVIRONMENTAL ENGINEERING
COLLEGE OF ENGINEERING UNIVERSITY OF CALIFORNIA AT BERKELEY
August 2001
Technical Report Documentation Page 1 Report No
UCB/CEE-STEEL-01/03
2. Government Accession No. 3. Recipient’s Catalog N
4. Title and Subtitle
FLOOR CATENARY ACTION TO PREVENT PROGRESSIVE COLLAPSE OF STEEL STRUCTURES
5. Report Date
August 2001
6. Performing Organization Code
7. Authors
A. Astaneh-Asl, Brant Jones, Yongkuan Zhao, Ricky Hwa,
8. Performing Organization Report No.
UCB/CEE-STEEL-01/03 9. Performing Organization Name and Address
Department of Civil and Environmental Engineering 10. Work Unit No. (TRAIS)
University of California, Berkeley, California 94720-1710 Fax: A. Astaneh: (510) 643-5258, e-mail: [email protected]
11. Contract or Grant No.
Contract Number:
12. Sponsoring Agency Name and Address
American Institute of Steel Construction 13. type of Report and Period Covered
Final 15. Supplementary Notes The research reported herein was done in the Department of Civil and Environmental Engineering of University of California, Berkeley and was supported by the American Institute of Steel Construction. The construction of full scale specimen used in these studies was funded by the General Services Administration of U.S. Federal Government in a sister project. The opinions expressed in this reports are those of the authors and do not necessarily reflect the views of University of California, Berkeley or the Sponsor. 16. Abstract
This report presents the background, test set-up, specimens, test procedures and the test results of “column-drop” tests of a one story steel structure. The specimen was a 60ft by 20ft one story typical steel structure with steel deck and concrete slab floor and wide flange beams and columns. The connections were either standard shear tab or bolted seat angle under bottom flange and a bolted single angle on one side of web. The main objectives of these studies were to explore the strength of a typical steel structure and floor system to resist progressive collapse in the event of removal of a column by a blast and to establish failure modes. An added objective was using the test results to provide the AISC with design-oriented information on what is the potential of existing typical steel structures to resist progressive collapse and what are the possible research needs in this particular field. The tests indicated that after removal of the middle perimeter column, due to catenary action of steel deck and girders, the design dead load and live load of the floor could be resisted and the floor is not expected to collapse in the event of removal of one such column. 17. Key Words
Steel Structures, Blast-resistant Design, Progressive Collapse Prevention, Floor Design, Steel Deck, Bolted Connections, Testing.
18. Distribution Statement
No restriction. This Document is available to the public through the Department of Civil and Environmental Engineering, University of California, Berkeley, CA 94720-1710 Contact: [email protected]
19. Security Classif. (of this Report)
Unclassified
20. Security Classif. (of this page)
Unclassified
21. No. of Pages 22. Price
$40.00+ Applicable Sales Tax
ABSTRACT
This report presents the background, test set-up, specimens, test procedures and the test results of “column-drop” tests of a one story steel structure. The specimen was a 60ft by 20ft one story typical steel structure with steel deck and concrete slab floor and wide flange beams and columns. The connections were either standard shear tab or bolted seat angle under bottom flange and a bolted single angle on one side of web.
The main objectives of these studies were to explore the strength of a typical steel structure and floor system to resist progressive collapse in the event of removal of a column by a blast and to establish failure modes. An added objective was using the test results to provide the AISC with design-oriented information on what is the potential of existing typical steel structures to resist progressive collapse and what are the possible research needs in this particular field.
The tests indicated that after removal of the middle perimeter column, due to catenary action of steel deck and girders, the design dead load and live load of the floor could be resisted and the floor is not expected to collapse in the event of removal of one such column.

ACKNOWLEDGMENTS
The study reported here was supported by the American Institute of Steel Construction.
The authors would like to express their appreciation for the support as well as technical advice
and input received from the AISC engineers. Particularly, the support and technical input from
Dr. Nestor Iwankiw, Dr. Sergio Zoruba and Mr. Tom Schlafly of the AISC were very useful and
essential to success of this project and are sincerely appreciated.
The tests reported here were conducted in the Department of Civil and Environmental
Engineering of University of California at Berkeley. The contributions of Department staff
particularly William Mac Cracken, Dr. Lev Stepanov, Chris Moy, Richard Parsons, Douglas
Zulaica and Mark Troxler were very valuable in conducting the tests as well as in data
acquisition and processing. Without their dedication and professional work, this project would
not have been possible. Roger Jung, Erik Madsen and Qiuhong Zhao , graduate student research
assistants participated in various aspects of the project. Wendy Wang and Sunil Tellis ,
undergraduate student research assistants, were also involved in preparing the specimen,
conducting material tests and other aspects of this large scale testing. The contributions of these
students were very valuable, acknowledged and sincerely appreciated.
The specimen used in these studies was constructed for a sister project that was funded
by the General Services Administration (GSA) of U.S. Federal Government. Herrick
Corporation of Stockton California fabricated the test specimen with diligence, on time and on
budget and according to drawings and specifications. The efforts of Jamie Winens, the project
engineer with Herrick Corporation are sincerely appreciated.
The testes reported herein were primarily conducted by second author, Brant Jones, as a
CE-299 Independent Research and during a summer spent on the campus of the University of
California – Berkeley as part of a Professional Development Program, a privilege for which he is
grateful to the Defense Nuclear Facilities Safety Board.

TABLE OF CONTENTS
Report Title Page… … … ....................................… … … … ..................................… … … .............. 1 Report Summary Form … … … … … … … … … … … … … … … … … … … … … … … … … … … … . 2 Abstract ......................................................................… … … … .........................… … … .......... 3 Acknowledgments ................................................… … … ......................… … … … ................… … 4 Table of Contents ...............................................................… … … ......................… … … … ..… … 5 1. Introduction........................................................… … … ...........… … … … .......… … … … … … 6 2. Experimental Research.................................................… … … ......................… … … … ..… … 9 3. Observed Behavior and Test Results................… … … … … .....................… … … … … … … . 23 4. Conclusions and Recommendations… … .....................… … … … … … … … ............… … … .. 36 Appendix A. Shop Drawings of Test Specimen Appendix B. Complete Test Data on Specimen


CHAPTER ONE
Introduction
1.1. Introduction
In recent years, a number of tragic terrorist attacks, particularly, in the U.S. soil, have
resulted in a number of initiatives to study resistance of structures to blasts. In addition, a number
of research projects have been undertaken or are underway to develop mechanisms and systems
that can reduce the hazard of such attacks. The main aim of these efforts is to protect life safety
of the building occupants and those who are around the building and can be injured by collapsing
structure and falling debris.
One of the main areas of research and development in this field is progressive collapse
prevention. From structural engineering and construction point of view, of course one can design
a building that can withstand a terrorist bomb attack with minimal or no damage. This has been
done for years and continues to be done for militarily sensitive and other critical buildings that
are necessary to be functional and occupied even after an explosion attack on them. Of course,
designing such a highly protected building requires significant amount of funding as well as
resources. In addition, to achieve the objective of minimal damage, the designers may end up
sacrificing the exterior aesthetics and in some cases the internal functionality of the building.
Although in case of military installations, the high cost and bunker-like look of a building can be
justified, for civilian office buildings, such high costs cannot be afforded and the loss of aesthetic
may not be always acceptable. This is because of very low probability of any given civilian
building being attacked by terrorists.
In order to make a civilian building structure blast-resistant, first, one has to define the
performance criteria for blast resistance. The performance criteria should be specific enough to
provide structural engineers with clear parameters such that they can design the structures to
achieve the expected performance. The following section discusses Performance Criteria in more
detail.

1.2. Blast-Resistance Performance Criteria
The blast performance criteria should be established in a way that the society as a whole
is satisfied with the target performance level and can afford the associated cost. Currently there
are no formal blast performance criteria for civilian buildings. It seems that a criteria that may
be acceptable and affordable by the society at this time and with present low probability of
terrorist attacks is to ensure that the loss of life and severe injuries are avoided and partial or full
collapse are prevented. Following this proposed performance criteria, damage to the building in a
terrorist attack is accepted as long as such damage does not result in death or severe injuries or
collapse.
There are several reasons for death and injuries in a blast attack. Death and injury can
occur due to direct impact of explosion, heat, fire, inhaling smoke and hazardous gases
eminating from the explosion or building contents, flying debris or building contents, falling
debris or building contents, shrapnels, air impact and other related causes such as heart attack.
Collapse of a structure and the resulting pancaking of floors has been the main cause of
deaths and injuries in recent blast attacks on buildings. It is clear that by preventing collapse,
especially by preventing catastrophic collapse of floors, one can save many lives and be able to
evacuate the occupants to safety. Therefore, making civilian buildings blast-resistant can be
translated to making sure that partial and full collapse of the structure of these buildings are
prevented.
Some structures have highly indeterminate structural systems with more than one load
paths to resist the applied loads. In these highly indeterminate systems with many redundant
members, it is possible to eliminate a number of structural elements yet not to be able to collapse
the structure or the floors. Obviously, if such systems are identified, their use will result in
significant saving in making building structures no to collapse during or after an explosion
attack.. Such characteristics denoted as “ progressive collapse” resistance was the main theme of
this research project.
1.3. Objectives
The tests reported herein were conducted to collect data on progressive collapse
resistance of typical steel structure with steel deck concrete slab floor supported on steel framing
with simple connections.
1.4. Scope and Content of the Report
The focus of this report is the investigation of conventionally designed buildings in their
ability to resist progressive collapse. The discussion will be limited to the observed behavior and
test data resulting from experimental research of a full-scale floor system of a typical commercial
office building. Conclusions and recommendations will focus on the overall failure mechanisms.
Some recommendations are made for future research needs.
CHAPTER TWO
Experimental Research
2.1. Introduction
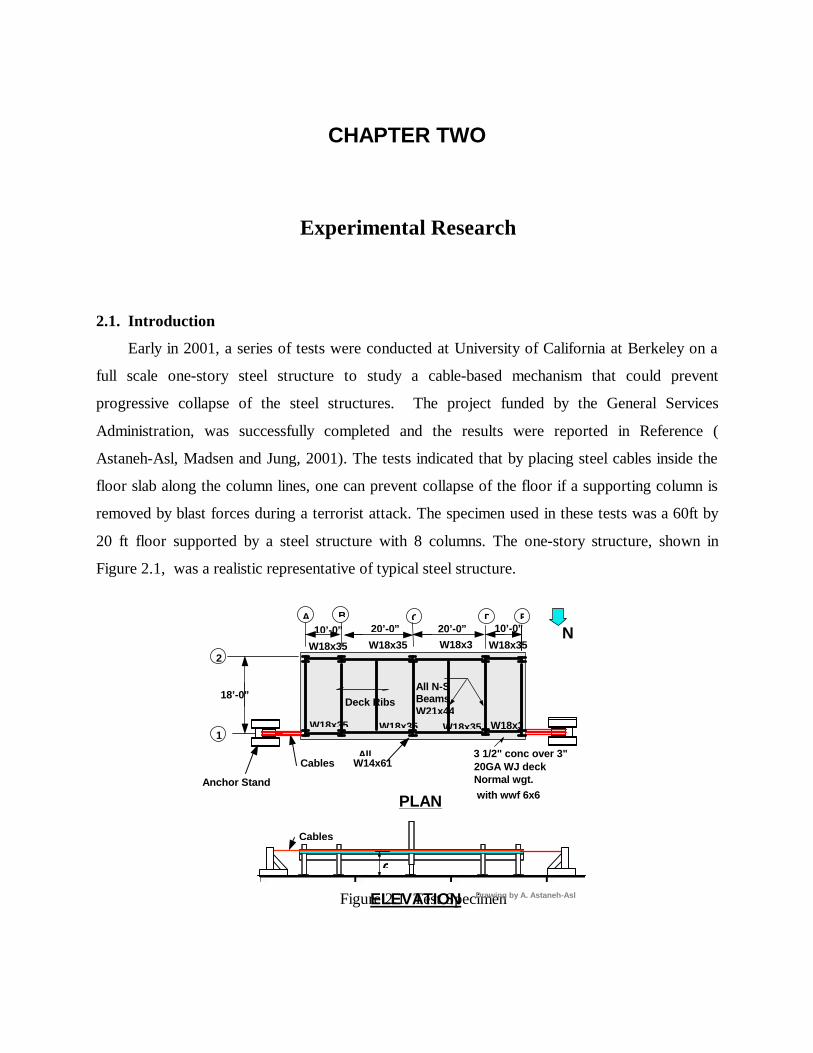
Early in 2001, a series of tests were conducted at University of California at Berkeley on a
full scale one-story steel structure to study a cable-based mechanism that could prevent
progressive collapse of the steel structures. The project funded by the General Services
Administration, was successfully completed and the results were reported in Reference (
Astaneh-Asl, Madsen and Jung, 2001). The tests indicated that by placing steel cables inside the
floor slab along the column lines, one can prevent collapse of the floor if a supporting column is
removed by blast forces during a terrorist attack. The specimen used in these tests was a 60ft by
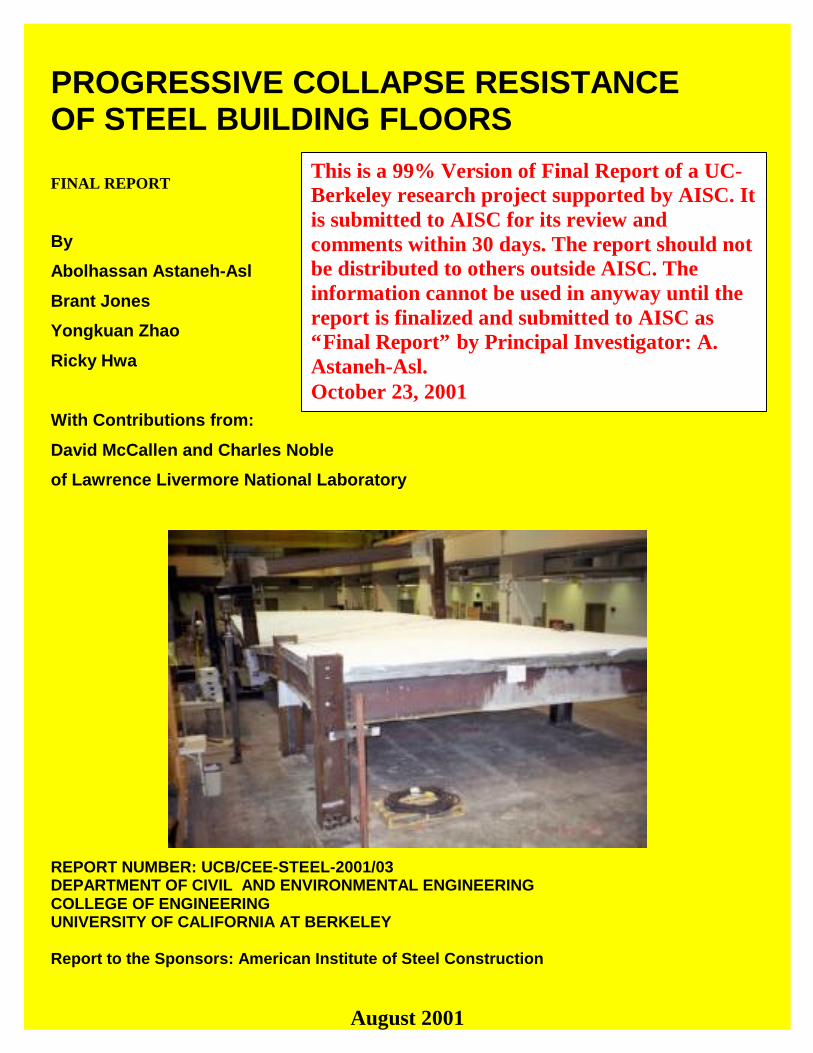
20 ft floor supported by a steel structure with 8 columns. The one-story structure, shown in
Figure 2.1, was a realistic representative of typical steel structure.
Figure 2.1. Test Specimen
PLAN
All Cables
W14x61
W18x35
All N-S Beams W21x44
Deck Ribs
Anchor Stand
1
3 1/2" conc over 3"
Normal wgt. conc.
20GA WJ deck
with wwf 6x6
W18x35 W18x3W18x35
2
118’-0”
A B C D E
N W18x35 W18x3
5 W18x35 W18x35
20’ 20’
10’
10’-0” 10’-0” 20’-0” 20’-0”
Drawing by A. Astaneh-Asl ELEVATION
6
Cables
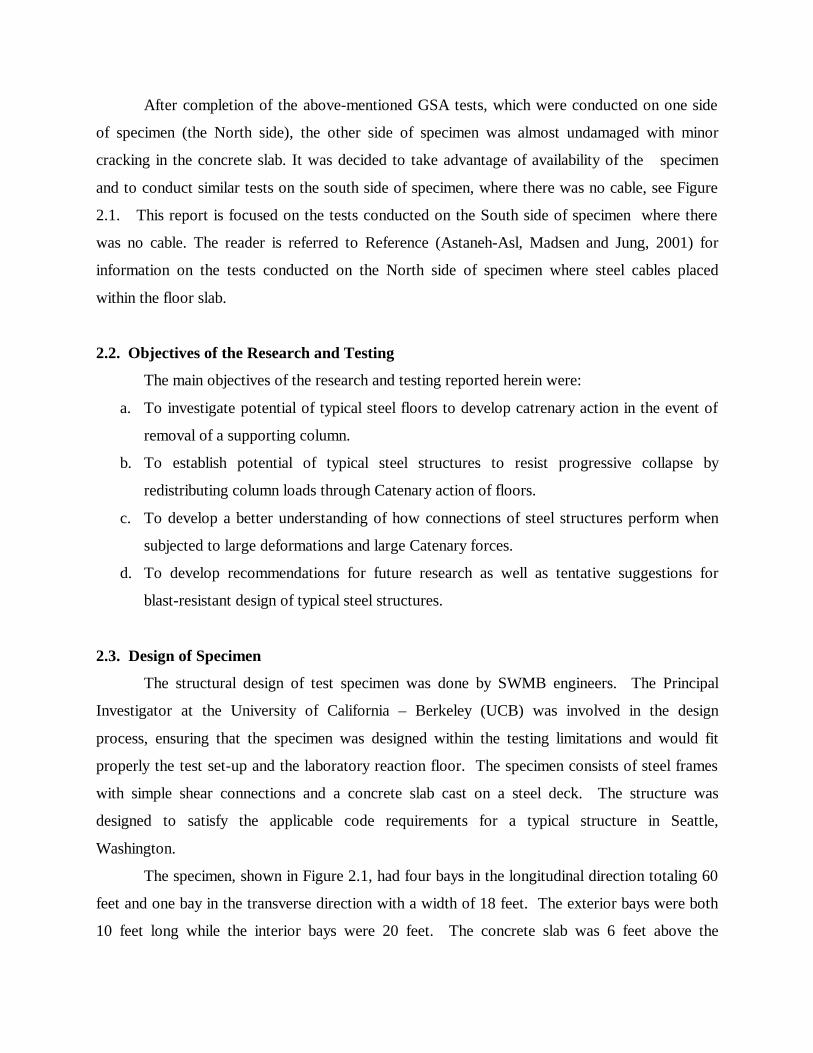
After completion of the above-mentioned GSA tests, which were conducted on one side
of specimen (the North side), the other side of specimen was almost undamaged with minor
cracking in the concrete slab. It was decided to take advantage of availability of the specimen
and to conduct similar tests on the south side of specimen, where there was no cable, see Figure
2.1. This report is focused on the tests conducted on the South side of specimen where there
was no cable. The reader is referred to Reference (Astaneh-Asl, Madsen and Jung, 2001) for
information on the tests conducted on the North side of specimen where steel cables placed
within the floor slab.
2.2. Objectives of the Research and Testing
The main objectives of the research and testing reported herein were:
a. To investigate potential of typical steel floors to develop catrenary action in the event of
removal of a supporting column.
b. To establish potential of typical steel structures to resist progressive collapse by
redistributing column loads through Catenary action of floors.
c. To develop a better understanding of how connections of steel structures perform when
subjected to large deformations and large Catenary forces.
d. To develop recommendations for future research as well as tentative suggestions for
blast-resistant design of typical steel structures.
2.3. Design of Specimen
The structural design of test specimen was done by SWMB engineers. The Principal
Investigator at the University of California – Berkeley (UCB) was involved in the design
process, ensuring that the specimen was designed within the testing limitations and would fit
properly the test set-up and the laboratory reaction floor. The specimen consists of steel frames
with simple shear connections and a concrete slab cast on a steel deck. The structure was
designed to satisfy the applicable code requirements for a typical structure in Seattle,
Washington.
The specimen, shown in Figure 2.1, had four bays in the longitudinal direction totaling 60
feet and one bay in the transverse direction with a width of 18 feet. The exterior bays were both
10 feet long while the interior bays were 20 feet. The concrete slab was 6 feet above the
laboratory floor level. Design drawings as well as shop drawings of the specimen are provided
in Appendix A.
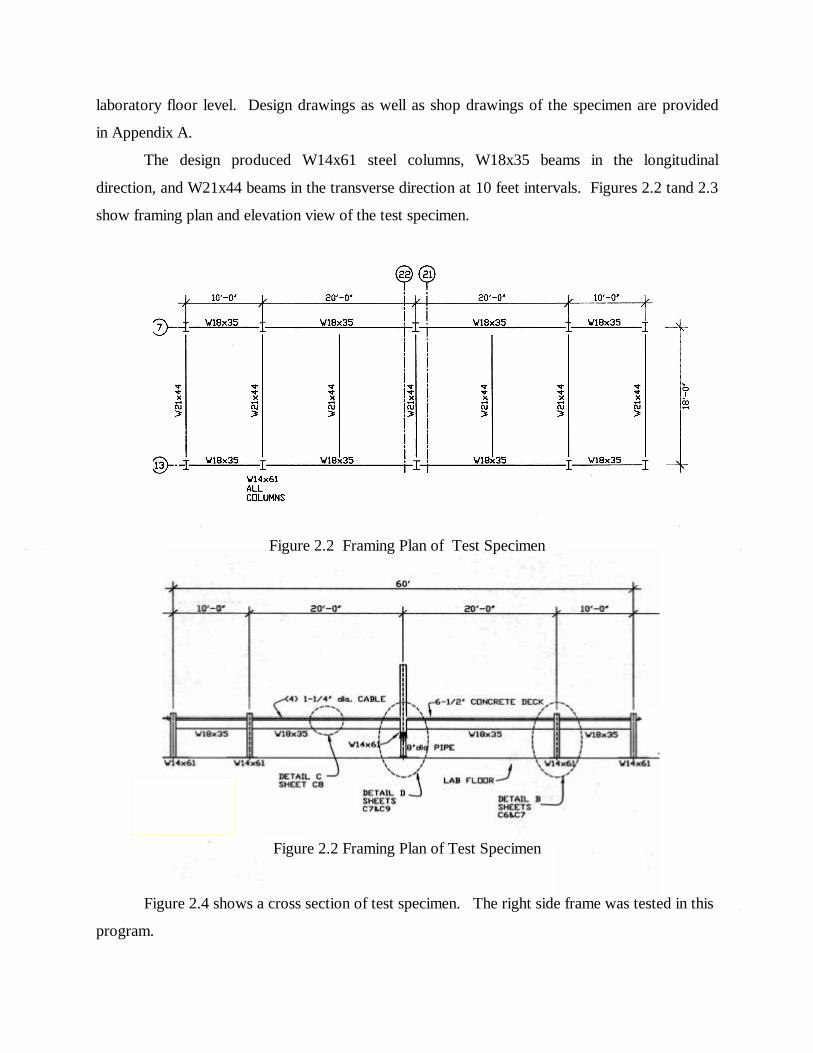
The design produced W14x61 steel columns, W18x35 beams in the longitudinal
direction, and W21x44 beams in the transverse direction at 10 feet intervals. Figures 2.2 tand 2.3
show framing plan and elevation view of the test specimen.
Figure 2.2 Framing Plan of Test Specimen
Figure 2.2 Framing Plan of Test Specimen
Figure 2.4 shows a cross section of test specimen. The right side frame was tested in this
program.

Figure 2.3. Cross Section of Test Specimen
The steel deck was a typical 20 gage deck connected to the framing with “puddle” welds
and with shear studs. Figure 2.4 shows a general view and close up of the deck.
Figure 2.4. A view of Stel Deck and Close-up of Deck and Shear Studs
Figure 2.5. shows plan view of the shear studs. Placed on top flange of beams and
girders.
Figure 2.5. Plan of Shear Studs
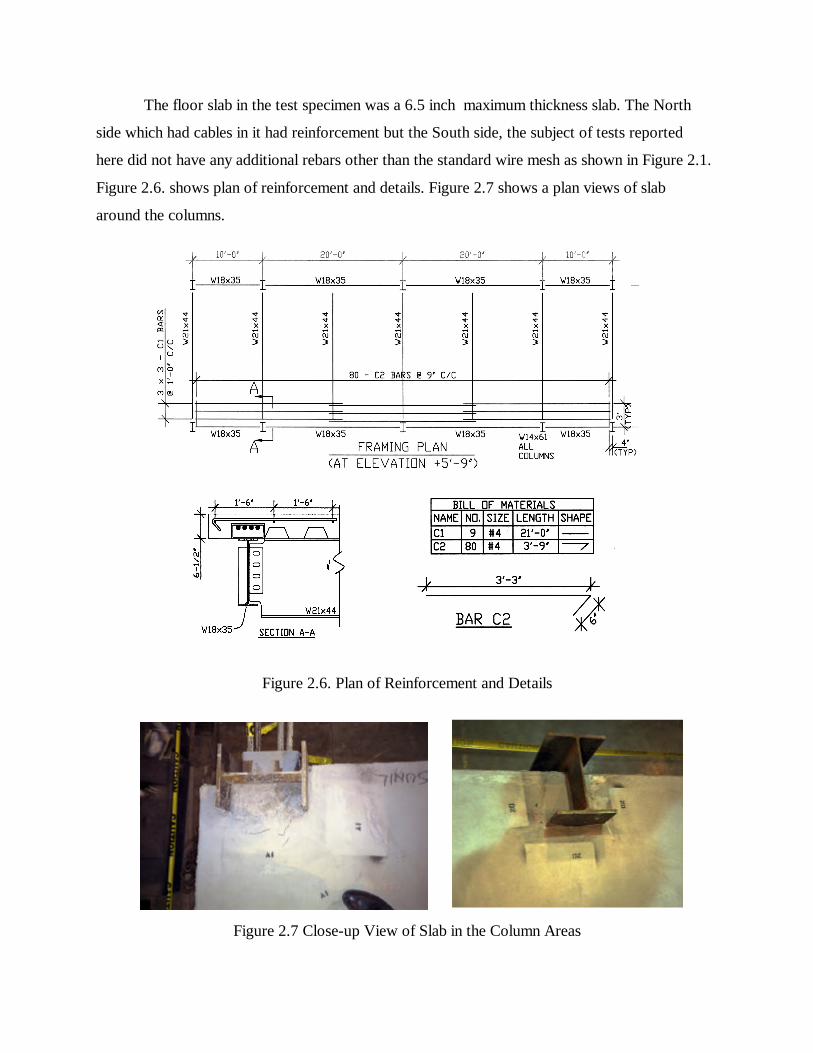
The floor slab in the test specimen was a 6.5 inch maximum thickness slab. The North
side which had cables in it had reinforcement but the South side, the subject of tests reported
here did not have any additional rebars other than the standard wire mesh as shown in Figure 2.1.
Figure 2.6. shows plan of reinforcement and details. Figure 2.7 shows a plan views of slab
around the columns.
Figure 2.6. Plan of Reinforcement and Details
Figure 2.7 Close-up View of Slab in the Column Areas
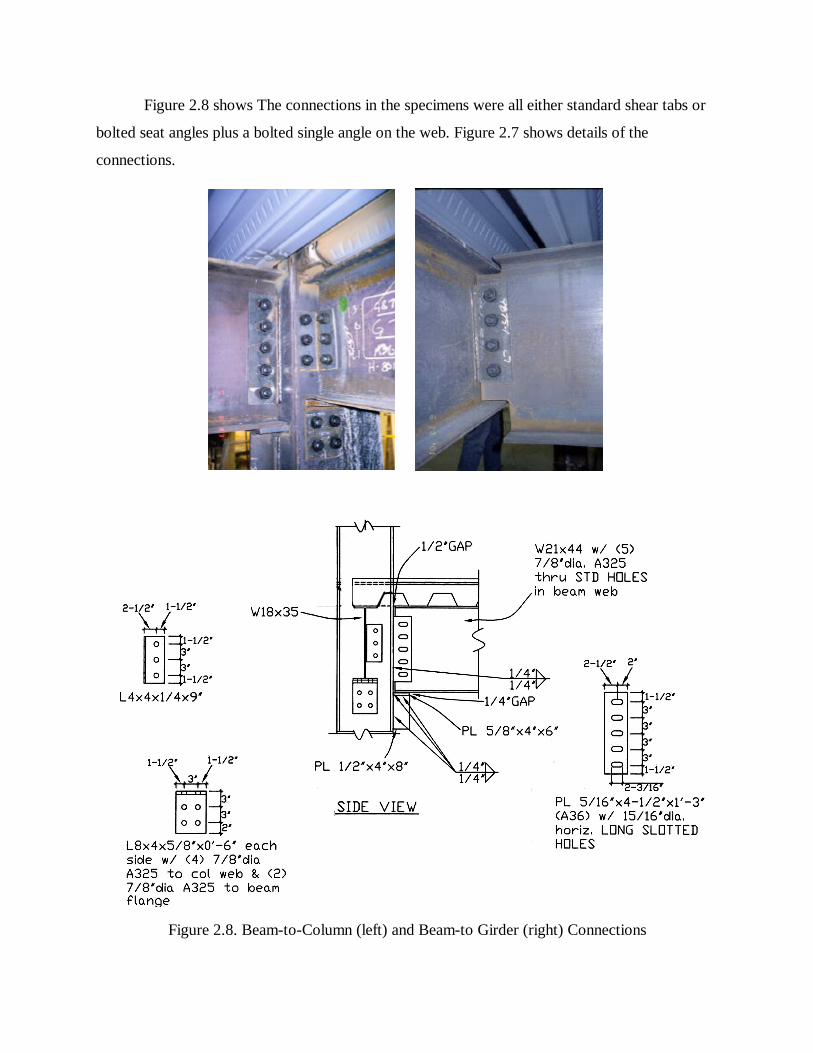
Figure 2.8 shows The connections in the specimens were all either standard shear tabs or
bolted seat angles plus a bolted single angle on the web. Figure 2.7 shows details of the
connections.
Figure 2.8. Beam-to-Column (left) and Beam-to Girder (right) Connections
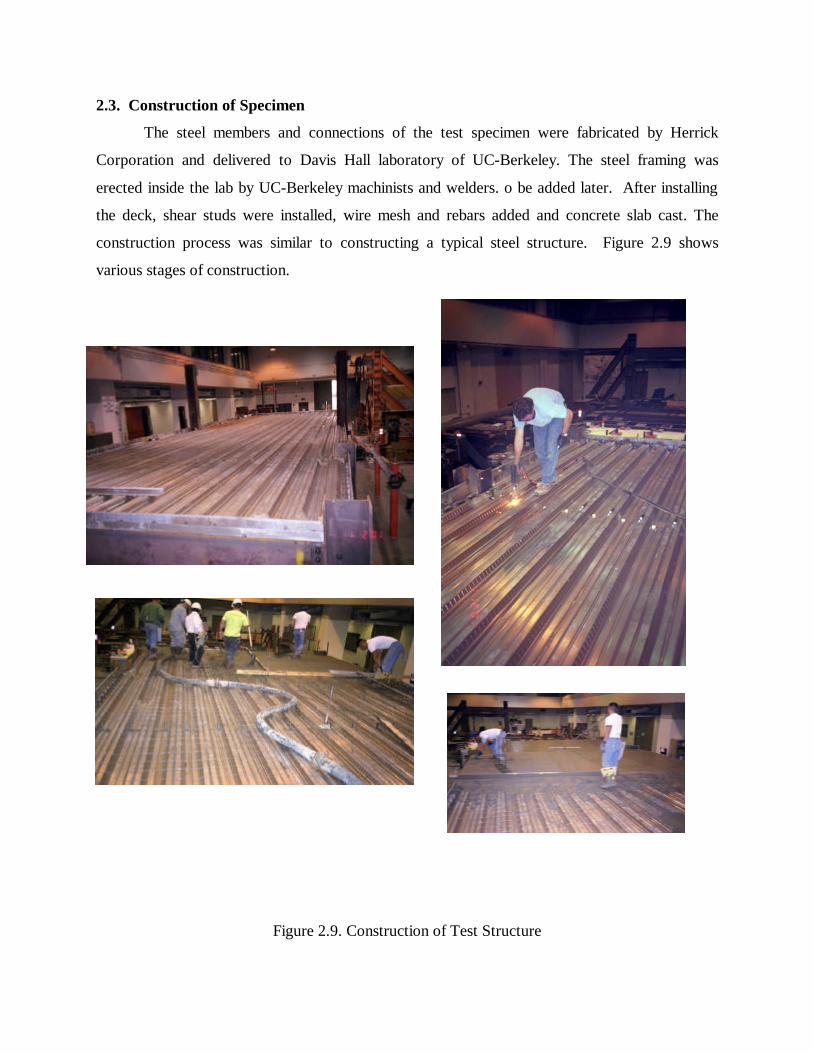
2.3. Construction of Specimen
The steel members and connections of the test specimen were fabricated by Herrick
Corporation and delivered to Davis Hall laboratory of UC-Berkeley. The steel framing was
erected inside the lab by UC-Berkeley machinists and welders. o be added later. After installing
the deck, shear studs were installed, wire mesh and rebars added and concrete slab cast. The
construction process was similar to constructing a typical steel structure. Figure 2.9 shows
various stages of construction.
Figure 2.9. Construction of Test Structure
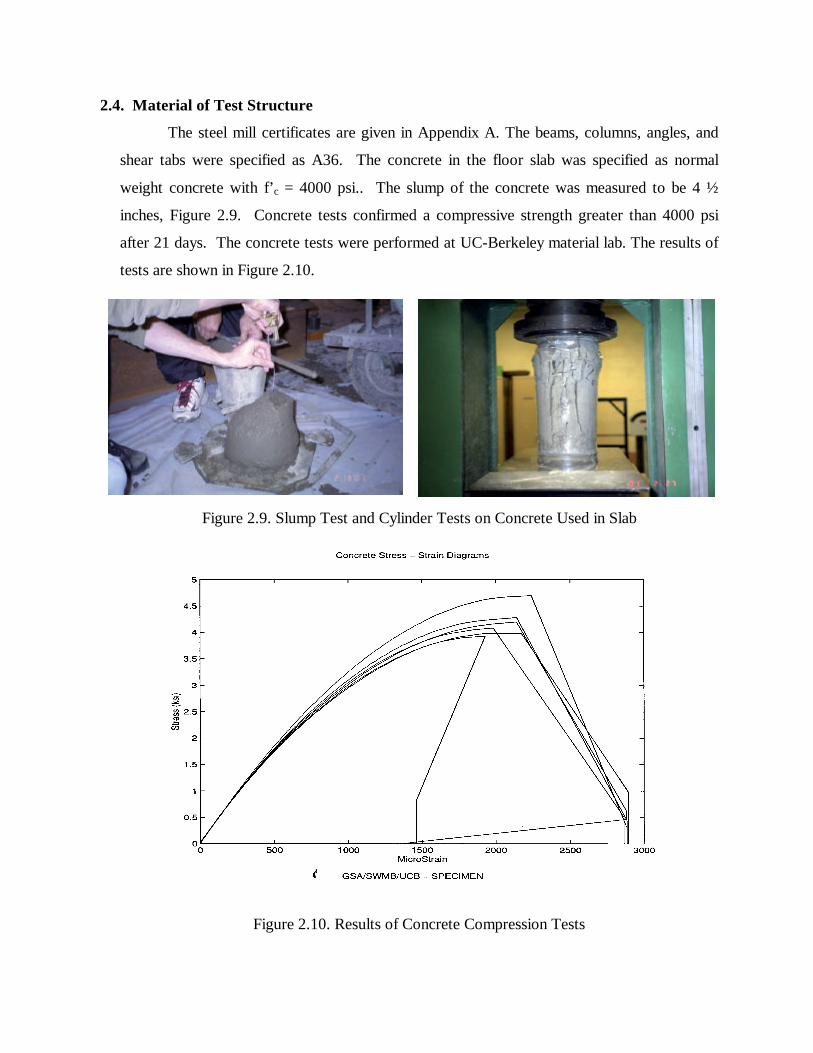
2.4. Material of Test Structure
The steel mill certificates are given in Appendix A. The beams, columns, angles, and
shear tabs were specified as A36. The concrete in the floor slab was specified as normal
weight concrete with f’c = 4000 psi.. The slump of the concrete was measured to be 4 ½
inches, Figure 2.9. Concrete tests confirmed a compressive strength greater than 4000 psi
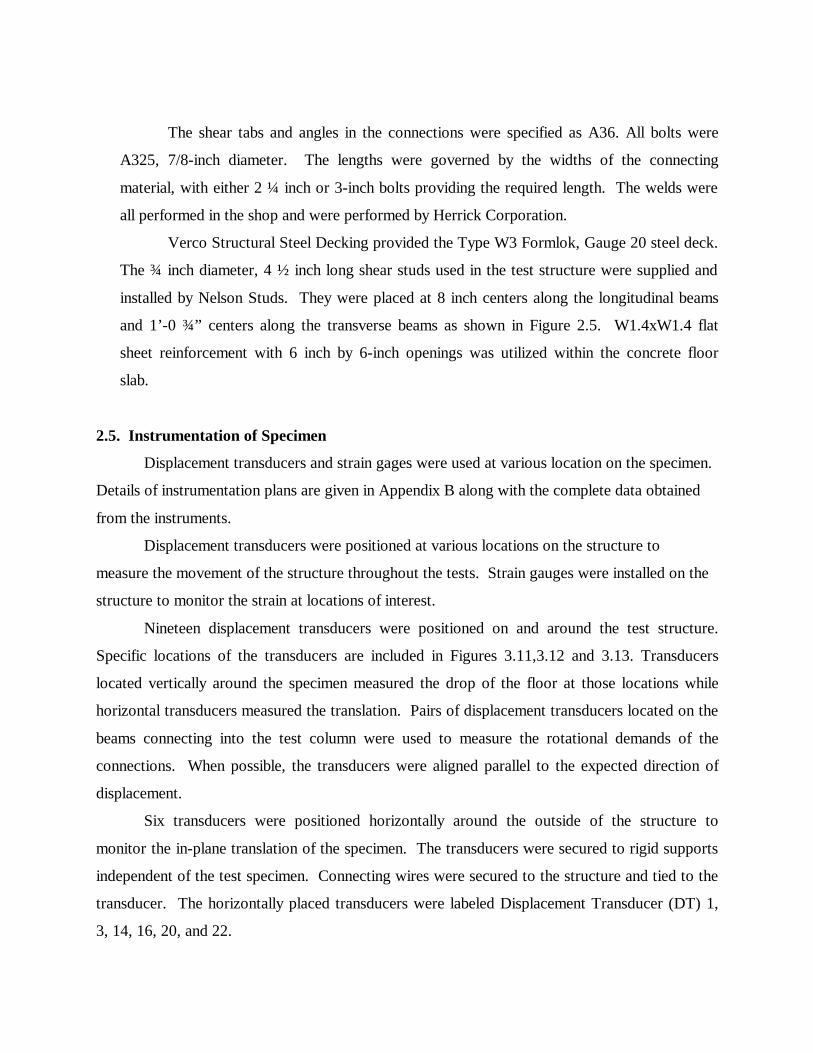
after 21 days. The concrete tests were performed at UC-Berkeley material lab. The results of
tests are shown in Figure 2.10.
Figure 2.9. Slump Test and Cylinder Tests on Concrete Used in Slab
Figure 2.10. Results of Concrete Compression Tests
The shear tabs and angles in the connections were specified as A36. All bolts were
A325, 7/8-inch diameter. The lengths were governed by the widths of the connecting
material, with either 2 ¼ inch or 3-inch bolts providing the required length. The welds were
all performed in the shop and were performed by Herrick Corporation.
Verco Structural Steel Decking provided the Type W3 Formlok, Gauge 20 steel deck.
The ¾ inch diameter, 4 ½ inch long shear studs used in the test structure were supplied and
installed by Nelson Studs. They were placed at 8 inch centers along the longitudinal beams
and 1’-0 ¾” centers along the transverse beams as shown in Figure 2.5. W1.4xW1.4 flat
sheet reinforcement with 6 inch by 6-inch openings was utilized within the concrete floor
slab.
2.5. Instrumentation of Specimen
Displacement transducers and strain gages were used at various location on the specimen.
Details of instrumentation plans are given in Appendix B along with the complete data obtained
from the instruments.
Displacement transducers were positioned at various locations on the structure to
measure the movement of the structure throughout the tests. Strain gauges were installed on the
structure to monitor the strain at locations of interest.
Nineteen displacement transducers were positioned on and around the test structure.
Specific locations of the transducers are included in Figures 3.11,3.12 and 3.13. Transducers
located vertically around the specimen measured the drop of the floor at those locations while
horizontal transducers measured the translation. Pairs of displacement transducers located on the
beams connecting into the test column were used to measure the rotational demands of the
connections. When possible, the transducers were aligned parallel to the expected direction of
displacement.
Six transducers were positioned horizontally around the outside of the structure to
monitor the in-plane translation of the specimen. The transducers were secured to rigid supports
independent of the test specimen. Connecting wires were secured to the structure and tied to the
transducer. The horizontally placed transducers were labeled Displacement Transducer (DT) 1,
3, 14, 16, 20, and 22.
A pair of transducers was placed on the ends of each of the three beams framing into the test
column. An additional pair was placed at the opposite end of the transverse beam. The
transducers were aligned parallel to the webs of the beams, two inches from the outermost
surface of the closest flange. A threaded rod was welded to the web of the beam onto which
each transducer could be attached. A connecting wire connected the transducer to the test
column. The eight rotational transducers were labeled DT 6 through 13.
Three displacement transducers were positioned along the test column line to measure the
vertical movement of the frame. One transducer was positioned at the test column while two
other transducers were placed near the adjacent columns. The three transducers were labeled DT
2, 4, and 15.
Two additional displacement transducers were attached to the test column as can be seen
in Figure X. The transducers were labeled DT 17 and 19. The test column was not only
expected to displace vertically, but also to rotate as it displaced. For this reason, it was not
possible to orient the transducers in a way to reduce the measurement to one dimension. Initial
connecting wire lengths were recorded and are included in the figure.
Displacement transducers with labels numbered 5, 18, and 21 were not utilized in the
testing. The transducers were labeled in a fashion so that there would be one-to-one
correspondence to the transducers used in previous experiments of the specimen.
Strain gauges were installed to monitor the strain at locations of interest. Specific
locations of the gauges are included in Appendix B. Four 45° rosettes were placed in a
symmetrical fashion on the underside of the steel deck. Three linear gauges previously attached
to an angle were monitored. The particular angle connected the test column to the longitudinal
beam directly east of the test column. Also, four linear strain gauges were placed underneath the
steel deck in a single line, 30 inches east of the test column. And seven additional gauges were
placed on the web and flanges of the longitudinal beam directly east of the column, also 30
inches from the test column.
The specimen was carefully prepared before the strain gauges were bonded to the surface.
Rust and mill-scale were removed from the steel beam and angle by grinding the surface with a
stone-based grinding wheel. The surface was then progressively smoothed by using a cycle of
sanding wheels beginning with a 36-grit wheel and ending with a 120-grit wheel. This process
removed visible defects. Next, the surfaces were sanded by hand using 240-grit sandpaper
followed by 360-grit sandpaper. The process of placing the gauges on the steel deck began at
this hand-sanding step. The locations were then ready to be chemically treated.
Before chemically treating the locations, the exact location of the gauge was scored into
the steel material. A water based acid surface cleaner applied with the 360-grit sandpaper was
then used to cleanse the surface. Next, a degreaser was applied and wiped clean to remove any
acid that remained on the surface. Wiping the surface with the acid surface cleaner immediately
followed by a swipe of an alkaline surface cleaner then neutralized the surface. The water based
alkaline surface cleaner contained ammonia water whereas the acid cleaner contained phosphoric
acid. At this point, the surface could be visually inspected, with colored streaks revealing any
contamination that required a subsequent neutralization step. Finally, the strain gauges were
secured to the surface using a high-strength glue, cyanoacrylate adhesive, and protected with a
layer of duct tape.
Four 45o strain rosettes were placed on the underside of the steel deck in the bays
adjacent to the displaced column. These gauges were symmetrically placed, with two residing
on the west side of the test column, and two on the east side. During installation and inspection,
it was determined that both longitudinal (east-west) gauge wires in the bay immediately west of
the test column were damaged and did not provide the necessary resistance. For this reason, they
were not attached to the data recording system. No problems were encountered with the adjacent
strain rosettes, placed in the bay immediately east of the test column. The ten functional gauges
were labeled Strain Gauge (SG) 1 through 10.
Three linear gauges were placed on an angle connecting the test column to one of the
longitudinal beams during testing of the opposite side (See Appendix B for location of gages).
The gauges were once again monitored during testing. Significant and visibly noticeable
yielding of the angle occurred during the prior testing. The three linear strain gauges were
labeled SG 11 through 13.
Four additional linear strain gauges were placed beneath the steel deck, 30 inches east of
the test column. The gauges provided data on the variation of stress in the steel deck. The four
gauges were labeled SG 14 through 17.
The seven gauges that were placed on the longitudinal beam directly east of the column
provided data that could be used to calculate the force in the beam throughout the tests. Two
gauges were place on the bottom of the top flange and the top of the bottom flange, one on either
side of the web. Three additional gauges were placed on the web of the beam facing the outside
of the structure. The seven gauges were all located 30 inches east of the test column and labeled
SG 18 through 24.
2.6. Data Acquisition
The displacement transducers and strain gauges were attached to six data acquisition
boxes. Each box was capable of monitoring eight channels. The instruments were attached such
that only one of the two types of instruments led into each of the boxes. The acquisition boxes
were subsequently connected to a Megadak data recording system. With a channel capacity of
56 and the capability to record 50 data points per second, the system provided sufficient data
recording capabilities.
A second computer controlled the actuators during the experiments. Not only was the
computer capable of recording the force and displacement in each actuator, but also a small
number of additional channels. For this reason, several of the key instruments were also
connected to the second computer to serve as back-up system. The data was recorded and
processed at a later date.
2.7. Problems Encountered in Instrumentation and Data Acquisition
Examination of the data revealed that the displacement transducers (DTs) numbered 4
and 19 both produced unexpected output. DT 4 was positioned just outside the test column and
measured the vertical drop in the test column. The processed data plots of DT 4 reveal changes
in the direction of movement. With the actuators displacing the column at a constant rate, the
processed data was clearly unreliable. The transducer may have been incorrectly attached to the
data acquisition system.
DT 19 was attached to the structure near the top of the test column, however the layout of
the lab required that the transducer be secured to piping located on the ceiling of an adjoining
sub-room. When securing the transducer to the overhead piping, it was believed to be sturdy
enough to resist the small force needed to extend the wire. However, the processed data clearly
shows that the transducer was displaced approximately 0.4 inches by this small force. This is
evident because once the displacement of the test column was completed, the transducer shows a
shortening of the connected distance by about 0.4 inches. Follow-up inspection of the pipes to
which it was attached confirmed the likelihood of this transducer movement.
2.8. Test Procedures
Prior to the testing date, all instrumentation was installed, calibrated, and tested for
proper operation. This included a check of the strain gauge resistances. The test consisted of
three constant velocity loadings. The column was displaced at a rate of 0.25 inches/second to
three different displacement levels. The column was displaced 19, 24, and 35 inches downward
for the first, second, and third subtests, respectively. After each subtest, the bottom of the test
column was returned to its original height, 36 inches above the base level. The final
displacement of each subtest was governed by the tests that were performed on the opposite side
of the structure that contained the catenary cables. By performing the same tests on each side,
one can evaluate the contribution of the catenary cables in resisting the increased load.
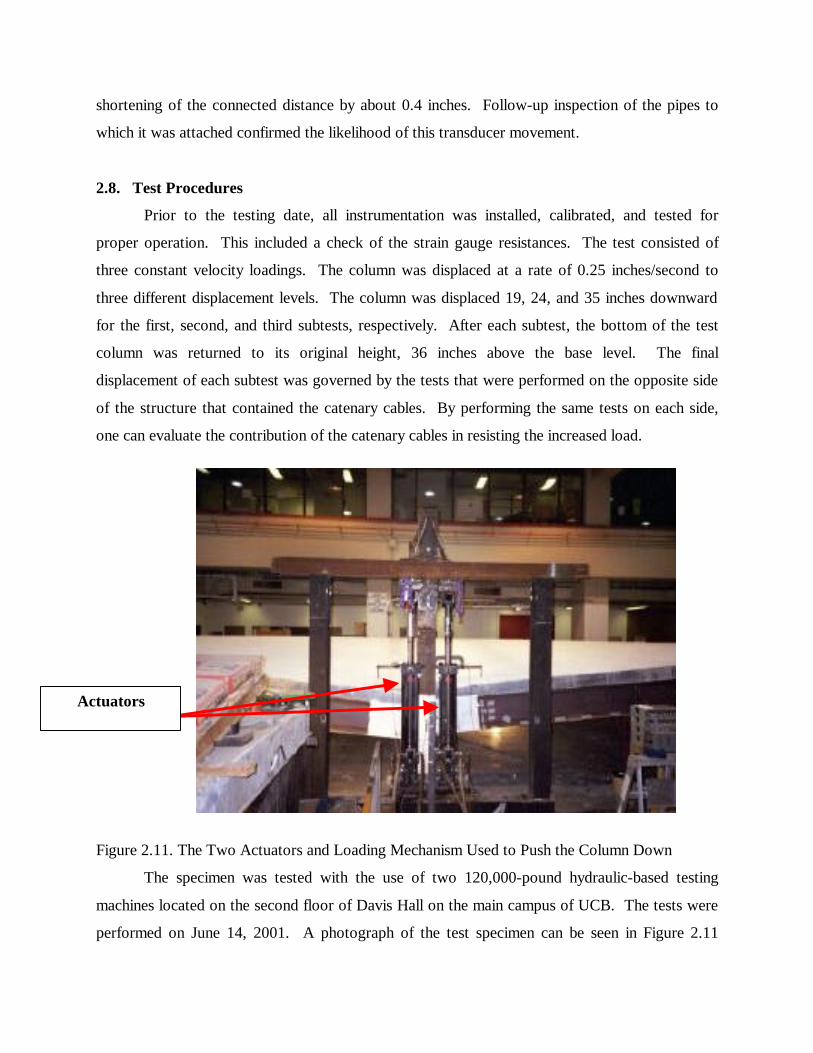
Figure 2.11. The Two Actuators and Loading Mechanism Used to Push the Column Down
The specimen was tested with the use of two 120,000-pound hydraulic-based testing
machines located on the second floor of Davis Hall on the main campus of UCB. The tests were
performed on June 14, 2001. A photograph of the test specimen can be seen in Figure 2.11
Actuators

showing the loading actuators that were used to push the floor down. In order to remove the 36
inch support column, the actuators were raised a slight amount, leaving a gap slightly greater
than 36 inch between the bottom of the column and the base of the floor. Once the column
support was removed, the specimen was ready to be tested at the prescribed column
displacements.
CHAPTER THREE
Observed Behavior and Test Results
This chapter summarizes the test results and observed behavior of the test specimen. A
complete set of test results and data recorded during the tests is provided in Appendix B.
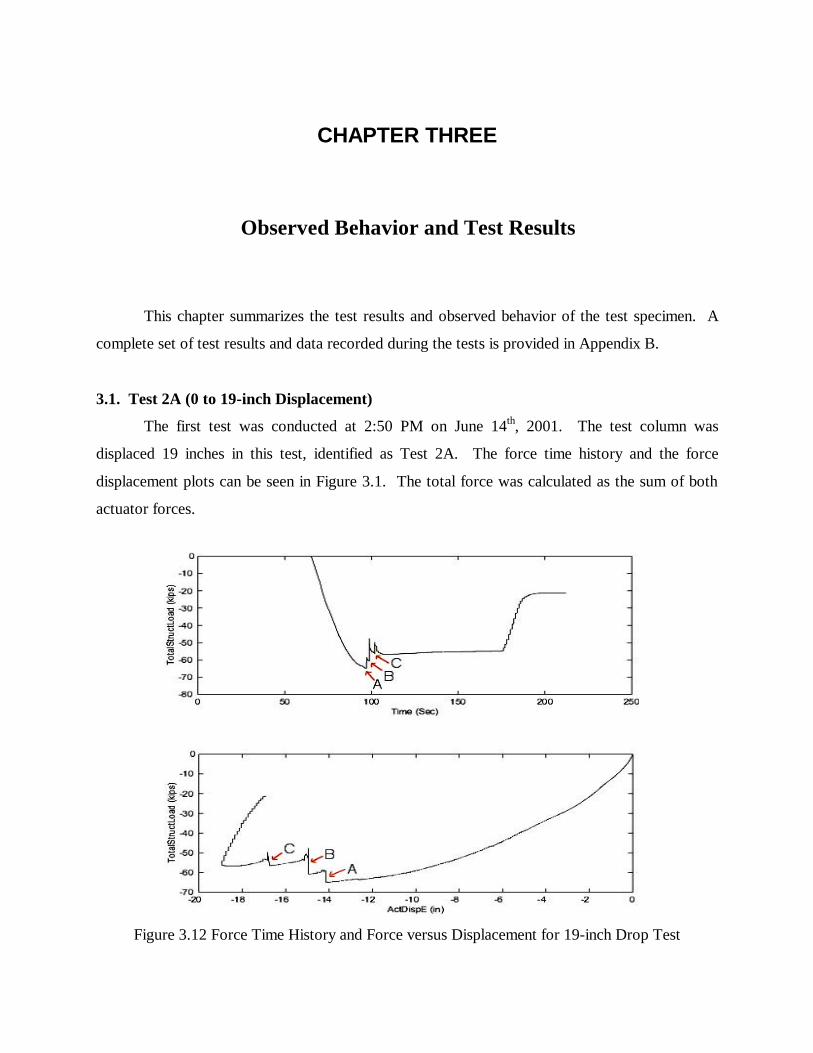
3.1. Test 2A (0 to 19-inch Displacement)
The first test was conducted at 2:50 PM on June 14th, 2001. The test column was
displaced 19 inches in this test, identified as Test 2A. The force time history and the force
displacement plots can be seen in Figure 3.1. The total force was calculated as the sum of both
actuator forces.
Figure 3.12 Force Time History and Force versus Displacement for 19-inch Drop Test
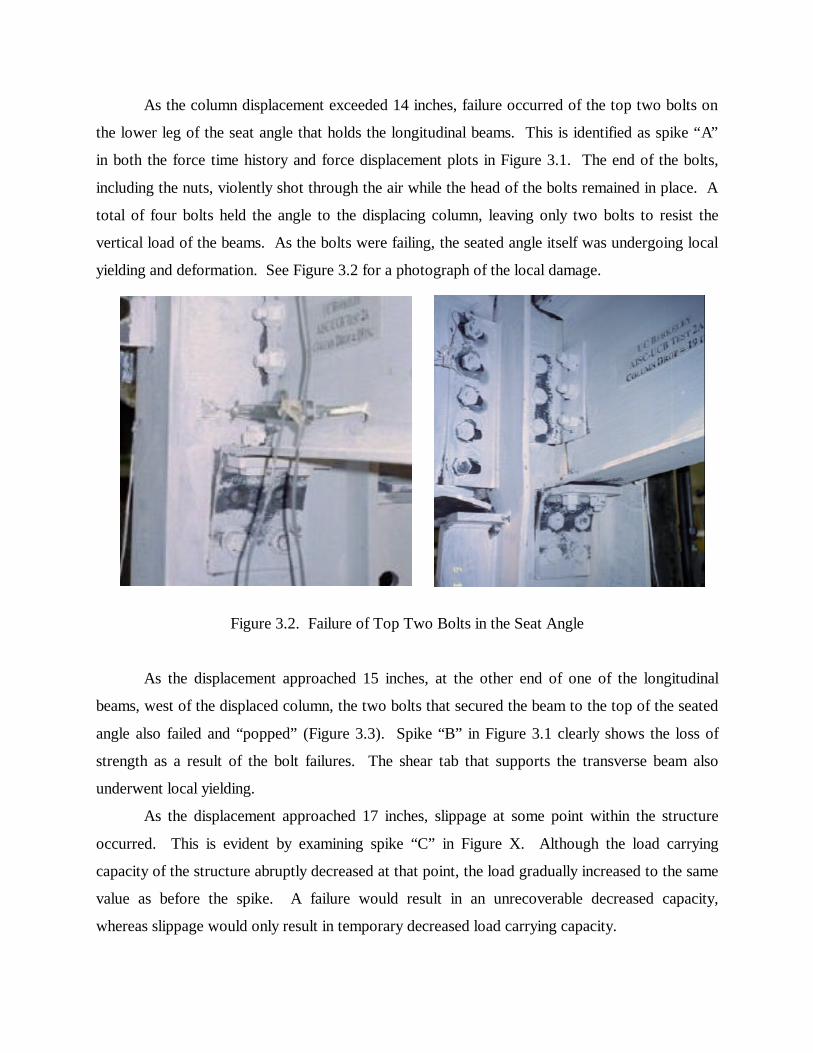
As the column displacement exceeded 14 inches, failure occurred of the top two bolts on
the lower leg of the seat angle that holds the longitudinal beams. This is identified as spike “A”
in both the force time history and force displacement plots in Figure 3.1. The end of the bolts,
including the nuts, violently shot through the air while the head of the bolts remained in place. A
total of four bolts held the angle to the displacing column, leaving only two bolts to resist the
vertical load of the beams. As the bolts were failing, the seated angle itself was undergoing local
yielding and deformation. See Figure 3.2 for a photograph of the local damage.
Figure 3.2. Failure of Top Two Bolts in the Seat Angle
As the displacement approached 15 inches, at the other end of one of the longitudinal
beams, west of the displaced column, the two bolts that secured the beam to the top of the seated
angle also failed and “popped” (Figure 3.3). Spike “B” in Figure 3.1 clearly shows the loss of
strength as a result of the bolt failures. The shear tab that supports the transverse beam also
underwent local yielding.
As the displacement approached 17 inches, slippage at some point within the structure
occurred. This is evident by examining spike “C” in Figure X. Although the load carrying
capacity of the structure abruptly decreased at that point, the load gradually increased to the same
value as before the spike. A failure would result in an unrecoverable decreased capacity,
whereas slippage would only result in temporary decreased load carrying capacity.
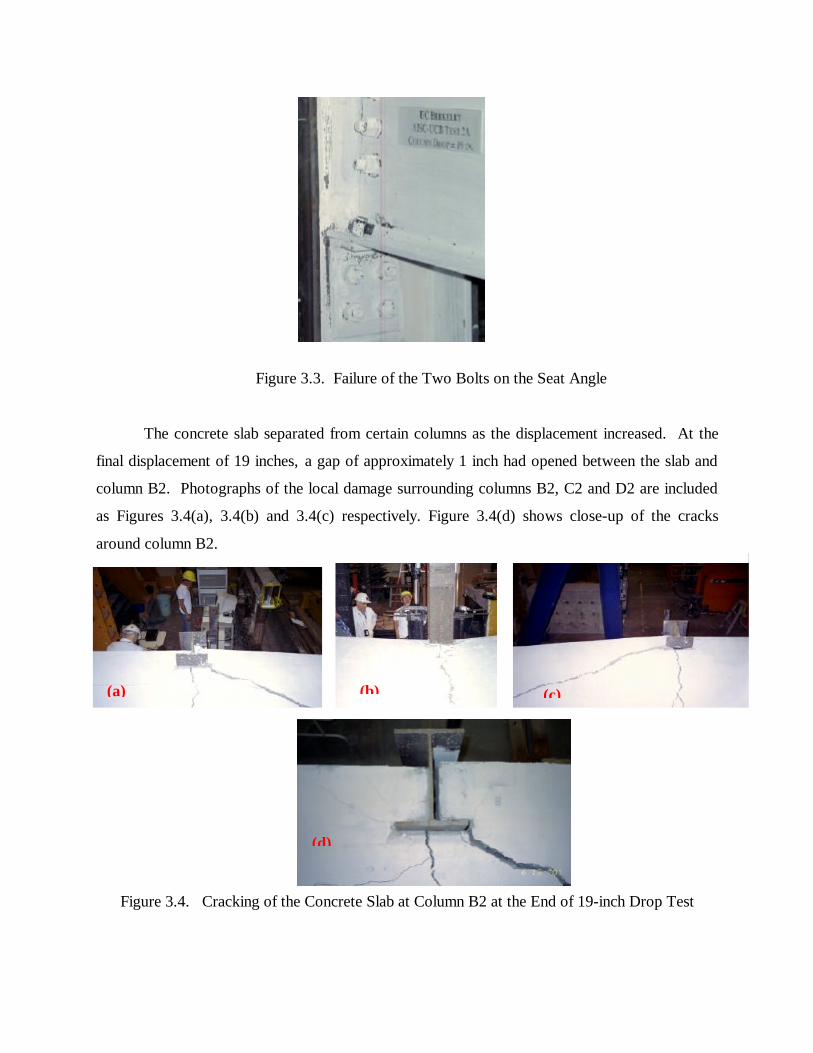
Figure 3.3. Failure of the Two Bolts on the Seat Angle
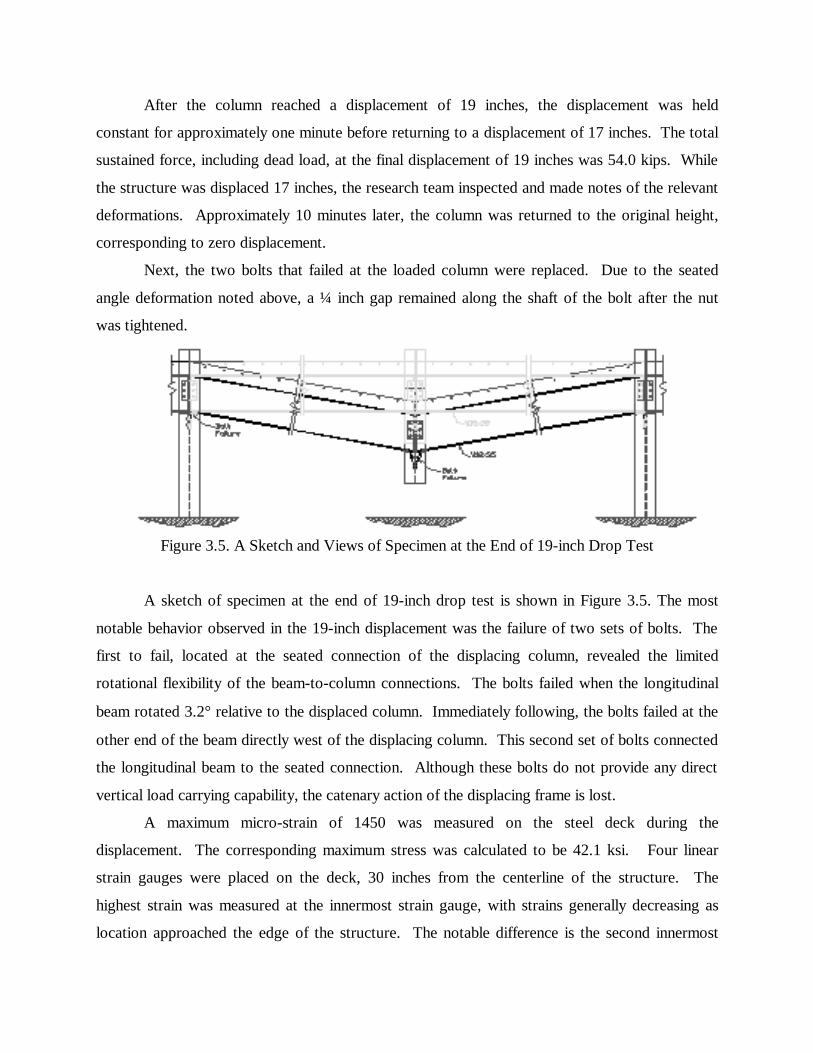
The concrete slab separated from certain columns as the displacement increased. At the
final displacement of 19 inches, a gap of approximately 1 inch had opened between the slab and
column B2. Photographs of the local damage surrounding columns B2, C2 and D2 are included
as Figures 3.4(a), 3.4(b) and 3.4(c) respectively. Figure 3.4(d) shows close-up of the cracks
around column B2.
Figure 3.4. Cracking of the Concrete Slab at Column B2 at the End of 19-inch Drop Test
(d)
(a) (b) (c)
After the column reached a displacement of 19 inches, the displacement was held
constant for approximately one minute before returning to a displacement of 17 inches. The total
sustained force, including dead load, at the final displacement of 19 inches was 54.0 kips. While
the structure was displaced 17 inches, the research team inspected and made notes of the relevant
deformations. Approximately 10 minutes later, the column was returned to the original height,
corresponding to zero displacement.
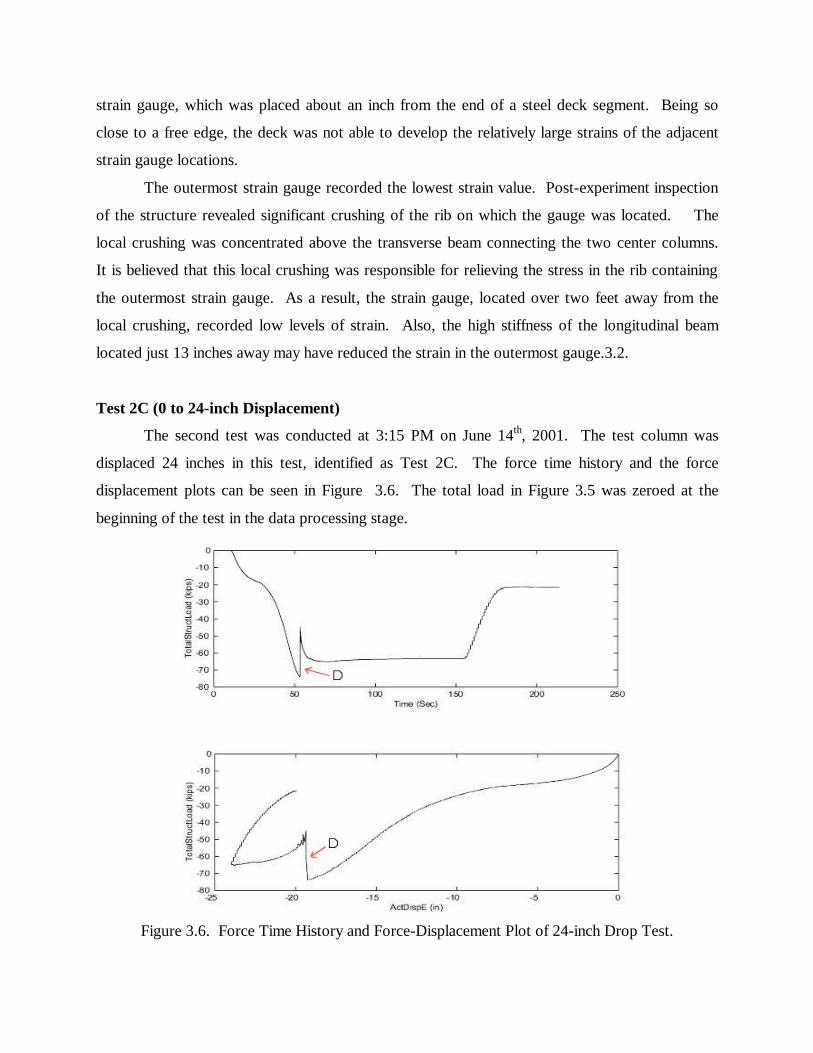
Next, the two bolts that failed at the loaded column were replaced. Due to the seated
angle deformation noted above, a ¼ inch gap remained along the shaft of the bolt after the nut
was tightened.
Figure 3.5. A Sketch and Views of Specimen at the End of 19-inch Drop Test
A sketch of specimen at the end of 19-inch drop test is shown in Figure 3.5. The most
notable behavior observed in the 19-inch displacement was the failure of two sets of bolts. The
first to fail, located at the seated connection of the displacing column, revealed the limited
rotational flexibility of the beam-to-column connections. The bolts failed when the longitudinal
beam rotated 3.2° relative to the displaced column. Immediately following, the bolts failed at the
other end of the beam directly west of the displacing column. This second set of bolts connected
the longitudinal beam to the seated connection. Although these bolts do not provide any direct
vertical load carrying capability, the catenary action of the displacing frame is lost.
A maximum micro-strain of 1450 was measured on the steel deck during the
displacement. The corresponding maximum stress was calculated to be 42.1 ksi. Four linear
strain gauges were placed on the deck, 30 inches from the centerline of the structure. The
highest strain was measured at the innermost strain gauge, with strains generally decreasing as
location approached the edge of the structure. The notable difference is the second innermost
strain gauge, which was placed about an inch from the end of a steel deck segment. Being so
close to a free edge, the deck was not able to develop the relatively large strains of the adjacent
strain gauge locations.
The outermost strain gauge recorded the lowest strain value. Post-experiment inspection
of the structure revealed significant crushing of the rib on which the gauge was located. The
local crushing was concentrated above the transverse beam connecting the two center columns.
It is believed that this local crushing was responsible for relieving the stress in the rib containing
the outermost strain gauge. As a result, the strain gauge, located over two feet away from the
local crushing, recorded low levels of strain. Also, the high stiffness of the longitudinal beam
located just 13 inches away may have reduced the strain in the outermost gauge.3.2.
Test 2C (0 to 24-inch Displacement)
The second test was conducted at 3:15 PM on June 14th, 2001. The test column was
displaced 24 inches in this test, identified as Test 2C. The force time history and the force
displacement plots can be seen in Figure 3.6. The total load in Figure 3.5 was zeroed at the
beginning of the test in the data processing stage.
Figure 3.6. Force Time History and Force-Displacement Plot of 24-inch Drop Test.
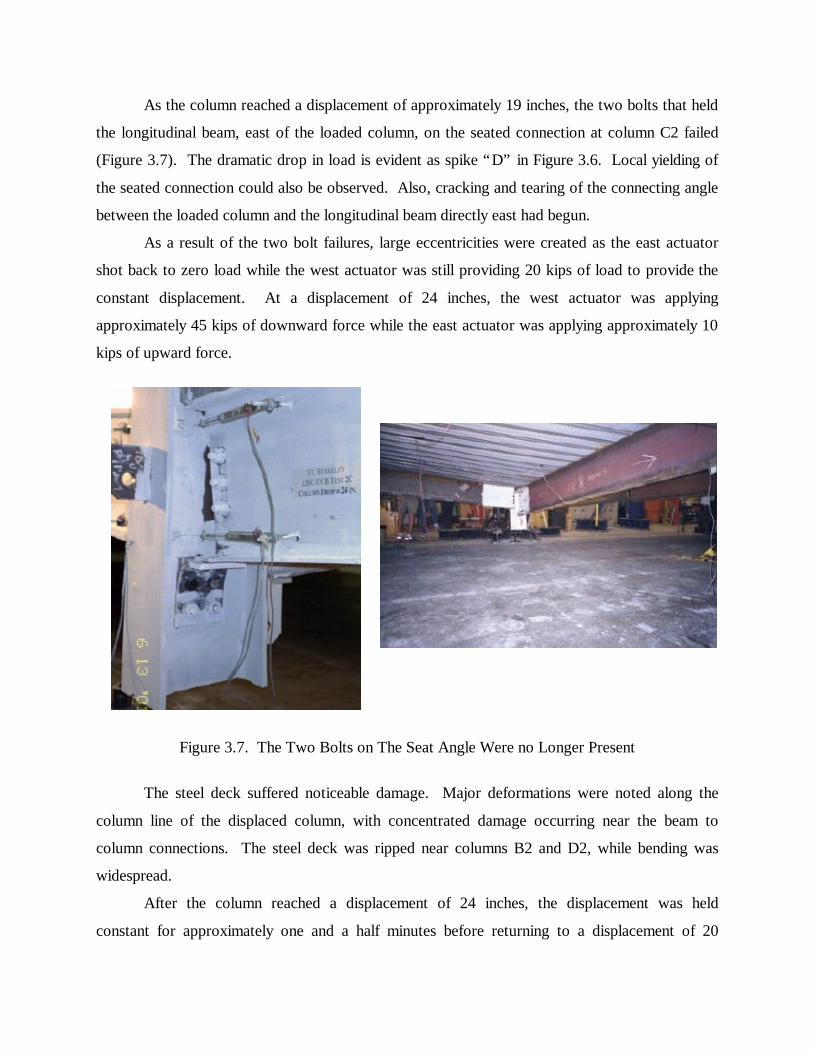
As the column reached a displacement of approximately 19 inches, the two bolts that held
the longitudinal beam, east of the loaded column, on the seated connection at column C2 failed
(Figure 3.7). The dramatic drop in load is evident as spike “D” in Figure 3.6. Local yielding of
the seated connection could also be observed. Also, cracking and tearing of the connecting angle
between the loaded column and the longitudinal beam directly east had begun.
As a result of the two bolt failures, large eccentricities were created as the east actuator
shot back to zero load while the west actuator was still providing 20 kips of load to provide the
constant displacement. At a displacement of 24 inches, the west actuator was applying
approximately 45 kips of downward force while the east actuator was applying approximately 10
kips of upward force.
Figure 3.7. The Two Bolts on The Seat Angle Were no Longer Present
The steel deck suffered noticeable damage. Major deformations were noted along the
column line of the displaced column, with concentrated damage occurring near the beam to
column connections. The steel deck was ripped near columns B2 and D2, while bending was
widespread.
After the column reached a displacement of 24 inches, the displacement was held
constant for approximately one and a half minutes before returning to a displacement of 20
inches. The total sustained force, including dead load, at the final displacement of 24 inches was
62.8 kips. While the structure was displaced 20 inches, the research team inspected and made
notes of the relevant deformations. Approximately 10 minutes later, the column was returned to
the original height, corresponding to zero displacement.
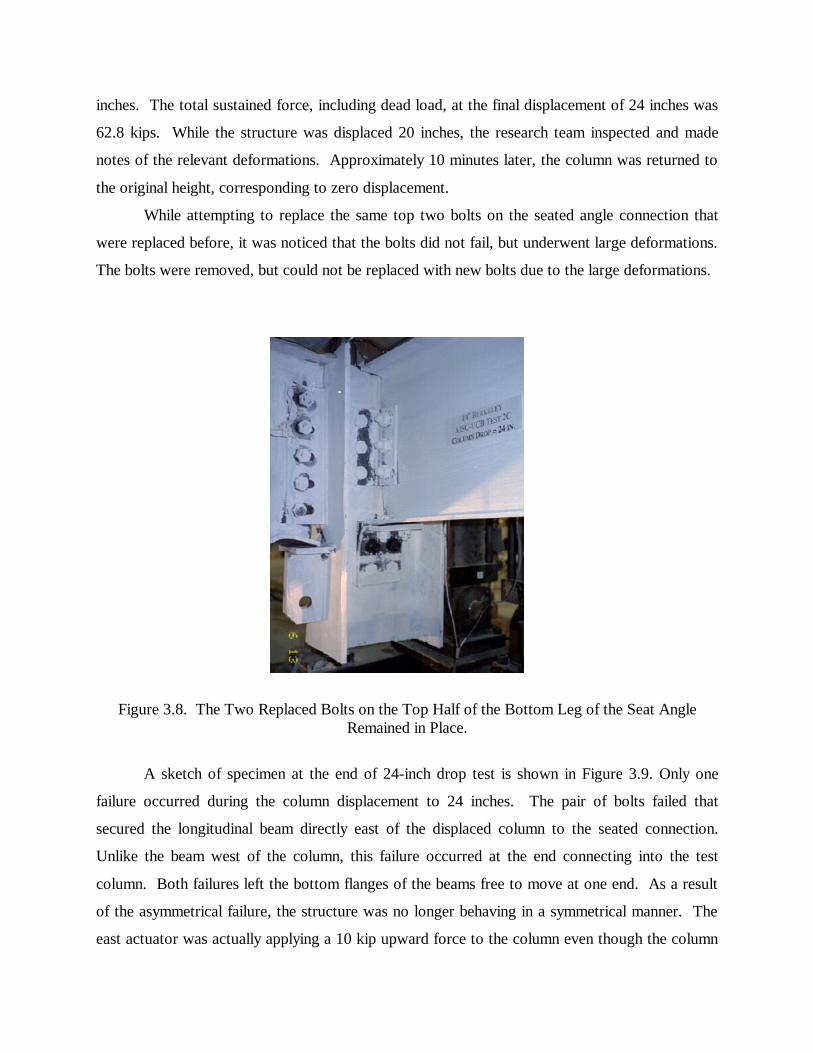
While attempting to replace the same top two bolts on the seated angle connection that
were replaced before, it was noticed that the bolts did not fail, but underwent large deformations.
The bolts were removed, but could not be replaced with new bolts due to the large deformations.
Figure 3.8. The Two Replaced Bolts on the Top Half of the Bottom Leg of the Seat Angle Remained in Place.
A sketch of specimen at the end of 24-inch drop test is shown in Figure 3.9. Only one
failure occurred during the column displacement to 24 inches. The pair of bolts failed that
secured the longitudinal beam directly east of the displaced column to the seated connection.
Unlike the beam west of the column, this failure occurred at the end connecting into the test
column. Both failures left the bottom flanges of the beams free to move at one end. As a result
of the asymmetrical failure, the structure was no longer behaving in a symmetrical manner. The
east actuator was actually applying a 10 kip upward force to the column even though the column
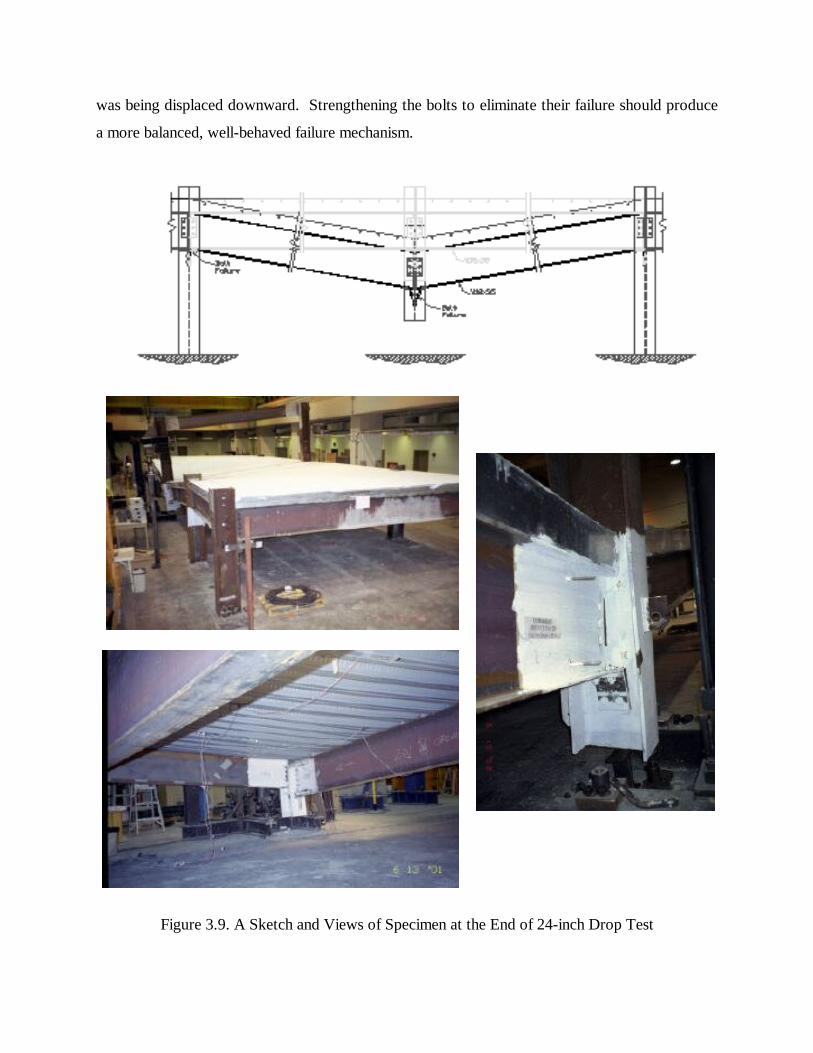
was being displaced downward. Strengthening the bolts to eliminate their failure should produce
a more balanced, well-behaved failure mechanism.
Figure 3.9. A Sketch and Views of Specimen at the End of 24-inch Drop Test

The force-displacement plot (Figure 3.6) shows a gradual stiffening of the structure once
the displacement passes 5 inches. This results from the replacement of the two bolts in the
seated connection at the displaced column. The ¼ inch gap that remained after the replacement
affected the behavior of the structure. As the bolts adjusted to the gap and engaged themselves,
the structure became stiffer.
A maximum micro-strain of 1560 was measured during the displacement. The
corresponding maximum stress was calculated to be 45.2 ksi. See Appendix B for the maximum
calculated stresses at the instrumentation locations. The strains for this second subtest include
any residual strains that existed within the gauges after the column was returned to a position of
zero displacement. As before, the innermost of the four linear strain gauges placed on the deck
recorded the highest strain. The strain generally decreased as the edge of the structure was
approached with the exceptions noted above.
3.3. Test 2D (0 to 35-inch Displacement)
The third test was conducted at 4:10 PM on June 14th, 2001. The test column was
displaced 35 inches in this test, identified as Test 2D. The force time history and the force
displacement plots can be seen in Figure 3.10. The total load in Figure 3.8 was zeroed at the
beginning of the test in the data processing stage.
In addition to the above noted behavior, as the column displacement approached 26
inches, complete failure occurred of the connecting angle between the loaded column and the
longitudinal beam directly east (Figure 3.10). Spike “F” in Figure 3.8 shows the sudden drop in
load after the angle failure. The preceding spike, labeled “E,” is evidence of slippage within the
structure, possibly within the angle before complete failure.
After the angle had failed, the concrete slab was the primary element transferring the
applied force to the longitudinal beam directly east of the displacing column. Unable to maintain
this force transfer, the slab failed in shear along the transverse beam connecting the two central
columns. This is represented by spike “G” in Figure 3.10.
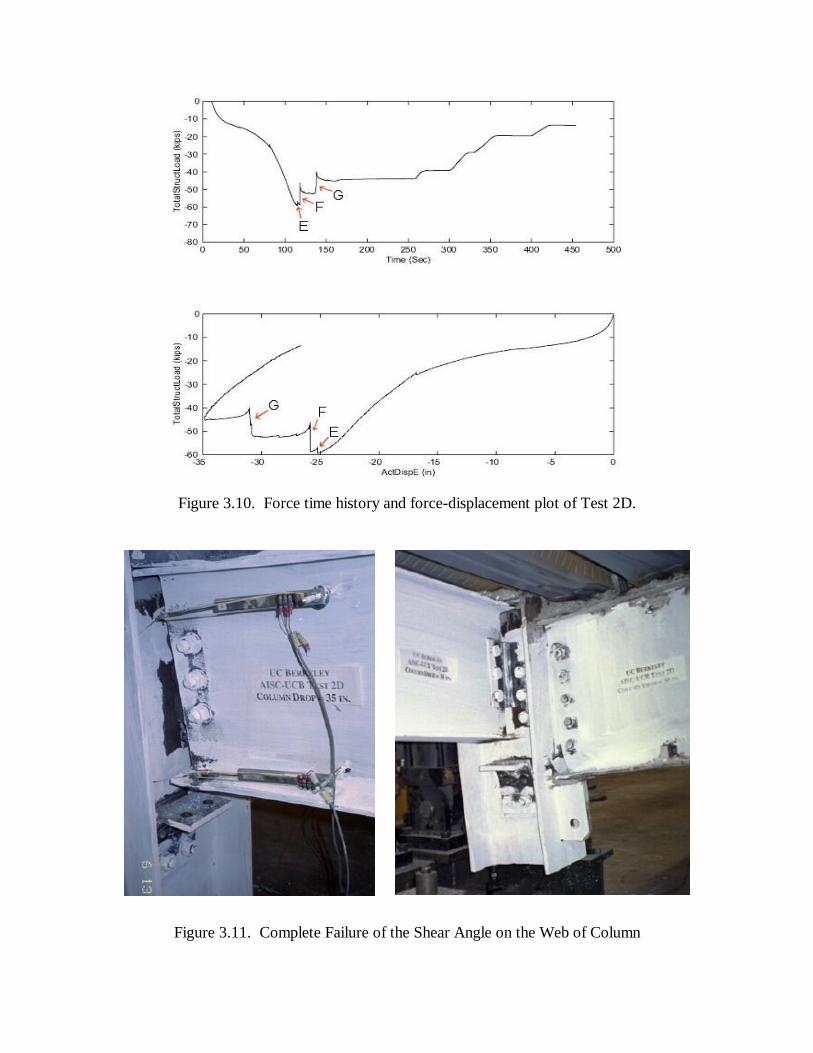
Figure 3.10. Force time history and force-displacement plot of Test 2D.
Figure 3.11. Complete Failure of the Shear Angle on the Web of Column
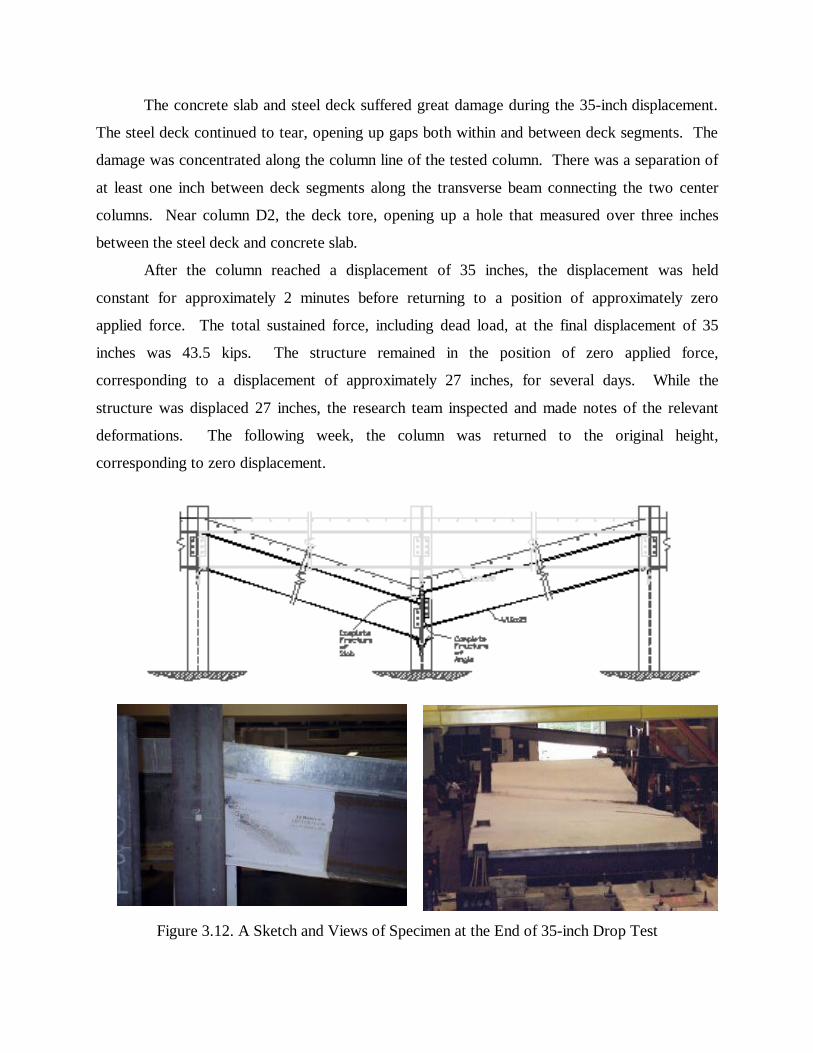
The concrete slab and steel deck suffered great damage during the 35-inch displacement.
The steel deck continued to tear, opening up gaps both within and between deck segments. The
damage was concentrated along the column line of the tested column. There was a separation of
at least one inch between deck segments along the transverse beam connecting the two center
columns. Near column D2, the deck tore, opening up a hole that measured over three inches
between the steel deck and concrete slab.
After the column reached a displacement of 35 inches, the displacement was held
constant for approximately 2 minutes before returning to a position of approximately zero
applied force. The total sustained force, including dead load, at the final displacement of 35
inches was 43.5 kips. The structure remained in the position of zero applied force,
corresponding to a displacement of approximately 27 inches, for several days. While the
structure was displaced 27 inches, the research team inspected and made notes of the relevant
deformations. The following week, the column was returned to the original height,
corresponding to zero displacement.
Figure 3.12. A Sketch and Views of Specimen at the End of 35-inch Drop Test
In addition to the above noted failures, two additional component failures occurred
during the 35-inch displacement. First, failure occurred of the connecting angle between the test
column and the longitudinal beam directly east. The concrete slab was left as the only remaining
component to transfer the applied force of the actuators to the east side of the structure. Unable
to provide this force transfer, the concrete slab failed in shear.
A maximum micro-strain of 1340 was measured during the displacement. The
corresponding maximum stress was calculated to be 38.9 ksi. See Figure X for the maximum
calculated stresses at the instrumentation locations. The gauge readings include any residual
stress that remained in the deck after the column was returned to zero displacement following the
previous test. Once again, the innermost of the four linear strain gauges placed on the deck
recorded the highest strain. The strain generally decreased as the edge of the structure was
approached with the exceptions noted above.
3.4. Summary of the Behavior and Results
Of the three subtests, the 24-inch displacement sustained the highest load of 62.8 kips.
The 19-inch and 35-inch test sustained 54.0 and 43.5 kips of loading, respectively. Figure X
provides a graph of the force-displacement relation of the three tests. As can be seen in the
figure, a maximum load is reached at a displacement somewhere between 19 and 35 inches.
The load-displacement plots of all three tests are included on one plot in Figure 3.13.
The proximity of all five component failures can easily be seen, beginning with the initial bolt
failures and ending with the complete transverse cracking of the floor slab. Also, the stiffness
degradation of the system is evident as the same load results greater displacements in the
following tests. The capacity of the structure was reached just before failure of the pair of bolts
that secured the east beam onto the seated connection at the test column. This failure, occurring
during Test 2c, resulted in the largest drop in applied load.

Figure 3.13. Force-Displacement Plot of the Three Tests.
0
10
20
30
40
50
60
70
0 5 10 15 20 25 30 35 40
Displacement (inches)
Forc
e (k
ips)

CHAPTER FOUR
Conclusions and Recommendations
4.1. Conclusions
The following conclusions were reached by observing the behavior of the test specimen
and by studying test data obtained.
1. The ultimate capacity of the structure following a loss of column is limited by the beam-
to-column connections at the lost column. The catenary action of the beams and steel
deck appear to be adequate to prevent progressive collapse provided that connection bolts
do not prematurely fail.
2. The steel deck is effective in redistributing the increased load resulting from the loss of a
column. Maximum stress readings during the tests were mostly between 5 and 15 ksi,
however, localized small areas of deck yielded. Failure of the steel deck through ripping
or tearing was isolated and did not limit the strength of the system.
3. The combined Catenary action of floor steel deck and the simply-supported girders was
able to prevent collapse of column with a load of about 63 kips in the column. This load
corresponds to about 300 kips per square feet of tributary area of the floor. Considering a
reduction factor of 0.5 due to impact, the floor load that was carried by Catenary action
could be established as about 150 pound per square feet of tributary area.
4. This one test only established the potential of typical steel structures to resist progressive
collapse in the event of sudden removal of a column. Further research is needed to
establish the parameters that affect this resistance and to develop appropriate design
guidelines to take advantage of this phenomenon in preventing collapse of structures.
5.2. Recommendations
The following recommendations are based on the observed behavior of the test specimen
and by studying test data obtained. Each recommendation is directly related to one of the
observed failure mechanisms.
1. Connection bolts should be strengthened to improve structure behavior in a loss of
column scenario. The bolt failures observed in the experiments led to greater specimen
deformations and resulted in failure of a beam-to-column angle connection. High-
strength bolts and/or larger sized bolts would improve the behavior of the system with
little additional cost.
2. Placing reinforcement bars within the concrete slab could postpone and possibly
eliminate complete cracking of the slab. The bars could be placed along the column lines
of any frames susceptible to blast loads. The additional steel cross section should prevent
complete shear fracturing of the floor slab.
3. The connections should be designed for combined effects of bending and axial load due
to Catenary forces. Guidelines for design of such connections can be developed upon
further research, experimental or analytical, and better understanding of magnitude of
forces and rotations involved. The first author will continue efforts in that direction.
BIBLIOGRAPHY ASCE, (1996). “The Oklahoma City Bombing: Improving Building Performance Through Multi-Hazard Mitigation.” FEMA 277. Federal Emergency Management Agency Mitigation Directorate. Reston, VA. Auster, B. (2000). “Striking Back at Terrorism.” Prism, American Society of engineering Education, Feb., 17-21 Baker, J.F., Lax, D. & Williams, E.L. (1948). “The Civil Engineer at War.” The Institution of Civil Engineers. London, England. Brokaw, J.T., Smith, J.L. & Swatzell, S.R. (1998). “Progressive Collapse Analysis and Design Guidance: Summary Report Documenting the Literature Review Findings.” Volume I. Applied Research Associates, Inc. ARA-TR-98-4854-1 Davis, R. (1998). “COMBATING TERRORISM: Observations on Crosscutting Issues.” Testimony Before the Subcommittee on National Security, International Affairs and Criminal Justice, Committee on Government Reform and Oversight, House of Representatives. GAO/T-NSIAD-98-164 Ettouney, M. and DiMaggio, P. (1998). “Integrated Study of Progressive Collapse of Buildings.” Paper from Structural Engineers World Congress. P312-4, ISBN:0-08-042845-2. Elsevier Science Ltd. Ettouney, M., Smilowitz, R. and Daddazio, R. (1998). “Comparison Between Design Requirements of Earthquake and Blast Events.” Paper from Structural Engineers World Congress. T210-1, ISBN:0-08-042845-2. Elsevier Science Ltd. Federal Emergency Management Agency. (1994). NEHRP (National Earthquake Hazards Reduction Program) Recommended Provisions for Seismic Regulations for New Buildings, Government Printing Office, Washington, DC Feld, J. and Carper, K. L. (1997). “Precast and Prestressed Concrete Structures.” Construction Failure, John Wiley & Sons, Inc., New York, NY., 9, 302-306 G.A.O. (1998). “COMBATING TERRORISM: Threat and Risk Assessments Can Help Prioritize and Target Program Investments.” U.S.G.A.O. Report to Congressional Requesters. GAO/NSIAD-98-74
Levy, M. and Salvadori, M. (1992). “Big Bangs.” Why Buildings Fall Down, W.W. Norton & Co., New York, NY., 76-83. National Research Council. (2000). “Blast Mitigation for Structures.” 1999 Status Report on the DTRA/TSWG Program. National Academy Press. Washington, D.C. Sunshine, D. A. (1998). “Protection of Structures Subjected to Explosions.” Structural Engineering World Wide 1998. T210-5, ISBN:0-08-042845-2. Elsevier Science Ltd. Ungar, B. L. (1998). “Many Building Security upgrades Made But Problems Have Hindered Program Implementation.” U.S.G.A.O. GSA - Testimony before the Subcommittee on Public Buildings and Economic Development, Committee on Transportation and Infrastructure, House of Representatives. GAO/T-GGD-98-141 Wearne, P. (1999). “Progressive Collapse, Progressive Security: Oklahoma City” and “Faulty Towers: Ronan Point.” Collapse: When Buildings Fall Down, TV Books, New York, NY., 117-156.

APPENDIX A
This appendix provides a copy of shop drawings that were developed by Herrick
corporation during the fabrication of the specimens.
The drawings will be added to final report after AISC Review is complete. A. A.

APPENDIX B This Appendix provides plots of all test data channels and information that was collected during
the tests.
The plots are ready and will be added to final report after AISC Review is complete. A. A.