Progressive 2008-Financial Review
78
The Progressive Corporation 2008 Annual Report to Shareholders review }
-
Upload
finance18 -
Category
Economy & Finance
-
view
96 -
download
0
Transcript of Progressive 2008-Financial Review

The Progressive Corporation
2008 Annual Report to Shareholders
review }

THE PROGRESSIVE CORPORATION
2008 ANNUAL REPORT TO SHAREHOLDERS
AnnualR
eportApp.-A-1
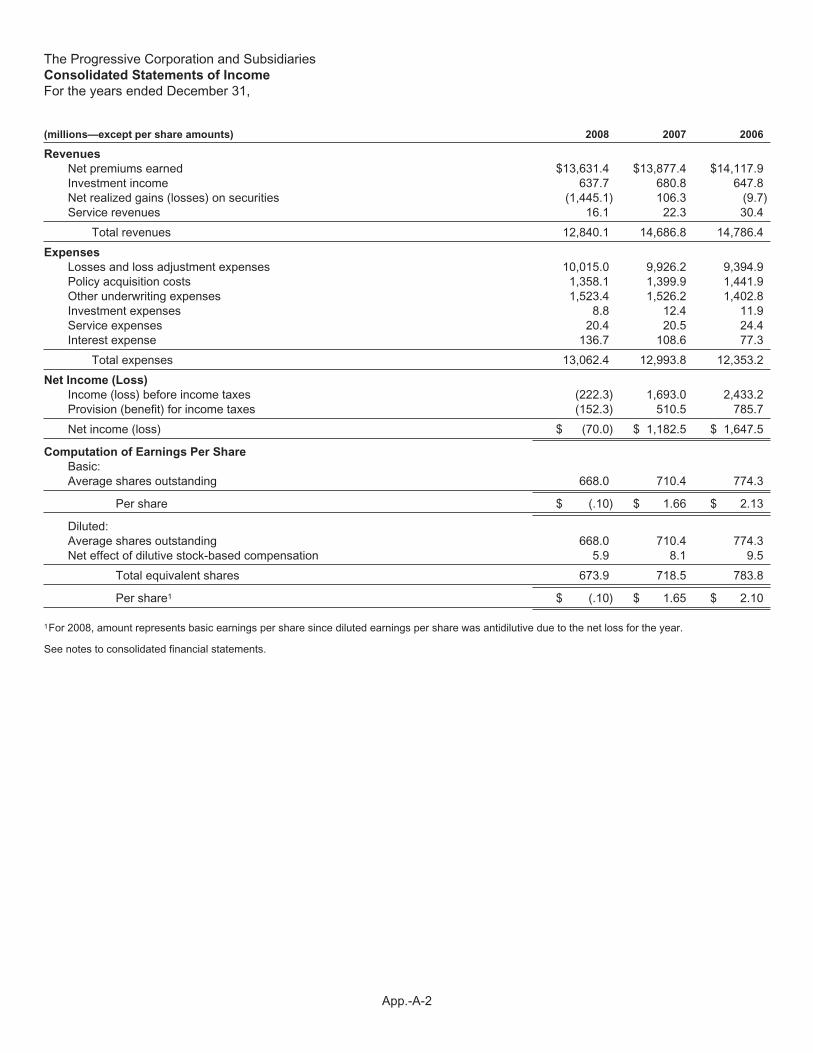
The Progressive Corporation and SubsidiariesConsolidated Statements of Income
For the years ended December 31,
(millions—except per share amounts) 2008 2007 2006
Revenues
Net premiums earned $13,631.4 $13,877.4 $14,117.9Investment income 637.7 680.8 647.8Net realized gains (losses) on securities (1,445.1) 106.3 (9.7)Service revenues 16.1 22.3 30.4
Total revenues 12,840.1 14,686.8 14,786.4
Expenses
Losses and loss adjustment expenses 10,015.0 9,926.2 9,394.9Policy acquisition costs 1,358.1 1,399.9 1,441.9Other underwriting expenses 1,523.4 1,526.2 1,402.8Investment expenses 8.8 12.4 11.9Service expenses 20.4 20.5 24.4Interest expense 136.7 108.6 77.3
Total expenses 13,062.4 12,993.8 12,353.2
Net Income (Loss)
Income (loss) before income taxes (222.3) 1,693.0 2,433.2Provision (benefit) for income taxes (152.3) 510.5 785.7
Net income (loss) $ (70.0) $ 1,182.5 $ 1,647.5
Computation of Earnings Per Share
Basic:Average shares outstanding 668.0 710.4 774.3
Per share $ (.10) $ 1.66 $ 2.13
Diluted:Average shares outstanding 668.0 710.4 774.3Net effect of dilutive stock-based compensation 5.9 8.1 9.5
Total equivalent shares 673.9 718.5 783.8
Per share1 $ (.10) $ 1.65 $ 2.10
1For 2008, amount represents basic earnings per share since diluted earnings per share was antidilutive due to the net loss for the year.
See notes to consolidated financial statements.
App.-A-2

The Progressive Corporation and SubsidiariesConsolidated Balance Sheets
December 31,
(millions) 2008 2007
Assets
Investments—Available-for-sale, at fair value:Fixed maturities (amortized cost: $10,295.3 and $9,135.6) $ 9,946.7 $ 9,184.9Equity securities:
Nonredeemable preferred stocks (cost: $1,131.3 and $2,578.1) 1,150.0 2,270.3Common equities (cost: $553.6 and $1,361.0) 727.8 2,327.5
Short-term investments (amortized cost: $1,153.6 and $382.4) 1,153.6 382.4
Total investments 12,978.1 14,165.1Cash 2.9 5.8Accrued investment income 125.7 142.1Premiums receivable, net of allowance for doubtful accounts of $113.7 and $118.1 2,408.6 2,395.1Reinsurance recoverables, including $44.0 and $47.6 on paid losses 288.5 335.1Prepaid reinsurance premiums 62.4 69.8Deferred acquisition costs 414.0 426.3Income taxes 821.6 106.0Property and equipment, net of accumulated depreciation of $653.6 and $605.7 997.1 1,000.4Other assets 151.6 197.4
Total assets $18,250.5 $18,843.1
Liabilities and Shareholders’ Equity
Unearned premiums $ 4,175.9 $ 4,210.4Loss and loss adjustment expense reserves 6,177.4 5,942.7Accounts payable, accrued expenses, and other liabilities1 1,506.4 1,580.6Debt2 2,175.5 2,173.9
Total liabilities 14,035.2 13,907.6
Common Shares, $1.00 par value (authorized 900.0; issued 797.9 and 798.1, including treasury shares of 121.4and 117.9) 676.5 680.2
Paid-in capital 892.9 834.8Accumulated other comprehensive income (loss):
Net unrealized gains (losses) on securities (76.8) 465.0Net unrealized gains on forecasted transactions 24.9 27.8
Retained earnings 2,697.8 2,927.7
Total shareholders’ equity 4,215.3 4,935.5
Total liabilities and shareholders’ equity $18,250.5 $18,843.1
1See Note 12 – Litigation and Note 13 – Commitments and Contingencies for further discussion.
2Consists of long-term debt. See Note 4 – Debt for further discussion.
See notes to consolidated financial statements.
App.-A-3
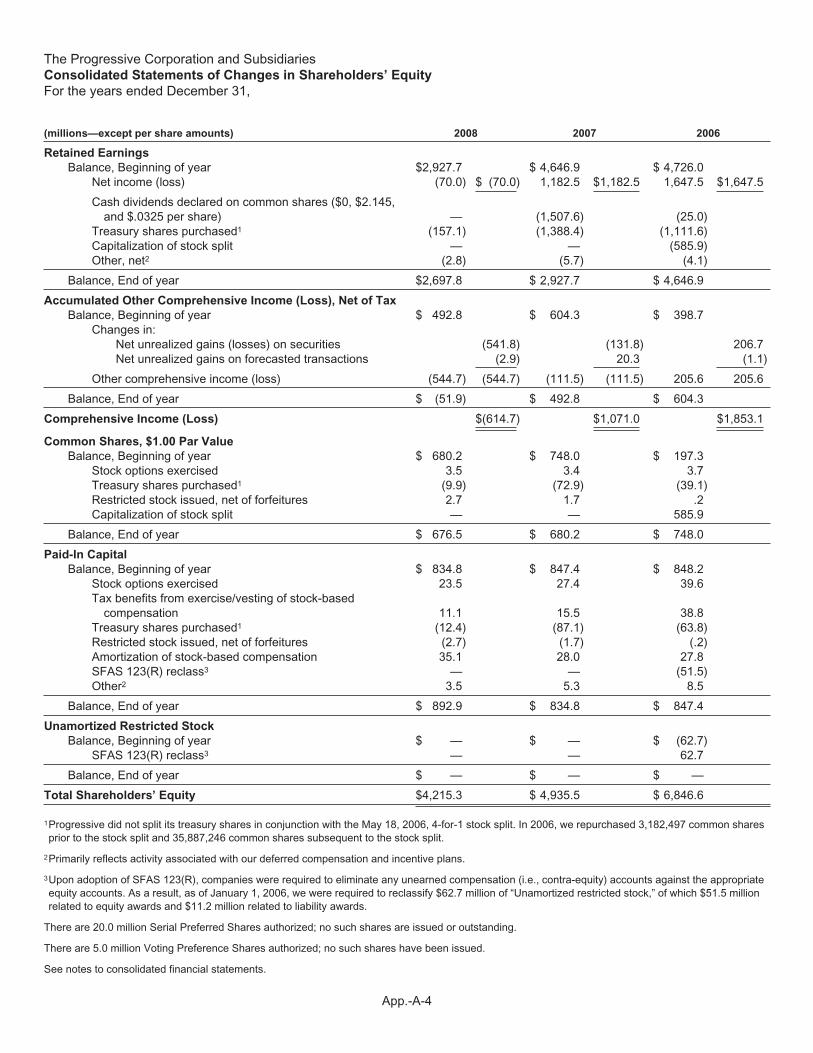
The Progressive Corporation and SubsidiariesConsolidated Statements of Changes in Shareholders’ Equity
For the years ended December 31,
(millions—except per share amounts) 2008 2007 2006
Retained Earnings
Balance, Beginning of year $2,927.7 $ 4,646.9 $ 4,726.0Net income (loss) (70.0) $ (70.0) 1,182.5 $1,182.5 1,647.5 $1,647.5
Cash dividends declared on common shares ($0, $2.145,and $.0325 per share) — (1,507.6) (25.0)
Treasury shares purchased1 (157.1) (1,388.4) (1,111.6)Capitalization of stock split — — (585.9)Other, net2 (2.8) (5.7) (4.1)
Balance, End of year $2,697.8 $ 2,927.7 $ 4,646.9
Accumulated Other Comprehensive Income (Loss), Net of Tax
Balance, Beginning of year $ 492.8 $ 604.3 $ 398.7Changes in:
Net unrealized gains (losses) on securities (541.8) (131.8) 206.7Net unrealized gains on forecasted transactions (2.9) 20.3 (1.1)
Other comprehensive income (loss) (544.7) (544.7) (111.5) (111.5) 205.6 205.6
Balance, End of year $ (51.9) $ 492.8 $ 604.3
Comprehensive Income (Loss) $(614.7) $1,071.0 $1,853.1
Common Shares, $1.00 Par Value
Balance, Beginning of year $ 680.2 $ 748.0 $ 197.3Stock options exercised 3.5 3.4 3.7Treasury shares purchased1 (9.9) (72.9) (39.1)Restricted stock issued, net of forfeitures 2.7 1.7 .2Capitalization of stock split — — 585.9
Balance, End of year $ 676.5 $ 680.2 $ 748.0
Paid-In Capital
Balance, Beginning of year $ 834.8 $ 847.4 $ 848.2Stock options exercised 23.5 27.4 39.6Tax benefits from exercise/vesting of stock-based
compensation 11.1 15.5 38.8Treasury shares purchased1 (12.4) (87.1) (63.8)Restricted stock issued, net of forfeitures (2.7) (1.7) (.2)Amortization of stock-based compensation 35.1 28.0 27.8SFAS 123(R) reclass3 — — (51.5)Other2 3.5 5.3 8.5
Balance, End of year $ 892.9 $ 834.8 $ 847.4
Unamortized Restricted Stock
Balance, Beginning of year $ — $ — $ (62.7)SFAS 123(R) reclass3 — — 62.7
Balance, End of year $ — $ — $ —
Total Shareholders’ Equity $4,215.3 $ 4,935.5 $ 6,846.6
1Progressive did not split its treasury shares in conjunction with the May 18, 2006, 4-for-1 stock split. In 2006, we repurchased 3,182,497 common sharesprior to the stock split and 35,887,246 common shares subsequent to the stock split.
2Primarily reflects activity associated with our deferred compensation and incentive plans.
3Upon adoption of SFAS 123(R), companies were required to eliminate any unearned compensation (i.e., contra-equity) accounts against the appropriateequity accounts. As a result, as of January 1, 2006, we were required to reclassify $62.7 million of “Unamortized restricted stock,” of which $51.5 millionrelated to equity awards and $11.2 million related to liability awards.
There are 20.0 million Serial Preferred Shares authorized; no such shares are issued or outstanding.
There are 5.0 million Voting Preference Shares authorized; no such shares have been issued.
See notes to consolidated financial statements.
App.-A-4

The Progressive Corporation and SubsidiariesConsolidated Statements of Cash Flows
For the years ended December 31,
(millions) 2008 2007 2006
Cash Flows From Operating Activities
Net income (loss) $ (70.0) $ 1,182.5 $ 1,647.5Adjustments to reconcile net income (loss) to net cash provided by operating activities:
Depreciation 99.1 106.9 103.4Amortization of fixed-income securities 249.6 284.1 225.6Amortization of stock-based compensation 34.5 26.5 27.6Net realized (gains) losses on securities 1,445.1 (106.3) 9.7Net loss on disposition of property and equipment 1.6 .4 .9Changes in:
Premiums receivable (13.5) 103.1 2.5Reinsurance recoverables 46.6 98.7 (28.1)Prepaid reinsurance premiums 7.4 19.7 14.2Deferred acquisition costs 12.3 14.7 3.8Income taxes (423.8) (30.3) 10.1Unearned premiums (34.5) (124.6) (.1)Loss and loss adjustment expense reserves 234.7 217.7 64.7Accounts payable, accrued expenses, and other liabilities (101.2) 2.4 7.1Other, net 61.3 (4.5) (64.3)
Net cash provided by operating activities 1,549.2 1,791.0 2,024.6
Cash Flows From Investing Activities
Purchases:Fixed maturities (7,593.9) (8,184.6) (6,294.9)Equity securities (598.3) (1,490.3) (1,131.6)Short-term investments—auction rate securities (631.5) (7,156.6) (2,999.3)
Sales:Fixed maturities 5,629.5 8,327.6 5,668.2Equity securities 1,401.0 775.2 323.1Short-term investments—auction rate securities 631.5 7,325.4 3,215.5
Maturities, paydowns, calls, and other:Fixed maturities 505.5 557.9 686.1Equity securities 34.9 10.7 223.5
Net sales (purchases) of short-term investments—other (771.0) 30.0 (22.3)Net unsettled security transactions 177.2 35.1 (116.6)Purchases of property and equipment (98.5) (136.3) (334.3)Sale of property and equipment 1.1 2.0 15.4
Net cash provided by (used in) investing activities (1,312.5) 96.1 (767.2)
Cash Flows From Financing Activities
Proceeds from exercise of stock options 27.0 30.8 43.3Tax benefits from exercise/vesting of stock-based compensation 11.1 15.5 38.8Proceeds from debt1 — 1,021.7 —Payment of debt — — (100.0)Dividends paid to shareholders (98.3) (1,406.5) (25.0)Acquisition of treasury shares (179.4) (1,548.4) (1,214.5)
Net cash used in financing activities (239.6) (1,886.9) (1,257.4)
Increase (decrease) in cash (2.9) .2 —Cash, Beginning of year 5.8 5.6 5.6
Cash, End of year $ 2.9 $ 5.8 $ 5.6
1Includes a $34.4 million pretax gain received upon closing a forecasted debt issuance hedge. See Note 4 – Debt for further discussion.
See notes to consolidated financial statements.
App.-A-5
The Progressive Corporation and SubsidiariesNotes to Consolidated Financial Statements
December 31, 2008, 2007, and 2006
1. REPORTING AND ACCOUNTING POLICIES
Nature of Operations The Progressive Corporation, an insurance holding company formed in 1965, owned 58 subsidiaries andhad 1 mutual insurance company affiliate as of December 31, 2008. Our insurance subsidiaries provide personal and commercialautomobile insurance and other specialty property-casualty insurance and related services throughout the United States. OurPersonal Lines segment writes insurance for private passenger automobiles and recreational vehicles through both anindependent insurance agency channel and a direct channel. Our Commercial Auto segment writes primary liability and physicaldamage insurance for automobiles and trucks owned by small businesses through both the independent agency and directchannels.
Basis of Consolidation and Reporting The accompanying consolidated financial statements include the accounts of TheProgressive Corporation, its subsidiaries, and affiliate. All of the subsidiaries and the mutual company affiliate are wholly ownedor controlled. We achieve control of our mutual company affiliate through a 100% reinsurance contract and a managementservice contract between a wholly-owned insurance subsidiary and such affiliate. All intercompany accounts and transactions areeliminated in consolidation.
Estimates We are required to make estimates and assumptions when preparing our financial statements and accompanyingnotes in conformity with accounting principles generally accepted in the United States of America (GAAP). As estimates developinto fact (e.g., losses are paid), results may, and will likely, differ from those estimates.
Investments Progressive’s fixed-maturity, equity securities, and short-term investments are accounted for on anavailable-for-sale basis. See Note 2 – Investments for the detailed composition of our investment portfolio.
Fixed-maturity securities include debt securities and redeemable preferred stocks, which may have fixed or variable principalpayment schedules, may be held for indefinite periods of time, and may be used as a part of our asset/liability strategy or sold inresponse to changes in interest rates, anticipated prepayments, risk/reward characteristics, liquidity needs, or other economicfactors. These securities are carried at fair value with the corresponding unrealized gains (losses), net of deferred income taxes,reported in accumulated other comprehensive income. Fair values are obtained from recognized pricing services or are quoted bymarket makers and dealers, with limited exceptions discussed in Note 3 – Fair Value.
Included in the fixed-maturity portfolio are asset-backed securities. The asset-backed securities are accounted for under theretrospective method, in general. Under the current accounting guidance, the prospective method is used primarily for interest-only, non-investment-grade asset-backed securities, and certain asset-backed securities with sub-prime loan exposure, wherethere is a greater risk of non-performance, or where it is possible the initial investment may not be substantially recovered. Theretrospective method recalculates yield assumptions (based on changes in interest rates or cash flow expectations) historically tothe inception of the investment, and applies the required adjustment, if any, to the cost basis, with the offset recorded toinvestment income. The prospective method requires a calculation of future expected repayments and resets the yield to allow forfuture period adjustments; no current period impact to investment income or the securities cost is made based on the cash flowupdate. Prepayment assumptions are based on market expectations and are updated at each periodic cash flow review period.
Equity securities include common stocks, nonredeemable preferred stocks, and other risk investments and are reported at quotedfair values. Changes in fair value of these securities, net of deferred income taxes, are reflected as unrealized gains (losses) inaccumulated other comprehensive income. To the extent we hold any foreign equities or foreign currency hedges, any change invalue due to exchange rate fluctuations would be limited by foreign currency hedges, if any, and would be recognized in incomein the current period.
Short-term investments can include auction rate securities (i.e., certain municipal bonds and preferred stocks). Due to the natureof auction rate securities, these securities are classified as short-term based upon their expected auction date (generally 7-49days) rather than on their contractual obligation (which are greater than one year at original issuance). In the event that anauction fails, the security may need to be reclassified from short-term. In addition to auction rate securities, short-terminvestments may include Eurodollar deposits, commercial paper, and other securities expected to mature within one year.Changes in fair value of these securities, net of deferred income taxes, are reflected as unrealized gains (losses) in accumulatedother comprehensive income.
App.-A-6

Trading securities are securities bought principally for the purpose of sale in the near term. To the extent we have tradingsecurities, changes in fair value would be recognized in income in the current period. Derivative instruments which may be usedfor trading purposes or classified as trading derivatives due to the characteristics of the transaction are discussed below.
Derivative instruments may include futures, options, forward positions, foreign currency forwards, interest rate swap agreements,and credit default swaps and may be used in the portfolio for general investment purposes or to hedge the exposure to:
▪ Changes in fair value of an asset or liability (fair value hedge);
▪ Foreign currency of an investment in a foreign operation (foreign currency hedge); or
▪ Variable cash flows of a forecasted transaction (cash flow hedge).
To the extent we have derivatives held or issued for general investment purposes, these derivative instruments are recognized aseither assets or liabilities and measured at fair value with changes in fair value recognized in income as a component of netrealized gains (losses) on securities during the period of change.
Derivatives designated as hedges are required to be evaluated on established criteria to determine the effectiveness of theircorrelation to, and ability to reduce the designated risk of, specific securities or transactions. Effectiveness is required to bereassessed regularly. Hedges that are deemed to be effective would be accounted for as follows:
▪ Fair value hedge: changes in fair value of the hedge, as well as the hedged item, would be recognized in income in the periodof change while the hedge was in effect.
▪ Foreign currency hedge: changes in fair value of the hedge, as well as the hedged item, would be reflected as a change intranslation adjustment as part of accumulated other comprehensive income. Gains and losses on the foreign currency hedgewould offset the foreign exchange gains and losses on the foreign investment as they are recognized into income.
▪ Cash flow hedge: changes in fair value of the hedge would be reported as a component of accumulated other comprehensiveincome and subsequently amortized into earnings over the life of the hedged transaction.
If a hedge is deemed to become ineffective and discontinued, the following accounting treatment would be applied:
▪ Fair value hedge: the derivative instrument would continue to be adjusted through income, while the adjustment in the changein value of the hedged item would be reflected as a change in unrealized gains (losses) as part of accumulated othercomprehensive income.
▪ Foreign currency hedge: changes in the value of the hedged item would continue to be reflected as a change in translationadjustment as part of accumulated other comprehensive income, but the derivative instrument would be adjusted throughincome for the current period.
▪ Cash flow hedge: changes in fair value of the derivative instrument would be reported in income for the current period (seeNote 4 – Debt for discussion regarding a forecasted debt issuance hedge we held in 2007).
For all derivative positions, net cash requirements are limited to changes in fair values, which may vary based upon changes ininterest rates, currency exchange rates, and other factors. Exposure to credit risk is limited to the carrying value; collateral may berequired to limit credit risk. We have elected not to offset fair value amounts that arise from derivative positions with the samecounterparty under a master netting arrangement.
Investment securities are exposed to various risks such as interest rate, market, credit, and liquidity risk. Fair values of securitiesfluctuate based on the nature and magnitude of changing market conditions; significant changes in market conditions couldmaterially affect the portfolio’s value in the near term. We continually monitor our portfolio for price changes, which might indicatepotential impairments, and perform detailed reviews of securities with unrealized losses based on predetermined guidelines. Insuch cases, changes in fair value are evaluated to determine the extent to which such changes are attributable to (i) fundamentalfactors specific to the issuer, such as financial conditions, business prospects, or other factors, or (ii) market-related factors, suchas interest rates or equity market declines. When a security in our investment portfolio has an unrealized loss in fair value that isdeemed to be other-than-temporary, we reduce the book value of such security to its current fair value, recognizing the decline asa realized loss in the income statement. Any future changes in fair value, either increases or decreases, are reflected as changesin unrealized gains (losses) as part of accumulated other comprehensive income.
Realized gains (losses) on securities are computed based on the first-in first-out method and also include write-downs onavailable-for-sale securities considered to have other-than-temporary declines in fair value, as well as holding period valuationchanges on derivatives.
App.-A-7

Insurance Premiums and Receivables Insurance premiums written are earned into income on a pro rata basis over the periodof risk, based on a daily earnings convention. Accordingly, unearned premiums represent the portion of premiums written that isapplicable to the unexpired risk. We provide insurance and related services to individuals and small commercial accountsthroughout the United States, and offer a variety of payment plans. Generally, premiums are collected prior to providing riskcoverage, minimizing our exposure to credit risk. We perform a policy level evaluation to determine the extent to which thepremiums receivable balance exceeds the unearned premiums balance. We then age this exposure to establish an allowance fordoubtful accounts based on prior experience.
Deferred Acquisition Costs Deferred acquisition costs include commissions, premium taxes, and other variable underwritingand direct sales costs incurred in connection with writing business. These costs are deferred and amortized over the policy periodin which the related premiums are earned. We consider anticipated investment income in determining the recoverability of thesecosts. Management believes that these costs will be fully recoverable in the near term. We do not defer any direct-responseadvertising costs.
Loss and Loss Adjustment Expense Reserves Loss reserves represent the estimated liability on claims reported to us, plusreserves for losses incurred but not recorded (IBNR). These estimates are reported net of amounts estimated to be recoverablefrom salvage and subrogation. Loss adjustment expense reserves represent the estimated expenses required to settle theseclaims and losses. The methods of making estimates and establishing these reserves are reviewed regularly, and resultingadjustments are reflected in income currently. Such loss and loss adjustment expense reserves are susceptible to change in thenear term.
Reinsurance Our reinsurance transactions primarily include premiums written under state-mandated involuntary plans forcommercial vehicles (Commercial Auto Insurance Procedures/Plans–“CAIP”) and premiums ceded to state-provided reinsurancefacilities, for which we retain no loss indemnity risk (see Note 7 – Reinsurance for further discussion). We also cede a portion ofthe premiums in our non-auto programs to limit our exposure in those particular markets. Prepaid reinsurance premiums areearned on a pro rata basis over the period of risk, based on a daily earnings convention, which is consistent with premiumswritten.
Income Taxes The income tax provision is calculated under the balance sheet approach. Deferred tax assets and liabilities arerecorded based on the difference between the financial statement and tax bases of assets and liabilities at the enacted tax rates.The principal assets and liabilities giving rise to such differences are write-downs of investment securities determined to be other-than-temporarily impaired, net unrealized gains (losses) on securities, loss reserves, unearned premiums reserves, deferredacquisition costs, and non-deductible accruals. We review our deferred tax assets for recoverability. Although realization of thedeferred tax asset is not assured, management believes it is more likely than not that the deferred tax asset will be realized basedon our expectation that we will be able to fully utilize the deductions that are ultimately recognized for tax purposes. See Note 5 –Income Taxes for further discussion.
Property and Equipment Property and equipment are recorded at cost, less accumulated depreciation. Depreciation isrecognized over the estimated useful lives of the assets using accelerated methods for computer equipment and the straight-linemethod for all other fixed assets. The useful lives range from 3 to 4 years for computer equipment, 10 to 40 years for buildingsand improvements, and 3 to 10 years for all other property and equipment. Land and buildings comprised 78% and 80% of totalproperty and equipment at December 31, 2008 and 2007, respectively. Property and equipment include capitalized softwaredeveloped or acquired for internal use. Total interest capitalized was $5.0 million in 2008 and $2.4 million in both 2007 and 2006,relating to construction projects and capitalized computer software costs.
Guaranty Fund Assessments We are subject to state guaranty fund assessments, which provide for the payment of coveredclaims or other insurance obligations of insurance companies deemed insolvent. These assessments are accrued after a formaldetermination of insolvency has occurred, and we have written the premiums on which the assessments will be based.
Service Revenues and Expenses Our service businesses provide insurance-related services. Service revenues consistprimarily of fees generated from processing business for involuntary CAIP plans and are earned on a pro rata basis over the termof the related policies. Service expenses include acquisition expenses for the involuntary plans, which are deferred and amortizedover the period in which the related revenues are earned, and costs associated with our other service products.
Stock-Based Compensation As of January 1, 2006, we adopted the provisions of Statement of Financial Accounting Standards123 (revised 2004), “Share-Based Payment” (SFAS 123(R)), which requires the measurement and recognition of compensationexpense for all share-based payment awards made to employees and directors, using the modified prospective method. As aresult, our consolidated financial statements for the year ended December 31, 2006, reflected the effect of SFAS 123(R),
App.-A-8

including the reclassification of any unamortized restricted stock (i.e., unearned compensation) against paid-in capital forrestricted stock awards accounted for as “equity awards” and against other liabilities for the restricted stock awards accounted foras “liability awards” (i.e., 2003 and 2004 restricted stock awards deferred pursuant to our deferred compensation plans).
Pursuant to the modified prospective application, we were required to expense the fair value at the grant date of our unvestedoutstanding stock options. No stock options have been granted after December 31, 2002. We did not incur any additionalexpense relating to currently outstanding stock options subsequent to 2006, since the final vesting date of stock optionspreviously granted was January 1, 2007. Beginning in 2003, we began issuing restricted stock awards, both time-based andperformance-based, as our form of equity compensation to key members of management and non-employee directors in lieu ofstock options; our current equity compensation program does not contemplate the issuance of stock options. Compensationexpense for restricted stock awards is recognized over the respective vesting periods. Beginning in 2007, the expense forrestricted stock is representative of the effect on net income for future periods.
For the years ended December 31, 2008, 2007, and 2006 the pretax expense of our stock-based compensation was $34.5million, $26.5 million, and $27.6 million, respectively, (tax benefit of $12.1 million, $9.3 million, and $9.7 million), of which $1.3million of the 2006 expense related to our unvested outstanding stock options.
In addition, in conjunction with the Financial Accounting Standards Board (FASB) Staff Position No. FAS 123(R)-3, “TransitionElection Related to Accounting for Tax Effects of Share-Based Payment Awards,” we elected to adopt the alternative transitionmethod for calculating the tax effects of stock-based compensation pursuant to SFAS 123(R). The alternative transition methodincludes simplified methods to establish the beginning balance of the additional paid-in capital pool related to the tax effects ofemployee stock-based compensation, and to determine the subsequent effect on the paid-in capital pool and the consolidatedstatements of cash flows of the tax effects of employee stock-based compensation awards that were outstanding upon theadoption of SFAS 123(R).
We record an estimate for expected forfeitures of restricted stock based on our historical forfeiture rates. In addition, we shortenthe vesting periods of certain stock-based awards based on the “qualified retirement” provisions in our incentive compensationplans, under which (among other provisions) the vesting of 50% of outstanding time-based restricted stock awards will accelerateupon retirement if the participant is 55 years of age or older and satisfies certain years-of-service requirements. The cumulativeeffect of adopting these changes under SFAS 123(R) was not material to our financial condition, cash flows, or results ofoperations for the year ended December 31, 2006.
Earnings Per Share Basic earnings per share are computed using the weighted average number of common sharesoutstanding, excluding both time-based and performance-based unvested restricted stock awards. Diluted earnings per shareinclude common stock equivalents assumed outstanding during the period. Our common stock equivalents include stock optionsand time-based restricted stock awards accounted for as equity awards. In determining the denominator for our diluted earningsper share, we include the impact of pro forma deferred tax assets pursuant to the alternative transition method under SFAS123(R) for purposes of calculating assumed proceeds under the treasury stock method. In periods where we report a net loss, thecalculated diluted earnings per share is antidilutive, therefore, basic earnings per share is disclosed.
Supplemental Cash Flow Information Cash includes only bank demand deposits. We paid income taxes of $258.0 million,$526.0 million, and $739.0 million in 2008, 2007, and 2006, respectively. Total interest paid was $144.7 million during 2008,$110.1 million during 2007, and $81.3 million during 2006. Non-cash activity includes declared but unpaid dividends, changes inthe net unrealized gains (losses) on investment securities, and in 2006, the reclass of the liability for deferred restricted stockcompensation due to the adoption of SFAS 123(R).
Progressive effected a 4-for-1 stock split in the form of a stock dividend to shareholders on May 18, 2006. We reflected theissuance of the additional common shares by transferring $585.9 million from retained earnings to the common stock account. Allshare, per share, and equivalent share amounts and stock prices were adjusted to give effect to the split. Treasury shares werenot split.
App.-A-9
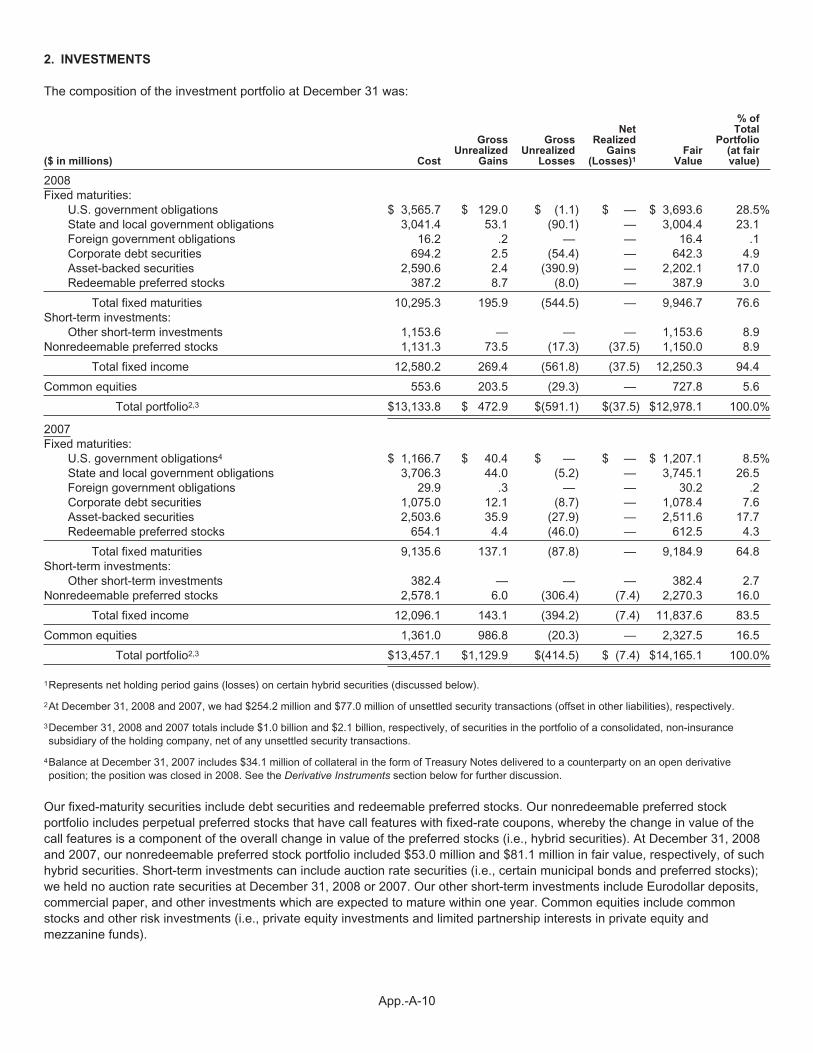
2. INVESTMENTS
The composition of the investment portfolio at December 31 was:
($ in millions) Cost
GrossUnrealized
Gains
GrossUnrealized
Losses
NetRealized
Gains(Losses)1
FairValue
% ofTotal
Portfolio(at fairvalue)
2008Fixed maturities:
U.S. government obligations $ 3,565.7 $ 129.0 $ (1.1) $ — $ 3,693.6 28.5%State and local government obligations 3,041.4 53.1 (90.1) — 3,004.4 23.1Foreign government obligations 16.2 .2 — — 16.4 .1Corporate debt securities 694.2 2.5 (54.4) — 642.3 4.9Asset-backed securities 2,590.6 2.4 (390.9) — 2,202.1 17.0Redeemable preferred stocks 387.2 8.7 (8.0) — 387.9 3.0
Total fixed maturities 10,295.3 195.9 (544.5) — 9,946.7 76.6Short-term investments:
Other short-term investments 1,153.6 — — — 1,153.6 8.9Nonredeemable preferred stocks 1,131.3 73.5 (17.3) (37.5) 1,150.0 8.9
Total fixed income 12,580.2 269.4 (561.8) (37.5) 12,250.3 94.4
Common equities 553.6 203.5 (29.3) — 727.8 5.6
Total portfolio2,3 $13,133.8 $ 472.9 $(591.1) $(37.5) $12,978.1 100.0%
2007Fixed maturities:
U.S. government obligations4 $ 1,166.7 $ 40.4 $ — $ — $ 1,207.1 8.5%State and local government obligations 3,706.3 44.0 (5.2) — 3,745.1 26.5Foreign government obligations 29.9 .3 — — 30.2 .2Corporate debt securities 1,075.0 12.1 (8.7) — 1,078.4 7.6Asset-backed securities 2,503.6 35.9 (27.9) — 2,511.6 17.7Redeemable preferred stocks 654.1 4.4 (46.0) — 612.5 4.3
Total fixed maturities 9,135.6 137.1 (87.8) — 9,184.9 64.8Short-term investments:
Other short-term investments 382.4 — — — 382.4 2.7Nonredeemable preferred stocks 2,578.1 6.0 (306.4) (7.4) 2,270.3 16.0
Total fixed income 12,096.1 143.1 (394.2) (7.4) 11,837.6 83.5
Common equities 1,361.0 986.8 (20.3) — 2,327.5 16.5
Total portfolio2,3 $13,457.1 $1,129.9 $(414.5) $ (7.4) $14,165.1 100.0%
1Represents net holding period gains (losses) on certain hybrid securities (discussed below).
2At December 31, 2008 and 2007, we had $254.2 million and $77.0 million of unsettled security transactions (offset in other liabilities), respectively.
3December 31, 2008 and 2007 totals include $1.0 billion and $2.1 billion, respectively, of securities in the portfolio of a consolidated, non-insurancesubsidiary of the holding company, net of any unsettled security transactions.
4Balance at December 31, 2007 includes $34.1 million of collateral in the form of Treasury Notes delivered to a counterparty on an open derivativeposition; the position was closed in 2008. See the Derivative Instruments section below for further discussion.
Our fixed-maturity securities include debt securities and redeemable preferred stocks. Our nonredeemable preferred stockportfolio includes perpetual preferred stocks that have call features with fixed-rate coupons, whereby the change in value of thecall features is a component of the overall change in value of the preferred stocks (i.e., hybrid securities). At December 31, 2008and 2007, our nonredeemable preferred stock portfolio included $53.0 million and $81.1 million in fair value, respectively, of suchhybrid securities. Short-term investments can include auction rate securities (i.e., certain municipal bonds and preferred stocks);we held no auction rate securities at December 31, 2008 or 2007. Our other short-term investments include Eurodollar deposits,commercial paper, and other investments which are expected to mature within one year. Common equities include commonstocks and other risk investments (i.e., private equity investments and limited partnership interests in private equity andmezzanine funds).
App.-A-10

Our securities are reported at fair value, with the changes in fair value of these securities (other than hybrid securities andderivative instruments) reported as a component of accumulated other comprehensive income, net of deferred income taxes. SeeNote 11 – Other Comprehensive Income (Loss) for changes in net unrealized gains (losses) during the period. The change in fairvalue of the hybrid securities and derivative instruments is recorded as a component of net realized gains (losses) on securities.
At December 31, 2008, bonds in the principal amount of $131.3 million were on deposit to meet state insurance regulatory and/orrating agency requirements. We did not have any securities of any one issuer with an aggregate cost or fair value exceeding 10%of total shareholders’ equity at December 31, 2008 or 2007. At December 31, 2008, we had fixed-maturity securities with a fairvalue of $1.1 million that were non-income producing during the preceding 12 months.
Net Investment Income The components of net investment income for the years ended December 31 were:
(millions) 2008 2007 2006
Fixed maturities $438.4 $478.6 $481.7Nonredeemable preferred stocks 144.5 126.9 84.4Common equities 38.9 46.2 43.1Short-term investments:
Auction rate municipal obligations 1.4 2.6 1.8Auction rate preferred stocks — .8 5.8Other short-term investments 14.5 25.7 31.0
Investment income 637.7 680.8 647.8Investment expenses (8.8) (12.4) (11.9)
Net investment income $628.9 $668.4 $635.9
App.-A-11
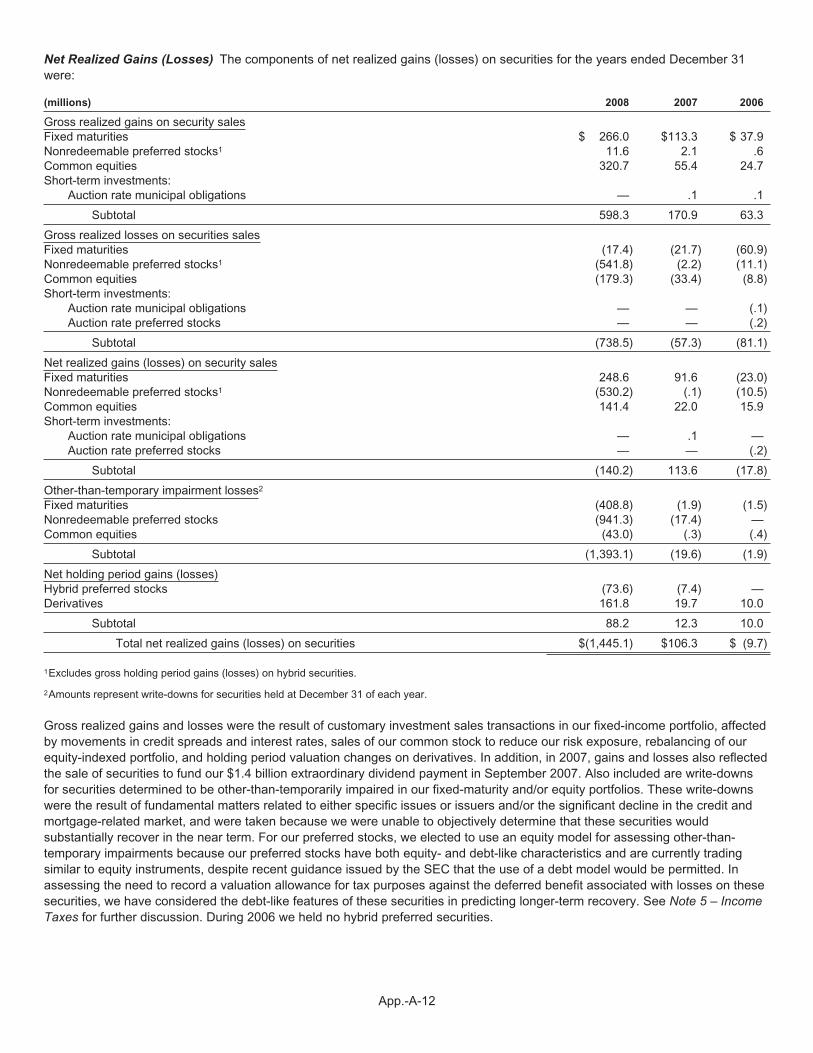
Net Realized Gains (Losses) The components of net realized gains (losses) on securities for the years ended December 31were:
(millions) 2008 2007 2006
Gross realized gains on security salesFixed maturities $ 266.0 $113.3 $ 37.9Nonredeemable preferred stocks1 11.6 2.1 .6Common equities 320.7 55.4 24.7Short-term investments:
Auction rate municipal obligations — .1 .1
Subtotal 598.3 170.9 63.3
Gross realized losses on securities salesFixed maturities (17.4) (21.7) (60.9)Nonredeemable preferred stocks1 (541.8) (2.2) (11.1)Common equities (179.3) (33.4) (8.8)Short-term investments:
Auction rate municipal obligations — — (.1)Auction rate preferred stocks — — (.2)
Subtotal (738.5) (57.3) (81.1)
Net realized gains (losses) on security salesFixed maturities 248.6 91.6 (23.0)Nonredeemable preferred stocks1 (530.2) (.1) (10.5)Common equities 141.4 22.0 15.9Short-term investments:
Auction rate municipal obligations — .1 —Auction rate preferred stocks — — (.2)
Subtotal (140.2) 113.6 (17.8)
Other-than-temporary impairment losses2
Fixed maturities (408.8) (1.9) (1.5)Nonredeemable preferred stocks (941.3) (17.4) —Common equities (43.0) (.3) (.4)
Subtotal (1,393.1) (19.6) (1.9)
Net holding period gains (losses)Hybrid preferred stocks (73.6) (7.4) —Derivatives 161.8 19.7 10.0
Subtotal 88.2 12.3 10.0
Total net realized gains (losses) on securities $(1,445.1) $106.3 $ (9.7)
1Excludes gross holding period gains (losses) on hybrid securities.
2Amounts represent write-downs for securities held at December 31 of each year.
Gross realized gains and losses were the result of customary investment sales transactions in our fixed-income portfolio, affectedby movements in credit spreads and interest rates, sales of our common stock to reduce our risk exposure, rebalancing of ourequity-indexed portfolio, and holding period valuation changes on derivatives. In addition, in 2007, gains and losses also reflectedthe sale of securities to fund our $1.4 billion extraordinary dividend payment in September 2007. Also included are write-downsfor securities determined to be other-than-temporarily impaired in our fixed-maturity and/or equity portfolios. These write-downswere the result of fundamental matters related to either specific issues or issuers and/or the significant decline in the credit andmortgage-related market, and were taken because we were unable to objectively determine that these securities wouldsubstantially recover in the near term. For our preferred stocks, we elected to use an equity model for assessing other-than-temporary impairments because our preferred stocks have both equity- and debt-like characteristics and are currently tradingsimilar to equity instruments, despite recent guidance issued by the SEC that the use of a debt model would be permitted. Inassessing the need to record a valuation allowance for tax purposes against the deferred benefit associated with losses on thesesecurities, we have considered the debt-like features of these securities in predicting longer-term recovery. See Note 5 – IncomeTaxes for further discussion. During 2006 we held no hybrid preferred securities.
App.-A-12

Gross Unrealized Losses The components of gross unrealized losses at December 31 were:
TotalFair
Value
Unrealized Losses
(millions) TotalLess than
12 months12 monthsor greater1
2008Fixed maturities $4,030.5 $(544.5) $(219.9) $(324.6)Nonredeemable preferred stocks 437.6 (17.3) (13.2) (4.1)Common equities 123.2 (29.3) (26.5) (2.8)
Total $4,591.3 $(591.1) $(259.6) $(331.5)
2007Fixed maturities $2,509.3 $ (87.8) $ (51.4) $ (36.4)Nonredeemable preferred stocks 1,975.3 (306.4) (245.3) (61.1)Common equities 160.5 (20.3) (18.3) (2.0)
Total $4,645.1 $(414.5) $(315.0) $ (99.5)
1The fair value for securities in an unrealized loss position for 12 months or greater was $2,149.5 million at December 31, 2008 and $2,038.9 million atDecember 31, 2007.
We have the intent and ability to hold the fixed-maturity securities and nonredeemable preferred stocks, and will do so, as long asthe securities continue to remain consistent with our investment strategy. Of the $591.1 million of gross unrealized losses atDecember 31, 2008, approximately 90% are within our fixed-maturities portfolio and 70% of that is within the asset-backedsecurities sector. The significant decline in value occurred during the fourth quarter 2008 as credit spreads in residential andcommercial mortgage-backed products widened considerably.
Within our asset-backed portfolio are residential loan-backed securities and commercial mortgage-backed securities. Theresidential loan-backed securities are comprised primarily of seasoned loans with an average duration of 1.5 years and anaverage AAA- credit rating. We continue to collect our periodic principal and interest on these securities.
Our commercial mortgage-backed portfolio has an average duration of 2.2 years and an overall average credit rating of AA+.Approximately 88% of the portfolio is rated A or higher and were predominantly originated prior to 2005, which is when financingrequirements were more conservative. Our largest exposure to non-investment-grade quality commercial mortgage-backedsecurities is within those securities that originated in 2006/2007 that are invested in a single borrower exposure that we believe isof stronger underlying credit than other non-investment-grade instruments marketed during those years. Our commercialmortgage-backed securities continue to receive periodic interest and principal streams.
Lastly, our commercial mortgage-backed interest-only securities are predominantly (91%) planned amortization based, a classstructured with prepayment risk protection and a primary payment schedule within the deal, as long as designated prepaymentexpectations remain intact. These securities are AAA rated, with the exception of one security, and have an average duration of1.5 years, and we continue to receive our periodic income streams.
We may retain the common stocks to maintain correlation to the Russell 1000 Index as long as the portfolio and index correlationremain similar. If our strategy was to change and these securities were determined to be other-than-temporarily impaired, wewould recognize a write-down in accordance with our stated policy.
Trading Securities At December 31, 2008 and 2007, we did not hold any trading securities. We did not have any net realizedgains (losses) on trading securities for the years ended December 31, 2008, 2007, and 2006.
Derivative Instruments We invest in the following derivative exposures at various times: interest rate swaps; asset-backedcredit default swaps; U.S. corporate debt and corporate debt indexed credit default swaps; and forecasted hedges.
Pursuant to FASB Staff Position (“FSP”) FIN 39-1, “Amendment of FASB Interpretation No. 39,” a reporting entity that is a party toa master netting agreement is permitted to offset fair value amounts recognized for the right to reclaim cash collateral or theobligation to return cash collateral against fair value amounts recognized for derivative instruments that have been offset underthe same master netting agreement. We have elected to not offset fair value amounts that arise from derivative positions with thesame counterparty under a master netting arrangement as permitted by this standard.
App.-A-13
For all derivative positions discussed below, realized holding period gains and losses are netted with any upfront cash that maybe exchanged under the contract to determine if the net position should be classified either as an asset or liability. To be reportedas a component of the available-for-sale portfolio, the inception-to-date realized gain on the derivative position at period endwould have to exceed any upfront cash received (net derivative asset). On the other hand, a net derivative liability would includeany inception-to-date realized loss plus the amount of upfront cash received (or netted, if upfront cash was paid) and would bereported as a component of other liabilities. These net derivative assets/liabilities are not separately disclosed on the balancesheet due to the immaterial effect on our financial condition, cash flows, and results of operations.
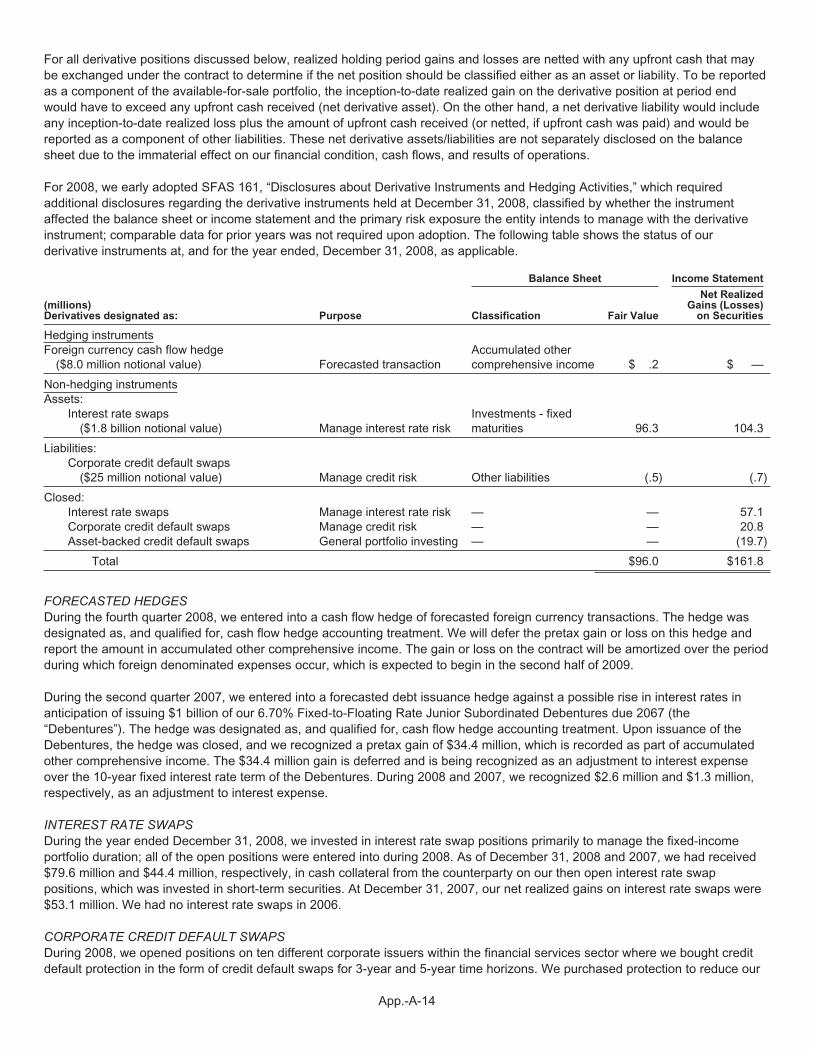
For 2008, we early adopted SFAS 161, “Disclosures about Derivative Instruments and Hedging Activities,” which requiredadditional disclosures regarding the derivative instruments held at December 31, 2008, classified by whether the instrumentaffected the balance sheet or income statement and the primary risk exposure the entity intends to manage with the derivativeinstrument; comparable data for prior years was not required upon adoption. The following table shows the status of ourderivative instruments at, and for the year ended, December 31, 2008, as applicable.
Balance Sheet Income Statement
(millions)Derivatives designated as: Purpose Classification Fair Value
Net RealizedGains (Losses)
on Securities
Hedging instrumentsForeign currency cash flow hedge
($8.0 million notional value) Forecasted transactionAccumulated othercomprehensive income $ .2 $ —
Non-hedging instrumentsAssets:
Interest rate swaps($1.8 billion notional value) Manage interest rate risk
Investments - fixedmaturities 96.3 104.3
Liabilities:Corporate credit default swaps
($25 million notional value) Manage credit risk Other liabilities (.5) (.7)
Closed:Interest rate swaps Manage interest rate risk — — 57.1Corporate credit default swaps Manage credit risk — — 20.8Asset-backed credit default swaps General portfolio investing — — (19.7)
Total $96.0 $161.8
FORECASTED HEDGESDuring the fourth quarter 2008, we entered into a cash flow hedge of forecasted foreign currency transactions. The hedge wasdesignated as, and qualified for, cash flow hedge accounting treatment. We will defer the pretax gain or loss on this hedge andreport the amount in accumulated other comprehensive income. The gain or loss on the contract will be amortized over the periodduring which foreign denominated expenses occur, which is expected to begin in the second half of 2009.
During the second quarter 2007, we entered into a forecasted debt issuance hedge against a possible rise in interest rates inanticipation of issuing $1 billion of our 6.70% Fixed-to-Floating Rate Junior Subordinated Debentures due 2067 (the“Debentures”). The hedge was designated as, and qualified for, cash flow hedge accounting treatment. Upon issuance of theDebentures, the hedge was closed, and we recognized a pretax gain of $34.4 million, which is recorded as part of accumulatedother comprehensive income. The $34.4 million gain is deferred and is being recognized as an adjustment to interest expenseover the 10-year fixed interest rate term of the Debentures. During 2008 and 2007, we recognized $2.6 million and $1.3 million,respectively, as an adjustment to interest expense.
INTEREST RATE SWAPSDuring the year ended December 31, 2008, we invested in interest rate swap positions primarily to manage the fixed-incomeportfolio duration; all of the open positions were entered into during 2008. As of December 31, 2008 and 2007, we had received$79.6 million and $44.4 million, respectively, in cash collateral from the counterparty on our then open interest rate swappositions, which was invested in short-term securities. At December 31, 2007, our net realized gains on interest rate swaps were$53.1 million. We had no interest rate swaps in 2006.
CORPORATE CREDIT DEFAULT SWAPSDuring 2008, we opened positions on ten different corporate issuers within the financial services sector where we bought creditdefault protection in the form of credit default swaps for 3-year and 5-year time horizons. We purchased protection to reduce our
App.-A-14

overall financial service sector exposure given the heightened risk in the financial markets and our exposure to preferred stockswithin the financial sector. By the end of 2008, we closed positions on nine of the ten different corporate issuers due to thegovernment funding of these issuers.
During the year ended December 31, 2007, we opened and closed positions where we bought credit default protection in the formof credit default swaps on a corporate non-investment-grade index, and we closed positions where we bought credit defaultswaps on an investment-grade index, which we also held in 2006. During the year ended December 31, 2006, we closedpositions where we sold credit default protection in the form of credit default swaps on the debt issuances of several issuers.These positions were matched with Treasury Notes that had equivalent principal and maturities to replicate cash bond positions.For each of the years ended December 31, 2007 and 2006, our net realized gains were $10.0 million.
ASSET-BACKED CREDIT DEFAULT SWAPSDuring the years ended December 31, 2008 and 2007, we held a position for which we sold credit protection in the form of acredit default swap comprised of a basket of 20 asset-backed bonds supported by sub-prime mortgage loans. We covered thecredit default swap’s notional exposure by acquiring U.S. Treasury Notes of equal maturity and principal amount and reducing ouroverall exposure with any upfront cash received. At the end of 2006, we had minimal sub-prime mortgage exposure. As prices ofmortgage-backed securities fell in 2007, we decided to increase our exposure by selling protection on this index. In 2008, theprice of the index declined. During the fourth quarter 2008, we closed our entire asset-backed credit default swap position. As aresult, we did not have any collateral deliveries related to this position outstanding at December 31, 2008, compared to $44.8million of delivered collateral ($34.1 million of U.S. Treasury Notes and $10.7 million of cash) at December 31, 2007. AtDecember 31, 2007, our realized loss, net of gains on the Treasury Notes for all asset-backed credit default swaps, was $43.4million. We held no asset-backed credit default swap position during 2006.
Fixed Maturities The composition of fixed maturities by maturity at December 31, 2008, was:
(millions) CostFair
Value
Less than one year $ 831.9 $ 785.2One to five years 7,539.1 7,301.3Five to ten years 1,765.4 1,716.7Ten years or greater 62.6 47.2
Total $10,199.0 $9,850.4
The table above excludes $96.3 million of gains on open interest rate swap positions.
Asset-backed securities are classified in the maturity distribution table based upon their projected cash flows. All other securitieswhich do not have a single maturity date are reported at expected average maturity. Contractual maturities may differ fromexpected maturities because the issuers of the securities may have the right to call or prepay obligations.
3. FAIR VALUE
In the first quarter 2008, we adopted SFAS 157, “Fair Value Measurements,” which became effective on January 1, 2008. SFAS157, which applies to financial assets and liabilities, establishes a framework for measuring fair value, establishes a fair valuehierarchy based on inputs used to measure fair value, and expands disclosure about fair value measurements. Adopting thisstatement has not had an effect on our financial condition, cash flows, or results of operations.
In accordance with SFAS 157, we have categorized our financial instruments, based on the degree of subjectivity inherent in thevaluation technique, into a fair value hierarchy of three levels, as follows:
• Level 1: Inputs are unadjusted, quoted prices in active markets for identical instruments at the measurement date (e.g.,U.S. Government securities and active exchange-traded equity securities).
• Level 2: Inputs (other than quoted prices included within Level 1) that are observable for the instrument either directly orindirectly (e.g., certain corporate and municipal bonds and certain preferred stocks). This includes: (i) quoted prices forsimilar instruments in active markets, (ii) quoted prices for identical or similar instruments in markets that are not active,(iii) inputs other than quoted prices that are observable for the instruments, and (iv) inputs that are derived principallyfrom or corroborated by observable market data by correlation or other means.
App.-A-15

• Level 3: Inputs that are unobservable. Unobservable inputs reflect the reporting entity’s subjective evaluation about theassumptions market participants would use in pricing the financial instrument (e.g., certain structured securities andprivately held investments).
The composition of the investment portfolio as of December 31 was:2008
(millions)
Level 1Fair
Value
Level 2Fair
Value
Level 3Fair
Value
TotalFair
Value Cost
Fixed maturities $3,705.7 $6,131.4 $109.6 $ 9,946.7 $10,295.3Nonredeemable preferred stocks 477.2 560.5 112.3 1,150.0 1,131.3Common equities 714.3 — 13.5 727.8 553.6
$4,897.2 $6,691.9 $235.4 11,824.5 11,980.2
Other short-term investments2 1,153.6 1,153.6
Total portfolio $12,978.1 $13,133.8
Debt3 $ 1,581.6 $ 2,175.5
20071
TotalFair
Value Cost
Fixed maturities $ 9,184.9 $ 9,135.6Nonredeemable preferred stocks 2,270.3 2,578.1Common equities 2,327.5 1,361.0
13,782.7 13,074.7Other short-term investments2 382.4 382.4
Total portfolio $14,165.1 $13,457.1
Debt3 $ 2,176.6 $ 2,173.9
1SFAS 157 was not effective until 2008; therefore, 2007 fair value was not required to be broken out by hierarchy level.2These securities are not subject to fair value measurement since they mature within six months; therefore, we report these securities at cost, whichapproximates fair value.
3Debt is not subject to measurement at fair value in the consolidated Balance Sheets; therefore, it is not broken out by hierarchy level. Fair values areobtained from publicly quoted sources.
Our portfolio valuations classified as either Level 1 or Level 2 in the above table are priced exclusively by external sources,including: pricing vendors, dealers/market makers, and exchange quoted prices. With limited exceptions, our Level 3 securitiesare also priced externally; however, due to several factors (e.g., nature of the securities, level of activity, lack of similar securitiestrading to obtain observable market level inputs), we feel these valuations are more subjective in nature. Certain private equityinvestments and fixed-income investments included in the Level 3 securities may be valued using external pricing supplementedby internal review and analysis. At December 31, 2008, one private equity security with an aggregate value of $10.2 million waspriced internally.
Vendor quoted prices represent approximately 74% of our Level 1 classifications and almost 97% of our Level 2 classifications.The balance of our Level 1 pricing comes from quotes obtained directly from trades made on an active exchange. We reviewedindependent documentation detailing the pricing techniques, models, and methodologies used by these pricing vendors andbelieve that their policies adequately consider market activity, either based on specific transactions for the issue valued or basedon modeling of securities with similar credit quality, duration, yield, and structure that were recently transacted. We continue tomonitor any changes or modifications to their process due to the recent market events. During 2008, and more specifically, in thefourth quarter, we reviewed each sector for transaction volumes to determine if sufficient liquidity and activity existed. Wedetermined that, while overall activity or liquidity is below historical averages, sufficient activity and liquidity existed to provide asource for market level valuations.
Broker quoted prices represent the remaining 3% of the Level 2 classification. We typically use broker/dealers because thesecurity issue we hold is not widely held or frequently traded and thus is not serviced by the pricing vendors. We reviewedindependent documentation detailing the pricing techniques, models, and methodologies used by broker/dealers and determinedthat they used the same pricing techniques as the external vendor pricing sources discussed above. The broker/dealers containback office pricing desks, separate from the day-to-day traders that buy and sell the securities. This process creates uniformity inpricing when they quote externally to their various customers. The broker/dealer valuations are quoted in terms of spreads tovarious indices and the spreads are based off recent transactions adjusted for movements since the last trade or based off similar
App.-A-16

characteristic securities currently trading in the market. These quotes are not considered binding offers to transact. We will, fromtime to time, obtain more than one broker quote for a security, when we feel it is necessary. In addition, from time to time, we willreceive a broker/dealer quote for those securities priced by vendors as further evaluation of market price. We believe thisadditional step ensures we are reporting the most representative price.
When we feel it is necessary to challenge a quote from either a pricing vendor or broker/dealer by using additional estimates toaugment those external prices, we review these assumptions and to the extent those estimates are determined to not containsufficient observable market information, we will reclassify the affected security valuations to Level 3.
During each valuation period, we create internal estimations of portfolio valuation (performance returns), based on currentmarket-related activity (i.e., interest rate and credit spread movements and other credit-related factors) within each major sectorof our portfolio. We compare our internally generated portfolio results with those generated based on quotes we receivedexternally and research material valuation differences.
Based on the criteria described above, we believe that the current level classifications are appropriate based on the valuationtechniques used and that our fair values accurately reflect current market assumptions in the aggregate.
The following table provides a summary of changes in fair value associated with Level 3 assets for the year ended December 31,2008:
Level 3 Fair Value
(millions)Fixed
Maturities
NonredeemablePreferred
StocksCommonEquities Total
Fair value at December 31, 2007 $119.4 $115.6 $13.7 $248.7Calls/maturities/paydowns (7.1) — (.9) (8.0)Sales (14.3) — — (14.3)Realized (gains) losses .5 — — .5Change in valuation (35.2) (3.3) .7 (37.8)Transfers in (out)1 46.3 — — 46.3
Fair value at December 31, 2008 $109.6 $112.3 $13.5 $235.4
1Represents movement between the fair value hierarchy levels during 2008, reflecting changes in the inputs used to measure fair value during the period.
There were no purchases associated with the Level 3 securities during 2008.
Additional information about specific valuation techniques and related fair value detail is provided in Note 1 – Reporting andAccounting Policies, Note 2 – Investments, and Note 4 – Debt.
4. DEBT
Debt at December 31 consisted of:
2008 2007
(millions)Carrying
ValueFair
ValueCarrying
ValueFair
Value
6.375% Senior Notes due 2012 (issued: $350.0, December 2001) $ 348.9 $ 355.3 $ 348.6 $ 367.87% Notes due 2013 (issued: $150.0, October 1993) 149.3 154.3 149.2 162.96 5/8% Senior Notes due 2029 (issued: $300.0, March 1999) 294.6 272.0 294.4 311.86.25% Senior Notes due 2032 (issued: $400.0, November 2002) 394.0 350.0 393.9 397.66.70% Fixed-to-Floating Rate Junior Subordinated Debentures due 2067 (issued: $1,000.0,
June 2007) 988.7 450.0 987.8 936.5
Total $2,175.5 $1,581.6 $2,173.9 $2,176.6
All of the outstanding debt is held by The Progressive Corporation. Debt includes amounts we have borrowed and contributed tothe capital of our insurance subsidiaries or used for other business purposes. Fair values are obtained from publicly quotedsources. There are no restrictive financial covenants or credit rating triggers on our debt.
Interest on all debt is payable semiannually at the stated rates. However, the 6.70% Fixed-to-Floating Rate Junior SubordinatedDebentures due 2067 (the “Debentures”) will only bear interest at this fixed annual rate through, but excluding, June 15, 2017.
App.-A-17
Thereafter, the Debentures will bear interest at a rate equal to the three-month LIBOR plus 2.0175%, and the interest will bepayable quarterly. In addition, subject to certain conditions, we have the right to defer the payment of interest on the Debenturesfor one or more periods not exceeding ten consecutive years each. During any such deferral period, among other conditions,interest would continue to accrue, including interest on the deferred interest, and we generally would not be able to declare or payany dividends on, or repurchase any of, our common shares.
Except for the Debentures, all principal is due at the maturity stated in the table above. The Debentures will become due onJune 15, 2037, the scheduled maturity date, but only to the extent that we have received sufficient net proceeds from the sale ofcertain qualifying capital securities. We must use our commercially reasonable efforts, subject to certain market disruption events,to sell enough qualifying capital securities to permit repayment of the Debentures in full on the scheduled maturity date or, ifsufficient proceeds are not realized from the sale of such qualifying capital securities by such date, on each interest payment datethereafter. Any remaining outstanding principal will be due on June 15, 2067, the final maturity date.
The 7% Notes are noncallable. The 6.375% Senior Notes, the 6 5/8% Senior Notes, and the 6.25% Senior Notes (collectively,“Senior Notes”) may be redeemed in whole or in part at any time, at our option, subject to a “make-whole” provision. Subject tothe Replacement Capital Covenant discussed below, the Debentures may be redeemed, in whole or in part, at any time: (a) priorto June 15, 2017, at a redemption price equal to the greater of (i) 100% of the principal amount of the Debentures beingredeemed, or (ii) a “make-whole” amount, in each case plus any accrued and unpaid interest; or (b) on or after June 15, 2017, ata redemption price equal to 100% of the principal amount of the Debentures being redeemed, plus any accrued and unpaidinterest. In connection with the issuance of the Debentures, we entered into a Replacement Capital Covenant in which weagreed, for the benefit of the holders of a senior debt security, that we will not repay, redeem, defease, or purchase all or part ofthe Debentures before June 15, 2047, unless, subject to certain limitations, we have received proceeds from the sale of certainreplacement capital securities, as defined in the Replacement Capital Covenant.
Prior to issuance of the Senior Notes and Debentures, we entered into forecasted debt issuance hedges against possible rises ininterest rates. Upon issuance of the applicable debt securities, the hedges were closed. At that time, we recognized, as part ofaccumulated other comprehensive income, unrealized gains (losses) of $18.4 million, $(4.2) million, $5.1 million, and $34.4million associated with the 6.375% Senior Notes, the 6 5/8% Senior Notes, the 6.25% Senior Notes, and the Debentures,respectively. The gains (losses) on these hedges are deferred and are being recognized as adjustments to interest expense overthe life of the related debt issuances for the Senior Notes, and over the 10-year fixed interest rate term for the Debentures.
On December 31, 2008, we entered into a 364-Day Secured Liquidity Credit Facility Agreement with National City Bank (NCB).Under this agreement, we may borrow up to $125 million, which may be increased to $150 million at our request but subject toNCB’s discretion. The purpose of the credit facility is to provide liquidity in the event of disruptions in our cash managementoperations, such as disruptions in the financial markets, that affect our ability to transfer or receive funds. We may borrow funds,on a revolving basis, either in the form of Eurodollar Loans or Base Rate Loans. Eurodollar Loans will bear interest at one-, two-,three-, or six-month LIBOR (as selected by us) plus 25 basis points for the selected period. Base Rate Loans will bear dailyinterest at the greater of (a) NCB’s prime rate for such day, (b) the federal funds effective rate for such day plus 1/2% per annum,and (c) one-month LIBOR plus 2% per annum. Any borrowings under this agreement will be secured by a lien on certainmarketable securities held in our investment portfolio. A one-time facility fee of $12,500 was paid as consideration for thisrevolving agreement. In addition, we deposited $125 million into an FDIC-insured deposit account at NCB in January 2009, toprovide us with additional cash availability in the event of such a disruption to our cash management operations. Our access tothese funds is unrestricted. However, if we withdraw funds from this account for any reason other than in connection with such adisruption in our cash management operations, the availability of borrowings under the NCB credit facility will be reduced on adollar-for-dollar basis until such time as we replenish the funds to the deposit account. There are no rating triggers under thecredit agreement. The credit facility will expire on December 31, 2009, unless earlier terminated according to its terms. We had noborrowings under this arrangement in 2008.
The revolving credit facility agreement discussed above replaced an uncommitted line of credit with NCB in the principal amountof $125 million. Under this terminated agreement, no commitment fees were required to be paid and there were no rating triggers.Interest on amounts borrowed would have generally accrued at the one-month LIBOR plus .375%. We had no borrowings underthis arrangement during 2008, 2007, or 2006.
Aggregate principal payments on debt outstanding at December 31, 2008, are $0 for 2009, 2010, and 2011, $350.0 million for2012, $150.0 million for 2013, and $1.7 billion thereafter.
App.-A-18
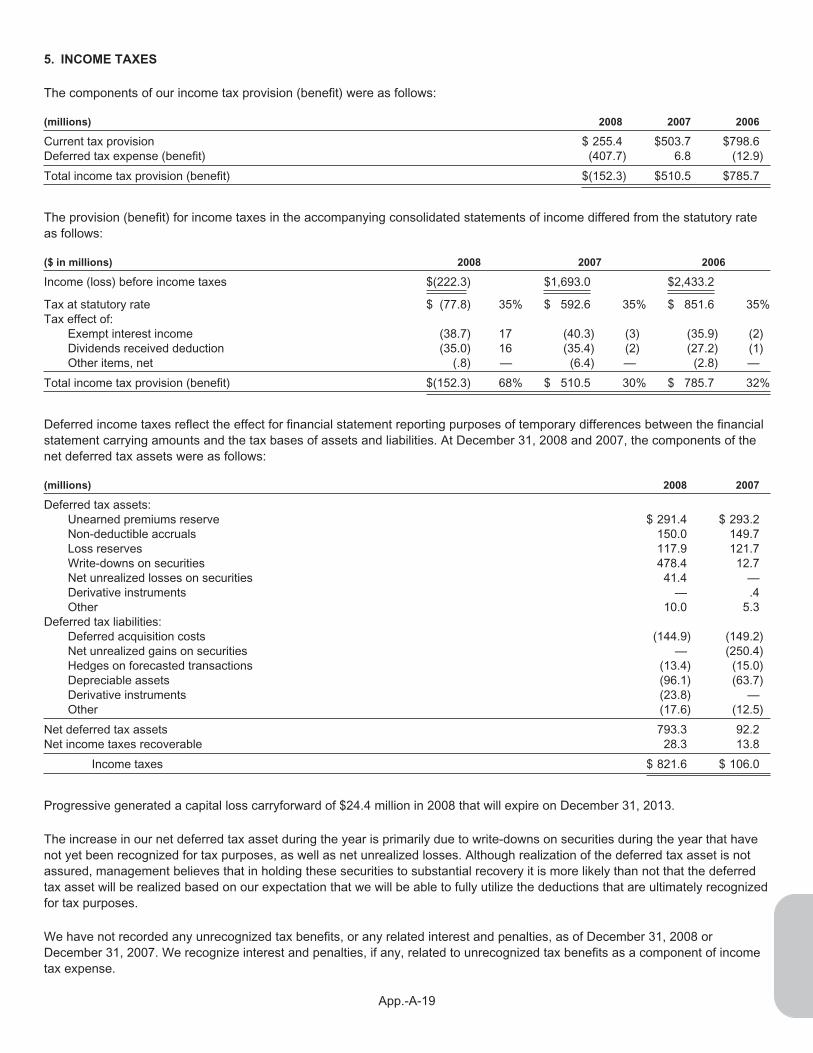
5. INCOME TAXES
The components of our income tax provision (benefit) were as follows:
(millions) 2008 2007 2006
Current tax provision $ 255.4 $503.7 $798.6Deferred tax expense (benefit) (407.7) 6.8 (12.9)
Total income tax provision (benefit) $(152.3) $510.5 $785.7
The provision (benefit) for income taxes in the accompanying consolidated statements of income differed from the statutory rateas follows:
($ in millions) 2008 2007 2006
Income (loss) before income taxes $(222.3) $1,693.0 $2,433.2
Tax at statutory rate $ (77.8) 35% $ 592.6 35% $ 851.6 35%Tax effect of:
Exempt interest income (38.7) 17 (40.3) (3) (35.9) (2)Dividends received deduction (35.0) 16 (35.4) (2) (27.2) (1)Other items, net (.8) — (6.4) — (2.8) —
Total income tax provision (benefit) $(152.3) 68% $ 510.5 30% $ 785.7 32%
Deferred income taxes reflect the effect for financial statement reporting purposes of temporary differences between the financialstatement carrying amounts and the tax bases of assets and liabilities. At December 31, 2008 and 2007, the components of thenet deferred tax assets were as follows:
(millions) 2008 2007
Deferred tax assets:Unearned premiums reserve $ 291.4 $ 293.2Non-deductible accruals 150.0 149.7Loss reserves 117.9 121.7Write-downs on securities 478.4 12.7Net unrealized losses on securities 41.4 —Derivative instruments — .4Other 10.0 5.3
Deferred tax liabilities:Deferred acquisition costs (144.9) (149.2)Net unrealized gains on securities — (250.4)Hedges on forecasted transactions (13.4) (15.0)Depreciable assets (96.1) (63.7)Derivative instruments (23.8) —Other (17.6) (12.5)
Net deferred tax assets 793.3 92.2Net income taxes recoverable 28.3 13.8
Income taxes $ 821.6 $ 106.0
Progressive generated a capital loss carryforward of $24.4 million in 2008 that will expire on December 31, 2013.
The increase in our net deferred tax asset during the year is primarily due to write-downs on securities during the year that havenot yet been recognized for tax purposes, as well as net unrealized losses. Although realization of the deferred tax asset is notassured, management believes that in holding these securities to substantial recovery it is more likely than not that the deferredtax asset will be realized based on our expectation that we will be able to fully utilize the deductions that are ultimately recognizedfor tax purposes.
We have not recorded any unrecognized tax benefits, or any related interest and penalties, as of December 31, 2008 orDecember 31, 2007. We recognize interest and penalties, if any, related to unrecognized tax benefits as a component of incometax expense.
App.-A-19

The statute of limitations remains open with respect to our federal income tax returns for tax years 2004 and later. For tax years2004-2006, all audit fieldwork has been completed and all adjustments agreed to. There was one issue raised during the auditwhich we could not reach agreement on, so this issue was taken to the Office of Appeals. We received an Appeals settlement,which includes the 2007 tax year, on this issue, but are awaiting the approval of the Joint Committee on Taxation.
For 2007 and 2008, we have entered into the Compliance Assurance Program (CAP). Under CAP, the IRS begins its examinationprocess for the tax year before the tax return is filed, by examining significant transactions and events as they occur. The goal ofthe CAP program is to expedite the exam process and to reduce the level of uncertainty regarding a taxpayer’s tax filing positions.
The 2007 CAP audit has been completed and our tax return has been accepted as filed, pending the Joint Committee’s approvalof our Appeals settlement, discussed above.
Fieldwork on the 2008 CAP audit began during the fourth quarter 2008. No issues have been raised to date.
6. LOSS AND LOSS ADJUSTMENT EXPENSE RESERVES
Activity in the loss and loss adjustment expense reserves is summarized as follows:
(millions) 2008 2007 2006
Balance at January 1 $ 5,942.7 $5,725.0 $5,660.3Less reinsurance recoverables on unpaid losses 287.5 361.4 347.2
Net balance at January 1 5,655.2 5,363.6 5,313.1
Incurred related to:Current year 9,981.8 9,845.9 9,641.8Prior years 33.2 80.3 (246.9)
Total incurred 10,015.0 9,926.2 9,394.9
Paid related to:Current year 6,700.4 6,737.2 6,682.3Prior years 3,036.9 2,897.4 2,662.1
Total paid 9,737.3 9,634.6 9,344.4
Net balance at December 31 5,932.9 5,655.2 5,363.6Plus reinsurance recoverables on unpaid losses 244.5 287.5 361.4
Balance at December 31 $ 6,177.4 $5,942.7 $5,725.0
Our objective is to establish case and IBNR reserves that are adequate to cover all loss costs, while sustaining minimal variationfrom the date that the reserves are initially established until losses are fully developed. Our reserves developed unfavorably inboth 2008 and 2007, compared to favorable development in 2006. Total development consists of net changes made by ouractuarial department on prior accident year reserves, based on regularly scheduled reviews, claims settling for more or less thanreserved, emergence of unrecorded claims at rates different than reserved, and changes in reserve estimates by claimrepresentatives. In 2008, an increase in the number of late reported Commercial Auto claims, and an increase in the estimatedseverity on these claims, was a primary contributor to the unfavorable development. The unfavorable development in 2007 wasdue to the settlement of some large outstanding litigation, the number of large losses emerging from prior accident years beingmore than anticipated, plus the result of reviews of large bodily injury and uninsured motorist claims. The favorable developmentin 2006 reflected the recognition of lower severity for prior accident years than had been previously estimated.
Because we are primarily an insurer of motor vehicles, we have limited exposure to environmental, asbestos, and general liabilityclaims. We have established reserves for such exposures, in amounts that we believe to be adequate based on informationcurrently known. These claims are not expected to have a material effect on our liquidity, financial condition, cash flows, or resultsof operations.
We write personal and commercial auto insurance in the coastal states, which could be exposed to hurricanes or other naturalcatastrophes. Although the occurrence of a major catastrophe could have a significant effect on our monthly or quarterly results,we believe that, based on historical performance, such an event would not be so material as to disrupt the overall normaloperations of Progressive. We are unable to predict the frequency or severity of any such events that may occur in the near termor thereafter.
App.-A-20
7. REINSURANCE
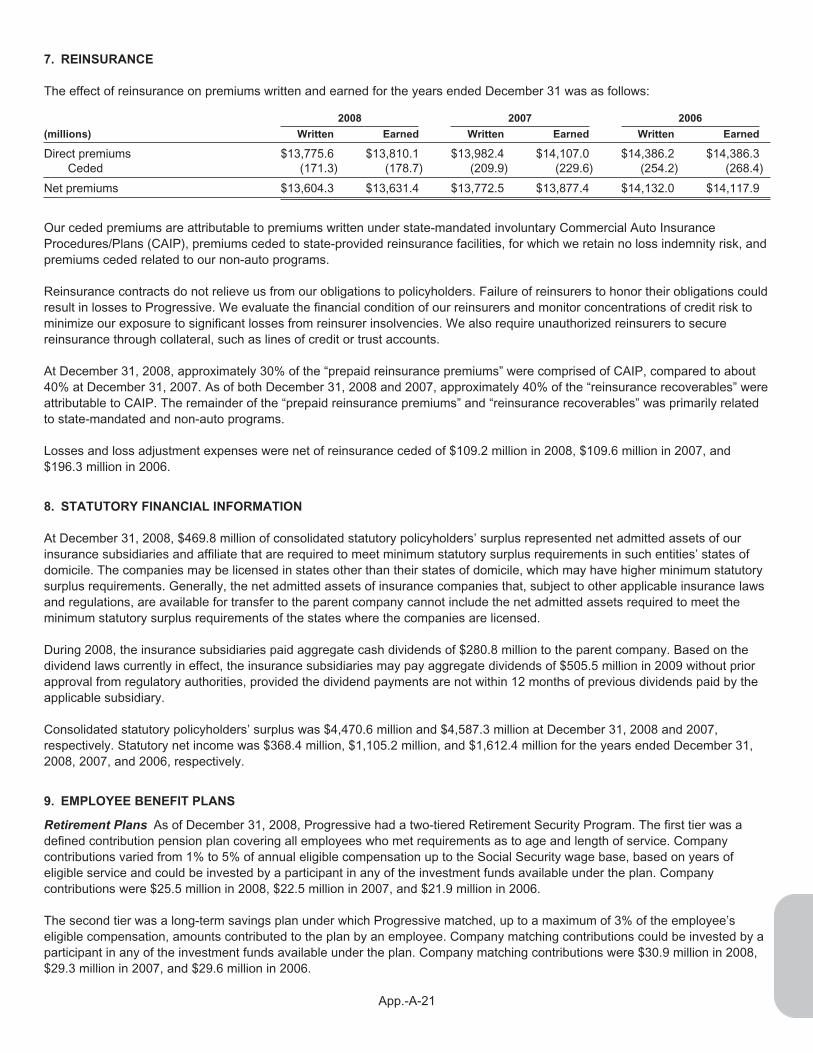
The effect of reinsurance on premiums written and earned for the years ended December 31 was as follows:
2008 2007 2006
(millions) Written Earned Written Earned Written Earned
Direct premiums $13,775.6 $13,810.1 $13,982.4 $14,107.0 $14,386.2 $14,386.3Ceded (171.3) (178.7) (209.9) (229.6) (254.2) (268.4)
Net premiums $13,604.3 $13,631.4 $13,772.5 $13,877.4 $14,132.0 $14,117.9
Our ceded premiums are attributable to premiums written under state-mandated involuntary Commercial Auto InsuranceProcedures/Plans (CAIP), premiums ceded to state-provided reinsurance facilities, for which we retain no loss indemnity risk, andpremiums ceded related to our non-auto programs.
Reinsurance contracts do not relieve us from our obligations to policyholders. Failure of reinsurers to honor their obligations couldresult in losses to Progressive. We evaluate the financial condition of our reinsurers and monitor concentrations of credit risk tominimize our exposure to significant losses from reinsurer insolvencies. We also require unauthorized reinsurers to securereinsurance through collateral, such as lines of credit or trust accounts.
At December 31, 2008, approximately 30% of the “prepaid reinsurance premiums” were comprised of CAIP, compared to about40% at December 31, 2007. As of both December 31, 2008 and 2007, approximately 40% of the “reinsurance recoverables” wereattributable to CAIP. The remainder of the “prepaid reinsurance premiums” and “reinsurance recoverables” was primarily relatedto state-mandated and non-auto programs.
Losses and loss adjustment expenses were net of reinsurance ceded of $109.2 million in 2008, $109.6 million in 2007, and$196.3 million in 2006.
8. STATUTORY FINANCIAL INFORMATION
At December 31, 2008, $469.8 million of consolidated statutory policyholders’ surplus represented net admitted assets of ourinsurance subsidiaries and affiliate that are required to meet minimum statutory surplus requirements in such entities’ states ofdomicile. The companies may be licensed in states other than their states of domicile, which may have higher minimum statutorysurplus requirements. Generally, the net admitted assets of insurance companies that, subject to other applicable insurance lawsand regulations, are available for transfer to the parent company cannot include the net admitted assets required to meet theminimum statutory surplus requirements of the states where the companies are licensed.
During 2008, the insurance subsidiaries paid aggregate cash dividends of $280.8 million to the parent company. Based on thedividend laws currently in effect, the insurance subsidiaries may pay aggregate dividends of $505.5 million in 2009 without priorapproval from regulatory authorities, provided the dividend payments are not within 12 months of previous dividends paid by theapplicable subsidiary.
Consolidated statutory policyholders’ surplus was $4,470.6 million and $4,587.3 million at December 31, 2008 and 2007,respectively. Statutory net income was $368.4 million, $1,105.2 million, and $1,612.4 million for the years ended December 31,2008, 2007, and 2006, respectively.
9. EMPLOYEE BENEFIT PLANS
Retirement Plans As of December 31, 2008, Progressive had a two-tiered Retirement Security Program. The first tier was adefined contribution pension plan covering all employees who met requirements as to age and length of service. Companycontributions varied from 1% to 5% of annual eligible compensation up to the Social Security wage base, based on years ofeligible service and could be invested by a participant in any of the investment funds available under the plan. Companycontributions were $25.5 million in 2008, $22.5 million in 2007, and $21.9 million in 2006.
The second tier was a long-term savings plan under which Progressive matched, up to a maximum of 3% of the employee’seligible compensation, amounts contributed to the plan by an employee. Company matching contributions could be invested by aparticipant in any of the investment funds available under the plan. Company matching contributions were $30.9 million in 2008,$29.3 million in 2007, and $29.6 million in 2006.
App.-A-21
Postemployment Benefits Progressive provides various postemployment benefits to former or inactive employees who meeteligibility requirements, their beneficiaries, and covered dependents. Postemployment benefits include salary continuation anddisability-related benefits, including workers’ compensation, and, if elected, continuation of health-care benefits for specifiedlimited periods. The liability for these benefits was $25.9 million at December 31, 2008, compared to $24.8 million in 2007.
Postretirement Benefits We provide postretirement health and life insurance benefits to all employees who met requirementsas to age and length of service at December 31, 1988. There are approximately 100 people in this group of employees. Ourfunding policy for the benefits is to contribute annually the maximum amount that can be deducted for federal income taxpurposes.
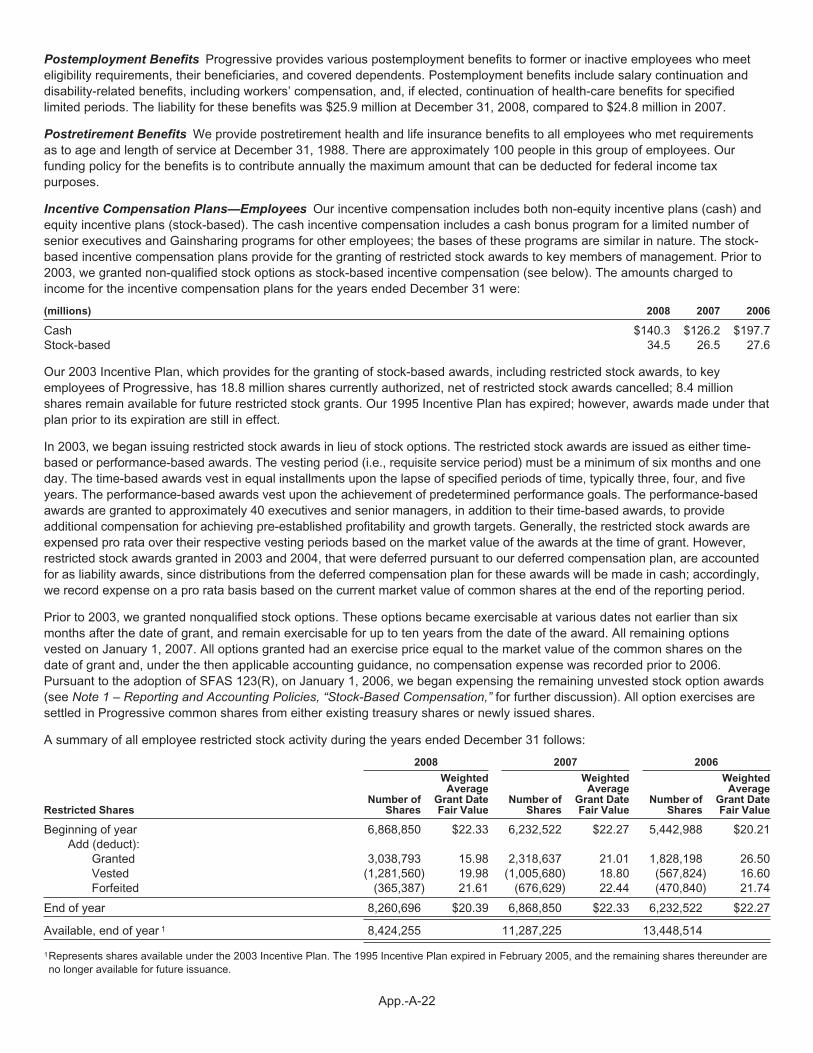
Incentive Compensation Plans—Employees Our incentive compensation includes both non-equity incentive plans (cash) andequity incentive plans (stock-based). The cash incentive compensation includes a cash bonus program for a limited number ofsenior executives and Gainsharing programs for other employees; the bases of these programs are similar in nature. The stock-based incentive compensation plans provide for the granting of restricted stock awards to key members of management. Prior to2003, we granted non-qualified stock options as stock-based incentive compensation (see below). The amounts charged toincome for the incentive compensation plans for the years ended December 31 were:
(millions) 2008 2007 2006
Cash $140.3 $126.2 $197.7Stock-based 34.5 26.5 27.6
Our 2003 Incentive Plan, which provides for the granting of stock-based awards, including restricted stock awards, to keyemployees of Progressive, has 18.8 million shares currently authorized, net of restricted stock awards cancelled; 8.4 millionshares remain available for future restricted stock grants. Our 1995 Incentive Plan has expired; however, awards made under thatplan prior to its expiration are still in effect.
In 2003, we began issuing restricted stock awards in lieu of stock options. The restricted stock awards are issued as either time-based or performance-based awards. The vesting period (i.e., requisite service period) must be a minimum of six months and oneday. The time-based awards vest in equal installments upon the lapse of specified periods of time, typically three, four, and fiveyears. The performance-based awards vest upon the achievement of predetermined performance goals. The performance-basedawards are granted to approximately 40 executives and senior managers, in addition to their time-based awards, to provideadditional compensation for achieving pre-established profitability and growth targets. Generally, the restricted stock awards areexpensed pro rata over their respective vesting periods based on the market value of the awards at the time of grant. However,restricted stock awards granted in 2003 and 2004, that were deferred pursuant to our deferred compensation plan, are accountedfor as liability awards, since distributions from the deferred compensation plan for these awards will be made in cash; accordingly,we record expense on a pro rata basis based on the current market value of common shares at the end of the reporting period.
Prior to 2003, we granted nonqualified stock options. These options became exercisable at various dates not earlier than sixmonths after the date of grant, and remain exercisable for up to ten years from the date of the award. All remaining optionsvested on January 1, 2007. All options granted had an exercise price equal to the market value of the common shares on thedate of grant and, under the then applicable accounting guidance, no compensation expense was recorded prior to 2006.Pursuant to the adoption of SFAS 123(R), on January 1, 2006, we began expensing the remaining unvested stock option awards(see Note 1 – Reporting and Accounting Policies, “Stock-Based Compensation,” for further discussion). All option exercises aresettled in Progressive common shares from either existing treasury shares or newly issued shares.
A summary of all employee restricted stock activity during the years ended December 31 follows:
2008 2007 2006
Restricted SharesNumber of
Shares
WeightedAverage
Grant DateFair Value
Number ofShares
WeightedAverage
Grant DateFair Value
Number ofShares
WeightedAverage
Grant DateFair Value
Beginning of year 6,868,850 $22.33 6,232,522 $22.27 5,442,988 $20.21Add (deduct):
Granted 3,038,793 15.98 2,318,637 21.01 1,828,198 26.50Vested (1,281,560) 19.98 (1,005,680) 18.80 (567,824) 16.60Forfeited (365,387) 21.61 (676,629) 22.44 (470,840) 21.74
End of year 8,260,696 $20.39 6,868,850 $22.33 6,232,522 $22.27
Available, end of year 1 8,424,255 11,287,225 13,448,514
1Represents shares available under the 2003 Incentive Plan. The 1995 Incentive Plan expired in February 2005, and the remaining shares thereunder areno longer available for future issuance.
App.-A-22

Of the 1,281,560 restricted stock awards that vested during the year ended December 31, 2008, 1,023,456 shares were notdeferred under our deferred compensation plans and 258,104 were deferred (see discussion of deferred compensation plansbelow). The aggregate fair value of the non-deferred awards, based on the respective grant date stock prices, was $20.5 million.Two types of deferred shares vested. First were 179,464 deferred liability awards. There was no intrinsic value attributed to theseshares which were deferred, since, as previously discussed, these awards were granted in 2003 or 2004 and, therefore, wereexpensed based on the current market value at the end of each reporting period. In addition, 78,640 deferred equity awardsvested which were granted in 2005. The aggregate fair value of these deferred awards, based on the grant date stock price, was$1.8 million.
During the year ended December 31, 2008, we recognized $34.5 million, or $22.4 million after taxes, of compensation expenserelated to our outstanding unvested restricted stock. During the year ended December 31, 2007, we recognized $26.5 million, or$17.8 million after taxes, of compensation expense related to our outstanding unvested restricted stock. During the year endedDecember 31, 2006, we recognized $27.6 million, or $17.9 million after taxes, of compensation expense related to ouroutstanding unvested restricted stock and stock option awards. At December 31, 2008, the total unrecognized compensation costrelated to unvested restricted stock awards was $83.2 million. This compensation expense will be recognized into the incomestatement over the weighted average vesting period of 2.67 years.
A summary of all employee stock option activity during the years ended December 31 follows:
2007 2006
Nonvested stock options outstandingNumber of
Shares
WeightedAverage
Grant DateFair Value
Number ofShares
WeightedAverage
Grant DateFair Value
Beginning of year 1,087,866 $5.82 4,232,220 $4.76Deduct:
Vested1 (1,087,866) 5.82 (3,053,352) 4.36Forfeited — — (91,002) 5.81
End of year — $ — 1,087,866 $5.82
1All remaining stock option awards vested on January 1, 2007.
In September 2007, we paid a $2.00 per common share special dividend to shareholders of record at the close of business onAugust 31, 2007. Since the holders of the outstanding stock option awards were not entitled to receive the cash dividend, wewere required to increase the number of shares and reduce the exercise price of any of our then outstanding stock option awardsin accordance with the antidilution provisions of our incentive plans; prior year information was not adjusted. This adjustment isreflected in the appropriate tables below.
2008 2007 2006
Options OutstandingNumber of
Shares
WeightedAverageExercise
PriceNumber of
Shares
WeightedAverageExercise
PriceNumber of
Shares
WeightedAverageExercise
Price
Beginning of year 11,738,502 $7.75 13,747,221 $ 8.75 19,621,476 $ 8.44Add:
Antidilution adjustment — — 1,201,984 NM — —Deduct:
Exercised (3,235,229) 7.86 (3,208,873) 9.10 (5,649,193) 7.55Forfeited — — (1,830) 11.78 (225,062) 12.09
End of year 8,503,273 $7.71 11,738,502 $ 7.75 13,747,221 $ 8.75
Exercisable, end of year 8,503,273 $7.71 11,738,502 $ 7.75 12,659,355 $ 8.38
NM=not meaningful
The total pretax intrinsic value of options exercised during the year ended December 31, 2008, was $30.5 million, based on theactual stock price at time of exercise.
The following employee stock options were outstanding and exercisable as of December 31, 2008:
Number of Shares
WeightedAverage
Exercise PriceAggregate
Intrinsic Value
Weighted AverageRemaining
Contractual Life
8,503,273 $7.71 $60.4 million 1.99 years
App.-A-23

The aggregate intrinsic value in the preceding table represents the total pretax intrinsic value, based on the difference betweenour closing stock price of $14.81 on December 31, 2008, and the exercise price of the options, which is the amount that wouldhave been received by the option holders, before taxes, had all option holders exercised their options as of that date. All of theexercisable options at December 31, 2008, were “in-the-money.”
Incentive Compensation Plans—Directors Our 2003 Directors Equity Incentive Plan, which provides for the granting of stock-based awards, including restricted stock awards to non-employee directors of Progressive, has 1.4 million shares currentlyauthorized, net of restricted stock awards cancelled; 1.0 million shares remain available for future restricted stock grants. Our1998 Directors’ Stock Option Plan expired on April 24, 2008; however, awards made under this plan prior to its expiration are stillin effect.
In 2003, we began issuing restricted stock awards to non-employee directors as the equity component of their compensation. Therestricted stock awards are issued as time-based awards. The vesting period (i.e., requisite service period) must be a minimum ofsix months and one day. The time-based awards granted to date have included vesting periods of eleven months from the date ofeach grant. The restricted stock awards are expensed pro rata over their respective vesting periods based on the market value ofthe awards at the time of grant.
Prior to 2003, we granted nonqualified stock options as the equity component of the directors compensation. These options weregranted for periods up to ten years, became exercisable at various dates not earlier than six months after the date of grant, andremain exercisable for specified periods thereafter. All options granted had an exercise price equal to the market value of thecommon shares on the date of grant and, under the then applicable accounting guidance, no compensation expense wasrecorded. All option exercises are settled in Progressive common shares from either existing treasury shares or newly issuedshares.
In April 2006, we began granting restricted stock awards to non-employee directors as their sole compensation as a member ofthe Board of Directors. From April 2003 through April 2006, we issued restricted stock awards in addition to other retainer andmeeting fees.
A summary of all directors restricted stock activity during the years ended December 31 follows:
2008 2007 2006
Restricted SharesNumber of
Shares
WeightedAverage
Grant DateFair Value
Number ofShares
WeightedAverage
Grant DateFair Value
Number ofShares
WeightedAverage
Grant DateFair Value
Beginning of year 68,595 $23.52 66,031 $26.64 50,244 $21.91Add (deduct):
Granted 105,420 17.96 76,074 23.52 66,031 26.64Vested (68,595) 23.52 (66,031) 26.64 (50,244) 21.91Forfeited — — (7,479) 23.52 — —
End of year 105,420 $17.96 68,595 $23.52 66,031 $26.64
Available, end of year 1 988,855 1,094,275 1,170,349
1Represents shares available under the 2003 Directors Equity Incentive Plan.
A summary of all stock option activity for both current and former directors during the years ended December 31 follows:
2008 2007 2006
Options OutstandingNumber of
Shares
WeightedAverageExercise
PriceNumber of
Shares
WeightedAverageExercise
PriceNumber of
Shares
WeightedAverageExercise
Price
Beginning of year 628,813 $7.97 772,664 $8.59 873,108 $8.20Add:
Antidilution adjustment — — 55,851 NM — —Deduct:
Exercised (227,456) 6.86 (199,702) 8.16 (100,444) 5.18
End of year 401,357 $8.60 628,813 $7.97 772,664 $8.59
Exercisable, end of year1 401,357 $8.60 628,813 $7.97 772,664 $8.59
NM = not meaningful
1The 1998 Directors’ Stock Option Plan has expired.
App.-A-24
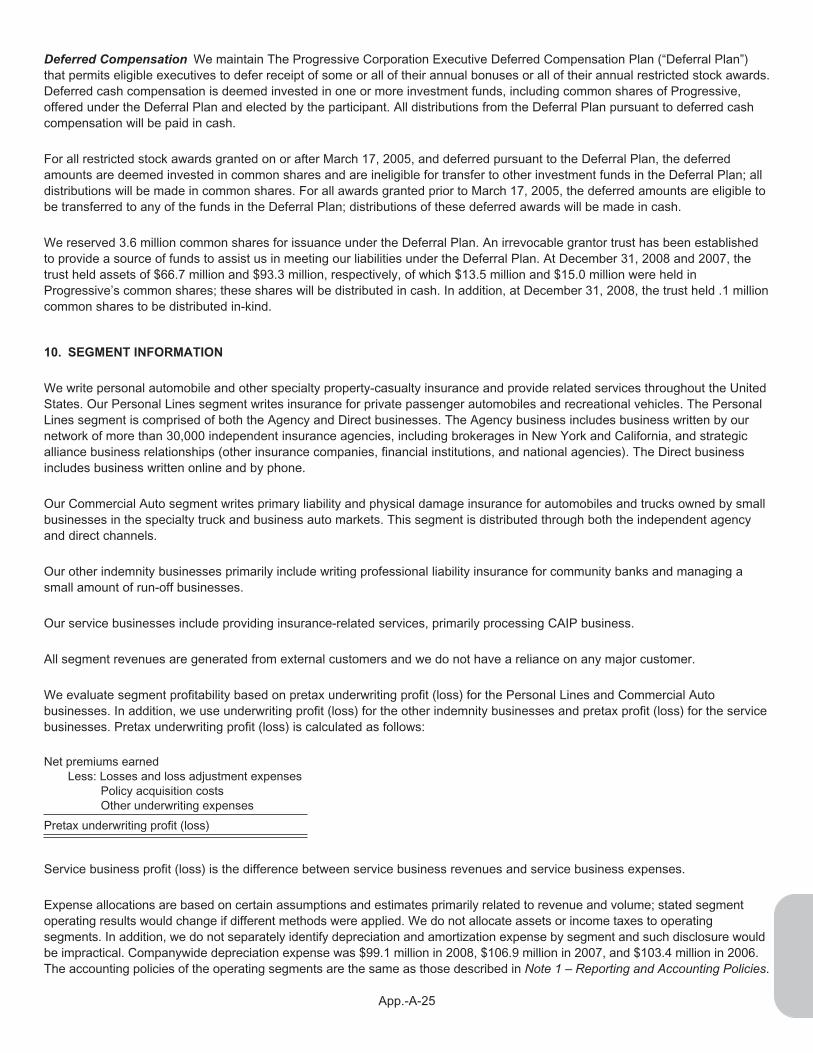
Deferred Compensation We maintain The Progressive Corporation Executive Deferred Compensation Plan (“Deferral Plan”)that permits eligible executives to defer receipt of some or all of their annual bonuses or all of their annual restricted stock awards.Deferred cash compensation is deemed invested in one or more investment funds, including common shares of Progressive,offered under the Deferral Plan and elected by the participant. All distributions from the Deferral Plan pursuant to deferred cashcompensation will be paid in cash.
For all restricted stock awards granted on or after March 17, 2005, and deferred pursuant to the Deferral Plan, the deferredamounts are deemed invested in common shares and are ineligible for transfer to other investment funds in the Deferral Plan; alldistributions will be made in common shares. For all awards granted prior to March 17, 2005, the deferred amounts are eligible tobe transferred to any of the funds in the Deferral Plan; distributions of these deferred awards will be made in cash.
We reserved 3.6 million common shares for issuance under the Deferral Plan. An irrevocable grantor trust has been establishedto provide a source of funds to assist us in meeting our liabilities under the Deferral Plan. At December 31, 2008 and 2007, thetrust held assets of $66.7 million and $93.3 million, respectively, of which $13.5 million and $15.0 million were held inProgressive’s common shares; these shares will be distributed in cash. In addition, at December 31, 2008, the trust held .1 millioncommon shares to be distributed in-kind.
10. SEGMENT INFORMATION
We write personal automobile and other specialty property-casualty insurance and provide related services throughout the UnitedStates. Our Personal Lines segment writes insurance for private passenger automobiles and recreational vehicles. The PersonalLines segment is comprised of both the Agency and Direct businesses. The Agency business includes business written by ournetwork of more than 30,000 independent insurance agencies, including brokerages in New York and California, and strategicalliance business relationships (other insurance companies, financial institutions, and national agencies). The Direct businessincludes business written online and by phone.
Our Commercial Auto segment writes primary liability and physical damage insurance for automobiles and trucks owned by smallbusinesses in the specialty truck and business auto markets. This segment is distributed through both the independent agencyand direct channels.
Our other indemnity businesses primarily include writing professional liability insurance for community banks and managing asmall amount of run-off businesses.
Our service businesses include providing insurance-related services, primarily processing CAIP business.
All segment revenues are generated from external customers and we do not have a reliance on any major customer.
We evaluate segment profitability based on pretax underwriting profit (loss) for the Personal Lines and Commercial Autobusinesses. In addition, we use underwriting profit (loss) for the other indemnity businesses and pretax profit (loss) for the servicebusinesses. Pretax underwriting profit (loss) is calculated as follows:
Net premiums earnedLess: Losses and loss adjustment expenses
Policy acquisition costsOther underwriting expenses
Pretax underwriting profit (loss)
Service business profit (loss) is the difference between service business revenues and service business expenses.
Expense allocations are based on certain assumptions and estimates primarily related to revenue and volume; stated segmentoperating results would change if different methods were applied. We do not allocate assets or income taxes to operatingsegments. In addition, we do not separately identify depreciation and amortization expense by segment and such disclosure wouldbe impractical. Companywide depreciation expense was $99.1 million in 2008, $106.9 million in 2007, and $103.4 million in 2006.The accounting policies of the operating segments are the same as those described in Note 1 – Reporting and Accounting Policies.
App.-A-25
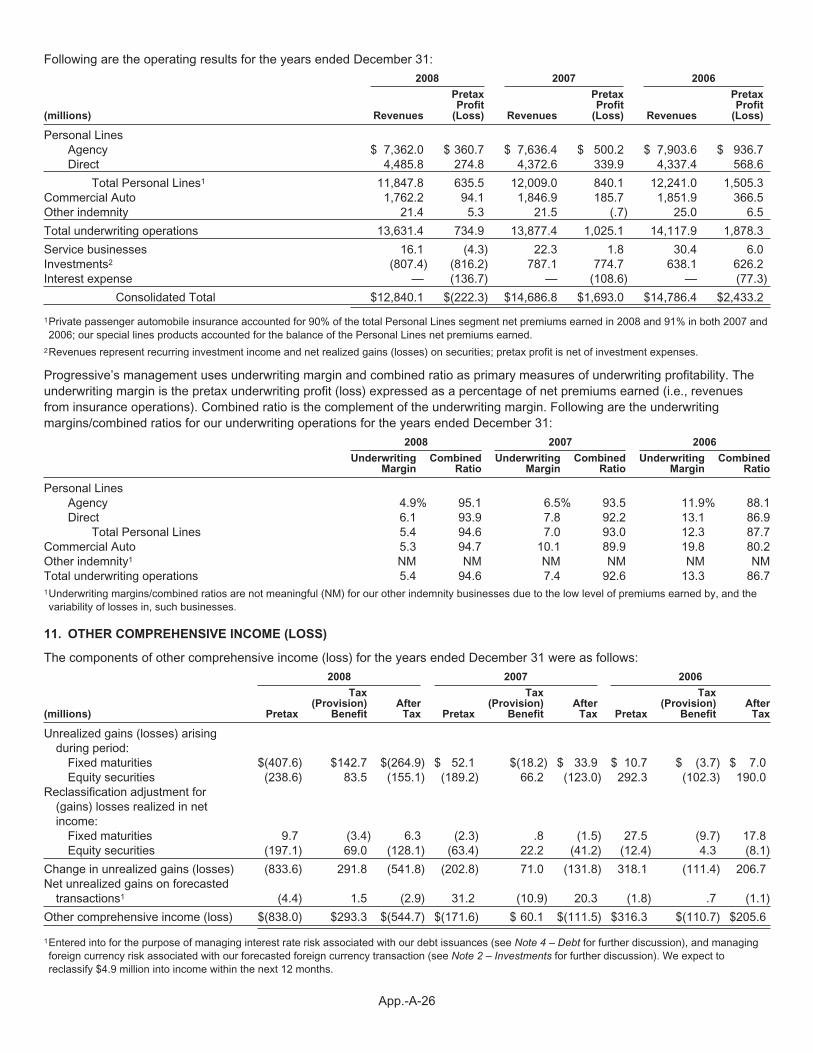
Following are the operating results for the years ended December 31:
2008 2007 2006
(millions) Revenues
PretaxProfit
(Loss) Revenues
PretaxProfit
(Loss) Revenues
PretaxProfit
(Loss)
Personal LinesAgency $ 7,362.0 $ 360.7 $ 7,636.4 $ 500.2 $ 7,903.6 $ 936.7Direct 4,485.8 274.8 4,372.6 339.9 4,337.4 568.6
Total Personal Lines1 11,847.8 635.5 12,009.0 840.1 12,241.0 1,505.3Commercial Auto 1,762.2 94.1 1,846.9 185.7 1,851.9 366.5Other indemnity 21.4 5.3 21.5 (.7) 25.0 6.5
Total underwriting operations 13,631.4 734.9 13,877.4 1,025.1 14,117.9 1,878.3
Service businesses 16.1 (4.3) 22.3 1.8 30.4 6.0Investments2 (807.4) (816.2) 787.1 774.7 638.1 626.2Interest expense — (136.7) — (108.6) — (77.3)
Consolidated Total $12,840.1 $(222.3) $14,686.8 $1,693.0 $14,786.4 $2,433.2
1Private passenger automobile insurance accounted for 90% of the total Personal Lines segment net premiums earned in 2008 and 91% in both 2007 and2006; our special lines products accounted for the balance of the Personal Lines net premiums earned.
2Revenues represent recurring investment income and net realized gains (losses) on securities; pretax profit is net of investment expenses.
Progressive’s management uses underwriting margin and combined ratio as primary measures of underwriting profitability. Theunderwriting margin is the pretax underwriting profit (loss) expressed as a percentage of net premiums earned (i.e., revenuesfrom insurance operations). Combined ratio is the complement of the underwriting margin. Following are the underwritingmargins/combined ratios for our underwriting operations for the years ended December 31:
2008 2007 2006
UnderwritingMargin
CombinedRatio
UnderwritingMargin
CombinedRatio
UnderwritingMargin
CombinedRatio
Personal LinesAgency 4.9% 95.1 6.5% 93.5 11.9% 88.1Direct 6.1 93.9 7.8 92.2 13.1 86.9
Total Personal Lines 5.4 94.6 7.0 93.0 12.3 87.7Commercial Auto 5.3 94.7 10.1 89.9 19.8 80.2Other indemnity1 NM NM NM NM NM NMTotal underwriting operations 5.4 94.6 7.4 92.6 13.3 86.71Underwriting margins/combined ratios are not meaningful (NM) for our other indemnity businesses due to the low level of premiums earned by, and thevariability of losses in, such businesses.
11. OTHER COMPREHENSIVE INCOME (LOSS)
The components of other comprehensive income (loss) for the years ended December 31 were as follows:
2008 2007 2006
(millions) Pretax
Tax(Provision)
BenefitAfter
Tax Pretax
Tax(Provision)
BenefitAfter
Tax Pretax
Tax(Provision)
BenefitAfter
Tax
Unrealized gains (losses) arisingduring period:
Fixed maturities $(407.6) $142.7 $(264.9) $ 52.1 $(18.2) $ 33.9 $ 10.7 $ (3.7) $ 7.0Equity securities (238.6) 83.5 (155.1) (189.2) 66.2 (123.0) 292.3 (102.3) 190.0
Reclassification adjustment for(gains) losses realized in netincome:
Fixed maturities 9.7 (3.4) 6.3 (2.3) .8 (1.5) 27.5 (9.7) 17.8Equity securities (197.1) 69.0 (128.1) (63.4) 22.2 (41.2) (12.4) 4.3 (8.1)
Change in unrealized gains (losses) (833.6) 291.8 (541.8) (202.8) 71.0 (131.8) 318.1 (111.4) 206.7Net unrealized gains on forecasted
transactions1 (4.4) 1.5 (2.9) 31.2 (10.9) 20.3 (1.8) .7 (1.1)
Other comprehensive income (loss) $(838.0) $293.3 $(544.7) $(171.6) $ 60.1 $(111.5) $316.3 $(110.7) $205.6
1Entered into for the purpose of managing interest rate risk associated with our debt issuances (see Note 4 – Debt for further discussion), and managingforeign currency risk associated with our forecasted foreign currency transaction (see Note 2 – Investments for further discussion). We expect toreclassify $4.9 million into income within the next 12 months.
App.-A-26

12. LITIGATION
The Progressive Corporation and/or its insurance subsidiaries are named as defendants in various lawsuits arising out of claimsmade under insurance policies in the ordinary course of our business. All legal actions relating to such insurance claims areconsidered by us in establishing our loss and loss adjustment expense reserves.
In addition, The Progressive Corporation and/or its insurance subsidiaries are named as defendants in a number of class actionor individual lawsuits arising out of the operation of the insurance subsidiaries. Other insurance companies face many of thesesame issues. The lawsuits discussed below are in various stages of development. We plan to contest these suits vigorously, butmay pursue settlement negotiations in some cases, if appropriate. The outcomes of these cases are uncertain at this time.
In accordance with GAAP, we establish loss reserves for a lawsuit when it is probable that a loss has been incurred and we canreasonably estimate its potential exposure (referred to as a loss that is both “probable and estimable” in the discussion below).Certain of the cases for which we have established reserves under this standard are mentioned in the discussion below. Basedon currently available information, we believe that our reserves for these lawsuits are reasonable and that the amounts reserveddid not have a material effect on our consolidated financial condition or results of operations. However, if any one or more ofthese cases results in a judgment against, or settlement by, our insurance subsidiaries for an amount that is significantly greaterthan the amount so reserved, the resulting liability could have a material effect on our consolidated financial condition, cash flows,and results of operations.
As to lawsuits that do not satisfy both parts of this GAAP standard (i.e., the loss is not both probable and estimable), we have notestablished reserves at this time. In the event that any one or more of these cases results in a substantial judgment against, orsettlement by, Progressive, the resulting liability could also have a material effect on our consolidated financial condition, cashflows, and results of operations.
Following is a discussion of potentially significant pending cases at December 31, 2008 and certain cases resolved during 2008,2007, and 2006.
There are four putative class action lawsuits and one that was a certified class action lawsuit challenging our insurancesubsidiaries’ use of certain automated database vendors or software to assist in the adjustment of bodily injury claims. A fifthputative class action lawsuit was voluntarily dismissed by the plaintiff in 2007. In each of these lawsuits, the plaintiffs allege thatthese databases or software systematically undervalue the claims. With respect to the four pending putative class action lawsuits,we do not consider a loss from these cases to be probable and estimable, and are unable to estimate a range of loss, if any, atthis time. With respect to the one certified class action lawsuit, we engaged in extensive settlement negotiations and reached asettlement on a nationwide basis, and a reserve was established accordingly. The settlement received preliminary approval fromthe court in November 2007, at which time the court certified the class action for settlement purposes only. All payments havenow been made and the file is closed. The amount of the settlement was not material to our consolidated financial condition, cashflows, or results of operations.
There are eight class action lawsuits challenging certain aspects of our insurance subsidiaries use of credit information andcompliance with notice requirements under the federal Fair Credit Reporting Act. During 2004, we entered into a settlementagreement to resolve these cases, had received preliminary court approval of the settlement, and had established a reserveaccordingly. In 2005, the court denied final approval of the proposed settlement. In 2006, an amended settlement received trialcourt approval, and the loss reserve was adjusted accordingly. The adjustment was not material to our financial condition, cashflows, and results of operations in 2006. After objecting class members filed an appeal, the Court of Appeals affirmed the trialcourt’s decision to approve the settlement. We are now in the process of administering the settlement. Once the administration iscompleted, all of the eight class action lawsuits will be resolved. There has been no further action on any of the six individualcases that were stayed pending the outcome of the class actions. None of these cases pose a material threat to our consolidatedfinancial condition, cash flows, and results of operations.
There was one putative class action lawsuit challenging the installment fee program used by our insurance subsidiaries, whichwas settled in May 2008. The amount of the settlement was not material to our consolidated financial condition, cash flows, andresults of operations. We had successfully defended similar cases in the past, including one case that was dismissed in 2007 andanother that was dismissed in 2005.
There is one certified class action lawsuit and one putative class action lawsuit alleging that the insurance subsidiaries’ ratingpractices at renewal are improper. We prevailed in a similar putative class action in December 2004. With respect to the
App.-A-27

putative class action lawsuit, we do not consider a loss to be probable and estimable, and are unable to estimate a range of loss,if any, at this time. With respect to the certified class action lawsuit, we engaged in extensive settlement negotiations and reacheda settlement on a statewide basis. The settlement received trial court approval in December 2007. All payments have now beenmade and the case is closed. The amount of the settlement was not material to our consolidated financial condition, cash flows,and results of operations.
There are three certified class action lawsuits and three putative class action lawsuits pending against our insurance subsidiaries,alleging that we failed to adjust MRI bills to a consumer price index in violation of a statute. With respect to the three certifiedclass action lawsuits, we engaged in extensive settlement negotiations and reached a settlement on a statewide basis. Thesettlement received trial court approval and was paid during 2007. The amount of the settlement was not material to ourconsolidated financial condition, cash flows, and results of operations. With respect to the three putative class action lawsuits, twowere dismissed and the other was settled for a nominal amount.
Progressive’s insurance subsidiaries are defending two putative class actions alleging that we violate the “make-whole” and“common-fund” doctrines. Specifically, it is alleged that we may obtain reimbursement of medical payments made on behalf of aninsured only when the insured has been made whole by a third-party tortfeasor and that we further must deduct from thereimbursement amount a proportionate share of the insured’s legal fees for pursuing the third-party tortfeasor. We do not considera loss from these cases to be probable and estimable, and are unable to estimate a range of loss, if any, at this time.
There is one certified nationwide class action lawsuit challenging our insurance subsidiaries’ practice of taking betterment on boatrepairs. While we consider a loss from this case to be probable, it is not currently estimable. As a result, we are unable toestimate a range of loss, if any, at this time.
There are three putative class action lawsuits challenging the labor rates our insurance subsidiaries pay to auto body repairshops. One action was brought on behalf of insureds, while the other two were brought on behalf of repair facilities. We do notconsider a loss from these cases to be probable and estimable, and are unable to estimate a range of loss, if any, at this time.
There are four putative class action lawsuits challenging Progressive’s insurance subsidiaries’ practice in Florida of payingpersonal injury protection (PIP) and first-party medical payments at 200% of the amount allowed by Medicare. We do not considera loss from these cases to be probable and estimable, and are unable to estimate a range of loss, if any, at this time.
There is one putative class action lawsuit alleging that Progressive’s insurance subsidiaries used non-conforming underinsuredmotorist rejection forms. We have engaged in extensive settlement negotiations and reached a settlement on a statewide basis.The settlement has been approved by the court. The amount of the settlement was not material to our consolidated financialcondition, cash flows, and results of operations.
In July 2005, we settled a state class action lawsuit alleging that Progressive’s insurance subsidiaries used non-conforminguninsured/underinsured (UM/UIM) motorist rejection forms. The settlement received trial court approval in October 2005, and waspaid during 2006. The amount of the settlement was not material to our consolidated financial condition, cash flows, and results ofoperations.
There is one certified class action lawsuit seeking refunds of all UIM premiums and certain UM premiums on grounds that thecoverages were illusory. We have engaged in extensive settlement negotiations and reached a settlement on a statewide basis.The settlement received preliminary approval from the court in December 2007. All payments have been made. The amount ofthe settlement was not material to our consolidated financial condition, cash flows, and results of operations.
There is one certified class action lawsuit alleging that Progressive’s insurance subsidiaries failed to offer certain enhanced PIPbenefits. We do not consider a loss from this case to be probable and estimable, and are unable to estimate a range of loss, ifany, at this time.
There is one certified class action lawsuit seeking interest on PIP payments that allegedly were late. We understand that thereare a number of similar class actions against others in the insurance industry. We do not consider a loss from this case to beprobable and estimable, and are unable to estimate a range of loss, if any, at this time.
In 2006, we settled two state class action lawsuits pending against Progressive’s insurance subsidiaries in Florida, challengingthe legality of our payment of preferred provider rates on PIP claims. The settlement received trial court approval
App.-A-28

in August 2006 and was paid in 2006. The amount of the settlement was not material to our consolidated financial condition, cashflows, and results of operations.
In 2006, we settled a nationwide class action lawsuit challenging our insurance subsidiaries’ use of certain automated databasevendors to assist in the evaluation of total loss claims. The settlement received trial court approval and was paid during 2006. Theamount of the settlement was not material to our consolidated financial condition, cash flows, and results of operations.
Progressive’s subsidiaries are also named as a defendant in individual lawsuits related to employment issues. The outcomes ofthese cases are uncertain, but we do not believe that they will have a material impact on our financial condition, cash flows, andresults of operations.
In 2008, we reached agreement in principle on one class action lawsuit challenging our classification of certain job titles under theFair Labor Standards Act. We are awaiting approval by the court. The amount of the settlement was not material to ourconsolidated financial condition, cash flows, and results of operations.
13. COMMITMENTS AND CONTINGENCIES
We have certain noncancelable operating lease commitments with lease terms greater than one year for property and computerequipment. The minimum commitments under these agreements at December 31, 2008, were as follows:
(millions)Year Commitment
2009 $ 86.72010 64.32011 40.22012 26.82013 11.3Thereafter 20.0
Total $249.3
Some of the leases have options to renew at the end of the lease periods. The expense we incurred for the leases disclosedabove, as well as other operating leases that may be cancelable or have terms less than one year, was:
(millions)Year Expense
2008 $124.82007 139.52006 138.8
As of December 31, 2008, we had open investment funding commitments of $.2 million; we had no uncollateralized lines or lettersof credit as of December 31, 2008 or 2007.
App.-A-29

Management’s Report on Internal Control over Financial Reporting
Progressive’s management is responsible for establishing and maintaining adequate internal control over financial reporting, assuch term is defined in Rule 13a-15(f) under the Securities Exchange Act of 1934. Our internal control structure was designedunder the supervision of our Chief Executive Officer and Chief Financial Officer to provide reasonable assurance regarding thereliability of financial reporting and the preparation of financial statements for external purposes in accordance with accountingprinciples generally accepted in the United States of America.
Our internal control over financial reporting includes policies and procedures that pertain to the maintenance of records that, inreasonable detail, accurately and fairly reflect our transactions and dispositions of assets; provide reasonable assurance thattransactions are recorded as necessary to permit preparation of financial statements in accordance with generally acceptedaccounting principles, and that our receipts and expenditures are being made only in accordance with authorizations of ourmanagement and our directors; and provide reasonable assurance regarding prevention or timely detection of unauthorizedacquisition, use, or disposition of our assets that could have a material effect on our financial statements.
Under the supervision and with the participation of our management, including our Chief Executive Officer and Chief FinancialOfficer, we conducted an evaluation of the effectiveness of our internal control over financial reporting based on the framework inInternal Control—Integrated Framework issued by the Committee of Sponsoring Organizations of the Treadway Commission(COSO). Based on our evaluation under the framework in Internal Control—Integrated Framework, management concluded thatour internal control over financial reporting was effective as of December 31, 2008.
During the fourth quarter 2008, there were no changes in our internal control over financial reporting identified in the internalcontrol review process that materially affected, or are reasonably likely to materially affect, our internal control over financialreporting.
PricewaterhouseCoopers LLP, an independent registered public accounting firm that audited the financial statements included inthis Annual Report, has audited, and issued an attestation report on the effectiveness of, our internal control over financialreporting as of December 31, 2008; such report appears herein.
CEO and CFO Certifications
Glenn M. Renwick, President and Chief Executive Officer of The Progressive Corporation, and Brian C. Domeck, Vice Presidentand Chief Financial Officer of The Progressive Corporation, have issued the certifications required by Sections 302 and 906 ofThe Sarbanes-Oxley Act of 2002 and applicable SEC regulations with respect to Progressive’s 2008 Annual Report on Form10-K, including the financial statements provided in this Report. Among other matters required to be included in thosecertifications, Mr. Renwick and Mr. Domeck have each certified that, to the best of his knowledge, the financial statements, andother financial information included in the Annual Report on Form 10-K, fairly present in all material respects the financialcondition, results of operations, and cash flows of Progressive as of, and for, the periods presented. See Exhibits 31 and 32 toProgressive’s Annual Report on Form 10-K for the complete Section 302 and 906 certifications, respectively.
In addition, Mr. Renwick submitted his annual certification to the New York Stock Exchange (NYSE) on May 16, 2008, stating thathe was not aware of any violation by Progressive of the NYSE corporate governance listing standards, as required bySection 303A.12(a) of the NYSE Listed Company Manual.
App.-A-30

Report of Independent Registered Public Accounting Firm
To the Board of Directors and Shareholders of The Progressive Corporation:
In our opinion, the accompanying consolidated balance sheets and the related consolidated statements of income, changes inshareholders’ equity and cash flows present fairly, in all material respects, the financial position of The Progressive Corporationand its subsidiaries at December 31, 2008 and 2007, and the results of their operations and their cash flows for each of the threeyears in the period ended December 31, 2008 in conformity with accounting principles generally accepted in the United States ofAmerica. Also in our opinion, the Company maintained, in all material respects, effective internal control over financial reportingas of December 31, 2008, based on criteria established in Internal Control—Integrated Framework issued by the Committee ofSponsoring Organizations of the Treadway Commission (COSO). The Company’s management is responsible for these financialstatements, for maintaining effective internal control over financial reporting and for its assessment of the effectiveness of internalcontrol over financial reporting, included in the accompanying Management’s Report on Internal Control over Financial Reporting.Our responsibility is to express opinions on these financial statements and on the Company’s internal control over financialreporting based on our integrated audits. We conducted our audits in accordance with the standards of the Public CompanyAccounting Oversight Board (United States). Those standards require that we plan and perform the audits to obtain reasonableassurance about whether the financial statements are free of material misstatement and whether effective internal control overfinancial reporting was maintained in all material respects. Our audits of the financial statements included examining, on a testbasis, evidence supporting the amounts and disclosures in the financial statements, assessing the accounting principles usedand significant estimates made by management, and evaluating the overall financial statement presentation. Our audit of internalcontrol over financial reporting included obtaining an understanding of internal control over financial reporting, assessing the riskthat a material weakness exists, and testing and evaluating the design and operating effectiveness of internal control based onthe assessed risk. Our audits also included performing such other procedures as we considered necessary in the circumstances.We believe that our audits provide a reasonable basis for our opinions.
A company’s internal control over financial reporting is a process designed to provide reasonable assurance regarding thereliability of financial reporting and the preparation of financial statements for external purposes in accordance with generallyaccepted accounting principles. A company’s internal control over financial reporting includes those policies and procedures that(i) pertain to the maintenance of records that, in reasonable detail, accurately and fairly reflect the transactions and dispositions ofthe assets of the company; (ii) provide reasonable assurance that transactions are recorded as necessary to permit preparation offinancial statements in accordance with generally accepted accounting principles, and that receipts and expenditures of thecompany are being made only in accordance with authorizations of management and directors of the company; and (iii) providereasonable assurance regarding prevention or timely detection of unauthorized acquisition, use, or disposition of the company’sassets that could have a material effect on the financial statements.
Because of its inherent limitations, internal control over financial reporting may not prevent or detect misstatements. Also,projections of any evaluation of effectiveness to future periods are subject to the risk that controls may become inadequatebecause of changes in conditions, or that the degree of compliance with the policies or procedures may deteriorate.
/s/ PricewaterhouseCoopers LLPCleveland, OhioFebruary 25, 2009
App.-A-31

The Progressive Corporation and SubsidiariesManagement’s Discussion and Analysis of Financial Condition and Results of Operations
The consolidated financial statements and the related notes, together with the supplemental information, should be read inconjunction with the following discussion and analysis of the consolidated financial condition and results of operations.
I. OVERVIEW
The Progressive Corporation is a holding company that does not have any revenue producing operations, physical property, oremployees of its own. The Progressive Group of Insurance Companies, together with our non-insurance subsidiaries, comprisewhat we refer to as Progressive. Progressive has been in business since 1937 and is estimated to be the country’s fourth largestprivate passenger auto insurer based on net premiums written during 2008. Through our insurance companies, we offer personalautomobile insurance and other specialty property-casualty insurance and related services throughout the United States. OurPersonal Lines segment writes insurance for private passenger automobiles and recreational vehicles through more than 30,000independent insurance agencies and directly to consumers online and over the phone. Our Commercial Auto segment, whichwrites through both the independent agency and direct channels, offers insurance for cars and trucks (e.g., pick-up or paneltrucks) owned by small businesses and is estimated to be in the top four in its industry. These underwriting operations, combinedwith our service and investment operations, make up the consolidated group.
The Progressive Corporation receives cash through subsidiary dividends, borrowings, security sales, and other transactions, anduses these funds to contribute to its subsidiaries (e.g., to support growth), to make payments to shareholders and debt holders(e.g., dividends and interest, respectively), to repurchase its common shares, and for other business purposes that might arise. In2008, the holding company received $30.4 million of dividends from its subsidiaries, net of capital contributions. In January 2008,we paid $98.3 million of dividends to shareholders under our annual variable dividend policy for 2007; no dividend was declaredfor 2008 as discussed below. During the year, we also used $179.4 million to repurchase 9.9 million Progressive common shares,at an average cost of $18.09 per share. We had no debt that matured in 2008. The holding company also has access to fundsheld in a non-insurance subsidiary; at year-end 2008, $1.0 billion of marketable securities were available in this company. On aconsolidated basis, we generated positive operating cash flows of $1.5 billion in 2008.
For 2008, Progressive generated a net loss of $70.0 million, or $.10 per share, driven by $1.4 billion of net realized losses in ourinvestment portfolio. This was our first net loss in 26 years. Our insurance operations had a solid year with underwritingprofitability of $734.9 million. Although written and earned premiums did not increase during the year, reflecting the prolongedperiod of rate declines that ran until late 2007, we achieved an increase in the number of policies that were in force at the end of2008, compared to year-end 2007. Several initiatives are underway to help spur our personal auto growth. Our Commercial Autobusiness continues to feel the effect of the weakening economy and competitive pressures on its ability to generate both premiumand policy growth.
During 2008, our investment portfolio recognized nearly $1.9 billion of write-downs on securities determined to have other-than-temporary declines in market value, with 90% of the write-downs relating to our preferred stock holdings. We ended 2008 with$6.4 billion of total capital (debt and equity), $718.6 million less than at the start of the year after investment losses and sharerepurchases. We continue to manage our investing and financing activities in order to maintain sufficient capital to support all theinsurance we can profitably underwrite and service.
A. Operations
In 2008, our insurance subsidiaries generated underwriting profitability of 5.4%, which exceeded our targeted profitabilityobjective of 4%. Companywide policies in force increased 3% over year-end 2007. Nevertheless, net premiums written andearned decreased 1% and 2%, respectively, reflecting the effect of previous rate reductions and shifts in the mix of businesswritten. Changes in net premiums written are a function of new business applications (i.e., issued policies), premium per policy,and retention.
During 2008, we saw a decrease in total new applications, primarily driven by decreases in our Agency auto and CommercialAuto businesses. New application growth in both businesses continues to be a challenge. On the other hand, the Direct auto andspecial lines businesses saw new applications increase during the year. We evaluate new business application growth on astate-by-state basis. For 2008, 18 of our states experienced growth in new personal auto applications. In late 2007 and into 2008,we partially restricted some classes of our Agency auto new business in New York and California, hindering our overall Agencyauto growth. We have received rate relief in New York and have lifted the restrictions for 2009, and we continue to improveunderwriting processes in California.
App.-A-32

In an effort to spur personal auto growth, we have several initiatives underway aimed at providing distinctive new businessoptions, including the expansion of our usage-based insurance product, referred to as MyRatesm; the introduction of Name YourPrice®, a program that provides customers the opportunity to select the price they would like to pay for auto insurance; and theroll-out of a new product in our Agency auto business, which is designed to help improve competitiveness through further pricesegmentation. In addition, during 2008, we entered Massachusetts with our personal auto and boat products available primarilyvia the Internet; we may expand the distribution method to include independent agents and direct via the phone over time. Withthis addition, Progressive now offers personal auto insurance in all 50 states and the District of Columbia.
Beginning in mid-2006 through late 2007, we were reducing rates to reflect the declining frequency trends that we wereexperiencing and to reflect our stated goal of growing as fast as possible at a 96 combined ratio. Toward the end of 2007 and in2008, we started to raise rates. On a year-over-year basis for 2008, our average written premium per policy increased slightly inour Agency auto new business, but was still down in Direct auto, special lines, and Commercial Auto. Total personal autopremium per policy, both new and renewal, decreased about 2% during 2008. The lower average premium per policy relative tothe rate increases reflects a shift in the mix of business toward more preferred customers.
Earned premium per earned car year, another measure of rate change, lags the written premium measure. For 2008, ascompared to 2007, earned premium per earned car year decreased about 4% and 8% in our personal and commercial autoproducts, respectively. Adjusting rates is a continuous process and we will continue to evaluate future rate needs and reactquickly as we recognize changing trends.
Companywide policies in force have increased 3% on a year-over-year basis since December 31, 2007. This equates to about350,000 additional policies in force. The growth is in our Direct auto business where policies in force grew 9%. Special lines sawan increase of about 7%, although it is uncertain that this part of the business will see significant gains going forward in theseuncertain economic times. In light of the tough economy, we were pleased that our Commercial Auto business was able to end2008 with about the same number of policies as it had at the start of the year. Agency auto, on the other hand, saw a decrease inpolicies in force of 2%.
To continue to grow policies in force, it is critical that we retain our customers for longer periods, which is why increasing retentioncontinues to be one of our most important priorities. In 2008, we continued to see an increase in customer retention with both ourAgency and Direct auto policy life expectancy increasing 11% on a year-over-year basis, while our special lines business saw a1% increase. Our Commercial Auto customer measures were down about 2% from the prior year.
As stated above, our 5.4% companywide underwriting profit margin for 2008 exceeded our target of a 4% underwriting margin,including 1.2 points of weather-related catastrophe losses, primarily related to hurricanes Ike and Gustav, and hail storms andfloods in the Midwest and Great Plains. In addition, we experienced .2 points of unfavorable prior accident year development,primarily in our Commercial Auto business. During 2008, we experienced declining auto frequency trends, while severityincreased slightly, reflecting increases in bodily injury and personal injury protection severity, offset by a decrease for the propertycoverages in total.
B. Investments and Capital Management
The fair value of our investment portfolio was $13.0 billion at December 31, 2008, including $.4 billion of redeemable and $1.1billion of nonredeemable preferred stocks. Within our investment portfolio, we maintained our asset allocation strategy ofinvesting between 75-100% of our total portfolio in fixed-income securities and 0-25% in common equities. During the year, wetook significant steps to restructure the portfolio to a lower risk profile. At the end of 2008, our portfolio was allocated 94% tofixed-income securities and 6% to common equities.
Our investment portfolio produced a fully taxable equivalent (FTE) total return of (10.4)% for 2008. We experienced losses in bothasset classes, with FTE total returns of (36.5)% and (7.1)% in the common stock and fixed-income portfolios, respectively. Wecontinue to maintain our fixed-income portfolio strategy of investing in high-quality, shorter-duration securities given the currentinvestment environment. We decreased the duration of our fixed-income portfolio modestly during the year to end 2008 at 3.2years, compared to 3.5 years at the end of 2007. The weighted average credit rating of our fixed-income portfolio ranged fromAA- early in 2008 to AA+ at the end of the year. Our common equity investment strategy remains an index replication approachusing the Russell 1000 Index as the benchmark.
During the year, financial markets continued to suffer from the turbulence that began at the end of 2007, the effects of whichtransformed the global financial system. The rapid deterioration in asset values, sharp retrenchment of credit providers, and lossof market confidence pushed highly leveraged financial institutions to near failure, with the collapse and rescue of several majorfinancial firms around the world. Capital markets witnessed unprecedented volatility and periods of illiquidity in both the primaryand secondary markets. Credit spreads on risk assets across virtually all asset classes increased sharply over the course of the
App.-A-33

year. The economy began the year growing modestly, but dysfunction in the global capital markets, combined with a debt-constrained consumer and further deterioration in the housing market, pushed the economy into contraction by year end. TheFederal Reserve responded to the economic weakness by cutting the overnight funds rate sharply, finishing the year with a targetrange of 0-0.25%. The Federal Reserve also used its balance sheet and nontraditional lending facilities in order to provideadditional liquidity to the economy and capital markets. At year end, two-year U.S. Treasury Notes and ten-year U.S. TreasuryNotes were yielding .74% and 2.21%, respectively, compared to 3.06% and 4.03% at the end of 2007.
In light of these market conditions, during 2008, we performed a detailed review of our portfolio, paying particular attention to thecredit profile of the issuers of our redeemable and nonredeemable preferred stocks, as well as our asset-backed securities, toidentify the extent to which our asset values may have been affected by their exposure to the sub-prime mortgage loan disruption,as well as broader credit market events.
Approximately 75% of our preferred stock holdings are obligations of financial sector issuers. During 2008, we recorded $1.7billion of other-than-temporary impairment losses on our redeemable and nonredeemable preferred stocks. The write-downs weredue to a combination of issuer fundamentals and severe market declines where we were unable to objectively determine that thesecurities would substantially recover in the near term.
At year-end 2008, we held approximately $213.4 million of sub-prime mortgage bonds, classified as home-equity bonds. Inaddition, we held $30.7 million of non-prime collateralized mortgage obligations (Alt-A securities). Together, these securities hadunrealized losses of $62.0 million for 2008. During 2008, we realized $31.1 million of losses related to other-than-temporarilyimpaired home-equity securities; we did not have any write-downs in our Alt-A securities. In addition, we closed a credit defaultswap derivative on an investment-grade asset-backed index, comprised of 20 bonds in the sub-prime mortgage sector; for 2008,this derivative position generated a net loss of $19.7 million.
The investment results and market valuations clearly eroded our capital position. We ended 2008 with $6.4 billion of total capital,debt plus equity. We continue to manage our investing and financing activities in order to maintain sufficient capital to support allthe insurance we can profitably underwrite and service.
II. FINANCIAL CONDITION
A. Holding Company
In 2008, The Progressive Corporation, the holding company, received $30.4 million of dividends from its subsidiaries, net ofcapital contributions made to subsidiaries. For the three-year period ended December 31, 2008, The Progressive Corporationreceived $3.0 billion of dividends from its subsidiaries, net of capital contributions. Regulatory restrictions on subsidiary dividendsare described in Note 8 – Statutory Financial Information.
Progressive’s debt-to-total capital (debt plus equity) ratios at December 31, 2008 and 2007 were 34.0% and 30.6%, respectively.During the last three years, The Progressive Corporation retired $100 million principal amount of debt securities. In June 2007,we announced a plan to restructure our capital position, which included issuing $1 billion of 6.70% Fixed-to-Floating Rate JuniorSubordinated Debentures due 2067. See Note 4 – Debt for further discussion of our current outstanding debt. The plan alsoconsisted of returning capital to shareholders through share repurchases and a special dividend of $2.00 per common share. The2007 recapitalization plan is discussed in further detail in the Liquidity and Capital Resources section below.
During 2008, we repurchased 9,918,818 of our common shares. The total cost to repurchase these shares was $179.4 million,with an average cost of $18.09 per share. During the three-year period ended December 31, 2008, we repurchased 121,874,776of our common shares at a total cost of $2.9 billion (average cost of $22.39 per share, on a split-adjusted basis), including sharesrepurchased as part of our 2007 recapitalization plan.
Progressive maintains a policy of paying an annual variable dividend that, if declared, would be payable shortly after the close ofeach year. Prior to 2007, we had paid a quarterly dividend. The annual variable dividend is based on a target percentage ofafter-tax underwriting income multiplied by a companywide performance factor (“Gainshare factor”), subject to the limitationsdiscussed below. The target percentage is determined by our Board of Directors on an annual basis and announced toshareholders and the public. For 2007, 2008, and 2009, the Board determined the target percentage to be 20% of annualafter-tax underwriting income.
The Gainshare factor can range from zero to two and is determined by comparing our operating performance for the year to certainpredetermined profitability and growth objectives approved by the Board. This dividend program is consistent with the variable cashincentive program currently in place for our employees (referred to as our “Gainsharing program”). Although recalibrated everyyear, the structure of the Gainsharing program generally remains the same. For 2008, the Gainshare factor was .80.
App.-A-34

Our annual variable dividend program is subject to certain limitations. If the Gainshare factor is zero or if our after-taxcomprehensive income (which includes net investment income, as well as both realized gains and losses on securities and thechange in unrealized gains and losses during the period) is less than after-tax underwriting income, no dividend will be paid. Forthe year ended December 31, 2008, our after-tax comprehensive loss was $614.7 million, which is lower than the $477.7 millionof after-tax underwriting income for the same period; therefore, the Board did not declare a dividend for 2008.
During the last three years, we paid $1.5 billion in shareholder dividends. In January 2008, we paid shareholder dividends of$98.3 million, or $.145 per common share, pursuant to a December 2007 declaration by our Board of Directors under our annualvariable dividend policy. In 2007, we returned $1.4 billion to shareholders via an extraordinary cash dividend of $2.00 per shareas part of a recapitalization plan that took place during the year. Lastly, we paid dividends of $25.0 million, or $.0325 per share, in2006 under our previous quarterly dividend plan.
B. Liquidity and Capital Resources
Progressive’s insurance operations create liquidity by collecting and investing premiums from new and renewal business inadvance of paying claims. As an auto insurer, our claims liabilities are generally short in duration. Approximately 50% of ouroutstanding reserves are paid within one year and less than 15% are still outstanding after three years. See Claims PaymentPatterns, a supplemental disclosure provided in this Annual Report, for further discussion on the timing of claims payments.
As of December 31, 2008, our consolidated statutory policyholders’ surplus was $4.5 billion, compared to $4.6 billion atDecember 31, 2007. Our net premiums written-to-surplus ratio was 3.0 to 1 at year-end 2008, compared to 3.0 and 2.8 at year-end 2007 and 2006, respectively. We also have access to $1.0 billion in a non-insurance subsidiary, portions of which could becontributed to the capital of our insurance subsidiaries to support growth as needed. In addition, our risk-based capital ratios,which are a series of dynamic surplus-related formulas that contain a variety of factors that are applied to financial balancesbased on the degree of certain risks (e.g., asset, credit, and underwriting), are well in excess of minimum requirements. See Note8 – Statutory Financial Information for any regulatory restrictions on subsidiary dividends.
For the three years ended December 31, 2008, operations generated positive cash flow of $5.4 billion, and cash flows areexpected to remain positive in both the short-term and reasonably foreseeable future. As of December 31, 2008, 94% of ourportfolio was invested in fixed-income securities with a weighted average credit quality of AA+ and duration of 3.2 years. At yearend we held $4.8 billion in cash and U.S. Treasury securities. The balance of our fixed-income portfolio consists substantially ofreadily marketable fixed-income securities. We believe that we have sufficient readily marketable securities to cover our claimspayments without having a negative effect on our cash flows from operations.
We believe that we have sufficient capital resources, cash flows from operations, and borrowing capacity to support our currentand anticipated business, scheduled principal and interest payments on our debt, and expected capital requirements. Thecovenants on our existing debt securities do not include any rating or credit triggers that would require an adjustment of theinterest rate or an acceleration of principal payments in the event our securities are downgraded. We have no scheduled debtmaturities until January 2012.
Continuing volatility in the capital markets presents challenges to us as we seek to manage our portfolio and our capital position.See Item 1A, “Risk Factors,” in our Form 10-K filed with the SEC for a discussion of certain matters that may affect our portfolioand capital position.
Progressive seeks to deploy capital in a prudent manner and uses multiple data sources and modeling tools to estimate thefrequency, severity, and correlation of identified exposures, including, but not limited to, catastrophic losses and the businessinterruptions discussed below, to estimate our potential capital needs.
Management views our capital structure as consisting of three levels, each with a specific size and purpose. The first layer ofcapital, which we refer to as “regulatory capital,” is the amount of capital we need to satisfy regulatory requirements and supportour objective of writing all the business we can write and service, consistent with our underwriting discipline of achieving a 96combined ratio. This capital is held largely within our various insurance entities.
The second layer of capital we call “extreme contingency.” While our regulatory capital is, by definition, a cushion for absorbingfinancial consequences of adverse events such as loss reserve development, litigation, weather catastrophes, or investmentmarket corrections, we view that as a base and hold additional capital for even more extreme conditions. The modeling used toquantify capital needs for these conditions is quite extensive, including tens of thousands of simulations, representing our bestestimates of such contingencies based on historical experience. This capital is held at the holding company and, at times, in ourinsurance entities potentially eligible for a dividend to the holding company.
The third layer of capital is capital in excess of the sum of the first two layers and provides maximum flexibility to repurchasestock, consider acquisitions, and pay dividends to shareholders, among other purposes. This capital is largely held at the holdingcompany.
App.-A-35

At all times during 2008, our total capital exceeded the sum of our regulatory capital layer plus our self-constructed extremecontingency load. However, due to the recent significant declines in the valuation of our investment portfolio, the third layer hasbeen diminished, along with the flexibility provided by that level of capital.
The speed by which the market valuations changed, and may continue to change, is of great concern and a basis for our ongoingreview of portfolio risk. To help manage these risks and preserve our capital base, as of December 31, 2008, we heldapproximately $4.8 billion in cash and U.S. Treasury securities, three times the amount that we held at the start of the year, as wehave sought to reduce overall risk and volatility in the portfolio.
In order to provide liquidity in the event of disruptions in our cash management operations, such as disruptions in the financialmarkets, that could affect our ability to transfer or receive funds, on December 31, 2008, we entered into a 364-Day SecuredLiquidity Credit Facility Agreement with National City Bank (NCB). Under this agreement, we may borrow up to $125 million,which may be increased to $150 million at our request but subject to NCB’s discretion. Any borrowings under this agreement willbe secured by a lien on certain marketable securities held in our investment portfolio. In addition, we deposited $125 million intoan FDIC-insured deposit account at NCB in January 2009, to provide us with additional cash availability in the event of such adisruption to our cash management operations. Our access to these funds is unrestricted. However, if we withdraw funds fromthis account for any reason other than in connection with such a disruption in our cash management operations, the availability ofborrowings under the NCB credit facility will be reduced on a dollar-for-dollar basis until such time as we replenish the funds tothe deposit account. See Note 4 – Debt for further discussion of this credit facility. We have not borrowed under this agreement todate. This revolving credit facility agreement replaced an uncommitted line of credit with NCB in the principal amount of $125million; there were no borrowings under this agreement during the last three years.
In June 2007, we announced a recapitalization plan in an effort to restructure our capital position, which included the followingcomponents:
• The payment of an extraordinary cash dividend of $2.00 per common share. This extraordinary cash dividend, whichaggregated to $1.4 billion, was declared by the Board on June 13, 2007, and was paid on September 14, 2007, toshareholders of record at the close of business on August 31, 2007.
• A new Board authorization for us to repurchase up to 100 million of our common shares over the course of 24 months,expiring June 30, 2009. This authorization was in addition to the approximately 4 million shares that remained availablefor repurchase at the end of the second quarter 2007 under the Board’s April 2006 share repurchase authorization. AtDecember 31, 2008, approximately 48.5 million shares remain available for repurchase under the 2007 authorization.
• The issuance of $1 billion of 6.70% Fixed-to-Floating Rate Junior Subordinated Debentures due 2067 (the “Debentures”)on June 18, 2007. The proceeds of the offering were $987.3 million, before $1.5 million of expenses related to theissuance. In addition, upon issuance of the Debentures, we closed a forecasted debt issuance hedge, which wasentered into to hedge against a possible rise in interest rates, and recognized a $34.4 million pretax gain as part ofshareholders’ equity; this gain is being recognized as an adjustment to interest expense and amortized over 10 years,which represents the fixed interest rate period of the Debentures. See Note 4 – Debt for further discussion of the termsof the Debentures.
In connection with the issuance of the Debentures, we also entered into a Replacement Capital Covenant for the benefit of theholders of our 6.25% Senior Notes due 2032 (the “Covered Debt”). Under the Replacement Capital Covenant, we may not repay,redeem, or repurchase any of the Debentures prior to June 15, 2047 (or, if earlier, prior to the occurrence of certain eventsspecified in the Replacement Capital Covenant), except to the extent that (subject to certain limitations) the amount to be repaid,redeemed, or purchased does not exceed a specified percentage of net cash proceeds from the sale to third parties of certainreplacement capital securities (as defined in the Replacement Capital Covenant) plus the proceeds from the sale or issuance ofcommon shares or certain qualifying warrants. The identity of the Covered Debt may be changed from time to time by thecompany upon the occurrence of certain events specified in, and in accordance with the requirements of, the provisions of theReplacement Capital Covenant. See our Current Report on Form 8-K, filed on June 22, 2007, for additional information and acopy of the Replacement Capital Covenant.
C. Commitments and Contingencies
We currently have a total of 54 centers that are available to provide concierge level claims service. The service centers arelocated in 41 metropolitan areas across the United States and serve as our primary approach to damage assessment andcoordination of vehicle repairs at authorized auto repair facilities in these markets. We completed construction of two new claimsservice centers in 2008, four in 2007, and 29 in 2006. Several of these newly constructed centers replaced previously leasedservice center locations, including both centers opened in 2008, three out of four opened in 2007, and two of the centers built in2006. In addition, we have opened one new center in 2009 that also replaced a previously leased location; no additional centers
App.-A-36

are currently under construction. The cost of these facilities, excluding land, is estimated to average $4 to $7 million per center,depending on a number of variables, including the size and location of the center.
During 2006, we constructed a data center, printing center, and related facilities in Colorado Springs, Colorado, at a total cost of$64.2 million, and acquired additional land for possible future development in Colorado Springs, Colorado and Mayfield Village,Ohio for a total cost of $16.2 million; both properties are near our current corporate facilities.
All such construction projects and property acquisitions have been funded internally through operating cash flows.
We maintain insurance on our real property and other physical assets, including coverage for losses due to business interruptionscaused by covered property damage. However, the insurance will not compensate us for losses that may occur due to disruptionsin service as a result of a computer, data processing, or telecommunications systems failure that is unrelated to covered propertydamage, nor will the insurance necessarily compensate us for all losses resulting from covered events. To help maintainfunctionality and reduce the risk of significant interruptions of our operations, we maintain back-up systems or facilities for certainof our principal systems and services. We still may be exposed, however, should these measures prove to be unsuccessful orinadequate against severe, multiple, or prolonged service interruptions or against interruptions of systems where no back-upcurrently exists. In addition, we have established emergency management teams, which are responsible for responding tobusiness disruptions and other risk events. The teams’ ability to respond successfully may be limited depending on the nature ofthe event, the completeness and effectiveness of our plans to maintain business continuity upon the occurrence of such an event,and other factors beyond our control.
In the second half of 2008, on two separate occasions, we discovered errors in our comparative rating process which affected theaccuracy of the comparative rates we provided to a number of Massachusetts consumers. We corrected the problems andnotified the Massachusetts Division of Insurance and Attorney General in both instances. The Massachusetts Attorney Generalhas issued a Civil Investigative Demand seeking information concerning these errors to which we are in the process ofresponding fully. We have stopped providing comparative rates in Massachusetts and will not resume providing this service inthat Commonwealth until we and the appropriate regulators have determined that these issues are resolved.
Off-Balance-Sheet Arrangements
Our off-balance-sheet leverage includes derivative positions and open investment funding commitments (as disclosed in Note 2 –Investments, Note 13 – Commitments and Contingencies and the Derivative Instruments section of this Management’sDiscussion and Analysis). It also includes operating leases and purchase obligations (disclosed in the table below).
Contractual Obligations
A summary of our noncancelable contractual obligations as of December 31, 2008, follows:
Payments due by period
(millions) TotalLess than
1 year1-3
years3-5
yearsMore than
5 years
Debt $ 2,200.0 $ — $ — $ 500.0 $1,700.0Interest payments on debt 1,707.5 144.7 289.4 255.9 1,017.5Operating leases 249.3 86.7 104.5 38.1 20.0Purchase obligations 120.5 66.6 39.7 4.9 9.3Loss and loss adjustment expense reserves 6,177.4 3,271.7 2,247.6 511.4 146.7
Total $10,454.7 $3,569.7 $2,681.2 $1,310.3 $2,893.5
Purchase obligations represent our noncancelable commitments for goods and services. Unlike many other forms of contractualobligations, loss and loss adjustment expense (LAE) reserves do not have definitive due dates and the ultimate payment datesare subject to a number of variables and uncertainties. As a result, the total loss and LAE reserve payments to be made byperiod, as shown above, are estimates based on our recent payment patterns. To further understand our claims payments, seeClaims Payment Patterns, a supplemental disclosure provided in this Annual Report. In addition, we annually publish acomprehensive Report on Loss Reserving Practices, which was most recently filed with the SEC on a Form 8-K on June 30,2008, that further discusses our claims payment development patterns.
We entered into two contracts to expand our brand building efforts during 2008. In January 2008, we entered into a 16-yearcontract for the ballpark naming rights and a sponsorship deal with the Cleveland Indians Major League Baseball team. Over thecontract term, Progressive will pay an average of approximately $3.6 million per year. In addition, in March 2008, we announcedour title sponsorship of the Progressive Insurance Automotive X PRIZE competition. The Automotive X PRIZE is a two and onehalf year international competition designed to inspire a new generation of safe, low emissions vehicles capable of achieving theequivalent of at least 100 miles per gallon in fuel efficiency. The total cost of the sponsorship is expected to be approximately
App.-A-37

$12.5 million, which includes the prize for the winning team as well as the funding of some operational expenses over the courseof the competition. These expenditures are a reallocation of a small percentage of our annual media spend and are intended togenerate greater exposure for our brand. Portions of these contracts are cancelable; only the noncancelable portions arereflected in the contractual obligations table above.
As discussed in the Liquidity and Capital Resources section above, we believe that we have sufficient borrowing capacity, cashflows, and other capital resources to satisfy these contractual obligations.
III. RESULTS OF OPERATIONS—UNDERWRITING
A. Growth
(millions) 2008 2007 2006
NET PREMIUMS WRITTENPersonal Lines
Agency $ 7,322.3 $ 7,549.4 $ 7,854.3Direct 4,556.5 4,371.8 4,354.5
Total Personal Lines 11,878.8 11,921.2 12,208.8Commercial Auto 1,704.8 1,828.9 1,898.0Other indemnity 20.7 22.4 25.2
Total underwriting operations $13,604.3 $13,772.5 $14,132.0
Growth over prior years (1)% (3)% 1%
NET PREMIUMS EARNEDPersonal Lines
Agency $ 7,362.0 $ 7,636.4 $ 7,903.6Direct 4,485.8 4,372.6 4,337.4
Total Personal Lines 11,847.8 12,009.0 12,241.0Commercial Auto 1,762.2 1,846.9 1,851.9Other indemnity 21.4 21.5 25.0
Total underwriting operations $13,631.4 $13,877.4 $14,117.9
Growth over prior years (2)% (2)% 3%
Net premiums written represent the premiums generated from policies written during the period less any premiums ceded toreinsurers. Net premiums earned, which are a function of the premiums written in the current and prior periods, are earned asrevenue over the life of the policy using a daily earnings convention. Progressive experienced a decline in total written andearned premiums during 2008 and 2007, as compared to the positive growth rates achieved in 2006. During the latter half of2008, we began to see an increase in our written premiums, primarily in our Direct auto business, reflecting the increase in newapplications and our efforts to increase retention, as well as other initiatives we have underway to help provide distinctive newauto business options (discussed below). We also attribute some of the Direct auto growth to our increase in advertising spendand what we believe to be better creative content.
Policies in force, our preferred measure of growth, represents all policies under which coverage is in effect as of the end of theperiod specified. As of December 31, our policies in force were:
(thousands) 2008 2007 2006
POLICIES IN FORCEPersonal Lines
Agency auto 4,288.6 4,396.8 4,433.1Direct auto 2,824.0 2,598.5 2,428.5
Total auto 7,112.6 6,995.3 6,861.6Special lines1 3,352.3 3,120.3 2,879.5
Total Personal Lines 10,464.9 10,115.6 9,741.1
Growth over prior year 3% 4% 3%
Commercial Auto 539.4 539.2 503.2
Growth over prior year —% 7% 7%
1Includes insurance for motorcycles, recreational vehicles (RV), mobile homes, watercraft, snowmobiles, and similar items, as well as a personal umbrellaproduct.
App.-A-38
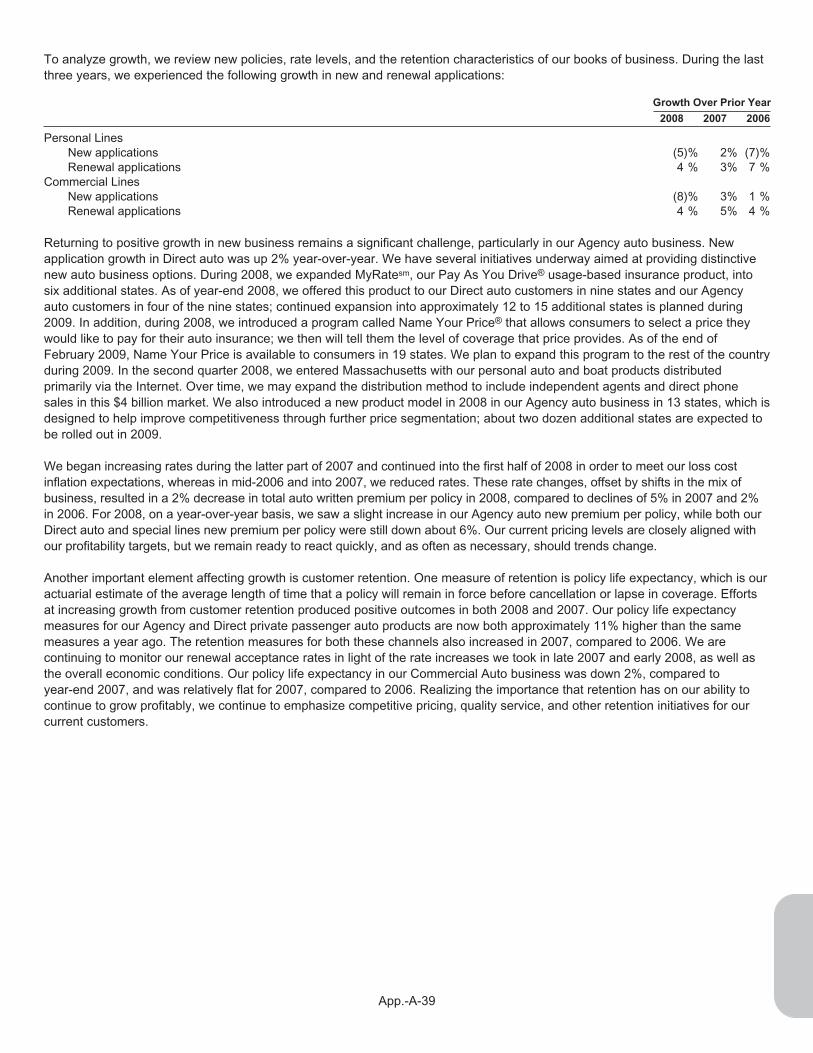
To analyze growth, we review new policies, rate levels, and the retention characteristics of our books of business. During the lastthree years, we experienced the following growth in new and renewal applications:
Growth Over Prior Year
2008 2007 2006
Personal LinesNew applications (5)% 2% (7)%Renewal applications 4 % 3% 7 %
Commercial LinesNew applications (8)% 3% 1 %Renewal applications 4 % 5% 4 %
Returning to positive growth in new business remains a significant challenge, particularly in our Agency auto business. Newapplication growth in Direct auto was up 2% year-over-year. We have several initiatives underway aimed at providing distinctivenew auto business options. During 2008, we expanded MyRatesm, our Pay As You Drive® usage-based insurance product, intosix additional states. As of year-end 2008, we offered this product to our Direct auto customers in nine states and our Agencyauto customers in four of the nine states; continued expansion into approximately 12 to 15 additional states is planned during2009. In addition, during 2008, we introduced a program called Name Your Price® that allows consumers to select a price theywould like to pay for their auto insurance; we then will tell them the level of coverage that price provides. As of the end ofFebruary 2009, Name Your Price is available to consumers in 19 states. We plan to expand this program to the rest of the countryduring 2009. In the second quarter 2008, we entered Massachusetts with our personal auto and boat products distributedprimarily via the Internet. Over time, we may expand the distribution method to include independent agents and direct phonesales in this $4 billion market. We also introduced a new product model in 2008 in our Agency auto business in 13 states, which isdesigned to help improve competitiveness through further price segmentation; about two dozen additional states are expected tobe rolled out in 2009.
We began increasing rates during the latter part of 2007 and continued into the first half of 2008 in order to meet our loss costinflation expectations, whereas in mid-2006 and into 2007, we reduced rates. These rate changes, offset by shifts in the mix ofbusiness, resulted in a 2% decrease in total auto written premium per policy in 2008, compared to declines of 5% in 2007 and 2%in 2006. For 2008, on a year-over-year basis, we saw a slight increase in our Agency auto new premium per policy, while both ourDirect auto and special lines new premium per policy were still down about 6%. Our current pricing levels are closely aligned withour profitability targets, but we remain ready to react quickly, and as often as necessary, should trends change.
Another important element affecting growth is customer retention. One measure of retention is policy life expectancy, which is ouractuarial estimate of the average length of time that a policy will remain in force before cancellation or lapse in coverage. Effortsat increasing growth from customer retention produced positive outcomes in both 2008 and 2007. Our policy life expectancymeasures for our Agency and Direct private passenger auto products are now both approximately 11% higher than the samemeasures a year ago. The retention measures for both these channels also increased in 2007, compared to 2006. We arecontinuing to monitor our renewal acceptance rates in light of the rate increases we took in late 2007 and early 2008, as well asthe overall economic conditions. Our policy life expectancy in our Commercial Auto business was down 2%, compared toyear-end 2007, and was relatively flat for 2007, compared to 2006. Realizing the importance that retention has on our ability tocontinue to grow profitably, we continue to emphasize competitive pricing, quality service, and other retention initiatives for ourcurrent customers.
App.-A-39

B. Profitability
Profitability for our underwriting operations is defined by pretax underwriting profit, which is calculated as net premiums earnedless losses and loss adjustment expenses, policy acquisition costs, and other underwriting expenses. We also use underwritingprofit margin, which is underwriting profit expressed as a percentage of net premiums earned, to analyze our results. For thethree years ended December 31, our underwriting profitability measures were as follows:
2008 2007 2006
UnderwritingProfit (Loss)
UnderwritingProfit (Loss)
UnderwritingProfit (Loss)
($ in millions) $ Margin $ Margin $ Margin
Personal LinesAgency $360.7 4.9% $ 500.2 6.5% $ 936.7 11.9%Direct 274.8 6.1 339.9 7.8 568.6 13.1
Total Personal Lines 635.5 5.4 840.1 7.0 1,505.3 12.3Commercial Auto 94.1 5.3 185.7 10.1 366.5 19.8Other indemnity1 5.3 NM (.7) NM 6.5 NM
Total underwriting operations $734.9 5.4% $1,025.1 7.4% $1,878.3 13.3%
1Underwriting margins for our other indemnity businesses are not meaningful (NM) due to the low level of premiums earned by, and the variability oflosses in, such businesses.
Underwriting margins in 2008 include the catastrophe losses we incurred from hurricanes Ike and Gustav, and hail storms andfloods in the Midwest and Great Plains. The decline in underwriting margins in 2007, and to a lesser extent in 2008, also reflectsthe rate reductions we took from mid-2006 to late 2007.
Further underwriting results for our Personal Lines business, including its channel components, the Commercial Auto business,and other indemnity businesses, as defined in Note 10 – Segment Information, were as follows:
Underwriting Performance1 2008 2007 2006
Personal Lines – AgencyLoss & loss adjustment expense ratio 73.7 72.1 67.8Underwriting expense ratio 21.4 21.4 20.3
Combined ratio 95.1 93.5 88.1
Personal Lines—DirectLoss & loss adjustment expense ratio 73.3 71.3 66.8Underwriting expense ratio 20.6 20.9 20.1
Combined ratio 93.9 92.2 86.9
Total Personal LinesLoss & loss adjustment expense ratio 73.5 71.8 67.4Underwriting expense ratio 21.1 21.2 20.3
Combined ratio 94.6 93.0 87.7
Commercial AutoLoss & loss adjustment expense ratio 73.2 69.7 61.0Underwriting expense ratio 21.5 20.2 19.2
Combined ratio 94.7 89.9 80.2
Total Underwriting Operations2
Loss & loss adjustment expense ratio 73.5 71.5 66.5Underwriting expense ratio 21.1 21.1 20.2
Combined ratio 94.6 92.6 86.7
Accident year—Loss & loss adjustment expense ratio3 73.3 70.9 68.2
1Ratios are expressed as a percentage of net premiums earned.
2Combined ratios for the other indemnity businesses are not presented separately due to the low level of premiums earned by, and the variability of lossesin, such businesses. For the years ended December 31, 2008, 2007, and 2006, these businesses generated an underwriting profit (loss) of $5.3 million,$(.7) million, and $6.5 million, respectively.
3The accident year ratio includes only the losses that occurred during the year noted. As a result, accident period results will change over time as ourestimates of loss costs improve or deteriorate when payments are made or reserves for that accident period are reviewed.
App.-A-40

Losses and Loss Adjustment Expenses (LAE)
(millions) 2008 2007 2006
Change in net loss and LAE reserves $ 277.7 $ 291.6 $ 50.5Paid losses and LAE 9,737.3 9,634.6 9,344.4
Total incurred losses and LAE $10,015.0 $9,926.2 $9,394.9
Claims costs, our most significant expense, represent payments made, and estimated future payments to be made, to or onbehalf of our policyholders, including expenses needed to adjust or settle claims. These costs include an estimate for costsrelated to assignments, based on current business, under state-mandated automobile insurance programs. Claims costs aredefined by loss severity and frequency and are influenced by inflation and driving patterns, among other factors. Accordingly,anticipated changes in these factors are taken into account when we establish premium rates and loss reserves. Our reserveswould differ if the underlying assumptions were changed. See the Critical Accounting Policies for a discussion of the effect ofchanging estimates.
During 2008, our loss and LAE ratio increased 2.0 points over last year, reflecting greater catastrophe losses in 2008.Catastrophe losses from 2008 storms contributed 1.2 points to our loss/LAE ratio, compared to .3 points in 2007, and .5 points in2006. The large amount of catastrophe losses in 2008 primarily related to hurricanes Ike and Gustav, and hail storms and floodsin the Midwest and Great Plains.
During 2008, we experienced a slight increase in total personal auto paid severity (i.e., average cost per claim) of about 1%,compared to increases of about 3.5% in 2007 and 5% in 2006, over the prior year periods. The increase in each of the threeyears was primarily from increases in both bodily injury and personal injury protection (PIP) coverages; 2008 and 2007 severitywas partially offset by a decrease for the property coverages in total.
We experienced a decline in year-over-prior year auto accident frequency in each of the past three years, although the rate ofdecline was more significant in 2008 than in 2007 or 2006. We cannot predict with any certainty the degree or direction offrequency change that we will experience in the future. We continue to analyze trends to distinguish changes in our experiencefrom external factors, such as changes in the number of vehicles per household, greater vehicle safety, and unemployment rates,versus those resulting from shifts in the mix of our business.
The table below presents the actuarial adjustments implemented and the loss reserve development experienced in the yearsended December 31:
($ in millions) 2008 2007 2006
Actuarial Adjustments
Favorable/(Unfavorable)Prior accident years $(56.1) $ 37.3 $158.3Current accident year 3.6 (37.1) 57.8
Calendar year actuarial adjustment $(52.5) $ .2 $216.1
Prior Accident Years Development
Favorable/(Unfavorable)Actuarial adjustment $(56.1) $ 37.3 $158.3All other development 22.9 (117.6) 88.6
Total development $(33.2) $ (80.3) $246.9
(Increase) decrease to calendar year combined ratio (.2) pts. (.6) pts. 1.7 pts.
Total development consists both of actuarial adjustments and “all other development.” The actuarial adjustments represent thenet changes made by our actuarial department to both current and prior accident year reserves based on regularly scheduledreviews. “All other development” represents claims settling for more or less than reserved, emergence of unrecorded claims atrates different than reserved, and changes in reserve estimates on specific claims. Although we believe that the developmentfrom both the actuarial adjustments and “all other development” generally results from the same factors, as discussed below, weare unable to quantify the portion of the reserve adjustments that might be applicable to any one or more of those underlyingfactors.
As reflected in the table above, we experienced unfavorable total development in 2008 and 2007, compared to favorabledevelopment in 2006. For 2008, the unfavorable development is heavily weighted towards claims from the 2006 accident year
App.-A-41

with favorable development for periods older than that. The prior year loss reserve development for 2007 primarily also reflectedunfavorable development from accident years greater than one year old (i.e., accident year 2005 and prior). For 2006, slightlymore than half of the development related to the immediately preceding accident year, with the remainder primarily affecting thepreceding two accident years at a declining rate.
The total prior year loss reserve development in 2008 and 2007, which increased the reported combined ratio by .2 points and .6points, respectively, principally arose in our Commercial Auto business for both years, while our Personal Lines business, in theaggregate, experienced little or no development for these years. An increase in the number of late reported Commercial Autoclaims in both 2008 and 2007 contributed to the unfavorable reserve development and, in 2008, we experienced an increase inthe estimated bodily injury severity on these late reported claims in both the business auto and specialty truck markets.
For 2006, the favorable total prior year loss reserve development was generally consistent across our business (e.g., product,distribution channel, and state). These changes in estimates were made based on our actual loss experience involving thepayment of claims, along with our evaluation of the needed reserves during these periods, as compared with the prior reservelevels for those claims.
Changes in our estimate of severity from what we originally expected when establishing the reserves is the principal cause ofprior year accident development in addition to more features being reported late for the Commercial Auto business, as discussedabove. These changes in estimate are the result of what we are observing in the underlying data as it develops. During 2008 and2007, we experienced unfavorable reserve development after several years of recognizing favorable development. The majorityof the development in 2008 was driven by severity on the late reported Commercial Auto claims and personal auto PIP losses,with primarily two states experiencing the majority of the unfavorable PIP development for the year. The development in 2007was driven by the unfavorable settlement of several outstanding lawsuits and the emergence of more than expected large lossesfrom prior years, along with the reviews of larger bodily injury and uninsured motorist claims. In 2006, we saw severity estimatesdevelop more favorably than what was originally expected, and although we were unable to quantify the contribution of eachfactor to the overall favorable reserve development, we believe that the favorable changes in these estimates were related tofactors as diverse as improved vehicle safety, more conservative jury awards, better fraud control, and tenure of our claimspersonnel.
We continue to focus on our loss reserve analysis, attempting to enhance accuracy and to further our understanding of our losscosts. A detailed discussion of our loss reserving practices can be found in our Report on Loss Reserving Practices, which wasfiled in a Form 8-K on June 30, 2008.
Because we are primarily an insurer of motor vehicles, our exposure as an insurer of environmental, asbestos, and generalliability claims is limited. We have established reserves for these exposures in amounts that we believe to be adequate based oninformation currently known. These exposures do not have a material effect on our liquidity, financial condition, cash flows, orresults of operations.
Underwriting Expenses
Progressive’s other underwriting expenses and policy acquisition costs as a percentage of premiums earned remained flat for2008 and increased about one point in 2007, compared to the prior year. On a year-over-year basis, we saw an increase in ouradvertising expenditures in both 2008 and 2007. However, average costs per auto policy decreased in 2008, reflecting improvedcustomer retention, as well as a focus on process improvements to help reduce expenses. One example is our 2008 effort todecrease costs and improve customer experience by moving customers to a paperless environment; over one million customershave signed up for this program. In addition to the increase in advertising spend, the increase in the 2007 expense ratio alsoreflects lower average earned premium per policy due to rate reductions. In accordance with GAAP, policy acquisition costs areamortized over the policy period in which the related premiums are earned (see Note 1 – Reporting and Accounting Policies). Wedo not defer any direct-response advertising costs.
C. Personal Lines
Growth Over Prior Year
2008 2007 2006
Net premiums written —% (2)% —%Net premiums earned (1)% (2)% 1%Policies in force 3% 4% 3%
App.-A-42

Progressive’s Personal Lines business writes insurance for private passenger automobiles and recreational vehicles, andrepresented approximately 87% of our total net premiums written for each of the last three years. We currently write our PersonalLines products in all 50 states and our personal auto product in the District of Columbia. In mid-2008, we began offering ourpersonal auto product and boat insurance to Direct Internet customers in Massachusetts. Additional options, such as shopping byphone and through independent insurance agents and the ability to buy other insurance products, such as motorcycle and RVpolicies, are expected to be phased in over time in the state.
Private passenger auto represented about 90% of our total Personal Lines net premiums written in each of the past three yearsand policies are primarily written for 6-month terms. The remaining Personal Lines business is comprised of special lines products(e.g., motorcycles, watercraft, and RVs), which are written for 12-month terms. Private passenger auto policies in force increased2% for both 2008 and 2007, and increased 1% in 2006; policies in force for the special lines products increased 7% in 2008 and8% in both 2007 and 2006. Net premiums written for private passenger auto declined 1% and 3% in 2008 and 2007, respectively,and were flat in 2006; special lines net written premiums grew 4%, 5%, and 7%, respectively, in each of the last three years.
Our total Personal Lines business generated combined ratios of 94.6, 93.0, and 87.7 in 2008, 2007, and 2006, respectively. In2008, 42 states, including the District of Columbia, were profitable, including 8 of our 10 largest auto business states. The speciallines products had a favorable effect on the total Personal Lines combined ratio of approximately .5 points in 2008, compared toabout one point in both 2007 and 2006.
In 2007, we brought our Agency and Direct businesses together under one Personal Lines organization. Nevertheless, we willcontinue to report our Agency and Direct business results separately as components of our Personal Lines segment to providefurther understanding of our products by channel.
The Agency Business
Growth Over Prior Year
2008 2007 2006
Net premiums written (3)% (4)% (2)%Net premiums earned (4)% (3)% (1)%Auto: policies in force (2)% (1)% (1)%
new applications (13)% (1)% (10)%renewal applications —% —% 4%
The Agency business includes business written by the more than 30,000 independent insurance agencies that representProgressive, as well as brokerages in New York and California. During 2008, we saw new Agency auto application growth in 17states, including two of our largest volume states, Florida and Texas. However, some of our other big states did not see thisgrowth during the year. In particular, beginning in the latter part of 2007 and into 2008, we restricted writing some classes of newbusiness in New York and California, thus hindering our overall Agency auto growth. In New York, we achieved rate relief and theapproval of a new product in the fourth quarter 2008 and were able to lift remaining restrictions in January 2009. In California, wecontinue to enhance our underwriting process to ensure adherence to our guidelines and meet our profitability targets; we alsotook steps to improve segmentation and rate levels in 2008 and anticipate implementing a new program in the second half of2009.
On a year-over-year basis, written premium per policy on total Agency auto business was down about 2% in 2008, 4% in 2007,and 3% in 2006, driven by a decrease in written premium per policy in renewal auto business and reflecting rate reductions takenin 2006 and 2007. For 2008, we saw a slight increase, on a year-over-year basis, in our Agency auto written premium per policyon new business.
The rate of conversion (i.e., converting a quote to a sale) was down in each of the past three years, on an increase each year inthe number of Agency auto quotes. Within the Agency business, we are continuing to see a shift from traditional agent quoting toquotes generated through comparative rating systems, where our rates are quoted more often, but the conversion rate issignificantly lower. Nevertheless, agents are placing more preferred customers with us.
The underwriting expense ratio on a year-over-year basis was flat in 2008 and up about one point in 2007. Improved customerretention and cost saving efforts helped keep expenses in line in 2008.
App.-A-43

The Direct Business
Growth Over Prior Year
2008 2007 2006
Net premiums written 4% —% 4%Net premiums earned 3% 1% 6%Auto: policies in force 9% 7% 4%
new applications 2% 5% (4)%renewal applications 9% 7% 9%
The Direct business includes business written directly by Progressive online and over the phone. In 2008, we experienced anincrease in Direct auto new applications in 27 states, primarily in our mid-size states. Internet sales continued to be the mostsignificant source of new business that is initiated in the Direct channel.
Written premium per policy for total Direct auto was down 4% during 2008, although the rate of decrease was lower in the secondhalf of the year than the first half; a shift in the mix of our business to more preferred customers offset the rate increases takenduring the year. In 2007 and 2006, written premium per policy decreased 6% and 1%, respectively, reflecting rate decreasesduring those time periods. In each of the last three years, the decreases were driven by declines in written premium per policy forboth new and renewal business.
The number of total quotes in the Direct business increased in 2008 and decreased in both 2007 and 2006, as compared to theprior year. Our entry into Massachusetts in May 2008 with an auto product distributed primarily via the Internet contributed to ourincrease in quoting activity. Phone quotes remained flat in 2008 and were down in both 2007 and 2006, compared to the prioryear. The rate of conversion for Internet-initiated business increased during 2008, but to a lesser extent than the increasesexperienced in 2007 and 2006, while the conversion rate for phone-initiated business decreased for 2008, and increased duringboth 2007 and 2006, compared to the prior year. We are continuing to see the Internet becoming a greater portion of our Directbusiness mix, which historically has had a lower conversion rate than phone.
For 2008, 2007, and 2006, we saw our total advertising expenditures increase on a year-over-year basis. In 2008, we launched anew advertising campaign, which provides a consistent identity and serves as a foundation for delivery of our many messages.During 2008, we also hired a Chief Marketing Officer as one of many steps that we have taken to achieve our key objective ofhaving our efforts in marketing and other brand-building activities match our competency in other technical skills, such as pricingand claims handling.
D. Commercial Auto
Growth Over Prior Year
2008 2007 2006
Net premiums written (7)% (4)% 5%Net premiums earned (5)% —% 11%Policies in force —% 7% 7%New applications (8)% 3% 1%Renewal applications 4% 5% 4%
Progressive’s Commercial Auto business writes primary liability and physical damage insurance for automobiles and trucksowned by small businesses, with the majority of our customers insuring three or fewer vehicles. Our Commercial Auto businessrepresented about 13% of our total net premiums written for each of the last three years. This business is primarily distributedthrough independent agents and operates in the specialty truck and business auto markets. The specialty truck commercial automarket, which accounts for slightly more than half of the total Commercial Auto premiums and approximately 40% of the vehicleswe insure in this business, includes dump trucks, logging trucks, tow trucks, local cartage, and other short-haul commercialvehicles. The remainder is in the business auto market, which includes autos, vans, and pick-up trucks used by artisans, such ascontractors, landscapers, and plumbers, and a variety of other small businesses. Both of these markets have been significantlyaffected by the downturn in the economy, as well as increased competition in the commercial auto business.
We currently write our Commercial Auto business in 49 states; we do not write Commercial Auto in Hawaii or the District ofColumbia. We entered Massachusetts early in 2007 and West Virginia in early 2006. The majority of our policies are written for12-month terms.
App.-A-44
As compared to the prior year, total written premium per policy decreased about 4% in 2008, compared to a decrease of 6% in2007 and an increase of 5% in 2006. The unprecedented economic times during 2008 also had a significant effect on ourCommercial Auto business growth. In light of these circumstances, we were pleased that the number of Commercial Auto policiesin force remained relatively unchanged in 2008, as compared to 2007.
Commercial Auto’s expense ratio increased 1.3 points during 2008, primarily reflecting lower earned premium during 2008. In2007, the expense ratio increased one point resulting from significant investments in agency distribution and direct marketingcapability, as well as reduced premiums.
Although Commercial Auto differs from Personal Lines auto in its customer base and products written, both businesses requirethe same fundamental skills, including disciplined underwriting and pricing, as well as excellent claims service. Since theCommercial Auto policies have higher limits (up to $1 million) than Personal Lines auto, we analyze the large loss trends andreserving in more detail to allow us to react quickly to changes in this exposure.
E. Other Indemnity
Progressive’s other indemnity businesses, which represented less than 1% of our net premiums written, primarily include writingprofessional liability insurance for community banks and a small amount of run-off business. The underwriting profit (loss) in thesebusinesses may fluctuate widely due to the low premium volume, variability in losses, and the run-off nature of some of theseproducts. The effect of these businesses on our overall operations is minimal.
Our community bank program has produced an underwriting profit for each of the last three years. We continue to review thisprogram in light of the significant turbulence that has impacted the financial markets during the year. We believe that we do nothave any significant exposure to claims arising from this financial crisis. From a strategic perspective, community banks tend notto be exposed to the same issues as the larger, highly leveraged financial institutions. In spite of these market conditions, ourclaim activity has remained fairly consistent.
F. Service Businesses
Our service businesses provide insurance-related services and represented less than 1% of our total revenues for each of the lastthree years and do not have a material effect on our overall operations. Our principal service business is providing policyissuance and claims adjusting services for the Commercial Auto Insurance Procedures/Plans (CAIP), which are state-supervisedplans serving the involuntary markets in 36 states. We have previously competed with two other major carriers for the CAIPbusiness. However, one of these carriers ceased writing new business in the second quarter 2008 and the remaining carrierannounced that it will cease writing business in early 2009. This will leave us as the largest CAIP provider countrywide. Althoughour market share will be increasing, we may not realize an immediate increase in revenues as the cyclical downturn in the CAIPmarket continues.
As a service provider, we collect fee revenue that is earned on a pro rata basis over the term of the related policies. We cede100% of the premiums and losses to the plans. Reimbursements to us from the CAIP plans are required by state laws andregulations. Material violations of contractual service standards can result in ceding restrictions for the affected business. Wehave maintained, and plan to continue to maintain, compliance with these standards. Any changes in our participation as a CAIPservice provider would not materially affect our financial condition, results of operations, or cash flows.
Service business revenues have decreased in each of the last three years. The decrease reflects the continuing cyclical downturnin the involuntary commercial auto market. Total service expenses, however, did not decrease at the same rate, primarily due tothe fixed costs associated with our total loss replacement program, which was another one of our service businesses throughwhich we would help policyholders and claimants find and purchase a replacement vehicle when their automobile is declared tobe a total loss. We evaluated the benefits of maintaining this service in-house and concluded that contracting with third-partyproviders to deliver this service will continue to meet our customers’ needs and reduce our costs; this transition was completed inthe second quarter 2008.
G. Litigation
The Progressive Corporation and/or its insurance subsidiaries are named as defendants in various lawsuits arising out of claimsmade under insurance policies in the ordinary course of our business. All legal actions relating to such insurance claims areconsidered by us in establishing our loss and loss adjustment expense reserves.
In addition, various Progressive entities are named as defendants in a number of class action or individual lawsuits arising out ofthe operations of the insurance subsidiaries. These cases include those alleging damages as a result of our use of credit inunderwriting and related requirements under the federal Fair Credit Reporting Act; practices in evaluating or paying medical or
App.-A-45

injury claims or benefits, including, but not limited to, personal injury protection, medical payments, uninsured motorist/underinsured motorist (UM/UIM), and bodily injury benefits; rating practices at policy renewal; the utilization, content, orappearance of UM/UIM rejection forms; the practice of taking betterment on boat repairs; labor rates paid to auto body repairshops; and cases challenging other aspects of our claims or marketing practices or other business operations. Other insurancecompanies face many of these same issues. During 2008, we settled one putative class action challenging our installmentpayment program for an amount that was not material to our financial condition, results of operations, or cash flows. During 2007,we settled a nationwide class action challenging our use of software to assist in the adjustment of bodily injury claims; a stateclass action challenging payments of certain medical benefits; and a state class action challenging the amount charged for UIMpremiums. During 2006, we settled nationwide claims challenging our use of credit information and notice requirements under thefederal Fair Credit Reporting Act; statewide class action lawsuits that challenged our payment of preferred provider rates onpersonal injury protection claims; and certain statewide class action lawsuits challenging our payments of MRI bills underpersonal injury protection coverage. These settlements did not have a material effect on our financial condition, cash flows, orresults of operations. See Note 12 – Litigation for a more detailed discussion.
H. Income Taxes
As reported in the balance sheets, income taxes are comprised of net current income taxes recoverable and net deferred taxassets and liabilities. A deferred tax asset/liability is a tax benefit/expense that is expected to be realized in a future tax return. Atboth December 31, 2008 and 2007, our income taxes were in a net asset position.
Our net deferred tax asset was $793.3 million at December 31, 2008, compared to $92.2 million at December 31, 2007, primarilyreflecting the write-downs on securities during the year that have not been recognized for tax purposes, as well as net unrealizedlosses. Although realization of the deferred tax asset is not assured, management believes it is more likely than not that thedeferred tax asset will be realized based on our expectation that we will be able to fully utilize the deductions that are ultimatelyrecognized for tax purposes. For a complete discussion of our deferred tax assets, see the Critical Accounting Policies-DeferredTax Assets section.
There have been no material changes in our uncertain tax positions during 2008.
See Note 5 – Income Taxes for further information.
App.-A-46
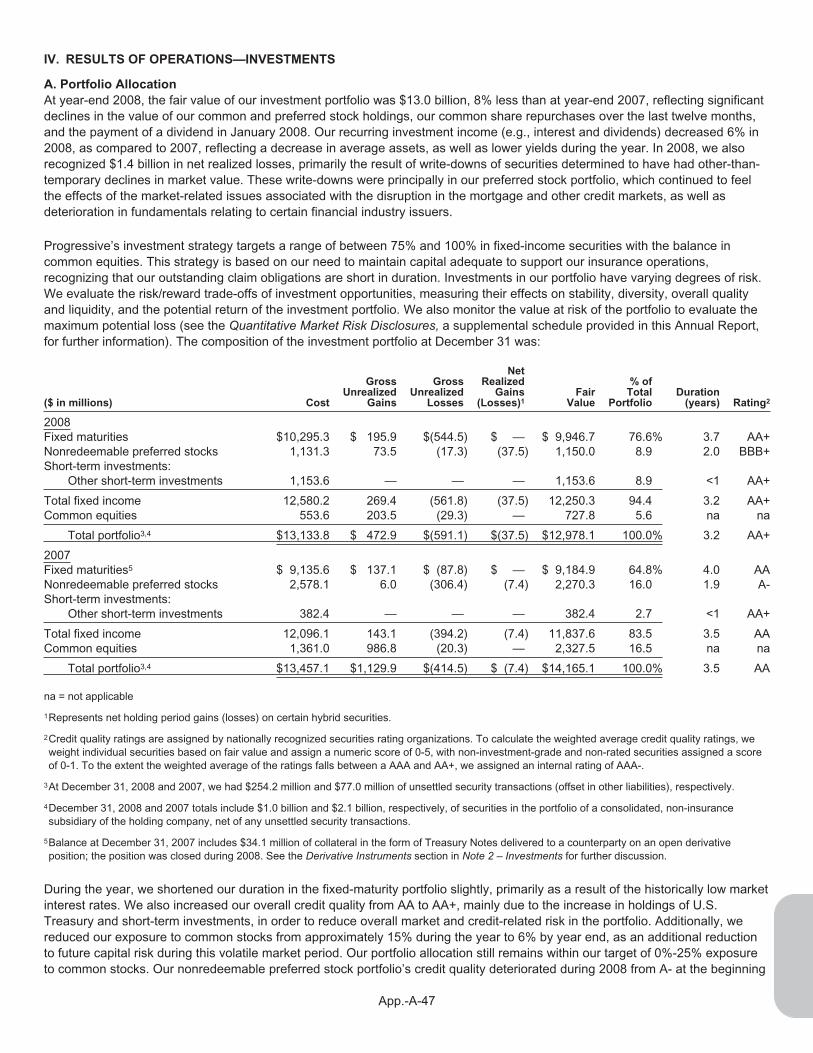
IV. RESULTS OF OPERATIONS—INVESTMENTS
A. Portfolio Allocation
At year-end 2008, the fair value of our investment portfolio was $13.0 billion, 8% less than at year-end 2007, reflecting significantdeclines in the value of our common and preferred stock holdings, our common share repurchases over the last twelve months,and the payment of a dividend in January 2008. Our recurring investment income (e.g., interest and dividends) decreased 6% in2008, as compared to 2007, reflecting a decrease in average assets, as well as lower yields during the year. In 2008, we alsorecognized $1.4 billion in net realized losses, primarily the result of write-downs of securities determined to have had other-than-temporary declines in market value. These write-downs were principally in our preferred stock portfolio, which continued to feelthe effects of the market-related issues associated with the disruption in the mortgage and other credit markets, as well asdeterioration in fundamentals relating to certain financial industry issuers.
Progressive’s investment strategy targets a range of between 75% and 100% in fixed-income securities with the balance incommon equities. This strategy is based on our need to maintain capital adequate to support our insurance operations,recognizing that our outstanding claim obligations are short in duration. Investments in our portfolio have varying degrees of risk.We evaluate the risk/reward trade-offs of investment opportunities, measuring their effects on stability, diversity, overall qualityand liquidity, and the potential return of the investment portfolio. We also monitor the value at risk of the portfolio to evaluate themaximum potential loss (see the Quantitative Market Risk Disclosures, a supplemental schedule provided in this Annual Report,for further information). The composition of the investment portfolio at December 31 was:
($ in millions) Cost
GrossUnrealized
Gains
GrossUnrealized
Losses
NetRealized
Gains(Losses)1
FairValue
% ofTotal
PortfolioDuration
(years) Rating2
2008Fixed maturities $10,295.3 $ 195.9 $(544.5) $ — $ 9,946.7 76.6% 3.7 AA+Nonredeemable preferred stocks 1,131.3 73.5 (17.3) (37.5) 1,150.0 8.9 2.0 BBB+Short-term investments:
Other short-term investments 1,153.6 — — — 1,153.6 8.9 <1 AA+
Total fixed income 12,580.2 269.4 (561.8) (37.5) 12,250.3 94.4 3.2 AA+Common equities 553.6 203.5 (29.3) — 727.8 5.6 na na
Total portfolio3,4 $13,133.8 $ 472.9 $(591.1) $(37.5) $12,978.1 100.0% 3.2 AA+
2007Fixed maturities5 $ 9,135.6 $ 137.1 $ (87.8) $ — $ 9,184.9 64.8% 4.0 AANonredeemable preferred stocks 2,578.1 6.0 (306.4) (7.4) 2,270.3 16.0 1.9 A-Short-term investments:
Other short-term investments 382.4 — — — 382.4 2.7 <1 AA+
Total fixed income 12,096.1 143.1 (394.2) (7.4) 11,837.6 83.5 3.5 AACommon equities 1,361.0 986.8 (20.3) — 2,327.5 16.5 na na
Total portfolio3,4 $13,457.1 $1,129.9 $(414.5) $ (7.4) $14,165.1 100.0% 3.5 AA
na = not applicable
1Represents net holding period gains (losses) on certain hybrid securities.
2Credit quality ratings are assigned by nationally recognized securities rating organizations. To calculate the weighted average credit quality ratings, weweight individual securities based on fair value and assign a numeric score of 0-5, with non-investment-grade and non-rated securities assigned a scoreof 0-1. To the extent the weighted average of the ratings falls between a AAA and AA+, we assigned an internal rating of AAA-.
3At December 31, 2008 and 2007, we had $254.2 million and $77.0 million of unsettled security transactions (offset in other liabilities), respectively.
4December 31, 2008 and 2007 totals include $1.0 billion and $2.1 billion, respectively, of securities in the portfolio of a consolidated, non-insurancesubsidiary of the holding company, net of any unsettled security transactions.
5Balance at December 31, 2007 includes $34.1 million of collateral in the form of Treasury Notes delivered to a counterparty on an open derivativeposition; the position was closed during 2008. See the Derivative Instruments section in Note 2 – Investments for further discussion.
During the year, we shortened our duration in the fixed-maturity portfolio slightly, primarily as a result of the historically low marketinterest rates. We also increased our overall credit quality from AA to AA+, mainly due to the increase in holdings of U.S.Treasury and short-term investments, in order to reduce overall market and credit-related risk in the portfolio. Additionally, wereduced our exposure to common stocks from approximately 15% during the year to 6% by year end, as an additional reductionto future capital risk during this volatile market period. Our portfolio allocation still remains within our target of 0%-25% exposureto common stocks. Our nonredeemable preferred stock portfolio’s credit quality deteriorated during 2008 from A- at the beginning
App.-A-47

of the year to BBB+ by year-end 2008. The cause of the decline was credit downgrades that occurred during the latter part of2008 on five financial sector firms, which represented 13% of our nonredeemable preferred stock portfolio at year end. Wecontinue to receive our periodic dividend payments on all such securities, other than our immaterial remaining holding in FannieMae. Our holdings in the financial sector predominantly represent the largest bank holding companies to which the FederalGovernment has committed capital, reflecting the systemic importance of these companies to the overall United States economy.See our detailed Preferred Stocks – Redeemable and Nonredeemable discussion below.
Unrealized Gains and Losses
As of December 31, 2008, our portfolio had $118.2 million of pretax net unrealized losses, recorded as part of accumulated othercomprehensive income, compared to $715.4 million of net unrealized gains at December 31, 2007. The net unrealized gains inthe common stock portfolio decreased $792.3 million, reflecting both the gains and losses generated from the sales of securities,as well as the negative return of the broad equity markets. During the year, the fair value of our fixed-income securities declinedreflecting widening credit spreads, partially offset by a reduction in interest rates. The net unrealized loss position atDecember 31, 2008, includes the effect of realizing through the income statement $1,858.8 million of write-downs on securitiesdetermined to be other-than-temporarily impaired during 2008; the write-downs were primarily in our preferred stock portfolio. SeeNote 2 – Investments for a further break-out of our gross unrealized gains and losses.
Fixed-Income Securities
The fixed-income portfolio is managed internally and includes fixed-maturity securities, short-term investments, andnonredeemable preferred stocks. The fixed-maturity securities, including redeemable preferred stocks, and short-term securities,as reported on the balance sheets at December 31, were comprised of the following:
($ in millions) 2008 2007
Investment-grade fixed maturities:1
Short/intermediate term $10,836.0 97.6% $9,084.2 95.0%Long term 45.7 .4 147.0 1.5
Non-investment-grade fixed maturities2 218.6 2.0 336.1 3.5
Total $11,100.3 100.0% $9,567.3 100.0%
1Long term includes securities with expected liquidation dates of 10 years or greater. Asset-backed securities are reported at their weighted averagematurity based upon their projected cash flows. All other securities that do not have a single expected maturity date are reported at average maturity. SeeNote 2 – Investments for further discussion.
2Non-investment-grade fixed-maturity securities are non-rated or have a quality rating of an equivalent BB+ or lower, classified by the lowest rating from anationally recognized rating agency.
A primary exposure for the fixed-income portfolio is interest rate risk, which is managed by maintaining the portfolio’s durationbetween 1.8 to 5 years. Interest rate risk includes the change in value resulting from movements in the underlying market rates ofdebt securities held. The fixed-income portfolio had a duration of 3.2 years at December 31, 2008, compared to 3.5 years atDecember 31, 2007. The distribution of duration and convexity (i.e., a measure of the speed at which the duration of a security isexpected to change based on a rise or fall in interest rates) are monitored on a regular basis.
As of December 31, the duration distribution of our fixed-income portfolio was:
Duration Distribution 2008 2007
1 year 19.6% 12.5%2 years 19.9 18.23 years 17.6 24.65 years 32.1 27.410 years 10.8 17.3
Total fixed-income portfolio 100.0% 100.0%
The shift in duration during 2008 resulted from our decision to reduce the overall portfolio valuation risk exposure.
Another primary exposure related to the fixed-income portfolio is credit risk. This risk is managed by maintaining a minimumaverage portfolio credit quality rating of A+, as defined by nationally recognized rating agencies, and limiting non-investment-grade securities to a maximum of 5% of the fixed-income portfolio. Pursuant to guidelines in effect in 2008 established by ourBoard of Directors, investment in a single issuer’s bonds and preferred stocks is limited to no more than 6% of our shareholders’equity, except for U.S. Treasury and agency bonds; any state’s general obligation bonds are limited to 12% of shareholders’equity.
App.-A-48

The credit quality distribution of the fixed-income portfolio at December 31 was:
Rating 2008 2007
AAA 59.0% 49.4%AA 16.3 20.6A 13.6 16.2BBB 9.0 10.6Non-rated/other 2.1 3.2
Total 100.0% 100.0%
During 2008, the AAA rating category increased while the remaining ratings categories decreased, due to our decision to reduceour exposure to the highly volatile market sectors, including common equities (discussed below), and adding to our holdings ofU.S. Treasury securities and short-term instruments.
Our portfolio is also exposed to concentration risk. Our credit risk limits single issuer exposure; however, economic sectorallocation is a key concentration risk. During 2008, the concentration risk in our portfolio was evidenced by an overweighting inpreferred stocks, predominantly invested in the financial services sector. This concentration risk, coupled with the credit crisis(credit risk), led to the significant decline in valuation of our total portfolio. We consider concentration risk more broadly to assetclasses, including but not limited to common equities, residential and commercial mortgage securities, municipal bonds, and high-yield bonds. During 2009, we will adjust our concentration exposure guidelines to reduce certain sector concentrations, as well asour single issuer guidelines, to reduce credit risk exposure, referred to above.
Prepayment and extension risk, especially in our structured product and preferred stock portfolios, is another risk that we monitorin the portfolio. Prepayment risk includes the risk of early redemption of security principal that may need to be reinvested at lessattractive rates. Extension risk includes the risk that a security will not be redeemed when anticipated, and that a security we holdhas a lower yield than a security we might be able to obtain by reinvesting the expected redemption principal. The different typesof structured debt and preferred securities that we hold help minimize this risk. During 2008, we did not experience significantprepayment or extension of principal relative to our expectations in the portfolio.
However, part of the decline in the value of our preferred stock portfolio during the year was due to anticipated extension risk. Thepreferred stocks were being priced under the assumption that issuers would not call their outstanding issues at the first call dateand might even choose to leave these securities outstanding as long as possible. This assumption was based on the fact that thecurrent dividend rates on the outstanding securities were lower than those available on new issues, as well as the fact that thepreferred stock market for new issues was largely not available during the latter part of 2008. The drop in price by assumingextension, particularly for perpetual securities with no mandatory redemption date, was significant.
In addition, we face the risk that our preferred stock dividend payments could be deferred for one or more periods. As ofDecember 31, 2008, all of our preferred securities, with the exception of Fannie Mae, continue to pay fully and timely dividends.
Liquidity risk is another risk factor we monitor. Based on the volatility of the markets in general and the widening of credit spreads,we elected to reduce portfolio valuation risk and direct new investments primarily to U.S. Treasury and short-term securities inorder to preserve capital and maintain our desired liquidity position. As of December 2008, we had $4.8 billion in U.S. Treasuryand short-term securities, approximately three times as much as we had at the same time last year. Another facet of liquidity riskinvolves the inability to sell securities due to a lack of buyers. Our overall portfolio remains very liquid and sufficient to meetcapital requirements; however, beyond U.S. Treasury obligations, market liquidity remains highly variable and generallyconstrained. There continue to be instances within the portfolio where less liquidity exists. The short to intermediate duration ofour portfolio provides an additional source of liquidity as we expect approximately 15% of our non-U.S. Treasury and short-term,fixed-income portfolio to repay principal over the course of 2009. In addition, cash from principal and dividend payments providesa recurring source of liquidity.
App.-A-49
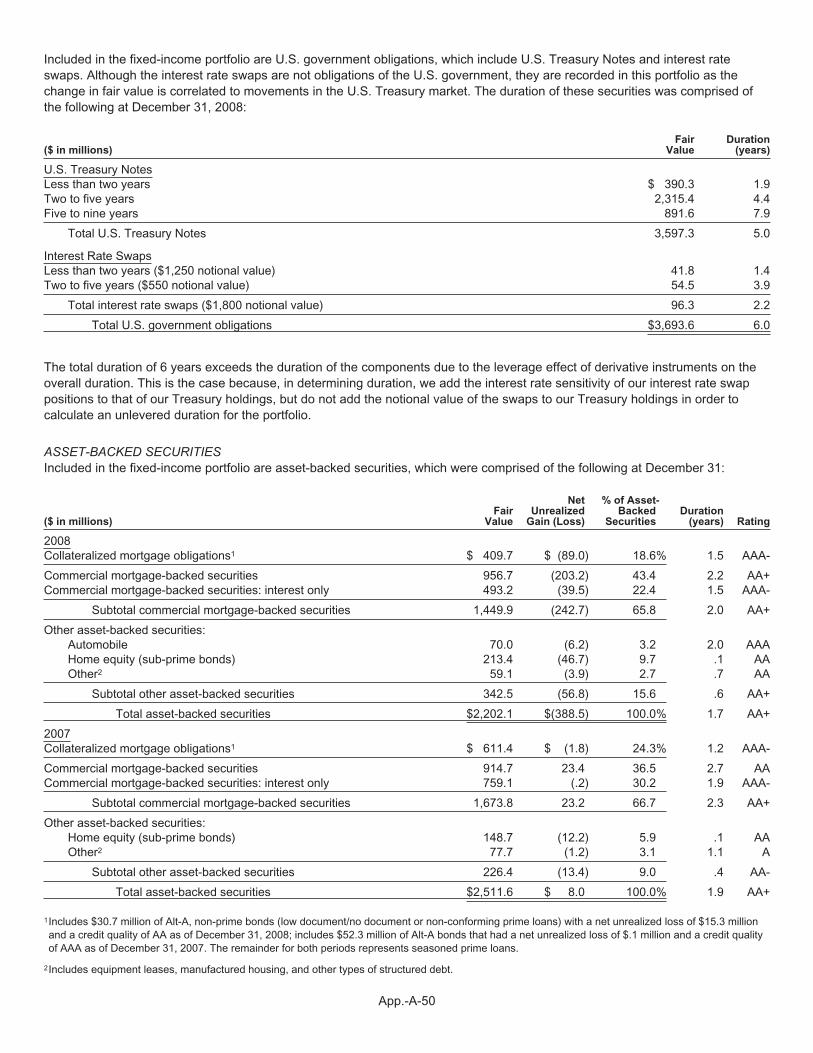
Included in the fixed-income portfolio are U.S. government obligations, which include U.S. Treasury Notes and interest rateswaps. Although the interest rate swaps are not obligations of the U.S. government, they are recorded in this portfolio as thechange in fair value is correlated to movements in the U.S. Treasury market. The duration of these securities was comprised ofthe following at December 31, 2008:
($ in millions)Fair
ValueDuration
(years)
U.S. Treasury NotesLess than two years $ 390.3 1.9Two to five years 2,315.4 4.4Five to nine years 891.6 7.9
Total U.S. Treasury Notes 3,597.3 5.0
Interest Rate SwapsLess than two years ($1,250 notional value) 41.8 1.4Two to five years ($550 notional value) 54.5 3.9
Total interest rate swaps ($1,800 notional value) 96.3 2.2
Total U.S. government obligations $3,693.6 6.0
The total duration of 6 years exceeds the duration of the components due to the leverage effect of derivative instruments on theoverall duration. This is the case because, in determining duration, we add the interest rate sensitivity of our interest rate swappositions to that of our Treasury holdings, but do not add the notional value of the swaps to our Treasury holdings in order tocalculate an unlevered duration for the portfolio.
ASSET-BACKED SECURITIESIncluded in the fixed-income portfolio are asset-backed securities, which were comprised of the following at December 31:
($ in millions)Fair
Value
NetUnrealized
Gain (Loss)
% of Asset-Backed
SecuritiesDuration
(years) Rating
2008Collateralized mortgage obligations1 $ 409.7 $ (89.0) 18.6% 1.5 AAA-
Commercial mortgage-backed securities 956.7 (203.2) 43.4 2.2 AA+Commercial mortgage-backed securities: interest only 493.2 (39.5) 22.4 1.5 AAA-
Subtotal commercial mortgage-backed securities 1,449.9 (242.7) 65.8 2.0 AA+
Other asset-backed securities:Automobile 70.0 (6.2) 3.2 2.0 AAAHome equity (sub-prime bonds) 213.4 (46.7) 9.7 .1 AAOther2 59.1 (3.9) 2.7 .7 AA
Subtotal other asset-backed securities 342.5 (56.8) 15.6 .6 AA+
Total asset-backed securities $2,202.1 $(388.5) 100.0% 1.7 AA+
2007Collateralized mortgage obligations1 $ 611.4 $ (1.8) 24.3% 1.2 AAA-
Commercial mortgage-backed securities 914.7 23.4 36.5 2.7 AACommercial mortgage-backed securities: interest only 759.1 (.2) 30.2 1.9 AAA-
Subtotal commercial mortgage-backed securities 1,673.8 23.2 66.7 2.3 AA+
Other asset-backed securities:Home equity (sub-prime bonds) 148.7 (12.2) 5.9 .1 AAOther2 77.7 (1.2) 3.1 1.1 A
Subtotal other asset-backed securities 226.4 (13.4) 9.0 .4 AA-
Total asset-backed securities $2,511.6 $ 8.0 100.0% 1.9 AA+
1Includes $30.7 million of Alt-A, non-prime bonds (low document/no document or non-conforming prime loans) with a net unrealized loss of $15.3 millionand a credit quality of AA as of December 31, 2008; includes $52.3 million of Alt-A bonds that had a net unrealized loss of $.1 million and a credit qualityof AAA as of December 31, 2007. The remainder for both periods represents seasoned prime loans.
2Includes equipment leases, manufactured housing, and other types of structured debt.
App.-A-50
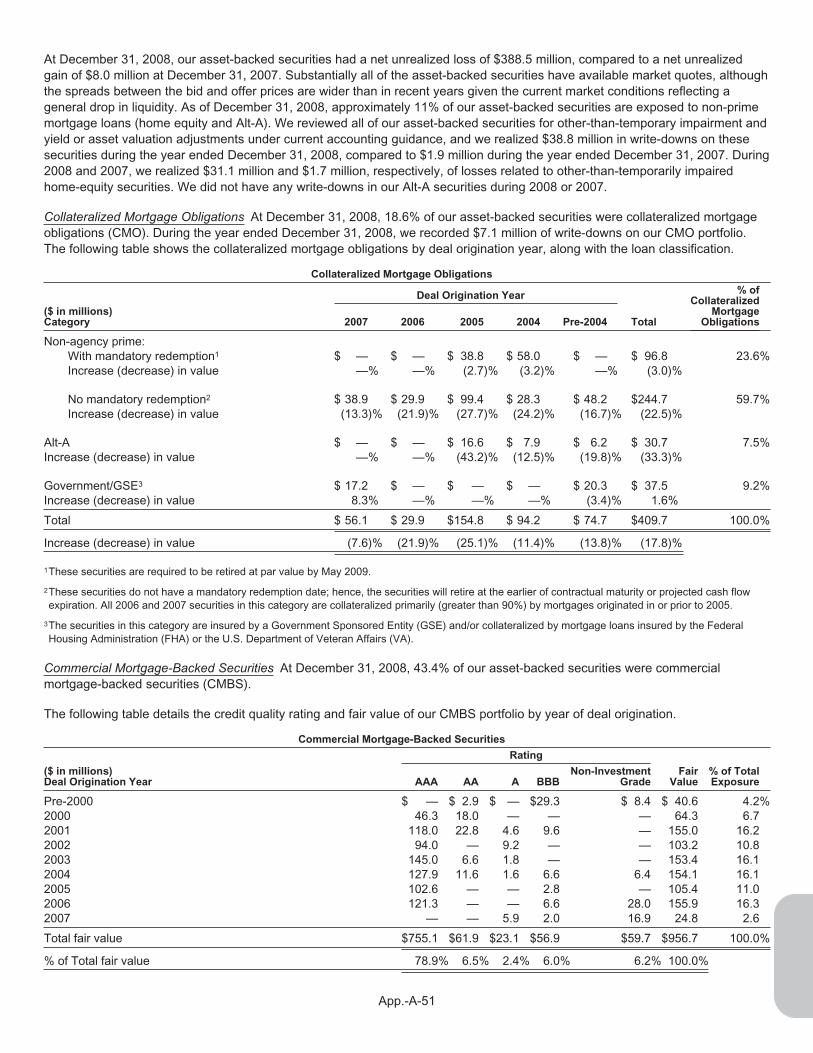
At December 31, 2008, our asset-backed securities had a net unrealized loss of $388.5 million, compared to a net unrealizedgain of $8.0 million at December 31, 2007. Substantially all of the asset-backed securities have available market quotes, althoughthe spreads between the bid and offer prices are wider than in recent years given the current market conditions reflecting ageneral drop in liquidity. As of December 31, 2008, approximately 11% of our asset-backed securities are exposed to non-primemortgage loans (home equity and Alt-A). We reviewed all of our asset-backed securities for other-than-temporary impairment andyield or asset valuation adjustments under current accounting guidance, and we realized $38.8 million in write-downs on thesesecurities during the year ended December 31, 2008, compared to $1.9 million during the year ended December 31, 2007. During2008 and 2007, we realized $31.1 million and $1.7 million, respectively, of losses related to other-than-temporarily impairedhome-equity securities. We did not have any write-downs in our Alt-A securities during 2008 or 2007.
Collateralized Mortgage Obligations At December 31, 2008, 18.6% of our asset-backed securities were collateralized mortgageobligations (CMO). During the year ended December 31, 2008, we recorded $7.1 million of write-downs on our CMO portfolio.The following table shows the collateralized mortgage obligations by deal origination year, along with the loan classification.
Collateralized Mortgage Obligations
Deal Origination Year% of
CollateralizedMortgage
Obligations($ in millions)Category 2007 2006 2005 2004 Pre-2004 Total
Non-agency prime:With mandatory redemption1 $ — $ — $ 38.8 $ 58.0 $ — $ 96.8 23.6%Increase (decrease) in value —% —% (2.7)% (3.2)% —% (3.0)%
No mandatory redemption2 $ 38.9 $ 29.9 $ 99.4 $ 28.3 $ 48.2 $244.7 59.7%Increase (decrease) in value (13.3)% (21.9)% (27.7)% (24.2)% (16.7)% (22.5)%
Alt-A $ — $ — $ 16.6 $ 7.9 $ 6.2 $ 30.7 7.5%Increase (decrease) in value —% —% (43.2)% (12.5)% (19.8)% (33.3)%
Government/GSE3 $ 17.2 $ — $ — $ — $ 20.3 $ 37.5 9.2%Increase (decrease) in value 8.3% —% —% —% (3.4)% 1.6%
Total $ 56.1 $ 29.9 $154.8 $ 94.2 $ 74.7 $409.7 100.0%
Increase (decrease) in value (7.6)% (21.9)% (25.1)% (11.4)% (13.8)% (17.8)%
1These securities are required to be retired at par value by May 2009.
2These securities do not have a mandatory redemption date; hence, the securities will retire at the earlier of contractual maturity or projected cash flowexpiration. All 2006 and 2007 securities in this category are collateralized primarily (greater than 90%) by mortgages originated in or prior to 2005.
3The securities in this category are insured by a Government Sponsored Entity (GSE) and/or collateralized by mortgage loans insured by the FederalHousing Administration (FHA) or the U.S. Department of Veteran Affairs (VA).
Commercial Mortgage-Backed Securities At December 31, 2008, 43.4% of our asset-backed securities were commercialmortgage-backed securities (CMBS).
The following table details the credit quality rating and fair value of our CMBS portfolio by year of deal origination.
Commercial Mortgage-Backed Securities
Rating
($ in millions)Deal Origination Year AAA AA A BBB
Non-InvestmentGrade
FairValue
% of TotalExposure
Pre-2000 $ — $ 2.9 $ — $29.3 $ 8.4 $ 40.6 4.2%2000 46.3 18.0 — — — 64.3 6.72001 118.0 22.8 4.6 9.6 — 155.0 16.22002 94.0 — 9.2 — — 103.2 10.82003 145.0 6.6 1.8 — — 153.4 16.12004 127.9 11.6 1.6 6.6 6.4 154.1 16.12005 102.6 — — 2.8 — 105.4 11.02006 121.3 — — 6.6 28.0 155.9 16.32007 — — 5.9 2.0 16.9 24.8 2.6
Total fair value $755.1 $61.9 $23.1 $56.9 $59.7 $956.7 100.0%
% of Total fair value 78.9% 6.5% 2.4% 6.0% 6.2% 100.0%
App.-A-51
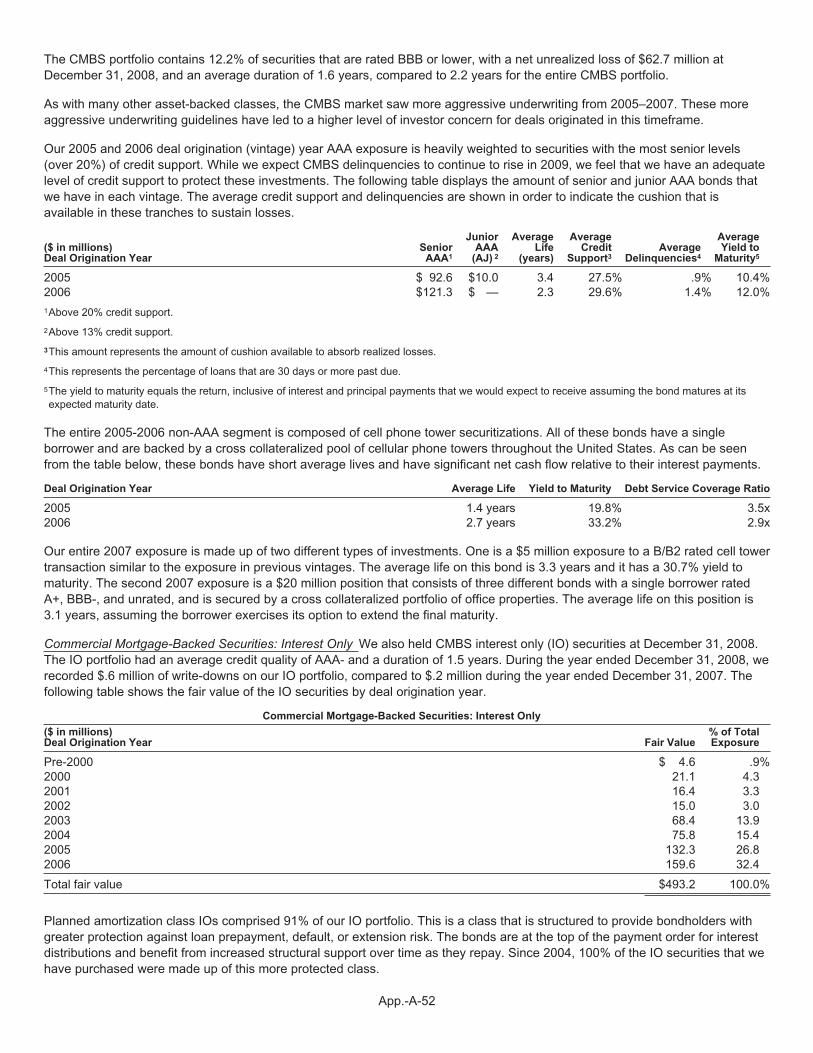
The CMBS portfolio contains 12.2% of securities that are rated BBB or lower, with a net unrealized loss of $62.7 million atDecember 31, 2008, and an average duration of 1.6 years, compared to 2.2 years for the entire CMBS portfolio.
As with many other asset-backed classes, the CMBS market saw more aggressive underwriting from 2005–2007. These moreaggressive underwriting guidelines have led to a higher level of investor concern for deals originated in this timeframe.
Our 2005 and 2006 deal origination (vintage) year AAA exposure is heavily weighted to securities with the most senior levels(over 20%) of credit support. While we expect CMBS delinquencies to continue to rise in 2009, we feel that we have an adequatelevel of credit support to protect these investments. The following table displays the amount of senior and junior AAA bonds thatwe have in each vintage. The average credit support and delinquencies are shown in order to indicate the cushion that isavailable in these tranches to sustain losses.
($ in millions)Deal Origination Year
SeniorAAA1
JuniorAAA
(AJ) 2
AverageLife
(years)
AverageCredit
Support3Average
Delinquencies4
AverageYield to
Maturity5
2005 $ 92.6 $10.0 3.4 27.5% .9% 10.4%2006 $121.3 $ — 2.3 29.6% 1.4% 12.0%
1Above 20% credit support.
2Above 13% credit support.
3This amount represents the amount of cushion available to absorb realized losses.
4This represents the percentage of loans that are 30 days or more past due.
5The yield to maturity equals the return, inclusive of interest and principal payments that we would expect to receive assuming the bond matures at itsexpected maturity date.
The entire 2005-2006 non-AAA segment is composed of cell phone tower securitizations. All of these bonds have a singleborrower and are backed by a cross collateralized pool of cellular phone towers throughout the United States. As can be seenfrom the table below, these bonds have short average lives and have significant net cash flow relative to their interest payments.
Deal Origination Year Average Life Yield to Maturity Debt Service Coverage Ratio
2005 1.4 years 19.8% 3.5x2006 2.7 years 33.2% 2.9x
Our entire 2007 exposure is made up of two different types of investments. One is a $5 million exposure to a B/B2 rated cell towertransaction similar to the exposure in previous vintages. The average life on this bond is 3.3 years and it has a 30.7% yield tomaturity. The second 2007 exposure is a $20 million position that consists of three different bonds with a single borrower ratedA+, BBB-, and unrated, and is secured by a cross collateralized portfolio of office properties. The average life on this position is3.1 years, assuming the borrower exercises its option to extend the final maturity.
Commercial Mortgage-Backed Securities: Interest Only We also held CMBS interest only (IO) securities at December 31, 2008.The IO portfolio had an average credit quality of AAA- and a duration of 1.5 years. During the year ended December 31, 2008, werecorded $.6 million of write-downs on our IO portfolio, compared to $.2 million during the year ended December 31, 2007. Thefollowing table shows the fair value of the IO securities by deal origination year.
Commercial Mortgage-Backed Securities: Interest Only
($ in millions)Deal Origination Year Fair Value
% of TotalExposure
Pre-2000 $ 4.6 .9%2000 21.1 4.32001 16.4 3.32002 15.0 3.02003 68.4 13.92004 75.8 15.42005 132.3 26.82006 159.6 32.4
Total fair value $493.2 100.0%
Planned amortization class IOs comprised 91% of our IO portfolio. This is a class that is structured to provide bondholders withgreater protection against loan prepayment, default, or extension risk. The bonds are at the top of the payment order for interestdistributions and benefit from increased structural support over time as they repay. Since 2004, 100% of the IO securities that wehave purchased were made up of this more protected class.
App.-A-52

Home-Equity Securities The following table shows the credit quality rating of our home-equity securities by deal origination year,along with a comparison of the fair value at December 31, 2008, to our original investment value (adjusted for returns of principaland amortization).
Home-Equity Securities
Deal Origination Year
($ in millions)Rating (date acquired) 2007 2006 2005 2004 Total
% of HomeEquity Loans
AAA (December 2007-May 2008) $— $ 60.9 $ 47.5 $ — $108.4 50.8%Decrease in value —% (10.9)% (12.4)% —% (11.6)%
AA (September 2007-May 2008) $— $ 5.9 $ 50.3 $ 9.1 $ 65.3 30.6%Decrease in value —% (20.9)% (25.1)% (36.8)% (26.6)%
A (August 2007-April 2008) $— $ — $ 8.8 $ 5.0 $ 13.8 6.5%Decrease in value —% —% (15.2)% —% (10.2)%
BBB (March 2007-December 2007) $— $ 13.4 $ 10.5 $ 1.1 $ 25.0 11.7%Decrease in value —% (29.7)% (11.2)% (19.9)% (22.5)%
Non-investment grade (August 2007) $ .4 $ — $ .5 $ — $ .9 .4%Decrease in value —% —% —% —% —%
Total $ .4 $ 80.2 $117.6 $ 15.2 $213.4 100.0%
Decrease in value —% (15.5)% (18.4)% (26.7)% (18.0)%
MUNICIPAL SECURITIESIncluded in the fixed-income portfolio at December 31, 2008, were $3,004.4 million of state and local government obligations withan overall credit quality of AA. These securities had a net unrealized loss of $37.0 million at December 31, 2008, compared to anet unrealized gain of $38.8 million at December 31, 2007. The following table details the credit quality rating of our municipalsecurities at December 31, 2008, without the benefit of credit or bond insurance as discussed below.
Municipal Securities Rating
(millions)Rating
GeneralObligations
RevenueBonds Total
AAA $ 357.7 $ 397.5 $ 755.2AA 652.2 1,258.1 1,910.3A 154.1 143.9 298.0BBB 1.4 29.6 31.0Other — 9.9 9.9
Total $1,165.4 $1,839.0 $3,004.4
Included in revenue bonds are $1.0 billion of single family housing revenue bonds issued by state housing finance agencies ofwhich $.7 billion are supported by individual mortgages held by the state housing finance agencies and $.3 billion are supportedby mortgage-backed securities. Of the programs supported by mortgage-backed securities, approximately 40% are collateralizedby Fannie Mae mortgages; the remaining 60% are collateralized by Ginnie Mae loans, which are fully guaranteed by the U.S.Government. Of the programs supported by individual mortgages held by the state housing finance agencies, the overall creditquality rating is AA. Most of these mortgages are supported by FHA, VA, or private mortgage insurance providers.
App.-A-53

Approximately 31%, or $931.9 million, of our total municipal securities were insured general obligation or revenue bonds, which inthe aggregate had a decline in credit quality from AAA at December 31, 2007 to AA- as of December 31, 2008. The credit qualitydecline was primarily due to rating downgrades of FGIC, AMBAC, and MBIA monoline bond insurers. The following table showsthe composition and credit quality rating of these municipal obligations by monoline insurer at December 31, 2008. The creditquality rating represents the rating of the underlying security, excluding credit insurance, based on ratings by nationallyrecognized rating agencies.
Insurance Enhanced Municipal Securities
(millions)Monoline Insurer/ Rating
GeneralObligations
RevenueBonds Total
FGICAA $ 72.1 $ 45.9 $118.0
AMBACAA $103.4 $ 69.0 $172.4A 38.3 — 38.3BBB — 1.0 1.0Non-rated — 5.1 5.1
$141.7 $ 75.1 $216.8
MBIAAA $120.3 $155.1 $275.4A 102.9 50.4 153.3BBB — 5.1 5.1Non-rated — 4.8 4.8
$223.2 $215.4 $438.6
FSAAA $ 47.2 $ 67.7 $114.9A — 22.8 22.8BBB — 20.8 20.8
$ 47.2 $111.3 $158.5
TOTALAA $343.0 $337.7 $680.7A 141.2 73.2 214.4BBB — 26.9 26.9Non-rated — 9.9 9.9
$484.2 $447.7 $931.9
As of December 31, 2008 and 2007, the insurance-enhanced general obligation and revenue bonds had combined net unrealizedgains of $12.9 million and $12.5 million, respectively. We buy and hold these securities based on our evaluation of the underlyingcredit without reliance on the monoline insurance. Our policy does not require us to liquidate securities should the insuranceprovided by the monoline insurers cease to exist.
CORPORATE SECURITIESIncluded in our fixed-income securities at December 31, 2008, were $642.3 million of fixed-rate corporate securities which had aduration of 3.9 years and an overall credit quality rating of BBB+. These securities had a net unrealized loss of $51.9 million atDecember 31, 2008, compared to a net unrealized gain of $3.4 million at December 31, 2007. During the year endedDecember 31, 2008, we recorded $69.0 million of other-than-temporary impairment losses on our corporate debt portfolio. Thetable below shows the exposure break-down by rating and sector.
Corporate Securities Rating by Sector
Sector AAA AA A BBB % of Portfolio
Financial ServicesU.S. banks —% —% 4.4% —% 4.4%Insurance — 10.4 9.2 — 19.6Other financial 3.2 — 4.6 7.7 15.5
Total Financial Services 3.2 10.4 18.2 7.7 39.5
Agency — — — — —Industrial — — 3.2 57.3 60.5Utility — — — — —
Total 3.2% 10.4% 21.4% 65.0% 100.0%
App.-A-54
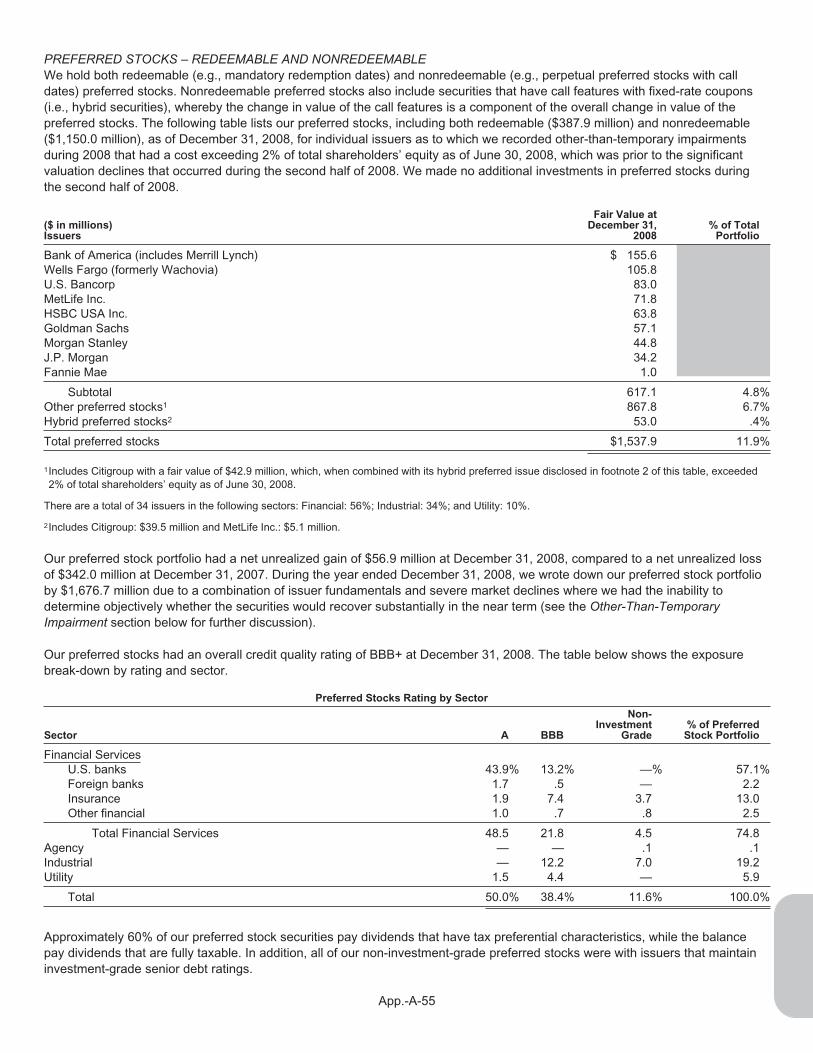
PREFERRED STOCKS – REDEEMABLE AND NONREDEEMABLEWe hold both redeemable (e.g., mandatory redemption dates) and nonredeemable (e.g., perpetual preferred stocks with calldates) preferred stocks. Nonredeemable preferred stocks also include securities that have call features with fixed-rate coupons(i.e., hybrid securities), whereby the change in value of the call features is a component of the overall change in value of thepreferred stocks. The following table lists our preferred stocks, including both redeemable ($387.9 million) and nonredeemable($1,150.0 million), as of December 31, 2008, for individual issuers as to which we recorded other-than-temporary impairmentsduring 2008 that had a cost exceeding 2% of total shareholders’ equity as of June 30, 2008, which was prior to the significantvaluation declines that occurred during the second half of 2008. We made no additional investments in preferred stocks duringthe second half of 2008.
($ in millions)Issuers
Fair Value atDecember 31,
2008% of Total
Portfolio
Bank of America (includes Merrill Lynch) $ 155.6Wells Fargo (formerly Wachovia) 105.8U.S. Bancorp 83.0MetLife Inc. 71.8HSBC USA Inc. 63.8Goldman Sachs 57.1Morgan Stanley 44.8J.P. Morgan 34.2Fannie Mae 1.0
Subtotal 617.1 4.8%Other preferred stocks1 867.8 6.7%Hybrid preferred stocks2 53.0 .4%
Total preferred stocks $1,537.9 11.9%
1Includes Citigroup with a fair value of $42.9 million, which, when combined with its hybrid preferred issue disclosed in footnote 2 of this table, exceeded2% of total shareholders’ equity as of June 30, 2008.
There are a total of 34 issuers in the following sectors: Financial: 56%; Industrial: 34%; and Utility: 10%.
2Includes Citigroup: $39.5 million and MetLife Inc.: $5.1 million.
Our preferred stock portfolio had a net unrealized gain of $56.9 million at December 31, 2008, compared to a net unrealized lossof $342.0 million at December 31, 2007. During the year ended December 31, 2008, we wrote down our preferred stock portfolioby $1,676.7 million due to a combination of issuer fundamentals and severe market declines where we had the inability todetermine objectively whether the securities would recover substantially in the near term (see the Other-Than-TemporaryImpairment section below for further discussion).
Our preferred stocks had an overall credit quality rating of BBB+ at December 31, 2008. The table below shows the exposurebreak-down by rating and sector.
Preferred Stocks Rating by Sector
Sector A BBB
Non-Investment
Grade% of Preferred
Stock Portfolio
Financial ServicesU.S. banks 43.9% 13.2% —% 57.1%Foreign banks 1.7 .5 — 2.2Insurance 1.9 7.4 3.7 13.0Other financial 1.0 .7 .8 2.5
Total Financial Services 48.5 21.8 4.5 74.8Agency — — .1 .1Industrial — 12.2 7.0 19.2Utility 1.5 4.4 — 5.9
Total 50.0% 38.4% 11.6% 100.0%
Approximately 60% of our preferred stock securities pay dividends that have tax preferential characteristics, while the balancepay dividends that are fully taxable. In addition, all of our non-investment-grade preferred stocks were with issuers that maintaininvestment-grade senior debt ratings.
App.-A-55

Approximately 70% of our preferred stock securities are fixed-rate securities and 30% are floating-rate securities. All of ourpreferred securities have call or mandatory redemption features. Most of the securities are structured to provide some protectionagainst extension risk in the event the issuer elects not to call such securities at their initial call date by either paying a higherdividend amount or by paying floating-rate coupons. Of our fixed-rate securities, approximately 90% will convert to floating-ratedividend payments if not called at their initial call date.
Common Equities
Common equities, as reported in the balance sheets at December 31, were comprised of the following:
($ in millions) 2008 2007
Common stocks $714.3 98.1% $2,313.8 99.4%Other risk investments 13.5 1.9 13.7 .6
Total common equities $727.8 100.0% $2,327.5 100.0%
Our common equity allocation is intended to enhance the return of and provide diversification for the total portfolio and may rangefrom 0% to 25% of the investment portfolio. At December 31, 2008, 5.6% of the portfolio was in common equities, compared to16.5% at the same time last year. The decrease reflects our decision to reduce our exposure to equity securities, which we begantoward the end of the third quarter 2008. In addition, the common equities experienced a significant market decline over the last12 months, which contributed to the reduction in fair value.
Common stocks are managed externally to track the Russell 1000 Index with an anticipated annual tracking error of +/-50 basispoints (bps). Our individual holdings are selected based on their contribution to the correlation with the index. In order to maintaincorrelation to the index, we use a market capitalization of the portfolio’s holdings compared to the total capitalization of theRussell 1000 Index. For 2008 our GAAP basis total return, when compared to the Russell 1000 Index, resulted in a tracking errorof approximately +12 bps outside of the anticipated range, or +62 bps. As a result of reducing our ongoing exposure to thevolatile common stock market at the end of the third quarter, with the declines in the market occurring while we were trading, ourportfolio’s tracking error to the index moved outside the desired +/-50 bps to as high as +/-95 bps on an annualized basis, andcreated the +12 bps spread referred to above. During the fourth quarter, we closed the tracking error variance down to a current+/-75 bps in order to reduce the overall variance on the portfolio going forward. The current high level of market volatility is thereason our predicted tracking error increased rather than a change in portfolio composition. We held 535 out of 985, or 54%, ofthe common stocks comprising the Russell 1000 Index at December 31, 2008 and approximately 86% of the total marketcapitalization of the index.
Other risk investments include private equity investments and limited partnership interests in private equity and mezzanineinvestment funds which have no off-balance-sheet exposure or contingent obligations, except for $.2 million of open fundingcommitments.
Trading Securities
Trading securities may be entered into from time to time for the purpose of near-term profit generation. We have not entered intoany trading securities in the last three years.
Derivative Instruments
We invest in the following derivative exposures at various times: interest rate swaps; asset-backed credit default swaps; U.S.corporate debt and corporate debt indexed credit default swaps; and forecasted hedges. See Note 2 – Investments for furtherdiscussion of our derivative positions.
For all derivative positions discussed below, realized holding period gains and losses are netted with any upfront cash that maybe exchanged under the contract to determine if the net position should be classified either as an asset or liability. To be reportedas a component of the available-for-sale portfolio, the inception-to-date realized gain on the derivative position at period endwould have to exceed any upfront cash received (net derivative asset). On the other hand, a net derivative liability would includeany inception-to-date realized loss plus the amount of upfront cash received (or netted, if upfront cash was paid) and would bereported as a component of other liabilities. These net derivative assets/liabilities are not separately disclosed on the balancesheet due to the immaterial effect on our financial condition, cash flows, and results of operations.
App.-A-56
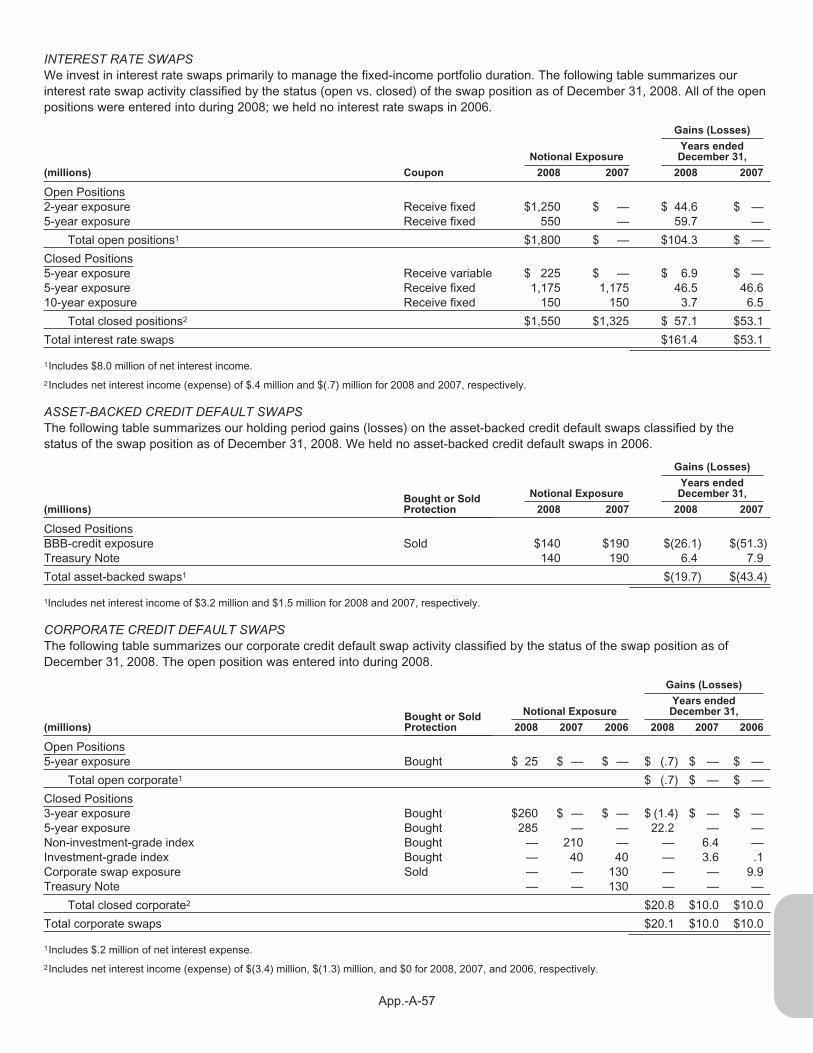
INTEREST RATE SWAPSWe invest in interest rate swaps primarily to manage the fixed-income portfolio duration. The following table summarizes ourinterest rate swap activity classified by the status (open vs. closed) of the swap position as of December 31, 2008. All of the openpositions were entered into during 2008; we held no interest rate swaps in 2006.
Gains (Losses)
Notional ExposureYears endedDecember 31,
(millions) Coupon 2008 2007 2008 2007
Open Positions2-year exposure Receive fixed $1,250 $ — $ 44.6 $ —5-year exposure Receive fixed 550 — 59.7 —
Total open positions1 $1,800 $ — $104.3 $ —
Closed Positions5-year exposure Receive variable $ 225 $ — $ 6.9 $ —5-year exposure Receive fixed 1,175 1,175 46.5 46.610-year exposure Receive fixed 150 150 3.7 6.5
Total closed positions2 $1,550 $1,325 $ 57.1 $53.1
Total interest rate swaps $161.4 $53.1
1Includes $8.0 million of net interest income.
2Includes net interest income (expense) of $.4 million and $(.7) million for 2008 and 2007, respectively.
ASSET-BACKED CREDIT DEFAULT SWAPSThe following table summarizes our holding period gains (losses) on the asset-backed credit default swaps classified by thestatus of the swap position as of December 31, 2008. We held no asset-backed credit default swaps in 2006.
Bought or SoldProtection
Notional Exposure
Gains (Losses)
Years endedDecember 31,
(millions) 2008 2007 2008 2007
Closed PositionsBBB-credit exposure Sold $140 $190 $(26.1) $(51.3)Treasury Note 140 190 6.4 7.9
Total asset-backed swaps1 $(19.7) $(43.4)
1Includes net interest income of $3.2 million and $1.5 million for 2008 and 2007, respectively.
CORPORATE CREDIT DEFAULT SWAPSThe following table summarizes our corporate credit default swap activity classified by the status of the swap position as ofDecember 31, 2008. The open position was entered into during 2008.
Bought or SoldProtection
Gains (Losses)
Notional ExposureYears endedDecember 31,
(millions) 2008 2007 2006 2008 2007 2006
Open Positions5-year exposure Bought $ 25 $ — $ — $ (.7) $ — $ —
Total open corporate1 $ (.7) $ — $ —
Closed Positions3-year exposure Bought $260 $ — $ — $ (1.4) $ — $ —5-year exposure Bought 285 — — 22.2 — —Non-investment-grade index Bought — 210 — — 6.4 —Investment-grade index Bought — 40 40 — 3.6 .1Corporate swap exposure Sold — — 130 — — 9.9Treasury Note — — 130 — — —
Total closed corporate2 $20.8 $10.0 $10.0
Total corporate swaps $20.1 $10.0 $10.0
1Includes $.2 million of net interest expense.
2Includes net interest income (expense) of $(3.4) million, $(1.3) million, and $0 for 2008, 2007, and 2006, respectively.
App.-A-57
FORECASTED HEDGESDuring the fourth quarter 2008, we entered into a cash flow hedge of forecasted foreign currency transactions. The hedge wasdesignated as, and qualified for, cash flow hedge accounting treatment. We will defer the pretax gain or loss on this hedge andreport the amount in accumulated other comprehensive income. The gain or loss on the contract will be amortized over the periodin which foreign denominated expenses occur beginning the second half of 2009.
During the second quarter 2007, we entered into a forecasted debt issuance hedge against a possible rise in interest rates inanticipation of issuing $1 billion of our 6.70% Fixed-to-Floating Rate Junior Subordinated Debentures due 2067 (the“Debentures”). The hedge was designated as, and qualified for, cash flow hedge accounting treatment. Upon issuance of theDebentures, the hedge was closed, and we recognized a pretax gain of $34.4 million, which is recorded as part of accumulatedother comprehensive income. The $34.4 million gain is deferred and is being recognized as an adjustment to interest expenseover the 10-year fixed interest rate term of the Debentures. During 2008 and 2007, we recognized $2.6 million and $1.3 million,respectively, as an adjustment to interest expense.
B. Investment Results
Recurring investment income (interest and dividends, before investment and interest expenses) decreased 6% in 2008 andincreased 5% in 2007 and 21% in 2006. The decrease in 2008 was the result of reallocating our portfolio, and investing new cashto the portfolio predominantly in U.S. Treasury and short-term securities, both of which have lower yields than the current mix ofcredit-related products in the portfolio. Additionally, the general reduction in the market level interest rates affected the amount ofincome collected on our variable-rate securities. The increase in 2007 was primarily the result of a decision to add certain higher-yielding, though lower-rated, assets. These lower-rated assets provided additional income over our previous investments. Theincrease in investment income during 2006 was primarily the result of an increase in investment yields, with a small growth inaverage assets providing the balance of the increase.
We report total return to reflect more accurately the management philosophy governing the portfolio and our evaluation ofinvestment results. The fully taxable equivalent (FTE) total return includes recurring investment income, net realized gains(losses) on securities, and changes in unrealized gains (losses) on investments.
We reported the following investment results for the years ended December 31:
2008 2007 2006
Pretax recurring investment book yield 4.7% 4.8% 4.6%Weighted average FTE book yield 5.5% 5.6% 5.3%FTE total return:
Fixed-income securities (7.1)% 4.4% 5.9%Common stocks (36.5)% 6.2% 16.3%Total portfolio (10.4)% 4.7% 7.4%
A further break-down of our total returns for our fixed-income securities for the years ended December 31 follows:
2008 2007 2006
Fixed-income securities:U.S. Treasury Notes1 30.5% 14.8% 3.5%Municipal bonds 4.1% 7.1% 5.8%Corporate bonds1 (7.1)% 7.7% 7.4%Commercial mortgage-backed securities (9.5)% 6.2% 6.2%Collateralized mortgage obligations (14.0)% 6.0% 4.9%Asset-backed securities1 (15.1)% (14.7)% 6.0%Preferred stocks (40.5)% (5.7)% 8.2%
1Includes the net gains (losses) on the credit default and interest rate swaps.
Investment expenses were $8.8 million in 2008, compared to $12.4 million in 2007 and $11.9 million in 2006. For 2007, theinvestment expenses included the costs associated with the June 2007 issuance of our Debentures, as well as an accrual for2007 bonuses under our incentive compensation plan that was reversed early in 2008 upon final determination of the relativeperformance of our fixed-income portfolio; no bonus was accrued for 2008.
Interest expense in 2008 was $136.7 million, compared to $108.6 million in 2007 and $77.3 million in 2006. The increase in 2008and 2007 reflects the June 2007 issuance of our Debentures.
App.-A-58

Other-Than-Temporary Impairment
Realized losses may include write-downs of securities determined to have had an other-than-temporary decline in fair value. Weroutinely monitor our portfolio for pricing changes that might indicate potential impairments, and perform detailed reviews ofsecurities with unrealized losses based on predetermined guidelines. In such cases, changes in fair value are evaluated todetermine the extent to which such changes are attributable to (i) fundamental factors specific to the issuer, such as financialconditions, business prospects, or other factors, or (ii) market-related factors, such as interest rates or equity market declines(e.g., negative return at either a sector index level or at the broader market level).
Fixed-income securities and common equities with declines attributable to issuer-specific fundamentals are reviewed to identify allavailable evidence, circumstances, and influences to estimate the potential for, and timing of, recovery of the investment’simpairment. An other-than-temporary impairment loss is deemed to have occurred when the potential for recovery does notsatisfy the criteria set forth in the current accounting guidance.
For fixed-maturity investments with unrealized losses due to market- or sector-related declines, the losses are not deemed toqualify as other-than-temporary where we have the intent and ability to hold the investment for the periods of time that weanticipate to be necessary to recover a substantial portion of the investment’s impairment and collect the interest and dividendobligations. In general, our policy for equity securities with market- or sector-related declines is to recognize impairment losses onindividual securities with losses we can not reasonably assert will recover in the near term under historical conditions by theearlier of (i) when we are able to objectively determine that the loss is other-than-temporary, or (ii) when the security has been insuch a loss position for three consecutive quarters.
When a security in our investment portfolio has an unrealized loss in fair value that is deemed to be other-than-temporary, wereduce the book value of such security to its current fair value, recognizing the decline as a realized loss in the income statement.All other unrealized gains or losses are reflected in shareholders’ equity. The write-down activity for the years endedDecember 31 was as follows:
(millions)Total
Write-downs
Write-downson Securities
Sold
Write-downson Securities
Held atPeriod End
2008Preferred stocks $1,676.7 $434.4 $1,242.3Corporate securities 69.0 — 69.0Asset-backed securities 38.8 — 38.8
Total fixed income 1,784.5 434.4 1,350.1Common equities 74.3 31.3 43.0
Total portfolio $1,858.8 $465.7 $1,393.1
2007Preferred stocks $ 17.4 $ — $ 17.4Asset-backed securities 1.9 — 1.9
Total fixed income 19.3 — 19.3Common equities 2.4 2.1 .3
Total portfolio $ 21.7 $ 2.1 $ 19.6
2006Corporate securities $ .3 $ .3 $ —Asset-backed securities 1.5 — 1.5
Total fixed income 1.8 .3 1.5Common equities 2.4 2.0 .4
Total portfolio $ 4.2 $ 2.3 $ 1.9
App.-A-59

The following is a summary of the 2008 redeemable and nonredeemable preferred stock write-downs by sector:
(millions)
Sector
Amount ofWrite-down
in 2008
Remaining GrossUnrealized Loss atDecember 31, 2008
Financial ServicesLarge issuers (see Preferred Stocks – Redeemable and Nonredeemable above):
Bank of America (includes Merrill Lynch) $ 209.5 $ 5.3Wells Fargo (formerly Wachovia) 104.1 —J.P. Morgan (includes Washington Mutual – entire position sold) 71.1 .1U.S. Bancorp 67.4 1.3MetLife Inc. 65.0 —Morgan Stanley 58.0 —HSBC USA Inc. 56.4 1.9Goldman Sachs 51.4 —
Other financial 447.9 9.9
Total Financial Services 1,130.8 18.5
Agency (Fannie Mae—$1.0 fair value remaining; Freddie Mac—entire position sold) 382.6 —Industrial 115.6 5.9Utility 47.7 .9
Total preferred stocks $1,676.7 $25.3
The following is a summary of the 2008 common equity security write-downs by sector (both market-related and issuer specific):
($ in millions)
Sector
Amount ofWrite-down
in 2008
Equity PortfolioAllocation at
December 31, 2008
Russell 1000Allocation at
December 31, 2008
Russell 1000SectorReturnin 2008
Remaining GrossUnrealized Loss atDecember 31, 2008
Auto and Transportation $ 1.0 2.8% 2.5% (32.0)% $ .2Consumer Discretionary 2.8 12.2 12.8 (35.0) 4.8Consumer Staples — 9.0 8.8 (17.8) .4Financial Services 43.7 15.2 15.7 (51.1) 4.0Health Care 5.0 14.6 14.8 (22.5) 4.7Integrated Oil — 9.0 7.8 (21.7) —Materials and Processing .5 4.1 4.5 (47.2) 1.5Other Energy 1.3 3.8 4.2 (53.5) 1.5Producer Durables .6 5.5 4.9 (40.9) .6Technology 6.7 12.8 13.5 (42.3) 8.8Utilities — 7.8 7.5 (28.8) .7Other Equities 12.7 3.2 3.0 (51.3) 2.0
Total Common Stocks 74.3 100.0% 100.0% (37.6)% 29.2
Other Risk Assets — .1
Total Common Equities $74.3 $29.3
See Critical Accounting Policies, Other-Than-Temporary Impairment for further discussion.
C. Repurchase Transactions
During each of the last three years, we entered into repurchase commitment transactions, whereby we loaned U.S. Treasury orU.S. Government agency securities to accredited brokerage firms in exchange for cash equal to the fair value of the securities.These internally managed transactions were typically overnight arrangements. The cash proceeds were invested in Eurodollar,reverse repurchase transactions, and unsecured commercial paper obligations issued by large, high-quality institutions with yieldsthat exceeded our interest obligation on the borrowed cash. We were able to borrow the cash at low rates since the securitiesloaned are in either short supply or high demand. Our interest rate exposure does not increase or decrease since the borrowingand investing periods match. However, these transactions can carry the risk that the counterparty in the arrangement coulddefault, in which event we would be unable to recover our collateral in a timely manner. To help mitigate this risk, we hold ourcounterparty’s cash for the full value of the securities we lend and revalue the securities on a regular basis to ensure that we holdsufficient cash to cover the market value of the securities. Nevertheless, in the event of a counterparty default, we may be unableto obtain additional cash if our securities on loan appreciate in value prior to their return.
App.-A-60

During September 2008, we suspended our repurchase activity due to increased counterparty risk and high market volatility. Forthe period in 2008 during which we invested in the transactions, our largest single outstanding balance of repurchasecommitments was $1.1 billion, which was open for one day; the average daily balance of repurchase commitments was $.4billion. During 2007, our largest single outstanding balance of repurchase commitments was $2.4 billion, which was open for fourconsecutive days; the average daily balance of repurchase commitments was $.7 billion for 2007. We had no open repurchasecommitments at December 31, 2008 or 2007. We earned income of $1.7 million during 2008 and $3.7 million during both 2007and 2006 on repurchase commitments.
Additionally, beginning with the second quarter 2008, we entered into reverse repurchase commitment transactions, whereby weloaned cash to accredited brokerage firms and received U.S. Treasury Notes pledged as general collateral against the cashborrowed. Our exposure to credit risk was limited, as these internally managed transactions were overnight arrangements. Theincome generated on these transactions was calculated at the then applicable general collateral rates on the value of U.S.Treasury securities received.
For the period in 2008 during which we invested in the transactions, our largest single outstanding balance of reverse repurchasecommitments was $600.0 million, which was open for one day; the average daily balance of reverse repurchase commitmentswas $206.5 million. We had no open reverse repurchase commitments at December 31, 2008. We earned income of $1.6 millionon reverse repurchase agreements for the year ended December 31, 2008. No reverse repurchase transactions were enteredinto during 2007 or 2006.
V. CRITICAL ACCOUNTING POLICIES
Progressive is required to make certain estimates and assumptions when preparing its financial statements and accompanyingnotes in conformity with GAAP. Actual results could differ from those estimates in a variety of areas. The three areas that we viewas most critical with respect to the application of estimates and assumptions are the establishment of our loss reserves, themethod of determining impairments in our investment portfolio, and the valuation of our deferred tax assets.
A. Loss and LAE Reserves
Loss and loss adjustment expense (LAE) reserves represent our best estimate of our ultimate liability for losses and LAE relatingto events that occurred prior to the end of any given accounting period but have not yet been paid. At December 31, 2008, wehad $5.9 billion of net loss and LAE reserves, which included $4.6 billion of case reserves and $1.3 billion of incurred but notrecorded (IBNR) reserves.
Progressive’s actuarial staff reviews over 350 subsets of the business data, which are at a combined state, product, and linecoverage level (the “products”), to calculate the needed loss and LAE reserves. We begin our review of a set of data by producingmultiple estimates of needed reserves, using both paid and incurred data, to determine if a reserve change is required. In theevent of a wide variation among results generated by the different projections, our actuarial group will further analyze the datausing additional techniques. Each review develops a point estimate for a relatively small subset of the business, which allows usto establish meaningful reserve levels for that subset. In addition, the actuarial staff completes separate projections of neededcase and IBNR reserves.
We review a large majority of our reserves by product/state combination on a quarterly time frame, with the remaining reservesgenerally reviewed on a semiannual basis. A change in our scheduled reviews of a particular subset of the business depends onthe size of the subset or emerging issues relating to the product or state. By reviewing the reserves at such a detailed level, wehave the ability to identify and measure variances in the trends by state, product, and line coverage that otherwise would not beseen on a consolidated basis. Our intricate process of reviewing the aforementioned subsets makes compiling a companywideroll up to generate a range of needed loss reserves not meaningful. We do not review loss reserves on a macro level and,therefore, do not derive a companywide range of reserves to compare to a standard deviation.
In analyzing the ultimate accident year loss experience, our actuarial staff reviews in detail, at the subset level, frequency(number of losses per earned car year), severity (dollars of loss per each claim), and average premium (dollars of premium perearned car year). The loss ratio, a primary measure of loss experience, is equal to the product of frequency times severity dividedby the average premium. The average premium for personal and commercial auto businesses is known and, therefore, is notestimated. The projection of frequency for these lines of business is usually stable in the short term, because a large majority ofthe parties involved in an accident report their claims within a short time period after the occurrence. The actual frequencyexperienced will vary depending on the change in mix of class of drivers insured by Progressive, but the accuracy of the projectedlevel is considered to be reliable. The severity experienced by Progressive, which is much more difficult to estimate, especially forinjury claims, is affected by changes in underlying costs, such as medical costs, jury verdicts, and regulatory changes. In addition,severity will vary relative to the change in our mix of business by limit.
App.-A-61

Assumptions regarding needed reserve levels made by the actuarial staff take into consideration influences on available historicaldata that reduce the predictiveness of our projected future loss costs. Internal considerations that are process-related, whichgenerally result from changes in our claims organization’s activities, include claim closure rates, the number of claims that areclosed without payment, and the level of the claims representatives’ estimates of the needed case reserve for each claim. Westudy these changes and their effect on the historical data at the state level versus on a larger, less indicative, countrywide basis.
External items considered include the litigation atmosphere, state-by-state changes in medical costs, and the availability ofservices to resolve claims. These also are better understood at the state level versus at a more macro countrywide level.
The manner in which we consider and analyze the multitude of influences on the historical data, as well as how loss reservesaffect our financial results, is discussed in more detail in our Report on Loss Reserving Practices, which was filed on June 30,2008 via Form 8-K.
At December 31, 2008, Progressive’s carried net reserve balance of $5.9 billion implicitly assumes that the loss and LAE severitywill increase for accident year 2008 over accident year 2007 by 1.5% and 2.6% for personal auto liability and commercial autoliability, respectively. Personal auto liability and commercial auto liability reserves represent approximately 97% of our totalcarried reserves. As discussed above, the severity estimates are influenced by many variables that are difficult to quantify andwhich influence the final amount of claims settlement. That, coupled with changes in internal claims practices, the legalenvironment, and state regulatory requirements, requires significant judgment in the estimate of the needed reserves to becarried.
The following table highlights what the effect would be to our carried loss and LAE reserves, on a net basis, as of December 31,2008, if during 2009 we were to experience the indicated change in our estimate of severity for the 2008 accident year (i.e.,claims that occurred in 2008):
Estimated Changes in Severity for Accident Year 2008
(millions) -2% -1% As Reported +1% +2%
Personal Auto Liability $4,289.4 $4,341.4 $4,393.4 $4,445.4 $4,497.4Commercial Auto Liability 1,356.8 1,366.2 1,375.6 1,385.0 1,394.4Other1 163.9 163.9 163.9 163.9 163.9
Total $5,810.1 $5,871.5 $5,932.9 $5,994.3 $6,055.7
1Includes reserves for personal and commercial auto physical damage claims and our non-auto lines of business; no change in estimates is presenteddue to the immaterial level of these reserves.
Note: Every percentage point change in our estimate of severity for the 2008 accident year would affect our personal auto liability reserves by $52.0 millionand our commercial auto liability reserves by $9.4 million.
Our 2008 year-end loss and LAE reserve balance also includes claims from prior years. Claims that occurred in 2008, 2007, and2006, in the aggregate, accounted for approximately 91% of our reserve balance. If during 2009 we were to experience theindicated change in our estimate of severity for the total of the prior three accident years (i.e., 2008, 2007, and 2006), the effect toour year-end 2008 reserve balances would be as follows:
Estimated Changes in Severity for Accident Years 2008, 2007, and 2006
(millions) -2% -1% As Reported +1% +2%
Personal Auto Liability $4,082.4 $4,237.9 $4,393.4 $4,548.9 $4,704.4Commercial Auto Liability 1,320.6 1,348.1 1,375.6 1,403.1 1,430.6Other1 163.9 163.9 163.9 163.9 163.9
Total $5,566.9 $5,749.9 $5,932.9 $6,115.9 $6,298.9
1Includes reserves for personal and commercial auto physical damage claims and our non-auto lines of business; no change in estimates is presenteddue to the immaterial level of these reserves.
Note: Every percentage point change in our estimate of severity for the total of accident years 2008, 2007, and 2006 would affect our personal auto liabilityreserves by $155.5 million and our commercial auto liability reserves by $27.5 million.
Our best estimate of the appropriate amount for our reserves as of year-end 2008 is included in our financial statements for theyear. Our goal is to ensure that total reserves are adequate to cover all loss costs, while sustaining minimal variation from thetime reserves are initially established until losses are fully developed. At the point in time when reserves are set, we have no way
App.-A-62

of knowing whether our reserve estimates will prove to be high or low (and, thus, whether future reserve development will befavorable or unfavorable), or whether one of the alternative scenarios discussed above is “reasonably likely” to occur. During2008, our estimate of the needed reserves at the end of 2007 increased .6%. The following table shows how we have performedagainst this goal over the last ten years.
($ in millions)For the years endedDecember 31, 1998 1999 2000 2001 2002 2003 2004 2005 2006 2007 2008
Loss and LAE Reserves1 $1,945.8 $2,200.2 $2,785.3 $3,069.7 $3,632.1 $4,346.4 $4,948.5 $5,313.1 $5,363.6 $5,655.2 $5,932.9
Re-estimated reservesas of:
One year later 1,916.0 2,276.0 2,686.3 3,073.2 3,576.0 4,237.3 4,592.6 5,066.2 5,443.9 5,688.4Two years later 1,910.6 2,285.4 2,708.3 3,024.2 3,520.7 4,103.3 4,485.2 5,130.5 5,469.8 —Three years later 1,917.3 2,277.7 2,671.2 2,988.7 3,459.2 4,048.0 4,501.6 5,093.6 — —Four years later 1,908.2 2,272.3 2,666.9 2,982.7 3,457.8 4,070.0 4,471.0 — — —Five years later 1,919.0 2,277.5 2,678.5 2,993.7 3,475.4 4,073.7 — — — —Six years later 1,917.6 2,284.9 2,683.7 3,002.5 3,472.5 — — — — —Seven years later 1,921.9 2,287.4 2,688.4 3,000.6 — — — — — —Eight years later 1,923.4 2,291.9 2,688.6 — — — — — — —Nine years later 1,928.5 2,290.8 — — — — — — — —Ten years later 1,927.2 — — — — — — — — —
Cumulative Development:Favorable/(unfavorable) $ 18.6 $ (90.6)$ 96.7 $ 69.1 $ 159.6 $ 272.7 $ 477.5 $ 219.5 $ (106.2)$ (33.2)
Percentage2 1.0 (4.1) 3.5 2.3 4.4 6.3 9.6 4.1 (2.0) (.6)
1Represents loss and LAE reserves net of reinsurance recoverables on net unpaid losses at the balance sheet date.
2Cumulative development ÷ loss and LAE reserves.
Note: The chart above represents the development of the property-casualty loss and LAE reserves for 1998 through 2007. The last line in the triangle foreach year represents the following:
Re-estimated reserves = Total amount paid to-date + Total remaining case reserves on unsettled claims.
Changes in the estimated severity and the actual number of late reported claims are the cause of the change in our re-estimated reserves from year toyear. The cumulative development represents the aggregate change in our estimates over all years.
From 1998 through 2001, while we experienced an increase in bodily injury severity, our developed reserves were within $100million each year, or 4%, of our original estimates. The bodily injury severity change was much lower than we expected between2002 and 2005; thus, the reserve run-off for these years was very favorable following the end of each year, or about 4% to 10%of our original carried amounts. During 2007 and 2008, the 2006 and 2007 year-end reserves experienced unfavorabledevelopment as higher than anticipated severity estimates were realized. In 2008, the estimated severity for the two most recentprior accident years (2007 and 2006) both increased less than 1.0% for personal auto and increased 3.9% and 1.0%,respectively, for Commercial Auto. For older accident years, the changes in estimated severity were generally downward.
Because Progressive is primarily an insurer of motor vehicles, we have minimal exposure as an insurer of environmental,asbestos, and general liability claims.
B. Other-Than-Temporary Impairment
Companies are required to perform periodic reviews of individual securities in their investment portfolios to determine whether adecline in the value of a security is other-than-temporary. A review for other-than-temporary impairment (OTI) requires companiesto make certain judgments regarding the materiality of the decline; its effect on the financial statements; the probability, extent,and timing of a valuation recovery; and the company’s ability and intent to hold the security. The scope of this review is broad andrequires a forward-looking assessment of the fundamental characteristics of a security, as well as market-related prospects of theissuer and its industry.
Realized losses may include write-downs of securities determined to have had an other-than-temporary decline in fair value. Weroutinely monitor our portfolio for pricing changes that might indicate potential impairments, and perform detailed reviews ofsecurities with unrealized losses based on predetermined guidelines. In such cases, changes in fair value are evaluated todetermine the extent to which such changes are attributable to (i) fundamental factors specific to the issuer, such as financialconditions, business prospects, or other factors, or (ii) market-related factors, such as interest rates or equity market declines(e.g., negative return at either a sector index level or at the broader market level).
App.-A-63
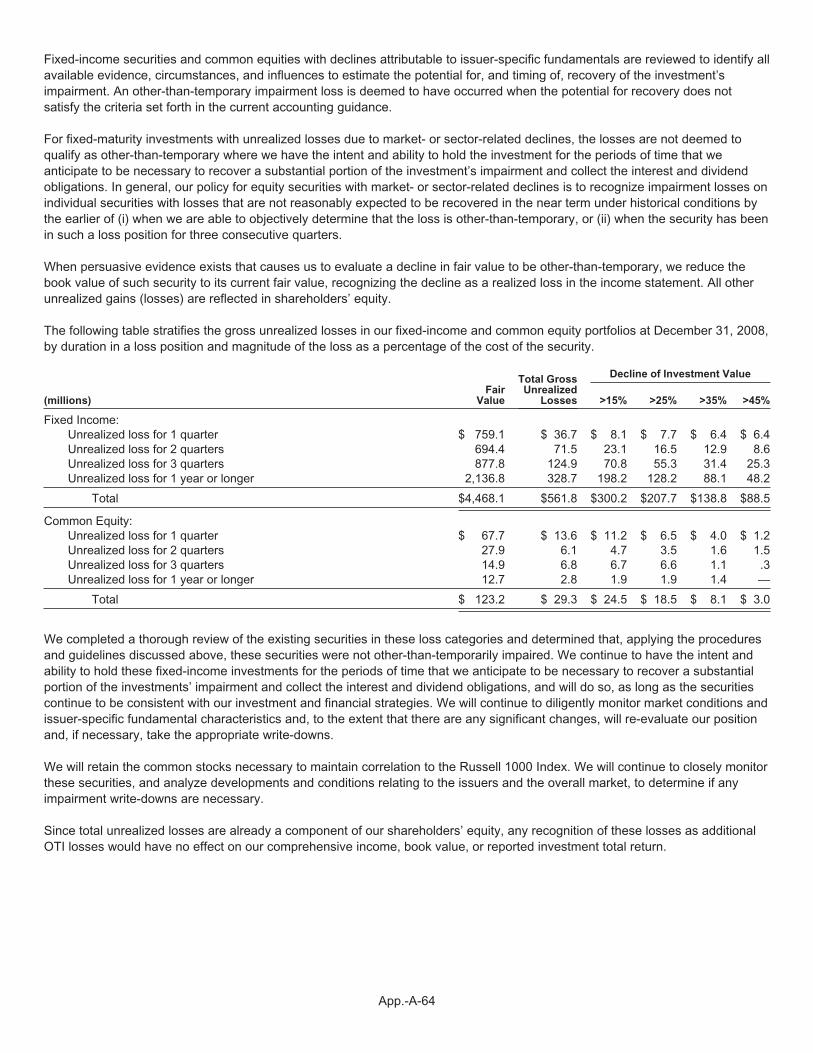
Fixed-income securities and common equities with declines attributable to issuer-specific fundamentals are reviewed to identify allavailable evidence, circumstances, and influences to estimate the potential for, and timing of, recovery of the investment’simpairment. An other-than-temporary impairment loss is deemed to have occurred when the potential for recovery does notsatisfy the criteria set forth in the current accounting guidance.
For fixed-maturity investments with unrealized losses due to market- or sector-related declines, the losses are not deemed toqualify as other-than-temporary where we have the intent and ability to hold the investment for the periods of time that weanticipate to be necessary to recover a substantial portion of the investment’s impairment and collect the interest and dividendobligations. In general, our policy for equity securities with market- or sector-related declines is to recognize impairment losses onindividual securities with losses that are not reasonably expected to be recovered in the near term under historical conditions bythe earlier of (i) when we are able to objectively determine that the loss is other-than-temporary, or (ii) when the security has beenin such a loss position for three consecutive quarters.
When persuasive evidence exists that causes us to evaluate a decline in fair value to be other-than-temporary, we reduce thebook value of such security to its current fair value, recognizing the decline as a realized loss in the income statement. All otherunrealized gains (losses) are reflected in shareholders’ equity.
The following table stratifies the gross unrealized losses in our fixed-income and common equity portfolios at December 31, 2008,by duration in a loss position and magnitude of the loss as a percentage of the cost of the security.
Total GrossUnrealized
Losses
Decline of Investment Value
(millions)Fair
Value >15% >25% >35% >45%
Fixed Income:Unrealized loss for 1 quarter $ 759.1 $ 36.7 $ 8.1 $ 7.7 $ 6.4 $ 6.4Unrealized loss for 2 quarters 694.4 71.5 23.1 16.5 12.9 8.6Unrealized loss for 3 quarters 877.8 124.9 70.8 55.3 31.4 25.3Unrealized loss for 1 year or longer 2,136.8 328.7 198.2 128.2 88.1 48.2
Total $4,468.1 $561.8 $300.2 $207.7 $138.8 $88.5
Common Equity:Unrealized loss for 1 quarter $ 67.7 $ 13.6 $ 11.2 $ 6.5 $ 4.0 $ 1.2Unrealized loss for 2 quarters 27.9 6.1 4.7 3.5 1.6 1.5Unrealized loss for 3 quarters 14.9 6.8 6.7 6.6 1.1 .3Unrealized loss for 1 year or longer 12.7 2.8 1.9 1.9 1.4 —
Total $ 123.2 $ 29.3 $ 24.5 $ 18.5 $ 8.1 $ 3.0
We completed a thorough review of the existing securities in these loss categories and determined that, applying the proceduresand guidelines discussed above, these securities were not other-than-temporarily impaired. We continue to have the intent andability to hold these fixed-income investments for the periods of time that we anticipate to be necessary to recover a substantialportion of the investments’ impairment and collect the interest and dividend obligations, and will do so, as long as the securitiescontinue to be consistent with our investment and financial strategies. We will continue to diligently monitor market conditions andissuer-specific fundamental characteristics and, to the extent that there are any significant changes, will re-evaluate our positionand, if necessary, take the appropriate write-downs.
We will retain the common stocks necessary to maintain correlation to the Russell 1000 Index. We will continue to closely monitorthese securities, and analyze developments and conditions relating to the issuers and the overall market, to determine if anyimpairment write-downs are necessary.
Since total unrealized losses are already a component of our shareholders’ equity, any recognition of these losses as additionalOTI losses would have no effect on our comprehensive income, book value, or reported investment total return.
App.-A-64

C. Deferred Tax Assets
The income tax provision is calculated under the balance sheet approach. Deferred tax assets and liabilities are recorded basedon the difference between the financial statement and tax bases of assets and liabilities at the enacted tax rates. We regularlyreview our deferred tax assets for recoverability. As of December 31, 2008, we did not record a valuation allowance against thegross deferred tax asset.
Our net deferred tax asset was $793.3 million at December 31, 2008. This amount includes $478.4 million of temporarydifferences related to other-than-temporary impairment write-downs and $41.4 million associated with net unrealized losses onsecurities in our portfolio. Due to the nature of these items, they have not yet been recognized for tax purposes. To the extentthese OTI losses or net unrealized losses are ultimately recognized, they would generate net capital losses for tax purposes.
Realization of the deferred tax asset ultimately depends on the existence of sufficient taxable income available of the samecharacter, which may include future reversals of existing temporary differences, future taxable income exclusive of reversingdifferences, taxable income in prior carryback years, and tax planning strategies.
The losses creating the deferred tax assets have resulted primarily from widening credit spreads on our fixed-income securities,with the majority in our preferred stock portfolio. As discussed in Note 2 – Investments, we elected to use an equity model forassessing OTI related to our preferred stocks and, upon determining that they were unlikely to substantially recover in value in thenear term, they were written down. From a tax planning standpoint, we classified these securities into two groups. The first groupconsists of preferred stocks that we believe are fundamentally impaired or that we are likely to sell in the near future (e.g., FannieMae). At December 31, 2008, we had sufficient unrealized gains in our portfolio to offset the unrealized tax losses on thesesecurities. The second group is preferred securities that we have the intent and ability to hold until substantial recovery,understanding that this may be a longer term proposition, yet still within an acceptable realized period under SFAS 109,“Accounting for Income Taxes.” We believe that the issuers of this second group of securities are financially sound companieswith adequate capital. Moreover, we have received payment of interest and dividends on these securities on a current basis. Inaddition, our strong positive cash flow from underwriting operations, as evidenced by 100 consecutive quarters of positiveoperating cash flows, limits our need to liquidate securities with large unrealized tax losses to generate cash. Although realizationof the deferred tax asset is not assured, management believes it is more likely than not that the deferred tax asset will be realizedbased on our expectation that we will be able to fully utilize the deductions that are ultimately recognized for tax purposes.
Our ability to recognize these deferred tax assets could be affected by further market value declines as well as if our expectationschange about either the ability of the securities to recover in value or our intent or ability to hold the securities until recovery. Suchchanges may require us to establish a valuation allowance against the deferred tax asset, which could have a material effect onour financial condition and results of operations.
Safe Harbor Statement Under the Private Securities Litigation Reform Act of 1995: Statements in this report that are nothistorical fact are forward-looking statements that are subject to certain risks and uncertainties that could cause actual events andresults to differ materially from those discussed herein. These risks and uncertainties include, without limitation, uncertaintiesrelated to estimates, assumptions, and projections generally; inflation and changes in economic conditions (including changes ininterest rates and financial markets); the financial condition of, and other issues relating to the strength of and liquidity availableto, issuers of securities held in our investment portfolios and other companies with which we have ongoing business relationships,including counterparties to certain financial transactions; the accuracy and adequacy of our pricing and loss reservingmethodologies; the competitiveness of our pricing and the effectiveness of our initiatives to retain more customers; initiatives bycompetitors and the effectiveness of our response; our ability to obtain regulatory approval for requested rate changes and thetiming thereof; the effectiveness of our brand strategy and advertising campaigns relative to those of competitors; legislative andregulatory developments; disputes relating to intellectual property rights; the outcome of litigation pending or that may be filedagainst us; weather conditions (including the severity and frequency of storms, hurricanes, snowfalls, hail, and winter conditions);changes in driving patterns and loss trends; acts of war and terrorist activities; our ability to maintain the uninterrupted operationof our facilities, systems (including information technology systems), and business functions; court decisions and trends inlitigation and health care and auto repair costs; and other matters described from time to time in our releases and publications,and in our periodic reports and other documents filed with the United States Securities and Exchange Commission. In addition,investors should be aware that generally accepted accounting principles prescribe when a company may reserve for particularrisks, including litigation exposures. Accordingly, results for a given reporting period could be significantly affected if and when areserve is established for one or more contingencies. Also, our regular reserve reviews may result in adjustments of varyingmagnitude as additional information regarding pending loss and loss adjustment expense reserves becomes known. Reportedresults, therefore, may be volatile in certain accounting periods.
App.-A-65
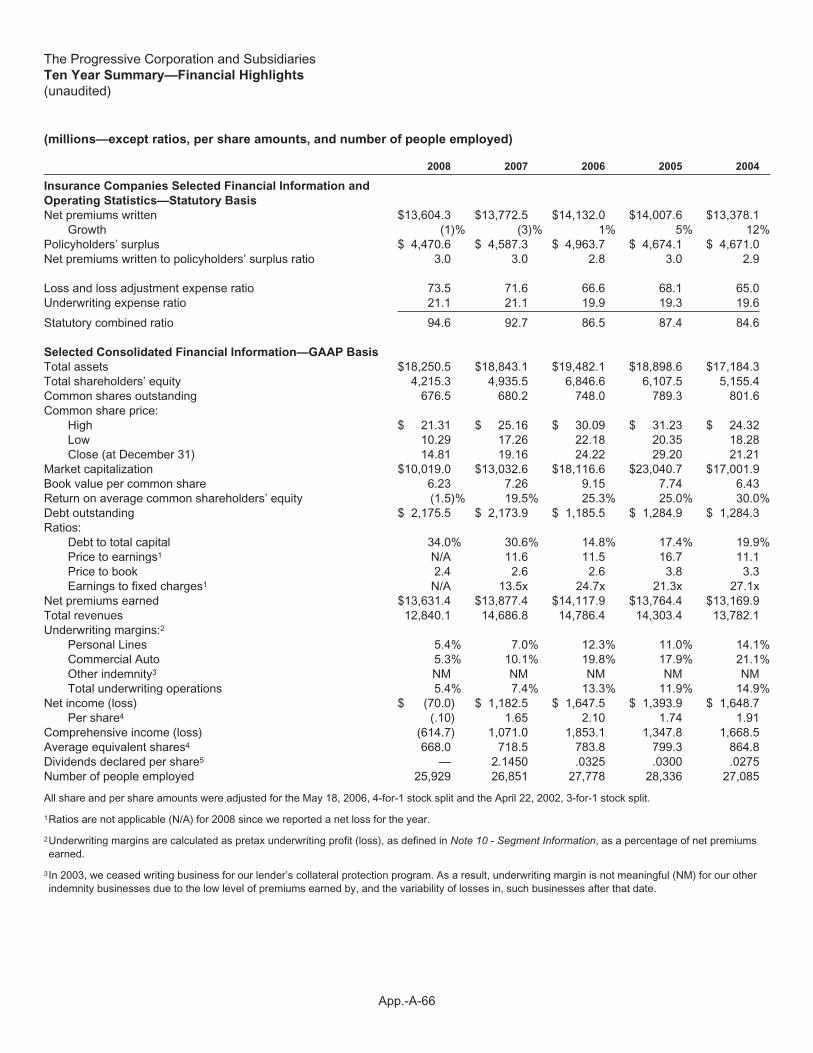
The Progressive Corporation and SubsidiariesTen Year Summary—Financial Highlights
(unaudited)
(millions—except ratios, per share amounts, and number of people employed)
2008 2007 2006 2005 2004
Insurance Companies Selected Financial Information and
Operating Statistics—Statutory Basis
Net premiums written $13,604.3 $13,772.5 $14,132.0 $14,007.6 $13,378.1Growth (1)% (3)% 1% 5% 12%
Policyholders’ surplus $ 4,470.6 $ 4,587.3 $ 4,963.7 $ 4,674.1 $ 4,671.0Net premiums written to policyholders’ surplus ratio 3.0 3.0 2.8 3.0 2.9
Loss and loss adjustment expense ratio 73.5 71.6 66.6 68.1 65.0Underwriting expense ratio 21.1 21.1 19.9 19.3 19.6
Statutory combined ratio 94.6 92.7 86.5 87.4 84.6
Selected Consolidated Financial Information—GAAP Basis
Total assets $18,250.5 $18,843.1 $19,482.1 $18,898.6 $17,184.3Total shareholders’ equity 4,215.3 4,935.5 6,846.6 6,107.5 5,155.4Common shares outstanding 676.5 680.2 748.0 789.3 801.6Common share price:
High $ 21.31 $ 25.16 $ 30.09 $ 31.23 $ 24.32Low 10.29 17.26 22.18 20.35 18.28Close (at December 31) 14.81 19.16 24.22 29.20 21.21
Market capitalization $10,019.0 $13,032.6 $18,116.6 $23,040.7 $17,001.9Book value per common share 6.23 7.26 9.15 7.74 6.43Return on average common shareholders’ equity (1.5)% 19.5% 25.3% 25.0% 30.0%Debt outstanding $ 2,175.5 $ 2,173.9 $ 1,185.5 $ 1,284.9 $ 1,284.3Ratios:
Debt to total capital 34.0% 30.6% 14.8% 17.4% 19.9%Price to earnings1 N/A 11.6 11.5 16.7 11.1Price to book 2.4 2.6 2.6 3.8 3.3Earnings to fixed charges1 N/A 13.5x 24.7x 21.3x 27.1x
Net premiums earned $13,631.4 $13,877.4 $14,117.9 $13,764.4 $13,169.9Total revenues 12,840.1 14,686.8 14,786.4 14,303.4 13,782.1Underwriting margins:2
Personal Lines 5.4% 7.0% 12.3% 11.0% 14.1%Commercial Auto 5.3% 10.1% 19.8% 17.9% 21.1%Other indemnity3 NM NM NM NM NMTotal underwriting operations 5.4% 7.4% 13.3% 11.9% 14.9%
Net income (loss) $ (70.0) $ 1,182.5 $ 1,647.5 $ 1,393.9 $ 1,648.7Per share4 (.10) 1.65 2.10 1.74 1.91
Comprehensive income (loss) (614.7) 1,071.0 1,853.1 1,347.8 1,668.5Average equivalent shares4 668.0 718.5 783.8 799.3 864.8Dividends declared per share5 — 2.1450 .0325 .0300 .0275Number of people employed 25,929 26,851 27,778 28,336 27,085
All share and per share amounts were adjusted for the May 18, 2006, 4-for-1 stock split and the April 22, 2002, 3-for-1 stock split.
1Ratios are not applicable (N/A) for 2008 since we reported a net loss for the year.
2Underwriting margins are calculated as pretax underwriting profit (loss), as defined in Note 10 - Segment Information, as a percentage of net premiumsearned.
3In 2003, we ceased writing business for our lender’s collateral protection program. As a result, underwriting margin is not meaningful (NM) for our otherindemnity businesses due to the low level of premiums earned by, and the variability of losses in, such businesses after that date.
App.-A-66

The Progressive Corporation and SubsidiariesTen Year Summary—Financial Highlights (cont’d)
(unaudited)
(millions—except ratios, per share amounts, and number of people employed)
2003 2002 2001 2000 1999
Insurance Companies Selected Financial Information and
Operating Statistics—Statutory Basis
Net premiums written $11,913.4 $ 9,452.0 $ 7,260.1 $ 6,196.1 $6,124.7Growth 26% 30% 17% 1% 16%
Policyholders’ surplus $ 4,538.3 $ 3,370.2 $ 2,647.7 $ 2,177.0 $2,258.9Net premiums written to policyholders’ surplus ratio 2.6 2.8 2.7 2.8 2.7
Loss and loss adjustment expense ratio 67.4 70.9 73.6 83.2 75.0Underwriting expense ratio 18.8 20.4 21.1 21.0 22.1
Statutory combined ratio 86.2 91.3 94.7 104.2 97.1
Selected Consolidated Financial Information—GAAP Basis
Total assets $16,281.5 $13,564.4 $11,122.4 $10,051.6 $9,704.7Total shareholders’ equity 5,030.6 3,768.0 3,250.7 2,869.8 2,752.8Common shares outstanding 865.8 871.8 881.2 882.2 877.1Common share price:
High $ 21.17 $ 15.12 $ 12.65 $ 9.25 $ 14.52Low 11.56 11.19 6.84 3.75 5.71Close (at December 31) 20.90 12.41 12.44 8.64 6.09
Market capitalization $18,088.9 $10,819.3 $10,958.6 $ 7,616.8 $5,345.4Book value per common share 5.81 4.32 3.69 3.25 3.14Return on average common shareholders’ equity 29.1% 19.3% 13.5% 1.7% 10.9%Debt outstanding $ 1,489.8 $ 1,489.0 $ 1,095.7 $ 748.8 $1,048.6Ratios:
Debt to total capital 22.8% 28.3% 25.2% 20.7% 27.6%Price to earnings1 14.7 16.6 27.2 164.5 18.5Price to book 3.6 2.9 3.4 2.7 1.9Earnings to fixed charges1 18.8x 13.2x 10.7x 1.3x 5.7x
Net premiums earned $11,341.0 $ 8,883.5 $ 7,161.8 $ 6,348.4 $5,683.6Total revenues 11,892.0 9,294.4 7,488.2 6,771.0 6,124.2Underwriting margins:2
Personal Lines 12.1% 7.5% 4.5% (5.2)% 1.2%Commercial Auto 17.5% 9.1% 8.3% 3.3% 8.4%Other indemnity3 NM 7.2% 7.0% 13.6% 10.8%Total underwriting operations 12.7% 7.6% 4.8% (4.4)% 1.7%
Net income (loss) $ 1,255.4 $ 667.3 $ 411.4 $ 46.1 $ 295.2Per share4 1.42 .75 .46 .05 .33
Comprehensive income (loss) 1,511.1 710.7 472.6 123.2 179.1Average equivalent shares4 882.1 892.8 900.7 891.8 895.6Dividends declared per share5 .0250 .0240 .0233 .0225 .0218Number of people employed 25,834 22,974 20,442 19,490 18,753
4Amounts reflect basic earnings per share for 2008 since we reported a net loss; all other periods are presented on a diluted basis.
5Progressive transitioned to an annual variable dividend policy beginning in 2007. In accordance with this policy, no dividend was declared in 2008 sinceour comprehensive income was less than after-tax underwriting income. In addition, in June 2007, Progressive’s Board declared an extraordinary cashdividend of $2.00 per common share that was paid September 14, 2007 to shareholders of record at the close of business on August 31, 2007.Progressive paid quarterly dividends prior to 2007.
App.-A-67
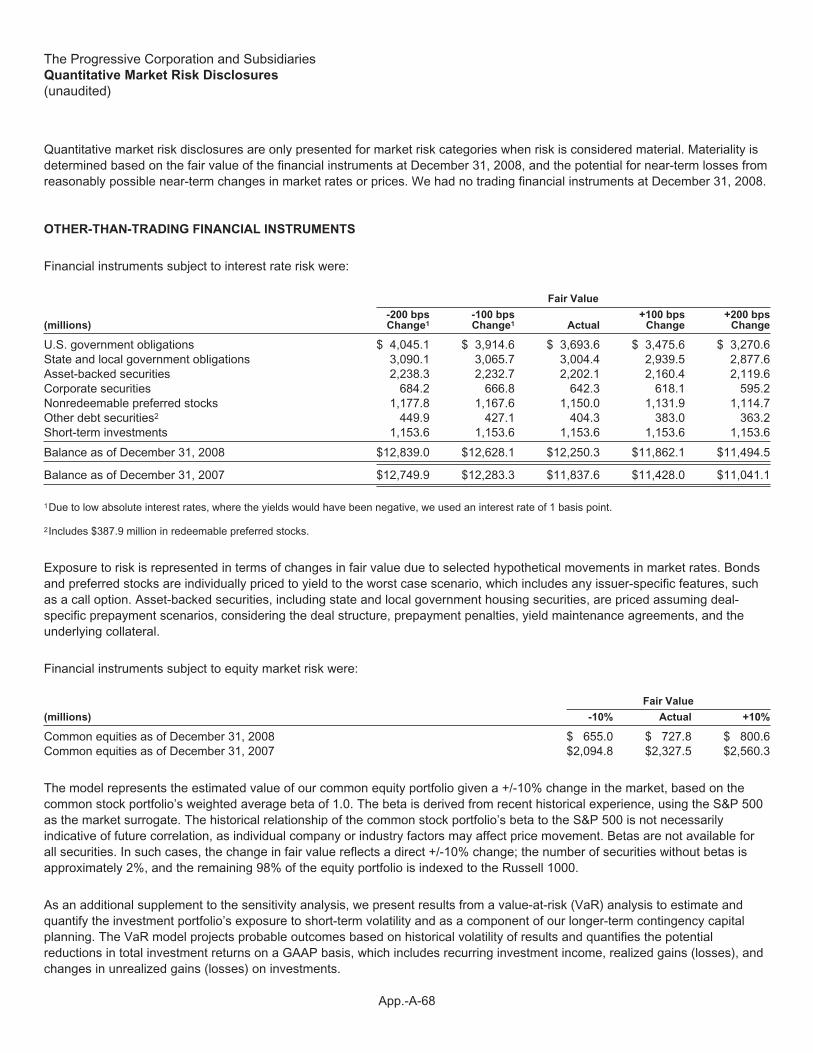
The Progressive Corporation and SubsidiariesQuantitative Market Risk Disclosures
(unaudited)
Quantitative market risk disclosures are only presented for market risk categories when risk is considered material. Materiality isdetermined based on the fair value of the financial instruments at December 31, 2008, and the potential for near-term losses fromreasonably possible near-term changes in market rates or prices. We had no trading financial instruments at December 31, 2008.
OTHER-THAN-TRADING FINANCIAL INSTRUMENTS
Financial instruments subject to interest rate risk were:
Fair Value
(millions)-200 bpsChange1
-100 bpsChange1 Actual
+100 bpsChange
+200 bpsChange
U.S. government obligations $ 4,045.1 $ 3,914.6 $ 3,693.6 $ 3,475.6 $ 3,270.6State and local government obligations 3,090.1 3,065.7 3,004.4 2,939.5 2,877.6Asset-backed securities 2,238.3 2,232.7 2,202.1 2,160.4 2,119.6Corporate securities 684.2 666.8 642.3 618.1 595.2Nonredeemable preferred stocks 1,177.8 1,167.6 1,150.0 1,131.9 1,114.7Other debt securities2 449.9 427.1 404.3 383.0 363.2Short-term investments 1,153.6 1,153.6 1,153.6 1,153.6 1,153.6
Balance as of December 31, 2008 $12,839.0 $12,628.1 $12,250.3 $11,862.1 $11,494.5
Balance as of December 31, 2007 $12,749.9 $12,283.3 $11,837.6 $11,428.0 $11,041.1
1Due to low absolute interest rates, where the yields would have been negative, we used an interest rate of 1 basis point.
2Includes $387.9 million in redeemable preferred stocks.
Exposure to risk is represented in terms of changes in fair value due to selected hypothetical movements in market rates. Bondsand preferred stocks are individually priced to yield to the worst case scenario, which includes any issuer-specific features, suchas a call option. Asset-backed securities, including state and local government housing securities, are priced assuming deal-specific prepayment scenarios, considering the deal structure, prepayment penalties, yield maintenance agreements, and theunderlying collateral.
Financial instruments subject to equity market risk were:
Fair Value
(millions) -10% Actual +10%
Common equities as of December 31, 2008 $ 655.0 $ 727.8 $ 800.6Common equities as of December 31, 2007 $2,094.8 $2,327.5 $2,560.3
The model represents the estimated value of our common equity portfolio given a +/-10% change in the market, based on thecommon stock portfolio’s weighted average beta of 1.0. The beta is derived from recent historical experience, using the S&P 500as the market surrogate. The historical relationship of the common stock portfolio’s beta to the S&P 500 is not necessarilyindicative of future correlation, as individual company or industry factors may affect price movement. Betas are not available forall securities. In such cases, the change in fair value reflects a direct +/-10% change; the number of securities without betas isapproximately 2%, and the remaining 98% of the equity portfolio is indexed to the Russell 1000.
As an additional supplement to the sensitivity analysis, we present results from a value-at-risk (VaR) analysis to estimate andquantify the investment portfolio’s exposure to short-term volatility and as a component of our longer-term contingency capitalplanning. The VaR model projects probable outcomes based on historical volatility of results and quantifies the potentialreductions in total investment returns on a GAAP basis, which includes recurring investment income, realized gains (losses), andchanges in unrealized gains (losses) on investments.
App.-A-68
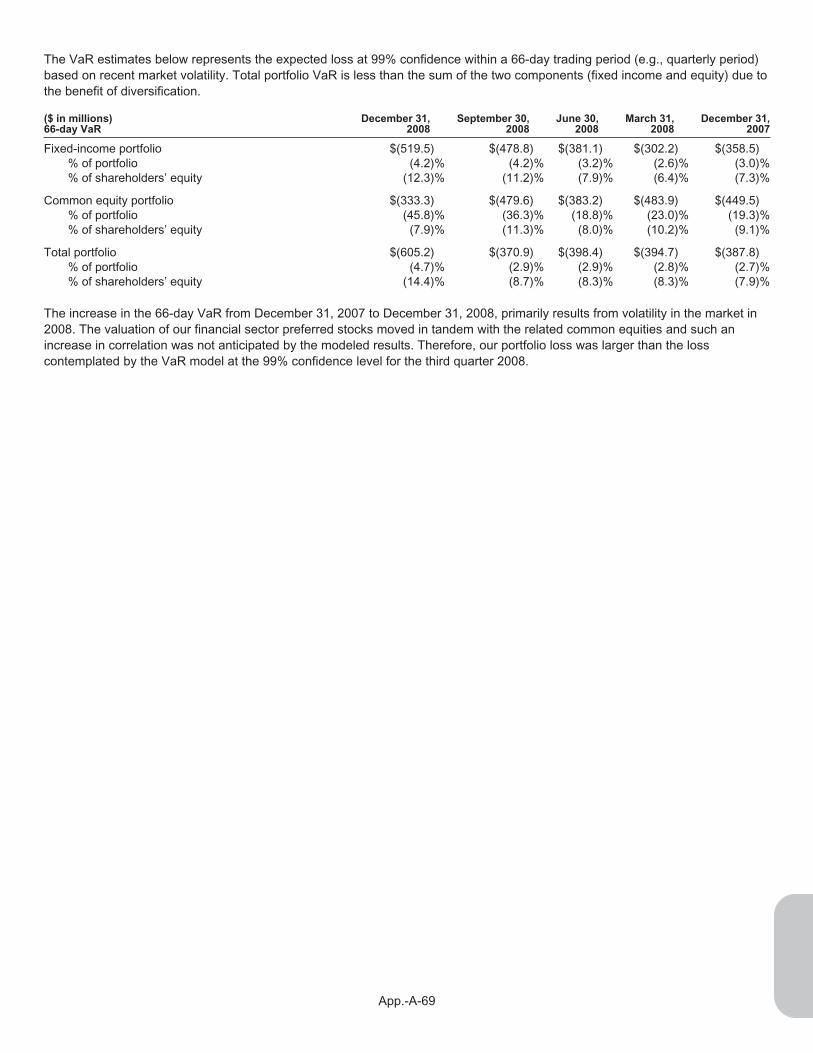
The VaR estimates below represents the expected loss at 99% confidence within a 66-day trading period (e.g., quarterly period)based on recent market volatility. Total portfolio VaR is less than the sum of the two components (fixed income and equity) due tothe benefit of diversification.
($ in millions)66-day VaR
December 31,2008
September 30,2008
June 30,2008
March 31,2008
December 31,2007
Fixed-income portfolio $(519.5) $(478.8) $(381.1) $(302.2) $(358.5)% of portfolio (4.2)% (4.2)% (3.2)% (2.6)% (3.0)%% of shareholders’ equity (12.3)% (11.2)% (7.9)% (6.4)% (7.3)%
Common equity portfolio $(333.3) $(479.6) $(383.2) $(483.9) $(449.5)% of portfolio (45.8)% (36.3)% (18.8)% (23.0)% (19.3)%% of shareholders’ equity (7.9)% (11.3)% (8.0)% (10.2)% (9.1)%
Total portfolio $(605.2) $(370.9) $(398.4) $(394.7) $(387.8)% of portfolio (4.7)% (2.9)% (2.9)% (2.8)% (2.7)%% of shareholders’ equity (14.4)% (8.7)% (8.3)% (8.3)% (7.9)%
The increase in the 66-day VaR from December 31, 2007 to December 31, 2008, primarily results from volatility in the market in2008. The valuation of our financial sector preferred stocks moved in tandem with the related common equities and such anincrease in correlation was not anticipated by the modeled results. Therefore, our portfolio loss was larger than the losscontemplated by the VaR model at the 99% confidence level for the third quarter 2008.
App.-A-69
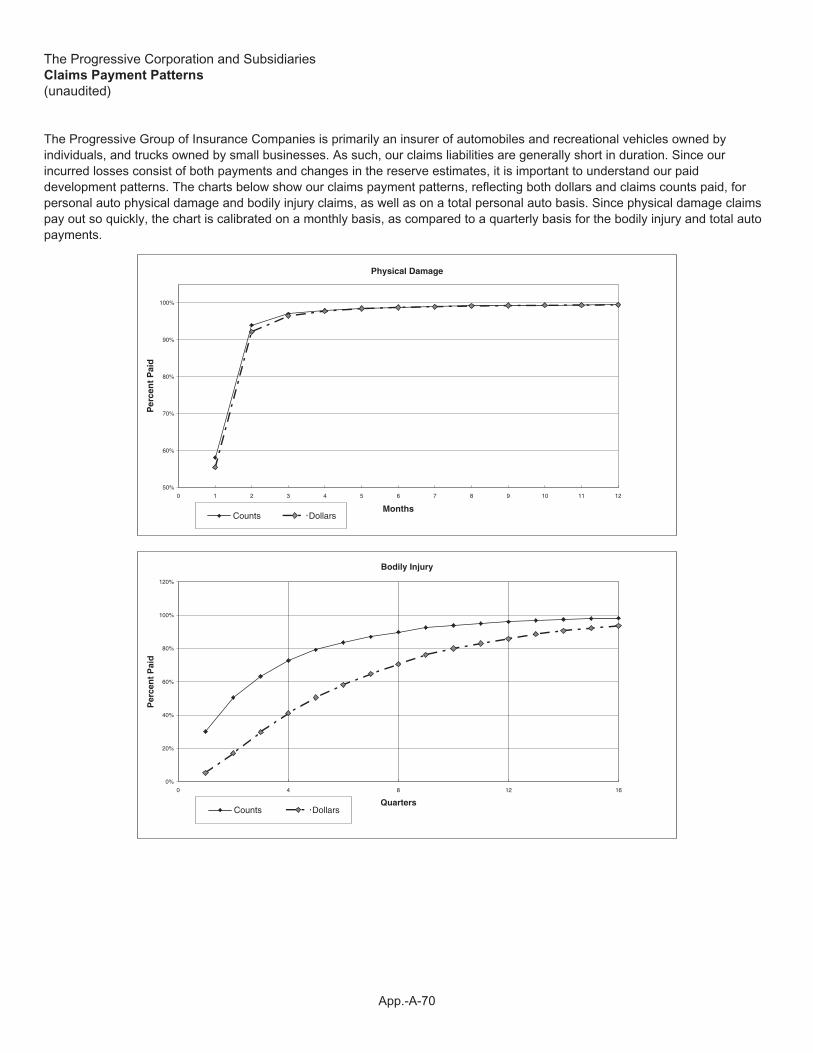
The Progressive Corporation and SubsidiariesClaims Payment Patterns
(unaudited)
The Progressive Group of Insurance Companies is primarily an insurer of automobiles and recreational vehicles owned byindividuals, and trucks owned by small businesses. As such, our claims liabilities are generally short in duration. Since ourincurred losses consist of both payments and changes in the reserve estimates, it is important to understand our paiddevelopment patterns. The charts below show our claims payment patterns, reflecting both dollars and claims counts paid, forpersonal auto physical damage and bodily injury claims, as well as on a total personal auto basis. Since physical damage claimspay out so quickly, the chart is calibrated on a monthly basis, as compared to a quarterly basis for the bodily injury and total autopayments.
Physical Damage
50%
60%
70%
80%
90%
100%
0 1 2 3 4 5 6 7 8 9 10 11 12
Months
Per
cen
t P
aid
Counts Dollars
Bodily Injury
0%
20%
40%
60%
80%
100%
120%
6121840
Quarters
Per
cen
t P
aid
Counts Dollars
App.-A-70

Total Personal Auto
50%
60%
70%
80%
90%
100%
110%
6121840
Quarters
Per
cen
t P
aid
Counts Dollars
Note: The above graphs are presented for our personal auto products on an accident period basis and are based on three yearsof actual experience for physical damage and nine years for bodily injury and total auto.
App.-A-71

The Progressive Corporation and SubsidiariesQuarterly Financial and Common Share Data
(unaudited)
(millions – except per share amounts)
Net Income (Loss) Stock Price1
DividendsDeclared
Per Share4QuarterTotal
Revenues TotalPer
Share2 High Low CloseRate ofReturn3
20081 $ 3,585.9 $ 239.4 $ .35 $19.84 $15.00 $16.07 $ —2 3,536.6 215.5 .32 21.31 16.11 18.72 —3 2,210.1 (684.2) (1.03) 20.71 15.70 17.40 —4 3,507.5 159.3 .24 17.59 10.29 14.81 —
$12,840.1 $ (70.0) $ (.10) $21.31 $10.29 $14.81 (21.9)% $ —
20071 $ 3,686.8 $ 363.5 $ .49 $24.75 $20.91 $21.82 $ —2 3,675.9 283.7 .39 25.16 21.55 23.93 2.00003 3,709.6 299.2 .42 24.10 18.88 19.41 —4 3,614.5 236.1 .34 20.50 17.26 19.16 .1450
$14,686.8 $1,182.5 $ 1.65 $25.16 $17.26 $19.16 (12.6)% $2.1450
20061 $ 3,660.9 $ 436.6 $ .55 $30.09 $25.25 $26.07 $.007502 3,707.9 400.4 .51 27.86 25.25 25.71 .007503 3,723.8 409.6 .53 25.84 22.18 24.54 .008754 3,693.8 400.9 .53 25.54 22.19 24.22 .00875
$14,786.4 $1,647.5 $ 2.10 $30.09 $22.18 $24.22 (17.0)% $.03250
All per share amounts and stock prices were adjusted for the May 18, 2006, 4-for-1 stock split.
1Prices as reported on the consolidated transaction reporting system. Progressive’s common shares are listed on the New York Stock Exchange under thesymbol PGR.
2Since we reported a net loss for both the third quarter and full year 2008, the calculated diluted earnings per share was antidilutive; therefore, basicearnings per share is disclosed. For all other periods, diluted earnings per share is disclosed. The sum may not equal the total because the averageequivalent shares differ in the quarterly and annual periods, and because of the net loss in 2008.
3Represents annual rate of return, assuming dividend reinvestment, including the $2.00 per share extraordinary cash dividend paid in September 2007.
4Progressive transitioned to an annual variable dividend policy beginning in 2007. In accordance with this policy, no dividend was declared in 2008 sinceour comprehensive income was less than after-tax underwriting income. The 2007 annual dividend was declared by the Board of Directors in December2007 and paid early in 2008. In addition, in June 2007, Progressive’s Board declared an extraordinary cash dividend of $2.00 per common share that waspaid September 14, 2007 to shareholders of record at the close of business on August 31, 2007. Progressive paid quarterly dividends prior to 2007.
App.-A-72
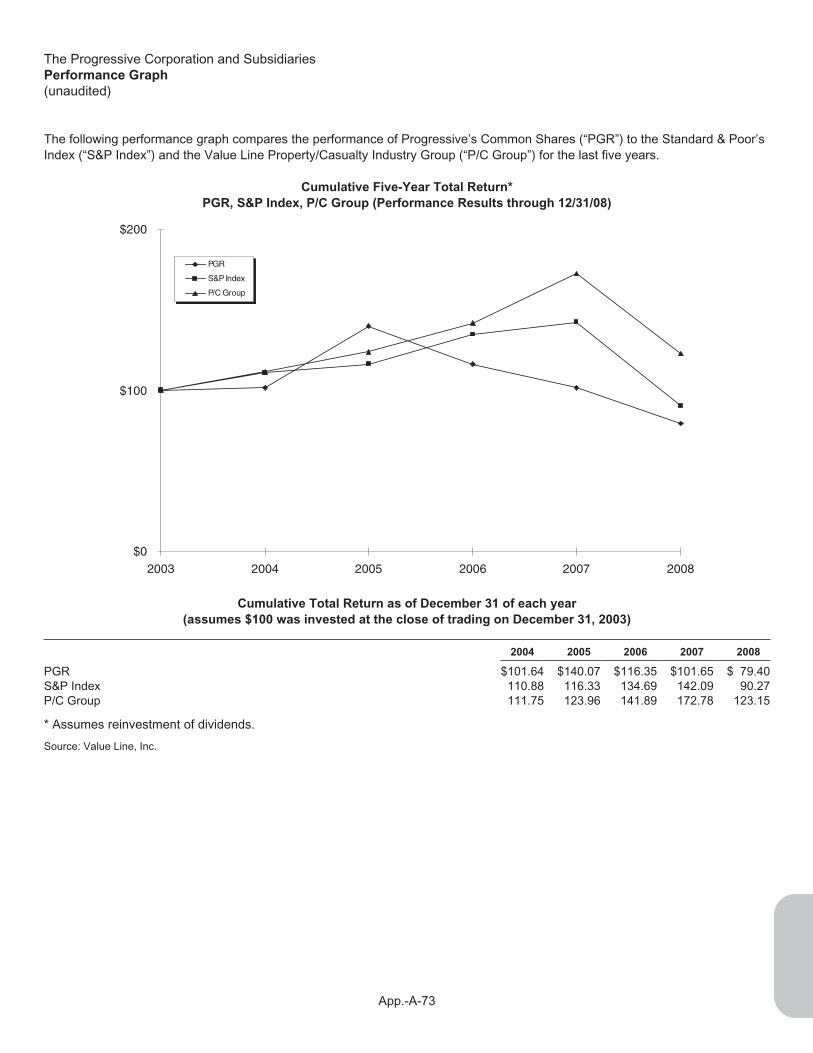
The Progressive Corporation and SubsidiariesPerformance Graph
(unaudited)
The following performance graph compares the performance of Progressive’s Common Shares (“PGR”) to the Standard & Poor’sIndex (“S&P Index”) and the Value Line Property/Casualty Industry Group (“P/C Group”) for the last five years.
Cumulative Five-Year Total Return*
PGR, S&P Index, P/C Group (Performance Results through 12/31/08)
$0
$100
$200
2003 2004 2005 2006 2007 2008
PGR
S&P Index
P/C Group
Cumulative Total Return as of December 31 of each year
(assumes $100 was invested at the close of trading on December 31, 2003)
2004 2005 2006 2007 2008
PGR $101.64 $140.07 $116.35 $101.65 $ 79.40S&P Index 110.88 116.33 134.69 142.09 90.27P/C Group 111.75 123.96 141.89 172.78 123.15
* Assumes reinvestment of dividends.
Source: Value Line, Inc.
App.-A-73

The Progressive Corporation and SubsidiariesNet Premiums Written by State
(unaudited)
($ in millions) 2008 2007 2006 2005 2004
Florida $ 1,631.0 12.0% $ 1,656.9 12.0% $ 1,811.5 12.8% $ 1,774.2 12.7% $ 1,522.6 11.4%Texas 1,151.3 8.5 1,072.0 7.8 1,096.0 7.8 1,126.8 8.0 1,181.1 8.8California 1,016.3 7.5 1,106.4 8.0 1,085.1 7.7 982.8 7.0 892.7 6.7New York 738.8 5.4 847.9 6.2 930.6 6.6 968.8 6.9 935.7 7.0Georgia 699.7 5.1 748.9 5.4 751.0 5.3 749.5 5.4 733.2 5.5Ohio 632.4 4.7 655.9 4.8 693.7 4.9 736.0 5.3 754.2 5.6Pennsylvania 563.7 4.1 610.5 4.4 642.1 4.5 659.1 4.7 634.4 4.7Michigan 461.8 3.4 443.5 3.2 432.2 3.1 438.8 3.1 413.3 3.1All other 6,709.3 49.3 6,630.5 48.2 6,689.8 47.3 6,571.6 46.9 6,310.9 47.2
Total $13,604.3 100.0% $13,772.5 100.0% $14,132.0 100.0% $14,007.6 100.0% $13,378.1 100.0%
App.-A-74

Directors
Charles A. Davis4,5,6 Peter B. Lewis2,4,6,7 1Audit Committee memberChief Executive Officer, Chairman of the Board 2Executive Committee memberStone Point Capital LLC 3Compensation Committee member(private equity investing) Norman S. Matthews3,5,6
Consultant,
4Investment and Capital Committee member5Nominating and Governance CommitteememberRoger N. Farah3,6 former President,
President and Chief Operating Officer, Federated Department Stores, Inc. 6Independent directorPolo Ralph Lauren Corporation (retailing) 7Non-executive chairman(lifestyle products)
Patrick H. Nettles, Ph.D.1,6
Stephen R. Hardis1,2,5,6 Executive Chairman,Non-Executive Chairman of the Board, Ciena CorporationMarsh & McLennan Companies, Inc. (telecommunications)(financial services)
Glenn M. Renwick2
Bernadine P. Healy, M.D.1,6 President and Chief Executive OfficerHealth Editor and Medical Columnist,U.S. News & World Report Donald B. Shackelford4,6
(publishing) Retired, former Chairman,Fifth Third Bank, Central Ohio
Jeffrey D. Kelly2,4,6 (commercial banking)Former Chief Financial Officer,National City Corporation Bradley T. Sheares, Ph.D.3,6
(commercial banking) Former Chief Executive Officer,Reliant Pharmaceuticals, Inc.
Abby F. Kohnstamm1,6 (pharmaceuticals)President and Chief Executive Officer,Abby F. Kohnstamm & Associates, Inc.(marketing consulting)
Corporate Officers Other Executive Officers
Glenn M. Renwick John A. BarbagalloPresident and Chief Executive Officer Commercial Lines Group President
Brian C. Domeck Lawrence W. BloomenkranzVice President and Chief Financial Officer Chief Marketing Officer
Charles E. Jarrett William M. CodyVice President, Secretary, Chief Investment Officerand Chief Legal Officer
Susan Patricia GriffithClaims Group PresidentThomas A. King
Vice President and TreasurerValerie Krasowski
Jeffrey W. Basch Chief Human Resource OfficerVice President and Chief Accounting Officer
John P. SauerlandMariann Wojtkun Marshall Personal Lines Group PresidentAssistant Secretary
Raymond M. VoelkerPeter B. Lewis Chief Information OfficerChairman of the Board(non-executive)
App.-A-75

Principal Office
The Progressive Corporation6300 Wilson Mills RoadMayfield Village, Ohio 44143440-461-5000progressive.com
24-Hour Insurance Quotes, Claims Reporting, and Customer Service
Private passenger autos, motorcycles, andrecreational vehicles Commercial autos/trucks
To receive a quote 1-800-PROGRESSIVE (1-800-776-4737)progressive.com
1-888-806-9598progressivecommercial.com
To report a claim 1-800-274-4499 1-800-274-4499progressive.com1
For customer service:
If you bought your policy through anindependent agent or broker
1-800-925-2886(1-800-300-3693 in California)progressiveagent.com
1-800-444-4487progressivecommercial.com
If you bought your policy directly throughProgressive online or by phone
1-800-PROGRESSIVE (1-800-776-4737)progressive.com
1-800-895-2886progressivecommercial.com
If you have a complaint or concernregarding any claim handling or otherclaims-related issue2
1-800-274-4641e-mail: [email protected]
1-800-274-4641e-mail: [email protected]
1Claims reporting via the Web site is currently only available for private passenger auto policies.
2Any policyholder, claimant, or other interested party who has any complaint or concern regarding any claim handling or other claims-related issue mayreport such claim using the contact information above. The complaint or concern will be promptly forwarded to the appropriate management personnel inour claims organization for review and response.
Shareholder/Investor Relations Progressive does not maintain a mailing list for distribution of shareholders’ reports. To viewProgressive’s publicly filed documents, shareholders can access our Web site: progressive.com/sec. To view our earnings andother releases, access progressive.com/investors.
To request copies of Progressive’s publicly filed documents free of charge, write to: The Progressive Corporation, InvestorRelations, 6300 Wilson Mills Road, Box W33, Mayfield Village, Ohio 44143, e-mail: [email protected] or call:440-395-2258.
For financial-related information, call: 440-395-2222 or e-mail: [email protected].
For all other Company information, call: 440-461-5000 or e-mail: [email protected].
Transfer Agent and Registrar
Registered Shareholders: If your Progressive shares are registered in your name, contact National City Bank regarding questionsor changes to your account: National City Bank, Shareholder Services Operations Dept. 5352, P.O. Box 92301, Cleveland, Ohio44193-0900. Phone: 1-800-622-6757 or e-mail: [email protected].
Beneficial Shareholders: If your Progressive shares are held in a brokerage or other financial institution account, contact yourbroker or financial institution directly regarding questions or changes to your account.
Contact Non-Management Directors Interested parties have the ability to contact the non-management directors as a group bysending a written communication clearly addressed to the non-management directors and sent to any of the following:
Peter B. Lewis, Chairman of the Board, The Progressive Corporation, 6300 Wilson Mills Road, Mayfield Village, Ohio 44143 ore-mail: [email protected].
Charles E. Jarrett, Corporate Secretary, The Progressive Corporation, 6300 Wilson Mills Road, Mayfield Village, Ohio 44143 ore-mail: [email protected].
The recipient will forward communications so received to the non-management directors.
App.-A-76

Accounting Complaint Procedure Any employee or other interested party with a complaint or concern regarding accounting,internal accounting controls, or auditing matters relating to Progressive may report such complaint or concern directly to theChairman of the Audit Committee, as follows: Stephen R. Hardis, Chairman of the Audit Committee,[email protected].
Any such complaint or concern also may be reported anonymously over the following toll-free Alert Line: 1-800-683-3604 oronline at www.progressivealertline.com. Progressive will not retaliate against any individual by reason of his or her having madesuch a complaint or reported such a concern in good faith. View the complete procedures at progressive.com/governance.
Whistleblower Protections Progressive will not retaliate against any officer or employee of Progressive because of any lawfulact done by the employee to provide information or otherwise assist in investigations regarding conduct that the employeereasonably believes to be a violation of Federal Securities Laws or of any rule or regulation of the Securities and ExchangeCommission or Federal Securities Laws relating to fraud against shareholders. View the complete Whistleblower Protections atprogressive.com/governance.
Corporate Governance Progressive’s Corporate Governance Guidelines and Board Committee Charters are available at:progressive.com/governance, or may be requested in print by writing to: The Progressive Corporation, Investor Relations, 6300Wilson Mills Road, Box W33, Mayfield Village, Ohio 44143.
Annual Meeting The Annual Meeting of Shareholders will be held at the offices of The Progressive Corporation, 6671 BetaDrive, Mayfield Village, Ohio 44143 on April 24, 2009, at 10 a.m. eastern time. There were 3,847 shareholders of record onDecember 31, 2008.
Common Shares The Progressive Corporation’s common shares (symbol PGR) are traded on the New York Stock Exchange.Progressive currently has an annual variable dividend policy. We expect the Board to declare the next annual variable dividend,subject to policy limitations, in December 2009, with a record date in January 2010 and payment shortly thereafter. A completedescription of our annual variable dividend policy can be found at: progressive.com/dividend.
Counsel Baker & Hostetler LLP, Cleveland, Ohio
Charitable Contributions Progressive contributes annually to The Progressive Insurance Foundation, which provides:(i) financial support to the Insurance Institute for Highway Safety to further its work in reducing the human trauma and economiccosts of auto accidents, and (ii) matching funds to eligible 501(c)(3) charitable organizations to which Progressive employeescontribute.
Online Annual Report and Proxy Statement Our 2008 Annual Report to Shareholders, in an interactive format, can be found at:progressive.com/annualreport.
We have also posted copies of our 2009 Proxy Statement and 2008 Annual Report to Shareholders, in a “PDF” format, at:progressiveproxy.com.
©2009 The Progressive Corporation
App.-A-77