Progress Report - University of Michigan
57
Progress Report '1 9 91
Transcript of Progress Report - University of Michigan

Progress Report
'1 9 91

THE UNIVERSITY OF MICHIGAN
OrnCE OF THE PREsIDENT
2074FLEMING ADMINISTRATION BUILDINGANN ARBOR, MICHIGAN 48109-1340313764-6270 FAX: 936-0775
Dear Colleagues and Friends:
This report shows how far the University of Michigan has come since 1987-and how far we have to go in making our University more diverse. Newinitiatives have sprung up, and old programs have flourished at all levels ofthe campus. Every division has drawn on its own diverse strengths andunique vision in meeting the challenges of diversity. This document standsas a record of our successes and continuing challenges. It is also a reaffirmation of our commitment to the goals of the Michigan Mandate.
We have known from the beginning that the Mandate would not change ourUniversity overnight. Increasing the numbers of faculty, students, and staffof color is only the first step in a long journey. Success will demand greateffort and a considerable investment of resources--but we do have the mostimportant thing we need to succeed: we have the determination. Byfollowing the guidance of the Mandate and by listening closely to the myriadvoices of our community, we will make the indivisible goals of diversity andexcellence a reality.
Dean Rhetaugh Dumas of the School of Nursing comments that "althoughthere is yet much work to be done, I believe that this report demonstrates ourcapabilities to increase the potential for building a type of community inwhich: people of different races and cultures are genuinely respected andappreciated; their efforts are rewarded; and obstacles to their advancement tomore significant positions of authority and leadership within the Universityare eliminated."
This is truly a historic challenge to Michigan. But facing such challenges isnot new to us: it is a part of our history. Michigan was the first majorinstitution in the nation to admit women, and one of the first to admit anAfrican American. We opened wide our doors to the non-traditionalstudents who were veterans after World War Il. All these commitments,initiated in the face of opposition, brought major changes to Michigan. Yet,by any standard, the university is a better place because we were willing tochange, willing to become more inclusive. The Mandate is only the latestchapter in our historic development as a world university.
Nonetheless we should not underestimate the challenges ahead. There arefew models to guide us, either in our own society or others. The fact is thatwe are trying to overcome one of the most persistent and damaging flaws ofhuman character: the need to define oneself by rejecting others. Professor

Frederick Neidhardt points out that "this (search for a multiculturalcommunity) will be scary for some people, requiring new ways of thi~king,
new styles of thought and expression. People never thought about thisbefore, because the American ideal was about 'them' joining, not thedominant culture being molded by all. This is easily viewed as 'givingsomething up,' and it is important that this challenge not be hidden. Therewill be a lot of-sadness and resistance to this change." No one has been herebefore. We must draw our own map of the territory.
Too often our students (and perhaps our faculty and staff) come here fromtheir homes inadequately prepared to deal with the diverse environmentthey find at Michigan. In their analysis of US census data, ProfessorsReynolds Farley and Walter Allen have shown that segregation in thetwenty-five largest metropolitan areas across America has decreased slightlysince the 1970s, even increasing in some cities, despite widespread popularbelief to the contrary. They note that most students will "complete their(elementary and secondary) education without ever having attended a schoolwhich enrolled students of the other race and without living in a
.neighborhood where the other race was well represented." Not surprisingly,new students arrive on campus with little experience of "difference." XimenaZiifiiga, Director of the UM Intergroup Relations and Conflict Program, facesthese challenges every day as she organizes intergroup dialogues andcoordinates the program's diversity classes and mini-courses. "It's anationwide, not just a campus problem. People are clearly not used to talkingabout racial and multicultural issues with members of other groups," shesays. "We are dealing with a lot of misinformation and issues that are oftenvery emotional and uncomfortable to talk about... there aren't any simpleanswers or quick solutions and that is often a major challenge for students."
Despite the historic and structural roots of segregation and prejudice in oursociety and the world, and the challenges resident even in our own campuscommunity, there are grounds for optimism about the possibilities forchange. Increasing international interdependence is creating powerful forcesfavoring multiculturalism over the long term. Here at home there is agrowing realization that if we hope to have a prosperous and fulfilling future,we must eliminate the remaining vestiges of discrimination and prejudiceand the growing national pattern of residential and educational segregation.
America's universities cannot sit by and wait for others to bring social change.On the contrary, we have an obligation to lead and to provide models forothers to follow. We are tied ever more irrevocably into the problems andpossibilities of our society. As the speed of change increases, higher educationhas become central to planning the future, to creating community. All thepower of the natural sciences is brought to bear on issues ranging from AIDSto computers. The social sciences struggle with urban blight in our centralcities and the plight of the small farmer on the plains. The humanities helpus re-examine our place in this world, asking "who is silenced, who isallowed to speak?" As Erich Bloch, former Director of the National Science
2
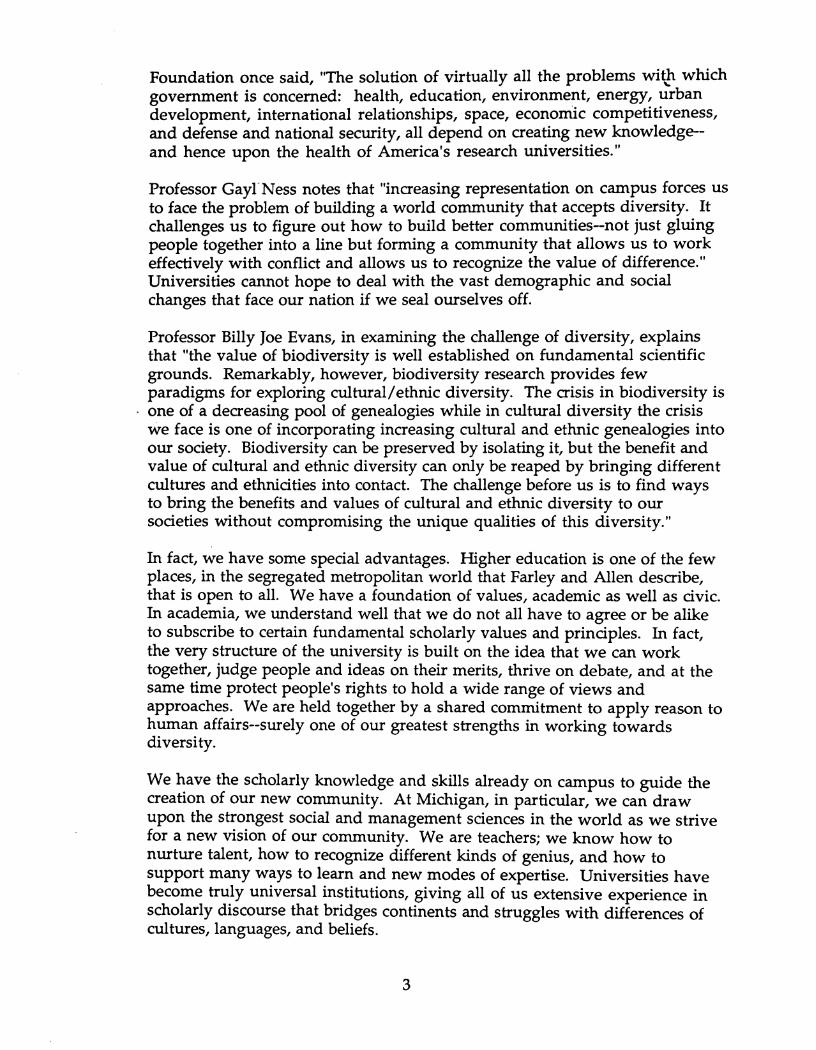
Foundation once said, "The solution of virtually all the problems with whichgovernment is concerned: health, education, environment, energy, urbandevelopment, international relationships, space, economic competitiveness,and defense and national security, all depend on creating new knowledgeand hence upon the health of America's research universities."
Professor GaylNess notes that "increasing representation on campus forces usto face the problem of building a world community that accepts diversity. Itchallenges us to figure out how to build better communities-not just gluingpeople together into a line but forming a community that allows us to workeffectively with conflict and allows us to recognize the value of difference."Universities cannot hope to deal with the vast demographic and socialchanges that face our nation if we seal ourselves off.
Professor Billy Joe Evans, in examining the challenge of diversity, explainsthat "the value of biodiversity is well established on fundamental scientificgrounds. Remarkably, however, biodiversity research provides fewparadigms for exploring cultural/ethnic diversity. The crisis in biodiversity is
. one of a decreasing pool of genealogies while in cultural diversity the crisiswe face is one of incorporating increasing cultural and ethnic genealogies intoour society. Biodiversity can be preserved by isolating it, but the benefit andvalue of cultural and ethnic diversity can only be reaped by bringing differentcultures and ethnidties into contact. The challenge before us is to find waysto bring the benefits and values of cultural and ethnic diversity to oursocieties without compromising the unique qualities of this diversity."
In fact, we have some special advantages. Higher education is one of the fewplaces, in the segregated metropolitan world that Farley and Allen describe,that is open to all. We have a foundation of values, academic as well as civic.In academia, we understand well that we do not all have to agree or be aliketo subscribe to certain fundamental scholarly values and principles. In fact,the very structure of the university is built on the idea that we can worktogether, judge people and ideas on their merits, thrive on debate, and at thesame time protect people's rights to hold a wide range of views andapproaches. We are held together by a shared commitment to apply reason tohuman affairs--surely one of our greatest strengths in working towardsdiversity.
We have the scholarly knowledge and skills already on campus to guide thecreation of our new community. At Michigan, in particular, we can drawupon the strongest social and management sciences in the world as we strivefor a new vision of our community. We are teachers; we know how tonurture talent, how to recognize different kinds of genius, and how tosupport many ways to learn and new modes of expertise. Universities havebecome truly universal institutions, giving all of us extensive experience inscholarly discourse that bridges continents and struggles with differences ofcultures, languages, and beliefs.
3
Most importantly, as scholars, we have had to learn how to incorporate newperspectives, experiences, and talents into our discourse. And we can gofarther. We have everything to gain from increasing diversity that helps usto overcome parochialism and transcend the limits of our own backgrounds.According to Professor Carl Berger, "The research university has historicallydeveloped single modes, weeding out those that are not successful. It's a selffulfilling paradigm of knowledge, but the history of science shows that asingle paradigm doesn't work." Professor Terrence McDonald goes further:"The (Michigan Mandate) project is like the space program, creatinguncounted spin-off benefits for everyone. Along the way we are finding out alot of new ways to go about our teaching and research." Diversity forceschange in our vision of the university. It resists the single paradigmapproach, and it keeps open many different avenues to learning at the sametime. It's often a painful experience; but it spills over into other areas,interrupts routine, makes achievement possible.
To harvest the benefits of plurality, we must all be open to new ideas. Wemust be more trusting and caring of one another. Can we learn? Can we
, retain academic excellence, nurture creativity, and increase diversity at thesame time? I am convinced we can.
The basic question before us is what kind of university community we wantto be. What shall we pass on to our children and they to their children? Ihope all of us will become part of this vital debate in the months and yearsahead.
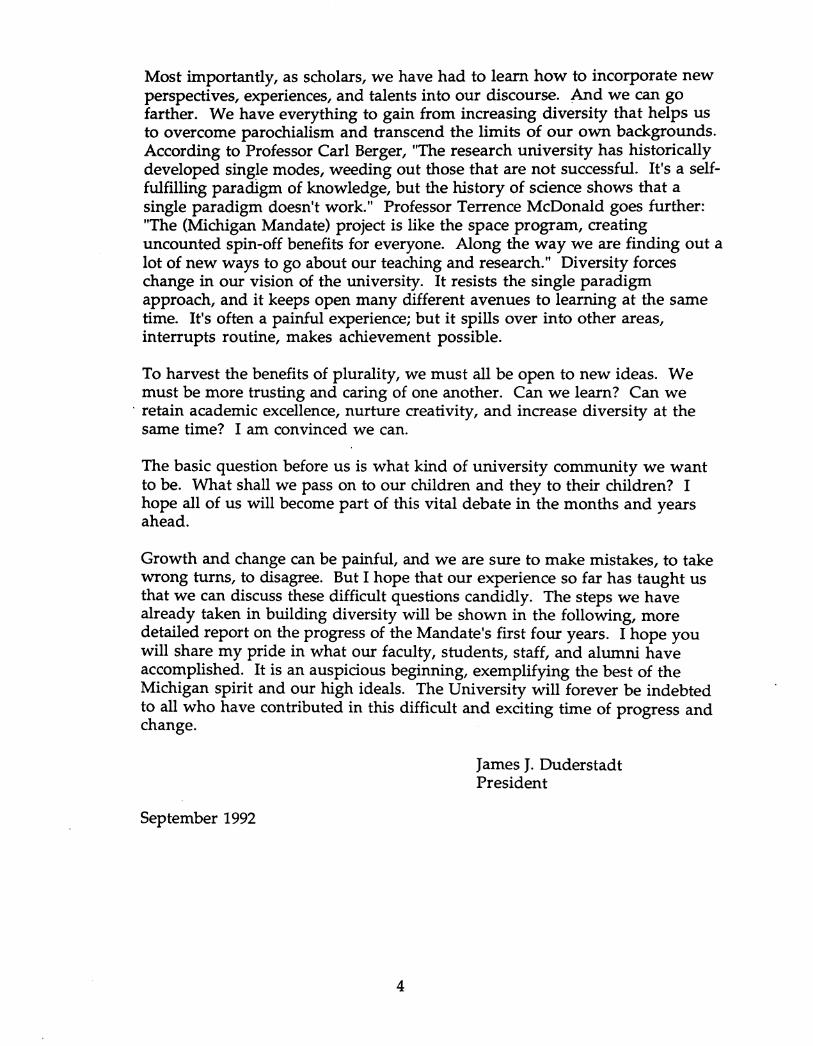
Growth and change can be painful, and we are sure to make mistakes, to takewrong turns, to disagree. But I hope that our experience so far has taught usthat we can discuss these difficult questions candidly. The steps we havealready taken in building diversity will be shown in the following, moredetailed report on the progress of the Mandate's first four years. I hope youwill share my pride in what our faculty, students, staff, and alumni haveaccomplished. It is an auspicious beginning, exemplifying the best of theMichigan spirit and our high ideals. The University will forever be indebtedto all who have contributed in this difficult and exciting time of progress andchange.
James J. DuderstadtPresident
September 1992
4

Michigan Mandate:A Four Year Progress Report
TABLE OF CONTENTS
Executive Summary 6
Faculty Recruiting and Development 9
Student Recruiting, Achievement, and Outreach 14
Total Student Enrollments 14
Undergraduate Student of Color Enrollments 15
Graduation Rates 17
Student of Color Enrollment in Graduate/Professional Schools 18
Projected Future Enrollments 22
Staff Recruiting and Development 25
Improving the Environment for Diversity ~ 27
Appendices 29
Printed on recycled paper
5

UNIVERSITY OF MICHIGANOffice of the President
The Michigan Mandate: Four-Year Progress ReportExecutive Summary
The Michigan Mandate is a commitment to make the University of Michigan anational and world academic leader in the racial and ethnic diversity of its faculty,students, and staff. First set forth in 1988, the Mandate presents a vision, a strategy,and a series of concrete actions. It is designed to build a multicultural academiccommunity that will be a model for higher education and society at large.
The Michigan Mandate breaks new ground, drawing on the best available researchand experience for promoting significant social change. It provides the frameworkfor a dynamic and inclusive reassessment of our future, based on the University'sbest academic traditions and values. It calls on the entire community to join in acommitment to change. Unique solutions, experiments, and creative approaches areencouraged; and resources are committed to them. Special incentives rewardprogress in the strategic areas of faculty hiring and graduate recruitment.
Why a Michigan Mandate for Diversity?
The Michigan Mandate grows out of the University's historic role as a leader ofAmerican higher education. It recognizes that the University's most basic goal ofacademic excellence cannot be achieved without intellectual and social diversity.Why is this so? The reasons are fundamental to our teaching, research, and servicemission:
• First, a diversity of talents, perspectives, and experiences is essential tointellectual strength in our increasingly pluralistic and interdependent world.The challenge of new ideas, energies, and vigorous debate generates powerfulnew fields of inquiry, stimulates debate about accepted ideas and standards,shifts paradigms, and improves professional practice.
• Second, America's future depends on our response to this nation's increasingdiversity. Universities must accept responsibility for providing the educatedpeople and ideas needed by this society to build unity out of diversity.
• Third, Michigan and America require a highly skilled and competitiveworkforce--a workforce drawn increasingly from groups currentlyunderrepresented in higher education and at the University of Michigan.
• Fourth and most important, it fulfills our commitment as a public universityto serve all of the people of our state and nation.
Our challenge is to create community and excellence while preserving and respectingdifference. We have only to look at the daily headlines to grasp the urgency of our
6

task. Societies around the world are being ripped apart by ethnic, racial, and religiousstrife that threatens world peace, causes untold suffering, and stands in the way ofprogress in addressing the most pressing problems facing humankind.
The University of Michigan cannot turn its back and lay the crisis of an increasinglypolarized and fragmented society at the feet of other institutions. Even though we inhigher education cannot hope to carry the burden alone, we can and must reaffirmthe mission of all institutions of higher learning: to lead, not follow. We must helpour country seize these great changes in our population as occasions for possibilityand progress. It is vital that, as a premier university, Michigan continue to be at theforefront of this struggle. And we bring many strengths to the challenge: chiefamong them our bedrock civic and academic values and our commitment toindividual intellectual freedom.
What has the Mandate Accomplished?
• Our Fall 1991 statistics showed that we have the largest number of AfricanAmerican, Hispanic/Latino, Native American and Asian American students-
, graduate and undergraduate--in our history: 6,636, corresponding to 20.1percent of our total enrollment. This represents a 53 percent increase instudent-of-color enrollments' in the first four years of the Michigan Mandate.
• Moreover, we now enroll the largest number of Hispanic/Latino, NativeAmerican, and Asian students at all levels--undergraduate, graduate, andprofessional--in our history. We have now exceeded as well the largestnumber of African American students in our history (2,456 in 1976). AfricanAmerican enrollments have increased by 45 percent over the past four years to2,510 students, representing 7.6 percent of our student body. Hispanic/Latinostudents have increased 83 percent to 1,240 or 3.8 percent of our student body.Asian students have increased 50 percent to 2,697 (8.2 percent), while NativeAmerican students have increased 47 percent to 189 (0.6 percent).
• The past recruiting year, Fall 1991, was among the most successful in ourhistory. Twenty-five percent of the 1991 freshman class were students of color.Of these students of color, 31.1 percent are African American, 18.9 percent areHispanic/Latino, 3.2 percent are Native American students and 46.9 percent areAsian Americans.
• We have also seen remarkable progress at the graduate and professional levelin fall 1991: a 66 percent increase in graduate students of color since 1987 (an 80percent increase in African American), and a 43 percent increase inprofessional students of color (a 47 percent increase in African Americans). Forexample, our entering Fall 1991 full-time MBA class is 25 percent students ofcolor (15 percent African American).
7
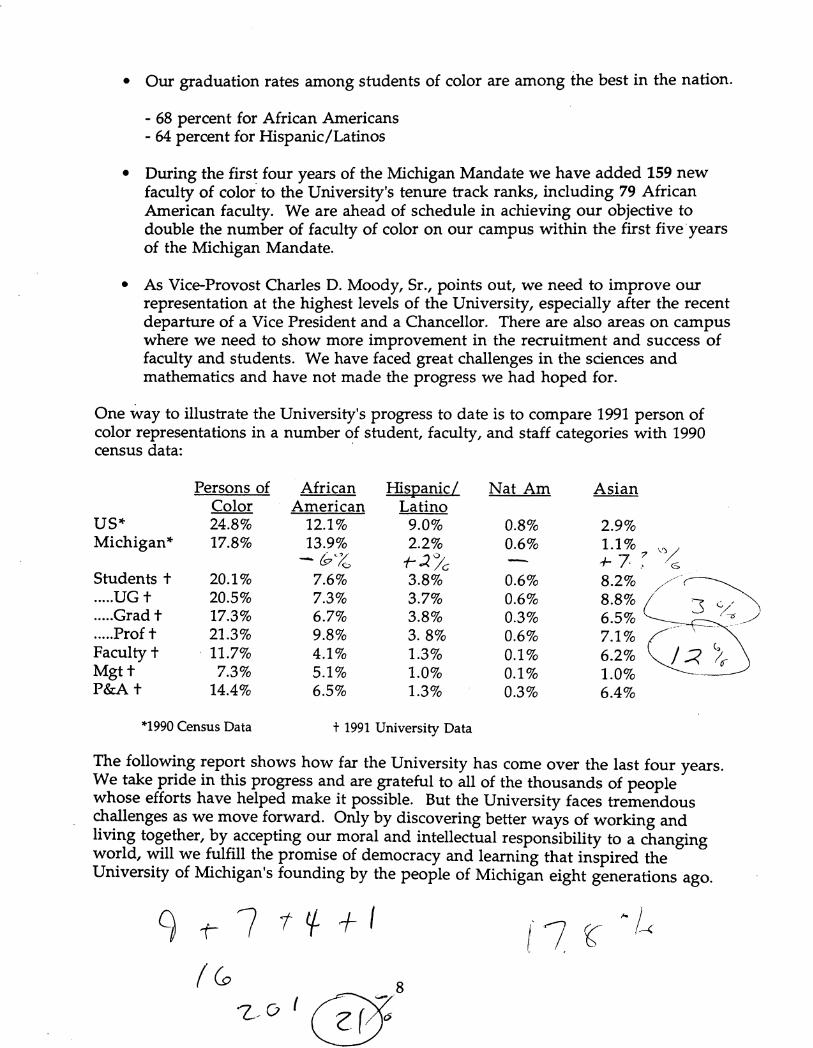
• Our graduation rates among students of color are among the best in the nation.
- 68 percent for African Americans- 64 percent for Hispanic/Latinos
• During the first four years of the Michigan Mandate we have added 159 newfaculty of color- to the University's tenure track ranks, including 79 AfricanAmerican faculty. We are ahead of schedule in achieving our objective todouble the number of faculty of color on our campus within the first five .yearsof the Michigan Mandate.
• As Vice-Provost Charles D. Moody, Sr., points out, we need to improve ourrepresentation at the highest levels of the University, especially after the recentdeparture of a Vice President and a Chancellor. There are also areas on campuswhere we need to show more improvement in the recruitment and success offaculty and students. We have faced great challenges in the sciences andmathematics and have not made the progress we had hoped for.
One way to illustrate the University's progress to date is to compare 1991 person ofcolor representations in a number of student, faculty, and staff categories with 1990census data: .
Persons of African Hispanic/ Nat Am AsianColor American Latino
U5* 24.8% 12.1% 9.0% 0.8% 2.9%Michigan" 17.8% 13.9% 2.2% 0.6% 1.1% 7 '~..... (9~~ -I-~/c +- 7·.\ .G
Students t 20.1% 7.6% 3.8% 0.6% 8.2% //~.....UGt 20.5% 7.3% 3.7% 0.6% 8.8% C:3 ~/.....Grad t 17.3% 6.7% 3.8% 0.3%
6.5% "_"~.....Prof t 21.3% 9.8% 3.8% 0.6% 7.1%Faculty t 11.7% 4.1% 1.3% 0.1% 6.2% CL3 ;6Mgtt 7.3% 5.1% 1.0% 0.1% 1.0% -P&At 14.4% 6.5% 1.3% 0.3% 6.4%
*1990 Census Data t 1991 University Data
The following report shows how far the University has come over the last four years.We take pride in this progress and are grateful to all of the thousands of peoplewhose efforts have helped make it possible. But the University faces tremendous
_ challenges as we move forward. Only by discovering better ways of working andliving together, by accepting our moral and intellectual responsibility to a changingworld, will we fulfill the promise of democracy and learning that inspired theUniversity of Michigan's founding by the people of Michigan eight generations ago.
7 1 ~ + I
8'-""'" .

The Michigan Mandate: A Four-Year Progress Report
Progress on the Four Principal Objectives of the Michigan Mandate
objective 1: Faculty Recruiting and Development
Goals:
• Substantially increase the number of tenure-track faculty in eachunderrepresented group.
• Increase the success of faculty of color in the achievement of professionalfulfillment, promotion, and. tenure.
• Increase the number of underrepresented faculty and staff of color inleadership positions over the next five years.
Results to Date:
The Target of Opportunity program, combined with aggressive recruiting effortsthrough regular mechanisms, has significantly increased representation of faculty ofcolor over the past four years:
• The University has added 159 new faculty of color to its tenure-track ranks- A 67.1 percent increase from 1987
• 321 tenure or tenure-track faculty of color- 11.7 percent of total faculty
• 79 new African American faculty have been added to tenure or tenure-trackpositions- A 92.4 percent increase since 1987
• The current African-American faculty now totals 113- 4.1 percent of total faculty
• 21 new Hispanic/Latino tenure-track faculty have been hired during this period- An 87.5 percent increase over 1987
• There are now 35 Hispanic/Latino faculty- 1.3 percent of total faculty
9
• Asian and Asian American faculty tenure and tenure-track representationhas risen by 64- A 49.2 percent increase in four years
• Asian and Asian American faculty now totals 170- 6.2 percent of total faculty
• However, only one new Native American faculty member has been added tothe faculty, bringing the total to three. Clearly this is an area in need ofgreater attention.
(Note: All cited faculty numbers consist of tenure and tenure-track faculty only.Lecturers and supplementary faculty were eliminated from the figures.)
Recruitment Highlight:The Target of Opportunity Program
Traditionally, university faculty hiring has been driven by a concern foracademic specializations within a department's discipline. While this has fosteredexceptional specialized academic strength in universities across the nation, it can alsobe constraining. Too often, faculty searches are "replacement" rather than"enhancement" searches.
To achieve our broader academic and diversity goals at Michigan, we cannot beconstrained by this perspective, and the Target of Opportunity Program was created asour response. The central administration agreed to provide financial support todepartments for both non-tenured and tenured faculty of color hires. This hascreated strong incentives for faculty of color recruitment at the department level.Moreover, the fact that the program's funds are reallocated from the base budget ofthe entire University makes it increasingly difficult for Schools and Colleges tocontinue "business as usual:' Departments that don't compete for this funding willlose out. .
The results of the Program are extremely encouraging. Many units havebecome much more vigorous and creative in identifying teachers/scholars of color.Departments have become less limited by concerns about narrow specialization andmore attentive to whether an individual will enhance the department in general.
- Some of the barriers to the recruitment of faculty of color have been removed, as thelarger report shows.
10

The following chart summarizes the progress made in faculty of color representation duringthe past four years:
Faculty of Color (UM-AA)Tenured and Tenure-Track
350
300
250
150 +-r/,///,/'l.J
100 ...... ..,------..
50
o'84 '85 '86 '87
11
'88 '89 '90 '91
~Asian
American
B NativeAmerican
o HispaniclLatino
II AfricanAmerican

The next two charts show the cumulative progress Michigan has made since thebeginning of the Mandate in increasing the representation of persons of color on thetenure and tenure-track faculty.
Percentage Increase of Tenured and Tenure-Track Faculty of Color
50% ~ - __ - _ - _ _ - --. __ .-..- - - -- _ --.
40% .-••• -•••• -••••••••••_•••••••••_•••••••••••••••••••• _.-_ -•••• -- ••••_••••••
10% _._--_.._-_._._-_._-_..._-~~~~~~~~~~_. __...I
I I •1988 1989 1990 1991
Percentage Increase in African American Tenured and Tenure-Track Faculty
50% _ ~ __ ~ __ ~ __ -_ ~_ __ _ _~ ~_ ~~ _- _ _- ~-.
40%
I
1991
.. __ ... -- .._-.'/ ~
.----.. 'l/'Z; -.._---
'I 'l
"F
"/ """I ~/
1989 1990
•
'/ -_..._-~~~
1988
_..
0%
20% .~ ••• --- •• _- ••• -_ •••_- •••--1IIIIIII1IIIIIIl
12
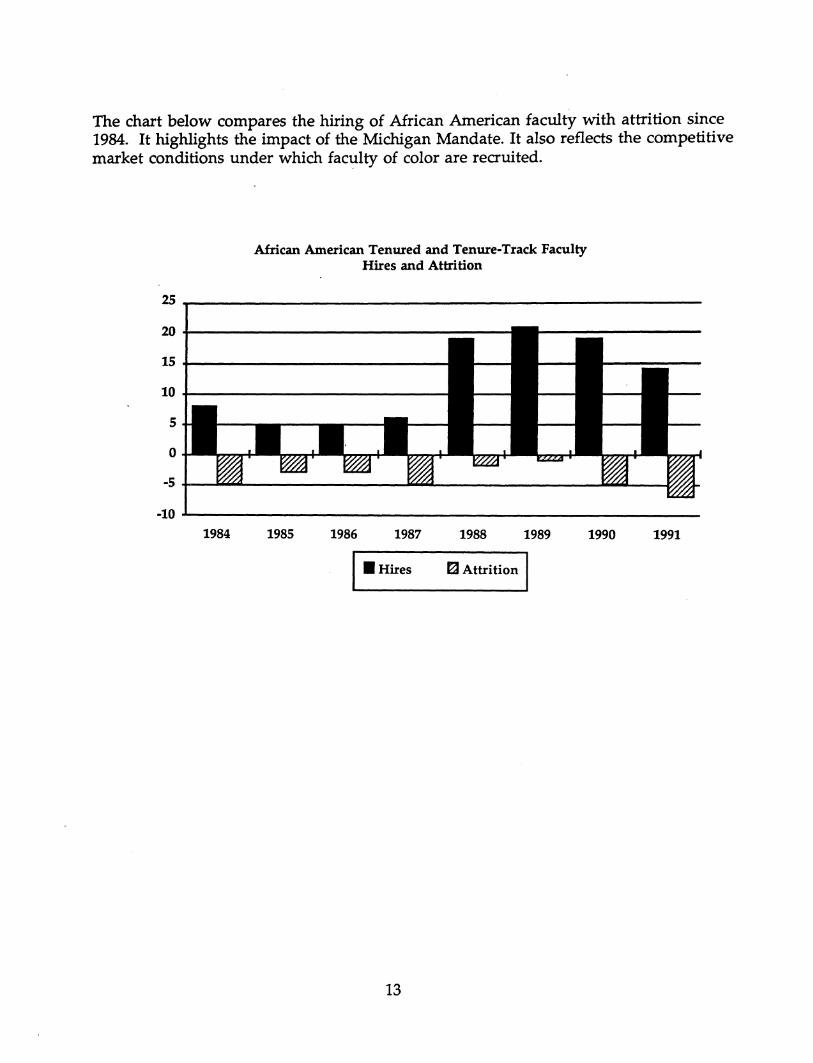
The chart below compares the hiring of African American faculty with attrition since1984. It highlights the impact of the Michigan Mandate. It also reflects the competitivemarket conditions under which faculty of color are recruited.
African American Tenured and Tenure-Track FacultyHires and Attrition
25 ..-- _
20 +-------------------15 ....--------------
10 +--------------5
o
-5 ...--..1......-..---------~ ......--- __IillI_'"L..__..rh;~
-10 .......---------------------------
I_Hires ~ Attrition I1984 1985 1986 1987 1988 1989 1990 1991
13
• Design new and strengthen. existing outreach programs which havedemonstrable impact on the pool of applicants of color to undergraduate,graduate, and professional programs.
Objective 2: Student Recruiting, Achievement, and Outreach
Goals:
• In each of the next five years, achieve an increase in the number of entering'/-'~~ students from underrepresented groups, as well as in our total underreprese~ted
" group enrollment. . __ _ _-r:':>
~-;:~~~:~sha:;d.z: spec~i~en:~:I_~~:_t_~~~~~ts for students of color in all,
CX-;-i~;;~;;-;~d~ati~n---~~~~:~f students of color.
Develop new programs to attract back to campus students of color who have",withdrawn from our academic programs. "
.~
J
Results to date:
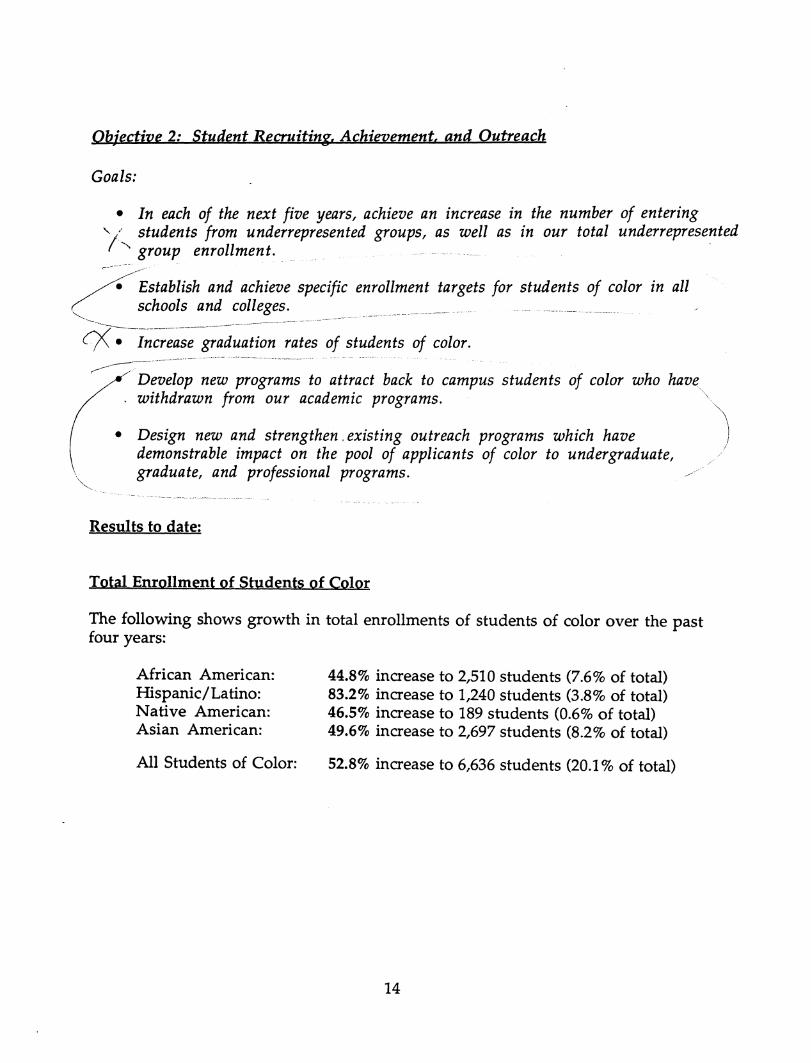
Total Enrollment of Students of color
The following shows growth in total enrollments of students of color over the pastfour years:
African American:Hispanic/Latino:Native American:Asian American:
All Students of Color:
44.8% increase to 2,510 students (7.6% of total)83.2% increase to 1,240 students (3.8% of total)46.5% increase to 189 students (0.6% of total)49.6% increase to 2,697 students (8.2% of total)
52.8% increase to 6,636 students (20.1% of total)
14

The chart below shows changes in UM enrollment of students of color from 1975 to 1991.
Enrollments of Students of Color (UM-AA)
7000 ----------------------------------------------------------_.----------
6000 ------------------------------------------------------------------~~~~
5000 ------------------------------------------------------
4000
3000
2000
1000
o'75 '76 '77 '7S '79 'SO 'Sl 'S2 '83 '84 'S5 'S6 'S7 'SS 'S9 '90 '91
23 AsianAmerican
sa NativeAmerican
[] HispanidLatino
• AfricanAmerican
(Note: Enrollments for each ethnic group, showing the breakout amongundergraduate, graduate, and professional schools are shown in Appendix A.Michigan's recruitment efforts also compare well with those of otherinstitutions. See Appendix B for comparisons with other Michiganuniversities and Appendix e for comparisons with eIe institutions.
undergraduate Enrollment of Students of Color
• Twenty-five percent of the 1991 freshman class are students of color. Ofthese students:
- 31.1 percent are African American- 18.9 percent are Hispanic/Latino- 3.2 percent are Native American
The next chart tracks undergraduate enrollment of students of color over time.
Undergraduate Students of Color (UM-AA)
5000
4500
4000
3500
3000
2500
2000
1500
1000
500
o
--~.-._._._----_.-.._._._._.---_._----_._--.._._._--.---------------------------------------------------_.._----------------------_.----------------------------_ ..-------_._----------------------.--------_.---------------------------------... ----------------------.------_ ..._·-·_·~~./.r~---...__ ._..-.-._....-.-. __ .. __ ._----_.-._-..._.- .....-
'75 '16 '77 '18 '79 '80 '81 '82 '83 '84 '85 '86 '81 '88 '89 '90 '91
15
1:3 A.ianAD\erican
B NativeAD\erlcan
CHi.panlclLatino
• AfricanAD\erlcan
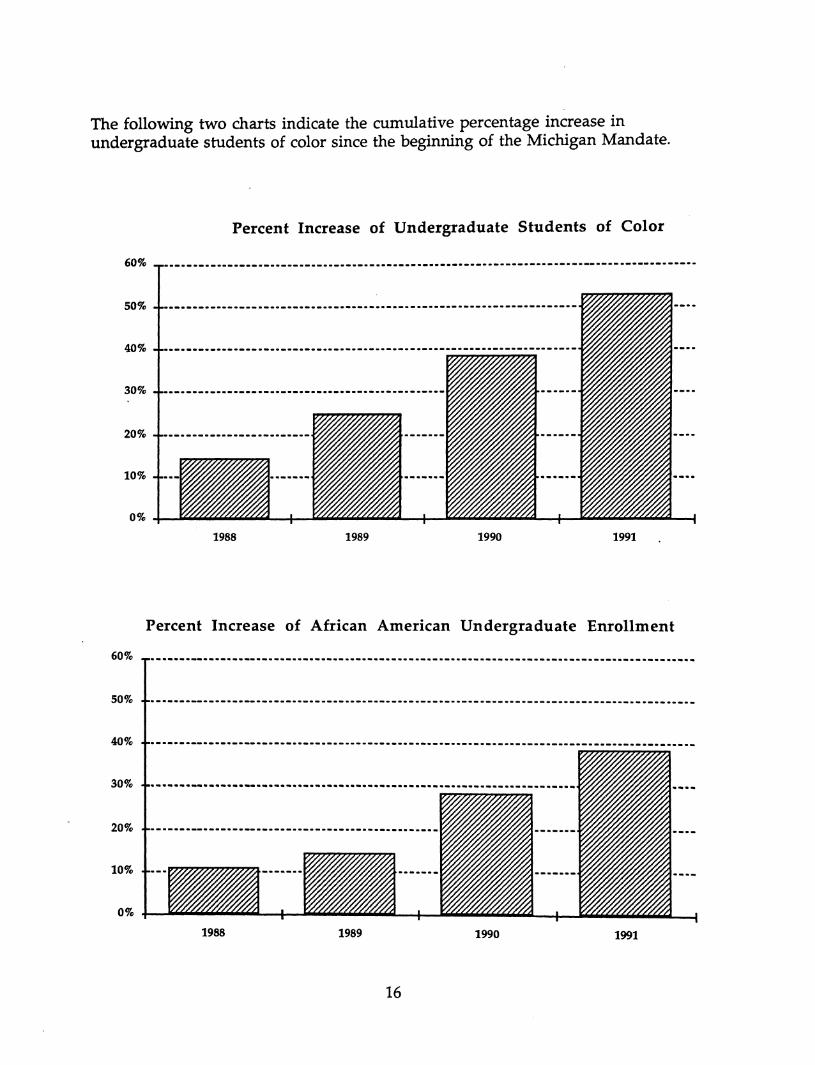
The following two charts indicate the cumu1ative percentage increase inundergraduate students of color since the beginning of the Michigan Mandate.
Percent Increase of Undergraduate Students of Color
60% .~.._._._._.._._._._.._-_.-._.._.-.-._..-.--_._.._.-.- -_.._--------.--_.-----_._----------_.
_._.- .. -.--_. __ e.
~
....... -.-.-. -...~
r/
:I' . '.I~~ J ~I I
J •1989 1990 1991
0%
1988
50% .~••_. - - _. - - - _. - - - • - _. - - _. -. _. - -. - - _. - •• - • -. - - - - - _. - - - - - • - - - - - _. - _. - • _. -~~~~~ - _. -
30% .~.__._-_••_-_·_ •• • __• __••__••_·._-_· __·_·_--·----II--..-.20% - ._ •••__• __._._-_.__._.__.~~~~~~
10% ••••••••••••••
Percent Increase of African American Undergraduate Enrollment
60%
50%
40% ---._-----.-._._-------_...--_._._---------_._-_._._------- ...._-------._-_._ ...._._._------
10% _._....~._. __.-
0% I
1988 1989 1990 1991
16

Graduation Rates
Yet another critical measure of success is undergraduate graduation rates.
• UM 1991 six-year graduation rates for underrepresented groups comparefavorably to those of peers though they still lag behind those for whites.
- 68% for African Americans- 64% for Hispanic/Latinos- 64% for Native Americans- 84% for Asian Americans- 85% for white students
The following chart shows UM's 1990 six-year graduation rate for African Americanstudents compared with other institutions. Data available from other schools is a yearolder than that cited above for Michigan's 1991 progress.
African AD'lerican 1990 Six-Year Graduation RateU of Michigan-Ann Arbor and CIC Institutions'"
70~ -------------------------------_.----._-••_--.-----.--_.----.---._--._-.------_.---------
60~ ---------------------------- ••---.--.----.-.------- ••---._------------------------50~
40~ -------.-- ---- --.- ---- ---- ---- _.-- •• ------30~
20~
10%
O~
UM-AA Purdue U-Illinoia uWiBconain
MSU U-Io""". OSU Indiana U U-Minneeota
Source: The Chronicle of Hisher Education 7/15/92 -Data not availabl. for Penn State, North"",,_tern,. or U of ClUcaso
Retention HighlightsImproving the Performance of All, Teaching Biology
Professor Lewis Kleinsmith's research on biology is discovering new methods forteaching in the sciences. He has found that these new methods improve the achievementof all students, and students of color achieve at the class average.
One of the most basic findings of this study is that the more ways students have to .learn, the better all will do. This response of the University to diversity, then, has openedus up to students with ability or even brilliance in areas where we might have lost thembefore.
Professor Carl Berger points out that, "Much of our work has been geared towardsmaking students take more responsibility for their own learning." What this study, andothers, show us is that students of all ethnicities and backgrounds that do not fit the"majority" paradigm, including many white students, may be failing because theinstitution is unable to respond to their needs, or more importantly, their individualpotentials.
17

(See Appendix D for more charts comparing UM's six-year graduation rates forother students of color and white students with those of its CIC (Big 10 plusChicago) peers.)
Enrollment of Students of color in Graduate and Professional School
Graduate School
• Because the University's graduate student population represents the nextgeneration of faculty for America's colleges and universities, the Universitycontinues to invest heavily in efforts to increase enrollment of graduatestudents of color in all fields.
• During the first four years of the Michigan Mandate, enrollment of graduatestudents of color has increased by 65.7 percent.
- African American:- Hispanic/Latino:- Asian American:
+79.8 percent+72.6 percent+57.2 percent
The following chart shows graduate student of color enrollments from 1~75-1991.
Graduate Students of Color (UM-AA)Enrollments
900
800
700
600
500
400
300
200
100
o'75 '76 '77 '7S '79 'SO 'Sl 'S2 "83 'S4 'S5 '86 '87 '88 '89 '90 '91
121 AsianAmerican
iii NativeAmerican
[] HispanidLatino
• AfricanAmerican
• The Rackham Graduate School has increased the number of Fellowssupported by programs for historically underrepresented groups by 86 percentsince 1987 to a total of 625 in Fall 1991. Of these:
- 55 percent were African American- 27 percent were Mexican American or Puerto Rican
18
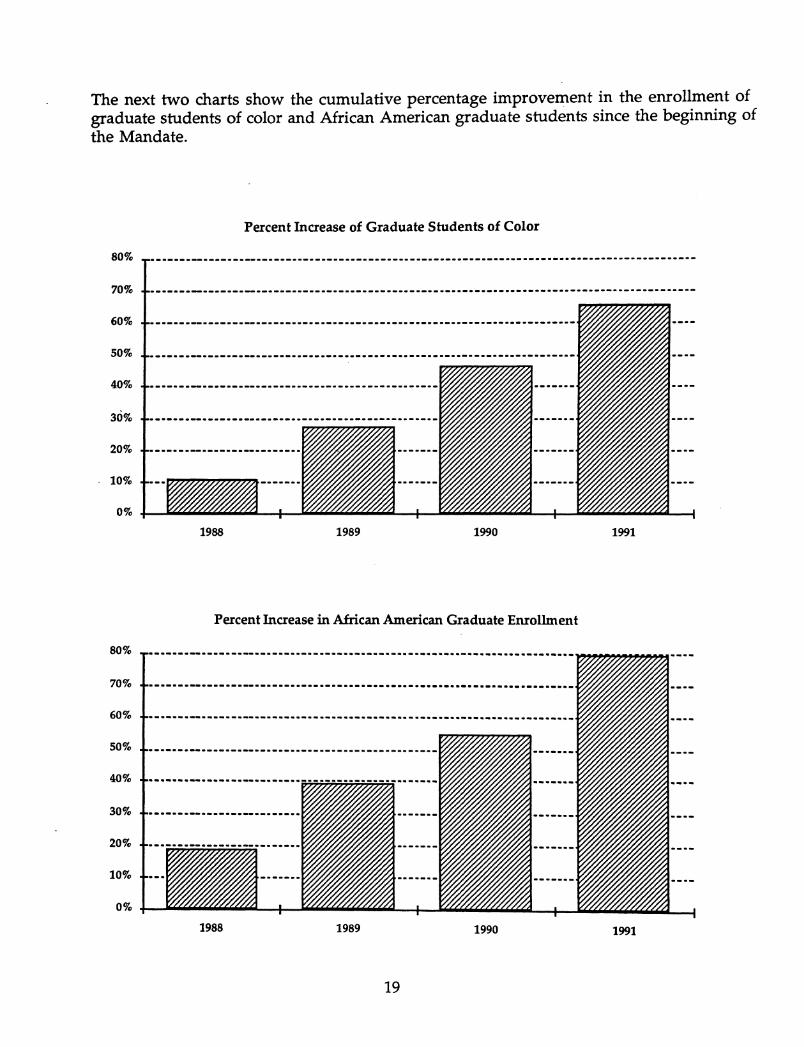
The next two charts show the cumulative percentage improvement in the enrollment ofgraduate students of color and African American graduate students since the beginning ofthe Mandate.
Percent Increase of Graduate Students of Color
80% ._.----------------------.-----------------..------_..------------------------_..------------
70%
60%
._._._.~._-_._-~._.----.--_.-._._-.---._..-._._._..-.----------------------_.._-----------
_.-._._---.-._._.._._._. __._._._. __ ._._._.__ ._._.-.__ .-._._. __._._._.__.~~_._.
50%
40% ••••.• ._._._.._._._. __ ._._._. __._._._.__._._.~~~~z_._.__ .
I
--·_·_·IIIIIIIIIIIIIII-·_·--·0%
20%
10%
1988 1989 1990 1991
Percent Increase in African American Graduate Enrollment
80% _._._._.._._._._.._._._. __._._._. __._._.-.__ .-._._.__._._._. __ ._._._.__.~~~~_._.
70%
60%
50%'/
40% './
30%/.
I
""""I..-
'./
0%
20% ••-.-.-.--. ._. ~~~~~~~~--.-.-.~-.-._-.
Wh~WhW~
10%
1988 1989 1990 1991
19
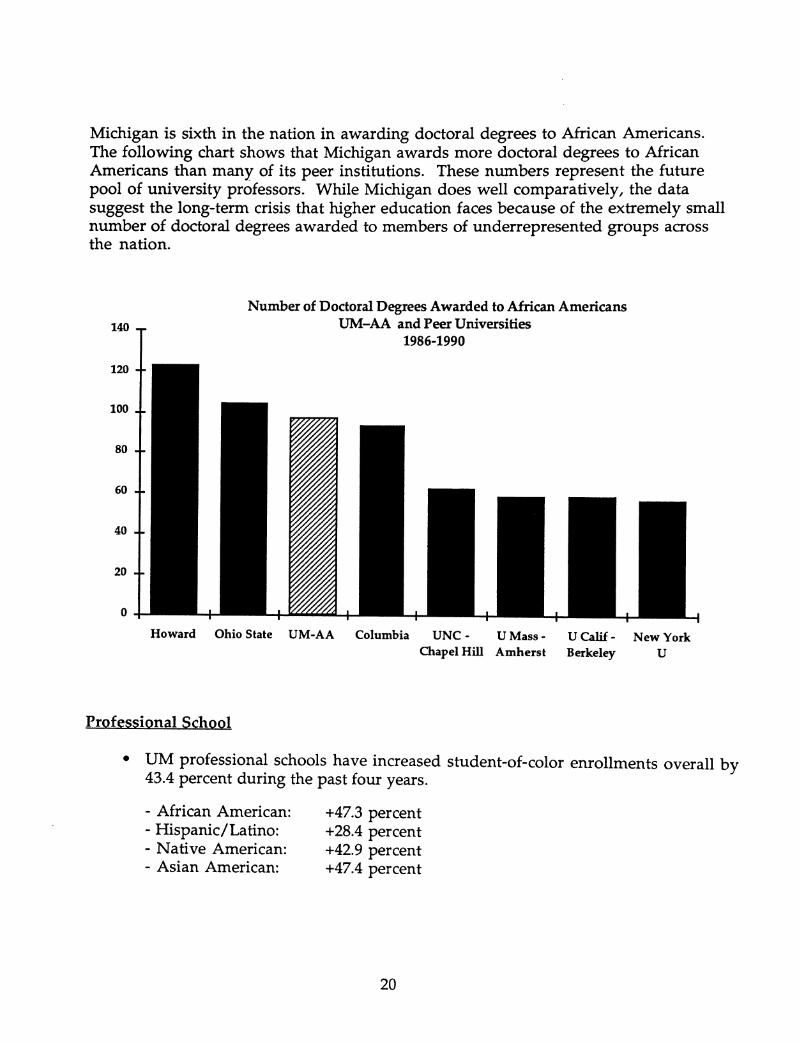
Michigan is sixth in the nation in awarding doctoral degrees to African Americans.The following chart shows that Michigan awards more doctoral degrees to AfricanAmericans than many of its peer institutions. These numbers represent the futurepool of university professors. While Michigan does well comparatively, the datasuggest the long-term crisis that higher education faces because of the extremely smallnumber of doctoral degrees awarded to members of underrepresented groups acrossthe nation.
140
120
100
80
60
40
20
o
Number of Doctoral Degrees Awarded to African AmericansUM-AA and Peer Universities
1986-1990
Howard Ohio State UM-AA Columbia UNC - U Mass -Chapel Hill Amherst
U Calif - New YorkBerkeley U
Professional School
• UM professional schools have increased student-of-color enrollments overall by43.4 percent during the past four years.
- African American:- Hispanic/Latino:- Native American:- Asian American:
+47.3 percent+28.4 percent+42.9 percent+47.4 percent
20
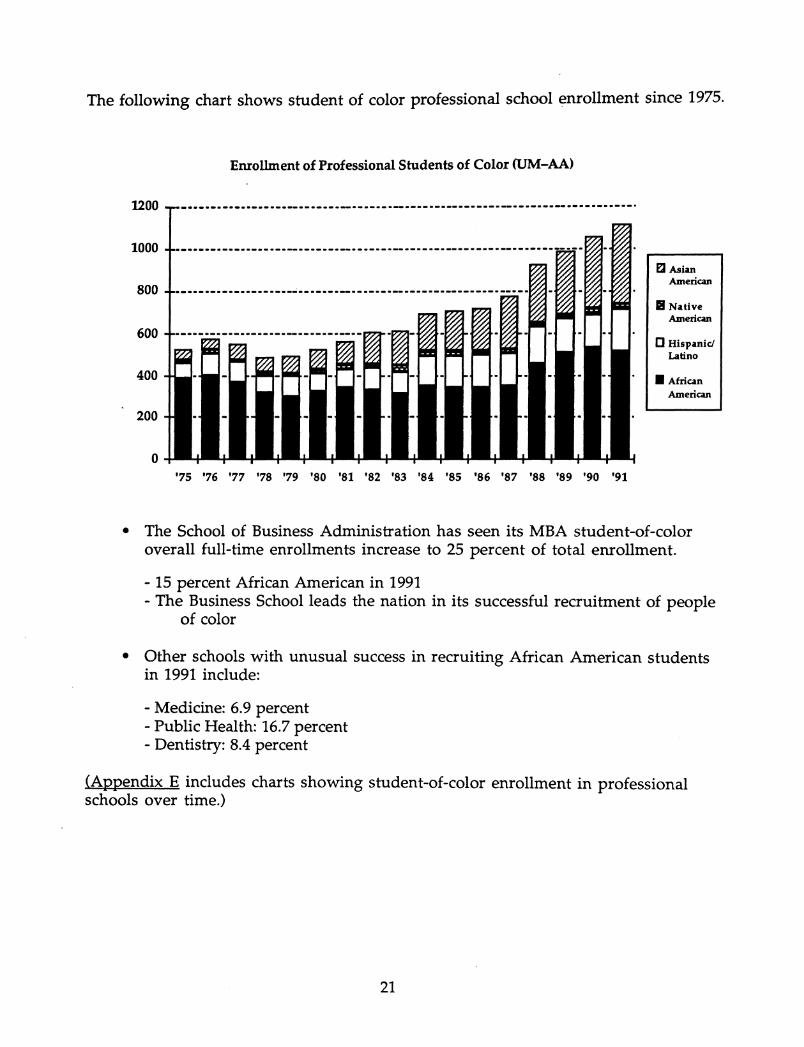
The following chart shows student of color professional school enrollment since 1975.
Enrollment of Professional Students of Color (UM-AA)
1200 _._------------------------------------------------------------------------_.
1000 -_••_----------------------------------------------------------------
800 -_.-----------------~---_.-.---_._---------------_._--------
600
400
200
o'75 '76 '77 '78 '79 '80 '81 '82 '83 '84 '85 '86 '87 '88 '89 '90 '91
E'J AsianAmerican
II NativeAmerican
[] Hispanic!Latino
• AfricanAmerican
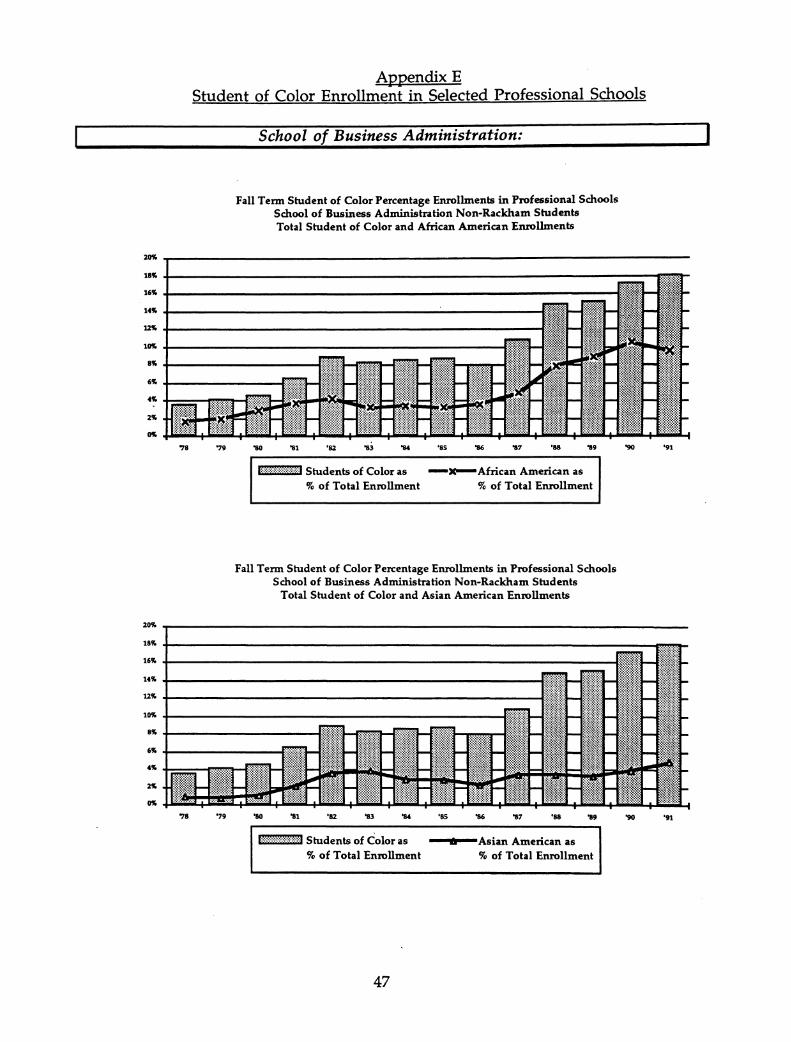
• The School of Business Administration has seen its MBA student-of-coloroverall full-time enrollments increase to 25 percent of total enrollment.
- 15 percent African American in 1991- The Business School leads the nation in its successful recruitment of people
of color
• Other schools with unusual success in recruiting African American studentsin 1991 include:
- Medicine: 6.9 percent- Public Health: 16.7 percent- Dentistry: 8.4 percent
(Appendix E includes charts showing student-of-color enrollment in professionalschools over time.)
21

Projected Future Enrollments
Since the inception of the Mandate, our student of color enrollment has grown at 10percent per year. This trend will become more difficult to sustain in the years ahead asour numbers increase: 10 percent of a small number is only a few students; 10 percentof a large number requires us to admit many more students. Still, we exceeded a 10percent increase in 1991, and the target remains a worthy benchmark and a difficultchallenge for our community. If we were able to sustain this trend, our enrollment to1995 would be as follows:
Enrollments of Students of Color (UM-AA)
6,000 • AfricanAmerican
mNativeS,OOO American
10,000
9,000
7,000
s,odo
4,000
3,000
2,000
1,000
o
E:I AsianAmerican
CHispanidLatino
Michigan Mandate Progress
in First Four Years: +53%30%
20%
10%
'75 '76 '77 '78 '79 '80 '81 '82 '83 '84 '85 'S6 'S7 'S8 '89 '90 '91 '92 '93 '94 '95
The following chart projects a similar 10 percent-per-year prorated increase for AfricanAmerican enrollment--the most underrepresented group--indicating that if we wereable to meet the increasingly difficult challenge of staying at this pace, we wouldachieve 14 percent representation by 1996, which is roughly the same as that ofMichigan's population.
4,000
3,500
3,000
2,500
2,000
1,500
1,000
500
o
African American Student Enrollments (UMAA)
I•UG 0 Grad III Prof I
22
15%
10%
5%

Other Actions Taken to Improve Student of Color Recruitment, Achievement, andOutreach:
• A broad series of outreach activities has been launched to help motivatestudents in schools and to help prepare them for college. These initiativesare beginning to show positive results:
- King-Chavez-Parks Program- Wade McCree Incentive Scholars program- Detroit Compact- Detroit Area Program in Science and Engineering- Cooperative relationships with key school systems across the state, e.g.,
Detroit, Flint, Saginaw, Ann Arbor, and with midsize community colleges- Cooperative relationships with historically African American and
predominantly Hispanic/Latino colleges and universities- Mackenzie High School writing program- Urban High School scholars program- Expansion of Alumni recruiting efforts
Outreach Program Highlights:The Nuclear Reactor Intern Program for Women and Minoritiesand The Summer Research opportunity Program for Minorities
The Nuclear Reactor Intern Program for Women and People of ColorNuclear power industry operations staffs are predominantly composed of
white males, facing, as do other areas of science and math, a critical shortage ofwomen and people of color. The Nuclear Reactor Intern Program is an effort ofMichigan's Nuclear Reactor Laboratory to address this problem. Reactor staff workwith high school students both during the academic year and in the summer;students attend classes and laboratories on a work-study basis.
We hope that some of the interns will remain at the Nuclear ReactorLaboratory as reactor operators and that they will enter college, obtaining collegedegrees. in a related field. This innovative program creates new opportunities forstudents from underrepresented groups to get hands-on experience and to get excitedabout science and engineering.
23

Outreach Program Highlights Continued:
The Summer Research Opportunity Program for Minority UndergraduatesSROP, the only undergraduate program in the Rackham Graduate School,
finished its seventh year this past summer. Created to encourage undergraduatestudents of color to consider research and graduate school, SROP matches thestudents with professor mentors for eight weeks during the summer. Eighty-sevenstudents of color participated this year, fifty-eight from UM and the rest fromnineteen other institutions. Students who participated in SROP have becomespokespersons for UM graduate schools in their home institutions, others haveended up pursuing graduate study here themselves. The response from both theprofessors and the students has been overwhelmingly positive.
The results of the program are impressive. A number of students from thispast summer will be publishing their results, under their own names or as co-authorswith their mentors. The research areas ranged from music to chemistry, English toengineering. Projects have included research on: tuning methods for pipe organs,how neurons find their targets in the zebra fish spinal cord, synthesis of precursorsfor electronic and magnetic ceramics, and the shift to supply-side economics 19771984.
Higher education faces a severe crisis because of the small number of membersof underrepresented groups completing Ph.D.'s (related chart, p. 20). SROP is animportant part of the effort to encourage students of color to pursue graduate study.
24

objective 3: Stat! Recruiting and Development
Goals:
~F:Cus on the a.ch. I.-e.v.ement of affirmative action goals in all job categories during( the next five years. )
• Increase the number of members of underrepresented groups in key Universityleadership positions.
• Strengthen support systems and services for staff of color.
• Representation of persons of color in University staffing has increased in mostareas during the first four years of the Michigan Mandate, with particularly
. strong growth at the senior manager ranks. We lost two out of three executiveofficers of color in the past year, however. This is clearly an area where weneed to concentrate more effort.
- Executive officers: -69.8 percent- Top managers: +72.4 percent- P&A: +47.4 percent
Persons of Color in Senior Management (UM-AA)
so •__ •••__ •••__ •••__ •••__ •••__•••__ •••__ ••• •••_•••_•••--- •••-•••••_•••_•••• __ •••__ •••
45 .-~ ••• -- ••• -- ••• -- ••• -- ••• --••• - •••• -- ••• -- ••• -- ••• -- ••• -- ••• -- ••• --.40 ._•••• _•••••_••• __•• ••• __••• • • •••__ • __._ •• __•• ••• __ •
35
30 .I-'-'-'--'~• .A..
2S - ..
20
15
10
5
o'81 '82 '83 '84 'S5 '86 '87 '88 '89 '90 '91
• African American [J HispanicJLatino • Native American 121 Asian American
25

100
600
500
400
300
200
100
o
Persons of Color in the P&A Staff <UM-AA)
-_._.~...__...~.._-_..--_...--.-. __...__...--...--...~...-_...__...__.._-_._--_...~...~.
'81 '82 '83 '84 '85 '86 '87 '88 '89 '90 '91
• African American [J H ispaniclLatino
26
I! Native American EI Asian American

objective 4: Improving the Environment for Diversity
Goals:
• Foster a culturally diverse environment.
• Significantly reduce the number of incidents of prejudice and discrimination.
• Increase community-wide commitment to diversity and involvement indiversity initiatives among students, faculty, and staff.
• Ensure the compatibility of University policies, procedures, and practice withthe goal of a multicultural community.
• Improve communications and interactions with and among all groups.
• Provide more opportunities [or people of color to communicate their needsand experiences and to contribute directly to the change process.
Over the past four years, the University has worked to meet its commitment to carryout the 1987 Six-Point Plan and to take other key actions to improve the environmentfor diversity. We have:
• Improved student orientation and fostered educational programs forstudents, faculty, and staff at all levels to increase understanding andsensitivity to multicultural issues.
• Set aside Martin Luther King, Jr. Day as a time for drawing the campuscommunity together in educational and commemorative activities in whichthousands of students, faculty, and staff join together.
• Divested all University stock holdings in companies with interests in SouthAfrica by action of the Regents of the University.
• Established in 1990-91 the Council for a Multicultural University to monitorprogress of recruitment and retention efforts in all academic and non-academicunits.
• Reorganized student services to create the position of Associate Dean forMulticultural Affairs to promote multiculturalism and understandingamong students.
27

Multicultural Program Highlight:Building Academic Excellence and Community in The 21st Century Program
1991-92 was the first year of The 21st Century Program. Over 250 first-yearstudents live and work together on a single wing of Markley Residence Hall, takingpart in seminars, academic workshops and other activities. The students reflect theincreasing diversity of society, and the goal through all of the Program's activities isto promote tolerance and understanding among students of different backgrounds,cultures and experiences. The Program hopes to help students acquire the thinkingand social skills that will be needed for leadership in the vastly changed andincreasingly diverse world of the coming 21st century.
The program helps to integrate students' academic and social experiences,drawing on research that indicates students do better when they work together ratherthan alone. It builds a community focused on academics within a supportiveenvironment of friends. Academic workshops emphasize this collaborativeapproach to learning, helping students on English composition, math, chemistry andphysics. In weekly community seminars, students explore important issues in societyas well as those that arise in the life of a first-year student. Starting with orientationand working throughout the year, staff concentrate on building a smaller, moreintimate, student-centered environment. Residence staff provide many educationalopportunities through programs, social events, and informal contacts withparticipants.
Very preliminary indications from the first year show that participants didbetter in class at the same time as they began the process of creating a communitywith others who were very different from themselves. Working with diverse groupsacademically helped them appreciate different skills and different approaches. Theresidents on the "21st Century" floors of Markley Hall seemed much closer thanthose on other floors and in other halls.
The Program is just a beginning, a single year out of a student's life. But it isan important example of the many varied programs being developed across campusto help students grapple with the changing world and the changing University.
28

Michigan Mandate:A Four Year Report
APPENDICES
Appendix A:
UM-AA Enrollment at All Levels by Ethnic Groups ~ 31
Appendix B:
. Enrollment Comparisons with Other Michigan Universities 34
AppendixC:
UM Student Enrollment Compared to CIC Institutions 39
Appendix D:
UM Graduation Rates Compared with Other Peer Universities 44
Appendix E:
Student of Color Enrollment in Selected Professional Schools 47
29

Appendix A
UMAA Enrollment at All Levels by Ethnic Groups
African American Student Enrollments (UM-AA)
3000
2500
2000
1500
1000
500
o
.-----_._.---_._-_...._.-.-...._._.- ...--.-.-....-._--_..._._._ ....-._-_ ....----_ .... -._. __ .
---------------------------- ..---------------_ .. _--------------_ .._-------_.-----------
'75 '76 '77 '78 '79 '80 '81 '82 '83 '84 '85 '86 '87 '88 '89 '90 '91
• Undergraduate ra Rackham Graduate [] Professional (Non-Rackham)Graduate
• The preceding chart shows African American enrollments, indicating the strongrecovery in recent years and building to the present level of:- 2,510 students- 7.6 percent of the student population.
30

HispanicJLatino Student Enrollments (UM-AA)
1400 ._••_._._._ •• _._._. __ ._._.-. __ ._._._. __ .-._.-.-_._.-.-. __ ._.-._.-_.-.-._. __ ._._.-. __ ._.-.- •.
1200 ._•• _._.-._ ••-.-.-.-_._._.-. __ ._._._.__ .-.-._. __ ._._.-. __ ._.-._.-_.-._._. __ ._._.-. __ .-
1000 ._••_._._._ ••_.-.-.--._._.-. __ ._._._. __ .-._._.-_._.-.-.__ ._.-._.-_.-._._. __ ._._.-
800 ••••_._._._.__._._. __ ._._.-. __ ._._._. __ .-._._._•• _.-.-. __ ._.-._.__ .-.-
600
400
200
o'75 '76 '77 '78 '79 '80 '81 '82 '83 '84 '85 '86 '87 '88 '89 '90 '91
• Undergraduate rJ Rackham Graduate o Professional (Nori-Rackham)Graduate
• Hispanic/Latino enrollments have grown steadily since the mid-1980s and nowstand at:. 1,240 students• 3.8 percent of the student population.
Native American Student Enrollments (UM-AA)
200
180
160
140
120
100
80
60
40
20
o
-------- .._------ .._----------------------------------. - . _ . _ - -- - _ . _ - - - -- - - - - - - - - - . ~ . _ - -
'75 '76 '77 '78 '79 '80 '81 '82 '83 '84 '85 '86 '87 '88 '89 '90 '91
II Undergraduate fa Rackham Graduate o Professional (Non-Rackham)Graduate
• Native American enrollments have grown by 20.4 percent to their present level of:- 189 students- 0.6 percent of total enrollment.
31

3000
2500
2000
1500
1000
500
o
Asian American Student Enrollments (UM--AA) .
---_._------------ _._._--_._.- -._._.---_._.-.._---_. __ _._._------------------_.
----_._._._----_._._------_..._--_. __...-._._...._----...--------.._-------------
'75 '76 '77 '78 '79 '80 '81 '82 '83 '84 '85 '86 '87 '88 '89 '90 '91
• Undergraduate fJ Rackham Graduate o Professional (Non-Rackham)Graduate
• Asian American enrollments have been growing steadily for some time, nowstanding at:- 2,697 students- 8.2 percent of the student population.
32

Appendix B
Enrollment Comparisons with Other Michigan Universities
It is instructive to compare the current status of student enrollments with data from otherMichigan universities.
Percentage Total Enrollments of Students of ColorMichigan Public Universities, Fall 1991
35%
30%
25%
20%
15%
10%
5%
0%
-------------_._-_._.-._-----_._---------_._---_.---.-._-_.-.-._._----.-._._._._._._---_._.
._.----_._._.-._-_._----------------------------------._-_.-._.-._.-._-_._._---_.-.----
._.-._._..._.-.-.- ..._.-.-.-._.-._._._._.-...-._.-_ ..-._._._._.-._.-._._._._.-._.-._.-.
._._._._._.-._---_._-_._-_._-----_._._-----_._._._._.-._.-._.-._._._._._._---_.--
._._._._._.-._._._._.----_._._._._._._.-._.-._._._._.-._.---.-._._._._.-._-_._.--
ws
UMA
UMD
MS
UMF
EM
sV
ou
FS
WM
LS
GV
NM
CM
MT
UM ranks second among Michigan universities in the absolute number of students of colorenrolled as indicated in the following:
Total Enrollments of Students of ColorMichigan Public Universities, Fall 1991
10000
9000
8000
7000
6000
5000
4000
3000
2000
1000
ows
UMA
M5
EM
WM
ou
33
FS
UMD
cv
CM
UMF
5V
NM
MT
L5

With the exception of Wayne State University, UM's percentage enrollment of AfricanAmerican students is comparable to those of the state's other major universities at roughly8 percent.
Percentage African American EnrollmentsMichigan Public Universities, Fall 1991
25%
20%
15%
10%
5%
0%
-----------------------------------------_._------_._.---_.-------_._._.----._-------------
._._._--_._------_._._--------_._--_.-._----_._._._---._.-----_._._--------_._--_._----
_._.-. __.-.-.-.__ .-~_._. __._-_.-.__ ._._.-.__ .-._._.__.. _._._-----------_._._-----------
....._--_._._._-_.._..._--_._._._--_._..._--_._._._---..._.._-_ ...-.---_.-..._--_._...-
ws
UMF
EM
UMA
FS
M US . M
D
oU
SV
WM
GV
CM
NM
MT
LS
A similar ranking holds for the absolute number of African American students enrolled,with UM and MSU roughly comparable because of their size.
Total African American EnrollmentsMichigan Public Universities, Fal11991
8000
7000
6000
sooo
4000
3000
2000
1000
ows
M5
UMA
EM
WM
FS
ou
34
GV
UMD
UMF
CM
sv
NM
MT
L5

UM now ranks first among state institutions in Hispanic/Latinopercentage:
Percentage Hispanic/Latino EnrollmentsMichigan Public Universities, Fall 1991
4% --_ ••_.-_._••-. __._••_._-.-.-_.- ••_. __.- ••_. __.-••-._-._---.-_.---_. __._. __.- •• _. __.-•• _. __._-
3% ••-._-.-._-.-_._.-_._--_. __.---_. __.---_.__._•• -.-_._.--.-_.-. __.---_._•• ---_.-_._.
2%
1%
0%
UMA
sV
UMo
ws
M GS . V
EM
UMF
CM
WM
ou
FS
LS
MT
NM
UMAA also ranks first, by a sizeable margin, in total number of Hispanic/Latino students:
Hispanic/Latino EnrollmentsMichigan Public Universities, Fall 1991
1400
1200
1000
800
600
400
200
oUMA
MS
ws
EM
WM
CM
sV
35
GV
UMD
ou
FS
UMF
NM
MT
LS

Because of its location in the Upper Peninsula, Lake Superior State University enrolls by farthe largest percentage of Native American students, followed by Northern MichiganUniversity. UM is comparable to other major institutions in the state with roughly 0.6percent Native American enrollment.
Percentage Native American EnrollmentsMichigan Public Universities, Fall 1991
6% .-.-.-.-.-.-.-.-.---.-.-.-.-.-.-.-.-.-.-.-.-.-.-.-.---.-._.-.-.-.----------------_.----_._-_.
5%
4%
3%
2%
-1%
0%
LS
NM
MT
CM
UMF
UMD
FS
sV
U MM SA
GV
w wS M
EM
ou
Once again, because of its size, UM fares somewhat better in comparisons of absolutenumber of Native American students enrolled.
Native American EnrollmentsMichigan Public Universities, Fall 1991
250 ._. __ .-._._. __ ._._._. __ .-.-.-.__ ._.-._. __ ._._._.--._.-.-. __ .-._._. __ .-._._•• -._._._ ••-.-._. __
200
150
100
50
o
----------_.------------._------------._._..._--------._._._---.-._._-------------------
-----_ .._-----_ .._----_ ..._--_. __.---._----------_.
M U N WS M M S
A
LS
c WM M
36
FS
EM
GV
UMD
M UT M
F
SV
oU

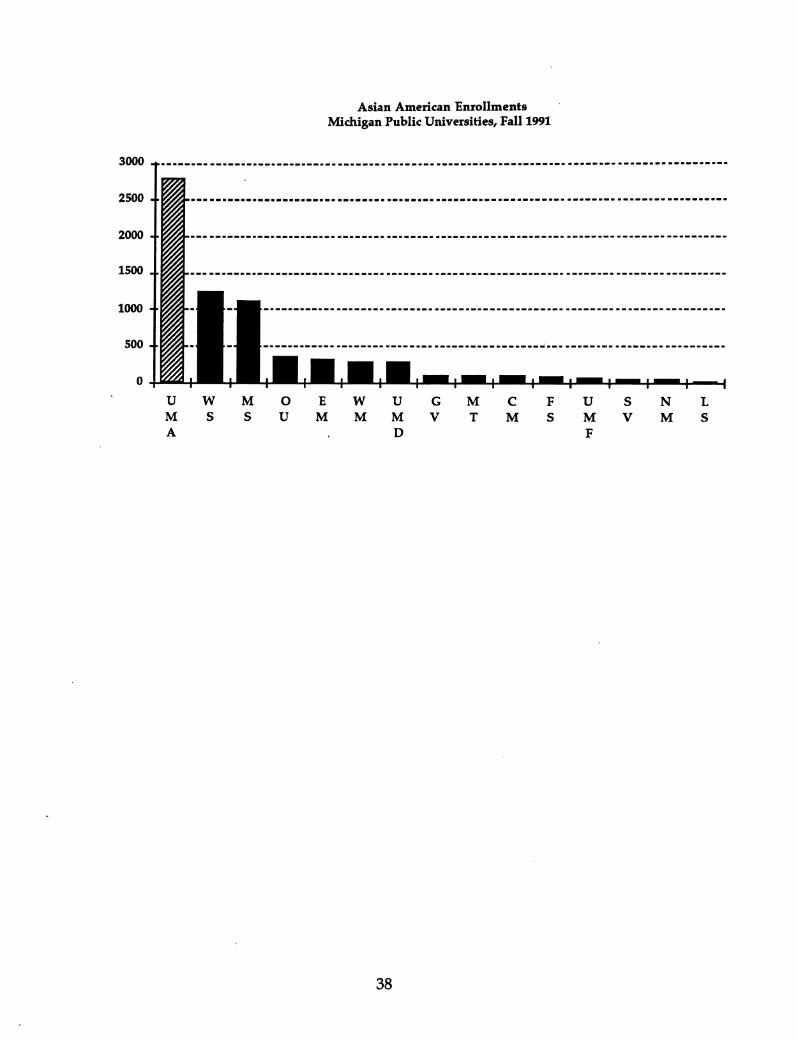
UM leads, both in percentage and absolute numbers, in the enrollment of Asian Americanstudents. This is due primarily to the University's high national visibility which attractsoutstanding students from all parts of the nation, including the West Coast which has largeAsian American populations.
Percentage Asian American EnrollmentsMichigan Public Universities, Fall 1991
9%
8%
7%
6%
5%
4%
3%
2%
1%
0%
u WM SA
UMD
ou
MS
M ET M
37
WM
UMF
GV
sV
FS
CM
LS
NM
3000
2500
2000
1500
1000
500
o
Asian American EnrollmentsMichigan Public Universities, Fall 1991
_._----------_._----------_ ..._---_...-----....------.----------_..._---_...--_....._--_._.-
._-------_...._---_..._--_...._---------------_...._-- .-.._.__ .~..-._--_._.
UMA
ws
MS
ou
EM
WM
UMD
38
GV
MT
CM
FS
UMF
sV
NM
LS

Appendix e
UM Student Enrollment Compared to eIC Institutions
The University of Michigan compares quite favorably with eIe institutions (Big Ten andthe University of Chicago), both in percentage and absolute number of students of colorenrolled, ranking at or near the top in both categories.
Percentage Total Student of Color Enrollmentsere Institutions, Fall 1991
25% .....--------------------------------
20%
15%
10%
5%
0%
w. UMAA NWIN OIIC osu PDUE ]NO PENN DWA W1SC MINN
Total Student of Color Enrollmentsere Institutions, Fall 1991
7000
6000
5000
4000
3000
2000
1000
0
l1MAA Dl. osu MSU MINN roUE
39
PENN NWTN WISC IND DWA ouc

The University of Michigan also clearly ranks as a leader in its enrollment of AfricanAmerican students among CIC institutions.
Percentage African American EnrollmentsDC Institutions, Fall 1991
8%
7%
6%
5%
4%
3%
2%
1%
0%UMM MSV NWTN IlL
African American EnrollmentsDC Institutions, Fall 1991
3500
3000
2500
2000
1500
1000
500
0
MSV osu UMAA DJ.
40

A similar situation applies to Hispanic/Latino students, in which the University ofMichigan again ranks second in both percentage and absolute number enrolled:
Percentage HispaniclLatino Enrollmentsere Institutions, Fall 1991
5% ~---------------------------------
4%
3%
2%
1%
0%
one NWTN MSU WISC DWA PDVE IND OSU MINN
HispaniclLatino Enrollmentsere Institutions, Fall 1991
1400~~~---------------------------~--
1200
1000
800
600
400
200
oDJ. MSU OSU WISC
41
PDVE MINN IND DNA CHIC

The University of Michigan also ranks among the leaders among eIe institutions in thepercentage and number of Native American students enrolled.
Percentage Native American EnrollmentsOC Institutions, Fall 1991
0.7% ..----------------------------------
0.6% +- _
0.5%
0.4%
0.3%
0.2%
0.1%
0.0%
UMAA MlNN MSlJ WISe PDUE DWA NWTN IND osu PENN one n.L
Native American EnrollmentsDC Institutions, Fall 1991
300 ,.---------------------------- _
250
200
150
100
50
oMINN MSU WlSC PDUE
42
osu PENN IND JIL ane

The University of Michigan ranks among the leaders in both percentage and absolutenumber of Asian American students enrolled.
Percentage Asian American Enrollmentsere Institutions, Fall 1991
U%-r-----------------------------------10%
8%
6%
4%
0%CHIC NWTN IlL MINN WlSC PENN PDUE OVA OSU MSU IND
Asian American Enrollmentsere Institutions, Fall 1991
3500 .---------------------------------
3000
2500
2000
1500
1000
soo
oIlL MINN NWfN osu
43
WISC PENN PDUE one MSU IND DWA

Appendix D
UM Graduation Rates Compared with Other Peer Universities
1990Six-Year Graduation Rate for All StudentsU of Michigan-Ann Arbor and OC Institutions"
90%80%70%60%50%40%30%20%10%
0%
_._--_._._.-_._._. __ ._._._.._._.-. __._._._.._._._.-_._._.-.._._._.-.._._._-._._.-. __ ._._.
UM-AA U-IIlinois Purdue UWisconsin
MSU U-Iowa Indiana U OSU UMinnesota
Source: Chronicle of Higher Education 1n.S/92 "Data not available for Penn State, Northwestern or U of Chicago
70%
60%
50%
40%
30%
20%
10%
0%
African American 1990 Six-Year Graduation RateU of Michigan-Ann Arbor and CIC Institutions"
t~~·__·_·_------_· __ ·-_·_-·_·--------_·_--·-··-_·_----.--.--------.. -.. -.. --.-----.--
UM-AA Purdue U-Illinois U-Wisconsin
MSU U-Iowa osu Indiana U U-Minnesota
Source: The Chronicle of Higher Education 1/15192
44
-Data not available for Penn State, Northwestern, or U of Chicago

70%
60%
50%
40%
30%
20%
10%
0%
HispaniclLatino 1990 Six-Year Graduation RateU of Michigan-Ann Arbor and DC Institutions"
-_.-.._.._..--.~_. __ .-_.._.._..-..-..-.._..--.--. __.._..- ..-.. -.._....._---------_ ..._._ ..
--_ _ _ _----_.---------_ ..
UM-AA U-Illinois U-Wisconsin
Purdue U-Iowa OSU MSU Indiana U U-Minnesota
Source: The Chronicle of Higher Education 7115192 ·Data not available for Penn State, Northwestern or U of Chicago
Native American 1990 Six-Year Graduation RateU of Michigan-Ann Arbor and DC Institutions"
80%70%
60%50%
40%
30%20%
10%0%
UM-AA U-Illinois U-Iowa Pwdue UWisconsin
MSU OSU U- Indiana UMinnesota
Source: The Chronicle of Higher Eduation 7/1S192
45
·Data not available for Penn State, Northwestern or U of Chicago

Asian American 1990 Six-Year Graduation RateU of Michigan-Ann Arbor and DC Institutlons"
_._.._.._..~. __.~. __..-..__ ._.._. __.__..--. __.__.._..-.._.._.._..-_.~.--.--_._.-_.-_..90%80%70%60%50%40%30%20%10%
0%UM-AA Purdue U-Illinois MSU Indiana U U-
WisoonsinU-Iowa osu U..
Minnesota
Source: The Chronicle of Higher Education 1115/92 ·Data not available for Penn State, Northwestern or U of Chicago
White 1990 Six-Year Graduation RateU of Michigan-Ann Arbor and OC Institutions"
90%80%70%60%50%40%30%20%10%
0%UM..AA U-Illinois Purdue MSU U ..
Wisconsin
U..Iowa Indiana U osu uMinnesota
Source: The Chronicle of Higher Education 7/15/92
46
-Data not available for Penn State, Northwestern or U of Chicago
2M,
Appendix EStudent of Color Enrollment in Selected Professional Schools
School of Business Administration:
Fall Term Student of Color Percentage Enrollments in Professional SchoolsSchool of Business Administration Non-Rackham StudentsTotal Student of Color and African American Enrollments
1:·:·:;:·:;:·:·:·:;:·:;:;:;:;:;:1 Students of Color as
% of Total Enrollment-x-African American as
% of Total Enrollment
Fall Term Student of Color Percentage Enrollments in Professional SchoolsSchool of Business Administration Non-Rackham Students
Total Student of Color and Asian American Enrollments
181.
161.
81.
6"
...,8 '79 '81 '82 '83 'SS
11'87
III'88 '89 '91
I:·:·;·:·:·:·:·:·:·:·:·:·:·:·:·:' Students of Color as
% of Total Enrollment
47
6

Fall Term Student of Color Percentage Enrollments in Professional SchoolsSchool of Business Administration Non-Rackham Students
Total Student of Color and HispanidLatino Enrollments
'91
I:::::::::::::::::::::::::::::::' Students of Color as% of Total Enrollment
Dental School:
=
25cx,
IScx,
10ge
Fall Term Student of Color Percentage Enrollments in Professional SchoolsDental School Non-Rackham Students
Total Student of Color and African American Enrollments
II ~II~II--I- - ~
~•I-- .~·:ll~11.....
I I~I--
I..-- ~ ~
Iiii • • ill mmm: -
I~
lit:: l'ill :111I--
IIII-
~ll--
:IIJII';I
~
li!I]!)1
~ ~ ~ I-- ~ l-- - ~ ~
~Ill.~:·.'18 '19 '80 '81 '82 '83 185 '81 '88 '89 191
I:::::::::::::::::::::::::::::::' Students of Color as
% of Total Enrollment
48
-X-African American as% of Total Enrollment

Fall Term Students of Color Percentage Enrollments in Professional SchoolsDental School Non-Rackham Students
Total Student of Color and Asian American Enrollments
~[f It-86 "81 -as "9 '90
,.:.:.:.:.:.:.:.:.:.:.:.:;:.:.:j Students of Color as% of Total Enrollment
6
Fall Term Student of Color Percentage Enrollments in Professional SchoolsDental School Non-Rackham Students
Total Student of Color and HispanicJLatino Enrollments
•S~
1111111111
• • •:.:.:.:.:.:.:.:."18 -'9 -so "81 -81 -sJ -85 '81 '89 "90 -91
a--eJ--HispanidLatino as% of Total Enrollment
I:::::::::::::::::::::::::::::::. Students of Color as
% of Total Enrollment
49

Law School:
Fall Term Student of Color Percentage Enrollments in Professional SchoolsLaw School Non-Rackham Students
Total Student of Color and African American Enrollments
18"
10'lt
2" (ilil'80
II'81
IIIllil
'82
III'8S '81 '88 '89 '91
1:.:.:;:.:·:·:·:;:.:·:·:·:;:;:;:1 Students of Color as% of Total Enrollment
-X-African American as% of Total Enrollment
20'lt
18"
14"
1~
Fall Term Student of Color Percentage Enrollments in Professional SchoolsLaw School Non-Rackham Students
Total Student of Color and Asian American Enrollments
~ --
~ ~ :~II! ..-I ~ -
:1.-
~ 100- '- ~
II-- -- -- ~
II. II-- l-- -- ~ 100- ~ ~ I-- 1~1~~~~~~~~~-- - ...
100- ~ I-- ~ - ~ ~ 100- ~ ~ I--
I~ - I-
,... I-- ... ~ - ,.-. I-- ... ~ 10- ~ -- II- ~
100- - 100- ~ - - -- 100- I-- ~ ...... -- - -:::::::.::::;::
III-- - I--
f1lft i~1~Iim~i@i j1l~iiii!i!~ l@I~ij~ """""""'" j!~li! -- - -...~.: Ji1ilit:im iji1tii;ijij i1@imi'18 '19 '80 '81 '82 'SS '81 '88 '89 '91
1;:;:;:;:;:;:;:;:·:·:;:;:;:1:::;1 Students of Color as
% of Total Enrollment
50
6

18"
Fall Term Student of Color Percentage Enrollments in Professional SchoolsLaw School Non-Rackham Students
Total Student of Color and Hispanic1Latino Enrollments
i1f..::o:::~..~
~.............
~
-
I- - -
I~I~I- - - - -
I~- - - - - - -- - - - - - -
I 1=...-
I- I =~I--II{i- _: --I ~ ll"l~II~ ~ ~ ~
'19 '81 '82 '83 'SS '88 '91
I:::::::·:::::::.:::·:::·:·:·:::, Students of Color as
% of Total Enrollment
Medical School:
D
Fall Term Student of Color Percentage Enrollments in Professional SchoolsMedical School Non-Rackham Students
Total Student of Color and African American Enrollments
'18 '19 '81 '82 '83 '89 '90
II:::::·:::::::::·:·:;:·:·:·:::·j Students of Color as
% of Total Enrollment
51
-x-African American as% of Total Enrollment

Fall Term Student of Color Percentage Enrollments in Professional SchoolsMedical School Non-Rackham Students
Total Student of Color and Asian American Enrollments
I:::·:·:::::·:::::::::::::::·:::, Students of Color as
% of Total Enrollment6
Fall Term Student of Color Percentage Enrollments in Professional SchoolsMedical School Non-Rackham Students
Total Student of Color and HispaniclLatino Enrollments
-- - - - -
I-- I-- - - - -
I~
I~ I-- I-- - - - -
I- I-- ~ -- ~ 1--0 - ~• ~
I....I -1=I - III- I-- I-- ~ 100- '-' 1--0 .... ~ ~
I-- - - - - .;::::':':':;::: -- l-- L.-- ·1~
:::::::::::::::; j@mml 1\~\~\~\1\~\1\1 ~~~1\1~1~\~jr \imtm ~tm~m~m ~m]mm l~;~~~\j................ .......... ..~... ::::::::::::::::
'79 '80 '81 '82 '83 '85 '86 '88 '90 '91
'.:.:.:.:.:.:.:.:.:.:.:.:.:.:.:.' Students of Color as% of Total Enrollment
52
=
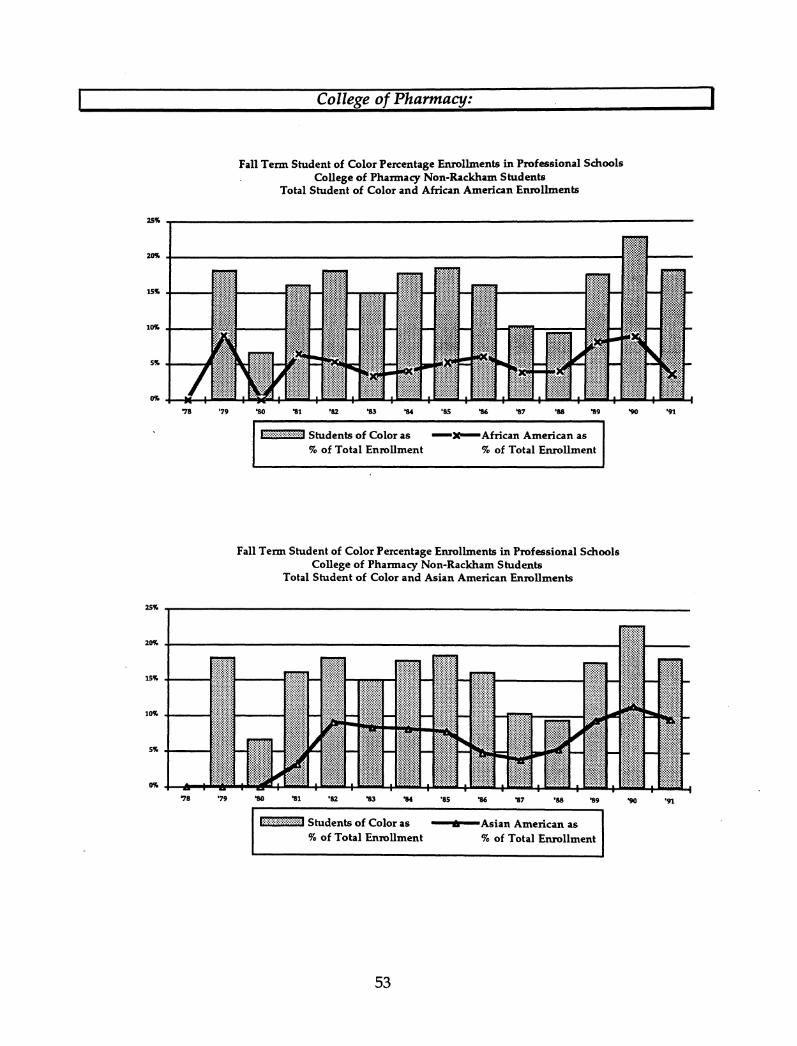
College of Pharmacy:
Fall Term Student of Color Percentage Enrollments in Professional SchoolsCollege of Pharmacy Non-Rackham Students
Total Student of Color and African American Enrollments
fi;;:f:·:·:;:-:·:-:·:·:·:·:i' Students of Color as% of Total Enrollment
-X-African American as% of Total Enrollment
Fall Term Student of Color Percentage Enrollments in Professional SchoolsCollege of Pharmacy Non-Rackham Students
Total Student of Color and Asian American Enrollments
5.-
.,8 79 '80 '81 '82
I1III
I'83
!lilI
I·:·:·:;:·:;:·:·:·:·:·:·:·:·:·:;, Students of Color as
% of Total Enrollment
53
a

Fall Term Student of Color Percentage Enrollments in Professional SchoolsCollege of Pharmacy Non-Rackham Students
Total Student of Color and HispanidLatino Enrollments
,.:.:;:.:.:.:.:.:.:;:.:.:.:.:.:., Students of Color as% of Total Enrollment
c
School of Public Health:
Fall Term Student of Color Percentage Enrollments in Professional SchoolsSchool of Public Health Non-Rackham Students
Total Student of Color and African American Enrollments
'·:·:·:·:·:·:·:·:·:·:·:·:·:·:·:1 Students of Color as% of Total Enrollment
54
-x-African American as% of Total Enrollment
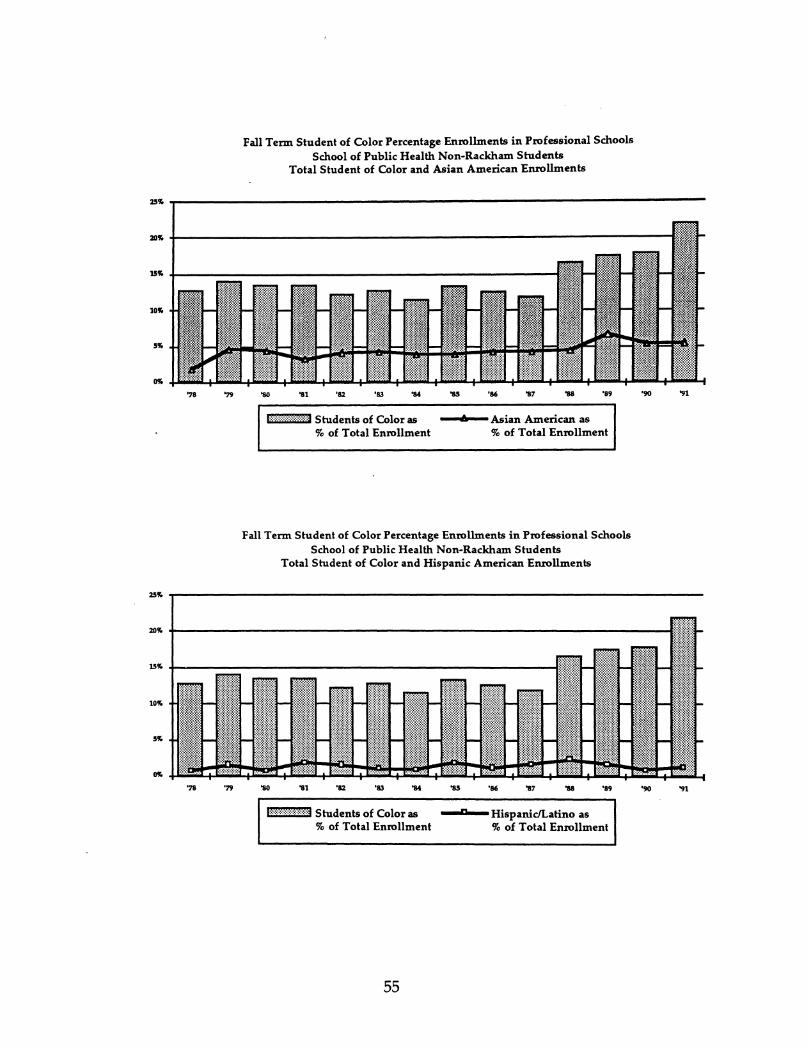
Fall Term Student of Color Percentage Enrollments in Professional SchoolsSchool of Public Health Non-Rackham Students
Total Student of Color and Asian American Enrollments
'18 '19 '80 '81
I I I I Iill;.!;11 !1~f~1"i !t.t~ :I'~~ II~ Ill! 11~'t182 '&3 '84 '85 186 '81 '88 '89 '90
I,'91
,.:.:.:.:.:.:.:.:.:.:.:.:.:.:.:j Students of Color as
% of Total Enrollment6
10"-
Fall Term Student of Color Percentage Enrollments in Professional SchoolsSchool of Public Health Non-Rackham Students
Total Student of Color and Hispanic American Enrollments
l-
I-- ~ I-- l-• .~ 1m
I~:
ITim
I-
I~
[[II.
~
il~ i"-
111
1I-- ~
:1"- ~ - 10- ~ - I-
- - - - ~ ~ .... .... ~ ..... - '"- ... ~
.::::::::::::::: ~ :::::::::::::::: ::::::::::::::: ........,....-, ...... ., ....: .:::::~::;::::: .:~: ::::::::::;::::: ;;;;;;t1;~; :::::~::::::::: :....~.... ..'18 '19 '80 '81 '82 '&3 '86 '81 '88 '89 '90
I:.:.:.:.:.:.:;:;:.:;:.:.:.:.:.j Students of Color as% of Total Enrollment
55
c