
Progress Report on DE-FG07-96-RTl4725: Nathan S. Lewis .../67531/metadc618970/m2/1/high... · The...
41
Progress Report on DE-FG07-96-RTl4725: “Investigation of Novel Electrode Materials for Electrochemically Based Remediation of High and Low-Level Mixed Wastes in the DOE Complex” Nathan S. Lewis Division of Chemistry and Chemical Engineering California Institute of Technology Pasadena, CA 91125 Marc A. Anderson Water Chemistry Program University of Wisconsin-Madison Madison, WI 35706
Transcript of Progress Report on DE-FG07-96-RTl4725: Nathan S. Lewis .../67531/metadc618970/m2/1/high... · The...

Progress Report on DE-FG07-96-RTl4725:
“Investigation of Novel Electrode Materials for Electrochemically Based
Remediation of High and Low-Level Mixed Wastes in the DOE Complex”
Nathan S. Lewis
Division of Chemistry and Chemical Engineering
California Institute of Technology
Pasadena, CA 91125
Marc A. Anderson
Water Chemistry Program
University of Wisconsin-Madison
Madison, WI 35706

This work is focused on the preparation of novel electrode materials for the
degradation of toxic wastes in the DOE complex. One of the goals of this work is to
characterize whether it is possible to use controlled doping of TiO2 with species such as Nb
in order to create new electrode materials that will facilitate the destruction of undesirable
organics and inorganics, without light and instead only with an applied potential, in the waste
tanks at the DOE sites. In the first part of this project, we have therefore spent an extensive
amount of effort characterizing, as a baseline. the chemical and electrochemical behavior of
TiO2 itself, so that we can make robust comparisons to the behavior of the Nb-doped
systems in subsequent work on this project. The preparation of these electrode films is
being performed by Marc Anderson at Wisconsin. who is preparing a number of different
stoichiometries, grain sizes, etc. for investigation of their electrochemical properties by the
Lewis group at Caltech. First we report on the progress of the electrode preparation work.
and then we describe progress on the electrochemical work.

INTRODUCTION
Several types of metallic supports have been coated with suspensions of various metal
oxides. In this report, we describe studies in which titania has been coated on copper, aluminium,
stainless steel, and titanium supports for further testing in photoelectrocatalytic systems.
EXPERIMENTAL
Reagents
All chemicals (Aldrich Chemical Co. and Fisher Scientific Co.) were used without further
purification. The water was deionized using a Barnstead NANO pure UV ultrapure water system.
TiO2 Sol Preparation and Characterization
Sol-gel processing techniques were employed to prepare three different titania sols (two
aqueous-based and one alcoholic-based) for use in this study (l-2). An aqueous-based sol was
prepared by mixing H2O, titanium isopropoxide (Ti(i-OPr)4) and conc. HNO3 in a volume ratio
of 300/24.75/2.1 with rapid stirring at room temperature. The resulting precipitate of titania was
peptized by continuing to stir for 3 days until a stable suspension was obtained. This acid
suspension was then dialyzed to a pH of 3.5 (3).
Another aqueous-based sol was prepared by mixing H2O, Ti(i-OPr)4 and conc.HNO3, in
a volume ratio of 300/30/2, with rapid stirring at room temperature: the resulting precipitate was
peptized by refluxing the mixture at 80 °C for three days (3). This aqueous sol was used only to
coat some samples of 304 stainless steel.
In addition, an alcohol-based sol was prepared. An alcohol exchange reaction was
employed to convert Ti(i-OPr)4 to the tertiary amyl alcohol (t-AmOH) analogue (4). The titania
sol was then prepared by adding, with stirring, a solution of 0.72 ml of water in 49.28 mL of t-
AmOH to a solution of 9.32 mL of Ti(t-OAm)4 in 40.68 mL of t-AmOH at room temperature.

Xerogels of the aqueous based sol were prepared by allowing the solvent to evaporate
slowly at room temperature. Porosities and surface areas of the unsupported xerogels after firing
at different temperatures were determined by BET analysis of nitrogen adsorption isotherms. The
particle size distribution in both sols was measured by laser light scattering (Brookhaven
Instruments Corp.).
TiO2 Thin-Film Preparation and Characterization
Plates of copper, aluminium, 304 stainless steel and titanium (Goodfellow Cambridge
Limited) measuring 50x100x0.5 mm were prepared. Copper and aluminium plates were cleaned
by placing them in acetone in an ultrasonic bath for 15 min. Titanium and stainless steel plates
were first polished with Hope’s stainless steel polish (The Hope Company, Inc., Bridgeton, MO).
Then these plates were cleaned ultrasonically with acetone as explained above. The final steps in
preparing the titanium plates were to dip them in hot 50 vol% hydrochloric acid for 2 min and
rinse them with MilliQ water.
Aluminium, copper and titanium plates were dip-coated (withdrawal speed: 1.5 cm min-1)
with a single layer of the alcohol-based sol and fired at 450 °C for 1 h. Coated copper plates
were not treated further. Coated aluminium and titanium plates were dip-coated a second time (at
the same withdrawal speed) with a single layer of dialyzed aqueous-based TiOz sol and fired at
either 300, 400 or 500 ºC for 5 h. In some cases this procedure was repeated to deposit more
layers of TiO2.
Stainless steel plates were first fired at 450 °C for 2 h, in order to produce a metal oxide
film that improved the adherence of the titania coating to the substrate (5). These pre-treated
plates were dip-coated (same withdrawal speed) with one layer of the dialyzed aqueous-based sol
and fired at either 300 or 500 °C for 2 h. In some cases this procedure was repeated to deposit
more layers of TiO2.
In order to study the inhibition of corrosion, samples of bare stainless steel were fired at
450 °C for 2 h, after which they were coated with several layers of the various titania sols and
then fired at 500 °C for 5 h. One additional sample, coated with the sol that was peptized at 80
°C, was fired at 700 °C for 5 h.
2

The surfaces of these photoelectrodes were characterized with scanning electron
microscopy (SEM), while the crystal structure of the deposited coatings was determined by X-
ray diffraction (XRD) analysis of the film.
Reactor System and Auxiliary Equipment
Studies were conducted in a batch reactor system whose principal components were a
borosilicate glass rectangular reactor vessel 55x66x25 mm (Vitro Corn Inc., Mountain Lakes,
NJ), placed 10 cm in front of a 15 W fluorescent ultraviolet bulb (General Electric, F15T8.BLB).
The reactor and the lamp were placed in a black acrylic box in order to avoid extraneous
illumination. A plastic cap was placed on the reactor in order to seal it and hold three electrodes.
Initially, 70 mL of test solution was put in the reactor, which allowed 25 cm2 of the supported
TiO2 film to be immersed into the solution. The intensity of light striking the electrode was 1.35
mW cm-2, as measured by a photometer (International Light Inc., Model IL 1400A). Electrical
potentials in the reactor were controlled by a potentiostat (IBM, EC/225) that was connected to a
counter electrode (platinum mesh 20x50 mm), a working electrode (metal-supported TiO2film),
and a reference electrode (saturated calomel). All potentials are reported relative to that of the
saturated calomel electrode.
Photoelectrocatalytic Reactions
The photoelectrocatalytic degradation of formic acid was conducted in the reactor system
described above. Given potentials were applied with the three electrode system to perform
photoelectrocatalytic reactions. Tests were conducted using aqueous solutions of formic acid (25
ppm as C) in 0.01 mol dm-3 NaCl. Oxygen was bubbled through the test solutions during all
reactions. In each experiment two samples were taken at a given time; the first set of samples
was obtained 15 min after the UV light was turned on (to allow the system to stabilize), while the
second set of samples was obtained three hours after the UV light was turned on. In order to
characterise the behaviour of the titania coatings that were placed on various metallic electrodes,
two properties of these photoelectrodes were monitored. One property was the photocatalytic
3

activity of the electrode under set operating conditions. This property was measured by
determining the percentage of degradation in each experiment as calculated from the change in
the average concentration of total organic carbon (TOC) in each sample after illumination for 3
h. TOC values were measured with a TOC analyzer (Shimadzu Instruments, Model TOC 5000).
A second property of interest was the stability of the photoelectrodes. This property was
determined by measuring the photocatalytic activity of each photoelectrode, at least three
separate times, at an applied potential of +0.5 V (vs SCE), and noting if any changes in activity
occurred in the different measurements over time.
RESULTS
Stability and Activity of Copper-Supported Photoelectrodes
To date all the attempts to produce a stable coating of titania on a copper plate have been
unsuccessful. It appears that a layer of CuO forms underneath the coating of titania. This layer of
CuO readily delaminates during testing, resulting in the loss of the titania coating.
Stability and Activity of Aluminium-Supported Photoelectrodes
TiOz supported on aluminium displays photocatalytic and photoelectrocatalytic activity,
but the TiO2 coated aluminium electrodes corrode after several hours of use. Scanning electron
micrographs of these photoelectrodes indicate that the TiO2 coating is deposited uniformly on the
aluminium surface before use (see Figure la). However. after use, much of the TiO2 coating has
delaminated from the substrate, and the substrate itself displays significant amounts of pitting
and corrosion (Figure lb). The application of a positive potential across the photoelectrodes
accelerates the corrosion process and Al(III) is released to the solution. For example, when +0.30
V were applied across a TiO2 coated aluminium electrode, 101 ppm of Al (III) were found in the
solution after 12 h of treatment.
Corrosion was observed when the bare aluminium substrate was placed in contact with
the test solution (25 ppm, as C, formic acid in 0.01 mol dm-3 NaCl) in the presence of O2 and UV

light (Figure 1c). The corrosion of these electrodes was so severe that it could be observed
visually. The extent of corrosion may be related to the test solution being treated. Less corrosion
might be observed if less aggressive test solutions were employed. Thus it appears that Al-
supported TiO2 electrodes are not suitable for this application. No further studies were conducted
with this system.
Stability and Activity of Stainless Steel-Supported Photoelectrodes
Photomicrographs of the surfaces of the fired 304 stainless steel plates (304 SS) before
coating indicate that these surfaces are covered by numerous fine particles (ca. 100 nm diameter).
The source of these particles has not been identified. They could be either material that was
deposited while polishing these plates or small iron oxide particles formed on the surface. When
the surface of the stainless steel is coated with an aqueous-based dialyzed sol of TiO2, the
resulting film follows the contours of the surface of the metal and covers the particles that are
present on that surface. These coatings are quite thin; a coating prepared by depositing two layers
of alcohol-based sol and firing at 500 °C for 5 h was less than 100 nm thick (see Figure 2).
TiO2 supported on stainless steel electrodes has been used previously to study the purely
photocatalytic degradation of formic acid and malic acid (5,6). We employed this material to
study both photocatalytic and photoelectrocatalytic processes.
When the photoelectrodes prepared for this study were tested for purely photocatalytic
activity (i.e. no applied potential), such activity was observed. An average of 5.5% of the initial
formic acid present in the solution was degraded in a three hour period, when a photoelectrode
coated with one layer of the dialyzed aqueous TiO2 sol and fired at 300 °C was used. When an
electrode with 6 layers of dialyzed aqueous TiO2 sol that was fired at the same temperature was
used. the percentage degraded in the same period was 30%. Photomicrographs of the surface
indicate that no observable change occurred during these tests. In the case of an electrode coated
with one layer of dialyzed aqueous TiO2 sol and fired at 500 ºC, only 1% of the initial formic
acid was degraded in three hours.
5

However. when the same electrodes were employed as photoanodes, they were observed
to corrode under applied potentials more positive than 0.0 V. The corrosion was obvious,
because the oxidized iron caused the test solution to turn red-orange.
In an attempt to prevent the dissolution of the metallic substrate by isolating the stainless
steel from the solution, additional samples coated with each type of the different TiO 2 sols
described previously were applied. 304 SS plates were coated with 1, 2 and 3 layers of each of
the sols (each plate always being coated with the same sol) and fired at 500 °C for 5 h after each
layer was applied. The stability of the samples to applied positive potentials was tested by
measuring current vs. applied potential. These experiments were conducted in the dark using a
Teflon cell. Titania-coated stainless steel electrodes were used as working electrodes with a
platinum counter electrode and SCE reference electrode. The cell was filled with a working
solution of 25 ppm (as C) formic acid in 0.01 mol dm-2 NaCl. The potential was scanned at 20
mV/s.
In all tests, a large increase in current was observed when the applied potential exceeded
50 mV, as shown in Figure 3. In addition. the surface of the electrode that was in contact with the
solution looked damaged after 5 cycles from 500 mV to -500 mV. However, SEM images do not
show anv differences between the areas of the electrodes that contacted the test solution and theI
areas that were not exposed to the solution.
Figure 4 presents SEM images of the surfaces of the 304 SS electrodes either bare or
coated with the different sols. Figure 4a shows the surface of a 303 SS plate that was fired at 500
ºC. This figure indicates the presence of the small particles (ca 100 nm) previously described.
Figure 4b is a magnification of the previous image in which some of the particles are shown.
Figure 4c shows the surface of an electrode coated with three layers of the alcohol-based
sol, in which the typical particles present on the surface of the 304 SS after firing can be seen.
Figure 4d is a magnification of the previous image. This view shows that the particles present on
the surface (light grey) are now coated by smaller particles of TiO2 (ca 20 nm).
Figure 4e shows the surface of an electrode coated with one layer of the dialyzed aqueous
sol. This film is thin enough that particles and some scratches on the surface are visible through
the film. Figure 4f is a magnification of the previous view. The particles of TiO 2 deposited from
6

the dialyzed aqueous sol are larger and less uniformly distributed than the particles deposited
from the alcoholic sol.
Figure 4g shows the surface of an electrode coated with one layer of the aqueous sol
peptized at 80 ºC. In this case. the film appears to completely cover the particles on the surface.
Therefore, we believe that this film is thicker than the others, which is a consequence of the
higher viscosity of this sol compared with the others. In fact, this film is so thick that it
delaminates from the electrode in several areas (not shown in the photograph). Figure 4h is a
magnification of the previous image which shows the arrangement of the particles in this film.
One plate was coated with a layer of the aqueous sol peptized at 80 ºC and fired at 700 ºC
for 5 h. The voltammograms obtained with this electrode were identical to that shown in Figure
2; and, after 50 cycles, the surface again appeared damaged., As can be noticed by comparing
Figures 5a-d to Figure 4. this surface appears quite different than the films obtained by firing at
500 °C. The uncoated area is covered by small crystals (100-200 nm) in a compact arrangement
(see Figure 5a). However, the coated areas contain relatively large structures on the surface (see
Figure 5b) whose composition is mostly iron oxide, as determined by energy dispersive X-ray
spectroscopy (EDX) analysis. (The particles shown in Figure 4a are too small to provide useful
information using this technique.) The morphology of these structures appears to be a compact
arrangement of deformed monocrystals (see Figure 5c). The presence of these iron oxide
structures on the surface indicates that the TiO2 coating cannot prevent corrosion of the iron
surface during firing at 700 °C. This phenomenon was also reported by S. K. Yen in 316 SS
coated with ZrO2 (7). As shown in Figure 5d, a flat area of the coated electrode appears like the
uncoated area (see Figure 5a). However, this flat area still has enough TiO2 on the surface to be
detected by EDX analysis.
After several cyclic voltammograms were obtained, the surface exposed to the test
solution was damaged. In Figure 5e, cracks and delamination of the surface can be observed.
EDX analysis of the different areas shows that the TiO2 film was not present in the areas of
delamination, while only iron and the minor components are present inside these areas. Although
further studies of titania coated stainless steel are being conducted, it does not appear that
stainless steel supports will be suitable for this application.
7

Stability and Activity of Titanium-Supported Photoelectrodes
SEM analysis of the titanium-supported photoelectrodes shows that the surface is
irregular with particles of different sizes deposited in the depressions on the surface (see Figures
6a-b). After coating, these particles remain under the film of TiO2 (see Figures 6c-d) and are
associated with the formation of cracks on the film. SEM analysis of samples pre-treated in
different ways indicated that the origin of the particles was the stainless steel polish used in the
first step of the pretreatment procedure. In the next samples this step was eliminated. Figure 6e
shows the surface of a sample pretreated only by sonication with acetone in an ultrasonic bath for
5 h (with the bath cycled on and off for periods of 15 min) and coated first with a layer of
alcohol-based sol (fired at 450 ºC for 1 h) and then one layer of dialyzed aqueous-based sol (fired
at 400 °C for 5 h). Notice that this second method for pretreating electrodes does not cause
particles to deposit on the electrodes. However. cracks in the coating still could not be avoided.
These cracks do not appear to be associated with particles deposited in surface depressions but
appear to result from contraction of the coating after the firing procedure. These observations
may indicate that these coatings are too thick to adhere well to the titanium electrode.
In another experiment, four plates of titanium were polished with an aqueous suspension
of 0.3 µm Al 2O3, particles. Two plates were coated with three layers of a dialyzed aqueous TiO2
sol. after which one was fired at 300 °C for 5 h and the other at 500 °C for 5 h. One of the
uncoated plates was fired at 300 °C and the other at 500 ºC. The films and the surfaces were
characterised by X-ray diffraction (XRD, Table 1) and SEM (Figures 7a-f).
Figures 7a and 7b show the surface of uncoated and coated samples fired at 300 °C
respectively. By comparing these figures. one can conclude that the TiO2 film covers completely
the surface of the support. The coated sample exhibits a homogeneous surface with small pores
and some cracks in the coating. Images of the uncoated (Figure 7c-d at different magnifications)
and coated (Figures 7e-f at different magnifications) samples fired at 500 °C are also shown.
Once again, the film covers completely the surface of the metal. However, after firing at 500 °C
the particles of TiO2 are well defined and bigger than when fired at 300 °C. As shown in Table I,
this growth in particle size is also associated with partial conversion of anatase crystals to rutile.
8

Table 1 Crystal structures of the surfaces of titanium plates treated in different ways.
Fired at 300 °C Fired at 500 °C
Uncoated No Crystalline Phase Rutile
Coated Anatase Anatase + Rutile
TiO2 supported on titanium displays both photoelectrocatalytic activity and reasonable
stability. Figure 8 shows the average activity of individual photoelectrodes that were fired at
different temperatures, with the error bars representing the relative standard deviation observed
in either three or four tests of each electrode. While the electrode that was fired at 300 °C was not
the most active. it did display the best reproducibility. Figure 9 indicates the variation in
behaviour that was observed for this electrode.
On the other hand. for the electrode that was fired at 500 ºC, a continuous diminution in
its catalytic activity was noticed as each of the three tests was conducted. After the tests were
completed, photomicrographs of the photoelectrodes fired at 500 °C indicated that in some areas
the film of TiO2 had separated from the substrate. The lack of contact between the titania coating
and the conductive substrate may contribute to the decreased activity of this photoelectrode.
However, the current that passes through the reactor is higher for the electrode fired at 500 °C
(2.8-3.5 mA) than for the electrode fired at 300 °C (1.6-2.0 mA). In addition, it appears that the
particles in the titania coating fired at 500 °C are larger than the particles in the titania coating
fired at 300 °C. Thus, the larger particles improve the conductivity of the photoelectrodes. This
behaviour is not surprising. As the porous coatings are heated, grain growth will occur. As the
particle size increases? the number of grain boundaries decreases. Because each grain boundary
resists the passage of current, the conductivity of the coatings, and thus of the photoelectrodes,
should increase with increasing firing temperature.
9

However, coatings that contain larger particles do not display improved catalytic activity.
In addition to the possible delamination of the TiO2 film mentioned above, two other factors may
also contribute to this behaviour. i) XRD analysis of the films indicates that the crystal structure
of the films tired at 300 °C is that of the anatase form of titania. while the films fired at 500 °C
are a mixture of anatase and r-utile. Results from several photocatalytic studies have suggested
that rutile is the less photoactive form of titania (for example see ref 8). ii) Firing these porous
coatings at higher temperatures reduces their surface area. Thus less catalyst will contact the test
solution in the coatings that were tired at 500 ºC. Both of these factors would offset the
improvement in conductivity that is obtained by firing the coatings at 500 °C.
Because the titania-coated titanium electrodes displayed reasonably reproducible
behaviour in these initial tests (as opposed to the significant degradation of the other substrates
that was observed), further tests of the photocatalytic and photoelectrocatalytic properties of
these titanium-supported photoelectrodes were conducted. These additional tests are described in
the next section, using coatings of titania deposited from dialyzed aqueous sols.
Effect of Different Variables on the Behaviour of the Titanium-Supported Photoelectrodes
a) Effect of the Applied Potential
The effect of the applied potential on the removal of formic acid using photoelectrodes
fired at different temperatures (i.e.. the photoelectrocatalytic process) is shown in Figures 10a
and l0b. We believe that these results correspond to the photoelectrochemical process because the
pure electrochemical oxidation of formic acid on TiO2 films deposited on conductive glass
occurs only at potentials higher than 2 V (9) and on uncoated titanium at potentials higher than 3
V (this work).
Inspection of Figures 10a and l0b indicates that, for films fired at both 300 and 500 °C,
the degradation of formic acid is highest for applied potentials of +l.0 V. However, only a small
improvement in degradation ability is obtained by increasing the applied potential from +0.5 to
+l.0 V. Therefore further studies were conducted under an applied potential of +0.5 V.
10

b) Effect of the Number of Layers of TiO2
Photoelectrodes containing various numbers of layers of dialyzed aqueous TiO2 were
fabricated. Figure 11 shows the activity of these photoelectrodes after being used for three hours
of treatment. The amount of formic acid degraded is roughly proportional to the amount of TiO 2
deposited on the substrate (see Figure 12). The data shown in Figure 11 demonstrate several
trends. 1) Application of a potential of +0.5 V across the titania coating significantly increases
the activity of the photoelectrode above that observed when no potential is applied. 2) With a
potential of +0.5 V applied across the photoelectrode, only a relatively small improvement in the
activity of the photoelectrode is observed when more than two layers of titania are present. 3)
Application of a potential across the titania coating has only a small effect when the coating
consists of 10 layers of titania. Fluctuations in the amount degraded with different numbers of
layers were reported previously in experiments that employed TiO2 supported on conductive
glass photoelectrodes (10). These fluctuations were attributed to experimental variations.
The first observation can be explained readily. When titania is illuminated by band gap
radiation. electron-hole pairs are generated that are responsible for the photocatalytic activity of
the material. By applying a potential across the photoactive titania, recombination of
photogenerated electron-hole pairs is minimised. As a result the activity of the titania increases.
Note that other factors may well contribute to this phenomenon which has been reported by
several researchers (1 l-l 6). There is also an obvious explanation for the other two observations
reported above. Because titania is a poor conductor of electrical current, the thicker coatings of
titania that are formed by depositing more layers of titania on the substrate are likely to inhibit
the effectiveness of the applied electric field. In these experiments, though, a second factor may
well contribute. If the degradation of formic acid follows first order kinetics, then the removal of
additional formic acid beyond the 60% removed by two layers of TiO 2 may proceed slowly.
These experiments were not conducted in a manner that would allow these two possibilities to be
distinguished.
The activity of multilayer photoelectrodes was observed to decrease with the number of
times that they were used. For example, when the photoelectrode that was coated with 4 layers of
titania was employed in three successive tests, the activity of the photoelectrode decreased by
22% as these tests were conducted. SEM analysis of this photoelectrode indicates that the
11
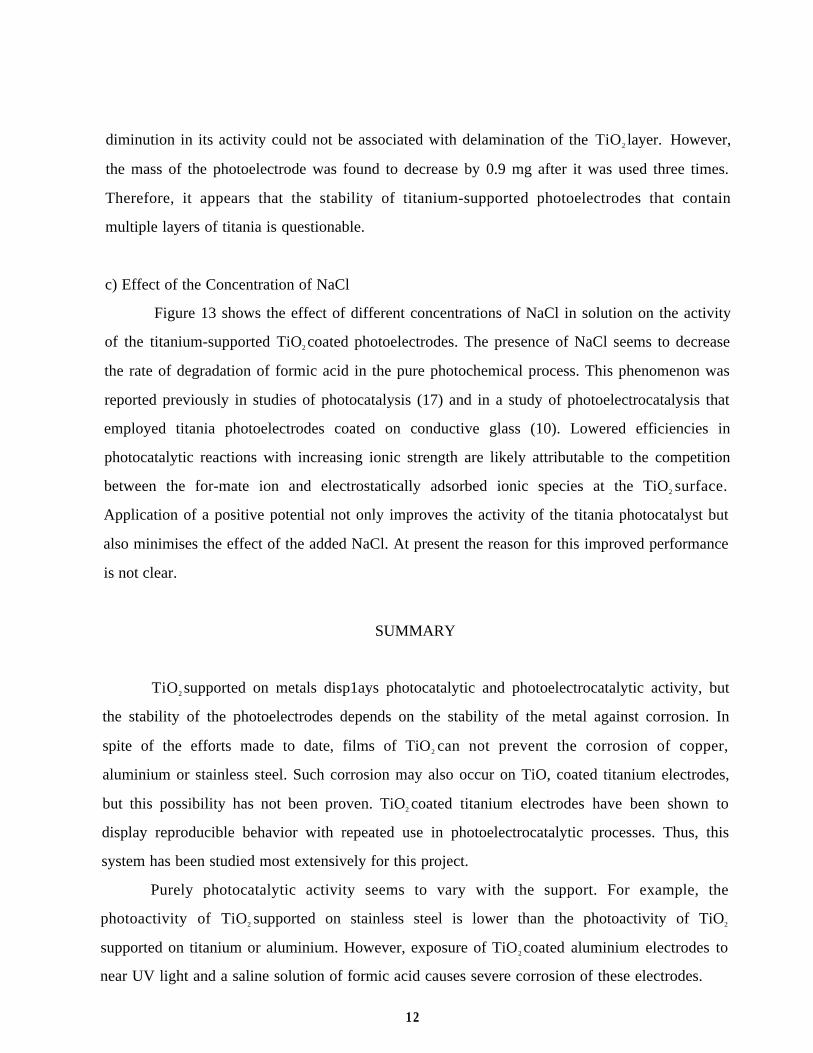
diminution in its activity could not be associated with delamination of the TiO2 layer. However,
the mass of the photoelectrode was found to decrease by 0.9 mg after it was used three times.
Therefore, it appears that the stability of titanium-supported photoelectrodes that contain
multiple layers of titania is questionable.
c) Effect of the Concentration of NaCl
Figure 13 shows the effect of different concentrations of NaCl in solution on the activity
of the titanium-supported TiO2 coated photoelectrodes. The presence of NaCl seems to decrease
the rate of degradation of formic acid in the pure photochemical process. This phenomenon was
reported previously in studies of photocatalysis (17) and in a study of photoelectrocatalysis that
employed titania photoelectrodes coated on conductive glass (10). Lowered efficiencies in
photocatalytic reactions with increasing ionic strength are likely attributable to the competition
between the for-mate ion and electrostatically adsorbed ionic species at the TiO2 surface.
Application of a positive potential not only improves the activity of the titania photocatalyst but
also minimises the effect of the added NaCl. At present the reason for this improved performance
is not clear.
SUMMARY
TiO2 supported on metals disp1ays photocatalytic and photoelectrocatalytic activity, but
the stability of the photoelectrodes depends on the stability of the metal against corrosion. In
spite of the efforts made to date, films of TiO2 can not prevent the corrosion of copper,
aluminium or stainless steel. Such corrosion may also occur on TiO, coated titanium electrodes,
but this possibility has not been proven. TiO2 coated titanium electrodes have been shown to
display reproducible behavior with repeated use in photoelectrocatalytic processes. Thus, this
system has been studied most extensively for this project.
Purely photocatalytic activity seems to vary with the support. For example, the
photoactivity of TiO2 supported on stainless steel is lower than the photoactivity of TiO2
supported on titanium or aluminium. However, exposure of TiO2 coated aluminium electrodes to
near UV light and a saline solution of formic acid causes severe corrosion of these electrodes.
12

Application of positive potentials across TiO2 films supported on titanium improves the
efficiency of the photocatalytic process. This behaviour is the same as previously reported with
TiO2 supported on conductive glass. Firing temperature plays an important role in determining
the electrochemical behaviour of the electrodes. The intensity of the current in the system (under
otherwise identical conditions) increases with the firing temperature, although no corresponding
improvement in the catalytic activity was detected. Catalytic activity of these electrodes can be
increased by applying multiple coatings of TiO2 to the titanium electrode. However. more studies
are necessary in order to improve the adherence of multilayer TiO2 electrodes with repeated use.
We expect to find an optimal thickness for the film of TiO2 that provides maximum
photocatalytic activity with the minimun amount of TiO2 when a positive potential is applied
across the electrode.
The application of positive potentials across TiO2 films diminishes the adverse effect of
salt in solution on the photocatalytic activity of the system. This result is very interesting because
most aqueous wastes that could be purified using this technology contain some salt.
REFERENCES
1. M. A. Anderson, M. J. Gieselmann and Q. Xu, J. Membrane Sci., 39, 243 (1988).
2. C. J. Brinker and G. W. Scherer, Sol-Gel Science: The Physics and Chemistry of Sol-Gel
Processing, Academic Press, New York (1990).
3.Q.Xu and M. A. Anderson, J. Mater. Res., 6, 1073 (1991).
4. Q. Xu and M. A. Anderson, J. Am. Ceram. Soc., 77(7), 1939 (1994).
5.H. Y. Ha and M. A. Anderson. J. Environ. Eng., 122, 217 (1996).
6. A. Fernandez. G. Lassaletta V. M. Jiménez A. Justo, A. R. González-Elipe, J. M. Herrmann H.
Tahiri and Y. Ait-Ichou: Appl. Catal. B: Environ., 7,49 (1995).
7. S.K. Yen, 191th Meeting of the Electrochemical Soc., Montreal, May 1997.
13

8. A. Wahl, M. Ulmann, A. Carroy, B. Jermann, M. Dolata. P. Kedzierzawki, C. Chatelain, A.
Monnier and J. Augustinski; J. Electroanal. Chem., 396, 41, (1995).
9. D.H. Kim and M.A. Anderson: J. Environ. Eng.; 121, 590, (1995).
10. D. H. Kim and M. A. Anderson, Environ. Sci. Technol., 28, 479, (1994).
11. K. Vinodgopal, S. Hotchandani and P. V. Kamat; J. Phys. Chem., 97, 9040, (1993).
12. L. Bahadur and T. N. Rao, J. Photochem. Photobiol. A: Chem., 91, 233, (1995).
13. A. Hagfeldt and M. Gratzel, Chem. Rev., 95, 49, (1995).
14. K. Vinodgopal, I. Bedja and P. V. Kamat. Chem. Mater., 8: 2187, (1996).
15. K. Vinodgopal and P. V. Kamat, Chemtech, 26, 18, (1996).
16. G. Boschloo, A. Goossens and J. Schoonman, J. Electrochem. Soc., 144, 1311, (1997).
17. M. Abdullah, G. K. Low and R.W. Matthews, J. Phys. Chem., 9, 6820, (1990).
14

FIGURE CAPTIONS
Figure 1. Scanning electron photomicrographs of aluminium photoelectrodes fired at 500 °C
and treated in different ways. a) Titania coated electrode prepared as described in the text (see p.
2) before exposure to the test solution. b) Same electrode as (a) after 7 h exposure to the test
solution and UV light with pure oxygen bubbled through the solution. c) Uncoated electrode
after 8 h exposure to the test solution and UV light with pure oxygen bubbled through the
solution.
Figure 2. Scanning electron photomicrograph of a 304 stainless steel-supported titania
photoelectrode. The coating is the narrow band across the center of the figure that is labeled 79.4
nm. The relatively uniform grayish area below the coating is the stainless steel electrode, while
the region above the coating is a layer of resin used to prepare the specimen.
Figure 3. Current-potential plot for a stainless steel-supported titania photoelectrode that was
coated with 3 layers of alcohol-based titania sol and fired at 500 °C for 5 h.
Figure 4. Scanning electron photomicrographs of stainless steel photoelectrodes prepared in
different ways. All samples were initially fired at 450 °C for 2 h. a) Uncoated electrode fired a
second time at 500 °C for 5 h. b) Same as (a) but at higher magnification. c) Electrode coated
with 3 layers of alcohol-based titania sol and fired at 500 °C for 5 h. d) Same as (c) but at higher
magnification. e) Electrode coated with 1 layer of dialyzed aqueous-based titania sol and fired at
500 °C for 5 h. f) Same as (e) but at higher magnification. g) Electrode coated with 1 layer of
peptized (80 °C) aqueous-based titania sol and fired at 500 °C for 5 h. h) Same as (g) but at
higher magnification.
Figure 5. Scanning electron photomicrographs of stainless steel photoelectrodes. All samples
were initially fired at 450 °C for 2 h. a) Uncoated electrode fired a second time at 700 °C for 5 h.
b) Electrode coated with 1 layer of peptized titania sol and fired at 700 °C for 5 h. C)
Magnification of the main feature shown in (b). cl) Magnification of a flat area shown in (b). e)
15
Coated surface prepared as in (b) after 50 cyclic voltammograms (-0.5 V to +0.5 V at a scan rate
of 20 mV/sec).
Figure 6. Scanning electron photomicrographs of titanium photoelectrodes prepared in different
ways. a) Uncoated electrode pretreated as described in the text (see p. 2). b) Same as (a) but at
higher magnification. c) Electrode coated with 1 layer of alcohol-based titania sol. fired at 450 °C
for 1 h, coated again with 1 layer of dialyzed titania sol, and fired at 300 °C for 5 h. d) Same as
(c) but at higher magnification. e) Electrode coated and fired as described in the text. Unlike the
electrode shown in (a-d), this electrode has not been polished.
Figure 7. Scanning electron photomicrographs of titanium electrodes prepared in different ways.
a) Uncoated electrode polished with alumina and fired at 300 °C for 5 h. b) Polished electrode
coated with 3 layers of dialyzed titania sol and fired at 300 °C for 5 h. c) Uncoated electrode
polished with alumina and fired at 500 °C for 5 h. d) Same as (c) but at higher magnification. e)
Polished electrode coated with 3 layers of dialyzed titania sol and fired at 500 °C for 5 h. f) Same
as (e) but at higher magnification.
Figure 8. Effect of firing temperature on the photoelectrocatalytic activity of titanium-supported
titania photoelectrodes. Electrodes were prepared by polishing titanium plates with stainless steel
polish. coating with 1 layer of alcohol-based sol. firing at 450 °C for 1 h. coating with 1 layer of
dialyzed titania sol. and firing at the indicated temperature for 5 h. Activity of the electrodes was
measured as described in the text (see p. 3) with an applied potential of +0.5 V. The percent of
formic acid remaining in solution corresponds to the average of at least three separate tests.
Figure 9. Variation in activity of the titanium-supported titania photoelectrode that was fired at
300 °C.
Figure 10. Effect of applied potentia l on the removal of formic acid. a) Electrode prepared as
described in Figure 8 and fired at 300 °C for h. b) Electrode prepared as described in Figure 8
and fired at 500 °C for 5 h.
16

Figure 11. Activity of photoelectrodes both with and without an applied potential as a function
of the number of layers of dialyzed titania sol applied to the electrode. All electrodes were first
coated with 1 layer of alcohol-based titania sol and fired at 450 °C for 1 h. After the indicated
number of coatings with the dialyzed sol, all electrodes were fired at 300 °C for 5 h.
Figure 12. Amount of titania deposited on the titanium support as a function of the number of
layers of titania applied. Layer 1 includes the mass of both one coating of alcohol-based titania
sol fired at 450 °C and one coating of dialyzed aqueous-based titania sol fired at 300 °C.
Additional layers include the mass deposited from additional coatings of the dialyzed sol fired at
300 °C.
Figure 13. Effect of applied potential and salt concentration in the test solution on the activity of
titania photoelectrodes. All electrodes were prepared by polishing titanium plates with stainless
steel polish, coating with 1 layer of alcohol-based titania sol. firing at 450 °C for 1 h, coating
with 1 layer of dialyzed titania sol. and firing at 300 °C for 5 h. (NAP = no applied potential).
17
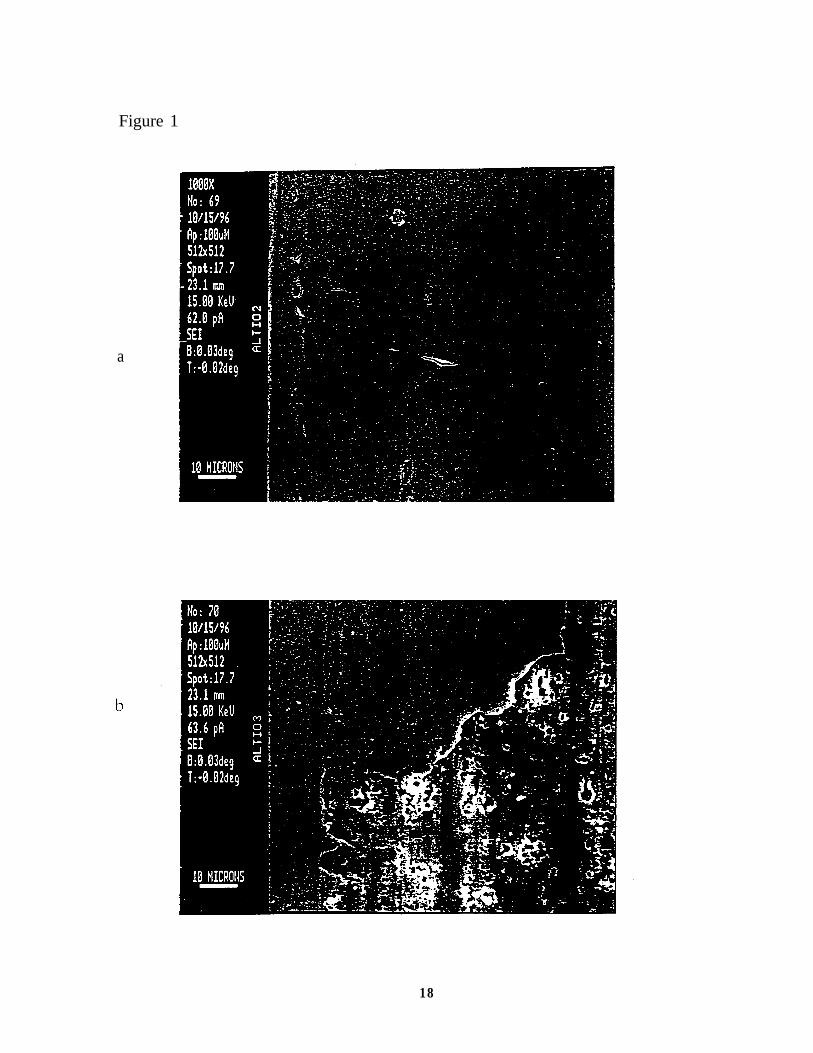
Figure 1
a
18

Figure 1 (continuation)
Figure 2
19
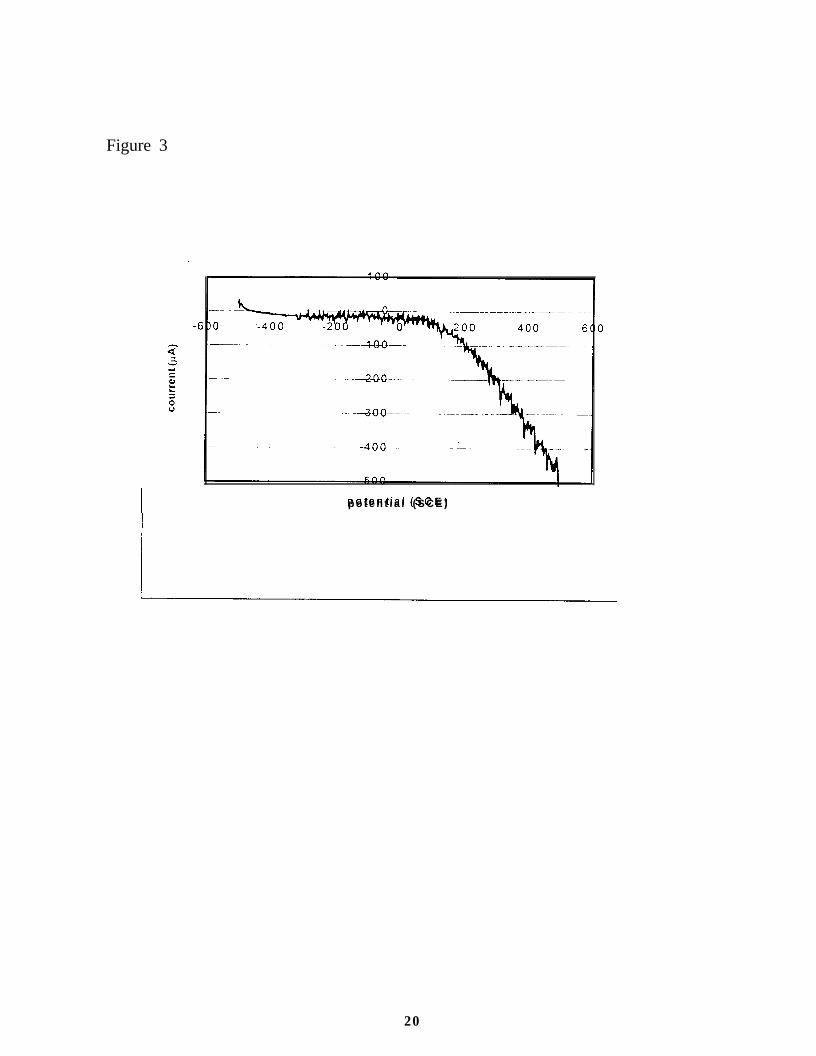
Figure 3
p o t e n t i a l ( S C E )
20

a
d
21

Figure 4 (continuation)

Figure 5
a
23

Figure 5 (continuation)
e
24

Figure 6
b
---- -, . _-.
25
Figure6 (continuation)
26

Figure 7
a
b
27

3
ct
-.

Figure 8
Figure 9
60
1 2 3 4
Test Number
29

Figure 10
a
no applredpo ten t ia l
0 0 .5 1
A p p l i e d p o t e n t i a l v s S C E
30
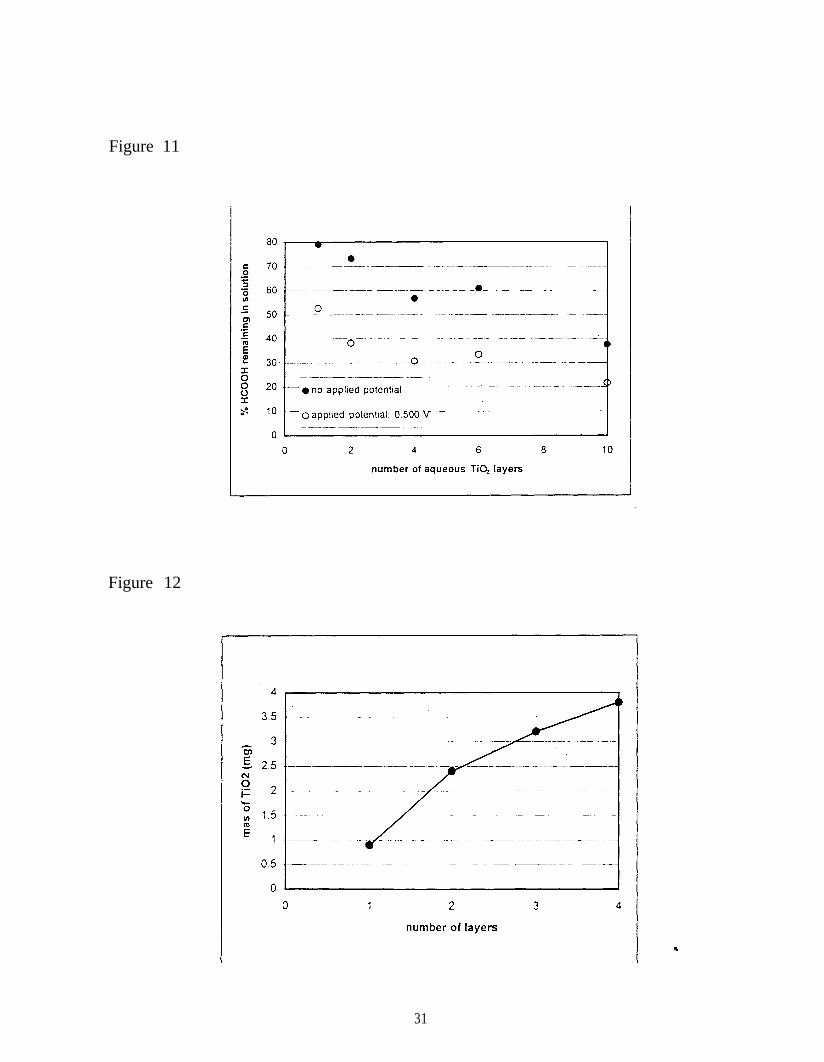
Figure 11
Figure 12
31

Figure 13
32
Electrochemical Studies
Electrodes were characterized both in the dark, to determine their baseline
electrochemical properties, and in the light with adsorbed dyes, in order to determine their
trap state density and other properties that will be important in ultimately affecting the
performance of these systems in an electrochemical cell. These studies are described briefly
below.
Electrodes were prepared by first depositing a layer of TiCl4 in isopropanol onto 3
mm thick glass coated with a conducting layer of F-doped SnO2 (manufact.). The layer was
evenly spread by pulling a glass slide across the surface of the electrode, where Scotch tape
on either side of the electrode region acted as a spacer for the slide. After the isopropanol
had evaporated, the colloid solution was spread onto the conducting glass in a similar
fashion. Once this layer had dried, the electrodes were’ fired in a tube furnace under flowing
air at 450 °C for 30 minutes. Once the electrodes had cooled, 100 mL of a freshly made
solution of 0.2 M TiC4 in water was deposited on each electrode. After the electrodes were
covered and allowed to sit overnight, the electrodes were rinsed with isopropanol. Sample
electrode thicknesses were approximately 5µm as measured by profilometry.
Initial experiments with TiO2 electrodes showed poor reproducibility. It was
hypothesized that variables such as water concentration and solution pH were affecting the
current-voltage behavior of these electrodes, so care was taken to control these variables. All
reagents and solutions listed above were stored in a nitrogen-purged box after purification.
The pyridinium triflate and pyridinium were added to both the dye and electrolyte solutions
in 0.001 M concentrations to maintain a constant initial pH. In pH studies, these buffered
solutions was made more basic by adding Proton Sponge. Enough Proton Sponge was
added SO that the pyridine/pyridinium could no longer act as a buffer. All cells were
constructed inside the nitrogen-purged box and sealed to avoid water contamination before
being brought out of the box. These precautions led to greatly improved reproducibility.

Current density vs potential experiments were performed using an EG&G Princeton
Applied Research (PAR) Model 362 Potential Controller in conjunction with a Houston
Instrument Omnigraphic 2000 recorder. Light intensities were controlled by the use of an
ELH W-halogen bulb and were determined by use of a calibrated silicon photodiode
(Solarex). A UV filter was used to avoid direct excitation of electrons in the titanium
dioxide. All measurements were performed in a three-electrode potentiostatic set-up, with a
Pt wire reference and Pt gauze counter electrode. The distance between the working and
counter electrodes was approximately 2 mm and no stirring was performed.
Some dye-electrolyte combinations were found to require some equilibration time to
reach a stable open-circuit voltage: therefore, all ceils were allowed to equilibrate for at least
30 minutes after exposure to a new solution before data published here were recorded. After
exposure to Proton Sponge, electrodes were allowed to reequilibrate with the buffered I -/I2
solution for at least 2 hours. Although the current-voltage properties of these junctions
remained stable while the ceil was assembled. once the electrodes were removed from the
iodine solution they tended to degrade. For this reason, fresh electrodes were used in all
experiments.
Spectral response data was obtained by biasing the cell to short circuit and measuring
the voltage output from the current monitor on the potentiostat. Monochromatic light was
obtained from a Spex 1682A tungsten lamp in conjunction with a Spex 1681 B
monochromator with 1.25 mm slits. For the TiO2 electrodes, the dark current tended to drift
slightly over time, so the dark current was measured at each wavelength and subtracted from
the photocurrent at that wavelength. The light intensity from a beam-split portion of the
monochromator output was measured by monitoring the photocurrent at a Si photodiode
from United Detector Technology. This diode thus served as a calibration of the lamp
intensity. Quantum yields were obtained by placing a calibrated Si photodiode in the same
position as the TiO2 working electrode and measuring the photocurrent at short circuit, then
correcting the data from the TiO2. Current-voltage data at 1 Sun illumination was obtained

before and after each run. Electrodes which showed significant decreases in photocurrent (2
5%) were viewed to be defective and were not included in the final analysis.
III. Results:
A. Characterization of Unsensitized Electrodes
The current-voltage behavior in the dark for a nanoporous titanium dioxide electrode
was first compared to the current-voltage behavior for a conducting glass electrode in a
solution of LiI/I2. Both reduction and oxidation of the I2/I- couple require high
over-potentials at the conducting glass electrode and very low currents are observed in either
potential direction. In contrast, the TiO2 electrode shows rectifying behavior and yields
much higher dark currents in forward bias than the conducting glass alone. This behavior
indicates there are slow kinetics of electron transfer for iodine at the conducting glass
surface. Since the TiO2 is capable of reducing I2 but not of oxidizing LiI in the dark, a
concentration gradient is developed which effectively separates the charge. To further
support this explanation, a similar experiment was performed with Me2Fc+/0 as the redox
couple in solution. This redox couple was chosen because the reduction potential of this
couple is reasonably close to that of the I2/I-. In this case, very high currents were observed
in both potential directions at the conducting glass electrode. At the titanium dioxide
electrode, similar behavior was observed. Although data is not shown here. dye-sensitized
electrodes immersed in solutions of Me2Fc +/0 developed no observable photovoltages and
showed no photocurrent at short circuit.
B. Spectral Response:
Spectral response data for electrodes sensitized with 8 dyes were also obtained, in
order to characterize the grain boundary transport processes though the TiO2 electrodes. The
results can be explained fully by three coinciding factors. First, as expected, the spectral
response roughly correlates with the absorption spectrum of each dye. Dyes which have
lower extinction coefficients such as the RuL'3 and OsL'3 showed lower current responses.
The wavelength at which the maximum photocurrent was observed corresponded to the

4
absorption maximum for each dye. Second, within a given set of ligands. the osmium dyes
showed much more photocurrent at higher wavelengths. This phenomenon is due to the
weak band present in the absorption spectra of the osmium dyes which is not present in the
ruthenium dyes and which likely arises due to the population of triplet states in the osmium
dyes. The only response which cannot be explained by a combination of these two effects is
that of electrodes sensitized with the OsL'2(SCN)2 dye. This dye shows very high light
absorption, yet electrodes sensitized with this dye show very poor energy conversion.
However. this effect can be explained by examining the ground state reduction potentials of
the dyes. Of the dyes examined in this work, the OsL'2(SCN)2 has the least positive
reduction potential and in fact is only 0.18 V positive of the 12/I- redox couple. It is likely,
therefore. that the smaller driving force for regeneration of the dye limits the efficiency of
this dye.
C. Effect of pH on the TiO2 Electrochemistry
TiO2/RuL'2(SCN)2 electrodes were characterized as a function of Proton Sponge
concentration. In initial sets of experiments, each electrode was first characterized in a
solution containing only buffered LiI/I2. When Proton Sponge was added, the open circuit
voltages increased dramatically and the short circuit currents dropped. This effect is believed
to be due to a shifting in the band edge position of the TiO2 with pH. As the difference
between the conduction band edge position of the TiO2 and the reduction potential of the
LiI/I2 is increased, the open circuit voltage gets larger. If the conduction band edge becomes
so negative that the excited dye cannot inject electrons efficiently, the short-circuit current
density decreases, However, when the electrode was reintroduced to the buffered solution,
the open-circuit voltages decreased as expected, but the short-circuit current densities did not
recover.
AS mentioned above, once the electrodes were exposed to iodine solution, the
removal of the iodine contact caused some irreversible degradation of the electrode which
could account for the change between the first and last potential scan. To determine whether

5
the decrease in current upon exposure to Proton Sponge was completely due to emptying the
cell and refilling it, current-voltage curves of fresh TiO2/RuL'2(SCN)2 electrodes in
solutions containing various concentrations of Proton Sponge were examined, The results
for the 10 mM Proton Sponge solution were almost identical to those of electrodes first
exposed to buffered solution. Since the dyes are known to desorb in aqueous base, the more
basic solutions could cause some loss of dye even in non-aqueous solutions, resulting in
lower currents when the electrodes are reimmersed in buffered solution. Although this effect
may also account for part of the current decrease, the voltage increases in basic solution
cannot be explained by a loss of dye, thus a band edge shift seems likely. The dark curves
for this dye-electrode system show a similar shift in the voltage, further supporting the
presence of a band edge shift. Table 2 summarizes the open circuit voltages and short circuit
current densities as a function of Proton Sponge concentration.
D. Effect of pH on Luminescence of the Adsorbed Dye--TiO 2/ R u L '3
Electrodes:
The effect of pH on the TiO2 band edge positions was further examined through
luminescence studies of the adsorbed dye. The quantum yield for luminescence (0) of the
dye is given by eq. 1, where krad is the rate constant for radiative decay, knrad is the rate
constant for non-radiative decay, and kinj is the injection rate constant:
If a shift in the band edge position causes a decrease in the injection rate constant. resulting
in a decrease in photocurrent increase, the quantum yield for luminescence should increase,
and thus luminescence intensity should increase as the pH is increased. If the decrease in
current observed above was solely due to a loss of dye, the luminescence intensity should
decrease due to the smaller amount of dye on the surface of the electrode.
Luminescence studies were first attempted on TiO2/RuL'2(SCN)2 electrodes, but the
luminescence intensity was very low and the peak was at a wavelength too positive to detect
with the system available. TiO2/RuL'3 electrodes were chosen as an alternate because of the

6
strong luminescence of the L'3 dyes. When Proton Sponge is present, the luminescence
intensity increases, as expected. After 2 hours of immersion in the buffered solution after
exposure to the Proton Sponge solution, the luminescence drops back down near the initial
value. To minimize the effects of changing solutions, the luminescence experiment was
repeated with a new electrode in a CH3CN solution containing 0.001 M/0.001 M py+/0 In
this case, a few drops of glacial acetic acid were then added to the solution to neutralize the
Proton Sponge. An immediate decrease in the luminescence intensity was observed,
consistent with an increased dye injection efficiency and a positive conduction band edge
shift due to the decreased pH.
To make sure the effect of pH on the current-voltage characteristics was not limited to
the RuL'2(SCN)2 system, J-E curves of the TiO2/RuL'3 electrodes were examined as a
function of pH. The photocurrents dropped significantly when the Proton Sponge
concentration was changed from 0 to 0.010 M. The large amount of hysteresis present
makes it difficult to quantify the open-circuit voltage change although it appears to increase
slightly. As in the previous case, the photocurrents decrease from their initial value on
reimmersion and equilibration with the buffered solution. The dark curves show a large
negative shift in the voltage when the electrode is exposed to Proton Sponge, similar to the
behavior observed with the TiO2/RuL'2(SCN)2 electrodes. The dark curves return to their
previous position when the electrode is reimmersed in the buffered solution.
E . Summary and Conclusions
The data collected in this project period appear to provide a rational approach for
design of more efficient nanoporous electrodes. As discussed above, the first requirement
for this type of system is slow charge transfer kinetics between the back contact of the
electrode and the sacrificial electron donor/acceptor in solution. This condition allows the
separation of charge by a diffusion gradient rather than drift. A similar approach has been
used in single crystal systems such as Si, in which ohmic selective back contacts were used

7
in conjunction with Si electrodes with very high carrier lifetimes to produce efficient solar
cells.
The effect of solution pH on the inter-facial energetics of the junction should be
considered. The data demonstrate that changing the solution pH can have a profound effect
on the current-voltage properties of the cell even in nonaqueous solutions. Increasing the pH
has been shown to result in photovoltage increases of up to 200 mV. Again, though, this
parameter needs to be optimized for the system studied. Studies of the effects of these
properties on the electrochemistry of aqueous systems, and a comparison of the behavior of
undoped and Nb-doped TiO2 electrodes, are being performed at present.


![Barnstead Water Purification Systems [ES] · Destilador totalmente de cristal](https://static.fdocuments.in/doc/165x107/5b06c1577f8b9ac33f8d41e5/barnstead-water-purification-systems-es-totalmente-de-cristal.jpg)