PROGRESS ON KEY INDICATORS MARCH 2015 - sanac.org.za filePrevention, Care and Impact Strategic...
19
PROGRESS ON KEY INDICATORS 2012-2014 PROGRESS ON KEY INDICATORS 2012-2014 LIMPOPO PROVINCIAL STRATEGIC PLAN FOR HIV, TB AND STIS (2012 – 2016)
Transcript of PROGRESS ON KEY INDICATORS MARCH 2015 - sanac.org.za filePrevention, Care and Impact Strategic...
PROGRESS ON KEY INDICATORS 2012-2014
PROGRESS ON KEY INDICATORS 2012-2014
LIMPOPO PROVINCIAL STRATEGIC PLAN FOR HIV, TB AND STIS
(2012 – 2016)
PROGRESS ON KEY INDICATORS MARCH 2015
Page 1 of 19
Introduction
The Limpopo Provincial AIDS Council (LPAC) which is tasked to coordinate all HIV
and TB interventions in the Province took the guidance from South African National
AIDS Council (SANAC) to develop a Provincial HIV, STIs and TB Provincial Strategic
Plan aligned to the NSP. The plan is meant to direct the provincial HIV and TB
response, assist in fulfilling the mandate of the LPAC in reporting to SANAC as well
as assist in costing the response. The LPAC developed this Provincial Strategic Plan
(PSP) in consultation with all relevant stakeholders and this plan has been endorsed
after all the necessary crucial steps. The vision of the plan as well as the strategic
objectives has all been adopted from the global and national vision 2030.
The development of the PSP was heavily influenced and imbedded within the
broader national and international development instruments like the South African
National AIDS Council (SANAC) emphasis on a multi-sectoral approach, the Joint
United Nations Programme on AIDS (UNAIDS) which advocates for Zero new
infections, Zero deaths associated with HIV and TB and Zero Stigma Discrimination
and the United Nations General Assembly Special Session on HIV and AIDS has
responded to HIV and AIDS by involving all stakeholders. The developmental
approach recognised that HIV, TB and STIs is not just a health problem but a cross-
cutting challenge for all sectors including the socio-structural, economic and politico-
legal determinants of health as causes of the causes of disease vulnerability.
From the outset the PSP acknowledges the health challenges that the country and
the province is faced with. It also acknowledges the various efforts by the South
African Government (SAG) at national and provincial level to address those
challenges. Some of the challenges include the quadruple burden of diseases
(Communicable, Non-Communicable, Violence and Injury and HIV/AIDS and TB).
Some of the efforts to address these challenges include the HIV counselling and
Testing (HCT) Campaign launched by government in 2010, the introduction of the
Nurse Initiated Management of ART (NIMART), the National Service Delivery
Agreement (NSDA) and the changes in the eligibility criteria for ART initiation (CD4
below 350), among others. Such an acknowledgment sets the tone and direction
towards which efforts should be directed in order to arrest the epidemic.
PROGRESS ON KEY INDICATORS MARCH 2015
Page 2 of 19
The purpose of the strategic plan is:
To guide the development of an implementation plan for the response in the
Province with clear timeframes and indicators to measure progress
To provide strategic direction in identifying practical interventions and the
roles of the stakeholders that forms part of the multi-sectoral response
To guide costing and budgeting for HIV and AIDS, STI and TB interventions to
ensure availability of resources and efforts for resource mobilization
To mainstream HIV and AIDS, STI s and TB services in all sectors in the
Province.
To strengthen multi-sectoral collaboration with greater emphasis on
implementation.
To solicit support and commitment of all stakeholders involved in HIV and
AIDS programmes.
The following is an outline of the strategic priorities for Limpopo as identified during
the consultative process culminating in the PSP:
Strategic Objective 1: Address Social and Structural drivers of HIV and TB
Prevention, Care and Impact
Strategic Objective 3: Sustain Health and Wellness
Strategic Objective 2: Prevention of new HIV and TB Infections
Strategic Objective 4: Protection of Human Rights and Promotion of Access to
Justice
Under each of these strategic objectives are sub-objectives that focus on specific
areas of interest and prioritised in the PSP development process based on the
epidemiological profiling of the province. Additionally, each strategic objective has a
summary of indicators against which the province is obliged to report routinely. Such
an arrangement makes the collection, collation, analysis, reporting and usage of data
much easier. It also makes it easy to track progress on specific soft issues that do
not easily lend themselves to quantitative deductions and conclusion.
PROGRESS ON KEY INDICATORS MARCH 2015
Page 3 of 19
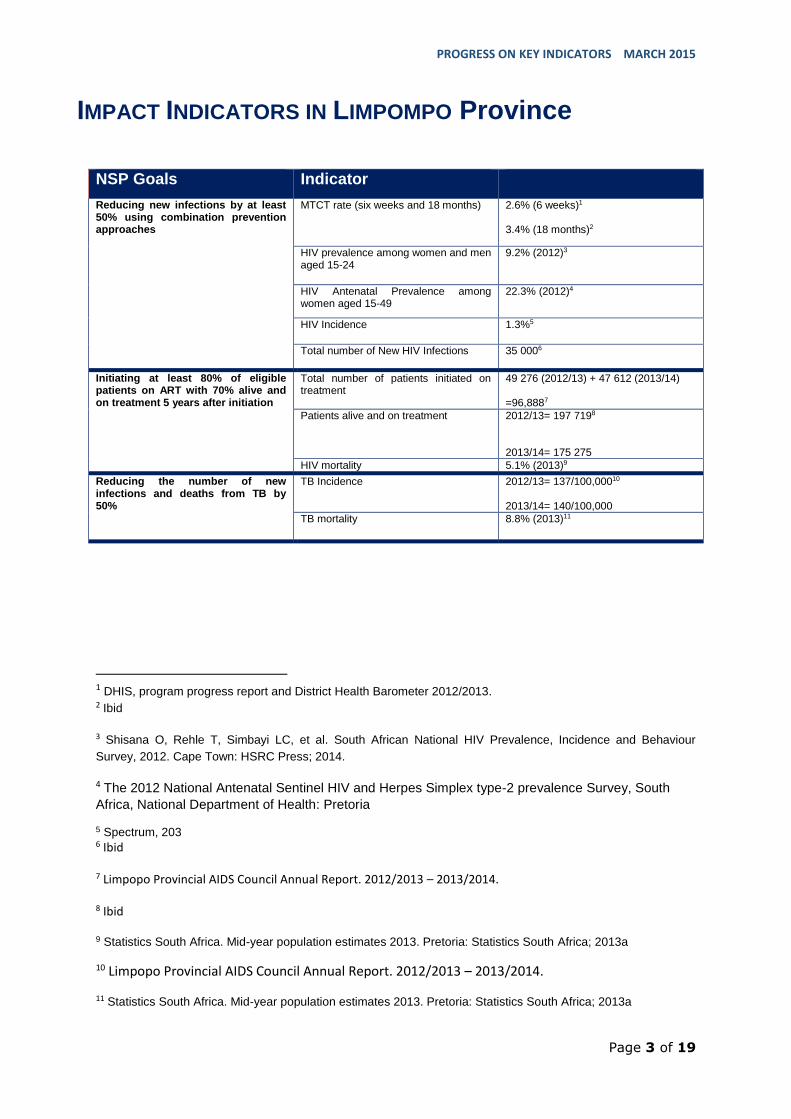
IMPACT INDICATORS IN LIMPOMPO Province
NSP Goals Indicator
Reducing new infections by at least 50% using combination prevention approaches
MTCT rate (six weeks and 18 months) 2.6% (6 weeks)1 3.4% (18 months)2
HIV prevalence among women and men aged 15-24
9.2% (2012)3
HIV Antenatal Prevalence among women aged 15-49
22.3% (2012)4
HIV Incidence 1.3%5
Total number of New HIV Infections 35 0006
Initiating at least 80% of eligible patients on ART with 70% alive and on treatment 5 years after initiation
Total number of patients initiated on treatment
49 276 (2012/13) + 47 612 (2013/14) =96,8887
Patients alive and on treatment 2012/13= 197 7198 2013/14= 175 275
HIV mortality 5.1% (2013)9
Reducing the number of new infections and deaths from TB by 50%
TB Incidence 2012/13= 137/100,00010 2013/14= 140/100,000
TB mortality 8.8% (2013)11
1 DHIS, program progress report and District Health Barometer 2012/2013. 2 Ibid
3 Shisana O, Rehle T, Simbayi LC, et al. South African National HIV Prevalence, Incidence and Behaviour
Survey, 2012. Cape Town: HSRC Press; 2014.
4 The 2012 National Antenatal Sentinel HIV and Herpes Simplex type-2 prevalence Survey, South
Africa, National Department of Health: Pretoria
5 Spectrum, 203 6 Ibid
7 Limpopo Provincial AIDS Council Annual Report. 2012/2013 – 2013/2014.
8 Ibid
9 Statistics South Africa. Mid-year population estimates 2013. Pretoria: Statistics South Africa; 2013a
10 Limpopo Provincial AIDS Council Annual Report. 2012/2013 – 2013/2014.
11 Statistics South Africa. Mid-year population estimates 2013. Pretoria: Statistics South Africa; 2013a
PROGRESS ON KEY INDICATORS MARCH 2015
Page 4 of 19
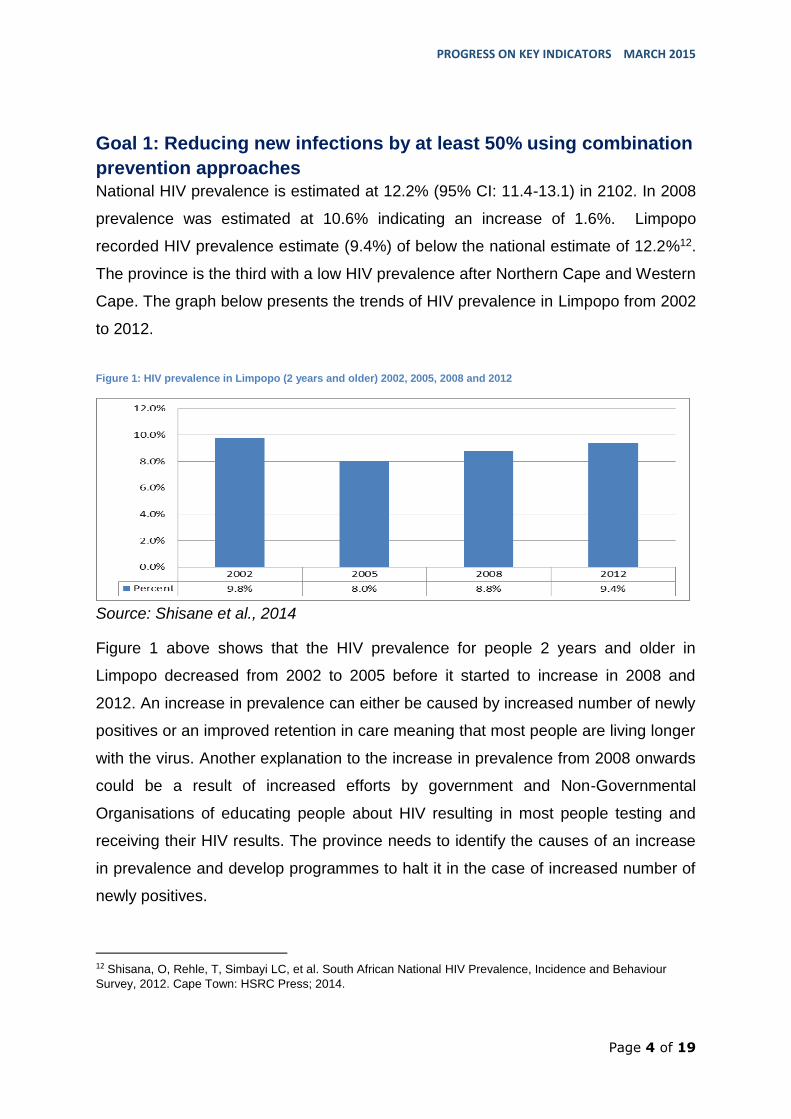
Goal 1: Reducing new infections by at least 50% using combination
prevention approaches
National HIV prevalence is estimated at 12.2% (95% CI: 11.4-13.1) in 2102. In 2008
prevalence was estimated at 10.6% indicating an increase of 1.6%. Limpopo
recorded HIV prevalence estimate (9.4%) of below the national estimate of 12.2%12.
The province is the third with a low HIV prevalence after Northern Cape and Western
Cape. The graph below presents the trends of HIV prevalence in Limpopo from 2002
to 2012.
Figure 1: HIV prevalence in Limpopo (2 years and older) 2002, 2005, 2008 and 2012
Source: Shisane et al., 2014
Figure 1 above shows that the HIV prevalence for people 2 years and older in
Limpopo decreased from 2002 to 2005 before it started to increase in 2008 and
2012. An increase in prevalence can either be caused by increased number of newly
positives or an improved retention in care meaning that most people are living longer
with the virus. Another explanation to the increase in prevalence from 2008 onwards
could be a result of increased efforts by government and Non-Governmental
Organisations of educating people about HIV resulting in most people testing and
receiving their HIV results. The province needs to identify the causes of an increase
in prevalence and develop programmes to halt it in the case of increased number of
newly positives.
12 Shisana, O, Rehle, T, Simbayi LC, et al. South African National HIV Prevalence, Incidence and Behaviour
Survey, 2012. Cape Town: HSRC Press; 2014.
PROGRESS ON KEY INDICATORS MARCH 2015
Page 5 of 19
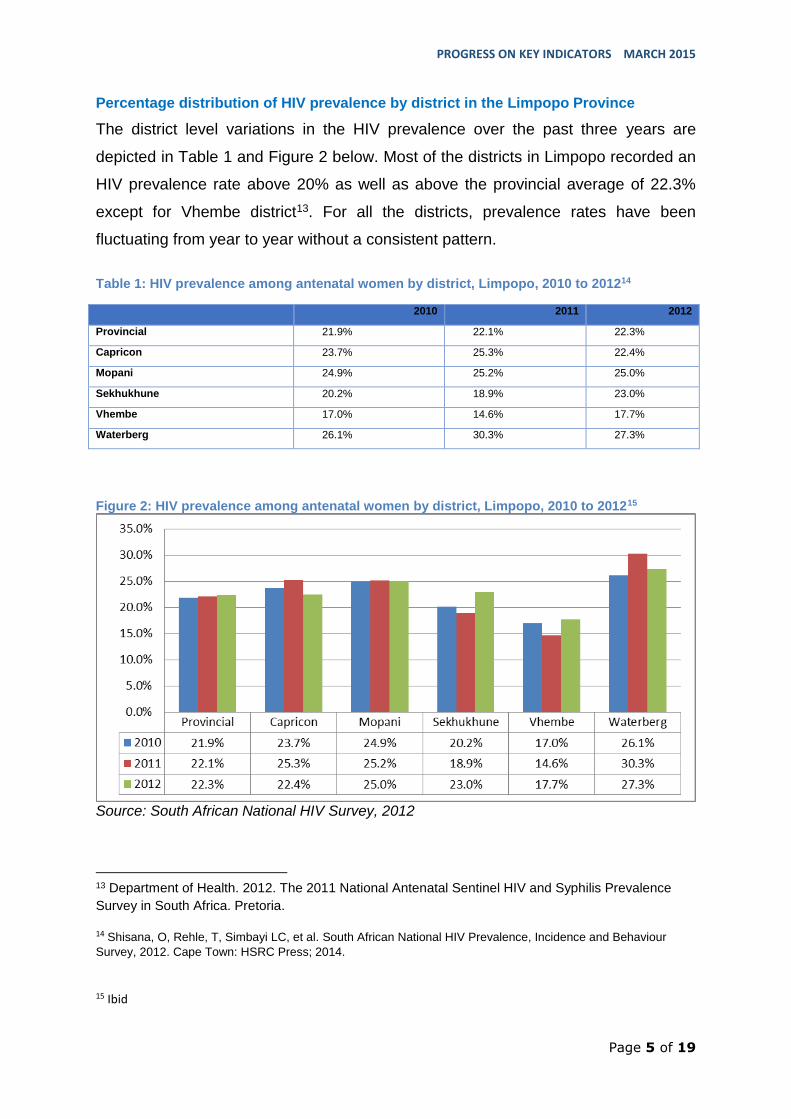
Percentage distribution of HIV prevalence by district in the Limpopo Province
The district level variations in the HIV prevalence over the past three years are
depicted in Table 1 and Figure 2 below. Most of the districts in Limpopo recorded an
HIV prevalence rate above 20% as well as above the provincial average of 22.3%
except for Vhembe district13. For all the districts, prevalence rates have been
fluctuating from year to year without a consistent pattern.
Table 1: HIV prevalence among antenatal women by district, Limpopo, 2010 to 201214
2010 2011 2012
Provincial 21.9% 22.1% 22.3%
Capricon 23.7% 25.3% 22.4%
Mopani 24.9% 25.2% 25.0%
Sekhukhune 20.2% 18.9% 23.0%
Vhembe 17.0% 14.6% 17.7%
Waterberg 26.1% 30.3% 27.3%
Figure 2: HIV prevalence among antenatal women by district, Limpopo, 2010 to 201215
Source: South African National HIV Survey, 2012
13 Department of Health. 2012. The 2011 National Antenatal Sentinel HIV and Syphilis Prevalence
Survey in South Africa. Pretoria.
14 Shisana, O, Rehle, T, Simbayi LC, et al. South African National HIV Prevalence, Incidence and Behaviour
Survey, 2012. Cape Town: HSRC Press; 2014.
15 Ibid
PROGRESS ON KEY INDICATORS MARCH 2015
Page 6 of 19
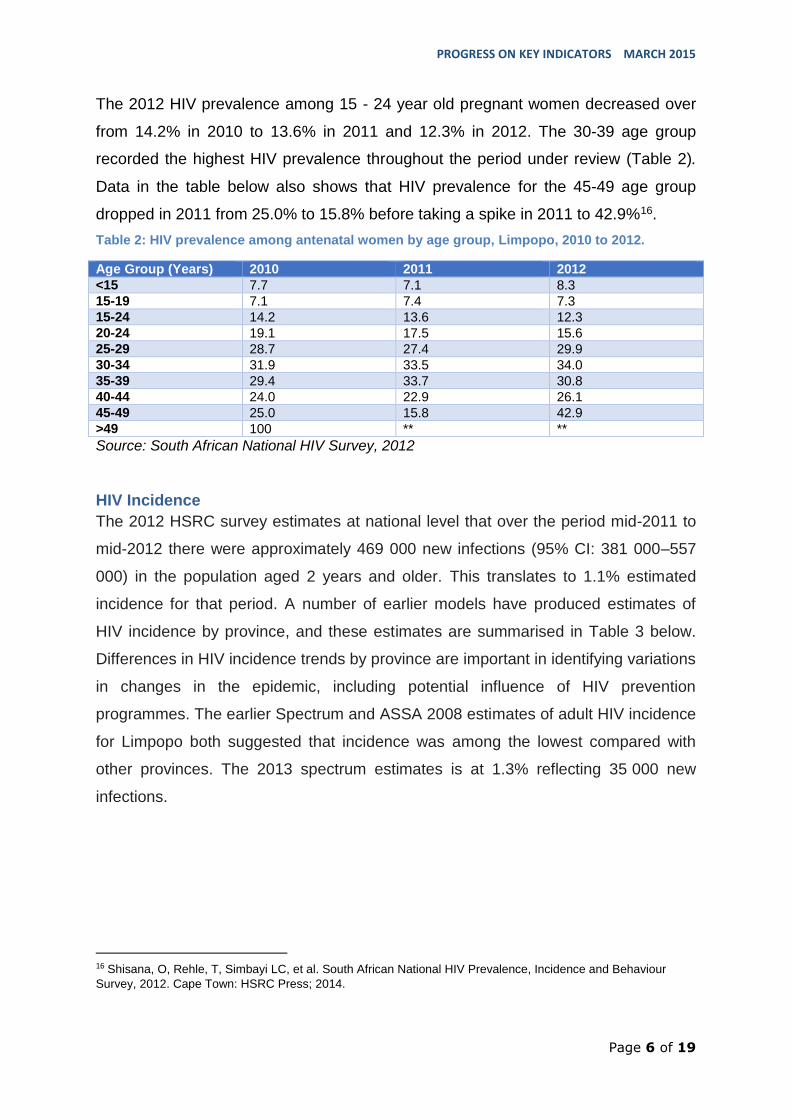
The 2012 HIV prevalence among 15 - 24 year old pregnant women decreased over
from 14.2% in 2010 to 13.6% in 2011 and 12.3% in 2012. The 30-39 age group
recorded the highest HIV prevalence throughout the period under review (Table 2).
Data in the table below also shows that HIV prevalence for the 45-49 age group
dropped in 2011 from 25.0% to 15.8% before taking a spike in 2011 to 42.9%16.
Table 2: HIV prevalence among antenatal women by age group, Limpopo, 2010 to 2012.
Age Group (Years) 2010 2011 2012
<15 7.7 7.1 8.3
15-19 7.1 7.4 7.3
15-24 14.2 13.6 12.3
20-24 19.1 17.5 15.6
25-29 28.7 27.4 29.9
30-34 31.9 33.5 34.0
35-39 29.4 33.7 30.8
40-44 24.0 22.9 26.1
45-49 25.0 15.8 42.9
>49 100 ** **
Source: South African National HIV Survey, 2012
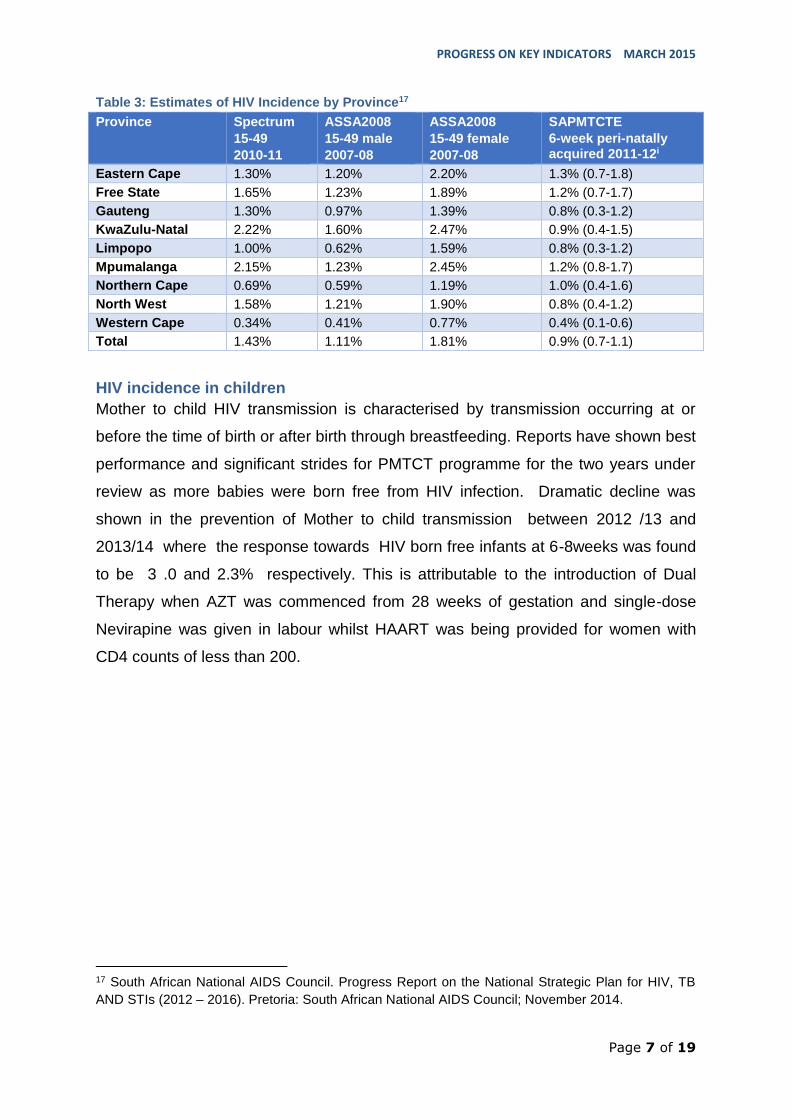
HIV Incidence
The 2012 HSRC survey estimates at national level that over the period mid-2011 to
mid-2012 there were approximately 469 000 new infections (95% CI: 381 000–557
000) in the population aged 2 years and older. This translates to 1.1% estimated
incidence for that period. A number of earlier models have produced estimates of
HIV incidence by province, and these estimates are summarised in Table 3 below.
Differences in HIV incidence trends by province are important in identifying variations
in changes in the epidemic, including potential influence of HIV prevention
programmes. The earlier Spectrum and ASSA 2008 estimates of adult HIV incidence
for Limpopo both suggested that incidence was among the lowest compared with
other provinces. The 2013 spectrum estimates is at 1.3% reflecting 35 000 new
infections.
16 Shisana, O, Rehle, T, Simbayi LC, et al. South African National HIV Prevalence, Incidence and Behaviour
Survey, 2012. Cape Town: HSRC Press; 2014.
PROGRESS ON KEY INDICATORS MARCH 2015
Page 7 of 19
Table 3: Estimates of HIV Incidence by Province17
Province Spectrum
15-49
2010-11
ASSA2008
15-49 male
2007-08
ASSA2008
15-49 female
2007-08
SAPMTCTE
6-week peri-natally acquired 2011-12i
Eastern Cape 1.30% 1.20% 2.20% 1.3% (0.7-1.8)
Free State 1.65% 1.23% 1.89% 1.2% (0.7-1.7)
Gauteng 1.30% 0.97% 1.39% 0.8% (0.3-1.2)
KwaZulu-Natal 2.22% 1.60% 2.47% 0.9% (0.4-1.5)
Limpopo 1.00% 0.62% 1.59% 0.8% (0.3-1.2)
Mpumalanga 2.15% 1.23% 2.45% 1.2% (0.8-1.7)
Northern Cape 0.69% 0.59% 1.19% 1.0% (0.4-1.6)
North West 1.58% 1.21% 1.90% 0.8% (0.4-1.2)
Western Cape 0.34% 0.41% 0.77% 0.4% (0.1-0.6)
Total 1.43% 1.11% 1.81% 0.9% (0.7-1.1)
HIV incidence in children
Mother to child HIV transmission is characterised by transmission occurring at or
before the time of birth or after birth through breastfeeding. Reports have shown best
performance and significant strides for PMTCT programme for the two years under
review as more babies were born free from HIV infection. Dramatic decline was
shown in the prevention of Mother to child transmission between 2012 /13 and
2013/14 where the response towards HIV born free infants at 6-8weeks was found
to be 3 .0 and 2.3% respectively. This is attributable to the introduction of Dual
Therapy when AZT was commenced from 28 weeks of gestation and single-dose
Nevirapine was given in labour whilst HAART was being provided for women with
CD4 counts of less than 200.
17 South African National AIDS Council. Progress Report on the National Strategic Plan for HIV, TB
AND STIs (2012 – 2016). Pretoria: South African National AIDS Council; November 2014.
PROGRESS ON KEY INDICATORS MARCH 2015
Page 8 of 19
Goal 2: Initiating at least 80% of eligible patients on antiretroviral
treatment (ART), with 70% alive and on treatment five years after
initiation
This indicator is concerned about coverage, effectiveness and impact of the ART
programme. Flowing from the country’s national strategic plan for HIV, STIs and TB
2012-2016, the Department’s strategic objectives were to scale up combination
prevention interventions to reduce the rate of new infections, and to improve the
quality of life of people living with HIV, by providing a comprehensive package of
care, treatment and support services to at least 80% of people living with HIV and
AIDS.
According to the LPAC/DOH province annual report for 2012/13, the total number of
patients initiated on ART was 49,276 against a target of 46,000. This represents
107% achievement for that year. In terms of the number of people on ART, the
province reached 197,719 against a target of 188,410 adults and children for the
same year. This represents 105% achievement on that indicator for the same year.
PROGRESS ON KEY INDICATORS MARCH 2015
Page 9 of 19
Goal 3: Reducing the number of new TB infections and deaths from
TB by 50%
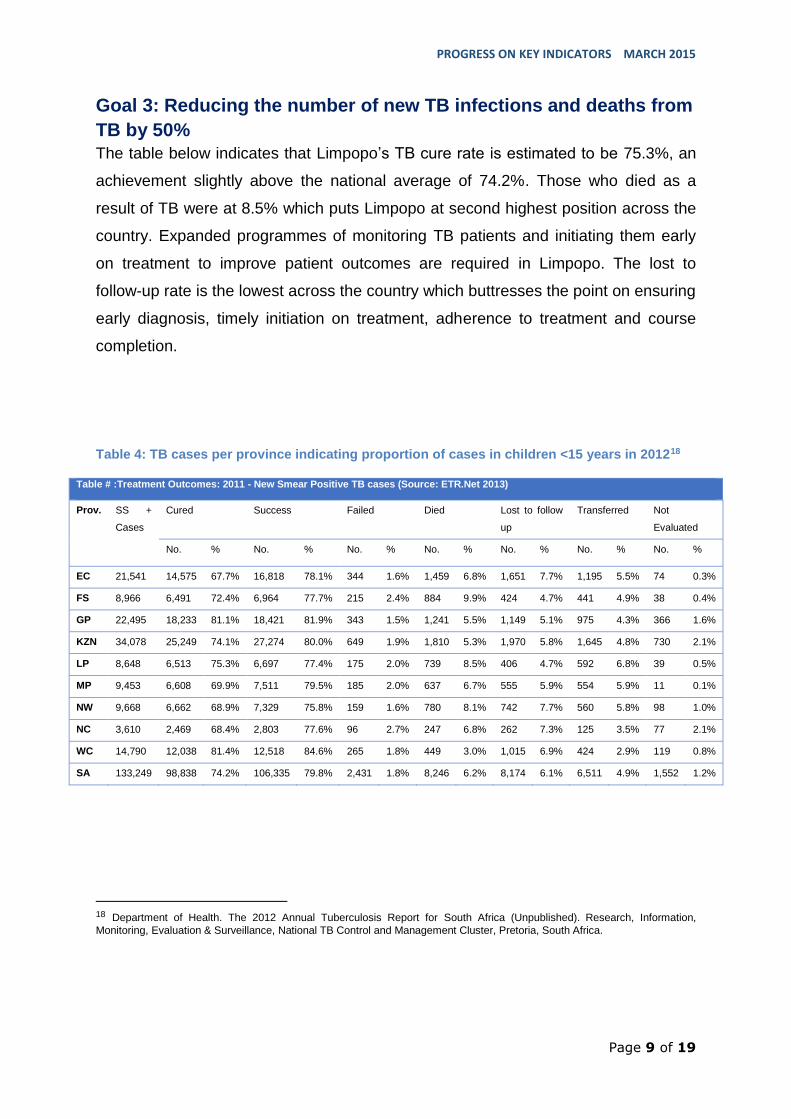
The table below indicates that Limpopo’s TB cure rate is estimated to be 75.3%, an
achievement slightly above the national average of 74.2%. Those who died as a
result of TB were at 8.5% which puts Limpopo at second highest position across the
country. Expanded programmes of monitoring TB patients and initiating them early
on treatment to improve patient outcomes are required in Limpopo. The lost to
follow-up rate is the lowest across the country which buttresses the point on ensuring
early diagnosis, timely initiation on treatment, adherence to treatment and course
completion.
Table 4: TB cases per province indicating proportion of cases in children <15 years in 201218
18 Department of Health. The 2012 Annual Tuberculosis Report for South Africa (Unpublished). Research, Information,
Monitoring, Evaluation & Surveillance, National TB Control and Management Cluster, Pretoria, South Africa.
Table # :Treatment Outcomes: 2011 - New Smear Positive TB cases (Source: ETR.Net 2013)
Prov. SS +
Cases
Cured Success Failed Died Lost to follow
up
Transferred Not
Evaluated
No. % No. % No. % No. % No. % No. % No. %
EC 21,541 14,575 67.7% 16,818 78.1% 344 1.6% 1,459 6.8% 1,651 7.7% 1,195 5.5% 74 0.3%
FS 8,966 6,491 72.4% 6,964 77.7% 215 2.4% 884 9.9% 424 4.7% 441 4.9% 38 0.4%
GP 22,495 18,233 81.1% 18,421 81.9% 343 1.5% 1,241 5.5% 1,149 5.1% 975 4.3% 366 1.6%
KZN 34,078 25,249 74.1% 27,274 80.0% 649 1.9% 1,810 5.3% 1,970 5.8% 1,645 4.8% 730 2.1%
LP 8,648 6,513 75.3% 6,697 77.4% 175 2.0% 739 8.5% 406 4.7% 592 6.8% 39 0.5%
MP 9,453 6,608 69.9% 7,511 79.5% 185 2.0% 637 6.7% 555 5.9% 554 5.9% 11 0.1%
NW 9,668 6,662 68.9% 7,329 75.8% 159 1.6% 780 8.1% 742 7.7% 560 5.8% 98 1.0%
NC 3,610 2,469 68.4% 2,803 77.6% 96 2.7% 247 6.8% 262 7.3% 125 3.5% 77 2.1%
WC 14,790 12,038 81.4% 12,518 84.6% 265 1.8% 449 3.0% 1,015 6.9% 424 2.9% 119 0.8%
SA 133,249 98,838 74.2% 106,335 79.8% 2,431 1.8% 8,246 6.2% 8,174 6.1% 6,511 4.9% 1,552 1.2%
PROGRESS ON KEY INDICATORS MARCH 2015
Page 10 of 19
Goal 4: Ensuring an enabling and accessible legal framework that
protects and promotes human rights in order to support
implementation of the NSP.
Chapter 2 of the South African Constitution makes provision for the protection and
promotion of human rights and obliges the state to ensure the realisation of such
rights particularly for specific vulnerable groups. These rights include amongst
others, the rights to equality, dignity, life, freedom, privacy and security of the person,
irrespective of sexual orientation. In line with this provision, the Limpopo province
emphasised the need for programming that is sensitive and targeted at such groups
of people as truck drivers, farm workers, and commercial sex workers, among
others.
Goal 5: Reducing self-reported stigma related to HIV and TB by at
least 50%.
The stigma index is the indicator for measuring this goal; the index is currently not
measured in the DHIS. SANAC is driving efforts to implement the stigma index to
monitor efforts to reduce stigma and discrimination and meet this fifth goal of the
NSP. Local government departments continue to deliver stigma and discriminating
reduction programmes in line with the NSP goals and objectives.
PROGRESS ON KEY INDICATORS MARCH 2015
Page 11 of 19
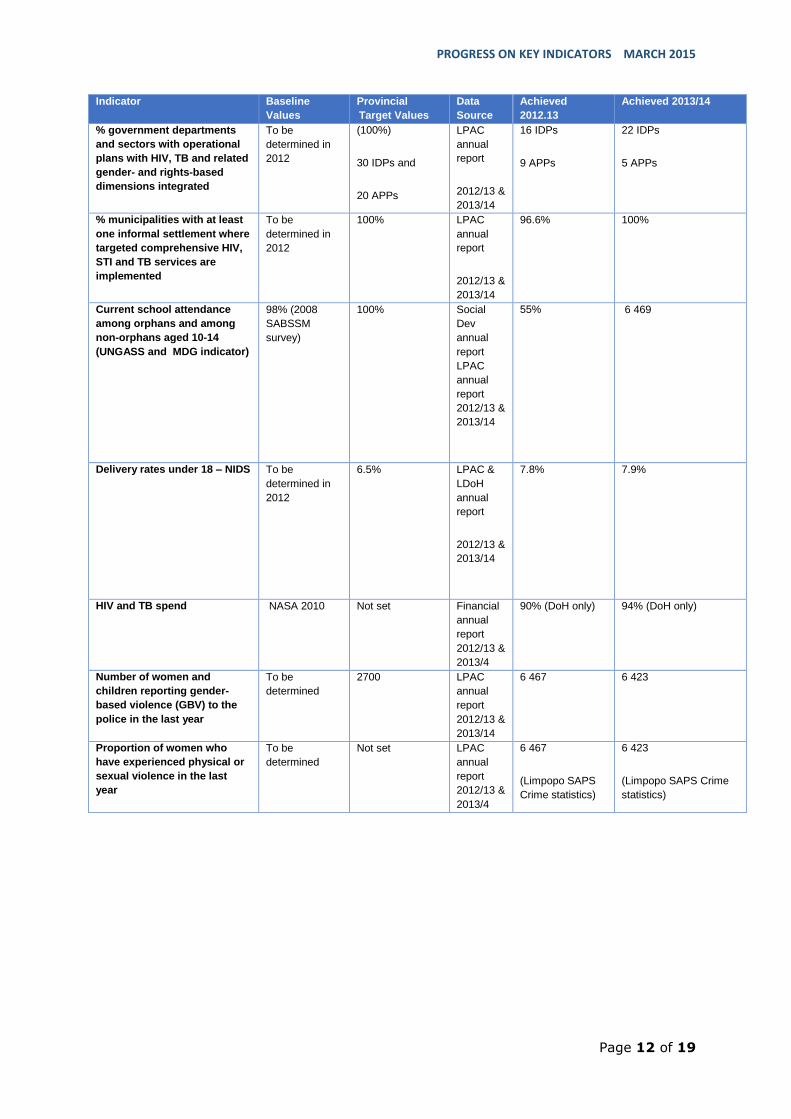
Strategic objective 1: Addressing social and structural drivers of HIV, STI and
TB prevention, care and impact
Social and structural approaches address the social, economic, political, cultural and
environmental factors that lead to increased vulnerability. As pointed out in the NSP,
every government department — at national, provincial and municipal levels — has a
critical role to play in addressing the structural factors driving HIV and TB. With a
cumulative total of 22 independent development plans (IDPs) developed by different
sectors mainstreaming HIV, TB and STIs, Limpopo province is on track to meet its
target by 2016. In line with the human rights provision of the Constitution of South
Africa as well as strategic objective 4 of the PSP, the Limpopo province also reached
out to under-privileged communities of people staying in informal settlements
providing HIV and TB services. By the end of 2013/14 year, the province had
reached its target of 100%.
In terms of orphans and vulnerable children (OVC) school attendance, the province
was at 55% by 2012/13 year. While it is acknowledged in the UNGASS report that
data for this indicator has been consistently missing over the years, the province as
a source of the data needs to be aggressive in collecting data on this indicator.
Spending on HIV/TB was also on track for the province. As shown by the data in the
table below, the province achieved 90% and 94% spending for the two year period
under review. Against a target of 2,700, the province has already overachieved by
reaching 247% by the end of 2013/14 year on the number of women and children
reporting gender-based violence (GBV) to the police in the last year. This
achievement for Limpopo could be a sign of the comprehensive programmes rolled
out to reach the target population as well as the multi-sectoral approach used
effectively to address social issues related to HIV.
PROGRESS ON KEY INDICATORS MARCH 2015
Page 12 of 19
Indicator Baseline
Values
Provincial
Target Values
Data
Source
Achieved
2012.13
Achieved 2013/14
% government departments
and sectors with operational
plans with HIV, TB and related
gender- and rights-based
dimensions integrated
To be
determined in
2012
(100%)
30 IDPs and
20 APPs
LPAC
annual
report
2012/13 &
2013/14
16 IDPs
9 APPs
22 IDPs
5 APPs
% municipalities with at least
one informal settlement where
targeted comprehensive HIV,
STI and TB services are
implemented
To be
determined in
2012
100% LPAC
annual
report
2012/13 &
2013/14
96.6% 100%
Current school attendance
among orphans and among
non-orphans aged 10-14
(UNGASS and MDG indicator)
98% (2008
SABSSM
survey)
100% Social
Dev
annual
report
LPAC
annual
report
2012/13 &
2013/14
55%
6 469
Delivery rates under 18 – NIDS To be
determined in
2012
6.5% LPAC &
LDoH
annual
report
2012/13 &
2013/14
7.8% 7.9%
HIV and TB spend NASA 2010 Not set Financial
annual
report
2012/13 &
2013/4
90% (DoH only) 94% (DoH only)
Number of women and
children reporting gender-
based violence (GBV) to the
police in the last year
To be
determined
2700 LPAC
annual
report
2012/13 &
2013/14
6 467 6 423
Proportion of women who
have experienced physical or
sexual violence in the last
year
To be
determined
Not set LPAC
annual
report
2012/13 &
2013/4
6 467
(Limpopo SAPS
Crime statistics)
6 423
(Limpopo SAPS Crime
statistics)
PROGRESS ON KEY INDICATORS MARCH 2015
Page 13 of 19
Strategic Objective 2: Preventing new HIV, STI and TB infections
"Targeted, evidence-based combination prevention is needed to achieve the long-
term goal of zero new HIV, STI and TB infections. Focusing prevention efforts in high
transmission areas and on key populations is likely to have the greatest impact,
whilst simultaneously sustaining efforts in the general population19." A Combination
Prevention approach acknowledges that no prevention intervention on its own can
adequately address the HIV and TB epidemics at the population and individual
levels. Combination prevention uses a mix of structural, social, behavioural and
biomedical interventions that, when implemented simultaneously, will have the
greatest power to reduce transmission, as well as mitigate individuals’ susceptibility
and vulnerability to infection20.
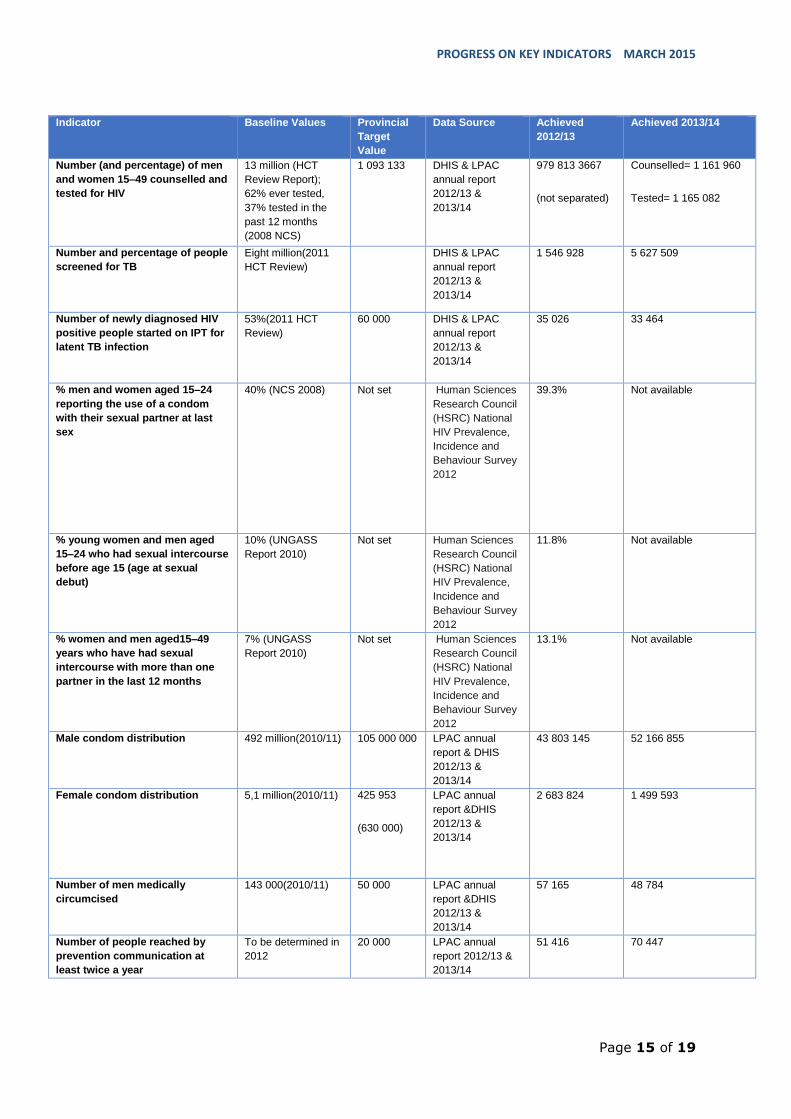
Reach of HCT Programme and TB Screening in the province
As indicated in the introductory section of this report above, a combination of factors
including the HCT campaign launched in 2010 and outreach programmes targeted at
specific vulnerable populations contributed to the achievements under this indicator.
With a target of reaching 1 093 133 with HCT services by the end of 2016, the
province had reached 1 165 082 people who are counselled and tested. This
represents above the target achievement by the end of 2013/14 year. While the table
below shows that there were no set targets for the number of people screened for
TB, an achievement of 5 627 509 people reached which is five more times of those
counselled and tested for HIV for the same period could be an indication of
consistency in the integration of health services in the province.
According to HIV treatment guidelines of, all HIV positive but TB negative people
should be initiated on IPT to prevent them from developing active TB disease.
Against a cumulative target of 60,000 on this indicator for the period under review,
the province has already overachieved reaching 68,490 people. Condom use among
15-24 age group remained low in the province. An achievement of 39.3% is below
19 SANAC. National strategic plan on HIV, STIs and TB 2012-2016. Pretoria: SANAC; 2011.
20 SANAC. National strategic plan on HIV, STIs and TB 2012-2016. Pretoria: SANAC; 2011.
PROGRESS ON KEY INDICATORS MARCH 2015
Page 14 of 19
the baseline value of 40%. This is an area the province needs to improve on. This
trend in performance is observed again for indicators on young women and men
having sexual intercourse before the age of 15 and having multiple sexual partners.
Performance on these indicators has remained below the baseline values21.
Reach of male condom distribution
In terms of male condom distribution, the province appears to be on target to reach
105,000,000 condoms distributed having already reached a cumulative number of
over 90,000,000 by 2013/14 year. However, the situation was better for female
condom distribution as the province has already more than doubled the target of
425 953 female condoms distributed. This is a positive sign and an indication that
maybe the province should extend its focus to cover correct and consistent use of
condoms by target populations.
Reach of Male medical circumcision
In accordance with Voluntary Male Medical Circumcision (VMMC) Policy of South
Africa there is a need to upscale this programme and reach more men as this is
regarded as one of the effective strategies to reduce HIV transmission amongst
men. With a target of 50,000 men medically circumcised, the Limpopo province has
a cumulative achievement of 105,949 which is already more than double the set
target by the end of 2013/14 year.
With an achievement of over 70,000 people reached with prevention communication
at least twice a year against a target of 20,000, the province has been effective in
increasing its reach to the target population which may explain its over achievement
in most of its indicators.
21 LPAC & LDoH Annual report 2012/13 & 2013/14.
PROGRESS ON KEY INDICATORS MARCH 2015
Page 15 of 19
Indicator Baseline Values Provincial
Target
Value
Data Source Achieved
2012/13
Achieved 2013/14
Number (and percentage) of men
and women 15–49 counselled and
tested for HIV
13 million (HCT
Review Report);
62% ever tested,
37% tested in the
past 12 months
(2008 NCS)
1 093 133 DHIS & LPAC
annual report
2012/13 &
2013/14
979 813 3667
(not separated)
Counselled= 1 161 960
Tested= 1 165 082
Number and percentage of people
screened for TB
Eight million(2011
HCT Review)
DHIS & LPAC
annual report
2012/13 &
2013/14
1 546 928 5 627 509
Number of newly diagnosed HIV
positive people started on IPT for
latent TB infection
53%(2011 HCT
Review)
60 000 DHIS & LPAC
annual report
2012/13 &
2013/14
35 026 33 464
% men and women aged 15–24
reporting the use of a condom
with their sexual partner at last
sex
40% (NCS 2008) Not set Human Sciences
Research Council
(HSRC) National
HIV Prevalence,
Incidence and
Behaviour Survey
2012
39.3% Not available
% young women and men aged
15–24 who had sexual intercourse
before age 15 (age at sexual
debut)
10% (UNGASS
Report 2010)
Not set Human Sciences
Research Council
(HSRC) National
HIV Prevalence,
Incidence and
Behaviour Survey
2012
11.8% Not available
% women and men aged15–49
years who have had sexual
intercourse with more than one
partner in the last 12 months
7% (UNGASS
Report 2010)
Not set Human Sciences
Research Council
(HSRC) National
HIV Prevalence,
Incidence and
Behaviour Survey
2012
13.1% Not available
Male condom distribution 492 million(2010/11) 105 000 000 LPAC annual
report & DHIS
2012/13 &
2013/14
43 803 145 52 166 855
Female condom distribution 5,1 million(2010/11) 425 953
(630 000)
LPAC annual
report &DHIS
2012/13 &
2013/14
2 683 824 1 499 593
Number of men medically
circumcised
143 000(2010/11) 50 000 LPAC annual
report &DHIS
2012/13 &
2013/14
57 165 48 784
Number of people reached by
prevention communication at
least twice a year
To be determined in
2012
20 000 LPAC annual
report 2012/13 &
2013/14
51 416 70 447
PROGRESS ON KEY INDICATORS MARCH 2015
Page 16 of 19
Strategic objective 3: Sustaining health and well being
Morbidity and Mortality
As part of their contribution to the work of Health Data Advisory and Co-ordination
Committee (HDACC), the Medical Research Council (MRC) of South Africa and the
School of Actuarial Sciences at the University of Cape Town (UCT), released data
from the Rapid Mortality Surveillance (RMS) System on four key outcome indicators
for South Africa in August 2012. The data reflected that the life expectancy of South
Africans has increased from 56.5 years in 2009 to 60 years in 2011. The Infant
Mortality Rate (IMR) decreased from 40 deaths per 1000 live births in 2009 to 30
deaths per 1000 live births in 2011; and the Under-5 Mortality Rate decreased from
56 deaths per 1000 live births in 2009 to 42 deaths per 1000 live births in 2011.
These achievements far exceeded the targets set for 2014 in the NSDA of the Health
Sector for 2010 to 2014. Undoubtedly, more work still needs to be done to fight
maternal and infant mortality, however, the NDoH report points to the fact that South
Africa should recognise and leverage these profound achievements as a celebration
of the unity of purpose and the high value our nation places on the wellbeing and
productivity of its children, mothers, workers and society at large.
Control and management of Tuberculosis in the province
Based on data obtained from the ETR.Net system, the Mpumalanga TB programme
has been largely successful. Inter-sectoral collaboration is very crucial towards
winning the battle against the scourge of HIV and AIDS, TB and STI. At sub-
national level this need to be elevated for the purpose of monitoring and
evaluation of HIV and TB programmatic activities as well as reducing infection
rates and the related burden of diseases affecting our communities. For the
percentage of people per year becoming eligible who receive ART, the province
attained 51% towards the 2016 target of 188,410. The rates of TB case registration
is reduced from the baseline values and also lower than provincial target as reflected
by a 137/100,000 in 2012/13 and 140/100,000 in 2013/14 year. The province is on
track to reach a target of 22,000 TB case detection by 2016 as they have already
reached over 90% of the target.
PROGRESS ON KEY INDICATORS MARCH 2015
Page 17 of 19
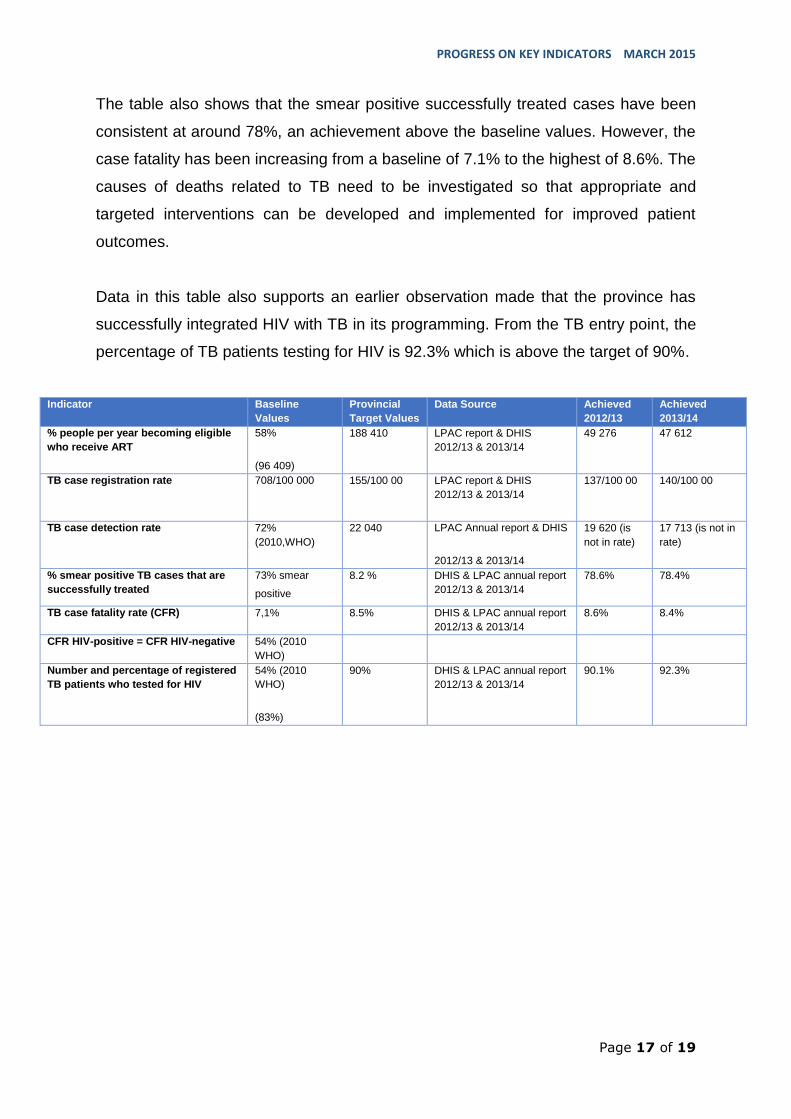
The table also shows that the smear positive successfully treated cases have been
consistent at around 78%, an achievement above the baseline values. However, the
case fatality has been increasing from a baseline of 7.1% to the highest of 8.6%. The
causes of deaths related to TB need to be investigated so that appropriate and
targeted interventions can be developed and implemented for improved patient
outcomes.
Data in this table also supports an earlier observation made that the province has
successfully integrated HIV with TB in its programming. From the TB entry point, the
percentage of TB patients testing for HIV is 92.3% which is above the target of 90%.
Indicator Baseline
Values
Provincial
Target Values
Data Source Achieved
2012/13
Achieved
2013/14
% people per year becoming eligible
who receive ART
58%
(96 409)
188 410 LPAC report & DHIS
2012/13 & 2013/14
49 276 47 612
TB case registration rate 708/100 000
155/100 00 LPAC report & DHIS
2012/13 & 2013/14
137/100 00 140/100 00
TB case detection rate 72%
(2010,WHO)
22 040 LPAC Annual report & DHIS
2012/13 & 2013/14
19 620 (is
not in rate)
17 713 (is not in
rate)
% smear positive TB cases that are
successfully treated
73% smear
positive
8.2 % DHIS & LPAC annual report
2012/13 & 2013/14
78.6% 78.4%
TB case fatality rate (CFR) 7,1% 8.5% DHIS & LPAC annual report
2012/13 & 2013/14
8.6% 8.4%
CFR HIV-positive = CFR HIV-negative 54% (2010
WHO)
Number and percentage of registered
TB patients who tested for HIV
54% (2010
WHO)
(83%)
90% DHIS & LPAC annual report
2012/13 & 2013/14
90.1% 92.3%
PROGRESS ON KEY INDICATORS MARCH 2015
Page 18 of 19
Data Elements Missing and to be collected by Limpopo AIDS Council
Strategic Objective 3
Number of all newly TB patients who are expressed as a propotion of all newly
registered TB patients.
CFR HIV-positive = CFR HIV-negative