Progress on incorporating climate change into...
18
Progress on incorporating climate change into management of California’ s water resources Jamie Anderson & Francis Chung & Michael Anderson & Levi Brekke & Daniel Easton & Messele Ejeta & Roy Peterson & Richard Snyder Received: 2 August 2006 / Accepted: 5 October 2007 / Published online: 22 December 2007 # Springer Science + Business Media B.V. 2007 Abstract This paper presents preliminary efforts by agencies managing California’ s water resources to incorporate climate change research into their planning and management tools. Projected increases in air temperature may lead to changes in the precipitation patterns, runoff timing and volume, sea level rise, and changes in the amount of irrigation water needed due to modified evapotranspiration rates. Historical observations of climate change related to California’ s water resources are shown. Results from preliminary modeling studies of potential impacts of climate change to operations of the State Water Project and Central Valley Project, Delta water quality and water levels, flood forecasting and evapotranspiration rates are presented. Future directions to incorporate risk assessment are discussed. 1 Introduction California water planners are concerned about potential climate change effects on the State’ s water resources. Projected increases in air temperature may lead to changes in the timing, amount and form of precipitation – rain or snow, changes in runoff timing and volume, increases in sea level, and changes in the amount of irrigation water needed due to modified evapotranspiration rates. More than 20 million Californians rely on two large water projects: the State Water Project (SWP) and federal Central Valley Project (CVP) (Fig. 1). These complex water storage and conveyance systems are operated by the California Department of Water Resources (DWR) and the US Bureau of Reclamation (Reclamation) for water supply, flood management, environmental protection and recreation. Climatic Change (2008) 87 (Suppl 1):S91–S108 DOI 10.1007/s10584-007-9353-1 J. Anderson (*) : F. Chung : M. Anderson : D. Easton : M. Ejeta : R. Peterson California Department of Water Resources, Sacramento, CA, USA e-mail: [email protected] L. Brekke US Bureau of Reclamation, Technical Service Center, Denver, CO, USA R. Snyder Department of Land, Air and Water Resources, University of California, Davis, CA, USA
Transcript of Progress on incorporating climate change into...

Progress on incorporating climate changeinto management of California’s water resources
Jamie Anderson & Francis Chung & Michael Anderson &
Levi Brekke & Daniel Easton & Messele Ejeta &
Roy Peterson & Richard Snyder
Received: 2 August 2006 /Accepted: 5 October 2007 / Published online: 22 December 2007# Springer Science + Business Media B.V. 2007
Abstract This paper presents preliminary efforts by agencies managing California’s waterresources to incorporate climate change research into their planning and management tools.Projected increases in air temperature may lead to changes in the precipitation patterns,runoff timing and volume, sea level rise, and changes in the amount of irrigation waterneeded due to modified evapotranspiration rates. Historical observations of climate changerelated to California’s water resources are shown. Results from preliminary modelingstudies of potential impacts of climate change to operations of the State Water Project andCentral Valley Project, Delta water quality and water levels, flood forecasting andevapotranspiration rates are presented. Future directions to incorporate risk assessment arediscussed.
1 Introduction
California water planners are concerned about potential climate change effects on theState’s water resources. Projected increases in air temperature may lead to changes in thetiming, amount and form of precipitation – rain or snow, changes in runoff timing andvolume, increases in sea level, and changes in the amount of irrigation water needed due tomodified evapotranspiration rates.
More than 20 million Californians rely on two large water projects: the State Water Project(SWP) and federal Central Valley Project (CVP) (Fig. 1). These complex water storage andconveyance systems are operated by the California Department of Water Resources (DWR)and the US Bureau of Reclamation (Reclamation) for water supply, flood management,environmental protection and recreation.
Climatic Change (2008) 87 (Suppl 1):S91–S108DOI 10.1007/s10584-007-9353-1
J. Anderson (*) : F. Chung :M. Anderson :D. Easton :M. Ejeta : R. PetersonCalifornia Department of Water Resources, Sacramento, CA, USAe-mail: [email protected]
L. BrekkeUS Bureau of Reclamation, Technical Service Center, Denver, CO, USA
R. SnyderDepartment of Land, Air and Water Resources, University of California, Davis, CA, USA

On June 1, 2005, Gov. Arnold Schwarzenegger issued Executive Order S-3-05establishing greenhouse gas emission targets for California and requiring biennial reportson potential climate change effects on several areas, including water resources. In responseto that executive order, a DWR-Reclamation work team prepared a technical memorandumreport titled “Progress on Incorporating Climate Change into Management of California’sWater Resources” (DWR 2006a). This paper provides an overview of the effortsdocumented in that report on integrating climate change into existing water resourcesplanning and management tools and methodologies.
Fig. 1 State water project and Central Valley project with delta highlighted
S92 Climatic Change (2008) 87 (Suppl 1):S91–S108
This paper presents analysis of historical data for trends related to climate change, andpreliminary results from modeling studies of projected climate change conditions.Preliminary climate change impacts analyses focus on (a) snowpack, (b) runoff, (c)operations of the SWP and CVP, (d) water quality and water levels in the Sacramento–SanJoaquin Delta for both present and future sea level rise conditions, and (e) evapotranspi-ration rates. These analyses represent first steps in incorporating climate change into theplanning and management process for the SWP and CVP. Continuing efforts and futuredirections with an emphasis on moving towards probability/risk assessment are presented atthe end of the paper.
2 Climate change in California
For California, over the past century there have been observed changes in air temperatures,annual precipitation, runoff, and sea levels. It is possible that these changes will beaccentuated as the global climate continues to warm. These changes may lead to impacts toCalifornia’s water resources and water project operations. An overview of the observedchanges in air temperature, precipitation, runoff and sea level is presented here as areference point for the later discussions of climate change impacts on management ofCalifornia’s water resources.
2.1 Air temperature
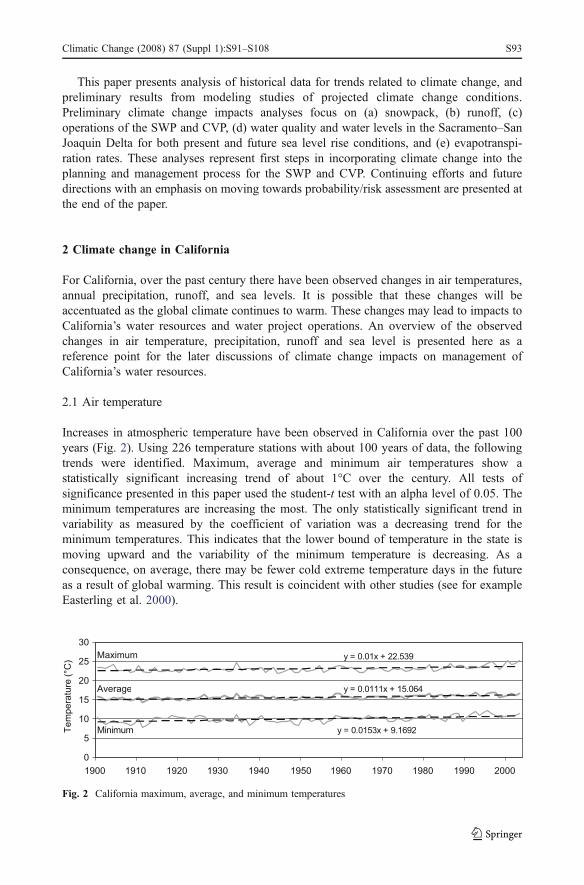
Increases in atmospheric temperature have been observed in California over the past 100years (Fig. 2). Using 226 temperature stations with about 100 years of data, the followingtrends were identified. Maximum, average and minimum air temperatures show astatistically significant increasing trend of about 1°C over the century. All tests ofsignificance presented in this paper used the student-t test with an alpha level of 0.05. Theminimum temperatures are increasing the most. The only statistically significant trend invariability as measured by the coefficient of variation was a decreasing trend for theminimum temperatures. This indicates that the lower bound of temperature in the state ismoving upward and the variability of the minimum temperature is decreasing. As aconsequence, on average, there may be fewer cold extreme temperature days in the futureas a result of global warming. This result is coincident with other studies (see for exampleEasterling et al. 2000).
y = 0.01x + 22.539
y = 0.0111x + 15.064
y = 0.0153x + 9.1692
0
5
10
15
20
25
30
1900 1910 1920 1930 1940 1950 1960 1970 1980 1990 2000
Te
mp
era
ture
(°C
)
Maximum
Minimum
Average
Fig. 2 California maximum, average, and minimum temperatures
Climatic Change (2008) 87 (Suppl 1):S91–S108 S93

2.2 Precipitation
From 1890 to 2002, the average annual precipitation from 102 stations across California is605 mm (Fig. 3). The last 20 years is the wettest 20-year period in the record with an annualaverage of 640 mm of precipitation. Precipitation is highly variable over the entire periodwith no statistically significant trend. The variability in precipitation as measured by thecoefficient of variation increased over the twentieth century. Climate change could affectthe amount, form, and timing of precipitation.
2.3 Runoff
Runoff for major rivers in the Sacramento and San Joaquin basins is represented by indicesthat reflect the current and the previous years’ runoff (DWR 1998). Over the past 100 yearsthere is no significant trend in either the San Joaquin Index or the Sacramento River Index.These results are consistent with the precipitation trends.
Spring runoff provides a significant portion of the water supply for dry summers andfalls in California. Over the past 100 years, the runoff volume during April–July hasdecreased by 23% for the Sacramento basin (Fig. 4) and 19% for the San Joaquin basin.This indicates that a greater percentage of the annual runoff is occurring outside thetraditional snowmelt season possibly as a result of an earlier onset of snowpack melting. Ifthe snowmelt season were to migrate to earlier times in the year as a result of globalwarming, it could potentially reduce the amount of runoff that can be stored for use later inthe year because runoff would be occurring when flood control requirements dominatereservoir storage requirements.
2.4 Sea level rise
Historical records show twentieth century sea levels rose globally with an average increaseranging from 0.1 to 0.2 m (IPCC 2001). Over the past 100 years, sea level at Golden Gatehas risen more than 0.21 m (Fig. 5). The increasing 19-year tidal trend reflects changes overthe Metonic cycle, the cycle of the moon’s inclination relative to the Earth. Sea levels areexpected to continue to rise under global warming due to thermal expansion of the oceanand melting of glaciers and polar ice caps. Simulations of future climate change scenariosshow increases in global sea levels ranging from 0.09 to 0.88 m by the end of the twenty-first century (IPCC 2001).
0
200
400
600
800
1000
1200
1890 1900 1910 1920 1930 1940 1950 1960 1970 1980 1990 2000
Pre
cip
ita
tio
n (
mm
)
Fig. 3 Average annual precipitation for California for 1890–2002
S94 Climatic Change (2008) 87 (Suppl 1):S91–S108

For California’s water supply, the largest effect of sea level rise (SLR) would likely be inthe Sacramento–San Joaquin Delta (DWR 2005a). Increased intrusion of salt water from theocean into the Delta could lead to increased releases of water from upstream reservoirs orreduced pumping from the Delta to maintain compliance with Delta water quality standards.
3 Approach
3.1 Climate change scenarios
Preliminary impacts assessments were conducted on four climate change scenarios thatrepresent two green house gas emissions scenarios (A2 and B1 from the IntergovernmentalPanel on Climate Change’s Fourth Assessment, IPCC4) simulated by two different GlobalClimate Models (GFDL and PCM) (Cayan et al. 2008). All four scenarios project increases inair temperature. The PCM B1 scenario showed a slight increase in precipitation, while allother scenarios projected decreases in precipitation. No probabilities of occurrence have beenassociated with these scenarios, thus potential impacts to water resources are shown relativeto one another, but no likelihoods are associated with these impacts. Due to space limitationsin this paper, results will be shown for the scenarios with the most and least warming, GFDLA2 and PCM B1 respectively. See DWR (2006a) for analysis of all scenarios.
3.2 Modeling approach
To examine the potential impacts of the climate change scenarios on California’s waterresources, a sequence of models were used to translate global scenarios to regional andlocal impacts (Fig. 6).
Fig. 5 Historical annual mean sea level at Golden Gate, 1900–2003
0
4,000
8,000
12,000
16,000
1901 1911 1921 1931 1941 1951 1961 1971 1981 1991 2001
Water Year (October 1 - September 30)
April-July
Runoff
Volu
me (
tAF
)
Linear trend shows 23% decrease over 100 years
Fig. 4 April–July runoff volume for the Sacramento Basin
Climatic Change (2008) 87 (Suppl 1):S91–S108 S95

3.2.1 Global scale modeling
Global Climate Models (GCMs) provided global scale results including projections for airtemperature and precipitation. The GCM results are archived at the Lawrence LivermoreNational Laboratory’s Program for Climate Model Diagnosis and Intercomparison(PCMDI). Various input data, including rainfall and snowmelt runoff, used in modelingregional water projects, such as the SWP and the CVP, are represented at the local level.Thus, it is necessary to establish the appropriate links between GCM global scalemeteorological output data and local scale model input data (Fig. 6). Projected data centeredaround 2050 (2035–2064) were compared to GCM representations of historical conditionscentered around 1976 (1961–1990) (Table 1).
3.2.2 Regional scale modeling
Output from the GCMs was downscaled to the regional scale by applying statistical biascorrection using historical meteorological data. The downscaled data were then used asinput to the Variable Infiltration Capacity (VIC) hydrologic model, which has beensuccessfully applied at various resolutions of latitude and longitude and has been foundsuitable for California’s spatial variability in topography (Maurer 2007). The VIC modelthen produced precipitation, air temperature, wind speed, surface air humidity, and soilmoisture results over California at 1/8th degree latitude/longitude resolution. Statisticalanalysis was applied to the rainfall runoff data from the VIC hydrological model to producestreamflows at several locations in California for 1950–2100 (Maurer 2007). This analysis
Fig. 6 Approach for analyzing potential water resources impacts of climate change
Table 1 Average changes in air temperature and precipitation projections
Scenario Air temperature °C Precipitation, in./yr
Northern CA Southern CA Northern CA Southern CA
2050 GFDL A2 2.3 2.3 −0.75 −0.222050 PCM B1 0.8 0.9 0.83 −0.08
S96 Climatic Change (2008) 87 (Suppl 1):S91–S108
is necessary to route the derived runoff through defined river systems to obtain streamflowsat specified locations. These streamflow data were used to determine a relationship betweenhistorical and projected future conditions, and that relationship was used to conduct waterresources impacts analysis for climate change projections as described in the remainder ofthis paper.
3.2.3 SWP–CVP impacts modeling approach
To quantify potential SWP–CVP impacts for climate change scenarios, CalSim-II, a watersupply planning simulation model developed by DWR and Reclamation, was used (DWR2006b). CalSim-II simulates operation of the SWP–CVP system over a 73-year hydrologicsequence at a monthly time step. The model assumes that water resources facilities, landuse, water supply contracts, and regulatory requirements are predictable at an assumedfuture level of development. The historical flow record from October 1922 to September1994, adjusted for the influence of land-use change and upstream flow regulation, is used torepresent the possible range of water supply conditions at the assumed level ofdevelopment.
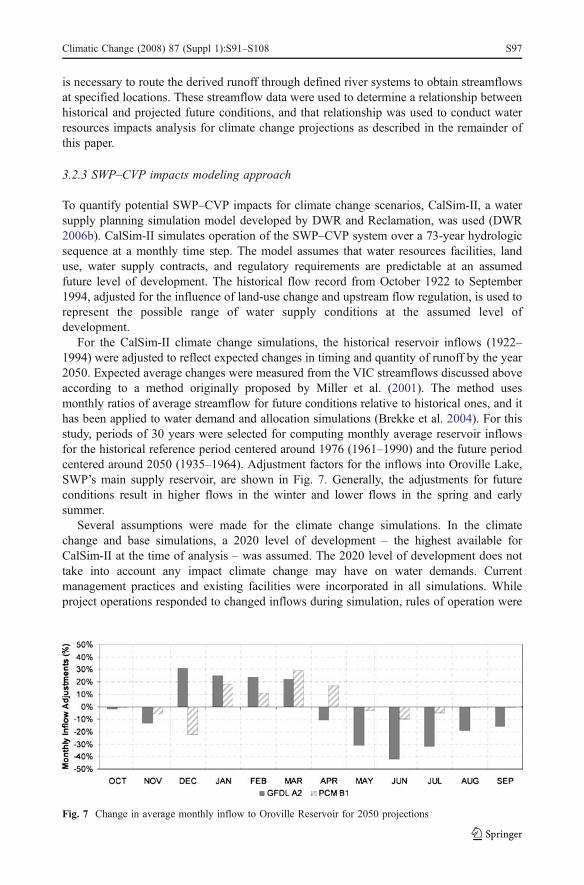
For the CalSim-II climate change simulations, the historical reservoir inflows (1922–1994) were adjusted to reflect expected changes in timing and quantity of runoff by the year2050. Expected average changes were measured from the VIC streamflows discussed aboveaccording to a method originally proposed by Miller et al. (2001). The method usesmonthly ratios of average streamflow for future conditions relative to historical ones, and ithas been applied to water demand and allocation simulations (Brekke et al. 2004). For thisstudy, periods of 30 years were selected for computing monthly average reservoir inflowsfor the historical reference period centered around 1976 (1961–1990) and the future periodcentered around 2050 (1935–1964). Adjustment factors for the inflows into Oroville Lake,SWP’s main supply reservoir, are shown in Fig. 7. Generally, the adjustments for futureconditions result in higher flows in the winter and lower flows in the spring and earlysummer.
Several assumptions were made for the climate change simulations. In the climatechange and base simulations, a 2020 level of development – the highest available forCalSim-II at the time of analysis – was assumed. The 2020 level of development does nottake into account any impact climate change may have on water demands. Currentmanagement practices and existing facilities were incorporated in all simulations. Whileproject operations responded to changed inflows during simulation, rules of operation were
Fig. 7 Change in average monthly inflow to Oroville Reservoir for 2050 projections
Climatic Change (2008) 87 (Suppl 1):S91–S108 S97

not changed to mitigate the impacts. Lastly, impacts of sea level rise on project operationswere not considered.
3.2.4 Delta impacts modeling approach
The Delta Simulation Model 2 (DSM2) (DWR 2006c) was used to examine how changes inSWP and CVP operations would affect flow rates, water levels and water quality in theSacramento–San Joaquin Delta (Fig. 1). The CalSim-II results provide Delta inflows andexports resulting from operation of the SWP and CVP for 2050 projected changes in reservoirinflows. Thus the results for the Delta reflect adjustments in reservoir operations and exportsfor climate change. Due to increased computational requirements, the Delta studies use a 16-year analysis period (Oct 1976 to Sept 1991) that is a subset of the CalSim-II results thatcontains a range of wet and dry conditions that reflects the hydrologic variability of thesystem. Although DSM2 simulations were run for both present sea level and projected 0.3 msea level rise scenarios, Delta inflows and exports provided by CalSim-II do not account forsea level rise.
4 SWP–CVP impacts
Using current management practices and existing system facilities, shifts in precipitationand runoff will directly affect deliveries and reservoir storage levels for the SWP and CVP.Analysis of the climate change CalSim-II simulations is provided below.
4.1 SWP deliveries
Annual water deliveries in the base and climate change CalSim-II simulations werecompared to assess impacts on the SWP and CVP. Annual delivery percent timeexceedance curves were assembled from the 73-year annual values. Figure 8 shows thepercent time exceedance curves for annual SWP deliveries. The drier climate andsignificant shift in seasonal runoff for the GFDL A2 scenario resulted in consistentlylower delivery capability. The slightly wetter climate and slight reduction in runoff in the
Fig. 8 Percent time of exceedance for SWP deliveries
S98 Climatic Change (2008) 87 (Suppl 1):S91–S108

late spring and summer for the PCM B1 scenario resulted in higher delivery capability forthe SWP at the lower end of the delivery spectrum due to more water being available duringdry years and roughly equivalent delivery capability to the base case the rest of the time.The 50% exceedance level delivery represents the median annual delivery of the 73-yearsimulation. As shown in Fig. 8, the median deliveries were highest for the base case, 0.7%lower for PCM B1, and 11.2% lower for GFDL A2.
4.2 SWP carryover storage
While delivery is the key metric of performance in these studies, carryover storage can notbe disregarded. Lower carryover storage indicates the projects are operating at a higherwater supply risk. Also, lower carryover storage indicates lower head for hydropowerproduction and less cold pool storage for fish protection.
SWP carryover storage is the sum of storage remaining in two reservoirs, Oroville andthe SWP portion of San Luis (Fig. 1), on September 30 – the end of the water year. Figure 9shows the percent time exceedance for SWP carryover storage based on simulation resultsfor 73 years.
For the drier GFDL A2 scenario, SWP carryover storage was consistently lower than thebase case. The greatest difference was at the 10% exceedance level where GFDL A2carryover storage is 28% less than in the base scenario. However, during the dry years, theSWP was able to modify operations and allocations sufficiently to make up for thiscarryover deficit and avoid unnecessary shortages. At higher exceedance levels, there is lessreduction in SWP carryover storage. At the 90% exceedance level, the GFDL A2 carryoveris 10% less than the base scenario, as compared to the 28% reduction at the 10%exceedance level. Overall, with the drier climate scenarios, less water was delivered by theSWP, which increased the likelihood of reduced carryover storage.
The results for the wetter PCM B1 scenario showed an increase in carryover storageabove the 50% exceedance level, and a reduction in carryover storage below the 50%exceedance level. During droughts, storage and pumping capacity were available to capturethe additional winter runoff for the PCM B1 scenario resulting in both higher deliveries andcarryover storage during the drier years. During the wetter years, the storage capacity
Fig. 9 Percent time of exceedance for SWP carryover storage
Climatic Change (2008) 87 (Suppl 1):S91–S108 S99

wasn’t available to capture the larger winter runoff. To maintain deliveries during thesummer months when PCM B1 runoff was slightly lower, carryover storage was reduced.
4.2.1 CVP South-of-Delta annual deliveries
Capability of CVP South of Delta (SOD) annual deliveries decreased for GFDL A2 – thedrier scenario – both at the high and low ends of the percent time exceedance spectrum(Fig. 10). The median (50% exceedance) CVP SOD delivery was 14.5% lower for theGFDL A2 scenario than for the base case. The wetter PCM B1 scenario shows moredelivery capability than the base in the 60–100% exceedance range. Annual deliveries ofthis range typically occurred in the drier years. During these years, storage and pumpingcapacity were available to deliver the additional winter runoff from the wetter scenario.
4.3 CVP North-of-Delta annual deliveries
In these studies, CVP North-of-Delta (NOD) deliveries were not as sensitive to climatechange since 80% of CVP NOD deliveries are fixed deliveries for settlement contracts andwildlife refuges, and these deliveries were assumed not to change for the climate changescenarios. Typically only the remaining 20% of CVP NOD deliveries are subject toallocation decisions based on available storage. Thus, delivery capability in the climatechange scenarios closely tracked that of the base case most of the time (Fig. 11). For thedrier GFDL A2 scenario, reduced deliveries in the 90% to 100% exceedance range reflectyears of shortage. During droughts in the GFDL A2 scenario, both Shasta and Folsomreservoirs (Fig. 1) were emptied to the level of dead pool storage for significant periods oftime. Dead pool storage was reached during 31 months at Shasta and for 28 months atFolsom spread out over three droughts in the 73-year simulation (1929–1934; 1976–1977;and 1987–1992). Settlement contractors and wildlife refuges were shorted during this time.Shortages were not seen in the base or wetter PCM B1 scenarios because Shasta andFolsom reservoirs always remained above dead pool storage. In light of these shortages,future climate change studies will investigate if delivery allocation rules can be modified toreduce or eliminate critical reservoir shortages during droughts.
Fig. 10 Percent time of exceedance for CVP South-of-Delta deliveries
S100 Climatic Change (2008) 87 (Suppl 1):S91–S108

4.4 CVP carryover storage
CVP carryover storage was reduced in the drier GFDL A2 scenario and increased in thewetter PCMB1 scenario as compared to the base (Fig. 12). CVP carryover storage is the sumof Trinity, Shasta, Folsom, and CVP San Luis storage (Fig. 1) on September 30, the end ofthe water year. For the drier GFDL A2 scenario, higher risks of shortage were takenresulting in lower carryover and lower SOD CVP deliveries. For the wetter PCM B1scenario, carryover storage was more dependable leading to increased CVP deliveriesduring droughts.
5 Delta impacts
The Sacramento–San Joaquin Delta can be considered the hub of California’s water supplysystem (Fig. 1). In the Delta, freshwater from the Sacramento and San Joaquin rivers
Fig. 12 Percent time of exceedance for CVP carryover storage
Fig. 11 Percent time of exceedance for CVP North-of-Delta deliveries
Climatic Change (2008) 87 (Suppl 1):S91–S108 S101

converges with salty tidal flows from San Francisco Bay. Today the Delta consists of 57leveed islands and more than 1,100 km of sloughs and channels. About two-thirds ofCalifornians and thousands of square kilometers of farmland rely on water from the Delta.Pumping plants in the south Delta are integral components for water distribution to centraland southern California from the SWP and the CVP.
Climate change could affect precipitation and runoff patterns, which would affectreservoir operations and Delta exports. Since the major inflows into the Delta are controlledby reservoir releases, Delta inflow patterns would be affected as well. Potential Deltaimpacts of projected sea level rise include threats of higher water levels to Delta islandlevees and degradation of water quality due to increased saltwater intrusion from the oceanthrough San Francisco Bay.
Numerical models were used to estimate potential effects of climate change on systemoperations (CalSim-II) and subsequent effects on Delta water quality (DSM2) for bothpresent sea level and a projected 0.3 m sea level rise (see Section 3 and Fig. 6). The Deltaimpacts reflect adjustments in reservoir operations and Delta exports due to shiftingprecipitation and runoff patterns (see Section 4); however, no additional changes were madeto operations to try to lessen the effects of sea level rise.
5.1 Delta inflows and exports
For the climate change scenarios, Delta inflows provided by CalSim-II typically increaseduring the late winter and early spring and decrease during the summer and fall. AverageDelta exports from CalSim-II are reduced especially during the summer and fall. Inflowsand exports are most sensitive to climate change during extremely wet or extremely dryperiods.
5.2 Delta water quality
Initial analysis of potential impacts of climate change on Delta water quality focuses on a250 mg/l maximum chloride concentration threshold for municipal and industrial intakes(SWRCB 1995). Chloride concentrations at the SWP and CVP intakes did not exceed thethreshold value for any of the climate change scenarios, even when sea level rise wasconsidered.
The Contra Costa Water District (CCWD) intake at Old River at Rock Slough is locatedcloser to the ocean than the SWP and CVP intakes, and thus it is more likely to be affectedby climate change and sea level rise. For present sea level conditions, flexibility in thesystem to modify reservoir operations and Delta exports maintained compliance levelssimilar to the base case, which had chloride concentrations below the threshold about 97%
Table 2 Frequency that chloride concentrations were below the 250 mg/l threshold value at Old River atRock Slough
Scenario Base 0.3 m SLR GFDL A2 PCM B1
Present sea level 97.2% – 98.0% 97.4%0.3 m sea level rise – 89.9%a 89.6%b 90.9%b
a Delta inflows and exports were not modified to lessen the effects of sea level rise.b Delta inflows and exports reflect shifts in runoff, but they were not further modified to lessen the effects ofsea level rise.
S102 Climatic Change (2008) 87 (Suppl 1):S91–S108
of the time (Table 2). A 0.3 m increase in sea level without any changes to systemoperations reduced the amount of time that chloride concentrations were below thethreshold to about 90% of the time. Future research involves determining (1) the types ofoperational changes that would be required to maintain chloride concentrations below thethreshold for a 0.3 m increase in sea level and (2) the subsequent water supply impacts ofthose operations changes for the SWP and CVP.
5.3 Chloride mass loadings at SWP and CVP intakes
Effects of climate change on the chloride mass loadings at the SWP and CVP intakes wereexamined by multiplying the chloride concentration by the export rate. For the climatechange scenarios, average chloride mass loadings were reduced by up to 9% due to lowerexport rates. For the sea level rise and combined climate change and sea level riseconditions, average chloride mass loadings increased by up to 11% due to increased saltintrusion from the ocean.
5.4 Sea level rise impacts on potential levee overtopping
Delta island levees may be vulnerable to overtopping if sea levels continue to rise. For thisstudy, potential overtopping was defined as any time the simulated daily maximum waterlevel in the channel exceeded the minimum crest elevation on the levee. Potential leveeovertopping was assessed for three islands in the western Delta, Sherman, Twitchell, andJersey islands. These are the Delta islands closest to the ocean, and so they are mostvulnerable to potential overtopping due to sea level rise. Effects of wind-induced waveswere not simulated. For the 0.3 m sea level rise scenario, maximum daily water levelsexceeded the minimum levee crest elevation on all three islands twice during the 16-yearanalysis period. Water levels did not exceed the minimum crest elevation for present sealevel conditions.
6 Flood forecasting
Consideration of climate change in flood forecasting presents many challenges. Whileclimate change refers to long-term averages in variables such as air temperature andprecipitation, flooding results from individual weather events. From year to year, there islarge variability in winter rainfall and associated runoff patterns. This large variabilitycreates uncertainty when evaluating changes in weather events due to climate change. SinceGCM results relate to long-term climate properties and not to short term-weather patterns,results cannot be used directly to evaluate changes in specific rainfall and runoff patternsleading to floods or to changes in frequency of floods or droughts. However, climate modelsimulation data can be used to compare simulated future and historical trends in airtemperature, precipitation and runoff. The model-derived trends also can be used to guideextrapolation of historical trends. Watershed models can then be used to estimate changes inrunoff. Such analyses are just a starting point for evaluating climate change impacts onwater supply or flood forecasting in California.
Increasing atmospheric temperatures due to climate change could impact both watersupply and flood control operations in California. Higher atmospheric temperatures leadingto higher snow lines will cause increased direct runoff after storms. The reduced snowpackwill lead to less spring runoff from snowmelt. Both types of runoff changes are explored
Climatic Change (2008) 87 (Suppl 1):S91–S108 S103
here. Other studies on this topic are highlighted in a special issue of Climatic Change (Vol.62, 2004).
6.1 Direct runoff from storms
For watersheds that receive precipitation both as rain and as snow, increased airtemperatures due to climate change can affect direct runoff that occurs during andimmediately after a storm. Higher air temperatures increase the portion of the precipitationthat falls as rain. This results in a larger area of the watershed producing direct runoff.
A simple hydrologic model of the Feather River watershed, HED71 (DWR 1988), wasused to illustrate the effects of greater contributing area on direct runoff. The modelspecifies the elevation where the snowpack starts, and elevations below that generate directrunoff from a precipitation event. As such, the HED71 model can be used to evaluate therelative changes in direct runoff associated with different contributing areas.
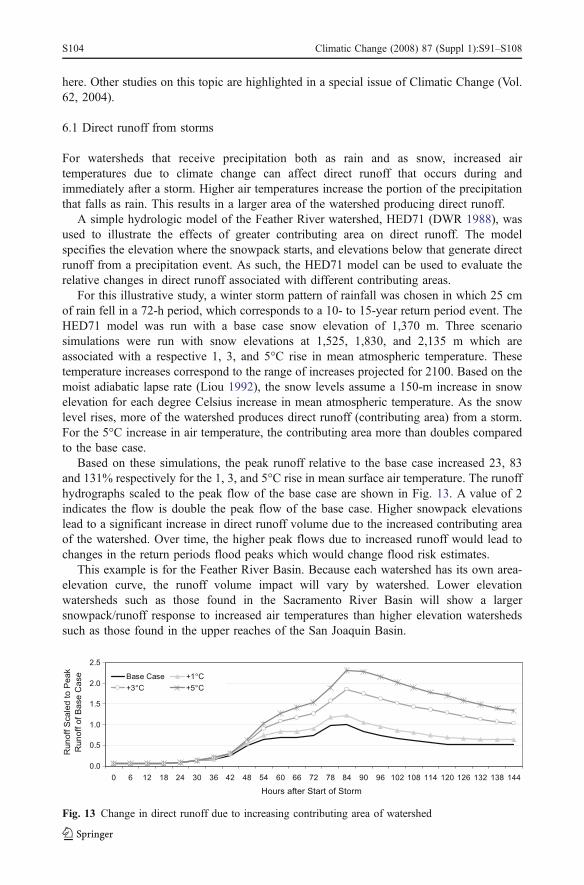
For this illustrative study, a winter storm pattern of rainfall was chosen in which 25 cmof rain fell in a 72-h period, which corresponds to a 10- to 15-year return period event. TheHED71 model was run with a base case snow elevation of 1,370 m. Three scenariosimulations were run with snow elevations at 1,525, 1,830, and 2,135 m which areassociated with a respective 1, 3, and 5°C rise in mean atmospheric temperature. Thesetemperature increases correspond to the range of increases projected for 2100. Based on themoist adiabatic lapse rate (Liou 1992), the snow levels assume a 150-m increase in snowelevation for each degree Celsius increase in mean atmospheric temperature. As the snowlevel rises, more of the watershed produces direct runoff (contributing area) from a storm.For the 5°C increase in air temperature, the contributing area more than doubles comparedto the base case.
Based on these simulations, the peak runoff relative to the base case increased 23, 83and 131% respectively for the 1, 3, and 5°C rise in mean surface air temperature. The runoffhydrographs scaled to the peak flow of the base case are shown in Fig. 13. A value of 2indicates the flow is double the peak flow of the base case. Higher snowpack elevationslead to a significant increase in direct runoff volume due to the increased contributing areaof the watershed. Over time, the higher peak flows due to increased runoff would lead tochanges in the return periods flood peaks which would change flood risk estimates.
This example is for the Feather River Basin. Because each watershed has its own area-elevation curve, the runoff volume impact will vary by watershed. Lower elevationwatersheds such as those found in the Sacramento River Basin will show a largersnowpack/runoff response to increased air temperatures than higher elevation watershedssuch as those found in the upper reaches of the San Joaquin Basin.
0.0
0.5
1.0
1.5
2.0
2.5
0 6 12 18 24 30 36 42 48 54 60 66 72 78 84 90 96 102 108 114 120 126 132 138 144
Hours after Start of Storm
Ru
no
ff S
ca
led
to
Pe
ak
Runoff o
f B
ase C
ase Base Case +1°C
+3°C +5°C
Fig. 13 Change in direct runoff due to increasing contributing area of watershed
S104 Climatic Change (2008) 87 (Suppl 1):S91–S108

6.2 Snowpack and spring runoff
Higher snow elevations not only mean more contributing area to direct runoff for a givenwinter storm, but there is less area for snowpack to develop. The impact of higher snowelevations due to higher atmospheric temperatures was estimated using area-elevationcurves for watersheds. Computations assumed a 150-m increase in elevation of snowpackfor each degree Celsius increase in atmospheric temperature. Table 3 lists the averagepercentage of watershed area covered with snow for three regions of the Sierra and Cascademountain ranges in California given mean surface air temperature increases from 1 to 5°C.The north region covers the Feather and Truckee watersheds north to the Oregon border.The central region extends from the Yuba and Carson watersheds down to the Mercedbasin. The south region encompasses the region from the San Joaquin to the Kernwatersheds. The greatest changes in snow-covered area are likely to come in the north(Table 3). This is because the peak elevations of the northern watersheds are lower than thesouthern watersheds. The results presented here are consistent with other works such asKnowles and Cayan (2004) and Mote et al. (2005).
7 Evapotranspiration
Potential climate change impacts on evapotranspiration rates and their subsequent effectson water demands are being investigated. Evaporation (E) is the loss of water vapor fromterrestrial and water surfaces to the atmosphere via a phase change from liquid water.When this phase change occurs inside plant leaves and the vapor diffuses to theatmosphere, it is called transpiration (T). For crops, the sum of E and T is calledevapotranspiration (ET). In California, ET comprises the largest consumptive use ofDWR project water (about 80% in a normal water year), excluding water qualitymaintenance and environmental needs (DWR 2005b).
Climate change could potentially affect ET in several complex ways which makes itchallenging to quantify overall changes in ET. Increased air temperatures and atmosphericCO2 concentrations would affect the energy balance that determines ET rates. Plantphysiology can also be affected, e.g. plant stomata have been shown to partially close inresponse to increased CO2 thus reducing ET rates (Long et al. 2004). Climate change couldalso affect the length of the growing season (Schwartz 2003) and agricultural land usepatterns (Kong et al. 2006). This project aims to quantify the potential effects of climatechange on ET, and then to incorporate those effects into management analysis tools todetermine potential changes in water demands.
Table 3 Change in percent snow cover by region with air temperature rise
Region Meanelevation[m]
Avg.Apr 1snowline [m]
Snowcoveredarea (% ofbasin)
With 1° Cwarming(% ofbasin)
With 2° Cwarming(% ofbasin)
With 3° Cwarming(% ofbasin)
With 4° Cwarming(% ofbasin)
With 5° Cwarming(% ofbasin)
North 1,460 1,295 68 53 37 24 12 6Central 1,865 1,650 69 59 51 41 31 21South 1,940 1,770 58 52 47 41 36 30
Climatic Change (2008) 87 (Suppl 1):S91–S108 S105

To determine potential impacts of both increased air temperatures and CO2 on futurewater demands from ET, an energy budget analysis of the Penman–Monteith equation(ASCE-EWRI 2005) was conducted using the Consumptive Use Program (CUP) (DWR2006d). Results from the Free Air CO2 Enrichment studies (Long et al. 2004) were used tomodify the stomatal influence on canopy resistance. Using a leaf area index of 2.88, whichassumes 50% of the leaves were transpiring, and a stomatal resistance of 100 s m−1 resultsin a canopy resistance of ≈70 s m−1 at current 360 ppm CO2 levels. The stomatal resistancein an atmosphere with 550 ppm of CO2 might have a stomatal resistance of about 125 s m−1
(Long et al. 2004), which would give a canopy resistance of ≈0.87 s m−1. The CUP modelwas then run for combinations of changes in CO2, air temperature, and dew pointtemperature to estimate potential changes in ET (Table 4). The highest increase in ET(18.7%) was produced by increasing only the air temperature by 3°C. Increasing both theair temperature and the dew point temperature by 3°C and using a CO2 concentration of550 ppm produced the lowest increase in ET (3.2%). If the minimum and dew pointtemperatures were increased twice as fast as the maximum temperature, and the highercanopy resistance was used, there was no observed increase in ET.
The results of this study are being explored for incorporation into the Simulation ofEvapotranspiration of Applied Water model (SIMETAW) (DWR 2006d) to determine howclimate change effects on ET rates could affect future agricultural water demands.
8 Future directions and risk assessment
The studies presented here are first steps in investigating potential effects of climate changeon management of California’s water resources. Results from this assessment show that forfuture warming scenarios, there is general consensus among the expected impacts. Greateramounts of winter-season runoff combined with static flood protection rules would lead togreater uncontrolled releases from SWP and CVP reservoirs. Reduced spring-season runoffinto the reservoirs would lead to decreased water supplies and deliveries to SWP and CVPwater users. Both impacts would pose challenges to maintaining SWP and CVPperformance levels at present-day conditions.
While there is general consensus in their trend, the magnitudes and onset-timing ofimpacts discussed in this paper are uncertain and are scenario-dependent. It is of interest forlong-term system planners to understand likelihood aspects of such impacts so thatpreparations and/or system modifications might be strategized in a timely manner. Tosupport development of such strategies, the analysis activities described in this paper mustbe expanded from assessing potential impacts to assessing risk.
Table 4 Simulated impacts of climate change on ET using the CUP model
Scenario Climate change variable Change in ET(%)
CO2
(ppm)Air temperature(°C)
Dew point(°C)
Canopy resistance(s m−1)
Increase CO2, air temp. anddew point
550 +3 +3 87 +3.2
Increase air temperature anddew point
360 +3 +3 70 +8.5
Increase air temp. only 360 +3 ±0 70 +18.7
S106 Climatic Change (2008) 87 (Suppl 1):S91–S108

Risk assessment involves integrated consideration of three factors: (1) a spectrum ofpotential scenarios that would cause impacts, (2) respective impacts associated with eachscenario, and (3) estimates of relative scenario probabilities. The impacts assessmentprocedures of this paper would be repeated, but for an expanded set of scenarios. Relativescenario probabilities could be estimated by analyzing climate projection consensus amongthe available scenarios. Upon defining scenarios, evaluating their impacts, and assigningprobabilities, risk could then be assessed as the integration of probability-weighted impactsacross the set of scenarios. Such information would allow water resources planners andmanagers to consider relative likelihoods of threshold-level impacts in their decisionmaking processes.
Following this premise, a project is underway involving collaboration betweenReclamation, DWR, and climate researchers, demonstrating how to apply risk assessmentprinciples in the study of climate change implications for CVP/SWP operations. Theassessment applies elements of the impacts assessment presented in this paper to a largerensemble of IPCC4 climate change scenarios. The project will also explore risk mitigationinvolving non-infrastructure strategies. Other future efforts will involve addressing data andanalysis gaps that were identified during these preliminary studies. For example, an analysistool is needed to incorporate consideration of sea level rise into determination of systemoperations. Collaboration will continue with climate change scientists to develop criteria fordetermining appropriate scenarios for analysis and to assist with interpretation of impactsand risk assessments. The evolving assessment methodologies described in this paper aimto provide water resources managers with climate change information that can be used todevelop planning, mitigation and adaptation strategies.
Acknowledgements The authors would like to acknowledge contributions by Michael Floyd, MortezaOrang, Hongbing Yin and all other co-authors of the report upon which this paper is based (DWR 2006a).Editorial assistance was provided by Michael Durant.
References
ASCE-EWRI (2005) The ASCE standardized reference evapotranspiration equation. Technical committeereport to the Environmental and Water Resources Institute of the American Society of Civil Engineersfrom the Task Committee on Standardization of Reference Evapotranspiration. p 173
Brekke LD, Miller NL, Bashford KE, Quinn NWT, Dracup JA (2004) Climate change impacts uncertaintyfor water resources in the San Joaquin River Basin, California. J Am Water Resour Assoc 40:149–164
Cayan DR, Maurer EP, Dettinger MD, Tyree M, Hayhoe K (2008) Climate change scenarios for theCalifornia region. Clim Change DOI 10.1007/s10584-007-9377-6 (this issue)
DWR (1988). Program Manual: HED71 for Headwater Runoff Forecasting. California Department of WaterResources, Division of Flood Management
DWR (1998) Bulletin 160-98. The California water plan update. Volume 1. California Department of WaterResources
DWR (2005a) California water plan update 2005, volume 1-stategic plan, chapter 4: preparing for anuncertain future. California department of water resources, Sacramento, CA
DWR (2005b) California water plan update 2005, volume 1-stategic plan, chapter 3: California water today.California department of water resources, Sacramento, CA
DWR (2006a) Progress on incorporating climate change into management of California’s water resources,technical memorandum report, California department of water resources http://baydeltaoffice.water.ca.gov/climatechange.cfm
DWR (2006b) CalSim water resources simulation model website, California department of water resources,Bay-Delta Office, modeling support branch, http://modeling.water.ca.gov/hydro/model/index.html cited20 April 2006
Climatic Change (2008) 87 (Suppl 1):S91–S108 S107

DWR (2006c) Delta Simulation Model 2 (DSM2) website, California department of water resources, Bay-Delta Office, modeling support branch, delta modeling section, http://baydeltaoffice.water.ca.gov/modeling/deltamodeling/models/dsm2/dsm2.cfm cited 20 April 2006
DWR (2006d) Consumptive Use Program (CUP) and Simulation of Evapotranspiration of Applied WaterProgram (SIMETAW) website, California department of water resources, division of planning and localassistance, http://www.landwateruse.water.ca.gov/basicdata/agwateruse/cropmodels.cfm cited November2, 2006
Easterling DR, Evans JL, Groisman PY, Karl TR, Kunkel KE, Ambenje P (2000) Observed variability andtrends in extreme climate events: a brief review. Bull Am Meteorol Soc 81:417–425
IPCC (2001). Intergovernmental panel on climate change, climate change 2001: the scientific basis. In:Houghton JT, Ding Y, Griggs DJ, Noguer M, van der Linden PJ, Xiaosu D (eds) Contribution ofworking group I to the third assessment report of the IPCC. Cambridge University Press, UK, pp 944
Knowles N, Cayan DR (2004) Elevational dependence of projected hydrologic changes in the San Franciscoestuary and watershed. Clim Change 62:319–336
Kong A, Cahill K, Hristova K, Jackson L (2006) Land use change in California agricultural landscapes inresponse to climate change. Chapter 8. In: Cavagnaro TR, Jackson LE, Scow KM (eds) Climate change:challenges and solutions for California agricultural landscapes. California. CEC-500-2005-189-SF.California Climate Change Center
Liou KN (1992) Radiation and cloud processes in the atmosphere. In: Oxford monographs on geology andgeophysics, no. 20. Oxford University Press
Long SP, Ainsworth EA, Rogers A, Ort DR (2004) Rising atmospheric carbon dioxide: plants FACE thefuture. Ann Rev Plant Biol 55:591–628
Maurer EP (2007) Uncertainty in hydrologic impacts of climate change in the Sierra Nevada, Californiaunder two emissions scenarios. Clim Change 82(3–4):309–325
Miller et al (2001) Climate change sensitivity study of California hydrology: a report to the California EnergyCommission, LBNL Technical Report No. 49110
Mote PW, Hamlet AF, Clark MP, Lettenmaier DP (2005) Declining mountain snowpack in western NorthAmerica. Bull Am Meteorol Soc 86:39–49
Schwartz MD (2003) Phenology: an integrative environmental science. Kluwer, Boston, MA, USA, p 564SWRCB (1995) Water quality control plan for the San Francisco Bay/Sacramento San Joaquin Delta Estuary,
95-1WR, state water resources control board, California Environmental Protection Agency, Sacramento,CA, May 1995
S108 Climatic Change (2008) 87 (Suppl 1):S91–S108