Progress on Estimation of Global Gas Flaring With VIIRS Data
33
Progress on Estimation of Global Gas Flaring With VIIRS Data C. Elvidge 1 , M. Zhizhin 2 , K. Baugh 2 , F. Hsu 2 and T. Ghosh 2 1 National Centers for Environmental Information, College Park, Maryland 303-497-6121, [email protected] 2 Cooperative Institute for Research in Environmental Sciences (CIRES), University of Colorado, Boulder
Transcript of Progress on Estimation of Global Gas Flaring With VIIRS Data

Progress on Estimation of Global Gas Flaring With VIIRS Data
C. Elvidge1, M. Zhizhin2, K. Baugh2, F. Hsu2 and T. Ghosh2
1National Centers for Environmental Information, College Park, Maryland303-497-6121, [email protected]
2Cooperative Institute for Research in Environmental Sciences (CIRES), University of Colorado, Boulder

Abstract• We report on a global map of gas flares and preliminary estimates of flared gas
volumes for 2012 and 2014 derived from data collected by the Suomi NPP Visible Infrared Imaging Radiometer Suite (VIIRS).
• Nighttime VIIRS data were processed to take advantange of clear detections of gas flares in spectral bands designed for daytime imaging of reflected sunlight. At night these spectral channels provide unambiguous observations of combustion sources worldwide.
• The spectral bands utilized span visible, near-infrared (NIR), short-wave infrared (SWIR) and mid-wave infrared (MWIR).
• Planck curve fitting of the hot source and background radiances yield temperature (K) and emission scaling factor. Additional calculations are done to estimate source size (square meters), radiant heat intensity (W/m2) and radiant heat (MW).
• Nightfire successfully retrieved temperature estimates ranging from 500 to 3000 K. Temperatures derived from Planck curve fitting allow gas flares to be separated from industrial sites and biomass burning
• A calibration for estimating flared gas volumes was developed based on reported data from specific regions.

Detection of Combustion Sources Basra, Iraq Region at NightJuly 17, 2012
M13 “Fire Band” M10
What makes VIIRS data so great?At night the VIIRS collects data in three daytime imaging bands: M7, M8, and M10.The nighttime M10 data have a remarkable ability to detect combustion sources!
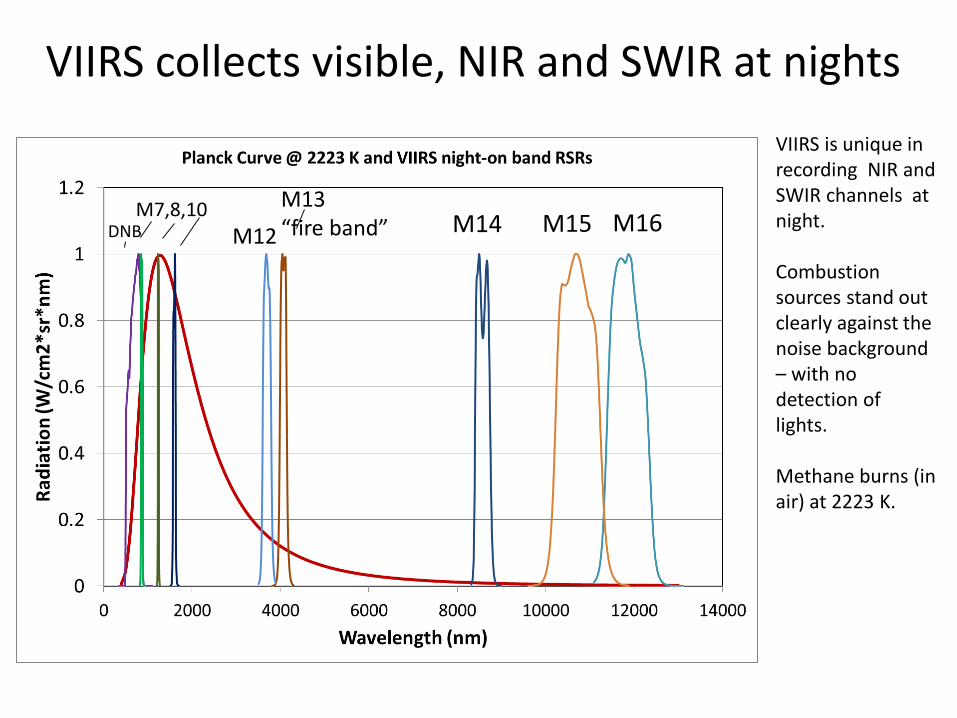
VIIRS collects visible, NIR and SWIR at nights
M14 M15 M16M13 “fire band”M12DNB
M7,8,10
VIIRS is unique in recording NIR and SWIR channels at night.
Combustion sources stand out clearly against the noise background – with no detection of lights.
Methane burns (in air) at 2223 K.

Estimating Radiant Heat
Radiant heat intensity is calculated through application of the Stephan-Bolzmann Law
Radiant heat is intensity multiplied by pixel footprint
B is the spectral radiance of the black body λ is wavelength, umkB, h, σ are the Boltzmann, Planck, and Stefan-Botzmann constatnsc is the speed of light,T is its temperature, degrees K ε is the emission scaling factor (ESF)J is the radiant heat intensity, Watts/m2/secS is the full pixel or subpixel fire footprint, m2
RH is the radiant heat, Watts/m2
Planck curve is fit using a simplex algorithm to match the observed radiances with temperature and emission scaling factor
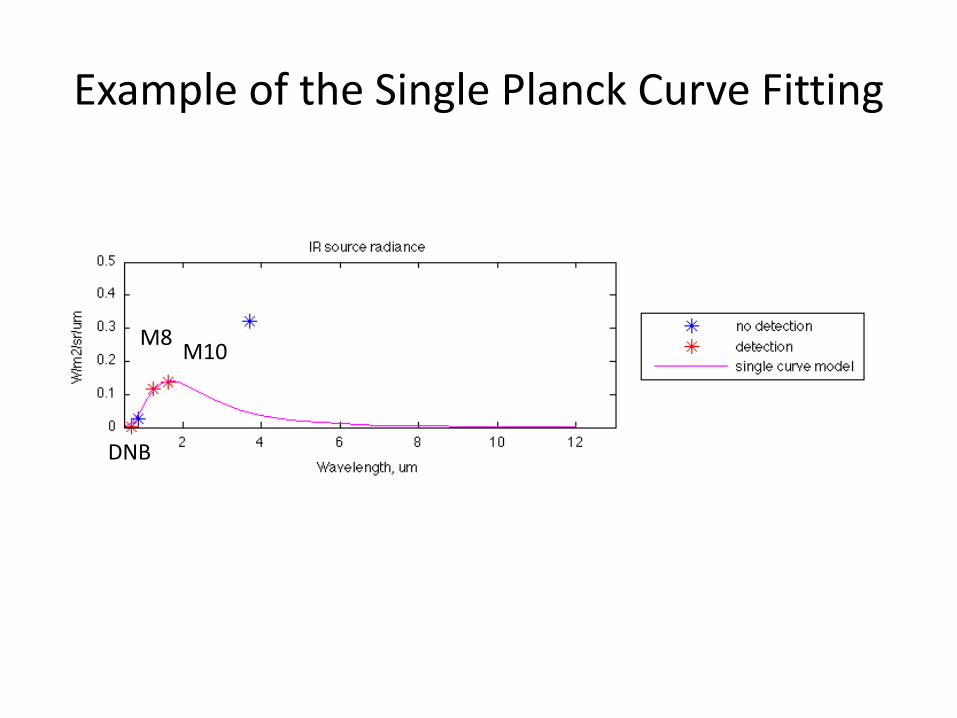
Example of the Single Planck Curve Fitting
M10M8
DNB
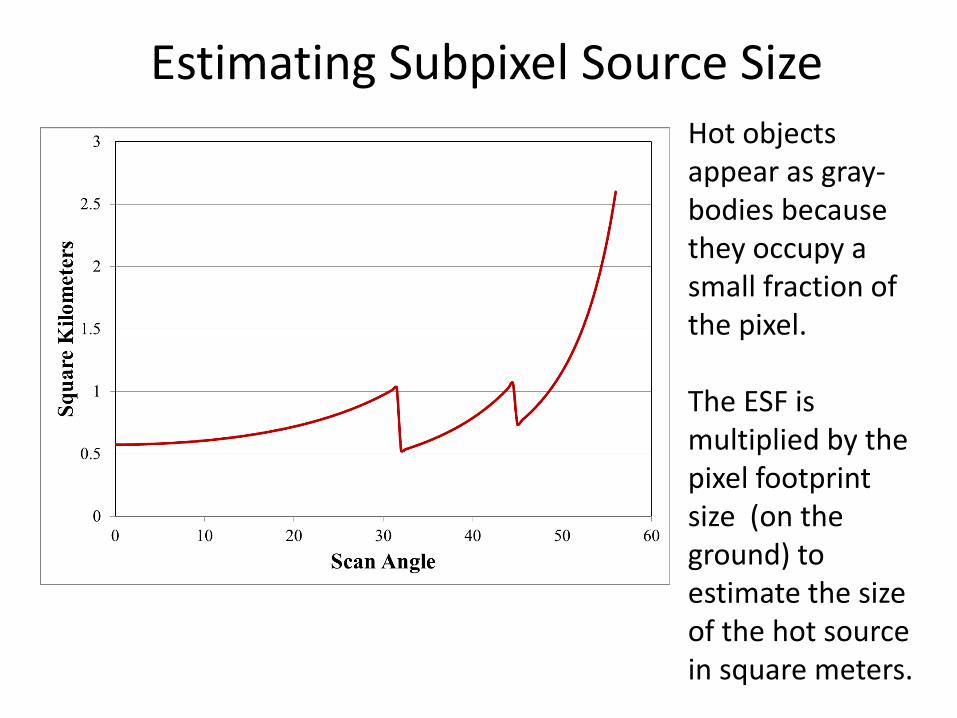
Estimating Subpixel Source SizeHot objects appear as gray-bodies because they occupy a small fraction of the pixel.
The ESF is multiplied by the pixel footprint size (on the ground) to estimate the size of the hot source in square meters.
Size = esf * Pixel Footprint

A new algorithm was developed to detect VIIRS pixels containing combustion sources using the mid-wave infrared channels (M12 and M13). The algorithm complements the original M10 detection algorithm.
M12 subpixel saturation
M12 saturation
Background baseline
Hotspot pixels are red
M12-M13 Hot Spots Detector
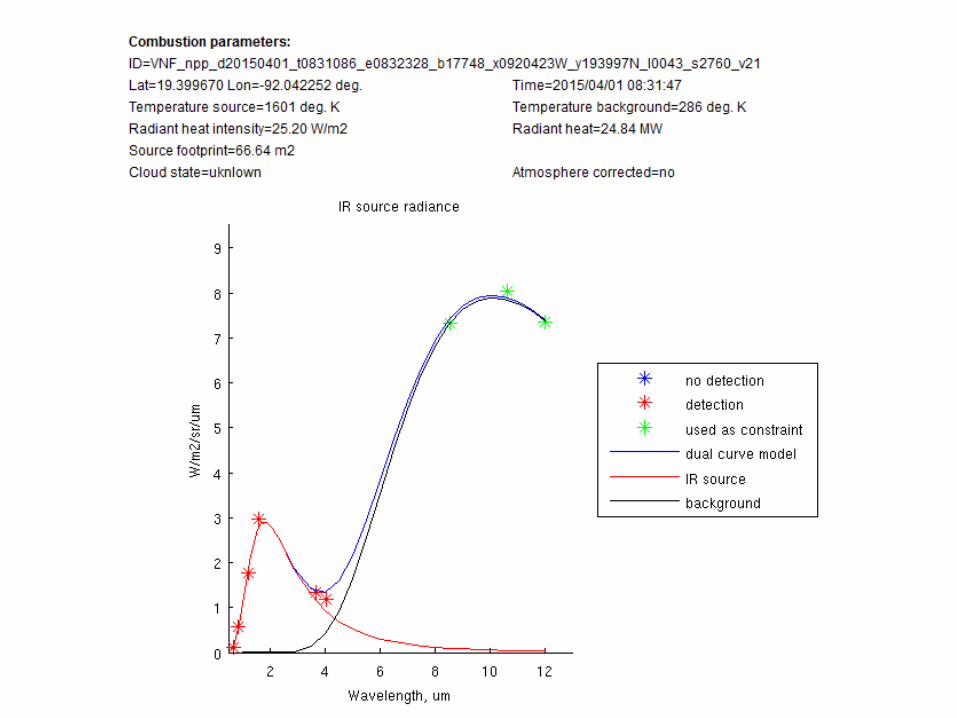
Dual-Curve Fitting Method
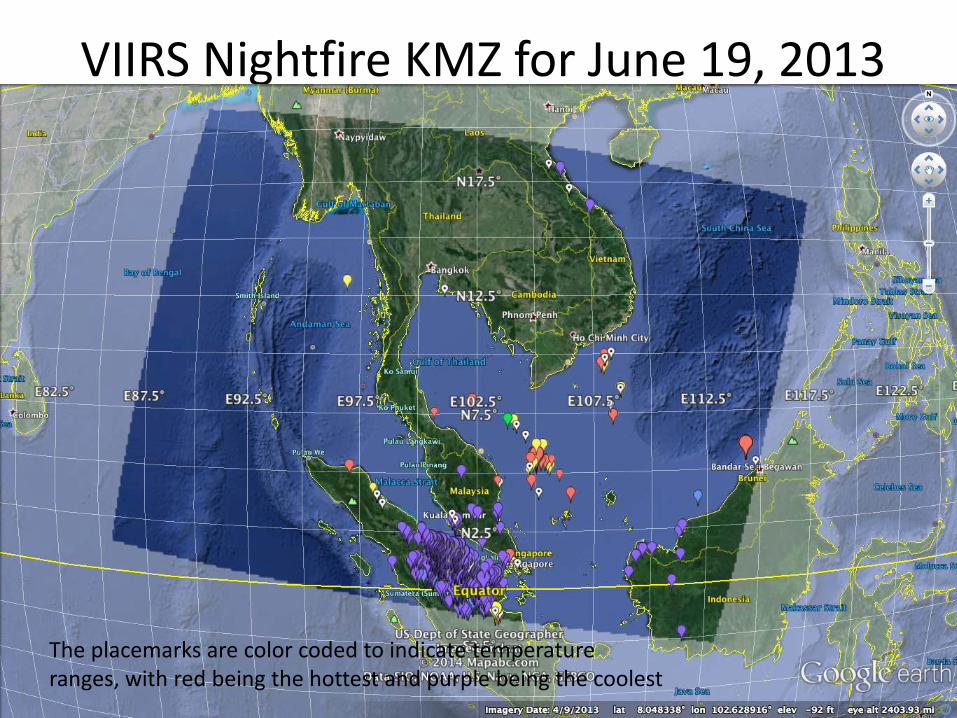
VIIRS Nightfire KMZ for June 19, 2013
The placemarks are color coded to indicate temperature ranges, with red being the hottest and purple being the coolest

Sensitivity of Dual-Curve Fit
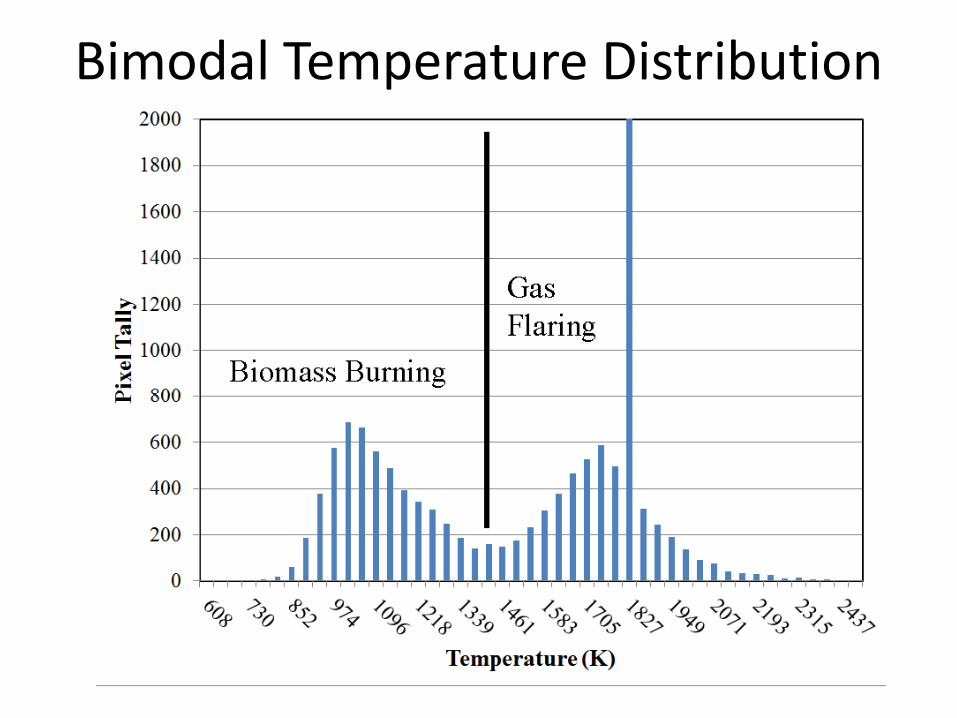
Bimodal Temperature Distribution

Global Mapping of Gas Flares• The extended records of local maxima detections are
composited into a global 15 arc second grid:– Number of detections (n)– Percent frequency of detection (pct)– Average temperature (K)
• Filtering to remove fires (biomass burning), volcanoes and non-flaring industrial sites:– Remove sites with n < 3.– Remove sites with K < 1500.
• Manual editing to clean out residual fires.• Watershed to identify separable features and mark
centroid locations: 10 000 flares worldwide

Watershed Cluster Analysis Percent frequency of detections
North Dakota
2012 Feb. ~ 2014 Dec.Fire observation percentage
Identified clusters w/Reported well location
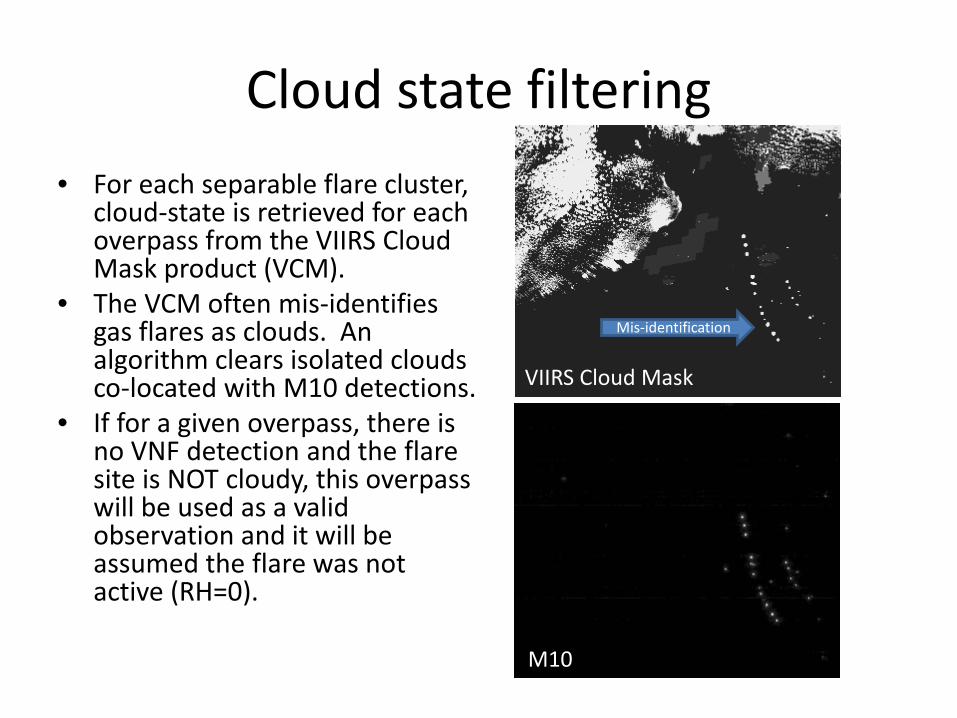
Cloud state filtering• For each separable flare cluster,
cloud-state is retrieved for each overpass from the VIIRS Cloud Mask product (VCM).
• The VCM often mis-identifies gas flares as clouds. An algorithm clears isolated cloudsco-located with M10 detections.
• If for a given overpass, there is no VNF detection and the flare site is NOT cloudy, this overpass will be used as a valid observation and it will be assumed the flare was not active (RH=0).
VIIRS Cloud Mask
M10
Mis-identification
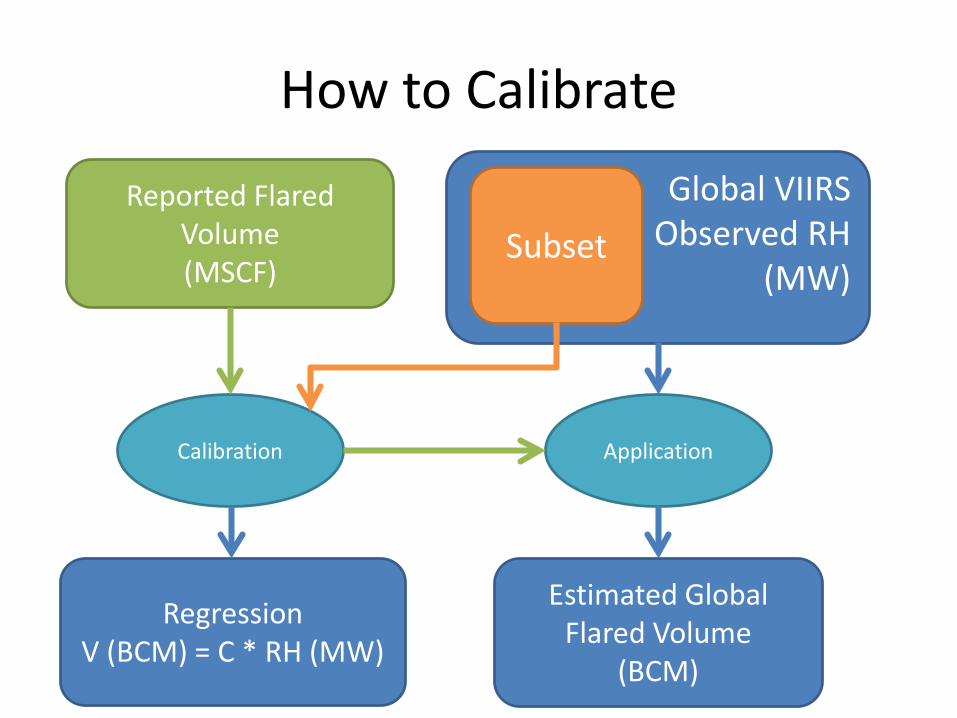
How to CalibrateGlobal VIIRS
Observed RH(MW)
SubsetReported Flared
Volume(MSCF)
Estimated Global Flared Volume
(BCM)
Calibration Application
RegressionV (BCM) = C * RH (MW)

Calibration Sites
Primary Sites (Conducted in this run)Chosen considering data volume / processing burden
Secondary Sites (To be added)
North Dakota~1400 Sites
Texas~3000 Sites
Nigeria~170 Sites
Angola
North Sea
Gulf of Mexico
Alaska
Azerbaijan
ShapshaCaspian Pulkovo Kazakhstan
Tangiz

Nigeria flares used in calibration
North Dakota
Nigeria
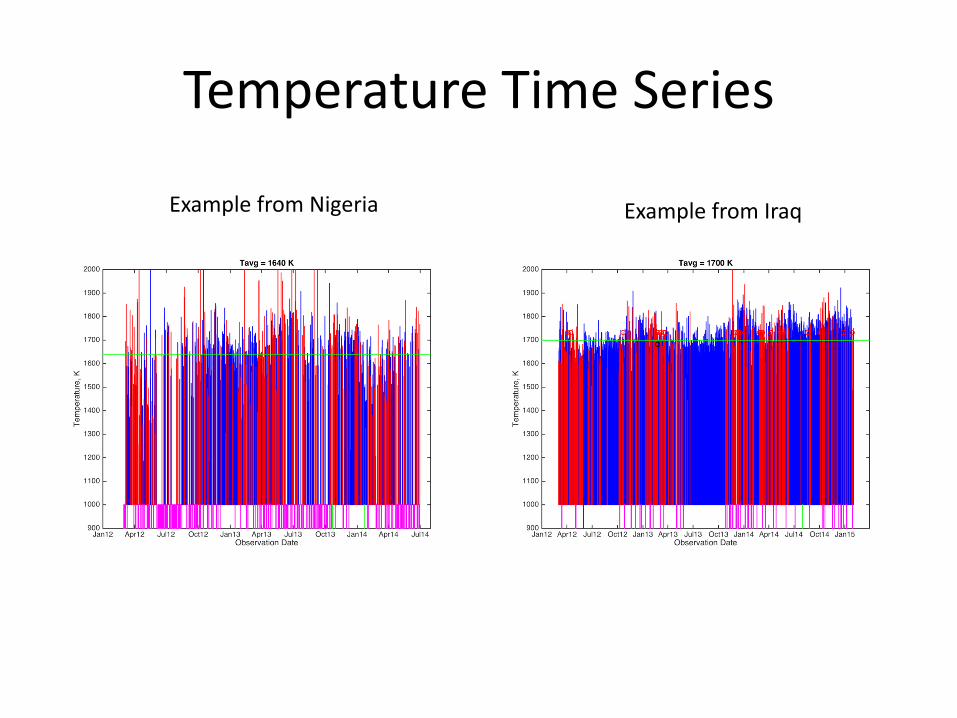
Temperature Time Series
Example from Nigeria Example from Iraq

Radiant heat Nigeria vs Iraq

SATZ CorrectionGas flare in Basra

Door to Hell:Derweze, Turmenistan

Calibration for Nigeria
• Reported flared volume– Monthly, field-wise– NNPC
• Aggregation unit: field (flare site)– Temp > 1300K– Only account site with
single flare feature (identified as local max?)
– Filter for site-months• None
– 2221 site-months• BCM = 0.00117*MW

Nigeriasite-months AWOBA

Nigeria, filtered
• Filter for site-months with– Nobs > 7– R2 > 0.5
• 379 site-months• BCM=0.0213(±8.8E-
5)*MW– 95% confidence

Calibration for North Dakota
• Reported Flare Volume– Monthly, state-wide– North Dakota Industrial
Commission, Dept. of Mineral Resources, Oil and Gas Division
• Aggregation unit: State– Temp > 1300K– 2 patterns, take the later
half (2012/10~2014/06)• Regulation change?
– 13 months• Removed one outlier:
2013/12
y = 0.0014x + 0.1844R² = 0.363
0
0.05
0.1
0.15
0.2
0.25
0.3
0.35
0.4
0 50 100 150
Repo
rted
Fla
red
Volu
me
(BCM
)
VIIRS Observed RH (MW)
North Dakota
2012/03-2012/092012/10-2014/06

Calibration for Texas
• Reported Flare Volume– Monthly, state-wide– Texas Rail Road
Commission
• Aggregation unit: State– Temp > 1300K– Only sites confirmed by
reported records are accounted.
– 26 months
y = 0.002x + 0.0703R² = 0.4858
0
0.05
0.1
0.15
0.2
0.25
0 50 100
Repo
rted
Fla
red
Volu
me
(BCM
)
VIIRS Observed RH (MW)

Overall Result
• North Dakota & TexasSATZ corrected
• BCM=0.0035(±1.1E-4)*MW
• R2=0.905

Known Issues• Wide spread on merged data (with Texas and North Dakota SATZ
corrected).• Partial annual estimation
– (2014 6 months, 2012 10 months)• Solar outage at higher latitude
– Some sites might not be detected due to sunlight.• North Dakota Regulation Change?• HP/LP Flare?
– Observed secondary cluster exhibits 3 times higher RH than majority. – LP flares radiate 3 time more energy than HP flares.
• Bias on compiled instantaneous observe vs. monthly summation of flared volume.
• SATZ correction is not yet fully verified.

0
10
20
30
40
50
Estim
ated
Fla
red
Volu
me
(BCM
)
Country
Top 20 Flaring Countries in 2012
Estimated Flared Volume
Estimated Flared Volume (Adjusted) 186.78 BCM
Top 20 Countries (2012)
Adjust: Top 50 flares are discounted 75% of their estimated flared volume due to high possibility of being LP flares.
Flares of 2012 in Russia not found in 2014 are not accounted.
241.88 BCM

Top 20 Countries (2014)
0
10
20
30
40
50
60
Estim
ated
Fla
red
Volu
me
(BCM
)
Country
Top 20 Flaring Countries in 2014
Estimated Flared Volume
Estimated Flared Volume (Adjusted)
Adjust: Top 50 flares are discounted 75% of their estimated flared volume due to high possibility of being LP flares.
249.68 BCM
185.66 BCM
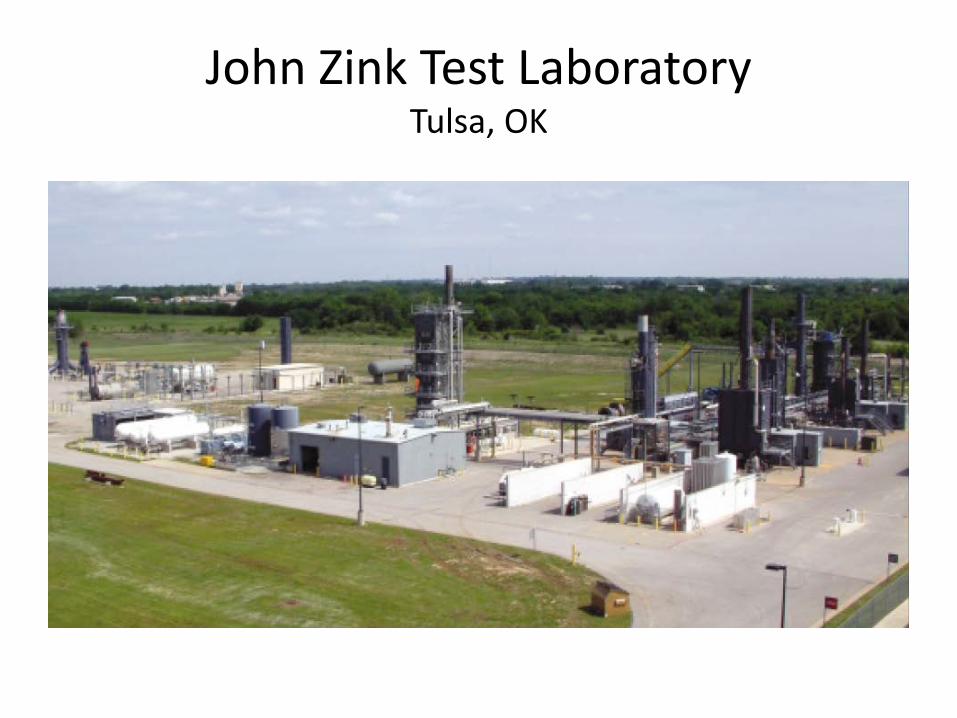
John Zink Test LaboratoryTulsa, OK

Future
• Include more calibration areas?• Add test flare facility data from John Zink? • Regional SATZ correction?• Study non-linear model V = C * RHD
• Improve ID of refineries and industrial sites