
Progress is made by trial and failure; the failures are generally a … · 2016-08-03 · Progress...
230
En vue de l’obtention du DOCTORAT DE L’UNIVERSITÉ DE TOULOUSE Présentée et soutenue par : Wan-Yu TSAI Ion Adsorption in Porous Carbon : from Fundamental Studies to Supercapacitor Applications Directeur/trice(s) de Thèse : Pr. Patrice SIMON et Dr. Pierre-Louis TABERNA J ur y : THÈSE Le mercredi 1 juillet 2015 Délivré par : Université Toulouse 3 Paul Sabatier (UT3 Paul Sabatier) École doctorale et discipline ou spécialité : ED SDM : Sciences et génie des matériaux - CO034c Unité de recherche : CIRIMAT UMR CNRS 5085 (Institut Carnot) C. VIX-GUTERL T. BROUSSE P. BARBOUX J.M. TARASCON T. TZEDAKIS P. SIMON P.L. TABERNA Directrice de recherche Professeur Professeur Professeur Professeur Professeur Chargé de recherche IS2M, Université de Haut-Alsace IMN, Ecole Polytechnique de Nantes Chimie ParisTech (ENSCP) Collège de France LGC, UPS Toulouse CIRIMAT, UPS Toulouse CIRIMAT, UPS Toulouse Rapporteur Rapporteur Examinateur Examinateur Examinateur Directeur de thèse Co-directeur de thèse
Transcript of Progress is made by trial and failure; the failures are generally a … · 2016-08-03 · Progress...

En vue de l’obtention du
DOCTORAT DE L’UNIVERSITÉ DE TOULOUSE
Présentée et soutenue par :Wan-Yu TSAI
Ion Adsorption in Porous Carbon : from Fundamental Studies to Supercapacitor Applications
Directeur/trice(s) de Thèse :Pr. Patrice SIMON et Dr. Pierre-Louis TABERNA
J u r y :
THÈSE
Le mercredi 1 juillet 2015
Délivré par :Université Toulouse 3 Paul Sabatier (UT3 Paul Sabatier)
École doctorale et dis cipline ou spécialité : ED SDM : Sciences et génie des matériaux - CO034c
Unité de recherche :CIRIMAT UMR CNRS 5085 (Institut Carnot)
C. VIX-GUTERL T. BROUSSEP. BARBOUXJ.M. TARASCONT. TZEDAKISP. SIMON P.L. TABERNA
Directrice de rechercheProfesseur Professeur Professeur Professeur Professeur Chargé de recherche
IS2M, Université de Haut-AlsaceIMN, Ecole Polytechnique de NantesChimie ParisTech (ENSCP) Collège de France LGC, UPS Toulouse CIRIMAT, UPS Toulouse CIRIMAT, UPS Toulouse
RapporteurRapporteur
ExaminateurExaminateurExaminateur
Directeur de thèseCo-directeur de thèse


Progress is made by trial and failure; the failures are generally a hundred
times more numerous than the successes; yet they are usually left
unchronicled.
William Ramsay


Acknowledgements
First, I would like to express my special appreciation and thanks to my main supervisor
Prof. Patrice Simon for offering me this opportunity to work under his supervision. Thanks for
his expertise, guidance and supports, I have progressed a lot professionally and personally.
I would like also to thank sincerely my co-supervisor Dr. Pierre-Louis Taberna, not only
for his expertise, but also for his encouragements, patience, and understanding. The numerous
discussions we had and all the salient points he pointed out have been a great help for
advancing the research work.
I would like to thank Dr. Cathie Vix-Guterl and Prof. Thierry Brousse who accepted to
refer my thesis manuscript, and Prof. Philippe Barboux, Prof. Jean-Marie Tarascon, and Prof.
Thèo Tzedakis who agreed to be jury members for my oral defense. The discussion during the
defense and the advices given by all the juries are interesting, and would be very useful for me
in the future. I would like also to thank European Research Council for financing my PhD and
the director of institute Carnot CIRIMAT, Dr. P. Tailhades, for providing the laboratory.
I would like to acknowledge all the people from different groups that I had the chance to
work with during these three years. I would like to thank Prof. Yury Gogotsi, Dr. John K.
McDonough and Dr. Carlos R. Pérez from Drexel University (Philadelphia, USA); Prof.
Rodney S. Ruoff, Dr. Shanthi Murali, and Dr. Li Li Zhang from University of Texas at Austin
(USA); Prof. Fédéric Favier, and Dr. Pengcheng Gao from Université de Montpellier (France)
for experimental supports and scientific discussions. Special thanks to Prof. Claire Grey, Dr.
John M. Griffin, and Dr. Alexander C. Forse from Cambridge University (UK) for the fruitful
scientific discussion and collaboration in Cambridge and in Toulouse.
I would like to thank Prof. Isamu Moriguchi, and Dr. Koki Urita from Nagasaki University
(Japan) who hosted me in their lab for in-situ experiments. The exchange was interesting and
challenging. I would like also to thank Chiharu and Yuki for making my stay convivial and
cheerful in Nagasaki. Apart from experimental aspects, I would like to thank Prof. Mathieu
Salanne, Dr. Clarisse Péan from Université Pierre et Marie Curie (France), and Dr. Céline
Merlet from Cambridge University for broadening my horizons in the modelling world. Special
thanks to Clarisse for the all the discussions from theoretical point of view, and her warm
support.

I would like to express my gratitude to the colleagues for administrative assistance, Mdm.
S. Berkouk, Prof. B. Viguier and Prof. E. Benoist from Ecole Doctorale, Mdm. C. Stasiulis from
the Service des Relations Internationales, Nicole, Murielle, Nabila, Maryse, Sandrine, and
Christiane from CIRIMAT. Special thanks to Marie-Claire for her technical support, and
always being smiley and encouraging.
I would like to thank my former and current team member: Dr. Patrick Rozier, Barbara
Daffos, Rongying, Etsuro, Julie, Peihua, Jeremy, Lorie, Efi, Yohan, Léo, Zifeng, Kevin, Yinghui,
Cyril, Eider, Laurent… It was a great pleasure to work under such a nice and professional
environment. Special thanks to Barbara, who has always been supportive and helpful in all the
aspects; also to Etsuro, Koki and Laurent, without them, the struggle against EQCM alone in
Room 62 could have been extremely long and difficult. I would like to thank Julie and Rongying
who trained me and taught me with patience when I just joined the team. I would like to address
my gratitude especially to Rongying, who shared her scientific and personal experiences with
me, took care of me as an elder sister and comforted me when I missed home.
Thanks to all the PhD students, post-doctoral researchers, interns, permanents, engineers,
technician, and IT personnel I met during my PhD, who helped to complete these three years.
Thanks Claire for those artistic nights we spent together, though short but I enjoyed a lot.
Thanks Rafael for his understanding and his Franglish office ambience. Thanks Congcong for
always being smiley, positive and encouraging. Un grand Merci à Pauline, for her presence
and support. The art workshops and several short weekends in Peyrusse-le-Roc were awesome
and definitely essential to conquer EQCM!
I would like to address my great appreciation to Prof. Tri-Rung Yew from National Tsing
Hua University (Taiwan).Without her guidance and encouragement, I could not have gone so
far. I would like also to thank my dear “EMPTY” for their support and concern no matter
where they are.
Un grand Merci à Laurent for always being patient, warm and understanding in every
aspect. Je remercie également Suzanne et Olivier, who made France my second home.
Lastly, I would like to thank my mom, my brother, Wan-jui, and Rice Ball. Without their
constant support and consideration, I could not have achieved all these. 謝謝你們!

Contents


General Introduction …………………………………………………………..1
Chapter I: Bibliography ……………………………………………………….5
1. Supercapacitors ...................................................................................................................... 5
1.1 Why supercapacitors? ....................................................................................................... 5
1.2 Fundamentals of Supercapacitors ..................................................................................... 7
1.2.1 Brief history ............................................................................................................... 7
1.2.2 Different types of supercapacitors ............................................................................. 9
1.2.3 How does an electric double layer capacitor (EDLC) work? .................................. 10
1.3 Applications .................................................................................................................... 15
2. State-of-the-art of the materials used in carbon/carbon supercapacitors ............................. 17
2.1 General material design concept for high performance supercapacitor ......................... 17
2.2 Carbon electrode materials ............................................................................................. 18
2.2 Electrolytes ..................................................................................................................... 24
3. State-of-the-art of the EDL study: pore size vs electrolyte ion size ..................................... 26
4. State-of-the-art of the charging mechanism and ion transport: from modelling and in-situ
techniques point of view .......................................................................................................... 33
4.1 Theoretical Approaches .................................................................................................. 33
4.1.1 Solvent-free environment: room temperature ionic liquids (RTILs) ....................... 34
4.1.2 Solvent-containing electrolytes ................................................................................ 38
4.2 In-situ Experimental Approaches ................................................................................... 40
4.3 What do we know today about charging mechanism? ................................................... 45
5. Objectives of the thesis ........................................................................................................ 46
5.1 Study of carbon microstructure effect on capacitive storage ......................................... 46
5.2 In-situ EQCM study on ion dynamics and charging mechanisms in confined carbon
micropores ............................................................................................................................ 46
6. Reference .............................................................................................................................. 47

Chapter II: Materials studied and experimental set-ups …………………..57
1. Introduction .......................................................................................................................... 57
2. Commercial Activated Carbons ........................................................................................... 57
3. Electrolytes ........................................................................................................................... 60
4. Electrochemical Characterization of Supercapacitors .......................................................... 64
4.1 Electrochemical characterization techniques .................................................................. 64
4.1.1 Cyclic voltammetry (CV) ........................................................................................ 64
4.1.2 Chronoamperometry ................................................................................................ 66
4.1.3 Electrochemical Impedance Spectroscopy (EIS) ..................................................... 67
4.2 Set-ups ............................................................................................................................ 70
4.2.1 Swagelok® Cells...................................................................................................... 70
4.2.2 Cavity Micro-Electrode (CME) ............................................................................... 72
5. Reference .............................................................................................................................. 75
Chapter III: Study of carbon microstructure effect on capacitive storage ..77
1. Introduction .......................................................................................................................... 77
2. Characteristics of ionic liquid-mixture ((PIP13FSI)0.5(PYR14FSI)0.5)................................... 79
3. Hierarchy silicon carbide-derived carbon (SiC-CDC) in organic electrolyte and IL mixture80
3.1 Electrochemical characterization of SiC-CDC in conventional organic electrolyte
(NEt4BF4/AN) ....................................................................................................................... 83
3.2 Electrochemical characterization of SiC-CDC in IL eutectic mixture ........................... 87
4. Activated Graphene (a-MEGO) in IL mixture ..................................................................... 95
4.1 Electrochemical characterization of activated graphene in IL mixture .......................... 98
4.2 Removal of surface functional group by vacuum annealing ........................................ 102
5. Conclusions ........................................................................................................................ 107
6. Reference ............................................................................................................................ 109

Chapter IV: In-situ EQCM Study on Ion Dynamics in Confined Carbon
Micropores …………………………………………………………………..111
1. Introduction ........................................................................................................................ 111
2. Electrochemical quartz crystal microbalance (EQCM) ..................................................... 118
2.1 EQCM Principle ........................................................................................................... 118
2.2 EQCM set-up ................................................................................................................ 123
2.3 Calibration (sensitivity constant, Cf) ............................................................................ 125
2.4 Theoretical mass change, apparent molecular weight, and solvation number ............. 126
3. In-situ EQCM study of charge mechanism and the solvation effect at the
electrode/electrolyte interface ................................................................................................ 128
3.1 Different experimental parameters ............................................................................... 128
3.2 Neat EMI-TFSI ............................................................................................................. 130
3.2.1 CDC-1nm ............................................................................................................... 130
3.2.2 CDC-0.65nm .......................................................................................................... 134
3.3 Solvated EMI-TFSI ...................................................................................................... 136
3.3.1 CDC-1nm ............................................................................................................... 136
3.3.2 CDC-0.65nm .......................................................................................................... 138
4. Discussions ......................................................................................................................... 141
5. Conclusions ........................................................................................................................ 143
6. Reference ............................................................................................................................ 143
Chapter V: Further understanding of the EDL structure by combining
in-situ EQCM with in-situ NMR Spectroscopy ……………………………145
1. Introduction ........................................................................................................................ 145
2. In-situ nuclear magnetic resonance (NMR) spectroscopy ................................................. 147
2.1 Brief NMR principle ..................................................................................................... 147
2.2 In-situ NMR experimental ............................................................................................ 150

2.2.1 NMR details ........................................................................................................... 150
2.2.2 Quantification of the adsorbed species at zero applied potential ........................... 151
2.2.3 In-situ NMR cell set-up ......................................................................................... 153
3. In-situ NMR results ............................................................................................................ 155
3.1 At zero potential ........................................................................................................... 155
3.2 Under polarization ........................................................................................................ 156
3.3 Quantitative information............................................................................................... 157
4. In-situ EQCM results ......................................................................................................... 160
4.1 Primary in-situ EQCM information .............................................................................. 161
4.2 Quantitative/Qualitative interpretation ......................................................................... 164
5. Discussions ......................................................................................................................... 167
6. Conclusions ........................................................................................................................ 168
7. Reference ............................................................................................................................ 170
General Conclusions and Perspective ……………………………………...173
Résumé de Thèse ............................................................................................ 177

General Introduction


General Introduction
1
General Introduction
The major challenge our society is currently facing is the dwindling fossil energy on
earth and the great ecological impact and climate change caused by consuming this fossil
energy. As a result, research has been focused on developing renewable and sustainable
solutions to obtain non-exhaustive energy resources, such as solar energy, wind energy, wave
power, geothermal energy, bioenergy, tidal power, etc. In principle, these methods involve
converting different forms of energy (e.g. heat, nuclear, radiant energy, etc.) which exist
naturally into electrical energy (energy conversion systems). However, the production cannot
always timely meet the demand, thus highlighting the need for the energy storage systems.
Energy is commonly stored in the form of chemical energy (e.g. batteries) or mechanical
energy (e.g. flywheel or hydroelectricity), but conversion of energy into electricity is often
achieved with great loss. In this context, although the major electrical charge storage device
today is secondary batteries, electrochemical double layer capacitors (EDLCs), also known as
supercapacitors, are very interesting since they store and deliver electrical energy directly
without converting into different forms. Basically, in supercapacitors, the charge is stored
through non-faradaic electrostatic attraction between the electrolyte ions and the porous carbon
electrode surface; hence the response time for storing and releasing the charges is much faster
compared to that of batteries. This charge storage process is highly reversible thus giving
supercapacitor a high cycle life (>106 cycle).
[1][2]
Although supercapacitors own high power capability (15 kW/kg), they suffer from a
relatively low energy density (6 Wh/kg) as compared to batteries. Therefore, the main
challenge today for supercapacitors is to increase their energy density.[3]
Although efforts
have been put on seeking for novel electrode and electrolyte materials, the performance
improvement was little due to the lack of fundamental understanding about the charge storage
mechanisms. An important discovery has been reported by our team in 2006[4]
, using
carbide-derived carbons (CDCs) with finely-controlled pore size distribution; it was found that
the capacitance increased dramatically when the carbon pore size was decreased below the
solvated ion size, suggesting that ions could lose a part of their solvation shell to access these
confined nanopores. Following this study, numerous works have been devoted to
understanding the origin of the anomalous increase in capacitance, and the physics of ion
adsorption and ionic transport in confined microporous carbons.

General Introduction
2
The aim of this thesis is to improve the energy and power performance of EDLCs, which
can be achieved mainly from two different aspects: (1) searching for new electrolytes and
electrode materials to increase the energy density, and improving the electrode/electrolyte
interface and electrode microstructure to enhance the power performance. (2) Improving
fundamental understanding of the double layer charging at the electrode/electrolyte interface
in confined pores of porous carbons by using an in-situ electrochemical technique.
In the first chapter, bibliography covering different aspects will be presented: basic
principles of supercapacitors, concept for improving supercapacitor performance from
material point of view, different types of electrolytes and active materials used in current
supercapacitors and their corresponding pros and cons. From fundamental point of view, EDL
studies and the relationship between pore size and ion size during the past 10 years will be
reviewed; different investigations conducted by using both theoretical and in-situ
experimental approaches will be discussed, and current understanding on EDL charging
mechanism will also be summarized.
The second chapter describes the active materials and electrolytes tested in this work.
Different electrochemical methods and cell configurations used to characterize the
supercapacitors in this work will also be presented.
The third chapter investigates carbons with different microstructures in
(PIP13FSI)0.5(PYR14FSI)0.5 ionic liquid mixture electrolyte under different operation
temperatures. The aim is to build high performance supercapacitors that allow operation
under wide temperature range by optimizing the carbon/electrolyte interface and to increase
the magnitude and quality of charge storage.
Improving fundamental understanding of the charging mechanism is the most efficient
way to enhance supercapacitor performance. Therefore, the fourth chapter is devoted to
studying the charging mechanism and ion transport at molecular scale during supercapacitor
operation. Charging of different carbons in neat and solvated ionic liquid electrolytes will be
investigated by electrochemical quartz crystal microbalance (EQCM) in real time.
In the fifth chapter, in-situ EQCM is coupled with in-situ NMR spectroscopy to study
the same electrode/electrolyte system. By incorporating the advantages of both techniques,
one should be able to get a clearer picture of the supercapacitor charge storage.

General Introduction
3
Lastly, the results obtained in this work will be summed up in the general conclusions
part, and the perspectives inspired by this work will also be addressed.
[1] B. E. Conway, Electrochemical Supercapacitors: Scientific Fundamentals and Technological Applications, Springer, 1999.
[2] F. Beguin, E. Frackowiak, Eds. , Carbons for Electrochemical Energy Storage and Conversion Systems, CRC Press, 2009.
[3] P. Simon, Y. Gogotsi, Nat. Mater. 2008, 7, 845. [4] J. Chmiola, G. Yushin, Y. Gogotsi, C. Portet, P. Simon, P. L. Taberna, Science 2006, 313,
1760.

General Introduction
4

Chapter I: Bibliography


Chapter I: Bibliography
5
1. Supercapacitors
1.1 Why supercapacitors?
More and more attention has been put on the “energy issue” due to the limiting fossil
fuels on earth and the climate change, such as global warming and ozone depletion, caused by
the combustion of fossil fuels. As a result, much effort has been put in finding renewable and
sustainable energy resources to produce electricity, such as wind energy or solar energy.
However, the production cannot always timely meet the consumption as the sun won’t shine
all the time and the wind won’t blow when we request; hence it is of great importance to
develop efficient energy storage and conversion devices to be able to utilize electricity
whenever and wherever we need. Electrochemical energy storage systems are currently one of
the most researched systems in view of achieving sustainable solutions.
Ragone plot, shown in Figure I-1, [1]
is commonly used to present and compare the
performance of different energy storage systems. [2]
As shown in this plot, batteries,
electrochemical capacitors, and capacitors are the three main energy storage systems which
Figure I-1: Specific power versus specific energy, also called a Ragone plot, for various electrical energy storage devices. If a battery is used in an electric vehicle, the specific power shows how fast one can go, and the specific energy shows how far one can go on a single charge. Times shown are the time constants of the devices, obtained by dividing the energy density by the power.
[1]

Chapter I: Bibliography
6
can be used for storing energy, and each system provides different characteristics in terms of
specific power and energy. Specific energy tells the amount of energy that can be stored in the
device, and specific power gives information on how fast the device is able to deliver its
energy. The dashed lines in Figure indicate the time needed to withdraw all the energy stored
in the device. Although batteries have been popular for the past decades and great efforts have
been made to develop high-performance Li-ion and other advanced secondary batteries, they
still suffer from slow power delivery or uptake. Faster and higher-power energy storage
systems are needed in a number of applications. Therefore, electrochemical capacitors, which
are power devices that can be fully charged or discharged in seconds, started to attract much
more attention recently.[3,4]
As shown in Ragone plot (Figure I-1), electrochemical capacitors, also commonly known
as supercapacitors, ultracapacitors or electrochemical double layer capacitors (EDLCs), fill
the gap between batteries and conventional capacitors. They can deliver very high power
density (15 kW/kg) with a lower stored energy than batteries (6 Wh/kg). Batteries, such as
Li-ion batteries, generally have high energy densities (up to 200 Wh/kg), however, with low
power capability (up to 1 kW/kg).[1]
These characteristics are defined from the way that the
energy is stored in the energy storage systems. Owing to the simple non-faradaic,
electrostatic attraction between the electrolyte ions and the charges at the surface of the active
material in the supercapacitor, the response time for storing and releasing the charge stored is
much faster as compared to batteries, in which faradaic reactions in the bulk of electroactive
materials are the main mechanisms for its operation as a chemical storage device. Moreover,
the charge storage process is highly reversible as compared to other energy storage devices
which involve faradaic reactions, thus EDLCs are able to sustain few millions of cycles.
Accordingly, supercapacitors are particularly attractive for applications where high power is
needed for a few seconds. They can also be seen as a complement to Li-ion batteries in
applications where both high energy (Li-ion batteries) and high power delivery
(supercapacitors) have to be achieved. Table I-1 summarizes the characteristics of the three
types of energy storage systems.

Chapter I: Bibliography
7
Table I-1: Comparison of typical capacitor, carbon based supercapacitors, and battery characteristics [4]
1.2 Fundamentals of Supercapacitors
1.2.1 Brief history
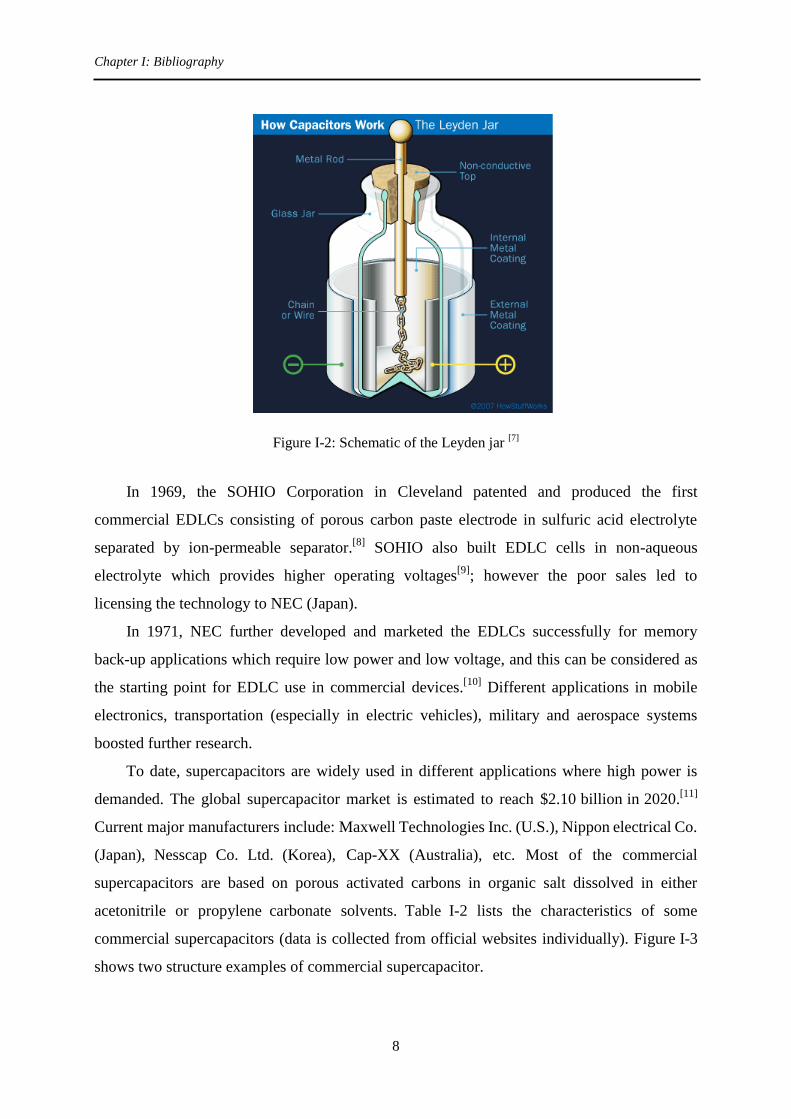
Although the first capacitor, which was named “Leyden jar” and stores the static
electricity between two electrodes inside and outside of a glass jar (Figure I-2), was invented
independently in 1745 by German cleric Ewald Georg von Kleist and by Dutch scientist
Pieter van Musschenbroek, the nature of electricity kept poorly understood until late 19th
century.[3]
The mechanism of electrical charge storage in capacitors was then studied and the
first model of double layer capacitance was devised by von Helmholtz in 1853.[5]
In 1957,
The first patent applying the concept of double layer capacitor for practical purposes was filed
by Becker, who used porous carbon coated on a metallic current collector immerse in an
aqueous electrolyte.[6]
Characteristics Capacitors Carbon EDLC Battery
Examples Al, Ta oxide,
condenser
Activated carbon in
H2SO4 or NEt4BF4/AN
Lead acid, Ni-Cd,
and Ni-MH
Storage mechanism Electrostatic Electrostatic Chemical
E (Wh/kg) < 0.1 1 10 ~20 150
P (kW/kg) >> 10 0.5 10 < 1
Discharge time (td) 10-6
10-3
s Seconds to minutes 0.3 3 h
Charging time (tc) 10-6
10-3
s Seconds to minutes 1 5 h
Efficiency (td/tc) ~ 1.0 0.85 0.99 0.7 0.85
Cycle life (cycles) >> 106
>> 10 yr
> 106
> 10 yr
~ 1500
~ 3 yr
Vmax determined by: Dielectric thickness Electrode/electrolyte
stability
Thermodynamics
of phase reactions
Self-discharge Low Moderate Low
Chapter I: Bibliography
8
Figure I-2: Schematic of the Leyden jar [7]
In 1969, the SOHIO Corporation in Cleveland patented and produced the first
commercial EDLCs consisting of porous carbon paste electrode in sulfuric acid electrolyte
separated by ion-permeable separator.[8]
SOHIO also built EDLC cells in non-aqueous
electrolyte which provides higher operating voltages[9]
; however the poor sales led to
licensing the technology to NEC (Japan).
In 1971, NEC further developed and marketed the EDLCs successfully for memory
back-up applications which require low power and low voltage, and this can be considered as
the starting point for EDLC use in commercial devices.[10]
Different applications in mobile
electronics, transportation (especially in electric vehicles), military and aerospace systems
boosted further research.
To date, supercapacitors are widely used in different applications where high power is
demanded. The global supercapacitor market is estimated to reach $2.10 billion in 2020.[11]
Current major manufacturers include: Maxwell Technologies Inc. (U.S.), Nippon electrical Co.
(Japan), Nesscap Co. Ltd. (Korea), Cap-XX (Australia), etc. Most of the commercial
supercapacitors are based on porous activated carbons in organic salt dissolved in either
acetonitrile or propylene carbonate solvents. Table I-2 lists the characteristics of some
commercial supercapacitors (data is collected from official websites individually). Figure I-3
shows two structure examples of commercial supercapacitor.

Chapter I: Bibliography
9
Table I-2: Examples of commercially available EDLCs
Manufacturer Cell/module
Voltage (V) C (F)
Specific Energy
(Wh/kg)
Specific Power
(kW/kg)
Maxwell 2.85 3400 7.4 14
Nesscap 2.7 3000 5.6 6.2
Batscap 2.7 2600 5.3 18
Ioxus 2.7 3000 6.3 10.1
Nippon Chemi-Con 2.5 2300 2.0 -
Figure I-3: Examples of different structures of supercapacitors[12]
1.2.2 Different types of supercapacitors
To date, different types of supercapacitors have been developed. Depending on the
mechanisms of charge storage and the active materials used, they can be generally sorted into
three groups: First group includes the most common devices using carbon-based active
materials with high specific surface area (SSA).[13,14]
Due to the low cost and ease of
preparation of carbon materials, more than 95% of commercial supercapacitors utilize
activated carbon as electrodes. Second group of supercapacitors, known as pseudo-capacitors
or redox supercapacitors, uses fast and reversible redox reactions at the surface of active
Chapter I: Bibliography
10
materials. Metal oxides such as RuO2, Fe3O4 or MnO2 and electronically conducting polymers
have been studied for this group of supercapacitors in the past decades. Hybrid capacitors,
belonging to the third group, involves the combination of a capacitive or pseudo-capacitive
electrode with a battery electrode, are recently under attraction since they benefit from both
the capacitor and the battery properties.
This thesis work focuses on the first group of supercapacitors where the capacitive
charge stored in the so-called “double layer” at the electrode-electrolyte interface, which gives
this type of supercapacitors the name “electric double layer capacitors (EDLCs)” and no
redox reaction is involved. For second and third group of supercapacitors, detail information
could be found in references.[3,15-19]
1.2.3 How does an electric double layer capacitor (EDLC) work?
Dielectric Capacitors
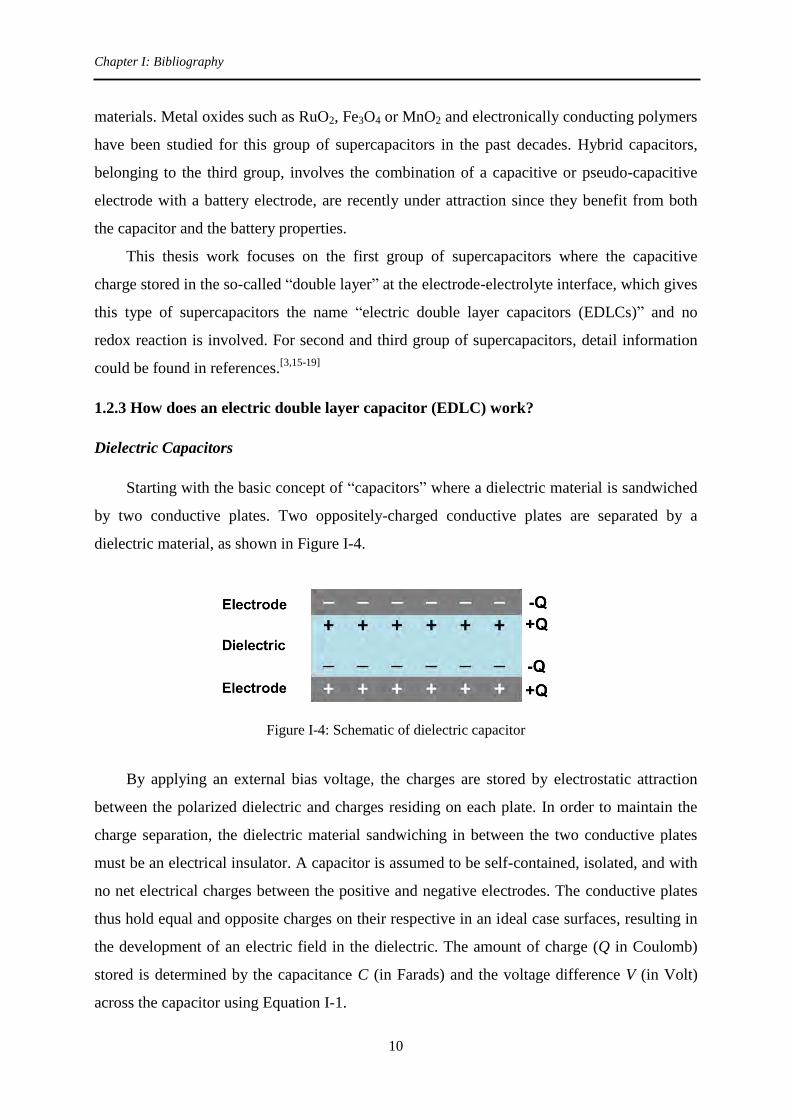
Starting with the basic concept of “capacitors” where a dielectric material is sandwiched
by two conductive plates. Two oppositely-charged conductive plates are separated by a
dielectric material, as shown in Figure I-4.
Figure I-4: Schematic of dielectric capacitor
By applying an external bias voltage, the charges are stored by electrostatic attraction
between the polarized dielectric and charges residing on each plate. In order to maintain the
charge separation, the dielectric material sandwiching in between the two conductive plates
must be an electrical insulator. A capacitor is assumed to be self-contained, isolated, and with
no net electrical charges between the positive and negative electrodes. The conductive plates
thus hold equal and opposite charges on their respective in an ideal case surfaces, resulting in
the development of an electric field in the dielectric. The amount of charge (Q in Coulomb)
stored is determined by the capacitance C (in Farads) and the voltage difference V (in Volt)
across the capacitor using Equation I-1.

Chapter I: Bibliography
11
VCQ (Equation I-1)
Increase in charge storage lead to the increase of the electric field across the dielectric.
Ability of a capacitor to store energy in an electric field is quantified as the term ‘Capacitance’
by following equation (Equation I-2):
d
AC ro (Equation I-2)
where εo and εr are the vacuum permittivity (8.854×10⁻¹²
F/m) and the dielectric constant of
the material between plates (for vacuum εr = 1), A is the area of the plates in meter square, and
d stands for the distance of separation between two parallel plates in meter.
Electric Double Layer (EDL) Theory
For charge storage in supercapacitors, the capacitance concept is the same as the basic
capacitors except that the conductive plates are replaced by different active materials, usually
non-metallic conductive materials (such as porous carbons) laminated on metallic current
collectors, and the dielectric material is replaced by a polymeric separator fully immersed in
the electrolyte. The electronic charges move through the external circuit from the positive to
the negative active material while applying a voltage difference across the cell. The cations
and anions in the electrolyte are then attracted by their opposite charges and move towards to
negative and positive electrodes respectively due to the electrostatic force. The charges are
then separated and stored at the electrolyte/electrode surface, which is the so-called “electric
double layer (EDL)”.
“Electric double layer” was first stated by Helmholtz in 1853[5,20]
that when charged
electrodes are immersed in electrolyte solutions, co-ions (ions that carry the same sign of
charge as electrode) will be repelled from the electrode surface while attracting counter-ions
(ions with opposite sign to that of the electrode). Two compact layers of charges are formed at
the electrode/electrolyte interface separated by a distance H (Figure I-5a), which is a similar
concept as planar dielectric capacitor.

Chapter I: Bibliography
12
Figure I-5: Schematics of the electric double layer structure showing the arrangement of solvated anions and cations near the electrode/electrolyte interface in the Stern layer and the diffuse layer. (a) Helmholtz model, (b) Gouy-Chapman model, and (c) Stern model
The Helmholtz model was modified by Gouy in 1910 [21]
and Chapman in 1913 [22]
taking into account that the ions are mobile in the electrolyte solutions and are driven by the
coupled influences of diffusion and electrostatic forces, resulting in the so-called “diffuse
layer” shown in Figure I-5b. However, the Gouy-Chapman model overestimates the double
layer capacitance since it assumed that ions are point charges [3]
. In 1924, Stern [23]
overcame
this problem by combining both Helmholtz compact layer and the Gouy-Chapman diffuse
layer in his model (Figure I-5c). The resulting double layer capacitance (Cdl) can be seen as a
capacitance conjugated of two capacitances generated from Helmholtz layer (CH) and
diffusion layer (CDiff), as shown in Figure I-5c, and can be expressed by:
DiffHdl CCC
111 (Equation I-3)
In general, double layer capacitance on a carbon surface is about 5 35 μF/cm2 which
depends mainly on the choice of electrolyte. Since the electrolyte concentration is generally
well above 0.1 M, the diffusion layer can be ignored.[3]
Figure I-6a is a simple schematic of an electric double layer capacitor (EDLC) using
porous carbon as active material, and the electric double layer at the negative electrode is also
shown. Figure I-6b gives the corresponding equivalent circuit. Cdl is double layer capacitance,
Chapter I: Bibliography
13
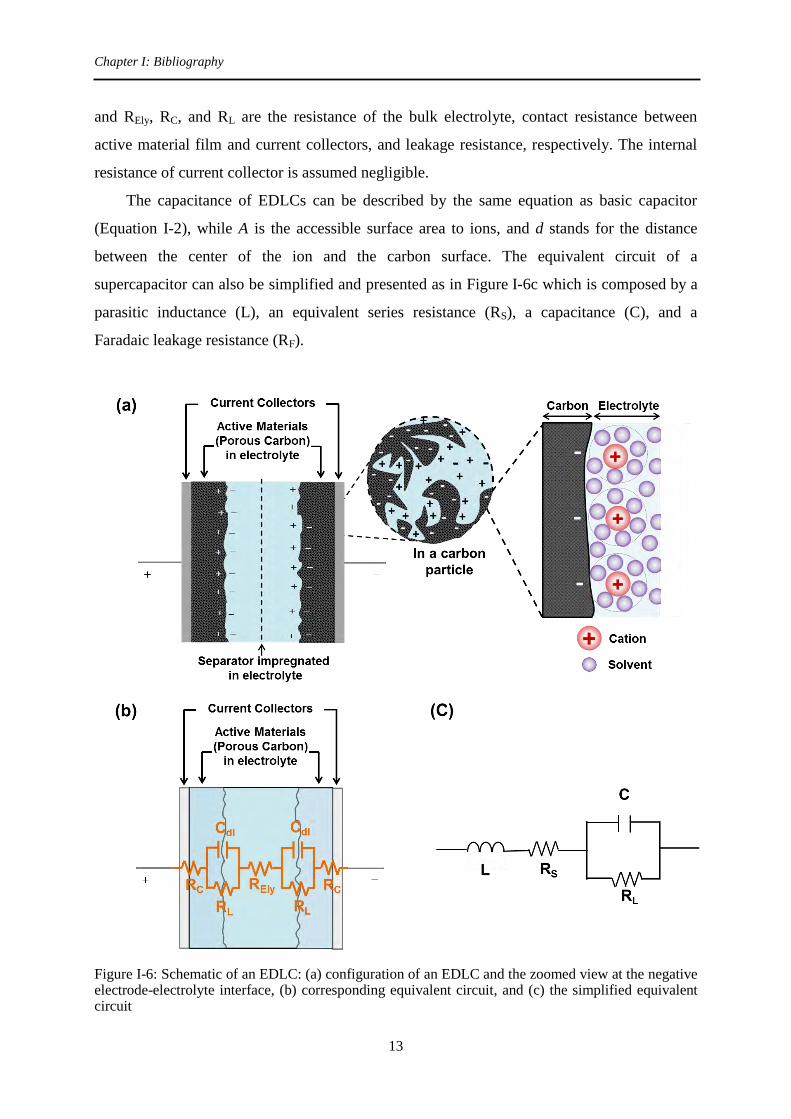
and REly, RC, and RL are the resistance of the bulk electrolyte, contact resistance between
active material film and current collectors, and leakage resistance, respectively. The internal
resistance of current collector is assumed negligible.
The capacitance of EDLCs can be described by the same equation as basic capacitor
(Equation I-2), while A is the accessible surface area to ions, and d stands for the distance
between the center of the ion and the carbon surface. The equivalent circuit of a
supercapacitor can also be simplified and presented as in Figure I-6c which is composed by a
parasitic inductance (L), an equivalent series resistance (RS), a capacitance (C), and a
Faradaic leakage resistance (RF).
Figure I-6: Schematic of an EDLC: (a) configuration of an EDLC and the zoomed view at the negative electrode-electrolyte interface, (b) corresponding equivalent circuit, and (c) the simplified equivalent circuit

Chapter I: Bibliography
14
The global capacitance of capacitors is calculated from both electrodes:
CCC
111 (Equation I-4)
Where C stands for the overall capacitance of the device, while C+ and C- are the capacitances
of positive and negative electrode, respectively. Taking an EDLC with two electrodes of the
same weight and same single electrode capacitance, e.g. 100 F/g, for example, the overall
capacitance of the device becomes 25 F/g (considering Equation I-4 and twice the amount of
electrode material), which was reduced by a factor of four compare to single electrode
capacitance. Therefore, it is important to precise which capacitance it is referred to during
discussion. In this thesis work, all the capacitance shown in the result chapters is presented as
single electrode capacitance.
The maximum energy (E, in Watt hours) and the power (P, in Watt) of capacitors that
one can extract from the device could be calculated by following equations:
2
maxmax2
1CVE (Equation I-5)
R
VP
4
2
maxmax (Equation I-6)
Where C is the overall capacitance of the cell (in Farad), V is the voltage difference between
the plates (in Volt), and R is the equivalent series resistance of the cell (in Ohm).
From Equation I-5 and 6, one can know that the energy and the power of supercapacitors
are determined by the double-layer capacitance (C), series resistance (R) which is mainly
attributed to bulk electrolyte resistance and the interfacial resistance between current
collector/active material film, and the cell voltage (V) which is mainly limited by electrolyte
electrochemical window. Therefore, the approach for improving the power and energy of
supercapacitors is to (1) decrease the internal resistance and interfacial between current
collectors and active materials (2) to search electrolytes with higher electrochemical window,
and (3) to increase the double-layer capacitance by optimizing the parameters in Equation I-2,
such as using high specific surface area porous materials or by optimizing the pore structure
to decrease the distance between AM and ions. The concept for improving energy and power
density of EDLCs, and fundamental understandings of EDL charging are the core of this
thesis work. The state-of-the-art of these aspects will be discussed in detail later in this
chapter.
Chapter I: Bibliography
15
1.3 Applications
As mentioned previously, the non-faradaic nature makes EDLCs highly attractive to
high power applications. Initially supercapacitors were used as back-up power devices for
volatile clock chips and complementary metal-oxide-semiconductor (CMOS) computer
memories. But many other applications have emerged over the past 40 years, including
portable wireless communication, heavy-duty systems [24]
, enhanced power quality for
distributed power generation systems and industrial actuator power sources.[25]
For example,
Ireland just announced to deploy supercapacitors in their smart grid systems for better energy
distribution management.[26]
In the past 10 years, supercapacitors have been involved intensely in transportation-
related field. For instance, in 2006, supercapacitors have been used to power the emergency
doors (16 per plane) in an Airbus A380, which proves their performance and safety.[1,27]
Today, one of the most promising applications is their use as high-efficiency energy storage
for electric vehicles (EVs) and hybrid electric vehicles (HEVs) for recovering the braking
energy and fast start-up of the engine.[28]
Buses powered by supercapacitors are also available
in different cities in the world.[29-31]
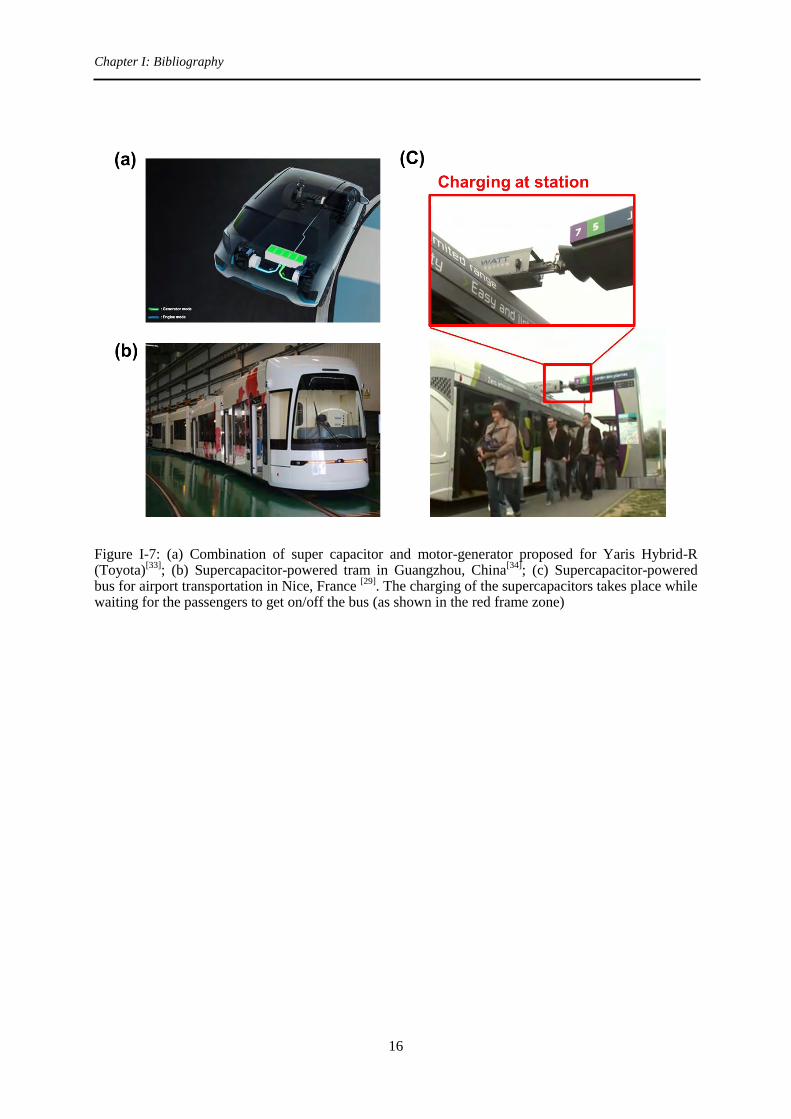
In 2014, Guangzhou (China) started to use supercapacitor powered trams where they are
charged at stops (Figure I-7b). Charging takes between 10 to 30 seconds and are enough to
run for 4 km. Breaking energy recovery system is also used on this tram with more than 85 %
of recovery efficiency. In the same year, Maxwell also won the energy Storage North America
(ESNA) Innovation Awards for an electric rail project aiming for Philadelphia area the
involvement of supercapacitors provides an energy efficient solution.[32]
Figure I-7 shows
some examples where supercapacitors are involved in transportations.
Chapter I: Bibliography
16
Figure I-7: (a) Combination of super capacitor and motor-generator proposed for Yaris Hybrid-R (Toyota)
[33]; (b) Supercapacitor-powered tram in Guangzhou, China
[34]; (c) Supercapacitor-powered
bus for airport transportation in Nice, France [29]
. The charging of the supercapacitors takes place while waiting for the passengers to get on/off the bus (as shown in the red frame zone)
Chapter I: Bibliography
17
2. State-of-the-art of the materials used in carbon/carbon supercapacitors
2.1 General material design concept for high performance supercapacitor
The main challenge today for supercapacitors is to increase their energy density without
sacrificing their power performance. There have been vast researches dedicated into finding
new electrolyte and electrode materials, and new concepts for charge storage. All the
important factors for building high performance supercapacitors are imbedded in the specific
energy and specific power equations, shown previously in Equation I-2, 5, and 6, recalled
below:
2
max02
maxmax2
1
2
1V
d
AVCE r
(Equation I-7)
ESR
VP
4
2
maxmax (Equation I-8)
From equations listed above, the energy density of supercapacitors can be enhanced by
increasing capacitance of the electrode/electrolyte pair (C) and the electrochemical window of
the system (Vmax). In general, the electrochemical window is determined by the nature of
electrolytes. Increasing electrochemical window is an efficient way to enhance supercapacitor
performance as it has a square relationship with both energy and power densities. This is the
reason why that researches have shifted from aqueous electrolytes (~ 1 V), to organic
electrolytes (~ 2.85 V), and further to room temperature ionic liquids (>3 V). While working
on the aforementioned parameters, at the same time, the resistance (R) of the cell (which was
affected by ionic conductivity of the electrolytes, electronic conductivity of the carbons, and
the contact between electrode/current collectors or between carbon particles) should be kept
as small as possible in order to maintain high power density.
The capacitance (C), as depicted in Equation I-7, can be improved by increasing the
charge storage surface area (A), decreasing the distance between ion center and carbon
electrode surface (d), or modifying the permittivity of the EDL which is mainly determined
by solvents or electrolytes. It is commonly assumed that the specific surface area (SSA) of the
carbon is the same as the surface area of electrode/electrolyte interface; hence the trend for
designing supercapacitor electrode materials is to increase the SSA of the carbons, mainly by
elaboration of microstructures or porosity creation (e.g. CO2 or KOH activation). However,
the correlation between capacitance and SSA is not so straightforward since electrode
electrical conductivity and other pore characteristics such as pore size, pore size distributions,

Chapter I: Bibliography
18
porosity, pore shape and pore structure are highly associated to each other.[35-37]
For example,
creating porosity by activation often results in widening in pore size distributions (PSD), and
decrease in electrical conductivity.[38]
It is difficult to modify solely one parameter without
changing the others, and all of them play a different role in the charging process. On the other
hand, to play with the factor d requires tailored electrode pore size and fundamental
understanding on the charge storage mechanism at molecular scale (will discuss in detail in
the following sections). The poor control on pore characteristics, and the complicated
relationship between pore characteristics and charging performance hinder both fundamental
understanding of EDL charging mechanism and electrode design of better performance. To
date, studies have shown that energy density is mainly dependent on micropores (pore size <
2 nm) and the best pore size depends on the electrolyte ions. However, mesopores (2 – 50 nm)
and/or macropores (> 50 nm) are equally important for power performance. Therefore, it is
also important to develop synthesis strategies which can finely control the porous structure
and tailor the required pore size and PSD.
2.2 Carbon electrode materials
As mentioned in the previous section, the choice of electrode materials for
supercapacitors requires high specific surface area (SSA) which offers high capacitance thus
high energy density (Equation I-7) and good electrical conductivity (~ 1 S/cm). Carbon-based
materials have been widely studied as supercapacitor electrode materials [39]
since they are
light, abundant, highly conductive, thermally and chemically stable, and they possess open
porosity and high SSA. Moreover, one of the most interesting properties of carbon is its
versatility that enables different microstructures to be produced and a wide variety of physical
and chemical properties to be achieved, allowing them to be used in different types of
applications.
Nowadays, activated carbons (AC) are the material of choice for commercial
supercapacitors because of their high SSA, relatively facile process and low cost.[13,40]
Carbide-derived carbons (CDCs)[41-45]
, templated carbons[46-48]
, onion-like carbons (OLCs)
[49-51], carbon nanotubes (CNTs)
[52-55], carbon nanohorns
[57,58], carbon fabrics
[59-62], carbon
fibers [63-65]
, and graphene [66-70]
have also been investigated. Table I-3 summarizes of the
different categories of carbon materials used in supercapacitors.[71]
In this section, different

Chapter I: Bibliography
19
carbon materials used in supercapacitors will be briefly summarized and discussed regarding
their synthesis methods, characteristic structures and electrochemical performances.
Table I-3: Different carbon structures used in EDLCs with onion-like carbon (OLC), carbon nanotubes, graphene, activated carbons, and carbide-derived carbons
[71]
0-D: Onion-Like Carbons (OLCs)
Onion-like carbons (OLCs) are zero-dimension carbons with concentric graphitic shells
(Figure I-8a-c). Currently there are two ways for large-scale production of OLCs: one is by
annealing diamond powder at 1200 – 1800 °C in vacuum or inert gas[49,51]
, and the other one
is by laser excitation of carbon precursor molecules (ethylene) [72]
. OLCs have open surface
structure and are free of micropores with particle size ranges from 5 to 15 nm. Since all the
surface area is fully ion accessible without ion transport limitation as in a microporous
network, OLCs presents high power capability.[49,73]
Micro-supercapacitors based on these
OLCs[73]
showed impressive rate capability (up to 200 V/s) and relaxation time constant (26
ms). Yet the low SSA (500 – 600 m2/g) of this material gives a poor energy performance and
low capacitance (~ 30 F/g). Chemical activation at the outer shells of OLCs shows increases
in both SSA (~ 800 m2/g) and capacitance (122 F/g) in aqueous electrolyte.
[50]

Chapter I: Bibliography
20
Figure I-8: TEM images of OLCs (a) growth with laser excitation at 10.532 μm [72]
, (b) produced by annealing nanodiamond powders at 1800 °C (Lattice spacing between the bent graphitic layers in the onion is close to 0.35 nm)
[73], and (c) synthesized via arc discharge between two carbon electrodes in
water [74]
; SEM images of (d) CNTs synthesised in the CVD system[75]
and (e) vertical aligned CNTs generated by Fe:Co (2:3) catalyst with additional Al2O3 layer
[53]
1-D: Carbon nanotubes (CNTs)
One dimensional carbon nanotubes are highly attractive electrode materials owning to
their superior electrical conductivity, and excellent thermal and mechanical stability. As
OLCs, CNTs have mainly exohedral surface with moderate SSA 120 500 m2/g (single wall
CNTs can go up to 1000 m2/g). As a result, they generally present a lower capacitance (50
80 F/g) than activated carbon in organic electrolytes [71]
, but are attractive candidates for high
power devices. Most common method to produce CNTs is by chemical vapor deposition
(CVD), as shown in Figure I-8d. Current trend is to grow CNTs vertically on conductive
substrate (Figure I-8e) which allows efficient electron pathway between current collectors and
CNTs and fast ionic transport.[53,76]
CNTs are also commonly used as substrate for composite
electrodes by decorating a thin layer of pseudocapacitive materials on the surface [77-79]
since
raw CNTs suffer from the same energy limitation as OLCs.

Chapter I: Bibliography
21
2-D: Graphene
Graphene is a single, atomic-thick, tightly-packed layer of carbon atoms bonded in
hexagonal lattice. It has drawn tremendous attention during the past decade since its first
successful creation in the lab by mechanical exfoliation using adhesive tape.[70-82]
Figure I-9: Examples of graphene: (a) TEM image images of as-prepared microwave exfoliated graphene oxide and the corresponding electron diffraction pattern
[83], (b) SEM image of curved
graphene sheets [84]
, and (c) TEM image of flat graphene sheets prepared by a conventional chemical route. This TEM image clearly shows graphene sheets overlapped together with intergraphene spacing likely <1 nm.
[84]
Owning to the special way carbon atoms bond to each other within the graphene layer,
graphene exhibit plenty of impressive properties which exceed other materials known today:
light (only 0.77 mg with 1 m2), mechanically strong (> 100 times than steel), and high
electron mobility (> 150,000 cm2/V.s).
[85] The most attractive feature of graphene as an
electrode material for supercapacitors is that it has a high theoretical SSA value of 2670 m2/g,
however in practice it still suffers from re-stacking. Graphene can be produced by various
ways such as CVD [86-88]
, electrophoretic deposition [89,90]
, ink-jet printing[91]
, whereas
reduction of graphene oxide (GO) is the most cost-effective method to obtain graphene-based
electrode materials (Figure I-9). Reduced graphene oxide (rGO) provides specific capacitance
of 130 205 and 100 125 F/g in aqueous and organic electrolytes, respectively. Recently,
rGO with large SSA (up to 3100 m2/g) derived by chemical activation of microwave
exfoliated/reduced GO has been reported by Zhu et al [66]
. This rGO provides excellent
performance with a specific capacitance of 200 F/g in neat EMI-TFSI ionic liquid electrolyte
at 0.7 A/g. However, owning to its low packing density, graphene suffers from low
volumetric capacitance.
Chapter I: Bibliography
22
3-D: Carbide-derived carbons (CDCs), templated carbons, and activated carbons (AC)
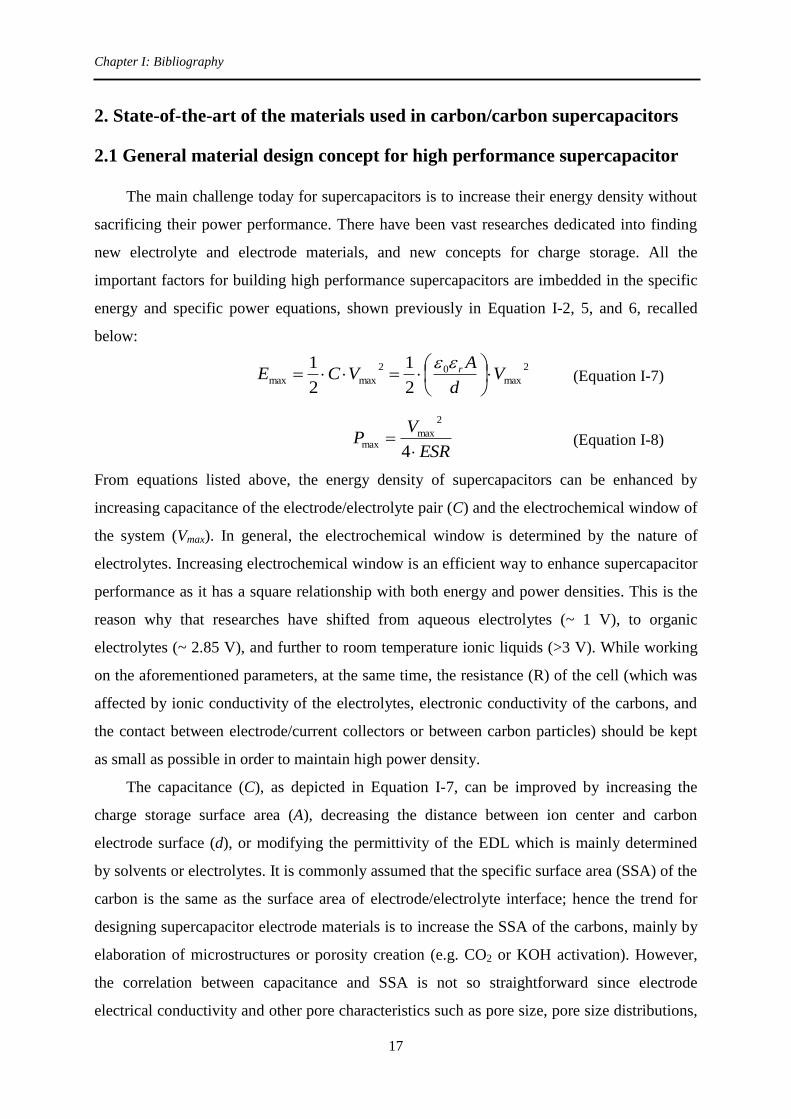
Carbide-derived carbons (CDCs) are produced by selective extraction of metals (M)
from metal carbide (MC) precursors and transforming the carbide into pure carbon through
different synthesis method (halogenation, hydrothermal treatment, vacuum decomposition, etc)
[42]. The most common way for producing CDCs for supercapacitor application is though
chlorination [41,92]
. The reaction is:
)(22 sn CMClnClMC (Equation I-9)
During carbide chlorination, the original shape and volume of the carbide precursor are
maintained; therefore it is also referred as conformal transformation process.[93,94] Carbons
produced by this method are highly attractive as it allows fine control over the pore size and
PSD by varying the carbide precursor, chlorination temperature, pressure, and other synthesis
conditions (Figure I-10). CDCs possess high SSA ranging from 1000 – 3000 m2/g and tunable
pore structures in microporous range with subnanometer accuracy, thus making them the best
candidates for fundamental EDL studies (will be discussed in section I-3). In general, CDCs
exhibit specific capacitance of 110 200 F/g in aqueous electrolytes, and 65 160 F/g in
organic electrolytes.[95]
Figure I-10: Examples of CDCs: TEM micrographs of TiC–CDC synthesized at (a) 400 °C (b) 1000 °C. At 400 °C, the carbon produced is mostly amorphous. As the temperature increases to 800 °C and above, thin non-planar graphitic fringes are seen. Planarization of graphite fringes and increase in their length can be seen at higher temperatures
[41]; TEM images of different template carbons (c-e)
[96-98]

Chapter I: Bibliography
23
Templated carbons the templating method provides an effective way to produce
nanostructured carbons with well controlled narrow pore size distributions from micro- to
macroporous range, ordered pore structures, and an interconnected pore network.[99]
Figure
I-10 shows some examples of ordered porous carbon produced by template method.[96-98] The
templates can be roughly sorted into two types: hard-templates which are generally solid
structure (e.g. silica), and soft-templates which are often organic surfactant-based (e.g.
triblock copolymer). In hard-templated approach, allows exact replication of the template
morphology hence offers a precise pore control, the template is generally first filled with
carbon precursor, and followed by carbonization and removal of template, leaving a porous
carbon structure. But the removal of template often involves toxic chemicals, such as HF.
While soft-templated strategy is more cost-effective and environmental-friendly, though less
precision in pore control. Specific capacitances of 120 350 and 60 140 F/g are found for
these carbons in aqueous and organic electrolytes, respectively.[100]
Activated carbons have been widely studied and are the most used electrode material
for commercial supercapacitors owning to their large SSA (> 1000 m2/g) and pore volume
(>0.5 cm3/g), relatively simple production method and low cost.
[1,40] They are produced by
pyrolysis of carbon-rich precursors in an inert atmosphere (usually N2) at 400 900 °C,
followed by activation process using oxidizing agents such as CO2 [35,101,102]
, steam [101-103]
or
KOH [36,37,103]
, leading to opening of some closed pores and creating additional porosity. In
general, the higher the activation temperature/activation time, the larger the porosity, however
the broader the pore size distribution (PSD). Traditional activated carbons feature a broad
pore size distribution ranging from micropore (< 2 nm) to macropore (> 50 nm) region,
resulting in capacitance of 150 300 F/g and 80 – 120 F/ g in aqueous and organic
electrolytes, respectively [1]
. Among different activating agents, KOH is of great interest to
supercapacitor applications since it generates large SSA (2000 3500 m2/g) and pore volume
(1 2.6 cm3/g), and shows narrower and better tuned PSD though careful selection of carbon
precursors and activation conditions. KOH activation can also be employed on other types of
materials to increase SSA and improve capacitance.[38,50,66]
However, it should be noted that
porosity creation often means increasing the amount of sp3-bonding resulting in reduction of
carbon conductivity. Although recent developments in precursors and activation procedures
showed improved control over PSD of activated carbons, templated carbons or
carbide-derived carbons still present better tunability and narrower PSD.

Chapter I: Bibliography
24
2.2 Electrolytes
Electrolytes used in supercapacitors can be sorted into three categories: aqueous
electrolytes, organic electrolytes, and room temperature ionic liquids. The two main criteria
for electrolytes are (wide) electrochemical window and (high) ionic conductivity.
Aqueous electrolytes
Aqueous electrolytes possess high ionic conductivity (few hundreds of mS/cm) as
compared to organic electrolytes or ionic liquids. However, the narrow stability window of
water limits the cell voltage at < 1.3 V, giving the device poor energy density. Acid-based
(e.g., H2SO4) or alkali-based (e.g., KOH) electrolytes are commonly used aqueous
electrolytes.
Organic electrolytes
Organic electrolytes are made of salts dissolving in organic solvents. The ionic
conductivity of organic electrolytes ranges from few to few tens of mS/cm. By shifting from
aqueous to organic electrolytes, the electrochemical window was increased up to 2.7 V. Both
properties are highly dependent on the nature of organic solvents (mainly viscosity). A
detailed study of different salts and organic electrolytes was reported by Ue et al.[104]
Conventional organic electrolyte used in most of the commercial supercapacitors is composed
of 1 – 1.5 M tetraethylammonium tetrafluoroborate (NEt4BF4) in acetonitrile (AN) with a
conductivity of ~ 60 mS/cm at room temperature. The main concern of this electrolyte is the
low flash point (~ 5 °C) of AN. However, current alternatives to AN, e.g., propylene
carbonate (PC), often show poorer power performance due to their lower ionic conductivities.
Room temperature ionic liquids (RTILs)
Room temperature ionic liquids (RTILs), also referred as room temperature molten salts,
have drawn much attention for energy storage applications during the past two decades thanks
to their wide electrochemical window (~ 4 V, some ionic liquids can go up to 6 V) [105-108]
.
Supercapacitors using pure ionic liquids as electrolytes usually exhibits potential windows
more than 3 V, limited mainly by impurities or functional groups on the carbon surface. They
are salts having low melting points thus exist as liquid state at room temperature, and they are
considered as “green” electrolyte due to their non-volatility. However, RTILs suffers from
their high viscosity (30 50 cP; some ILs even have viscosity values up to 600 cP at 25 °C)

Chapter I: Bibliography
25
hence relatively low ionic conductivity (0.1 18 mS/cm at 25 °C), which limits their practical
use at elevated temperature [107]
. Interestingly, Lin et al. have recently shown that the concern
of ionic conductivity can be circumvented by selecting appropriate carbon nanostructures,
such as exohedral surface materials [109]
. Physical and chemical properties of different RTILs
(to be used as electrolyte in electrochemical cells) have been summarized and discussed in
detail in reference [110]
.
This thesis focuses mainly on organic electrolyte and ionic liquid-based electrolytes
owning to their high energy density.

Chapter I: Bibliography
26
3. State-of-the-art of the EDL study: pore size vs electrolyte ion size
Traditional view of ion adsorption
Before mid-2000s, early efforts put in increasing the capacitance were focused on
increasing specific surface area and porosity of the carbon materials. However, the SSA failed
to show linear relationship with capacitance as predicted by equation.[111,112]
In search of other
parameters that could improve capacitance, the relationship between electrolyte ion size and
carbon pore size has also been investigated. Studies have suggested that electrolyte ions enter
the pores with their entire solvation shells due to the high magnitude of solvation energy, and
the maximum capacitance was expected to appear when the compact layers of ions residing on
both adjacent pore walls. Taking into account the solvated ion size for organic electrolytes is
larger than 1 nm [113,114]
, the best electrode pore size was limited at about 2 5 nm (twice the
solvated ions size) [1,115]
, mainly in mesoporous range. Despite all efforts poured in tailoring
pore size in small mesopore range, mainly achieved by template techniques, only small
improvement has been achieved using mesoporous carbon. The capacitance is round 100-120
F/g and 150-200 F/g for organic and aqueous electrolytes, respectively.[116-120]
At the same
time, high capacitance has also been reported in carbons containing large amount of
micropores by different groups.[121-123]
Moreover, a study reported by Vix-Guterl et al [121]
has
shown linear relationship between capacitance and microporous volume in the materials,
leaving doubts in this EDL theory.
The rising of micropores: ion desolvation
Systematic studies of the individual effect of SSA, pore size, porosity, pore size
distribution and conductivity on capacitive charge storage were difficult to be carried out due
to poor control of traditional production methods over carbon pore characteristics. Therefore,
the traditional belief in double layer structure in a charged porous carbon could not be studied
and verified until a new category of carbon carbide-derived carbons (CDCs) has been
developed.[124]
CDCs offer narrow PSD, and excellent pore size control with angstrom
accuracy by changing the synthesis temperature.[41]
Among different CDCs, titanium
carbide-derived carbons (TiC-CDCs) are very interesting for probing ion – pore size
relationship because their pore sizes can be controlled in between 0.6 and 1.1 nm, in the same
range as bare/solvated ion sizes (Figure I-11b[125]
). By using TiC-CDCs, Chmiola et al. [126]
have found a dramatic capacitance increase when pore size goes below solvated ion size (1

Chapter I: Bibliography
27
nm), as shown in Figure I-11a where capacitance was normalized by BET SSA to highlight
the effect of pore size, contradicting the traditional EDL pictures. It was proposed that ions
stripped off part of their solvation shells to squeeze in the confined micropores, leading to a
reduction in distance between ion center and carbon surface, thus resulting in the capacitance
increase. The capacitance increased from 100 to 140 F/g (55 to 80 F/cm3) while reducing the
pore size from 1.1 to 0.68 nm, representing a gravimetric capacitance improvement of 40%
over commercial carbons under the same testing condition (100 % for volumetric capacitance).
The size effect has also been reported by other groups.[121,123,127]
These results have
completely overturned the old belief in supercapacitor charging mechanisms, and changed the
research directions in the capacitive storage domain.
Figure I-11: CDCs with controlled and narrow PSD studies in 1.5 M NEt4BF4 solvated in acetonitrile: (a) Specific capacitance normalized by SBET for CDCs and in two other studies with identical organic electrolytes
[126], (b) bare and solvated electrolyte ion size calculated from reference
[128], (c) figure
adapted from reference [125]
, and specific capacitance of the cell and positive (C) and negative (C+) electrodes as a function of pore size
[125].
Further study of the same system (NEt4BF4/AN) was conducted in a three-electrode cell
configuration to investigate cation and anion behavior separately.[125]
Results confirm that
both cations and anions are at least partially desolvated. Maximum capacitances for cation
and anion appear at different pore sizes, suggesting different effective ion size; anion exhibits

Chapter I: Bibliography
28
higher capacitance than cation for all the pore size. (Figure I-11c). The authors attributed the
difference in capacitance between anion and cation to different solvation energy, and
suggesting that higher solvation energy leads to higher capacitance since part of the energy is
stored in the reversible solvation/desolvation process.
Steric effect: ion sieving
The pore vs ion size relationship is further investigated using cavity microelectrode
(CMEs) [129]
by cyclic voltammetry and electrochemical impedance spectroscopy
measurements [130-133]
. From CV measurements (Figure I-12a), Lin et al have shown that
despite the solvated ion sizes of NEt4+ and BF4
in acetonitrile (AN) are larger than 1 nm
(Figure I-11b) [125]
, the CV shows nice rectangular profile in 1 nm-pore for both cation and
anion adsorption. The capacitive behavior is preserved for anion adsorption (potential > OCV
@ 0 V vs reference) while decreasing pore size from 1 down to 0.68 nm; whereas CV
distortions are observed for pore size < 1 nm for cation adsorption (potential < OCV @ 0 V vs
reference) suggesting a decrease of ion accessibility in the pores. The effective ion sizes for
anion and cation are thus deduced to be < 0.68 nm and 0.76 1 nm, respectively.
Figure I-12: Normalized CVs of CDC samples at scan rate of 100 mV/s in (a) 1.5 M NEt4BF4/AN (OCV = 0 V vs ref) and (b) 1 M NEt4BF4/PC (OCV = 0.3 ~ 0.5 V vs ref)
[130]
The same trend has been observed when using propylene carbonate (PC) as solvent
(Figure I-12b), and the effective ion sizes are found to be larger than that in acetonitrile: ~
0.75 nm and > 1 nm for anion and cation, respectively, suggesting that effective size of the

Chapter I: Bibliography
29
same ion adsorbed in carbon pores is different depending on the nature of the solvent, and the
ion-solvent interaction. These results confirm that ions move in and out the micropores
without hindrance at light degree of desolvation (1 nm-pore); removal of the first few solvents
is easy. The increase of confinement will increase the degree of desolvation until the energy
of removing one more solvent becomes too high, and the minimum solvated ion size
(effective ion size) is reached. Further decrease of pore size won’t remove more solvent
molecules but decrease the ion accessibility to the pore surface, resulting in deviated CVs
from rectangular capacitive profile. A steric effect or ion sieving effect [134]
is thus observed.
These results are also confirmed by using other ion/solvent pairs.[132,133]
Instead of steric effect, some reports attributed the limited charge storage in small pore
size to surface saturation effect.[135,136]
Segalini et al [133]
conducted experiments to clarify the
origin of the current distortion in smaller pore size. A current increase was observed when
adding EMI-BF4 into 1.5 M NEt4BF4/AN (Figure I-13a). The added EMI-BF4 have the same
anion but cation with smaller effective ion size than NEt4+, thus have access to smaller pores
that were not reachable by larger solvated NEt4+. Same trend has been observed when playing
with effective anion size (Figure I-13b). These results have shown that the pore accessibility
is not determined by charge saturation on the carbon surface but by steric effect.
Figure I-13: Normalised CVs of TiC-CDC with 0.68 nm pores in 1.5 M NEt4BF4 in AN (a) and 2 M EMI-TFSI in AN (b) with addition of different amounts of EMI-BF4
Chapter I: Bibliography
30
Solvent-free environment
After the breakthrough discovery of ion accessibility in the small micropores [126]
, the
following question then becomes what is the best pore size for efficient charge storage? In
spite of the attempt in probing pore-ion size relationship, lots of uncertainties remain when
studies were conducted with organic salts dissolved in solvent: To what extent can solvent
been removed? Even if the pore size is close to ion size, is there any solvent residual in the
pores? Do the solvent residuals participate in charge storage? Ionic liquid, as a solvent-free
electrolyte, is thus a good candidate to help clarifying things one by one. Without the
implication of solvent molecules, ionic liquid has a well identified ion size and thus makes the
investigation of effect of ion-pore size relationship on capacitance simpler.
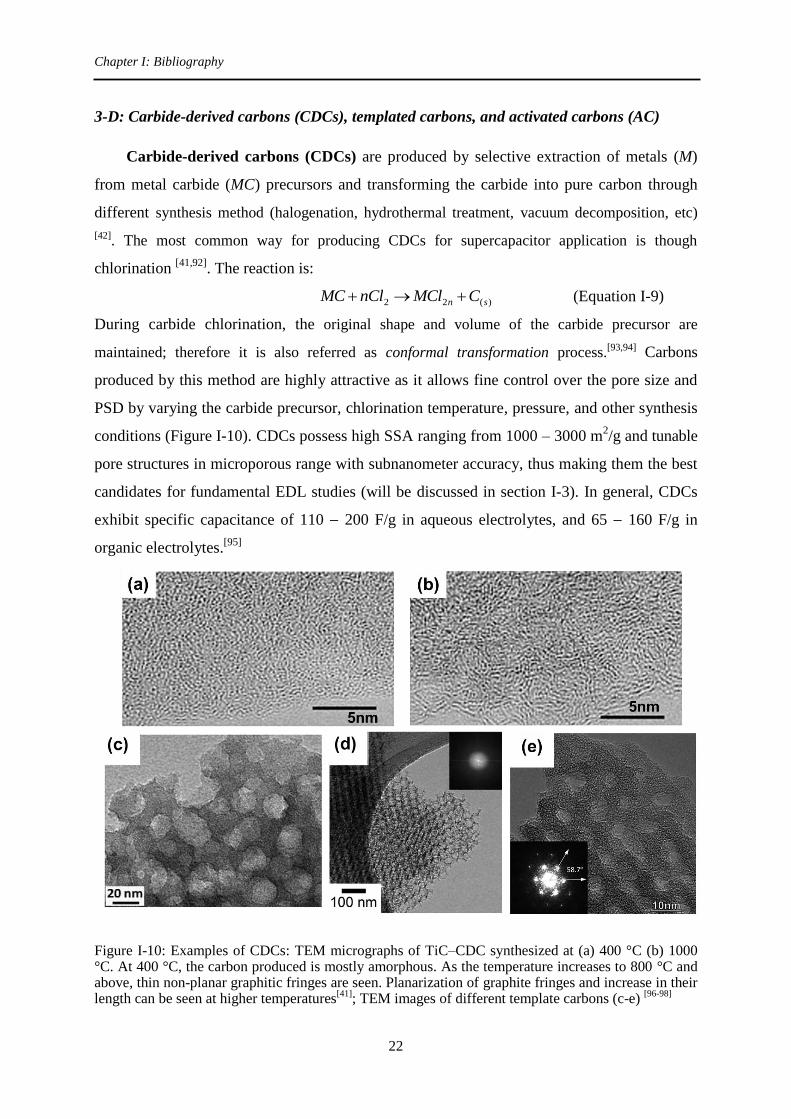
Figure I-14: Normalized capacitance change vs the pore size of the CDC samples prepared at different temperatures; normalized capacitance is obtained by dividing the specific capacitance by the SSA. HyperChem models of the structure of EMI and TFSI ions show a size correlation.
[137]
CDCs with different pore sizes measured in neat EMI-TFSI ionic liquid (Figure I-14)
shows that maximum capacitance appears at pore size of ~ 0.7 nm, close to the longest
dimension of both cation and anion.[137]
The optimized pore size offers high specific
capacitance of 160 F/g (85 F/cm3), much greater than commercial activated carbon in ionic
liquids (less than 100 F/g and 50 F/cm3). This confirms again the key contribution of
micropores in the capacitive charge storage, and maximum capacitance arises when pore size
is close to ion size.
From material design point of view, all these results highlighted the need to adapt the
electrode pore size to the electrolyte ions size, which situates at the microporous range, for
Chapter I: Bibliography
31
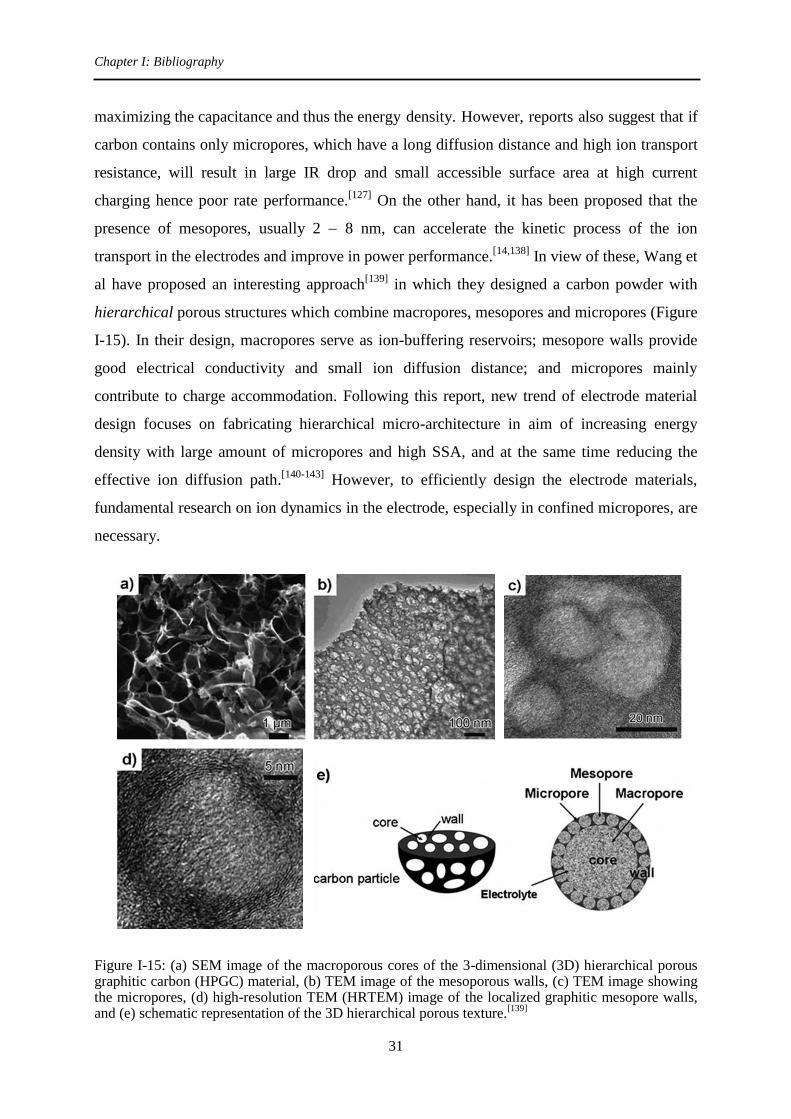
maximizing the capacitance and thus the energy density. However, reports also suggest that if
carbon contains only micropores, which have a long diffusion distance and high ion transport
resistance, will result in large IR drop and small accessible surface area at high current
charging hence poor rate performance.[127]
On the other hand, it has been proposed that the
presence of mesopores, usually 2 8 nm, can accelerate the kinetic process of the ion
transport in the electrodes and improve in power performance.[14,138]
In view of these, Wang et
al have proposed an interesting approach[139]
in which they designed a carbon powder with
hierarchical porous structures which combine macropores, mesopores and micropores (Figure
I-15). In their design, macropores serve as ion-buffering reservoirs; mesopore walls provide
good electrical conductivity and small ion diffusion distance; and micropores mainly
contribute to charge accommodation. Following this report, new trend of electrode material
design focuses on fabricating hierarchical micro-architecture in aim of increasing energy
density with large amount of micropores and high SSA, and at the same time reducing the
effective ion diffusion path.[140-143]
However, to efficiently design the electrode materials,
fundamental research on ion dynamics in the electrode, especially in confined micropores, are
necessary.
Figure I-15: (a) SEM image of the macroporous cores of the 3-dimensional (3D) hierarchical porous graphitic carbon (HPGC) material, (b) TEM image of the mesoporous walls, (c) TEM image showing the micropores, (d) high-resolution TEM (HRTEM) image of the localized graphitic mesopore walls, and (e) schematic representation of the 3D hierarchical porous texture.
[139]

Chapter I: Bibliography
32
If we look back to the capacitance equation (Equation I-2), the parameter r, dielectric
constant seems to receive less attention. In the traditional double layer theory, solvent
molecules only act as continuum, and are often assumed to have no additional effect on the
double layer during charging process by using constant permittivity. Whereas in reality,
solvents largely populate in the double layer even in the case of partial desolvation, and the
effective dielectric permittivity plays a certain role on the charging process. Although it has
been suggested that the permittivity decreases when solvent molecules are adjacent to the
charged electrode owning to the decreased ability to screen the charge [3,144]
, but up to now,
individual contribution of solvent molecules and ions to charge storage, the details of how
solvent molecules affect the double layer structure in such confined space, and the
relationship between solvation energy, adsorption energy and charge storage are still poorly
understood. Aside from these rather thermodynamic factors, realization of ion transport and
instant molecular organization during charging/discharge is needed for achieving efficient
charging. Fundamental understanding on the kinetic factors will efficiently help for better
supercapacitors designs. Electrochemical techniques alone are insufficient to probe these
issues, incorporation of simulation or other in-situ techniques are definitely required to reveal

Chapter I: Bibliography
33
4. State-of-the-art of the charging mechanism and ion transport: from
modelling and in-situ techniques point of view
To obtain a clear picture of charging mechanism and dynamics in the confine space and
the physics behind the capacitance increase, one need in-situ electrochemical methods to track
the electrolyte molecules in real time. To date, we lack the techniques to probe the
relationship between the local degree of charge separation and the local structure of pores.
Therefore, computational simulations and modellings are equally important for understanding
what accounts for the anomalous increase of charge storage and how it happens. This section
will summarize what we know now about charging the EDL in confined space from
modelling and empirical points of view. Exohedral surface materials (e.g. onion-like carbons
or nanotubes) are also gaining increasing attentions from fundamental point of view, however
high energy density requires porous confinement. Therefore, this thesis work and the
following discussion will focus on porous materials.
4.1 Theoretical Approaches
There was a clear lack of fundamental understanding of the double layer charging in the
confined space of micropores as the traditional theories fail to explain the anomalous
capacitance increase in the microporous carbon. This has triggered significant research efforts
in computational simulations and modeling, aimed at developing new theories or improving
the existing ones. Among different methods, Monte Carlo (MC) and molecular dynamics
(MD) are the most favored molecular simulation techniques. MC simulations are based on
statistical mechanics which obtains the thermodynamic properties of the system by averaging
over a large number of sampling steps, and are thus limited to equilibrium properties. MD
simulations solve the Newton’s equation of motion for the system over a period of simulation
time, and are able to predict both equilibrium and dynamic properties.
In the development of molecular modeling, the selection of electrolyte and electrode
models is critical for the accuracy and reliability of the simulation results. Commonly used
electrolyte includes primitive models, all-atom electrolyte models, united-atom models and
coarse-grained models. Primitive models are often used in the early simulations of EDLCs
since they are simplest models among the aforementioned ones by describing ions as hard
spheres, electrodes as hard walls, and solvents are considered as a dielectric constant
[145][146][147]. The accuracy of these models is restrained due to the lack of realistic structure.

Chapter I: Bibliography
34
All-atom electrolyte models include every single electrolyte atom, and are the most realistic
models for studying EDL structure and polarizability [148]
. However, all-atom electrolyte
models are of limited use due to their high computational cost. United-atom models and
coarse-grained models applied some simplification by grouping different atoms into single
pseudo-atoms [148]
. Coarse-grained models are highly attractive for simulating RTILs since
they allow accurate prediction of IL physical properties, IL/electrode interaction and EDL
structure as that of all-atom models [149]
, with greatly reduced simulation times (by 100 times)
[148]. The electrode models can be roughly sorted into constant and uniform surface charges or
polarizable electrodes where the electrode potential is hold constant and the local carbon
charges are allowed to fluctuate. Besides these, different electrode structures (e.g. planar
electrodes, slit-type pores, carbon nanotubes, etc.) could be given. In general, simplified
carbon structure (e.g. planar electrode) often results in underestimated capacitance as
compared to experimental values; hence it is important to include the carbon structural
complexity and polarizability.[150-153]
4.1.1 Solvent-free environment: room temperature ionic liquids (RTILs)
Planar electrodes
Due to their promising features for supercapacitor applications, RTILs have also
attracted significant attention from modelling researchers. The molecular simulations of
RTILs on planar electrodes during charging have revealed the EDL structures at the
electrode-electrolyte interface and provided different pictures and factors which may involve
in charging/discharging procedures.
It has been pointed out that one cannot apply Gouy–Chapman–Stern theory, which is
based on diluted electrolytes, to RTILs.[154]
Due to the absence of solvent, short-range
Coulomb correlations [155]
are strong in these dense ionic systems [156,157]
; hence it is important
to take the strong electrostatic interaction between cations and anions into account when
constructing the EDL structure of RTILs. Two EDL structures at the planar charged electrode,
which took into account the natural constrain of maximum ion packing density and
short-range ionic correlations, have been proposed by Fedorov and Kornyshev [158]
(Figure
I-16): overscreening where the electrode surface charge is overscreened by a monolayer of
counter-ions and is corrected by an excess of co-ions in the second monolayer; and crowding
where counter-ions extends across two monolayers leading to a co-ion excess in the third

Chapter I: Bibliography
35
monolayer. It predicts that [159]
overscreening is pronounced at small voltages polarization and
gradually replaced by the formation of a condensed layer of counter-ions, followed by
complete lattice saturation at very high electrode polarization. These results suggest that the
“over-compensation” leads to an oscillatory behavior of the charge density extending several
layers from the electrode surface to bulk electrolyte until the electroneutrality is reached;
hence the double layer in IL is not one layer thick.
Figure I-16: Structure of the ionic-liquid double layer (in color) predicted from MD simulation of Ref [158]
. (a) Overscreening is pronounced at a moderate voltage, V = 10kBT/e (0.26 V), (b) whereas crowding dominates overscreening at a high voltage, V=100kBT/e (2.6 V) Because of electrostriction, the diffuse double layer (colored ions) is more dense than the quasineutral bulk liquid (white ions)
[159]
Several simulations highlighted the effect of ion size, ion size asymmetry (cation size
different from anion size) and ion shape asymmetry on interfacial structure and capacitance
[158-163]. On the other hand, by using all-atom models of BMI-PF6 ionic liquid
[164,165],
simulations have shown that near uncharged graphite surface, the ionic liquid structure differs
from its bulk structure, and shows a well-organized region extended ~ 2 nm from the
electrode surface. The imidazolium rings in cations tend to lie flat, parallel to the graphite
surface with a distance of 0.35 nm, while the alkyl chains stretch in the perpendicular
direction. When the surface is charged negatively, more cations are adsorbed on the electrode
but with the same ring-electrode distance, while anions are repelled toward the electrolyte
bulk, resulting in an alternating cationic and anionic layer profile. At the positively charged
surface, anions are adsorbed on the surface; the cation concentration in the adsorption layer
decreases but still has a nonzero value. In addition, the tilt angle of the adsorbed rings
increases, which is in accordance with the experimental observations [166,167]
. These results

Chapter I: Bibliography
36
highlight that RTILs undergo a high level of structural rearrangement near charged surface.
Porous electrodes
Understanding the IL properties on planar electrodes is essential but not sufficient to
understand the origin of the anomalous capacitance increase in confined micropores, therefore
the pore-ion size relationship has also been investigated by the introduction of micropores in
the modelling system. Qualitative agreements are found in different micropore models.
Kondrat et al. [168,169]
suggested performed grand canonical MC simulations of a restricted
primitive model of ionic liquid in which image forces exponentially screen out the ion-ion
interactions in the metallic slit-like narrow pores and ion-pore wall interactions. Packing of
ions with the same sign becomes easier and is mainly restricted by steric factors. The authors
termed this phenomenon as “superionic” state, which explains the anomalous capacitance
increase when pore size decreases (Figure I-17). Simulation results showed that both total
charge (per surface area) increase in a pore and total ion density increase along with the
capacitance increase. The saturation of the total ion density in a pore (which means a
complete filling of a pore is reached) is account for the peak in the capacitance vs voltage
plot.
Figure I-17: Anomalous capacitance behavior [161]
: Differential capacitance per surface area (a) as a function of voltage and (b) as a function of the pore width for zero electrode polarization, compared with the experimental data from ref.
[130], and the dot-dash line
represents the mean-field results of ref. [160]
; (c) Schematic view of the cross-section of a single, laterally infinite, slit-like narrow pore as a part of a porous electrode.
[160]

Chapter I: Bibliography
37
By using CNTs as porous electrodes, which differs from slit-type electrodes by addition
of curvature effect, Shim et al. [151]
have shown that capacitance increases when the CNT
diameter goes from 2 down to 0.9 nm. Below 0.8 nm, the capacitance drops as the pores
become too small to accommodate ions, which corresponds to the “ion sieving” observed
experimentally [126,134,137]
. However, concerns are raised due to a large disparity between the
capacitances obtained from simulation (0.5 1.5 μF/cm2) and experimental results (7 13
μF/cm2)
[137]. The authors attributed this to the lack of polarizability of electrode and
electrolyte in the models.
Merlet et al [152]
conducted an insightful MD simulations using coarse-grained model of
BMI-PF6 with realistic microporous electrodes (Figure I-18). The electrode model
Figure I-18: The EDLC simulation cell. Upper panel: the simulation cell consists of a BMI-PF6 ionic liquid electrolyte surrounded by two porous electrodes (CDC-1200) held at constant electrical potentials (blue: C atoms, red: the three sites of BMI
and green: PF6
ions). Lower panel: structure of
the electrode for various voltages. For each value, the same snapshot is shown twice: The ionic distribution is shown on the left. The degree of charging of the electrode atoms is shown on the right, where the carbon atoms are colored according to the charge q they carry (green: q<0, red: q>0 and yellow: q=0).
[152]

Chapter I: Bibliography
38
was derived from quenched molecular dynamics simulations by Palmer [170]
which was
proved to mimic well the morphology of TiC-CDCs. The polarization of the electrode atoms
by the electrolyte ions was also taken into account in the simulation. Capacitances of 87 and
125 F/g are obtained for CDC-1200 and CDC-950, respectively (correspond to CDC
synthesized at temperature of 1200 and 950 °C). The results are in excellent agreement
experimental data [126,137]
. It has been found that the electrodes are wetted by equal number of
cations and anions even at null potential, which was also observed previously in other
simulations using slit-type micropore electrodes [169,171]
, implying that the charging is not a
simple potential-driven mechanism. During charging, the total volume occupied by the ions in
the electrodes remains almost constant, but ions in the electrode exchange with those in bulk
and the ratio of cation to anion in the pores varies. Although the average coordination number
drops from seven in the bulk to four inside the electrode, the Coulomb ordering effect that
occurs in the bulk is also found to dominate the IL structure in the pores.
Comparison of the double layer structure adsorbed on CDC-1200 porous electrode and
planar graphite electrode confirms that local electrode structure plays a role on capacitive
charge storage. An overscreening was observed on planar electrode whereas in the pores of
CDC-1200, there is only one adsorbed layer. Although there are three times more of
counter-ions in the closest adsorbed layer on the graphite surface than on the CDC-1200
surface due to the overscreening effect, the second adsorbed layer of co-ions not only
counterbalances the charge in the first layer and also drags the first adsorbed layer further
toward the bulk hence leaves a larger distance between ions and electrode, resulting in a less
efficient charge storage. This may be part of the reasons to explain the better capacitive
performance in the confined micropores. Interestingly, the capacitance of CDC-950 exceeds
that of CDC-1200 by 43 % even though they have similar PSD and average pore size (0.93nm
and 0.95 nm), indicating that the local structures can affect capacitance.
4.1.2 Solvent-containing electrolytes
Acetonitrile-solvated RTILs have been studied in molecular simulations to investigate
the influence of solvent and determine which system (between pure and solvated IL
electrolytes) is better for EDLC designs. From the simulation performed on a planar
electrode by Feng et al[172-174]
, two competing phenomena have been found when adding
acetonitrile molecules in neat IL: the capacitance may decrease as acetonitrile molecules
screen the interaction between cation and anion thus reducing the overscreening effect;

Chapter I: Bibliography
39
whereas capacitance may increase as the dielectric constant of the solvent is higher than
RTILs.
Recently, charging process of neat and acetonitrile solvated ionic liquid in a realistic
carbon electrode has been studied by Merlet et al using MD simulations.[175]
The local
structure and solvation environment have been investigated. For solvated ILs at null potential,
wetting of the carbon electrode is already achieved by partial desolvation. When applying
potential, counter-ions are dragged deeper in more confined sites (Figure I-19), and the
solvation number decreases from 9 in the bulk down to 3 (in some cases even 1) depending on
the degree of confinement around the ions. The more confined environment results in higher
degree of desolvation, which is in good agreement with experimental observation.[126]
On the
other hand, co-ions are expelled to less confined sites. These results first confirmed that the
origin of the anomalous capacitance increase in microporous carbon is the electronic
screening by the pore walls of the repulsive Coulombic interactions between ions of the same
charge and the absence of overscreening effects in the electrolytes. It also highlights the role
of local carbon structure.
Figure I-19: Distribution of the DoC experienced by each (a) PF6
and (b) BMI
for three different
applied electrode potentials (0.5, 0 and 0.5 V), in the case of the ACN-containing electrolyte.[175]
Kaneko’s group has carried out reverse MC simulations of the structure of PC in a
slit-shaped micropores by using experimental synchrotron XRD data[176,177]
. Results have
shown that PC and NEt4+ molecules in the micropores are vertically aligned against the
carbon walls leading to a more ordering and denser packing way than in the bulk. The degree
of PC ordering is dependent on the pore size.

Chapter I: Bibliography
40
Dynamics
Due to the high computational cost, relatively few studies have focused on the dynamic
effects on EDL charging. By applying a mean-field model to study ionic liquid in a slit-like
metallic micropore, Kondrat and Kornyshev[178]
have shown that the charging of initially
empty pores proceeds in a front-like way, while that of already filled pores is diffusive. The
dynamics of charging in realistic nanoporous carbon electrodes have been investigated by
Péan et al [179]
. Results show that the general tendency observed for the charging process is
that the charge penetrates progressively from the electrode-electrolyte boundary toward the
interior of the electrode in a diffusive way, in qualitative agreement as reported by Kondrat et
al [178]
. Ion transport is found to be slower in pores with smaller pore size. The results also
highlight that besides the pore size, the connectivity between the pores should play an
important role in the charging process and influence its heterogeneous characteristic.
4.2 In-situ Experimental Approaches
Standard electrochemical experiments and other ex-situ measurements offer important
insights but they do not give a realistic picture of a working device, hence it is important to
develop in-situ electrochemical techniques to study the capacitive charge storage, which is
also critical for investigating the charging dynamics of the electrode/electrolyte pairs. There
are only few in-situ electrochemical techniques which are able to reveal the EDL structure or
investigate the charging mechanism and ion transport at near electrode/electrolyte interface.
This section will briefly sum up different in-situ techniques that have been involved in the
investigation of EDLC charging mechanisms. Most of them are relatively new techniques and
are still under development. Different from simulations, it is more difficult to investigate neat
ionic liquids than solvent-containing systems due to technical limitations, generally arising
from the high viscosity of ionic liquid. Technical improvement is definitely needed for each
in-situ methods to reveal the real double layer charging scenarios at molecular/atomic scale.

Chapter I: Bibliography
41
Nuclear Magnetic Resonance Spectroscopy
Nuclear Magnetic Resonance (NMR) is an appealing technique for revealing the
charging mechanism as it is able to probe local interaction between electrode and electrolyte
and dynamics at the interfaces. Its element selective nature makes it extremely powerful as it
can track specific species individually, thus allow separate observation of cations and anions
in the system. Recent Ex-situ NMR measurements[180]
reported by Deschamps et al, where
NMR spectra were collected on a dismantled supercapacitor after charging in different states,
are combined with magic-angle spinning (MAS) techniques[181]
to improve spectral resolution.
However, concerns are raised owning to the fast self-discharge in the EDLCs and solvent
evaporation.
In-situ NMR technique for EDLC study was recently developed by Grey’s group.[182,183]
Wang et al [183]
have reported that by using an optimized cell configuration, BF4- anions was
successfully tracked during supercapacitors operation in real time by both potentiostatic
(Figure I-20a and b) and potentiodynamic measurement (Figure I-20c to f).
In the 19
F NMR spectra, the peak at around 156.5 ppm corresponds to anions strongly
adsorbed on the carbon surface in the micropores, whereas the intense peak observed between
148 and 150 ppm is assigned to weakly adsorbed anions which situate further from the
carbon surface in the larger pores or between carbon particles. The position and the intensity
of the peak of strongly adsorbed anions change with the charge stored the YP-50F activated
carbon electrode. NMR spectra collected during cyclic voltammetry (Figure I-20c-f)
qualitatively agree with those collected during chronoamperometry (Figure I-20a and b). In
addition, quantitative information could be extracted from the spectra by deconvolution of the
peaks. It has been found that when charging the electrode negatively, anions are expelled
from the electrode micropores constantly, whereas during positive charging, anion population
in the micropores keeps constant at low polarization and increases at higher polarization (cell
potential > 0.75 V). This indicates that at low level of positive polarization, the charge storage
is achieved by short-scale rearrangement or co-ion (cation) ejection. These results provide
important insights into the charge storage mechanisms. However, cations and acetonitrile
solvent molecules are not monitored in these reports. It is thus difficult to confirm that the
charge storage is achieved by ion exchange (ion swapping), counter-ion adsorption or co-ion
ejection, and also the role of solvent, leaving the charging pictures incomplete.

Chapter I: Bibliography
42
Figure I-20: 19
F NMR spectra collected at different potential step between 0 and 2 V (a, b) during cyclic voltammetry (c, d), and successive NMR spectra from four full cyclic voltammetric cycles (e, f). (a, c, e) are NMR spectra collected from positive electrode, and (b, d, f) from negative electrode
[183]
Chapter I: Bibliography
43
Infrared Spectroscopy (IR)
In-situ infrared spectroscopy technique, which is able to couple the chemical changes
with electrical inputs/outputs, has been developed very recently by Richey et al.[184-186]
The
in-situ IR study conducted with EMI-TFSI electrolyte in CDC microporous carbon[185]
showed that the peak intensity corresponding to both ions residing at the exterior surface (not
in the micropores) is found to decrease while polarizing the electrode, indicating that both
ions enter the pores when charge is stored in the electrode regardless of charging sign. The
authors attribute the observation to that ions are moving as aggregate into the pores owning to
the strong cation-anion interaction. In addition, same trend (both ions entering the pores
during charging) has been found in the measurements testing CDC electrode in EMI-TFSI
solvated in PC, whereas the entrance of PC molecules into the micropores is IL concentration
dependent. Further study using the same neat ionic liquid in nanoporous carbon nanofibers
(NCNFs) and KOH-activated NCNFs [186]
with improved cell configuration and calibration
method enabling quantitative data analysis provides interesting results (Figure I-21).
For the as-prepared NCNFs, anions drag cations together into the pores, resulting in both
ion concentrations observed outside of the pores of nanofibers decrease (Figure I-21a-c).
Larger amount of anion than cation is adsorbed in the pores when increasing polarization
(from Figure I-21a to c). On the other hand, the KOH-activated NCNFs showed a
significantly different behavior (Figure I-21d-f). The cations are expelled from the pores
while anions are adsorbed in the pores during positively charging of the electrode. The
difference between cation and anion affinity to the pores is attributed to the oxygen
functionalities introduced during KOH activation process. These results suggest different
charge storage mechanisms depending on the electrode pore structures and surface functional
groups: NCNFs seemed to be purely adsorptive while KOH-activated NCNFs involve ion
exchange. These results highlight the influence of surface chemistry and ionophilicity on
charge storage behaviors. However, these results are questionable, especially in the case of
NCNFs where both counter-ions and co-ions are adsorbed during charging. If the pores are
wetted before charging, the purely adsorptive mechanism will result in > 10 % expansion of
the pore volume, which is large and seems unfavorable from both mechanical and energy
point of view.

Chapter I: Bibliography
44
Figure I-21: In operando infrared spectroelectrochemical results: Initialized time-resolved concentration (concentration units g/g corresponds to g EMI‑TFSI/g electrode) of the EMI
cation and
TFSI anion in as-prepared NCNFs (a-c) and KOH-activated NCNFs (d-f) during three CV cycles
from (a, d) 0 to 1 V, (b, e) 0 to 1.5 V, and (c, f) 0 to 2 V.[186]
In-situ Dilatometry
In-situ dilatometry technique has been used to investigate the volume change of different
supercapacitor electrodes due to ion uptake during charging.[187-189]
Systematic study on the

Chapter I: Bibliography
45
effect of the pore size and exohedral electrode surface on the expansion behavior was directed
by Hantel et al.[190,191]
In-situ dilatometry measurements with CDCs in NEt4BF4/AN showed
that no matter the pore size (0.58 0.85 nm), the electrode expansion is no more than 3 %.
The degree of expansion is related to effective ion size. Larger swelling observed in
negatively charged electrode originates from the larger effective cation size.[190]
Electrochemical Quartz Crystal Microbalance (EQCM)
Aside from the aforementioned in-situ techniques, electrochemical quartz crystal
microbalance (EQCM), which measures the mass change arising from the compositional
changes in the porous electrode during charging/discharge, has recently been involved in
studying EDL adsorption/desorption mechanism and solvation situation by Aurbach’s
group.[192-194]
The heart of this thesis work is devoted into using EQCM to study the charging
process and the phenomena involved. The principle of EQCM and state-of-the-art of the
current EQCM study on capacitive charging will be described later in detail in chapter IV.
4.3 What do we know today about charging mechanism?
The breakthrough discovery of anomalous capacitance increase in confined micropores
[126] sparks a spate of research into fundamental charge storage mechanisms. To date, we know
that micropores are important for capacitive charging while mesopores are also essential for
fast ion transport. Ions are able to enter the pores smaller than their bulk solvated ion size by
removing or deforming part of their solvation, and this is the origin of the anomalous
capacitance increase. Molecular simulations and modellings provide different possible
scenarios that could exist at the electrode/electrolyte interface during charging:
overscreening[154]
, overcrowding[159]
, superionic state[168,169]
, ion insertion[152,171]
, ion
swapping[152,171]
, structural rearrangement[164,165,176,195]
, de-coordination for pure IL[152]
,
solvent screening and pore wetting before charging[152,169,171]
. From both theoretical and
empirical approaches, we know factors that may affect the EDL structures and the capacitance
contain: ion structure, ion size asymmetry, cation-anion interaction, ion-solvent interaction[130]
,
electrode surface roughness [196]
, electrode pore structures, and the surface chemistry. [186]
However, ion transport and dynamics have not been well addressed until now. How the
aforementioned factors affect the charging dynamics is critical for a better supercapacitor

Chapter I: Bibliography
46
design and thus clearly needs research attentions. This is also the reason why in-situ
techniques are of great importance and require further developments to unveil the whole
charging picture.
5. Objectives of the thesis
5.1 Study of carbon microstructure effect on capacitive storage
As mentioned previously, high performance supercapacitors require both micropores and
mesopores, and microstructure play an important role on both energy and power performance.
Therefore, the first part of the thesis will be dedicated into studying the effect of the carbon
micro-architecture on the supercapacitor performance. Results will be presented in chapter III.
5.2 In-situ EQCM study on ion dynamics and charging mechanisms in
confined carbon micropores
Regardless of the great efforts that have been put in the fundamental understanding from
both theoretical and empirical sides, there is still a clear lack of knowledge of the charge
storage mechanism and the ion transport dynamics in the confined space, thus hampering the
performance improvement and the future design of supercapacitors. Therefore, this thesis
work is devoted into using in-situ EQCM to study charging dynamics, adsorption mechanism,
and also solvent effect in aim to answer the remaining fundamental questions that are
unanswered by other in-situ techniques, also to verify the validities of the theories and models
proposed by theoreticians. Results will be presented in chapter IV.
Another problem that hinders the analysis of current double layer studies is that it is
difficult to compare the results derived from different techniques. Due to the intrinsic
limitation of each technique, it turns out that each in-situ technique investigates different
electrodes and electrolytes. For example, computational simulations are limited by existing
realistic porous electrode (CDCs) or electrolyte (coarse-grained BMI-PF6, EMI-TFSI) models,
otherwise new models need to be created and validated; NMR measurements are limited by
NMR active elements such as 11
B, 13
C, 19
F, etc. As highlighted by simulations and some
ex-situ empirical studies show that pore structure, cation-anion interaction, and ion-solvent
interaction will all contribute to the EDL structure and capacitance, comparing results using
different components in different techniques may be somehow misleading. Therefore, in
Chapter I: Bibliography
47
chapter V, in-situ NMR and in-situ EQCM are coupled to study the same electrode/electrolyte
system under the same electrochemical method to verify the results in different techniques.
The combination of two in-situ techniques incorporate the advantages of both techniques, and
is expected to provide a more complete scenario of the EDL charge storage.
6. Reference
[1] P. Simon, Y. Gogotsi, Nat. Mater. 2008, 7, 845.
[2] T. Christen, M. W. Carlen, J. Power Sources 2000, 91, 210.
[3] B. E. Conway, Electrochemical Supercapacitors: Scientific Fundamentals and Technological Applications, Springer, 1999.
[4] F. Beguin, E. Frackowiak, Eds. , Supercapacitors: Materials, Systems and Applications - Max Lu, Francois Beguin, Elzbieta Frackowiak, Wiley-VCH, 2013.
[5] H. von Helmholtz, Ann Phys Chem 1853, 89, 211.
[6] H. I. Becker, Low Voltage Electrolytic Capacitor, 1957, US2800616 A.
[7] “Where There Is Charge, There Can Be Sparks!,” can be found under http://www.sciencebuddies.org/science-fair-projects/project_ideas/Elec_p049.shtml, n.d.
[8] R. A. Rightmire, Electrical Energy Storage Apparatus, 1966, US3288641 A.
[9] D. L. Boos, Electrolytic Capacitor Having Carbon Paste Electrodes, 1970, US3536963 A.
[10] M. Endo, T. Takeda, Y. J. Kim, K. Koshiba, K. Ishii, Carbon Sci. 2001, 1, 117.
[11] “Supercapacitor Market by Materials & Products - 2020 | MarketsandMarkets,” can be found under http://www.marketsandmarkets.com/Market-Reports/supercapacitor-market-37140453.html
[12] “Electric Double Layer Capacitors ( Gold Capacitors ) | Industrial Devices & Solutions | Panasonic,” can be found under http://industrial.panasonic.com/ww/products/capacitors/edlc
[13] A. G. Pandolfo, A. F. Hollenkamp, J. Power Sources 2006, 157, 11.
[14] E. Frackowiak, Phys. Chem. Chem. Phys. 2007, 9, 1774.
[15] G. A. Snook, P. Kao, A. S. Best, J. Power Sources 2011, 196, 1.
[16] D. Cericola, R. Kötz, Electrochimica Acta 2012, 72, 1.
[17] G. Wang, L. Zhang, J. Zhang, Chem Soc Rev 2012, 41, 797.
[18] V. Augustyn, P. Simon, B. Dunn, Energy Environ. Sci. 2014, 7, 1597.
[19] K. Wang, H. Wu, Y. Meng, Z. Wei, Small 2014, 10, 14.
[20] H. von Helmholtz, Ann. Phys. 1879, 243, 337.
[21] L. G. Gouy, Compt Rend 1910, 149, 654.

Chapter I: Bibliography
48
[22] D. L. Chapman, Philos. Mag. Ser. 6 1913, 25, 475.
[23] O. Stern, Z. Elektrochem. Llnd Angew. Phys. Chem. 1924, 30, 508.
[24] J. R. Miller, P. Simon, Science 2008, 321, 651.
[25] “Maxwell Technologies Power Grid Solutions,” can be found under http://www.maxwell.com/solutions/power-grid/default.aspx
[26] “Maxwell Technologies Ultracapacitors Deployed in Ireland Microgrid Energy Storage System,” can be found under http://www.prnewswire.com/news-releases/maxwell-technologies-ultracapacitors-deployed-in-ireland-microgrid-energy-storage-system-300037291.html
[27] “Opening doors to space,” can be found under http://www.esa.int/Our_Activities/Telecommunications_Integrated_Applications/Opening_doors_to_space
[28] “Transportation Solutions,” can be found under http://www.maxwell.com/solutions/transportation
[29] “Nice: a fully electric bus with unlimited range,” can be found under http://www.investincotedazur.com/en/info/news/nice-a-fully-electric-bus-with-unlimited-range/
[30] X. Navarro, “Paris tests a new hybrid bus that uses ultracapacitors,” can be found under http://www.autoblog.com/2009/04/15/paris-tests-a-new-hybrid-bus-that-uses-ultracapacitors/, n.d.
[31] T. Hamilton, “Next Stop: Ultracapacitor Buses,” can be found under http://www.technologyreview.com/news/415773/next-stop-ultracapacitor-buses/, 2009.
[32] “Maxwell Technologies Wins ESNA Innovation Award for Philadelphia Electric Rail Project,” can be found under http://www.prnewswire.com/news-releases/maxwell-technologies-wins-esna-innovation-award-for-philadelphia-electric-rail-project-277873761.html
[33] “Toyota details its triple-motor, super capacitor-powered Yaris Hybrid-R - Images,” can be found under http://www.gizmag.com/toyota-details-yaris-hybrid-r/28827/pictures,
[34] “Guangzhou supercapacitor tram unveiled,” can be found under http://www.railwaygazette.com/news/urban/single-view/view/guangzhou-supercapacitor-tram-unveiled.html
[35] O. Barbieri, M. Hahn, A. Herzog, R. Kötz, Carbon 2005, 43, 1303.
[36] D. Lozano-Castelló, D. Cazorla-Amorós, A. Linares-Solano, S. Shiraishi, H. Kurihara, A. Oya, Carbon 2003, 41, 1765.
[37] E. Raymundo-Piñero, K. Kierzek, J. Machnikowski, F. Béguin, Carbon 2006, 44, 2498.
[38] B. Xu, F. Wu, Y. Su, G. Cao, S. Chen, Z. Zhou, Y. Yang, Electrochimica Acta 2008, 53, 7730.
[39] Y. Zhai, Y. Dou, D. Zhao, P. F. Fulvio, R. T. Mayes, S. Dai, Adv. Mater. 2011, 23, 4828.
[40] M. Sevilla, R. Mokaya, Energy Environ. Sci. 2014, 7, 1250.
[41] R. Dash, J. Chmiola, G. Yushin, Y. Gogotsi, G. Laudisio, J. Singer, J. Fischer, S. Kucheyev, Carbon 2006, 44, 2489.
[42] V. Presser, M. Heon, Y. Gogotsi, Adv. Funct. Mater. 2011, 21, 810.

Chapter I: Bibliography
49
[43] C. R. Pérez, S.-H. Yeon, J. Ségalini, V. Presser, P.-L. Taberna, P. Simon, Y. Gogotsi, Adv. Funct. Mater. 2013, 23, 1081.
[44] H. Wu, X. Wang, L. Jiang, C. Wu, Q. Zhao, X. Liu, B. Hu, L. Yi, J. Power Sources 2013, 226, 202.
[45] E. Tee, I. Tallo, H. Kurig, T. Thomberg, A. Jänes, E. Lust, Electrochimica Acta 2015, 161, 364.
[46] A. B. Fuertes, G. Lota, T. A. Centeno, E. Frackowiak, Electrochimica Acta 2005, 50, 2799.
[47] A. Kajdos, A. Kvit, F. Jones, J. Jagiello, G. Yushin, J. Am. Chem. Soc. 2010, 132, 3252.
[48] Y. Korenblit, A. Kajdos, W. C. West, M. C. Smart, E. J. Brandon, A. Kvit, J. Jagiello, G. Yushin, Adv. Funct. Mater. 2012, 22, 1655.
[49] C. Portet, G. Yushin, Y. Gogotsi, Carbon 2007, 45, 2511.
[50] Y. Gao, Y. S. Zhou, M. Qian, X. N. He, J. Redepenning, P. Goodman, H. M. Li, L. Jiang, Y. F. Lu, Carbon 2013, 51, 52.
[51] J. K. McDonough, Y. Gogotsi, Electrochem Soc Interface 2013, 22, 61.
[52] D. N. Futaba, K. Hata, T. Yamada, T. Hiraoka, Y. Hayamizu, Y. Kakudate, O. Tanaike, H. Hatori, M. Yumura, S. Iijima, Nat. Mater. 2006, 5, 987.
[53] S. Dörfler, I. Felhösi, T. Marek, S. Thieme, H. Althues, L. Nyikos, S. Kaskel, J. Power Sources 2013, 227, 218.
[54] M. Kaempgen, C. K. Chan, J. Ma, Y. Cui, G. Gruner, Nano Lett. 2009, 9, 1872.
[55] M. Noked, S. Okashy, T. Zimrin, D. Aurbach, Carbon 2013, 58, 134.
[56] M. F. De Volder, S. H. Tawfick, R. H. Baughman, A. J. Hart, Science 2013, 339, 535.
[57] C.-M. Yang, Y.-J. Kim, M. Endo, H. Kanoh, M. Yudasaka, S. Iijima, K. Kaneko, J. Am. Chem. Soc. 2007, 129, 20.
[58] H. J. Jung, Y.-J. Kim, J. H. Han, M. Yudasaka, S. Iijima, H. Kanoh, Y. A. Kim, K. Kaneko, C.-M. Yang, J. Phys. Chem. C 2013, 117, 25877.
[59] K. Hung, C. Masarapu, T. Ko, B. Wei, J. Power Sources 2009, 193, 944.
[60] C.-C. Hu, C.-C. Wang, J. Power Sources 2004, 125, 299.
[61] H. Y. Jin, Z. H. Peng, W. M. Tang, H. L. W. Chan, RSC Adv. 2014, 4, 33022.
[62] X. Li, X. Zang, Z. Li, X. Li, P. Li, P. Sun, X. Lee, R. Zhang, Z. Huang, K. Wang, D. Wu, F. Kang, H. Zhu, Adv. Funct. Mater. 2013, n/a.
[63] S. Shiraishi, H. Kurihara, L. Shi, T. Nakayama, A. Oya, J. Electrochem. Soc. 2002, 149, A855.
[64] V. T. Le, H. Kim, A. Ghosh, J. Kim, J. Chang, Q. A. Vu, D. T. Pham, J.-H. Lee, S.-W. Kim, Y. H. Lee, ACS Nano 2013, 7, 5940.
[65] S. Pan, H. Lin, J. Deng, P. Chen, X. Chen, Z. Yang, H. Peng, Adv. Energy Mater. 2015, 5, n/a.
[66] Y. Zhu, S. Murali, M. D. Stoller, K. J. Ganesh, W. Cai, P. J. Ferreira, A. Pirkle, R. M. Wallace, K. A. Cychosz, M. Thommes, D. Su, E. A. Stach, R. S. Ruoff, Science 2011, 332, 1537.

Chapter I: Bibliography
50
[67] M. F. El-Kady, V. Strong, S. Dubin, R. B. Kaner, Science 2012, 335, 1326.
[68] P. Tamilarasan, S. Ramaprabhu, J. Nanosci. Nanotechnol. 2015, 15, 1154.
[69] W. Li, H.-Y. Lü, X.-L. Wu, H. Guan, Y.-Y. Wang, F. Wan, G. Wang, L.-Q. Yan, H.-M. Xie, R.-S. Wang, RSC Adv 2015, 5, 12583.
[70] F. Bonaccorso, L. Colombo, G. Yu, M. Stoller, V. Tozzini, A. C. Ferrari, R. S. Ruoff, V. Pellegrini, Science 2015, 347, 1246501.
[71] P. Simon, Y. Gogotsi, Acc. Chem. Res. 2013, 46, 1094.
[72] Y. Gao, Y. S. Zhou, J. B. Park, H. Wang, X. N. He, H. F. Luo, L. Jiang, Y. F. Lu, Nanotechnology 2011, 22, 165604.
[73] D. Pech, M. Brunet, H. Durou, P. Huang, V. Mochalin, Y. Gogotsi, P.-L. Taberna, P. Simon, Nat. Nanotechnol. 2010, 5, 651.
[74] I. Alexandrou, H. Wang, N. Sano, G. A. J. Amaratunga, J. Chem. Phys. 2004, 120, 1055.
[75] C. Emmenegger, P. Mauron, P. Sudan, P. Wenger, V. Hermann, R. Gallay, A. Züttel, J. Power Sources 2003, 124, 321.
[76] H. Zhang, G. Cao, Y. Yang, Z. Gu, J. Electrochem. Soc. 2008, 155, K19.
[77] C.-C. Hu, K.-H. Chang, M.-C. Lin, Y.-T. Wu, Nano Lett. 2006, 6, 2690.
[78] L. Hu, M. Pasta, F. L. Mantia, L. Cui, S. Jeong, H. D. Deshazer, J. W. Choi, S. M. Han, Y. Cui, Nano Lett. 2010, 10, 708.
[79] C. Choi, S. H. Kim, H. J. Sim, J. A. Lee, A. Y. Choi, Y. T. Kim, X. Lepró, G. M. Spinks, R. H. Baughman, S. J. Kim, Sci. Rep. 2015, 5, 9387.
[80] K. S. Novoselov, A. K. Geim, S. V. Morozov, D. Jiang, Y. Zhang, S. V. Dubonos, I. V. Grigorieva, A. A. Firsov, Science 2004, 306, 666.
[81] L. L. Zhang, R. Zhou, X. S. Zhao, J. Mater. Chem. 2010, 20, 5983.
[82] Y. Huang, J. Liang, Y. Chen, Small 2012, 8, 1805.
[83] Y. Zhu, S. Murali, M. D. Stoller, A. Velamakanni, R. D. Piner, R. S. Ruoff, Carbon 2010, 48, 2118.
[84] C. Liu, Z. Yu, D. Neff, A. Zhamu, B. Z. Jang, Nano Lett. 2010, 10, 4863.
[85] “Graphene - What Is It?,” can be found under http://www.graphenea.com/pages/graphene, n.d.
[86] J. J. Wang, M. Y. Zhu, R. A. Outlaw, X. Zhao, D. M. Manos, B. C. Holloway, V. P. Mammana, Appl. Phys. Lett. 2004, 85, 1265.
[87] M. Zhu, J. Wang, B. C. Holloway, R. A. Outlaw, X. Zhao, K. Hou, V. Shutthanandan, D. M. Manos, Carbon 2007, 45, 2229.
[88] J. J. Yoo, K. Balakrishnan, J. Huang, V. Meunier, B. G. Sumpter, A. Srivastava, M. Conway, A. L. Mohana Reddy, J. Yu, R. Vajtai, P. M. Ajayan, Nano Lett. 2011, 11, 1423.
[89] M. Beidaghi, Y. Gogotsi, Energy Environ. Sci. 2014, 7, 867.
[90] S. J. An, Y. Zhu, S. H. Lee, M. D. Stoller, T. Emilsson, S. Park, A. Velamakanni, J. An, R. S. Ruoff, J. Phys. Chem. Lett. 2010, 1, 1259.
[91] L. T. Le, M. H. Ervin, H. Qiu, B. E. Fuchs, W. Y. Lee, Electrochem. Commun. 2011, 13,
Chapter I: Bibliography
51
355.
[92] Y. Korenblit, M. Rose, E. Kockrick, L. Borchardt, A. Kvit, S. Kaskel, G. Yushin, ACS Nano 2010, 4, 1337.
[93] D. A. Ersoy, M. J. McNallan, Y. Gogotsi, Mater. Res. Innov. 2001, 5, 55.
[94] L. Chen, G. Behlau, Y. Gogotsi, M. J. McNallan, in 27th Annu. Cocoa Beach Conf. Adv. Ceram. Compos. Ceram. Eng. Sci. Proc. (Eds.: W.M. Kriven, H.-T. Lin), John Wiley & Sons, Inc., 2003, pp. 57–62.
[95] W. Gu, G. Yushin, Wiley Interdiscip. Rev. Energy Environ. 2014, 3, 424.
[96] C. Matei Ghimbeu, L. Vidal, L. Delmotte, J.-M. Le Meins, C. Vix-Guterl, Green Chem. 2014, 16, 3079.
[97] A. Vu, X. Li, J. Phillips, A. Han, W. H. Smyrl, P. Bühlmann, A. Stein, Chem. Mater. 2013, 25, 4137.
[98] M. Karthik, E. Redondo, E. Goikolea, V. Roddatis, S. Doppiu, R. Mysyk, J. Phys. Chem. C 2014, 118, 27715.
[99] X. S. Zhao, F. Su, Q. Yan, W. Guo, X. Y. Bao, L. Lv, Z. Zhou, J. Mater. Chem. 2006, 16, 637.
[100] L. L. Zhang, X. S. Zhao, Chem. Soc. Rev. 2009, 38, 2520.
[101] F. Rodríguez-Reinoso, M. Molina-Sabio, M. T. González, Carbon 1995, 33, 15.
[102] G. San Miguel, G. D. Fowler, C. J. Sollars, Carbon 2003, 41, 1009.
[103] F.-C. Wu, R.-L. Tseng, C.-C. Hu, C.-C. Wang, J. Power Sources 2005, 144, 302.
[104] M. Ue, K. Ida, S. Mori, J. Electrochem. Soc. 1994, 141, 2989.
[105] T. Welton, Chem. Rev. 1999, 99, 2071.
[106] M. J. Earle, K. R. Seddon, Pure Appl. Chem. 2000, 72, 1391.
[107] M. Armand, F. Endres, D. R. MacFarlane, H. Ohno, B. Scrosati, Nat. Mater. 2009, 8, 621.
[108] D. R. MacFarlane, N. Tachikawa, M. Forsyth, J. M. Pringle, P. C. Howlett, G. D. Elliott, J. H. Davis, M. Watanabe, P. Simon, C. A. Angell, Energy Environ. Sci. 2013.
[109] R. Lin, P.-L. Taberna, S. Fantini, V. Presser, C. R. Pérez, F. Malbosc, N. L. Rupesinghe, K. B. K. Teo, Y. Gogotsi, P. Simon, J. Phys. Chem. Lett. 2011, 2, 2396.
[110] M. Galiński, A. Lewandowski, I. Stępniak, Electrochimica Acta 2006, 51, 5567.
[111] J. Gamby, P. L. Taberna, P. Simon, J. F. Fauvarque, M. Chesneau, J. Power Sources 2001, 101, 109.
[112] D. Qu, J. Power Sources 2002, 109, 403.
[113] Y. . Kim, Y. Horie, S. Ozaki, Y. Matsuzawa, H. Suezaki, C. Kim, N. Miyashita, M. Endo, Carbon 2004, 42, 1491.
[114] Y. Marcus, Ion Solvation, Wiley, 1985.
[115] P. Simon, Y. Gogotsi, Philos. Trans. R. Soc. Math. Phys. Eng. Sci. 2010, 368, 3457.
[116] J. A. Fernández, T. Morishita, M. Toyoda, M. Inagaki, F. Stoeckli, T. A. Centeno, J. Power Sources 2008, 175, 675.

Chapter I: Bibliography
52
[117] S. Á lvarez, M. C. Blanco-López, A. J. Miranda-Ordieres, A. B. Fuertes, T. A. Centeno, Carbon 2005, 43, 866.
[118] H. Zhou, S. Zhu, M. Hibino, I. Honma, J. Power Sources 2003, 122, 219.
[119] M. Sevilla, S. Á lvarez, T. A. Centeno, A. B. Fuertes, F. Stoeckli, Electrochimica Acta 2007, 52, 3207.
[120] W. Li, D. Chen, Z. Li, Y. Shi, Y. Wan, G. Wang, Z. Jiang, D. Zhao, Carbon 2007, 45, 1757.
[121] C. Vix-Guterl, E. Frackowiak, K. Jurewicz, M. Friebe, J. Parmentier, F. Béguin, Carbon 2005, 43, 1293.
[122] L. Eliad, G. Salitra, A. Soffer, D. Aurbach, Langmuir 2005, 21, 3198.
[123] L. Eliad, E. Pollak, N. Levy, G. Salitra, A. Soffer, D. Aurbach, Appl. Phys. A 2006, 82, 607.
[124] Y. Gogotsi, R. K. Dash, G. Yushin, T. Yildirim, G. Laudisio, J. E. Fischer, J. Am. Chem. Soc. 2005, 127, 16006.
[125] J. Chmiola, C. Largeot, P.-L. Taberna, P. Simon, Y. Gogotsi, Angew. Chem. Int. Ed. 2008, 47, 3392.
[126] J. Chmiola, G. Yushin, Y. Gogotsi, C. Portet, P. Simon, P. L. Taberna, Science 2006, 313, 1760.
[127] J. Leis, M. Arulepp, A. Kuura, M. Lätt, E. Lust, Carbon 2006, 44, 2122.
[128] Y.-J. Kim, Y. Masutzawa, S. Ozaki, M. Endo, M. S. Dresselhaus, J. Electrochem. Soc. 2004, 151, E199.
[129] C. Cachet-Vivier, V. Vivier, C. S. Cha, J.-Y. Nedelec, L. T. Yu, Electrochimica Acta 2001, 47, 181.
[130] R. Lin, P. L. Taberna, J. Chmiola, D. Guay, Y. Gogotsi, P. Simon, J. Electrochem. Soc. 2009, 156, A7.
[131] J. Segalini, B. Daffos, P. L. Taberna, Y. Gogotsi, P. Simon, Electrochimica Acta 2010, 55, 7489.
[132] R. Lin, P. Huang, J. Ségalini, C. Largeot, P. L. Taberna, J. Chmiola, Y. Gogotsi, P. Simon, Electrochimica Acta 2009, 54, 7025.
[133] J. Segalini, E. Iwama, P.-L. Taberna, Y. Gogotsi, P. Simon, Electrochem. Commun. 2012, 15, 63.
[134] G. Salitra, A. Soffer, L. Eliad, Y. Cohen, D. Aurbach, J. Electrochem. Soc. 2000, 147, 2486.
[135] R. Mysyk, E. Raymundo-Piñero, F. Béguin, Electrochem. Commun. 2009, 11, 554.
[136] G. Sun, W. Song, X. Liu, D. Long, W. Qiao, L. Ling, Electrochimica Acta 2011, 56, 9248.
[137] C. Largeot, C. Portet, J. Chmiola, P.-L. Taberna, Y. Gogotsi, P. Simon, J. Am. Chem. Soc. 2008, 130, 2730.
[138] J. Huang, B. G. Sumpter, V. Meunier, Chem. - Eur. J. 2008, 14, 6614.
[139] D.-W. Wang, F. Li, M. Liu, G. Q. Lu, H.-M. Cheng, Angew. Chem. Int. Ed. 2008, 47, 373.
Chapter I: Bibliography
53
[140] D.-D. Zhou, Y.-J. Du, Y.-F. Song, Y.-G. Wang, C.-X. Wang, Y.-Y. Xia, J Mater Chem A 2013, 1, 1192.
[141] A. Stein, S. G. Rudisill, N. D. Petkovich, Chem. Mater. 2014, 26, 259.
[142] Q. Wang, J. Yan, Y. Wang, T. Wei, M. Zhang, X. Jing, Z. Fan, Carbon 2014, 67, 119.
[143] Y. Zhang, M. Ma, J. Yang, W. Huang, X. Dong, RSC Adv. 2014, 4, 8466.
[144] J. Dzubiella, J.-P. Hansen, J. Chem. Phys. 2005, 122, 234706.
[145] D. Boda, W. R. Fawcett, D. Henderson, S. Sokołowski, J. Chem. Phys. 2002, 116, 7170.
[146] C. N. Patra, S. K. Ghosh, J. Chem. Phys. 2002, 117, 8938.
[147] C. N. Patra, J. Phys. Chem. B 2010, 114, 10550.
[148] Y. Wang, W. Jiang, T. Yan, G. A. Voth, Acc. Chem. Res. 2007, 40, 1193.
[149] C. Merlet, M. Salanne, B. Rotenberg, J. Phys. Chem. C 2012, 116, 7687.
[150] L. Yang, B. H. Fishbine, A. Migliori, L. R. Pratt, J. Am. Chem. Soc. 2009, 131, 12373.
[151] Y. Shim, H. J. Kim, ACS Nano 2010, 4, 2345.
[152] C. Merlet, B. Rotenberg, P. A. Madden, P.-L. Taberna, P. Simon, Y. Gogotsi, M. Salanne, Nat. Mater. 2012, 11, 306.
[153] R. Burt, G. Birkett, X. S. Zhao, Phys. Chem. Chem. Phys. 2014, 16, 6519.
[154] A. A. Kornyshev, J. Phys. Chem. B 2007, 111, 5545.
[155] Y. Levin, Rep. Prog. Phys. 2002, 65, 1577.
[156] M. Mezger, H. Schröder, H. Reichert, S. Schramm, J. S. Okasinski, S. Schöder, V. Honkimäki, M. Deutsch, B. M. Ocko, J. Ralston, M. Rohwerder, M. Stratmann, H. Dosch, Science 2008, 322, 424.
[157] B. Skinner, M. S. Loth, B. I. Shklovskii, Phys. Rev. Lett. 2010, 104, 128302.
[158] M. V. Fedorov, A. A. Kornyshev, Electrochimica Acta 2008, 53, 6835.
[159] M. Z. Bazant, B. D. Storey, A. A. Kornyshev, Phys. Rev. Lett. 2011, 106.
[160] S. K. Reed, O. J. Lanning, P. A. Madden, J. Chem. Phys. 2007, 126, 084704.
[161] M. V. Fedorov, A. A. Kornyshev, J. Phys. Chem. B 2008, 112, 11868.
[162] N. Georgi, A. A. Kornyshev, M. V. Fedorov, J. Electroanal. Chem. 2010, 649, 261.
[163] M. V. Fedorov, N. Georgi, A. A. Kornyshev, Electrochem. Commun. 2010, 12, 296.
[164] S. A. Kislenko, I. S. Samoylov, R. H. Amirov, Phys. Chem. Chem. Phys. 2009, 11, 5584.
[165] S. Wang, S. Li, Z. Cao, T. Yan, J. Phys. Chem. C 2010, 114, 990.
[166] S. Rivera-Rubero, S. Baldelli, J. Phys. Chem. B 2004, 108, 15133.
[167] C. Aliaga, S. Baldelli, J. Phys. Chem. B 2006, 110, 18481.
[168] S. Kondrat, A. Kornyshev, J. Phys. Condens. Matter 2011, 23, 022201.
[169] S. Kondrat, N. Georgi, M. V. Fedorov, A. A. Kornyshev, Phys. Chem. Chem. Phys. 2011, 13, 11359.
Chapter I: Bibliography
54
[170] J. C. Palmer, A. Llobet, S.-H. Yeon, J. E. Fischer, Y. Shi, Y. Gogotsi, K. E. Gubbins, Carbon 2010, 48, 1116.
[171] P. Wu, J. Huang, V. Meunier, B. G. Sumpter, R. Qiao, J. Phys. Chem. Lett. 2012, 3, 1732.
[172] G. Feng, J. Huang, B. G. Sumpter, V. Meunier, R. Qiao, Phys. Chem. Chem. Phys. 2010, 12, 5468.
[173] G. Feng, J. Huang, B. G. Sumpter, V. Meunier, R. Qiao, Phys. Chem. Chem. Phys. 2011, 13, 14723.
[174] G. Feng, R. Qiao, J. Huang, S. Dai, B. G. Sumpter, V. Meunier, Phys Chem Chem Phys 2011, 13, 1152.
[175] C. Merlet, C. Péan, B. Rotenberg, P. A. Madden, B. Daffos, P.-L. Taberna, P. Simon, M. Salanne, Nat. Commun. 2013, 4, DOI 10.1038/ncomms3701.
[176] A. Tanaka, T. Iiyama, T. Ohba, S. Ozeki, K. Urita, T. Fujimori, H. Kanoh, K. Kaneko, J. Am. Chem. Soc. 2010, 132, 2112.
[177] M. Fukano, T. Fujimori, J. Ségalini, E. Iwama, P.-L. Taberna, T. Iiyama, T. Ohba, H. Kanoh, Y. Gogotsi, P. Simon, K. Kaneko, J. Phys. Chem. C 2013, 117, 5752.
[178] S. Kondrat, A. Kornyshev, J. Phys. Chem. C 2013, 117, 12399.
[179] C. Péan, C. Merlet, B. Rotenberg, P. A. Madden, P.-L. Taberna, B. Daffos, M. Salanne, P. Simon, ACS Nano 2014, 8, 1576.
[180] M. Deschamps, E. Gilbert, P. Azais, E. Raymundo-Piñero, M. R. Ammar, P. Simon, D. Massiot, F. Béguin, Nat. Mater. 2013, 12, 351.
[181] J. W. Hennel, J. Klinowski, in New Tech. Solid-State NMR (Ed.: J. Klinowski), Springer Berlin Heidelberg, 2005, pp. 1–14.
[182] H. Wang, T. K.-J. Köster, N. M. Trease, J. Ségalini, P.-L. Taberna, P. Simon, Y. Gogotsi, C. P. Grey, J. Am. Chem. Soc. 2011, 133, 19270.
[183] H. Wang, A. C. Forse, J. M. Griffin, N. M. Trease, L. Trognko, P.-L. Taberna, P. Simon, C. P. Grey, J. Am. Chem. Soc. 2013, 135, 18968.
[184] F. W. Richey, Y. A. Elabd, J. Phys. Chem. Lett. 2012, 3, 3297.
[185] F. W. Richey, B. Dyatkin, Y. Gogotsi, Y. A. Elabd, J. Am. Chem. Soc. 2013, 135, 12818.
[186] F. W. Richey, C. Tran, V. Kalra, Y. A. Elabd, J. Phys. Chem. C 2014, 118, 21846.
[187] M. Hahn, O. Barbieri, F. P. Campana, R. Kötz, R. Gallay, Appl. Phys. A 2006, 82, 633.
[188] M. Hahn, O. Barbieri, R. Gallay, R. Kötz, Carbon 2006, 44, 2523.
[189] B. H. Ka, S. M. Oh, J. Electrochem. Soc. 2008, 155, A685.
[190] M. M. Hantel, V. Presser, R. Kötz, Y. Gogotsi, Electrochem. Commun. 2011, 13, 1221.
[191] M. M. Hantel, R. Nesper, A. Wokaun, R. Kötz, Electrochimica Acta 2014, 134, 459.
[192] M. D. Levi, G. Salitra, N. Levy, D. Aurbach, J. Maier, Nat. Mater. 2009, 8, 872.
[193] M. D. Levi, N. Levy, S. Sigalov, G. Salitra, D. Aurbach, J. Maier, J. Am. Chem. Soc. 2010, 132, 13220.
[194] S. Sigalov, M. D. Levi, G. Salitra, D. Aurbach, J. Maier, Electrochem. Commun. 2010, 12, 1718.

Chapter I: Bibliography
55
[195] C. Pinilla, M. G. Del Pópolo, J. Kohanoff, R. M. Lynden-Bell, J. Phys. Chem. B 2007, 111, 4877.
[196] L. Xing, J. Vatamanu, G. D. Smith, D. Bedrov, J. Phys. Chem. Lett. 2012, 3, 1124.

Chapter I: Bibliography
56

Chapter II: Materials Studied and
Experimental set-ups


Chapter II: Materials Studied and Experimental Set-ups
57
1. Introduction
This chapter is aim to describe the different commercially-available active materials and
electrolytes tested in the thesis work, and different electrochemical methods and cell
configurations used to characterize the materials of supercapacitors. The experimentals of the
materials synthesized in the lab will be described later in the result chapters, and EQCM
principle and set-up will introduced in chapter IV.
2. Commercial Activated Carbons
Two commercial activated carbons were used in this work: YP-17 and YP-50F.
Both are derived from coconut shell and bought from Kuraray Chemical Co., Japan. Their
characteristics will be discussed in this section. Other carbons used in this work which are
synthesized in the labs will be discussed individually in each section later. All the porosity
characteristics of the as-received commercial carbons are characterized from Ar sorption
isotherm measured at 77 K with Micromeritics ASAP 2020 porosimetry analyser, and the pore
size distributions (PSD) were calculated from the isotherm by using Quenched Solid Density
Functional Theory (QSDFT) method [1]
assuming a slit pore geometry.
YP-50F
The porosity characteristics of the YP-50F carbon were obtained from Ar sorption
isotherm measured at 77 K (Figure II-1a), and the specific surface area estimated by using
Brunauer-Emmett-Teller (BET) method [2][3]
is 1732 m2/g. The pore size distributions (PSD)
calculated from the isotherm by using QSDFT method is shown in Figure II-1b. The calculated
average pore size is 0.9 nm, and the total pore volume is 0.75 cm3/g with 92 % of the pores
smaller than 2 nm (micropores). Other characteristics provided by the supplier are also shown
in Table II-1 [4]
.

Chapter II: Materials Studied and Experimental Set-ups
58
Figure II-1: Porosity Characteristics of the as-received YP-50F carbon: (a) Ar sorption isotherm collected at 77K and (b) pore size distribution calculated from QSDFT model.
Table II-1: Characteristics of YP-50F activated carbon
YP-17
The porosity characteristics of the as-received YP-17 carbon were obtained from Ar
sorption isotherm at 77 K (Figure II-2a). The PSD were calculated from the isotherm by using
QSDFT is shown in Figure II-2b. The calculated average pore size is 1 nm and the BET SSA
was estimated to be is 1602 m2/g.
Surface area (m2/g) 1500 - 1800
pH 7-10
Particle size (µm) 5-20
Ash content (wt%) 1 max
Moisture content (wt%) 3 max

Chapter II: Materials Studied and Experimental Set-ups
59
Figure II-2: Porosity Characteristics of the as-received YP-17 carbon: (a) Ar sorption isotherm and (b) pore size distribution calculated from QSDFT model
Other characteristics provided by the supplier are listed in Table II-2. It was also
mentioned that for pores which are smaller than 3 nm, 40 vol % of which are less than 1 nm,
55 vol % are between 1 to 1.5 nm, and the remaining 5 vol % have the pore size larger than
1.5 nm.
Table II-2: Characteristics of YP-17 activated carbon
BET Surface (m2/g) 1709
Microporous volume (cm3/g), < 2 nm 0.690
Mesoporous volume (cm3/g), 2 – 5 nm 0.038
Mesoporous volume (cm3/g), 2 – 50 nm 0.080
Macroporous volume (cm3/g), > 50 nm 0.108
Total volume (cm3/g) 0.877
Ash content (%) 0.3
pH 5.7

Chapter II: Materials Studied and Experimental Set-ups
60
3. Electrolytes
Different organic and ionic liquid-based solutions were used as electrolytes:
tetraethylammonium tetrafluoroborate (NEt4BF4, CAS #429-06-1) and tetraethylphosphonium
tetrafluoroborate (PEt4BF4, CAS #665-49-6) salts were purchased from Acros Organics and
Tokyo Chemical Industries, respectively. Ionic liquids 1-ethyl-3-methylimidazolium
bis(trifluoromethanesulfonyl)imide (EMI-TFSI, CAS #174899-82-2), 1-Butyl-3-
methylimidazolium hexafluorophosphate (BMI-PF6, CAS #174501-64-5), N-butyl-N-
methylpyrrolidinium, bis(fluorosulfonyl)imide (PYR14-FSI, CAS #1057745-51-3), and
N-methyl-N-propylpiperidinium bis(fluorosulfonyl)imide (PIP13-FSI) were bought or obtained
from Solvionic. The acetonitrile (AN) (CAS #75-05-8, H2O < 10 ppm) solvent was also
obtained from Acros Organics. Table II-3, Table II-4, and Table II-5 present respectively the
cations, anions and solvent molecules and their structures (drawn by using ChemSketch
Freeware V.14.01). As an important part of this thesis work is to study the relationship
between the ion size and pore size, the size of the molecules found in the literatures are also
given in the tables. The detailed information of each electrolyte regarding applied voltage,
viscosity, etc. will be further discussed individually in each part of results.

Chapter II: Materials Studied and Experimental Set-ups
61
Table II-3: Structure and size of the cations studied in this work
Cations Structure Size max/min
length (nm)
NEt4+
tetraethylammonium
0.85/0.75[5]
PEt4+
tetraethylphosphonium
---/0.72[6]
EMI+
1-ethyl-3-methylimidazolium
0.76
[7]/---
Side view
BMI+
1-Butyl-3-methylimidazolium
---
Side view

Chapter II: Materials Studied and Experimental Set-ups
62
PYR14+
N-butyl-N-methylpyrrolidinium
--- Side view
PIP13+
N-methyl-N-propylpiperidinium
--- Side view
Table II-4: Structure and size of the anions studied in this work
Anions Structure Size max/min
length (nm)
BF4-
tetrafluoroborate
0.51/0.50[5]
PF6-
hexafluorophosphate
0.54/ ---

Chapter II: Materials Studied and Experimental Set-ups
63
TFSI-
bis(trifluoromethylsulfonyl)imide
0.79[7]
/0.37[5]
FSI-
bis(fluorosulfonyl)imide
---
Table II-5: Structure and size of the solvent molecule studied in this work
Solvent Structure Size max/min
length (nm)
AN
Acetonitrile
0.58/0.40[5]
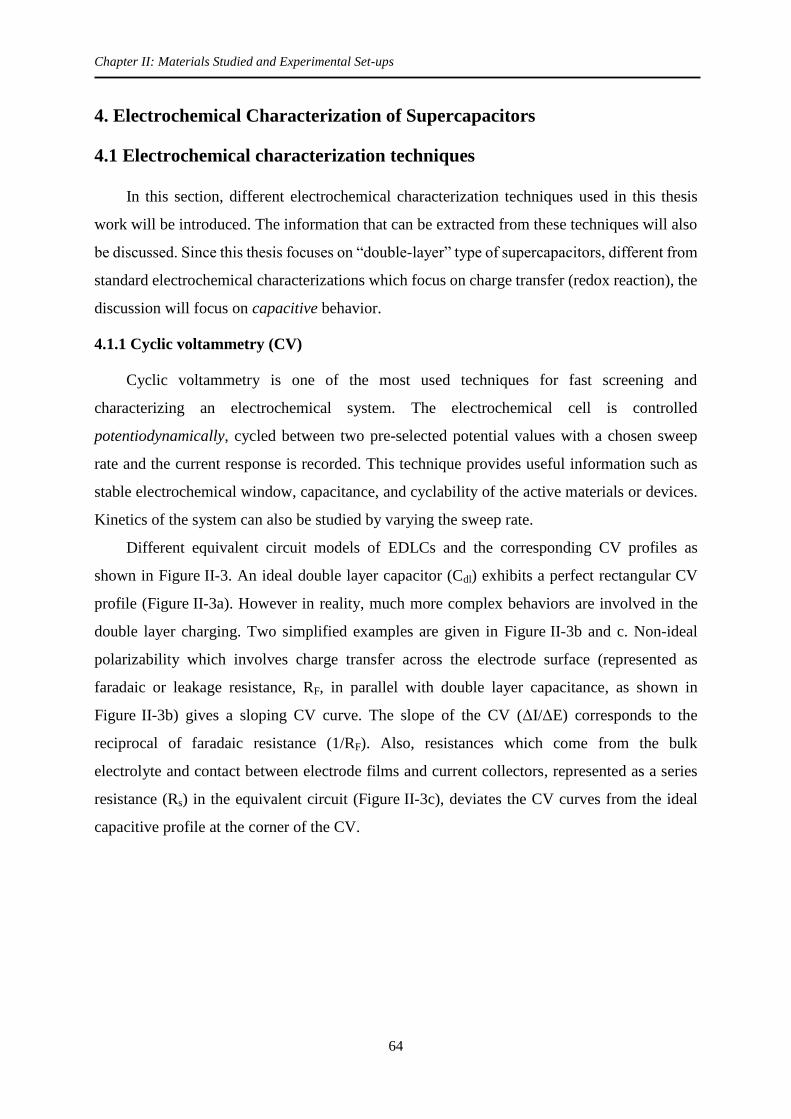
Chapter II: Materials Studied and Experimental Set-ups
64
4. Electrochemical Characterization of Supercapacitors
4.1 Electrochemical characterization techniques
In this section, different electrochemical characterization techniques used in this thesis
work will be introduced. The information that can be extracted from these techniques will also
be discussed. Since this thesis focuses on “double-layer” type of supercapacitors, different from
standard electrochemical characterizations which focus on charge transfer (redox reaction), the
discussion will focus on capacitive behavior.
4.1.1 Cyclic voltammetry (CV)
Cyclic voltammetry is one of the most used techniques for fast screening and
characterizing an electrochemical system. The electrochemical cell is controlled
potentiodynamically, cycled between two pre-selected potential values with a chosen sweep
rate and the current response is recorded. This technique provides useful information such as
stable electrochemical window, capacitance, and cyclability of the active materials or devices.
Kinetics of the system can also be studied by varying the sweep rate.
Different equivalent circuit models of EDLCs and the corresponding CV profiles as
shown in Figure II-3. An ideal double layer capacitor (Cdl) exhibits a perfect rectangular CV
profile (Figure II-3a). However in reality, much more complex behaviors are involved in the
double layer charging. Two simplified examples are given in Figure II-3b and c. Non-ideal
polarizability which involves charge transfer across the electrode surface (represented as
faradaic or leakage resistance, RF, in parallel with double layer capacitance, as shown in
Figure II-3b) gives a sloping CV curve. The slope of the CV (ΔI/ΔE) corresponds to the
reciprocal of faradaic resistance (1/RF). Also, resistances which come from the bulk
electrolyte and contact between electrode films and current collectors, represented as a series
resistance (Rs) in the equivalent circuit (Figure II-3c), deviates the CV curves from the ideal
capacitive profile at the corner of the CV.
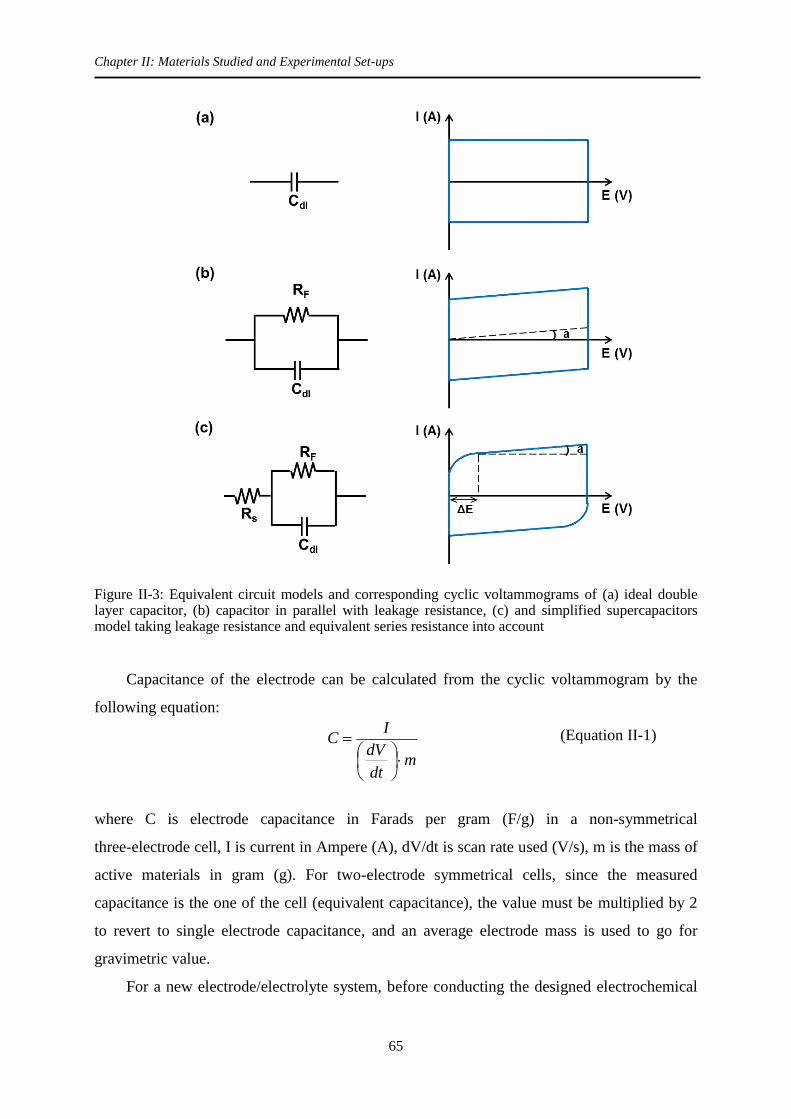
Chapter II: Materials Studied and Experimental Set-ups
65
Figure II-3: Equivalent circuit models and corresponding cyclic voltammograms of (a) ideal double layer capacitor, (b) capacitor in parallel with leakage resistance, (c) and simplified supercapacitors model taking leakage resistance and equivalent series resistance into account
Capacitance of the electrode can be calculated from the cyclic voltammogram by the
following equation:
(Equation II-1)
where C is electrode capacitance in Farads per gram (F/g) in a non-symmetrical
three-electrode cell, I is current in Ampere (A), dV/dt is scan rate used (V/s), m is the mass of
active materials in gram (g). For two-electrode symmetrical cells, since the measured
capacitance is the one of the cell (equivalent capacitance), the value must be multiplied by 2
to revert to single electrode capacitance, and an average electrode mass is used to go for
gravimetric value.
For a new electrode/electrolyte system, before conducting the designed electrochemical
mdt
dV
IC

Chapter II: Materials Studied and Experimental Set-ups
66
measurements and collecting data, the electrochemical window of the system was first
screened using cyclic voltammetry at low scan rate (e.g. 5 mV/s).
4.1.2 Chronoamperometry
The electrochemical behavior can also be studied potentiostatically by applying
chronoamperometry: a sequence of potential steps are applied to the electrode, and the current
transient response is recorded in each potential step. When applying a potential step to the
electrode, a current transient is generated within a short time in response to the voltage pulse
(Figure II-4). Since ΔQ = C・ΔV, during the hold of the potential step (ΔV = 0), the current
transient becomes zero (ΔQ = 0 = I・t) after a certain period of time for a pure capacitive
behavior (Figure II-4a). The total charge (ΔQ) flows in the electrode can be calculated
through integration of current over time, and the capacitance (C) can be also obtained by
dividing charge over voltage change (ΔV = V2 - V1). If the measured system presents high
leakage/faradaic current (IF) due to electrolyte decomposition or other redox reactions at the
electrode surface, the residual current will not be zero and is contributed from faradaic
phenomena. For EDLC investigation, faradaic/leakage charge (QF) is unwanted, and should
be separated from the charge stored at the supercapacitor double layer (Qdl) (Figure II-4b).
Figure II-4: simple equivalent circuit of a supercapacitor and the current transient of the electrode in response to a potential pulse from V1 to V2: (a) without and (b) with leakage current in the system
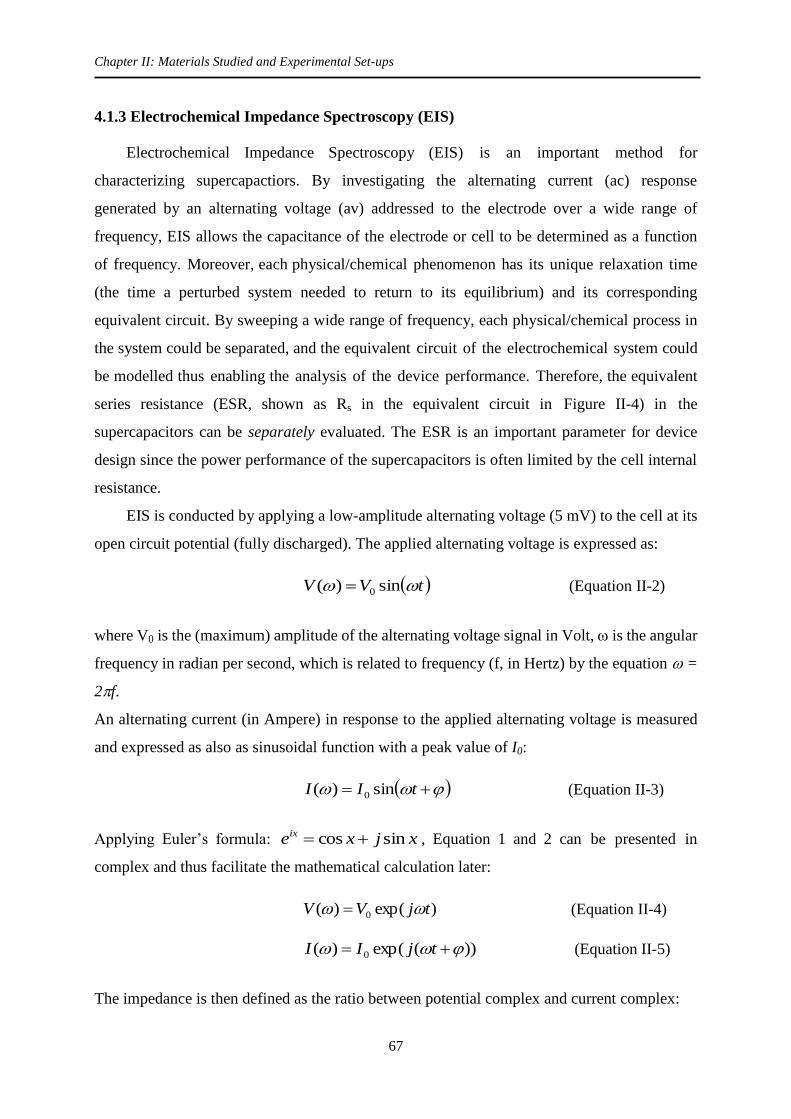
Chapter II: Materials Studied and Experimental Set-ups
67
4.1.3 Electrochemical Impedance Spectroscopy (EIS)
Electrochemical Impedance Spectroscopy (EIS) is an important method for
characterizing supercapactiors. By investigating the alternating current (ac) response
generated by an alternating voltage (av) addressed to the electrode over a wide range of
frequency, EIS allows the capacitance of the electrode or cell to be determined as a function
of frequency. Moreover, each physical/chemical phenomenon has its unique relaxation time
(the time a perturbed system needed to return to its equilibrium) and its corresponding
equivalent circuit. By sweeping a wide range of frequency, each physical/chemical process in
the system could be separated, and the equivalent circuit of the electrochemical system could
be modelled thus enabling the analysis of the device performance. Therefore, the equivalent
series resistance (ESR, shown as Rs in the equivalent circuit in Figure II-4) in the
supercapacitors can be separately evaluated. The ESR is an important parameter for device
design since the power performance of the supercapacitors is often limited by the cell internal
resistance.
EIS is conducted by applying a low-amplitude alternating voltage (5 mV) to the cell at its
open circuit potential (fully discharged). The applied alternating voltage is expressed as:
tVV sin)( 0 (Equation II-2)
where V0 is the (maximum) amplitude of the alternating voltage signal in Volt, is the angular
frequency in radian per second, which is related to frequency (f, in Hertz) by the equation =
2f.
An alternating current (in Ampere) in response to the applied alternating voltage is measured
and expressed as also as sinusoidal function with a peak value of I0:
tII sin)( 0 (Equation II-3)
Applying Euler’s formula: xjxeix sincos , Equation 1 and 2 can be presented in
complex and thus facilitate the mathematical calculation later:
)exp()( 0 tjVV (Equation II-4)
))(exp()( 0 tjII (Equation II-5)
The impedance is then defined as the ratio between potential complex and current complex:

Chapter II: Materials Studied and Experimental Set-ups
68
)exp()(0
0 jI
VZ (Equation II-6)
The complex impedance can also be represented as:
"')exp()( jZZjZZ (Equation II-7)
With the impedance modulus defined as
22
0
0 "')( ZZI
VZ (Equation II-8)
where Z’ and Z” are the real and imaginary parts of the complex impedance, respectively. The
impedance of three commonly used ideal electrical elements capacitors (Zc), ohmic resistors
(ZR) and inductors (ZL) are described by equation II-9, 10, and 11, respectively.
CjZc
1 (Equation II-9)
RZR (Equation II-10)
LjZL (Equation II-11)
Where C, R and L are capacitance, resistance and inductance, respectively.
Nyquist plot (Z” versus Z’) is commonly used for EIS study. Figure II-5 shows the
Nyquist plots corresponding to two simple equivalent circuit models mentioned in Figure II-3.
Figure II-5: Equivalent circuit and its corresponding Nyquist plot of (a) an ideal double-layer capacitor (Cdl), and (b) a more complex model also considering leakage resistance (RF) and equivalent series resistance (Rs)
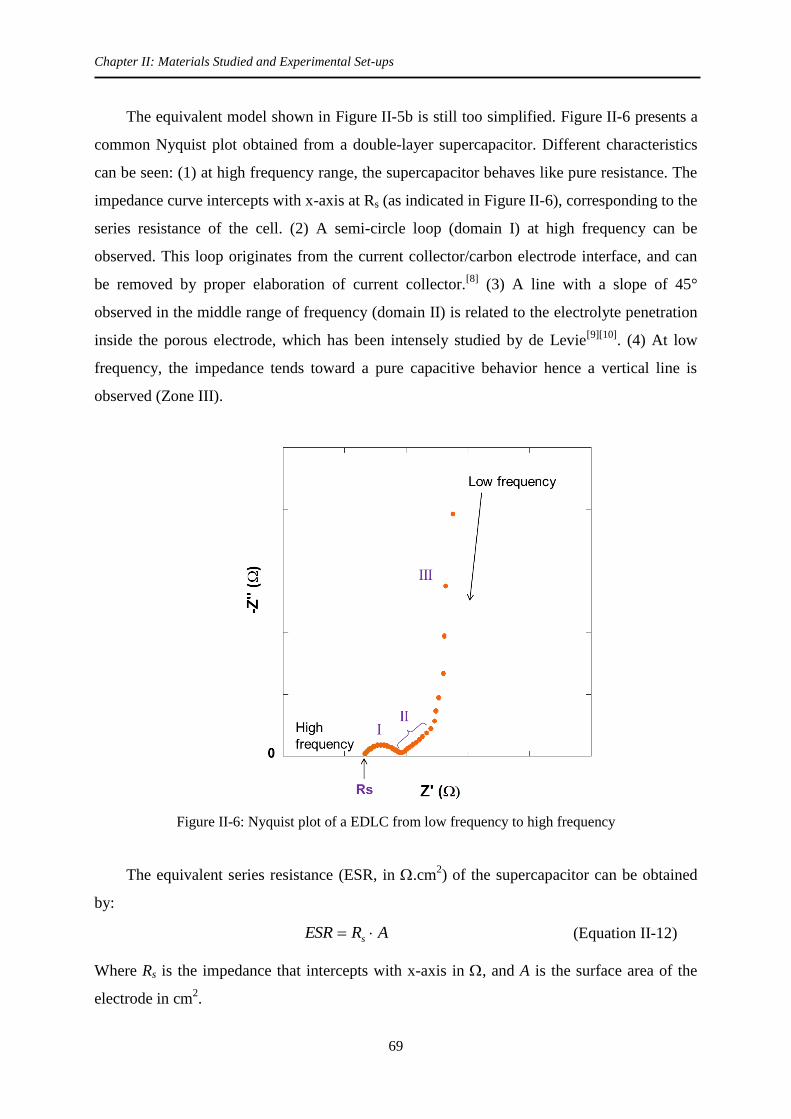
Chapter II: Materials Studied and Experimental Set-ups
69
The equivalent model shown in Figure II-5b is still too simplified. Figure II-6 presents a
common Nyquist plot obtained from a double-layer supercapacitor. Different characteristics
can be seen: (1) at high frequency range, the supercapacitor behaves like pure resistance. The
impedance curve intercepts with x-axis at Rs (as indicated in Figure II-6), corresponding to the
series resistance of the cell. (2) A semi-circle loop (domain I) at high frequency can be
observed. This loop originates from the current collector/carbon electrode interface, and can
be removed by proper elaboration of current collector.[8]
(3) A line with a slope of 45°
observed in the middle range of frequency (domain II) is related to the electrolyte penetration
inside the porous electrode, which has been intensely studied by de Levie[9][10]
. (4) At low
frequency, the impedance tends toward a pure capacitive behavior hence a vertical line is
observed (Zone III).
Figure II-6: Nyquist plot of a EDLC from low frequency to high frequency
The equivalent series resistance (ESR, in .cm2) of the supercapacitor can be obtained
by:
ARESR s (Equation II-12)
Where Rs is the impedance that intercepts with x-axis in , and A is the surface area of the
electrode in cm2.

Chapter II: Materials Studied and Experimental Set-ups
70
Porous electrode: Transmission Line Model from De Levie
As one can easily imagine that for a porous carbon electrode, the time needed for inner
surface to be charged is longer than that for outer surface since ions need to penetrate the pore.
This non-uniform charging rate on the available electrode surface is revealed on the
impedance, giving rise to the characteristic curve with slope of 45° in the medium frequency
range (Figure II-6, zone II). This behavior of species mass transport in a pore has been
investigated in detail by de Levie [9][10]
using the transmission line model as shown in Figure
II-7. Therefore, this sloping region in the Nyquist plot gives information on the ionic
resistance during penetration in the pore, which is highly related to the pore geometry.
Figure II-7: Equivalent circuit in a pore suggested by de Levie [10]
.
4.2 Set-ups
Two different cell configurations were used for studying electrochemical double layer.
After cell assembly, the electrochemical measurements of these cells were conducted using a
VMP3 potentiostat/galvanostat (Biologic, France).
4.2.1 Swagelok® Cells
The two-electrode or three-electrode Swagelok® stainless steel cell[11]
, illustrated in

Chapter II: Materials Studied and Experimental Set-ups
71
Figure II-8a, was assembled in a glove box under argon atmosphere of less than 1 ppm of
oxygen and water content. The electrode films were laminated onto treated aluminum current
collectors (Al CC), and two layers of 25μm-thick porous cellulose or other type of porous
polymeric papers were used as separator. The stack (CC / electrode / separator / electrode / CC)
was hold firmly between two stainless steel pistons. In the case of three-electrode Swagelok® , a
silver wire (2 mm in diameter) was used as a quasi-reference electrode (Figure II-8b). For
experiments conducting under various temperatures, a slight pressure was added on both sides
of the pistons to ensure the contact between stacks will not be affected by thermal expansion
of the cell.
Figure II-8: Schemes of two-electrode (a) and three-electrode (b) Swagelok® cell
Current collectors
Aluminum current collectors were pre-treated in the following steps to improve the
contact with the electrode film hence decrease the interface impedance: First, the aluminium
foils were laminated to thickness of about 250 μm, and immersed into 1M NaOH solution for
20 minutes at room temperature to remove the grease and native oxide on the Al surface. Then,
the aluminum foils were rinsed with distilled water and placed into 80oC 1M HCl solution for 2
minutes in order to etch and create roughness on the Al surface. After etching, the Al current
collectors were rinsed again by distilled water and blown dry.
To enhance the conductivity, the etched current collectors were then dip-coated at a
withdrawal rate of 35cm/min. in a slurry consisting of a few percent of acetylene black powder
suspended in a polymeric sol.[8]
Lastly, the collectors were subjected to a thermal treatment at
470oC in air for 4 hours to remove the polymeric sol. After thermal treatment, the Al current

Chapter II: Materials Studied and Experimental Set-ups
72
collector surface was covered by the conducting acetylene black particles. The current
collectors were then punched into the sizes corresponding to the sizes of the Swagelok.
Electrode films
The electrode films were prepared by mixing 95 wt.% active materials (CDCs,
commercial activated carbons) with 5 wt.% of polytetrafluoroethylene binder (PTFE; 60 wt.%
dispersion in water) in ethanol. The slurry was uniformly stirred on a watch glass until it formed
a paste-like material, and then rolled into film using a glass tube and cut into circles. For a film
with a carbon loading of 15 mg/cm2, the thickness of the films ranged from 250 to 300 µm
depending on the type of carbons.
Separators
Separator is used to prevent short circuit between two electrodes while allowing the
transport of electrolyte ions during operation. There exist several types of separators and main
requirements for separators in supercapacitors are listed as follow: (1) They need to be
chemical and electrochemical stable in the system; (2) They should provide as low cell
resistance as possible to avoid changing the cell performance, which means thin, high porosity
and permeability allowing the electrolyte to penetrate; (3) They should be mechanically strong
enough to withstand the pressure applied during cell assembly. In this set-up, two layer of 25
µm-thick porous cellulose (provided by Batscap) or Al2O3 (Separion® , average pore size of
240 nm, > 40 % porosity, Evonik Industries, Germany) were used as separators. Al2O3
separators were used for low temperature test.
4.2.2 Cavity Micro-Electrode (CME)
Cavity micro-electrode (CME) is a technique that allows investigating electrochemical
kinetics of processes occurring at powder material electrode. The CME used in this work is
provided by the French network “CNRS Microéléctrode à cavité”. It consists of a thin platinum
wire (60-150 µm in diameter) sealed in a glass tube as shown in Figure II-9a. The cavity was
obtained either by laser ablation or controlled dissolution of the Pt-wire in a highly
concentrated hot aqua regia solution (which was described in detail by Cachet-Vivier et al.[12]
)
The platinum wire was connected to a copper rod current collector. The electrical contact
between the Pt wire and the copper rod was reinforced by carbon graphite powder. The

Chapter II: Materials Studied and Experimental Set-ups
73
diameter of the cavity is in between 20 and 150 µm, and the height-diameter (h/d) ratio, as
indicated in Figure II-9a, was controlled between 0.4 and 1. If the h/d ratio was larger than 1,
then establishing the contact between the platinum and the powder grains was difficult; if it was
less than 0.4, the grains packed inside the cavity could escape easily during the tests.[12]
Figure II-9: Scheme of cavity micro-electrode (CME) (a) and CME electrochemical cell assembly and configuration (rolled-Pt as counter electrode and silver wire as reference) (b)
The electrochemical cell was assembled under glove box condition (oxygen and water
content < 1 ppm) as follow (Figure II-9b): the powder was packed inside the cavity by simple
pressing CME on the powder grains onto a glass substrate. The powder-packed CME was then
used as the working electrode, and a laminated silver wire and a rolled platinum foil (with area
of 1 cm2) were used as reference and counter electrode, respectively.
Since the powder was hold physically inside the cavity by simple packing, the powder
could detach from the cavity by shaking the cell, gas formation or volume change during
electrochemical test. Therefore, all the CME tests were repeated at least twice, and the
open-circuit voltage (OCV) was tracked between tests for the same sample to verify the
reproducibility. Between different tests, the CME was cleaned by sonication in ethanol.
Cavity micro-electrode provides several advantages compared to conventional EDLC
set-up (such as the 2cm x 2cm electrode EDLC[8]
): First, it allows the study of
electrochemical behavior at the active materials / electrolyte interface without influence of
binders, separators, current collectors or other components in the conventional set-ups. Only

Chapter II: Materials Studied and Experimental Set-ups
74
few micrograms of materials are needed, and the small size of electrochemical interface
between the electrode grains and the electrolyte reduced hugely the ohmic drop, thus it allows
recording voltammograms over a wide scan rate range between a few tens microvolts to several
tens or even hundreds of volts per second, therefore makes CME a powerful technique to study
electrochemical kinetics. Furthermore, the cell preparation and assembly are simple and fast, so
it could be used for fast screening different materials. However, as the amount of material
packed in the cavity is different between different experiments and the weight of material
packed inside is too few to be measured, therefore CME cannot obtain quantitative information,
e.g. specific capacitance (Farad per gram). Comparison between different CME experiments
requires normalization with respect to a selected reference pint, thus only qualitative
information can be extracted. Figure II-10 shows an example of CVs collected using CME
technique [13]
: Figure II-10a presents the CME raw data before normalization and Figure II-10b
shows the comparison of CVs after normalization where all the current values in the CVs have
been normalized to the current value measured at 1 V/Ref.
Figure II-10: (a) CVs of CDC samples in AN + 1.5 M NEt4BF4 electrolyte between −1.3 and +1 V/Ref at a scan rate of 100 mV and (b) normalized CVs of the same samples
[13]

Chapter II: Materials Studied and Experimental Set-ups
75
5. Reference
[1] A. V. Neimark, Y. Lin, P. I. Ravikovitch, M. Thommes, Carbon 2009, 47, 1617. [2] S. Brunauer, P. H. Emmett, E. Teller, J. Am. Chem. Soc. 1938, 60, 309. [3] K. S. Sing, Adv. Colloid Interface Sci. 1998, 76, 3. [4] “Kuraray, YP50F Specifications,” can be found under
http://www.kuraraychemical.com/products/sc/SCcarbon.htm, n.d. [5] C. Decaux, C. Matei Ghimbeu, M. Dahbi, M. Anouti, D. Lemordant, F. Béguin, C.
Vix-Guterl, E. Raymundo-Piñero, J. Power Sources 2014, 263, 130. [6] K. Matsumoto, U. Harinaga, R. Tanaka, A. Koyama, R. Hagiwara, K. Tsunashima, Phys
Chem Chem Phys 2014, 16, 23616. [7] C. Largeot, C. Portet, J. Chmiola, P.-L. Taberna, Y. Gogotsi, P. Simon, J. Am. Chem. Soc.
2008, 130, 2730. [8] C. Portet, P. . Taberna, P. Simon, C. Laberty-Robert, Electrochimica Acta 2004, 49, 905. [9] R. de Levie, Electrochimica Acta 1963, 8, 751. [10] R. de Levie, Electrochimica Acta 1964, 9, 1231. [11] A. Blyr, C. Sigala, G. Amatucci, D. Guyomard, Y. Chabre, J.-M. Tarascon, J. Electrochem.
Soc. 1998, 145, 194. [12] C. Cachet-Vivier, V. Vivier, C. S. Cha, J.-Y. Nedelec, L. T. Yu, Electrochimica Acta 2001,
47, 181. [13] R. Lin, P. L. Taberna, J. Chmiola, D. Guay, Y. Gogotsi, P. Simon, J. Electrochem. Soc.
2009, 156, A7.

Chapter II: Materials Studied and Experimental Set-ups
76
Chapter III:
Study of carbon microstructure effect on
capacitive storage


Chapter III: Study of Carbon Microstructure Effect on Capacitive Storage
77
1. Introduction
As discussed in chapter I, it is important to adapt the electrode pore size to ion size but
at the same time take the ion transport into account, which, in other words, means a 3-D
interconnected porous structure containing both micro- and mesoporous material is needed as
electrode materials. On the other hand, supercapacitors not only attract attention for high
power applications, but also for application operated in wide temperature range (especially
under low temperature condition, where batteries suffer from bad performance). As a result, a
lot of efforts have been made for developing wide voltage electrolytes with large temperature
range.
Our group has recently reported a novel ionic liquid electrolyte composed of (1:1 by
weight or molar ratio) N-methyl-N-propylpiperidinium bis(fluorosulfonyl)imide (PIP13-FSI)
and N-butyl-N-methylpyrrolidinium bis(fluorosulfonyl)imide (PYR14-FSI).[1]
The liquid state
of this ionic liquid eutectic mixture is maintained several tens of degrees lower compared to the
individual constituting ILs. Most importantly, the wide electrochemical stability window is
preserved in the mixtures, which contributes to the goal of increasing energy density, as E = ½
CV2, where C is capacitance and V is voltage. This electrolyte mixture has been investigated in
our previous work with exohedral carbons such as onion-like carbon (OLC) or carbon
nanotubes (CNTs). Excellent capacitive behavior has been observed (Figure III-1)[1]
in an
Figure III-1: CVs at temperatures from 40 to 100°C for OLCs recorded at 100 and 1 mV/s (a); CVs at temperatures from 50 to 100 °C at 5 and 100 mV/s for CNTs (b)
[1]
Chapter III: Study of Carbon Microstructure Effect on Capacitive Storage
78
extended operating temperature range of 50 °C to 100 °C with high rate performance (60 %
of capacitance retention at 20 V/s for T ≥ 20 °C, and 75 % of capacitance retention at 20 mV/s
for T = 50 °C) thanks to the highly accessible open carbon structure.
This work gives important insights into improving the material design of supercapacitors
in different aspects. First, the selected two ionic liquids have the same electrochemically
stable anion (FSI), same molecular weight, and same number of atoms of the same nature, and
the only difference is their cation molecular structure, based on a five-member or six-member
heterocycle, respectively. The similarities of the ionic liquids give the mixture high
miscibility, and keep the chemical nature and interaction between cations and anions in the
mixture close to those of its constituents. The slight difference in their cation molecular
structure increases the disorder in the electrolyte hence inhibiting the formation of lattice and
decreasing dramatically the melting point of the mixture. Therefore, the resulting mixture
preserves the wide electrochemical window in a broad operating temperature range. This
provides an inspiring concept for producing new electrolytes with large potential window
(hence energy) in a wide temperature range by adapting the carbon structure to the electrolyte
viscosity. Second, the good capacitive behavior and high capacitance retention in these
systems at extreme temperature of 50 °C clearly lifted the long-hold restrictions of the use of
ionic liquid in energy storage applications above room temperature. However, the main
disadvantage of these exohedral carbons is their low specific surface area (500 m2/g) as
compared to other porous carbon materials (1000-2000 m2/g), leading to low specific
capacitance (~30 F/g; 4 mF/cm2). This highlights the importance of increasing specific surface
area (SSA), more precisely ion accessible surface area, in the electrode materials.
Conventional supercapacitor electrode materials such as nanoporous activated or
carbide-derived carbons that possess a high SSA and excellent performance in organic
electrolytes exhibit poor capacitive performance with IL electrolytes at room temperature or
below [1-3]
due to low ion mobility in the porous networks. Pore structure that contains both
micropore and mesopores (usually 28 m) may enhance the ion transport kinetics in the
materials. The aim of this chapter is to build high performance supercapacitors that allow
operation under wide temperature range. (PIP13FSI)0.5(PYR14FSI)0.5 ionic liquid mixture was
chosen in this study owning to its wide temperature range of liquid state. Carbons with
different microstructures thus ion accessibility were investigated in order to optimize the
carbon/electrolyte interface and to increase the magnitude and quality of charge storage,
thereby further improving the energy density in an extended operating temperature range.

Chapter III: Study of Carbon Microstructure Effect on Capacitive Storage
79
2. Characteristics of ionic liquid-mixture ((PIP13FSI)0.5(PYR14FSI)0.5)
Ionic liquids PIP13FSI and PYR14FSI were purchased from Solvionic, and the mixture
was obtained by simply mixing same weight of PIP13FSI and PYR14FSI in the glove box. The
characteristics of PIP13FSI, PYR14FSI and their 1:1 mixture are presented in Figure III-2.[1]
As
previously reported[1]
, a proper combination of cations with the same anion prevents the
molecules from ordered arrangement and crystallization. The liquid state of the IL mixture
can therefore be maintained few tens of degrees lower than both of its constituents. The
conductivity of both ILs and their mixture are shown in Figure III-2b. For PIP13FSI and
PYR14FSI ionic liquids, their conductivities drop significantly when temperature goes below
their melting points of 6 and 18°C, respectively. Whereas for the 1:1 mixture, conductivity
values of 28.9 mS/cm and 4.9 mS/cm were found at 100 and 20°C, respectively, and the
temperature dependence follows Arrhenius behaviour down to 70°C. This extended
temperature of ionic conductivity allows the IL mixture to be operated at low temperature as
low as 50°C with exohedral carbons.[1]
Figure III-2: Characteristics of the ILs: DSC profiles of (I) PIP13FSI, (II) PYR14FSI and (III) (PIP13FSI)0.5(PYR14FSI)0.5 mixture, and their chemical structures (a); Change of the conductivity versus the inverse temperature for PIP13FSI, PYR14FSI and (PIP13FSI)0.5(PYR14FSI)0.5 IL mixture (b)
[1]

Chapter III: Study of Carbon Microstructure Effect on Capacitive Storage
80
3. Hierarchy silicon carbide-derived carbon (SiC-CDC) in organic
electrolyte and IL mixture
Among different carbon-based materials, microporous carbide-derived carbon (CDC)
family is highly attractive thanks to their tunable structure leading to high capacitance.[4-7]
As
mentioned in chapter I, CDCs are prepared from chlorination of metal carbides; depending on
the choice of precursor material and synthesis conditions, the resulting microstructure can be
nicely controlled with a narrow pore size distribution, while retaining the original carbide shape
and volume (a conformal transformation).[2]
An original route for the synthesis of ordered
mesoporous carbides has been developed recently by Favier et al using a magnesio-thermal
reaction on silica-carbon mesoporous composites.[8,9]
This section investigates the electrochemical performance of such ordered
micro/mesoporous silicon carbide – CDC (SiC-CDC) materials first in a conventional organic
electrolyte (tetraethylammonium tetrafluoroborate (NEt4BF4) in acetonitrile (AN)), and
further in the IL eutectic mixture. The synthesis of silicon carbide and part of the material
characterizations were conducted in Professor Fédéric Favier’s group in Montpellier, France.
The chlorination of the as-prepared silicon carbide powder was implemented in Professor
Yury Gogotsi’s group (Drexel University, USA).
Ordered micro/mesoporous silicon carbide-derived carbon (SiC-CDC)
SiC-CDC synthesis
Mesoporous carbon-silica composites were prepared with slight modifications on the
synthetic route described by Liu et al.[10]
A triblock copolymer P123 (Aldrich) was chosen as
soft template. In a typical procedure, under vigorous stirring, 1 g of 0.2 M HCl was added to
9.6 g of 20 wt% P123 alcoholic solutions. After stirring at 40 ºC for 4 h, a clear solution was
obtained. Subsequently, 2.5 g of 20 wt% resol alcoholic solution and 2.08 g tetraethoxysilane
(TEOs, 98% Alfa Aesar) were added. The mixture was continuously stirred for 2 h and painted
afterwards onto a glass plate. The resulting film was kept at ambient temperature overnight to
evaporate residual ethanol before being polymerized at 100 °C for 24 h. The as-made film was
scraped and ground into fine powder before being carbonized in a tubular furnace at 800 °C for
3 h under N2 flow. C/Si molar ratio was measured at 1.04:1 by residual silica content after
burning SiC precursors at 550 °C for 2 h. By tuning the molar ratio between silica and carbon

Chapter III: Study of Carbon Microstructure Effect on Capacitive Storage
81
precursors, as illustrated in Figure III-3a), the pore size could be finely tuned between 2.5 to 11
nm (Figure III-3b and c).[9]
Chlorination of this ordered silicon carbide creates micropores
while maintaining the mother mesoporous structure, resulting in a hierarchical
micro/mesoporous network in the material.
Figure III-3: SiC growth mechanism starting from various CS composite precursors (a) The pore size of the final SiC depends on the liquid polymer/TEOS ratio thanks to the size of the silica shell around the P123/F127 micelles. During the magnesio-thermal reduction, SiO2 dissolves through SiOx diffusion through the carbon matrix for pore opening in the final SiCs. TEM images of mesoporous silicon carbide using triblock copolymers P123 (b) and F127 (c) as structuring agent, respectively. (From reference [9])
The mesoporous silicon carbide was synthesized by using Mg as reducing agent at
moderate temperatures as described in reference [8]. After sealing a carbon/SiO2 composite
mixed with Mg powder (10% Mg molar excess over SiO2) under Ar in a 316L stainless tube,
the magnesio-thermal reduction was performed at 800 ºC for 24 h at a heating rate of
1 °C/min. SiC product was purified using 1 M HCl and 1 M HNO3 aqueous solutions in
sequence.
CDC powders were produced by chlorination of the SiC precursor, as previously
described.[2]
The precursor was placed in a horizontal tube furnace and heated to 800 °C in Ar,

Chapter III: Study of Carbon Microstructure Effect on Capacitive Storage
82
followed by Cl2 flow (10-15 cm3/min) for 3 h. After flushing residual Cl2 with argon and
lowering the temperature to 600 °C, the sample was annealed for 2 h using H2.
SiC-CDC Characterization
As mentioned in reference [9], XRD measurements conducted on the as-prepared SiC
(Figure III-4a) shows the evidence for carbide formation. The SAXS reflection of the SiC
(Figure III-4b)
Figure III-4: XRD (a) and SAXS (b) patterns of the as-prepared silicon carbide powders (XRD and SAXS measurements were performed on a Philips X’s Pert diffractometer using Cu Kα radiation (λ = 1.5405Å ))
TEM image (obtained using a JEOL 1200 EX2 TEM operating at 100 kV), Ar gas
adsorption/desorption isotherm at 87K (Micromeritics ASAP 2020 porosimeter) and the pore
size distribution obtained from Quenched Solid Density Functional Theory (QSDFT) method
(Figure III-5) show that the mesoporous structure of the silicon carbide was retained after
chlorination, with a significant fraction (~ 70%) of the pores having sizes greater than 2 nm.
Additionally, the SiC-CDC contains narrowly distributed micropores as a peak at 1 nm is
observed in Figure III-5b (inset). The specific surface areas of SiC-CDC calculated from
Brunauer-Emmett-Teller (BET) and Density Functional Theory (DFT) method are 1619 m2/g
and 1335 m2/g, respectively.
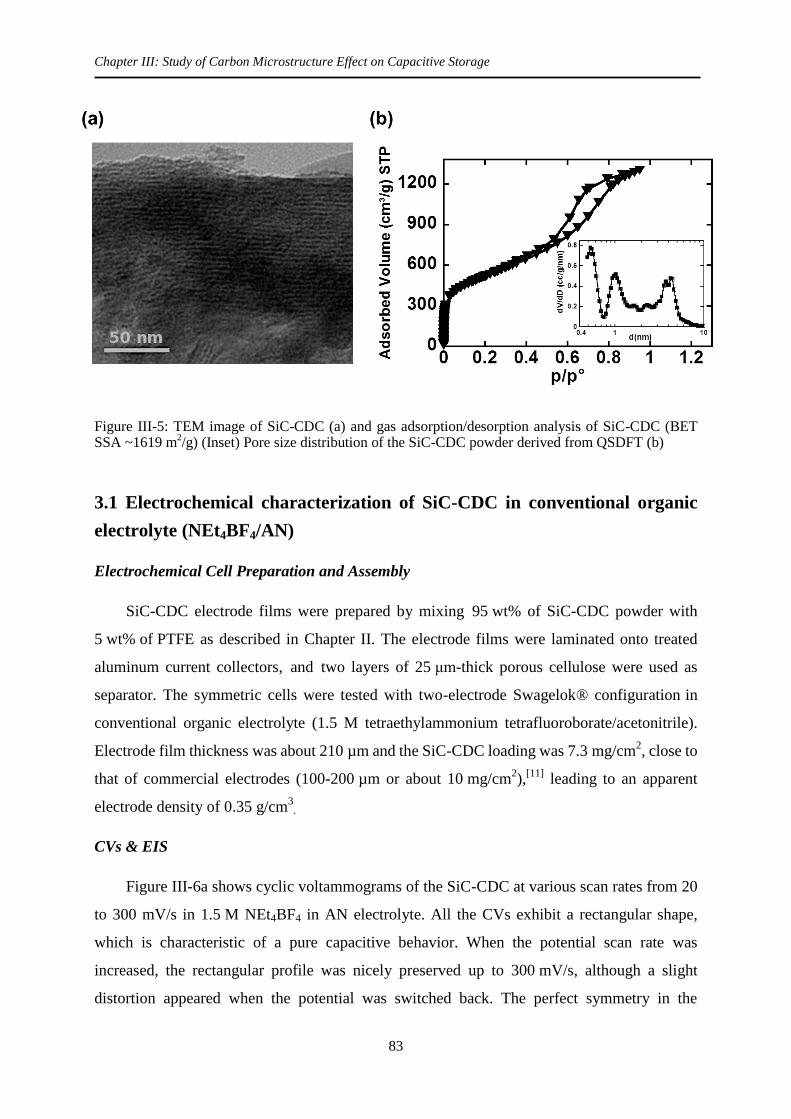
Chapter III: Study of Carbon Microstructure Effect on Capacitive Storage
83
Figure III-5: TEM image of SiC-CDC (a) and gas adsorption/desorption analysis of SiC-CDC (BET SSA ~1619 m
2/g) (Inset) Pore size distribution of the SiC-CDC powder derived from QSDFT (b)
3.1 Electrochemical characterization of SiC-CDC in conventional organic
electrolyte (NEt4BF4/AN)
Electrochemical Cell Preparation and Assembly
SiC-CDC electrode films were prepared by mixing 95 wt% of SiC-CDC powder with
5 wt% of PTFE as described in Chapter II. The electrode films were laminated onto treated
aluminum current collectors, and two layers of 25 μm-thick porous cellulose were used as
separator. The symmetric cells were tested with two-electrode Swagelok® configuration in
conventional organic electrolyte (1.5 M tetraethylammonium tetrafluoroborate/acetonitrile).
Electrode film thickness was about 210 µm and the SiC-CDC loading was 7.3 mg/cm2, close to
that of commercial electrodes (100-200 µm or about 10 mg/cm2),
[11] leading to an apparent
electrode density of 0.35 g/cm3
.
CVs & EIS
Figure III-6a shows cyclic voltammograms of the SiC-CDC at various scan rates from 20
to 300 mV/s in 1.5 M NEt4BF4 in AN electrolyte. All the CVs exhibit a rectangular shape,
which is characteristic of a pure capacitive behavior. When the potential scan rate was
increased, the rectangular profile was nicely preserved up to 300 mV/s, although a slight
distortion appeared when the potential was switched back. The perfect symmetry in the

Chapter III: Study of Carbon Microstructure Effect on Capacitive Storage
84
distortion evidences an ohmic origin, which is originated from the ohmic drop in the bulk
electrolyte. The specific capacitance of the prepared porous carbon is 80 F/g. This value is
certainly not among the highest reported in the literature for porous carbons in organic
electrolyte[12]
; however, taking into account the carbon weight loading of 7.3 mg/cm2, it
corresponds to a areal capacitance of more than 0.5 F/cm2 per electrode, which compares
favorably with most values reported in the literature[13-16]
at the same scan rate (will verify
again). The specific capacitance per cm2 of the electrode is representative to the energy that
could be stored in a real device.[11]
Figure III-6: Electrochemical characterization of Si-CDC in 1.5M NEt4BF4/Acetonitrile: CVs at different scan rates (a) and the corresponding EIS Nyquist plot (b). Inset in (b) shows data at high-frequency range (Ri = ionic resistance)
The EIS Nyquist plot of the cell (Figure III-6b) shows a typical capacitive behavior of a
porous blocking electrode[17]
as well as an extremely low resistance: an equivalent series
resistance (ESR) of 0.25 ·cm2 and an ionic resistance of the electrolyte inside the porous
carbon electrode of 0.35 ·cm2. Both ESR and ionic resistance obtained are smaller than those
found in the literature for other carbon-based materials (activated carbon[17-20]
, other CDCs[21]
,
CNT[13]
, CNF[22]
, carbon onion[13]
, graphene[23]
) in the same electrolyte under similar testing
conditions. While micropores provide a good charge storage capability, a high power is
anticipated from the low intrinsic resistance of SiC-CDC and high ion accessibility through the
mesopores.

Chapter III: Study of Carbon Microstructure Effect on Capacitive Storage
85
Figure III-7a shows CVs at high scan rates from 20 to 3,000 mV/s and Figure III-7b shows
the gravimetric capacitance (derived from the slope of the Q-V curve during cell discharge) and
the areal specific capacitance (obtained by dividing the electrode capacitance by the geometric
area of the cell) as a function of the potential scan rate. The capacitive CV shape was preserved
up to 1 V/s, with a gravimetric capacitance of 75 F/g, corresponding to > 90% of capacitance
retention; this already evidences the high power performance of the material.
Figure III-7: Power performance investigation of SiC-CDC: CVs at high scan rates up to 3V/s (a) and capacitance vs scan rate (b)
Complex Capacitance Model (C’ & C’’ vs f)
The frequency behavior of the cell was analyzed using a complex capacitance model[17]
,
based on the modeling of the capacitance in real part C’() and imaginary part C’’(). In this
model, the real part C’ () and imaginary part C’’ () of the capacitance are both function of
the frequency and can be extracted from the EIS data by the following equations:
and
Where is the pulsation ( = 2 × frequency), Z() is the complex impedance, Z’() and
Z’’() are the real and imaginary part of the complex impedance, respectively.
Figure III-8a shows the change of the real part of the capacitance C’() with frequency.
The graph shows a transition from purely resistive behavior at high frequency (phase angle
close to 0) to purely capacitive behavior at low frequency (phase angle of -87°). The whole
2)(
)(")('
Z
ZC
2)(
)(')('
Z
ZC

Chapter III: Study of Carbon Microstructure Effect on Capacitive Storage
86
capacitance of the electrode is reached at around 0.2 Hz where the capacitance tends to be
constant below this value; the capacitance value for a phase angle of -45° obtained at 1 Hz is
0.25 F/cm2. This corresponds to half of the total (low frequency) capacitance of the
electrode.[17]
The change of C’ vs. frequency first evidences the high power capability of the
porous SiC-CDC, since the transition frequency is high, at 1 Hz. Higher power can be reached
using thin-films in micro-devices for instance, or exohedral carbons with accessible but limited
surface area. However, it is achieved at the expense of the energy density. As such, the areal
capacitance (F/cm2) of such devices or electrodes is low, from μF/cm
2 to few mF/cm
2.[15,24-26]
In
contrast, thanks to the hierarchical porous structure of the prepared SiC-CDC, an attractive
areal capacitance of 0.5 F/cm2 was obtained, demonstrating a higher energy density while
maintaining high power performance.
Figure III-8: Complex capacitance: Real capacitance, C’ (a) and imaginary capacitance, C’’ (b) vs the logarithm of frequency
Figure III-8b shows the imaginary part of the capacitance, C’’(), versus frequency. The
relaxation time τ0 in this system is 1 second, which can be calculated from 00 /1 f , where f0
is the frequency corresponding to the maximum of the curve of C’’ vs. f. This time constant
corresponds to the minimum time needed to discharge the supercapacitor while still
maintaining an energy efficiency more than 50 %. These micro/mesoporous carbons thus
show high power performance with high specific capacitance. These primary electrochemical
characterizations in conventional organic electrolyte suggest that the magnesio-thermal
reduction of SiC is an efficient way for producing carbon for high power applications.

Chapter III: Study of Carbon Microstructure Effect on Capacitive Storage
87
3.2 Electrochemical characterization of SiC-CDC in IL eutectic mixture
The high power performance of micro/mesoporous SiC-CDC in NEt4BF4/AN electrolyte
indicates an improved ion accessibility in this hierarchical porous carbon thanks to the high
content of mesopores; we therefore suggest that it might be a potential electrode candidate in
IL eutectic mixture at low temperature with improved capacitance (hence energy density) as
compared to the exohedral carbon (OLCs and CNTs). Commercial activated carbon (YP-50F)
was tested under the same condition in this section for comparison. Although YP-50F exhibits
higher specific capacitance (100 F/g) than that of SiC-CDC in 1.5 M NEt4BF4/AN at ambient
temperature, its structure contains mainly micropores (92 % of pores smaller than 2 nm)
without hierarchical structure, hence it shows poorer power characteristics in NEt4BF4/AN
electrolyte. The pore characteristics of these two carbon materials are summarized in Table
III-1. The comparison between the prepared SiC-CDC (hierarchical micro/mesoporous
network) and YP-50F (microporous structure) in the much more viscous ionic liquid mixture,
especially at low temperature, may highlight the effect of carbon microstructure on ion
accessibility.
Table III-1: Characteristics of SiC-CDC and YP-50F
SiC-CDC YP-50F
BET SSA (m2/g) 1619 1732
Total pore volume (cc/g) 1.59 0.75
Percentage of pore < 1 nm (%) 17.5 66
Percentage of pore of 12 nm (%) 13.5 26
Percentage of pore > 2 nm (%) 69 8
Peak pore size/mean pore size (nm) 1 and 3-4 0.9
Electrochemical Cell Preparation and Assembly
The SiC-CDC electrode films was prepared as mentioned in previous section, and tested
with two-electrode Swagelok® configuration in (PIP13FSI)0.5(PYR14FSI)0.5 ionic liquid
mixture. Platinum discs were used as current collectors and two layers of 25 μm-thick porous
Al2O3 were used as separator. SiC-CDC loading is 6.2 mg/cm2, close to that in previous test.
YP-50F activated carbon was also prepared with similar weight loading and tested under the

Chapter III: Study of Carbon Microstructure Effect on Capacitive Storage
88
same condition for comparison. Swagelok® cells were kept under light pressure during the
measurement to buffer thermal expansion/contraction of the stainless steel pistons.
Temperature control was achieved using a Votsch climatic chamber (Germany) with the
temperature being additionally checked by a thermocouple.
Room Temperature
Figure III-9 shows the cyclic voltammograms and EIS Nyquist plots of SiC-CDC and
YP-50F in IL mixture at room temperature (20°C) at 20mV/s. Both CVs of SiC-CDC and
YP-50F present rectangular profiles, confirming nice capacitive characteristics of both
Figure III-9: Electrochemical characterization of SiC-CDC (a, c) and activated carbon YP-50F (b,d) in (PIP13FSI)0.5(PYR14FSI)0.5 ionic liquid mixture - cyclic voltammograms at 20mV/s (a, b) and EIS Nyquist plots (c, d)
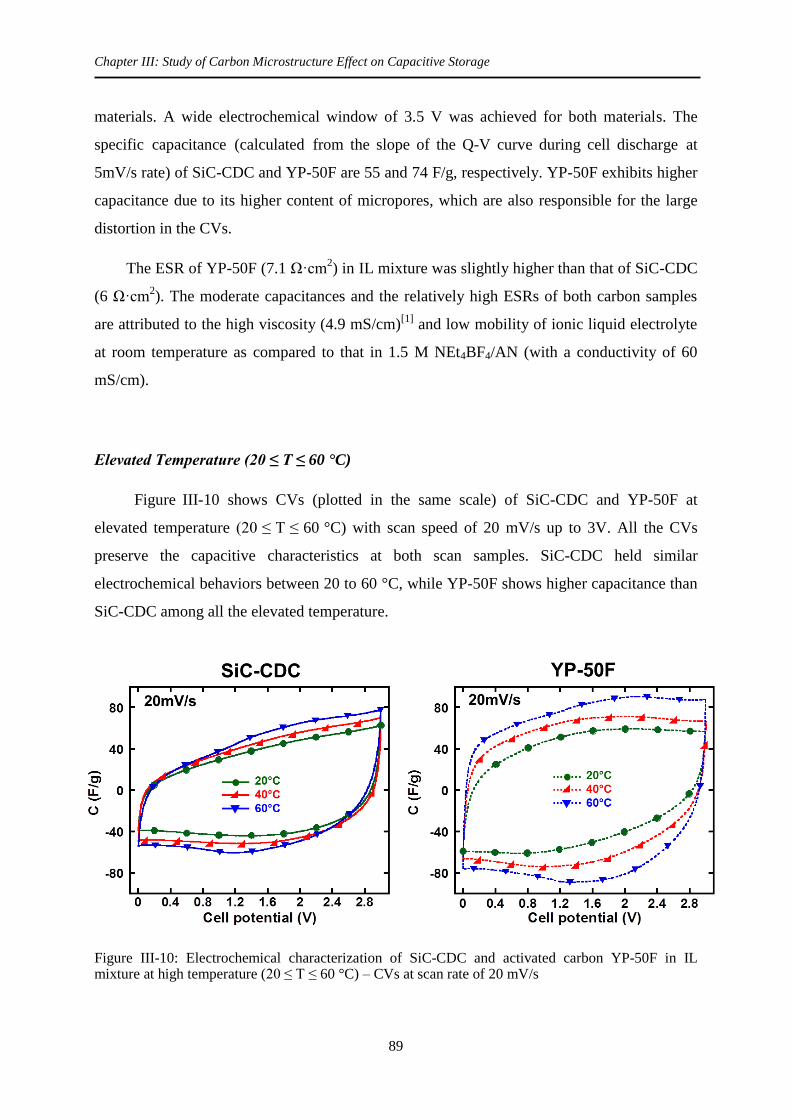
Chapter III: Study of Carbon Microstructure Effect on Capacitive Storage
89
materials. A wide electrochemical window of 3.5 V was achieved for both materials. The
specific capacitance (calculated from the slope of the Q-V curve during cell discharge at
5mV/s rate) of SiC-CDC and YP-50F are 55 and 74 F/g, respectively. YP-50F exhibits higher
capacitance due to its higher content of micropores, which are also responsible for the large
distortion in the CVs.
The ESR of YP-50F (7.1 Ω·cm2) in IL mixture was slightly higher than that of SiC-CDC
(6 Ω·cm2). The moderate capacitances and the relatively high ESRs of both carbon samples
are attributed to the high viscosity (4.9 mS/cm)[1]
and low mobility of ionic liquid electrolyte
at room temperature as compared to that in 1.5 M NEt4BF4/AN (with a conductivity of 60
mS/cm).
Elevated Temperature (20 ≤ T ≤ 60 °C)
Figure III-10 shows CVs (plotted in the same scale) of SiC-CDC and YP-50F at
elevated temperature (20 ≤ T ≤ 60 °C) with scan speed of 20 mV/s up to 3V. All the CVs
preserve the capacitive characteristics at both scan samples. SiC-CDC held similar
electrochemical behaviors between 20 to 60 °C, while YP-50F shows higher capacitance than
SiC-CDC among all the elevated temperature.
Figure III-10: Electrochemical characterization of SiC-CDC and activated carbon YP-50F in IL mixture at high temperature (20 ≤ T ≤ 60 °C) – CVs at scan rate of 20 mV/s

Chapter III: Study of Carbon Microstructure Effect on Capacitive Storage
90
Temperature shows stronger influence on capacitance for YP-50F samples than
SiC-CDC samples. The increase of capacitance with temperature is attributed to the increase
ion mobility with temperature. The maximum applicable potential window is related to
temperature - the higher the temperature, the higher the material activity, hence the narrower
the window. The maximum windows of SiC-CDC and YP-50F at 20 mV/s at 60 °C were 3.5
and 3.3 V, respectively.
Sub-zero Temperatures (20 & 40 °C)
The electrochemical characterization of both SiC-CDC and YP-50F at 20 & 40 °C are
shown in Figure III-11. The CVs (Figure III-11a and b; plotted in the same scale) at 5 mV/s
up to 3.5 V show that the two carbon samples behave differently when temperature decreases.
The capacitance of YP-50F reduced significantly to 25 and 11 F/g at 20 and 40 °C,
respectively, which correspond to 34 % and 15 % of the capacitance at room temperature with
the same scan rate. While for SiC-CDC carbon, at low temperature of 40 °C, it kept 70 % of
its capacitance when operating at room temperature.
EIS measurements (Figure III-11c and d) still show capacitive characteristics for both
materials at -40 °C. The extra semi-circles at high frequency range might be attributed to the
onset of the gelation or increased immobility of the electrolyte ions in the narrow porous
structure. In addition, YP-50F carbons presented a higher resistance than that of SiC-CDC at
low frequency tail. Both CV and EIS indicate that at low temperature, ions have lower
mobility and less accessibility inside a pure microporous material (YP-50F) than in the
material containing hierarchical network (SiC-CDC).

Chapter III: Study of Carbon Microstructure Effect on Capacitive Storage
91
Figure III-11: Electrochemical characterization of SiC-CDC (a, c) and YP-50F (b,d) in (PIP13FSI)0.5(PYR14FSI)0.5 ionic liquid mixture at low temperature - cyclic voltammograms at 5mV/s (a, b) and EIS Nyquist plots (c, d)
Temperature Dependence and Power Performance
Figure III-12 compares the electrochemical behaviors of SiC-CDC and YP-50F in terms
of temperature and scan rate: CVs collected at 20 and 60 °C with scan rates of 20 and 100
mV/s, and at 20 and 40 °C with scan rates of 5 and 20 mV/s. In both carbon samples, the
higher the temperature, the higher the ionic mobility in the pores, thus the higher the
capacitance; on the other hand, the higher the scan rate, the less time allowed for ion to
respond to the applied polarization, the lower the capacitance. The temperature dependence
and power dependence are compared individually in Figure III-13 and Figure III-14.

Chapter III: Study of Carbon Microstructure Effect on Capacitive Storage
92
Figure III-12: CVs of SiC-CDC and activated carbon YP-50F in IL mixture at 20 and 60 °C with scan rates of 20 and 100 mV/s, and at 20 and 40 °C with scan rates of 5 and 20 mV/s.
The temperature dependence of the specific capacitance at moderate scan rate of 20
mV/s was plotted and shown in Figure III-13. At elevated temperature (T ≥ 20 °C), where the
ions own high mobility, YP-50F presents much higher capacitance than that of SiC-CDC

Chapter III: Study of Carbon Microstructure Effect on Capacitive Storage
93
since it contains large amount of micropores. However, when the temperature decreases, the
ion mobility is highly limited in such narrow microporous network, therefore the capacitance
drops significantly with temperature. At 0 °C, the capacitance of YP-50F already becomes
smaller than that of SiC-CDC. Whereas for SiC-CDC, the capacitance does not change a lot
between 20 and 60 °C, indicating that good ion accessibility is achieved in the SiC-CDC
hierarchical porous structure within this temperature range.
Figure III-13: Temperature dependence of specific capacitance (calculated from Q-V slope during discharge at 20 mV/s). SiC-CDC shows better capacitive behavior than YP-50F at low temperature.
The capacitance versus scan rate at 20, 0, 20, and 40 °C are shown in Figure III-14.
SiC-CDC shows better capacitance retention than that of microporous activated carbon as
scan rate increased. It also shows higher capacitance than exohedral carbons even at low
temperature of 40 °C. These results evidence that the prepared SiC-CDC allows the
operation in IL mixture at low temperature down to 40°C thanks to its ordered mesopores
which serve as ion reservoirs and transport channels, and the capacitance was improved as
compared to the exohedral carbons (20 to 30 F/g, highlighted in red dashed line in the Figure)
owning to the presence of micropores.

Chapter III: Study of Carbon Microstructure Effect on Capacitive Storage
94
Figure III-14: Power performance of SiC-CDC and YP-50F at 20, 0, 20, and 40 °C. Capacitance was calculated from the Q-V slope during discharge at different scan rates. Capacitance of exohedral carbon (~30 F/g) used in the same ILs mixture was also highlighted in red dashed line as reference.
In this section, the hierarchical meso/microporous SiC-CDC was compared with
microporous YP-50F and previously reported exohedral carbons [1]
. The mesopores offer a
wider pathway for ion transport, thus greatly improve the supercapacitor performance at low
temperature as compared to the commercial activated carbon which only contains micropores.
Additionally, capacitance is improved as compared to the exohedral carbons due to the higher
SSA and introduction of endohedral surface. These results highlight again the importance of
selecting appropriate carbon nanostructures to match the nature of the electrolyte.

Chapter III: Study of Carbon Microstructure Effect on Capacitive Storage
95
4. Activated Graphene (a-MEGO) in IL mixture
In previous section, the use of ordered micro/mesoporous SiC-CDC in ILs mixture has
shown good capacitive behavior with improved capacitance at low temperature with regards
to both exohedral carbons with a totally open surface and commercial activated carbon
containing only micropores. This proves that both micropores and mesopores are important
for energy storage in supercapacitors. However, due to the high amount of mesopore (~70%)
in the SiC-CDC, an important part of the pore volume in the material does not contribute to
charge storage; hence the capacitance only improves by a factor of two as compared to OLCs
and CNTs in ILs mixture. A porous carbon possessing high accessible SSA, optimized ratio
between micropores and mseopores, and ion accessible pore architecture is thus needed.
Graphene, as mentioned in Chapter I, its well-known high theoretical SSA (2630 m2/g)
and high electrical conductivity make it an interesting candidate as supercapacitor electrode
material. Ruoff’s group has recently reported on the activation of microwave exfoliated
graphite oxide (‘MEGO’) using potassium hydroxide.[27]
This carbon (‘a-MEGO’) shows
unique structure and properties, such as high SSA (up to 3100 m2/g) and high accessible
surface area, low O and H content, and is composed mostly of sp2 bonded carbon, therefore we
reasoned that it might yield to important increase in specific capacitance, compared to OLCs or
CNTs, with the (PIP13-FSI)0.5(PYR14-FSI)0.5 ionic liquid electrolyte.
Synthesis and Characterization of Activated graphene (a-MEGO)
The synthesis procedure for a-MEGO, as well as its characterization, has been conducted
by Professor Rodney Ruoff’s group (University of Texas at Austin, USA) and described in
detail in reference 27. MEGO was prepared from graphite oxide (GO) by microwave
irradiation,[28]
then dispersed and soaked in aqueous KOH solution for 20 h. The solid cake
obtained after vacuum filtration of the excess KOH was then dried. The dry MEGO/KOH
mixture was heated at 800 oC for 1 hour in a horizontal tube furnace with an argon flow of 150
sccm at atmospheric pressure. The sample was then washed with de-ionized water, and dried at
65 oC in ambient air for 2 hours. Annealing of activated graphene was done in a custom made
vacuum furnace (Solar Atmospheres, USA) at 1100 °C, with the heating ramp 10 °C/min, and a
vacuum ~10-6
Torr for 10 minutes.
Schematic showing the microwave exfoliation/reduction of GO and the following

Chapter III: Study of Carbon Microstructure Effect on Capacitive Storage
96
chemical activation of MEGO with KOH, and SEM and TEM images of the prepared a-MEGO
are reported in reference 27 and reproduced in Figure III-15. This graphene material showed a
continuous, three dimensional pore structure comprised of highly curved single-layer sheets of
n-membered rings of carbon, with n varying between 5 and 8.
Figure III-15: Schematic showing the microwave exfoliation/reduction of GO and the following chemical activation of MEGO with KOH that creates pores while retaining high electrical conductivity (A). Low magnification SEM image of a 3D a-MEGO piece (B). High-resolution SEM image of a different sample region that demonstrates the porous morphology (C). ADF-STEM image of the same area as (C), acquired simultaneously. As seen, a-MEGO contains micro- and mesopores with a distribution of sizes between ~1 and ~10 nm (D). High-resolution phase contrast electron micrograph of the thin edge of an a-MEGO chunk, taken at 80 kV. There is a variation in focus across the image because of the sloped nature of the sample and changes in sample thickness. The image shows the presence of a dense network of nanometer scale pores surrounded by highly curved, predominantly single-layer carbon (E). Exit wave reconstructed HR-TEM image from the edge of a-MEGO (F). The in-plane carbon atoms are clearly resolved, and a variety of n-membered carbon rings can be seen. Substantial curvature of the single-carbon sheets is visible, with the in-plane crystallinity being preserved. (From reference
[27])

Chapter III: Study of Carbon Microstructure Effect on Capacitive Storage
97
Nitrogen gas sorption was performed at 77 K using a Quadrasorb Pore Size and Surface
Area Analyzer (Quantachrome Instruments, USA). Prior to analysis, samples were outgassed
at 200 °C in vacuum at about 10-2
Torr for 24 hours. BET surface area was calculated in the
range of 0.05-0.3 P/P0. Pore size distributions were determined using the quenched solid
density functional theory (QSDFT) model, assuming a slit pore geometry, which was part of the
QuadraWin software package (Quantachrome Instruments, USA).
Figure III-16: Nitrogen sorption isotherms (a) and corresponding pore size distributions calculated by QSDFT model (b) for activated graphene (BET SSA 1901 m
2/g)
Single-layer graphene has a theoretical specific surface area of 2630 m2/g, however in
practice the BET SSA is generally much lower because of multi-layer sheets and agglomeration.
We approach the theoretical value of a single sheet of graphene, with as-activated a-MEGO
having a high surface area of 1901 m2/g and all pores less than 5 nm (Figure III-16a). The
a-MEGO has a desirable PSD for supercapacitors, as it has both micropores that give it a high
SSA, in the range of values typical for activated carbons, and mesopores that facilitate ion
mobility during charging and discharging.

Chapter III: Study of Carbon Microstructure Effect on Capacitive Storage
98
4.1 Electrochemical characterization of activated graphene in IL mixture
Electrochemical Cell Preparation and Assembly
Two-electrode Swagelok® nylon cells with stainless steel pistons were used for
quantitative electrochemical characterizations of as-activated MEGO (a-MEGO) powder. Cells
were assembled in the eutectic mixture of ILs under glove-box conditions. Pt disks were used
as current collectors to decrease the contact resistance at the as-activated a-MEGO/piston
interface. For the as-activated a-MEGO, electrode films (disks) of 1.1 cm², 1.65 mg and 55 µm
thick were made of 95% of the carbon powder and 5% of PTFE (Dupont de Nemours) binder
as described in Zhu et al.[27]
Electrodes and two layers of Al2O3 separators were wetted with
the electrolyte prior to being placed between the electrodes. Swagelok® cells were kept under
light pressure during the measurement to buffer thermal expansion/contraction of the stainless
steel pistons. Temperature control was achieved using a Votsch climatic chamber (Germany)
with the temperature being additionally checked by a thermocouple. After heating to a certain
temperature, the system was kept isothermal for a period of no less than 5 hours prior to
electrochemical measurements to ensure system equilibration. For low temperature
experiments, this dwell time was increased to an overnight period (> 6 hours).
Room Temperature
Figure III-17a shows the CV of as-activated a-MEGO electrodes in the IL mixture
scanned at 20 mV/s at room temperature. The characteristic rectangular CV profile confirms
the feasibility of using the eutectic IL mixture with as-activated a-MEGO. A maximum
operating voltage of 3.7 V (same as for the OLCs) was obtained at room temperature with a
capacitance of ~160 F/g, which is a 5-fold increase compared to OLCs and CNTs (~30 F/g)[1]
and 3-fold increase to SiC-CDC. This huge increase can be firstly attributed to the highly
accessible SSA of the as-activated a-MEGO electrodes. Moreover, the open inter-layer
porosity of the as-activated a-MEGO electrodes allows electrolyte ions access to the
subnanometer pores in a-MEGO sheets without much limitation in ion transfer, as may occur
when using conventional activated carbons with a tortuous pore network and narrow
bottlenecks between pores.[1]

Chapter III: Study of Carbon Microstructure Effect on Capacitive Storage
99
Figure III-17: Room temperature electrochemical characterization of a-MEGO electrodes in (PIP13-FSI)0.5(PYR14-FSI)0.5 electrolyte: CVs collected at 20 mV/s with the electrochemical window of 3.5 V and showing capacitance of 150 F/g (a) and the corresponding EIS Nyquist plot (b). Inset in (b) shows the high-frequency range.
Figure III-17b shows the EIS plot for the activated graphene electrodes assembled in the
ionic liquid mixture. The vertical increase of the imaginary part of the impedance at low
frequency provides evidence of the capacitive storage achieved with a-MEGO. A fairly low
ESR of 3.4 Ω.cm2 was measured at room temperature (10 Ω.cm² ESR was measured for CNT
electrodes[1]
, and 6 Ω·cm2 for SiC-CDC), mainly due to the high electrical conductivity of the
a-MEGO electrode (500 S/cm) compared to commercial activated carbons (0.1 – 1 S/cm).[29]
Thanks to the 2-dimentional nature, both sides of the atom-thick pore walls of a-MEGO
(graphene layers) can be used in charge storage, once the electrolyte gains access to these
surfaces, a tremendous amount of charge could be stored as observed in the 5-fold increase in
capacitance using a-MEGO.
Elevated Temperature (20 ≤ T ≤ 80 °C)
Figure III-18a shows CVs recorded at 100 mV/s to their respective maximum voltages at
different temperatures. There is a gradual increase of capacitance with increasing temperature
that can be explained by the higher ionic conductivity (ion mobility) of the electrolyte at
elevated temperatures, which is also reflected in the more rectangular shape of the CVs with

Chapter III: Study of Carbon Microstructure Effect on Capacitive Storage
100
increasing temperature, as observed in previous section. Electrochemical impedance
measurements further confirm the decrease in ionic resistance as shown in Figure III-18b, and
the ESR value decreases from 3.4 to 1.3 Ω.cm2 while increasing the temperature from 20 °C to
80 °C. The capacitance increases from 160 to 180 F/g as temperature increases from RT to 80
°C.
Figure III-18: Electrochemical characterization of a-MEGO electrodes in (PIP13FSI)0.5(PYR14-FSI)0.5 electrolyte at room and elevated temperatures: CVs collected at 100 mV/s (a), corresponding EIS Nyquist plots (b)
The electrochemical window decreases as the temperature increases, and is limited to 2.9
V at 80 °C. This may be related with the catalytic nature of the platinum current collectors
used in the tests. Further experiments were conducted by placing a spacer and ionic liquids in
between two platinum or two gold current collectors, without a-MEGO electrodes, in same
Swagelok® cell configuration as that of a-MEGO. CVs collected using different current
collectors at room temperature and 80 °C were presented in Figure III-19. The results showed
that higher electrochemical activity at platinum current collectors is observed at elevated
temperature due to its catalytic nature. This explains the reasons why the operating voltage is
limited to smaller value at elevated temperature.
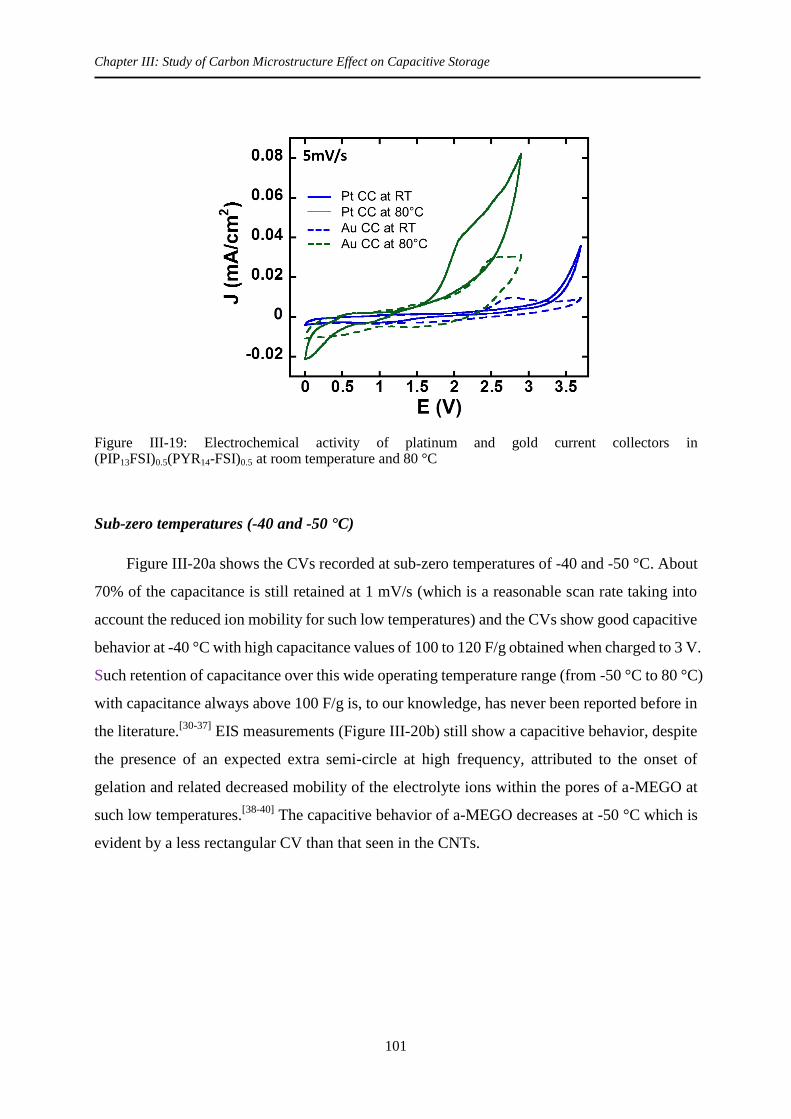
Chapter III: Study of Carbon Microstructure Effect on Capacitive Storage
101
Figure III-19: Electrochemical activity of platinum and gold current collectors in (PIP13FSI)0.5(PYR14-FSI)0.5 at room temperature and 80 °C
Sub-zero temperatures (-40 and -50 °C)
Figure III-20a shows the CVs recorded at sub-zero temperatures of -40 and -50 °C. About
70% of the capacitance is still retained at 1 mV/s (which is a reasonable scan rate taking into
account the reduced ion mobility for such low temperatures) and the CVs show good capacitive
behavior at -40 °C with high capacitance values of 100 to 120 F/g obtained when charged to 3 V.
Such retention of capacitance over this wide operating temperature range (from -50 °C to 80 °C)
with capacitance always above 100 F/g is, to our knowledge, has never been reported before in
the literature.[30-37]
EIS measurements (Figure III-20b) still show a capacitive behavior, despite
the presence of an expected extra semi-circle at high frequency, attributed to the onset of
gelation and related decreased mobility of the electrolyte ions within the pores of a-MEGO at
such low temperatures.[38-40]
The capacitive behavior of a-MEGO decreases at -50 °C which is
evident by a less rectangular CV than that seen in the CNTs.

Chapter III: Study of Carbon Microstructure Effect on Capacitive Storage
102
Figure III-20: Electrochemical characterization of a-MEGO electrodes in (PIP13FSI)0.5(PYR14-FSI)0.5 electrolyte at low temperatures (-40 and -50 C): CVs collected at 1 mV/s (a) and the corresponding EIS Nyquist plot (b).
4.2 Removal of surface functional group by vacuum annealing
While the a-MEGO electrodes show outstanding capacitance of ~160 F/g (see Figure
III-17a), the presence of bumps in the CV at about 1.5 V could be due to electrochemically
active oxygen-containing functional groups, such as carboxylic acid or hydroxyl groups on
their surface. Such bumps were also observed when a-MEGO electrodes were tested in
EMI-TFSI electrolyte.[27]
Although they are suitable for improving the capacitance, such
surface groups are known to be unstable during cycling, thus limiting the cycle life of the
cells.[41]
Therefore, we further conducted annealing on the a-MEGO powder under vacuum to
try to eliminate functional groups that may be present on its surface. Apart from the point that
the functional groups are generally unwanted for double-layer type of supercapacitors, from
fundamental point of view, it can be interesting to determine the active oxygen sites by active
surface area (ASA) quantification technique as proposed by Vix-Guterl et al[42]
, and to further
study the relationships between surface chemistry, interfacial properties and capacitive
charging.
Vacuum Annealing
The a-MEGO was annealed at 1100 °C in vacuum at an attempt to remove the oxygen
containing surface functional groups. At this temperature with appropriate exposure time, one
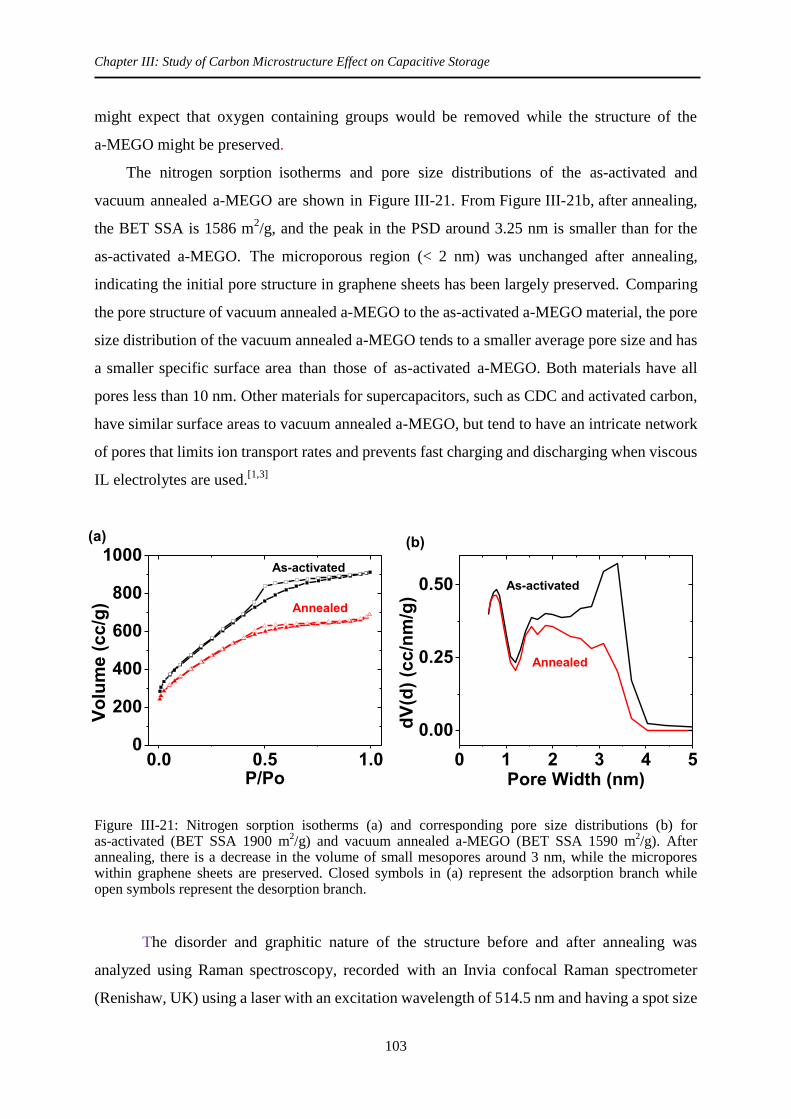
Chapter III: Study of Carbon Microstructure Effect on Capacitive Storage
103
might expect that oxygen containing groups would be removed while the structure of the
a-MEGO might be preserved.
The nitrogen sorption isotherms and pore size distributions of the as-activated and
vacuum annealed a-MEGO are shown in Figure III-21. From Figure III-21b, after annealing,
the BET SSA is 1586 m2/g, and the peak in the PSD around 3.25 nm is smaller than for the
as-activated a-MEGO. The microporous region (< 2 nm) was unchanged after annealing,
indicating the initial pore structure in graphene sheets has been largely preserved. Comparing
the pore structure of vacuum annealed a-MEGO to the as-activated a-MEGO material, the pore
size distribution of the vacuum annealed a-MEGO tends to a smaller average pore size and has
a smaller specific surface area than those of as-activated a-MEGO. Both materials have all
pores less than 10 nm. Other materials for supercapacitors, such as CDC and activated carbon,
have similar surface areas to vacuum annealed a-MEGO, but tend to have an intricate network
of pores that limits ion transport rates and prevents fast charging and discharging when viscous
IL electrolytes are used.[1,3]
Figure III-21: Nitrogen sorption isotherms (a) and corresponding pore size distributions (b) for as-activated (BET SSA 1900 m
2/g) and vacuum annealed a-MEGO (BET SSA 1590 m
2/g). After
annealing, there is a decrease in the volume of small mesopores around 3 nm, while the micropores within graphene sheets are preserved. Closed symbols in (a) represent the adsorption branch while open symbols represent the desorption branch.
The disorder and graphitic nature of the structure before and after annealing was
analyzed using Raman spectroscopy, recorded with an Invia confocal Raman spectrometer
(Renishaw, UK) using a laser with an excitation wavelength of 514.5 nm and having a spot size
0.0 0.5 1.00
200
400
600
800
1000
Vo
lum
e (
cc
/g)
P/Po
Annealed
As-activated
(a)
0 1 2 3 4 5
0.00
0.25
0.50
(b)
dV
(d)
(cc
/nm
/g)
Pore Width (nm)
Annealed
As-activated

Chapter III: Study of Carbon Microstructure Effect on Capacitive Storage
104
of 2 μm (Figure III-22). There is very little difference in the two spectra, thus evidencing that
the annealing process did not change the graphene layer structure. The main difference lies in
the full width at half maximum (FWHM) of the disorder-induced (D) band, which narrows after
annealing from 160 to 140 cm-1
, proving healing of some defects. The main goal of annealing
the activated graphene was to remove oxygen groups on the surface without affecting a-MEGO
structure, which seems to be successful from the Raman spectra as the difference before and
after annealing is subtle. Here again, the determination of the ASA of the a-MEGO could be
interesting for quantifying the effect of annealing treatment.
Figure III-22: Raman spectra of as-activated and annealed graphene in the carbon spectral range showing the bands corresponding to disordered structures (D) around 1350 cm
-1 and in-plane
vibrations of graphite (G) around 1600 cm-1
. Note that there is no significant change of the structure as a result of annealing.
Annealed a-MEGO Electrochemical Cell Preparation and Assembly
A three-electrode Swagelok® nylon cell was used to characterize vacuum annealed
a-MEGO powders. The cell assembly was similar as described in previous section. A silver
wire was used as a quasi-reference electrode, platinum discs as current collectors, YP17
activated carbon as counter electrode, and the annealed a-MEGO powders were tested directly
without film processing.
Cavity microelectrode (CME) was also used for investigating the difference between the
a-MEGO before and after annealing. The CME configuration is illustrated in Figure III-23
and described in detail in Chapter II. A cavity with diameter of 50 μm was created by laser

Chapter III: Study of Carbon Microstructure Effect on Capacitive Storage
105
ablation on the tip of the electrode. The a-MEGO powders were packed inside the cavity by
simply pressing CME on the powder grains onto a glass substrate (as shown in Figure III-23b).
The powder-packed CME was then used as the working electrode, and a laminated silver wire
and a rolled platinum foil (with area of 1 cm2) were used as reference and counter electrode,
respectively. The main advantage of utilizing CME is that this technique allows the study of
electrochemical behavior at the active materials / electrolyte interface without influence of
binders, separators, current collectors or other components in the conventional set-ups[43,44]
,
hence making it an interesting technique, in our case especially, to study the electrochemical
signals which come purely from the active material, and to compare the electrochemical
signatures between the two samples.
Figure III-23: Scheme of cavity micro-electrode (CME) (a) and CME electrochemical cell assembly and configuration (rolled-Pt as counter electrode and silver wire as reference) (b)
Electrochemical signatures: As-activated vs annealed a-MEGO
Annealed and as-activated a-MEGO powders were tested in the eutectic IL mixture at
room temperature using cavity microelectrode to obtain information on any difference in
electrochemical response as a result of vacuum annealing. The CVs collected from both
samples at room temperature are shown in Figure III-24a, scanned within a potential window
of 1.7 to +1.3 V/Ref. Bumps observed at ~ 0.3 V/Ref in the positive scan and at ~ 0.8 V/Ref
in the negative scan are pronounced for the as-activated a-MEGO powder and clearly decreased
after annealing.

Chapter III: Study of Carbon Microstructure Effect on Capacitive Storage
106
Figure III-24: Cyclic voltammograms of annealed and as-activated a-MEGO electrodes in (PIP13-FSI)0.5(PYR14-FSI)0.5 electrolyte: CVs collected at 500 mV/s at room temperature using CME (a); CV collected at 1 mV/s using a Swagelok® cell (b).
Annealed a-MEGO powders were then characterized in Swagelok® cells, using a
3-electrode configuration. Figure III-24b shows the CV of annealed a-MEGO powders at 1
mV/s at room temperature. Note that in these experiments, raw powders were tested without
any binder (to echo the testing condition in CME) so that the ohmic drop was not optimized in
the cell which is why a low scan rate was used. The specific capacitances at different scan rates
are also measured and shown in Table III-2. Annealed a-MEGO powders reached a
capacitance of 130 F/g, which is ~20% less than the capacitance obtained for the as-activated
samples, as expected from a lower SSA of the annealed material. The other point to be taken
into account is the processing of the electrode, which could have some effect on capacitance
values measured.
Another notice is that since we would like to verify the bump is removed after annealing
by comparing CVs of annealed and as-activated MEGO, hence we have to make sure the bump
is not attributed to the oxidation or reduction of electrolyte and fix the same potential window
for comparison of two samples, we limited the electrochemical window well below the
oxidation/reduction potential limits of the electrode/electrolyte system (3V). However, in
Figure III-24b, the full potential window for annealed a-MEGO was extracted (3.5V).
Therefore, a difference in the potential window between Figure III-24a and b could be found.

Chapter III: Study of Carbon Microstructure Effect on Capacitive Storage
107
Table III-2: Capacitance of annealed a-MEGO electrodes in (PIP13-FSI)0.5(PYR14-FSI)0.5 electrolyte at room temperature.
Scan Rate (mV/s) Charging/discharging
capacitance (F/g)
20 100
5 110
1 130
5. Conclusions
In this chapter, carbons with different microstructures have been tested in
(PIP13FSI)0.5(PYR14FSI)0.5 ILs mixture, which possesses a wide stable electrochemical
window over extended operating temperature range, to study the relationship between carbon
architecture and capacitance, and ion accessibility (by varying temperature and scan rate).
Two carbons containing both mesopores and micropores have been investigated: SiC-CDC
prepared by chlorination of ordered mesoporous SiC which is derived from magnesio-thermal
reduction of templated carbon-silica precursors, and KOH-activated microwave exfoliated
graphite oxide (a-MEGO).
SiC-CDC, with hierarchical micro/mesoporous structure, was first tested in conventional
organic electrolyte (1.5 M NEt4BF4/AN), showed outstanding rate capability (90% of capacity
retention at 1 V/s and time constant of 1 second) with high specific areal capacitance (0.5 F/cm2
of electrode).[48]
This hierarchical porous carbon was further tested in ILs mixture and
compared with microporous activated carbon (YP-50F). SiC-CDC showed good capacitive
behavior down to -40 °C and much better capacitance retention at subzero temperature than the
microporous YP-50F. However, the large amount of mesopores (~70%) in this material gives it
a respectable capacitance (80 F/g in 1.5 M NEt4BF4/AN; 55 F/g in ILs mixture at 20 °C).
The as activated a-MEGO presented an exceptionally high capacitance (up to 180 F/g)
and wide electrochemical window (up to 3.7 V) over a wide temperature range from -50 °C to
80 °C in ILs mixture.[49]
Annealing the a-MEGO yields better electrochemical stability, but the
specific capacitance somewhat decreases due to decreased mesoporosity and associated
accessible SSA after annealing. This is 5 times higher capacitance compared to exohedral

Chapter III: Study of Carbon Microstructure Effect on Capacitive Storage
108
nanostructured carbon (nanotubes and onions) electrodes and 3 times higher than SiC-CDC
electrode, in the same eutectic mixture of ionic liquids. The high SSA, high electric
conductivity and uniformly situated mesopores (2 to 4 nm), compared with the mesopores of
SiC-CDC whose peak ranged from 2 to 10 nm, allow the KOH-activated MEGO to store the
charge much more efficiently than SiC-CDC. These findings have largely overcast the
temperature range offered by conventional organic electrolytes of 110 °C (from -30 °C to 80 °C)
and would greatly contribute to the advances in electrical storage based on ILs, pushing the
limits of energy storage to greater heights.
These studies have not only affirmed our previous findings on the need to design carbon
structure for optimizing carbon/electrolyte interface, but also showed that ionic liquids are no
longer confined to the category of “above room temperature” applications. Even more, they
have proved their extended threshold for extreme climatic conditions, which clearly proved the
robustness of ILs as electrolytes for electrical storage. Herein, the research pathway has been
paved towards optimizing the carbon accessible surface area (e.g., by using activated
graphene[27]
, de-bundled single-walled nanotubes[45]
, or mesoporous templated carbons[46][47]
)
together with designing the IL-based electrolyte. Control of the electrolyte composition and its
molecular/ionic structure is required for achieving better compatibilities with various carbon
structures and surpassing the current capacitance and energy density limits of supercapacitors.
On the other hand, fundamental understanding of the EDL charging mechanism is necessary
and will efficiently help for better supercapacitors designs. In the next chapter, the study of
charge storage mechanisms and ion dynamics using in-situ electrochemical quartz crystal
microbalance (EQCM) will be presented.

Chapter III: Study of Carbon Microstructure Effect on Capacitive Storage
109
6. Reference
[1] R. Lin, P.-L. Taberna, S. Fantini, V. Presser, C. R. Pérez, F. Malbosc, N. L. Rupesinghe, K. B. K. Teo, Y. Gogotsi, P. Simon, J. Phys. Chem. Lett. 2011, 2, 2396.
[2] V. Presser, M. Heon, Y. Gogotsi, Adv. Funct. Mater. 2011, 21, 810. [3] C. Largeot, C. Portet, J. Chmiola, P.-L. Taberna, Y. Gogotsi, P. Simon, J. Am. Chem. Soc.
2008, 130, 2730. [4] J. Chmiola, G. Yushin, Y. Gogotsi, C. Portet, P. Simon, P. L. Taberna, Science 2006, 313,
1760. [5] C. R. Pérez, S.-H. Yeon, J. Ségalini, V. Presser, P.-L. Taberna, P. Simon, Y. Gogotsi, Adv.
Funct. Mater. 2013, 23, 1081. [6] M. Arulepp, J. Leis, M. Lätt, F. Miller, K. Rumma, E. Lust, A. F. Burke, J. Power Sources
2006, 162, 1460. [7] W. Gu, G. Yushin, Wiley Interdiscip. Rev. Energy Environ. 2014, 3, 424. [8] P.-C. Gao, Y. Lei, A. F. C. Pérez, K. Rajoua, D. Zitoun, F. Favier, J. Mater. Chem. 2011,
21, 15798. [9] P.-C. Gao, P. Simon, F. Favier, Microporous Mesoporous Mater. 2013, 180, 172. [10] R. Liu, Y. Shi, Y. Wan, Y. Meng, F. Zhang, D. Gu, Z. Chen, B. Tu, D. Zhao, J. Am. Chem.
Soc. 2006, 128, 11652. [11] Y. Gogotsi, P. Simon, Science 2011, 334, 917. [12] L. Wei, M. Sevilla, A. B. Fuertes, R. Mokaya, G. Yushin, Adv. Energy Mater. 2011, 1,
356. [13] C. Portet, G. Yushin, Y. Gogotsi, Carbon 2007, 45, 2511. [14] S. Dörfler, I. Felhösi, T. Marek, S. Thieme, H. Althues, L. Nyikos, S. Kaskel, J. Power
Sources 2013, 227, 218. [15] D. Pech, M. Brunet, H. Durou, P. Huang, V. Mochalin, Y. Gogotsi, P.-L. Taberna, P.
Simon, Nat. Nanotechnol. 2010, 5, 651. [16] H. Wu, X. Wang, L. Jiang, C. Wu, Q. Zhao, X. Liu, B. Hu, L. Yi, J. Power Sources 2013,
226, 202. [17] P. L. Taberna, P. Simon, J. F. Fauvarque, J. Electrochem. Soc. 2003, 150, A292. [18] N. Jäckel, D. Weingarth, M. Zeiger, M. Aslan, I. Grobelsek, V. Presser, J. Power Sources
2014, 272, 1122. [19] D. Weingarth, D. Cericola, F. C. F. Mornaghini, T. Hucke, R. Kötz, J. Power Sources
2014, 266, 475. [20] N. Liu, J. Shen, D. Liu, Microporous Mesoporous Mater. 2013, 167, 176. [21] R. Lin, P. Huang, J. Ségalini, C. Largeot, P. L. Taberna, J. Chmiola, Y. Gogotsi, P. Simon,
Electrochimica Acta 2009, 54, 7025. [22] B.-H. Kim, K. S. Yang, J. Electroanal. Chem. 2014, 714-715, 92. [23] Y. Zhu, S. Murali, M. D. Stoller, K. J. Ganesh, W. Cai, P. J. Ferreira, A. Pirkle, R. M.
Wallace, K. A. Cychosz, M. Thommes, D. Su, E. A. Stach, R. S. Ruoff, Science 2011, 332, 1537.
[24] W. Gu, N. Peters, G. Yushin, Carbon 2013, 53, 292. [25] M. Kaempgen, C. K. Chan, J. Ma, Y. Cui, G. Gruner, Nano Lett. 2009, 9, 1872. [26] C.-M. Yang, Y.-J. Kim, M. Endo, H. Kanoh, M. Yudasaka, S. Iijima, K. Kaneko, J. Am.
Chem. Soc. 2007, 129, 20. [27] Y. Zhu, S. Murali, M. D. Stoller, K. J. Ganesh, W. Cai, P. J. Ferreira, A. Pirkle, R. M.
Wallace, K. A. Cychosz, M. Thommes, D. Su, E. A. Stach, R. S. Ruoff, Science 2011, 332, 1537.
[28] Y. Zhu, S. Murali, M. D. Stoller, A. Velamakanni, R. D. Piner, R. S. Ruoff, Carbon 2010, 48, 2118.
[29] L. L. Zhang, R. Zhou, X. S. Zhao, J. Mater. Chem. 2010, 20, 5983. [30] R. Kötz, M. Hahn, R. Gallay, J. Power Sources 2006, 154, 550. [31] H. Kurig, A. Jänes, E. Lust, J. Electrochem. Soc. 2010, 157, A272. [32] V. Ruiz, T. Huynh, S. R. Sivakkumar, A. G. Pandolfo, RSC Adv. 2012, 2, 5591. [33] E. Iwama, P. L. Taberna, P. Azais, L. Brégeon, P. Simon, J. Power Sources 2012, 219,
235. [34] C. Largeot, P. L. Taberna, Y. Gogotsi, P. Simon, Electrochem. Solid-State Lett. 2011, 14,

Chapter III: Study of Carbon Microstructure Effect on Capacitive Storage
110
A174. [35] E. Brandon, M. Smart, W. West, NASA Techncal Rep. Serv. 2010. [36] R. Vellacheri, A. Al-Haddad, H. Zhao, W. Wang, C. Wang, Y. Lei, Nano Energy 2014, 8,
231. [37] R. Väli, A. Laheäär, A. Jänes, E. Lust, Electrochimica Acta 2014, 121, 294. [38] J. Reiter, J. Vondrák, J. Michálek, Z. Mička, Electrochimica Acta 2006, 52, 1398. [39] E. J. Brandon, W. C. West, M. C. Smart, L. D. Whitcanack, G. A. Plett, J. Power Sources
2007, 170, 225. [40] A.-K. Hjelm, T. Eriksson, G. Lindbergh, Electrochimica Acta 2002, 48, 171. [41] A. G. Pandolfo, A. F. Hollenkamp, J. Power Sources 2006, 157, 11. [42] C. Vix-Guterl, M. Couzi, J. Dentzer, M. Trinquecoste, P. Delhaes, J. Phys. Chem. B 2004,
108, 19361. [43] R. Lin, P. L. Taberna, J. Chmiola, D. Guay, Y. Gogotsi, P. Simon, J. Electrochem. Soc.
2009, 156, A7. [44] C. Cachet-Vivier, V. Vivier, C. S. Cha, J.-Y. Nedelec, L. T. Yu, Electrochimica Acta 2001,
47, 181. [45] A. Izadi-Najafabadi, S. Yasuda, K. Kobashi, T. Yamada, D. N. Futaba, H. Hatori, M.
Yumura, S. Iijima, K. Hata, Adv. Mater. 2010, 22, E235. [46] F. Beguin, E. Frackowiak, Carbon Materials for Electrochemical Energy Storage Systems,
n.d. [47] C. Matei Ghimbeu, L. Vidal, L. Delmotte, J.-M. Le Meins, C. Vix-Guterl, Green Chem.
2014, 16, 3079. [48] W.-Y. Tsai, P.-C. Gao, B. Daffos, P.-L. Taberna, C. R. Perez, Y. Gogotsi, F. Favier, P.
Simon, Electrochem. Commun. 2013, 34, 109. [49] W.-Y. Tsai, R. Lin, S. Murali, L. Li Zhang, J. K. McDonough, R. S. Ruoff, P.-L. Taberna,
Y. Gogotsi, P. Simon, Nano Energy 2013, 2, 403.

Chapter IV:
In-situ EQCM Study on Ion Dynamics in
Confined Carbon Micropores


Chapter IV: In-situ EQCM Study on Ion Dynamics in Confined Carbon Micropores
111
1. Introduction
Aside from searching for new electrolytes and electrode materials to increase the energy
density, improving the electrode/electrolyte interface and electrode microstructure to enhance
the power performance, fundamental understanding of the charge storage mechanism and ion
dynamics during charging/discharge process at the molecular scale is of great importance for
designing the next generation supercapacitors. As mentioned in chapter I, the traditional
picture regarding charge storage in the porous carbon believes in that maximum capacitance
appears when the compact layers of solvated counter-ions (ions having charge opposite to that
of polarized carbon electrode) resides on both adjacent pore walls, which means the best
electrode pore size should be twice the solvated ions size. It was overturned when a
breakthrough discovery has been reported in 2006 using carbide-derived carbons (CDCs) with
controlled and narrow pore size distribution.[1]
An anomalous capacitance increase was found
when the pore size decreased down to less than 1 nm which corresponds to the solvated ion
size. It has been proposed that the ions are partially desovalted to be able to squeeze in the
micropores.
Since then, numerous works have been devoted to understanding the origin of the physics
of ion adsorption and ionic transport in confined nanoporous carbon.[2- 13]
However, owing to
the lack of in-situ technique for studying the electrode/electrolyte interface during charging and
discharging, lots of questions regarding how charge is stored at the molecular scale in confined
environment remain unsolved: does one net charge stored on the electrode correspond to one
single counter-ion adsorption (thus giving a charge storage efficiency of 100 %)? Since there
is a strong interaction between cation and anion in neat ionic liquid, do co-ions (ions carrying
charge same as that of polarized carbon electrode) affect counter-ions adsorption? In
solvent-containing electrolyte systems, how do solvents affect the charge storage? Do solvents
screen the charge of the ions leading to a less efficient charge storage?
As mentioned in chapter I, among the few in-situ electrochemical techniques (e.g. in-situ
nuclear magnetic resonance spectroscopy or in-situ infrared spectroscopy), electrochemical
quartz crystal microbalance (EQCM), which measures the mass change arising from the
compositional changes in the porous electrode during charging/discharge, has recently been
involved in investigating the EDL charging mechanism. The first demonstration of applying
EQCM in the study of adsorption/desorption mechanism was initiated by Aurbach’s group [14]
.
In this work, different porous and non-porous carbons have been deposited on the quartz of

Chapter IV: In-situ EQCM Study on Ion Dynamics in Confined Carbon Micropores
112
EQCM and tested in different aqueous electrolytes. Other factors (amount of carbon deposit,
scan rate of cyclic voltammetry, etc) have also been studied. The results have proved the
validity of using EQCM as an electrogravimetric probe to study the concentration and
compositional changes in porous carbon during its charging and discharging. Further study
using a commercial activated carbon in organic electrolytes was conducted by the same group
[15]. By varying the cation size of the salts (from small Li
+ to bulky quaternary ammonium
cations), ion-sieving effect was observed, and the carbon perm-selective behavior was
discussed. Depending on the degree of carbon polarization, different charging phenomena of
NEt4BF4/PC in porous carbon have been observed/proposed by EQCM (Figure IV-1):
ion-mixing at low polarization (zone I), ion adsorption without their solvation shell (zone II),
and pore expansion (Figure III). Furthermore, the cation solvation numbers can be calculated
from EQCM data: the lithium solvation number was found to be 3 PC molecules, smaller than
its bulk solvation number. Ion partial desolvation has been observed in a quantitative manner.
Figure IV-1: CVs of a carbon-coated quartz crystal electrode in 0.1 and 0.025 M TEABF4/PC solutions (A), and the related treated EQCM responses, Γ vs Q (B). Three domains with the characteristic different Γ/Q slopes for the 0.025 M solution are indicated. The slope within domain II (the broken blue line) is equal to the theoretical slope of the broken red straight line calculated from the Faraday law.
[15]

Chapter IV: In-situ EQCM Study on Ion Dynamics in Confined Carbon Micropores
113
These results have clearly shown that EQCM allows direct monitoring the ion fluxes
during charging/discharging of the carbon porous electrode, thus making it a promising in-situ
electrochemical technique for studying the charging mechanism and ion transport in the
electric double layer. The adsorption/desorption mechanism and solvation environment have
then been intensely studied by the same group using EQCM technique since their pioneer
work [16-18]
, however, most of the studies are performed with commercial activated carbons in
aqueous or organic electrolytes with the presence of solvents. Because of the large pore size
distribution of the porous carbon used, it was difficult to link pore size to local solvation
number and molecular information during charging/discharging. The charging mechanism and
dynamics in a solvent-free environment has not been investigated, either. In view of this, we
are thus interested in using the powerful electrogravimetric EQCM to study carbon-derived
carbides with controlled, narrow pore size distribution in neat and solvated ionic liquids.
Previous studies using carbide-derived carbons with different pore sizes in neat
1-Ethyl-3-methylimidazolium bis(trifluoromethanesulfonyl)imide (EMI-TFSI) ionic liquid
electrolyte showed that the maximum capacitance was achieved when the carbon pore size was
close to that of the adsorbing ions of the electrolyte (Figure IV-2).[19]
Further study extended the
experiments on CDCs in 2M EMI-TFSI dissolved in acetonitrile (AN) to understand the
solvation effect onto the ion adsorption in porous carbons.[20]
It was found that cation and anion
adsorption showed different electrochemical signature when decreasing the carbon pore size
below 1 nm: the capacitive behavior was kept for pore size between 0.74 nm ~ 1 nm during
EMI+ cation adsorption (Figure IV-3a) while severe asymmetrical distortion of CVs was
observed for pore size smaller than 0.8 nm for TFSI− anion adsorption (Figure IV-3b). From
Figure IV-3 and considering that the calculated ion sizes in longest dimension are 0.76 and 0.79
nm for EMI+ cation and TFSI
− anion, desolvation was observed for both anion and cation
adsorption, and the effective sizes of adsorbed ions were found to decrease in the order: TFSI−
in AN > EMI+ in AN > EMI
+ TFSI
−. Furthermore, it has also been found that TFSI
− anion
adsorption in the pores was a diffusion-controlled process because of the lack of accessibility
due to size effect.
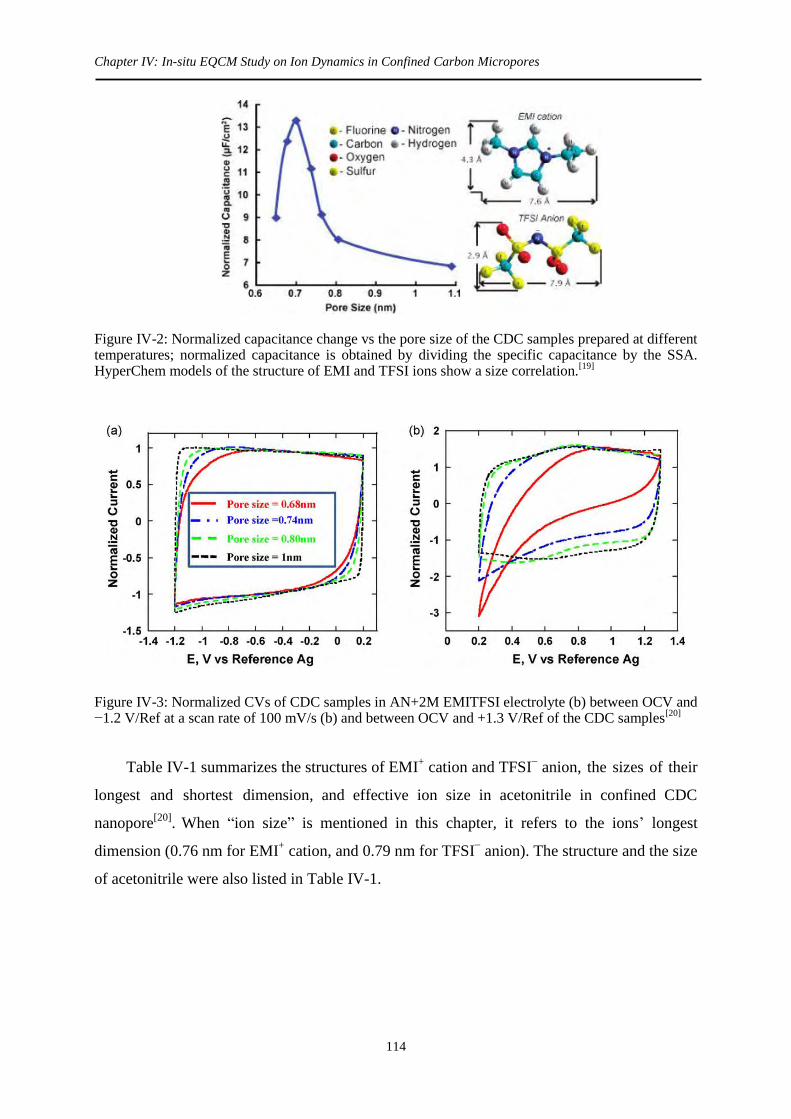
Chapter IV: In-situ EQCM Study on Ion Dynamics in Confined Carbon Micropores
114
Figure IV-2: Normalized capacitance change vs the pore size of the CDC samples prepared at different temperatures; normalized capacitance is obtained by dividing the specific capacitance by the SSA. HyperChem models of the structure of EMI and TFSI ions show a size correlation.
[19]
Figure IV-3: Normalized CVs of CDC samples in AN+2M EMITFSI electrolyte (b) between OCV and −1.2 V/Ref at a scan rate of 100 mV/s (b) and between OCV and +1.3 V/Ref of the CDC samples
[20]
Table IV-1 summarizes the structures of EMI+ cation and TFSI
− anion, the sizes of their
longest and shortest dimension, and effective ion size in acetonitrile in confined CDC
nanopore[20]
. When “ion size” is mentioned in this chapter, it refers to the ions’ longest
dimension (0.76 nm for EMI+ cation, and 0.79 nm for TFSI
− anion). The structure and the size
of acetonitrile were also listed in Table IV-1.

Chapter IV: In-situ EQCM Study on Ion Dynamics in Confined Carbon Micropores
115
Table IV-1: Structure and size of the EMI+ cation, TFSI− anion and acetonitrile (AN) solvent
Ions Structure* Size max/min
length (nm) [19,21]
Effective ion size
in AN (nm) [20]
EMI+
0.76/--- ~ 0.7
Side view
TFSI−
0.79/0.37 > 0.75
AN
0.58/0.40 ---
*Molecular structures were drawn by using ChemSketch Freeware
Here, to further obtain the detail picture of the fundamental charging mechanism in
confined environment, in-situ EQCM was used to study the same electrolytes at room
temperature. In this chapter, neat EMI-TFSI ionic liquid and 2M EMI-TFSI dissolved in
acetonitrile (AN) and microporous CDCs with large (1 nm) and small (0.65 nm) pore sizes have
been used to study both the influence of the presence of solvent and the impact of the carbon
pore size.

Chapter IV: In-situ EQCM Study on Ion Dynamics in Confined Carbon Micropores
116
Carbide-derived carbons (CDCs)
The two titanium carbide derived carbons (TiC-CDCs) used in this study were purchased
from YCarbon Inc (USA). The as-received CDC carbons are characterized from Ar sorption
isotherm measured at 77 K with Micromeritics ASAP 2020 porosimetry analyser, and the pore
size distributions (PSD) were calculated from the isotherm by using Quenched Solid Density
Functional Theory (QSDFT) method assuming a slit pore geometry.
CDC-0.65nm
The CDC-0.65nm was obtained at chlorination temperature of 400 °C. The Ar sorption
isotherm (77K) and PSD obtained from QSDFT methods of the as-received CDC-0.65nm
were shown in Figure IV-4. The calculated BET SSA is 1023 m2/g, and the average pore size
is 0.65 nm.
Figure IV-4: Porosity Characteristics of the as-received CDC-0.65nm carbon: (a) Ar sorption isotherm collected at 77K and (b) pore size distribution calculated from QSDFT model
CDC-1nm
The CDC-1nm was obtained at chlorination temperature of 1100 °C. Figure IV-5 shows
the Ar sorption isotherm measured at 77K and PSD obtained from QSDFT methods of the
as-received CDC-1nm carbon samples. The average pore size and the calculated BET SSA
are 1 nm and 1542 m2/g, respectively. The presence of mesopores is due to the high
chlorination temperature (> 1000 °C), as reported by Dash et al [22]
.

Chapter IV: In-situ EQCM Study on Ion Dynamics in Confined Carbon Micropores
117
Figure IV-5: Porosity Characteristics of the as-received CDC-1nm carbon: (a) Ar sorption isotherm collected at 77K and (b) pore size distribution calculated from QSDFT model
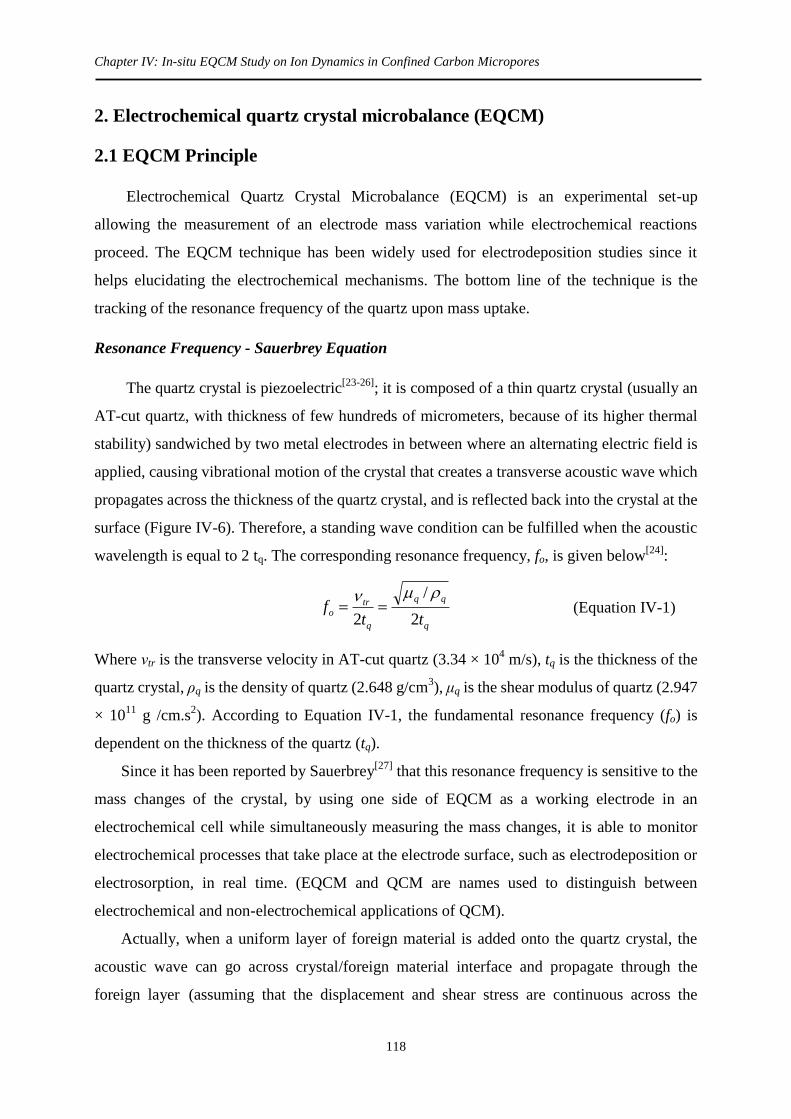
Chapter IV: In-situ EQCM Study on Ion Dynamics in Confined Carbon Micropores
118
2. Electrochemical quartz crystal microbalance (EQCM)
2.1 EQCM Principle
Electrochemical Quartz Crystal Microbalance (EQCM) is an experimental set-up
allowing the measurement of an electrode mass variation while electrochemical reactions
proceed. The EQCM technique has been widely used for electrodeposition studies since it
helps elucidating the electrochemical mechanisms. The bottom line of the technique is the
tracking of the resonance frequency of the quartz upon mass uptake.
Resonance Frequency - Sauerbrey Equation
The quartz crystal is piezoelectric[23-26]
; it is composed of a thin quartz crystal (usually an
AT-cut quartz, with thickness of few hundreds of micrometers, because of its higher thermal
stability) sandwiched by two metal electrodes in between where an alternating electric field is
applied, causing vibrational motion of the crystal that creates a transverse acoustic wave which
propagates across the thickness of the quartz crystal, and is reflected back into the crystal at the
surface (Figure IV-6). Therefore, a standing wave condition can be fulfilled when the acoustic
wavelength is equal to 2 tq. The corresponding resonance frequency, fo, is given below[24]
:
q
q
tro
ttf
2
/
2
(Equation IV-1)
Where νtr is the transverse velocity in AT-cut quartz (3.34 × 10⁴ m/s), tq is the thickness of the
quartz crystal, ρq is the density of quartz (2.648 g/cm3), μq is the shear modulus of quartz (2.947
× 1011
g /cm.s2). According to Equation IV-1, the fundamental resonance frequency (fo) is
dependent on the thickness of the quartz (tq).
Since it has been reported by Sauerbrey[27]
that this resonance frequency is sensitive to the
mass changes of the crystal, by using one side of EQCM as a working electrode in an
electrochemical cell while simultaneously measuring the mass changes, it is able to monitor
electrochemical processes that take place at the electrode surface, such as electrodeposition or
electrosorption, in real time. (EQCM and QCM are names used to distinguish between
electrochemical and non-electrochemical applications of QCM).
Actually, when a uniform layer of foreign material is added onto the quartz crystal, the
acoustic wave can go across crystal/foreign material interface and propagate through the
foreign layer (assuming that the displacement and shear stress are continuous across the

Chapter IV: In-situ EQCM Study on Ion Dynamics in Confined Carbon Micropores
119
interface). Assuming that the foreign material has the same acoustic properties as quartz crystal,
then the foreign layer can be simply treated as a thickness increment of the quartz (shown in
Figure IV-6) [24]
.
Figure IV-6: Schematic of the transverse shear wave in quartz crystal (re-plotted from reference
[24])
The thickness change leads to a frequency change, and the relation is given as following
equation:
tr
o
qo
tf
t
t
f
f
2 (Equation IV-2)
Where the Δt and Δf are the fractional changes in thickness and frequency respectively.
Applying that Δt = Δm/ρq.A based on previous assumption, and appropriate substitution of
Equation IV-1 and Equation IV-2 gives the Sauerbrey Equation (Equation IV-3) [24,27]
:
fCff
Am f
o
22
(Equation IV-3)
Where Δm is the mass change, A the piezoelectrically active area, and Cf is the sensitivity factor
(ng/Hz) of the crystal (referred to as the “calibration constant” when it is determined through
the calibration procedure which will be discussed later in the chapter) Studies have shown that
this sensitivity factor of the crystal is approximately Gaussian: the maximum mass sensitivity is
in the center of the quartz crystal and it tapers off towards the edge. Therefore, the larger the
quartz surface, the more stable the signal [28-30]
.
The Sauerbrey relationship is the key equation to convert the frequency change to mass
changes during electrochemical process. However, it should be noted that Sauerbrey equation is
valid under the assumption that the deposited layer is an ideal rigid film, and the mass loading
should not exceed 2% of the mass of the crystal since the relative “non-ideal” contribution of
the foreign layer to the overall composite resonator increases.

Chapter IV: In-situ EQCM Study on Ion Dynamics in Confined Carbon Micropores
120
Electrical Equivalent Circuit
A convenient way for studying the electroacoustical/electromechanical behavior of the
QCM is through its electrical equivalent circuit. The Butterworth-Van Dyke (BVD) equivalent
circuit is a typical model used to describe an unperturbed (without mass or liquid loading)
quartz resonator, as shown in Figure IV-7: here in the series branch, L1 represents the inertial
component related to the displaced mass during oscillation (analogous to a purely mechanical
model of a mass attached to a spring of compliance), C1 represents the energy stored during
oscillation (elasticity of the quartz and surrounding medium), and R1 represents the energy
dissipated during oscillation (damping coming from viscosity and the mounting of the quartz).
This series branch is commonly referred as the motional branch since it is the segment which
defines the electromechanical characteristics (vibrational motion) of the quartz resonator. Co,
parallel branch, arises from the electrical capacitance of the quartz sandwiched between the
electrodes on both faces of the quartz.
Figure IV-7: Butterworth-Van Dyke (BVD) equivalent circuit for an unperturbed quartz crystal microbalance (re-plotted from reference
[24])
Since the piezoelectric quartz resonator couples the mechanical displacement and
electrical potential, the mechanical interaction between the quartz crystal and contacting media
(e.g. foreign deposit layer or immersing in a liquid) will influence the electrical characteristics
of the QCM, particularly the quality factor. Therefore, when a thin film is deposited on the
quartz crystal and the quartz resonator is immersed in a liquid media (which is the case for
electrochemical studies), not only the mass loading of the deposit film, but also the liquid
density (L) and dynamic viscosity (L) will affect the resonance frequency value. In general,
immersing the QCM in a liquid results in a decrease in frequency arise from the additional
mass of vibrating liquid (represent as LL in the equivalent circuit in Figure IV-8) [31- 34]
, which

Chapter IV: In-situ EQCM Study on Ion Dynamics in Confined Carbon Micropores
121
is dependent upon the viscosity and density of the liquid as described by Kanazawa’s equation
[31]:
LLqff
2/3 (Equation IV-4)
Where fq is the resonance frequency of unloaded crystal in Hz, q is density of quartz (2.648 x
103 kg/m
3), q is shear modulus of quartz (2.974x10
10 Pa), L is density of the liquid in kg/m
3,
and L is viscosity of the liquid in Pa.s.
The immersion of QCM in a liquid medium also results in an increase in motional
resistance caused by the power dissipation of the shear wave that radiates into the liquid
(damping of the resonance). The increase in motional resistance and the mean decay length of
the shear wave into the liquid (at the interface) is defined by Equation IV-5 and Equation
IV-6:
2
26
3
2/3
)(32
)(2
eAffR
qr
(Equation IV-5)
sL
LDL
2
(Equation IV-6)
Where R (shown as RL in the modified BVD equivalent circuit Figure IV-8) is the change in
series resistance due to the quartz immersion in the liquid in , Ar is the active are of the quartz
(for Maxtek 1-inch quartz is 3.419∙105 m
2), e26 is the piezoelectric constant for an AT-cut quartz
(0.095 kg/sec2/V), LD is the decay length in m, and s = Angular frequency at series resonance
(2f). As indicated by Equation IV-4 to 6, when immersing a quartz resonator in a liquid, the
higher the liquid viscosity, the higher the mass loading on the quartz, the higher the series
resistance, and the higher the decay length.
Furthermore, if the deposit layer is a viscoelastic polymer film, then except for the
parameters just mentioned, the density (f), viscosity (f), and elasticity (f) of the film material
will also affect the resonance frequency. Figure IV-8 depicts a modified BVD model of a quartz
resonator coated with a viscoelastic polymer film and immersed in a liquid. Asides from above
mentioned factors, the microscopic surface roughness of the electrode also plays a role when
immersing in the liquid since the liquid that trapped in the surface cavities will lead to an

Chapter IV: In-situ EQCM Study on Ion Dynamics in Confined Carbon Micropores
122
additional mass component.
Figure IV-8: Modified Butterworth-Van Dyke (BVD) equivalent circuit for a quartz crystal coated with viscoelastic polymer film and immersed in a liquid (re-plotted from reference
[24])
Validation of the Sauerbrey Equation
Owning to the complex electroacoustic behavior of a film-coated quartz resonator
immersed in a liquid, it is important to validate the use of Sauerbrey equation (Equation IV-3)
by verifying the frequency change only originates from gravimetric nature rather than other
causes. In our case, the concept is rather simple: carbon electrode is deposited on the quartz
prior to its immersion in the electrolytes; during electrochemical measurements, the only
incident involved is the electrolytic ions entering or leaving the porous electrode hence
resulting in a mass change observed by EQCM. Other unwanted events in the supercapacitors,
such as redox reaction or electrode film swelling, will either generate local stress/strain or
change in the local acoustic properties hence giving rise to a change in motional resistance
which is linked to the quality factor of the QCM. In this study, an EQCM (Maxtek, USA)
allows tracking of the QCM motional resistance in real time together with the resonance
frequency, which offers important information on the validation of the Sauerbrey equation
during electrochemical incidents.

Chapter IV: In-situ EQCM Study on Ion Dynamics in Confined Carbon Micropores
123
2.2 EQCM set-up
Figure IV-9 depicts a simple schematic for a typical EQCM apparatus[24,35]
: Generally, a
computer interfaces to both electrochemical instrumentation and the frequency instrumentation,
and it simultaneously conducts the electrochemical tests and measures the frequency response.
Comparison of both data provides information about film deposition and dissolution, surface
morphology changes, and mass changes in thin films caused by redox or other chemical
processes.
Figure IV-9: Schematic of EQCM apparatus (re-plotted from reference
[24])
In this work, Maxtek 1-inch-diameter AT-cut quartz crystals were used for all the EQCM
measurements. The large surface of these quartz crystals (1-inch diameter) allows enough
distance between the active area of the crystal and the mounting area, which improves the
overall stability of the quartz by reducing the frequency changes due to the mounting stress
[28-30]. Sauerbrey equation (Equation IV-3) shows that the higher the fundamental quartz
resonance frequency (fo), the higher the sensitivity of the microbalance hence the smaller the
detectable mass. Nevertheless, a fundamental frequency of 5 MHz was chosen for our study
since a carbon electrode layer is deposited on the quartz as working electrode of
supercapacitor, which disturbs the quartz resonance and make it difficult to obtain stable and
neat frequency signal. Therefore, quartz crystals with higher fundamental quartz frequency
are too sensitive for our application. Another advantage of choosing lower fundamental
frequency is that the quartz is thicker (333 m) as compared to quartz with higher
fundamental frequency (e.g. 185 m for 9 MHz) hence less fragile and larger active area is

Chapter IV: In-situ EQCM Study on Ion Dynamics in Confined Carbon Micropores
124
allowed.
Both sides of the quartz crystal were patterned with polished gold electrodes (as shown
in Figure IV-10a[33]
, and titanium was chosen as adhesion layer between gold and quartz
crystal due to its electrochemical stability in our system. The diameters of front electrode
which is in contact the electrolyte and rear electrode are 1/2 and 1/4 inch, respectively. The
electrochemical active area is the area of front electrode (1.37 cm2), and the measured current
and mass change shown in this chapter are normalized by this area.
Figure IV-10: Maxtek quartz crystal: (a) crystal electrode patterns and (b) quartz crystal with carbon deposition (CDC-0.65nm)
As mentioned previously, to be able to apply Sauerbrey equation (Equation IV-3) for
converting frequency change into mass change, the carbon deposition has to be uniform, rigid
and thin. Therefore, the amount of carbon deposited on the quartz crystal cannot be too high,
but at the same time sufficient to acquire reliable electrochemical data. The optimized mass
loading of the carbon deposition on the quartz is around 20 - 60 μg/cm2. Figure IV-10b shows
an example of a carbon-coated quartz crystal. Moreover, as mentioned in previous section, the
motional resistance of the quartz represents the energy dissipated during oscillation and is
related to the electroacoustic properties of the QCM and the contacting medium is also
tracked in different stages of the experiments, and will be discussed later in section IV-3.1.
The EQCM three-electrode cell was prepared as follow: Slurry composed of 80 - 90 wt
% of active electrode materials and 10 - 20 % of polyvinylidene fluoride (Arkema, CAS
#24937-79-9) in N-Methyl-2-pyrrolidone (Sigma-Aldrich, CAS #872-50-4) was prepared and
dripped on the quartz. The carbon-coated quartz was then dried in 60°C oven overnight, and
mounted in a Teflon quartz holder. The electrochemical cell was assembled in a glove box
under argon atmosphere (oxygen and water content < 1 ppm) at room temperature by using

Chapter IV: In-situ EQCM Study on Ion Dynamics in Confined Carbon Micropores
125
the carbon-coated quartz as working electrode, platinum-coated titanium mesh as counter
electrode and a silver wire as a quasi-reference electrode, as shown in Figure IV-11. Maxtek
RQCM system combined with Metrohm Autolab Potentiostats / Galvanostats (Autolab
PGSTAT101) was used for simultaneous EQCM and electrochemical measurements. After
the cell was assembled, prior to electrochemical measurements, cyclic voltammetry at 10
mV/s was launched for few cycles until stable EQCM signals were obtained.
Figure IV-11: Schematic of EQCM set-up
2.3 Calibration (sensitivity constant, Cf)
To apply Sauerbrey equation for converting the shift of the quartz resonance
frequency (Δf) into mass change (Δm) on the quartz electrode, the calibration constant
(sensitivity factor, Cf) is needed. The sensitivity factor, Cf, was obtained by carrying out a silver
electroplating under constant current (chronopotentiometry @ -0.18mA/cm2) on a bare quartz
soaked in electrolytic solution containing 0.01 M silver nitrate and 0.1 M tetraethylammonium
tetrafluoroborate in acetonitrile. The frequency response recorded by EQCM during silver
electroplating was shown in Figure IV-12.

Chapter IV: In-situ EQCM Study on Ion Dynamics in Confined Carbon Micropores
126
Figure IV-12: EQCM calibration by conducting silver electroplating under constant current: (a) frequency change versus time, and (b) frequency change versus mass change
The mass of silver deposit (m) was calculated by applying Faraday’s law (Equation IV-7),
assuming a 100% faradic efficiency:
Fn
MtI
Fn
MQm ww
(Equation IV-7)
Where Q is the charge stored on the electrode in Coulomb, I is the current in Ampere, t is the
time in seconds, Mw is the molecular weight of silver (107.9 g/mol), F is the Faraday Constant
(96485 C/mol), and n is the valence number of the ion (in this case it is one for silver ion).
Figure IV-12a then can be re-plotted into frequency change versus mass change (Figure
IV-12b). The calibration constant Cf was then determined from the slope of Δf versus Δm
curve. The value of the calibration constant used in this work is 13.8 ng/Hz/cm2.
2.4 Theoretical mass change, apparent molecular weight, and solvation
number
Theoretical Mass Change (mTheo)
From cyclic voltammogram, the charge stored on the electrode can be calculated by
integration of the current versus time. If we consider that one electrical charge stored on the
electrode corresponds to one counter-ion adsorption (assuming 100 % efficiency), the
theoretical mass change (mTheo), caused by this amount of ion adsorption, could be obtained

Chapter IV: In-situ EQCM Study on Ion Dynamics in Confined Carbon Micropores
127
by applying Faraday’s Law (Equation IV-8):
Fn
MtI
Fn
MQm ww
Theo
(Equation IV-8)
Where Q is the charge passed through the electrode in Coulomb, I is the current in Ampere, t is
the time in seconds, Mw is the molecular weight of EMI+ (111 g/mol) or TFSI
− (280 g/mol), F is
the Faraday Constant (96485 C/mol), and n is the valence number of the ion, which is one for
both cation and anion in this case. Both mass change and charge change are normalized by the
electrochemical active area of the quartz (1.27cm2).
Apparent Molecular Weight (Mw’)
As EQCM measures the mass change during electrochemical tests and the amount of
electronic charge stored can be calculated from current, further plotting mass change (Δm)
versus charge (ΔQ), one can obtain more quantitative information from EQCM: the apparent
molecular weight (Mw’) of the species that interact with the electrode during electrochemical
measurements could be calculated from the slope of the experimental Δm-ΔQ curve by the
following equation (derived from Faraday’s Law):
Q
m
nF
M w '
(Equation IV-9)
Acetonitrile Solvation Number (n)
As the apparent molecular weight of the species that interact with the electrode during
electrochemical measurements can be determined, the acetonitrile solvation number can thus be
calculated by the following equation:
)(
)('
ANw
ionbareww
M
MMn
(Equation IV-10)
where Mw(bare ion) and Mw(AN) are the molecular weight of ions and acetonitrile, respectively.

Chapter IV: In-situ EQCM Study on Ion Dynamics in Confined Carbon Micropores
128
3. In-situ EQCM study of charge mechanism and the solvation effect at the
electrode/electrolyte interface
3.1 Different experimental parameters
In this chapter, CDC-1nm and CDC-0.65nml will be studied with neat and solvated ionic
liquid (EMI-TFSI) under potentiodynamic condition (cyclic voltammetry at 10 mV/s) with
simultaneous quartz resonance frequency record. Before discussing EQCM results, there are
few points need to be clarified. The potential of zero charge (PZC) is close to the open-circuit
voltage (OCV) in each experiment conducted in this chapter ( 50 mV). In each experiment, the
system was studied with three different potential ranges: individually above and below its
open-circuit voltage (OCV), and the full electrochemical window range. Cycling the carbon
electrode only above or only below OCV means the electrode is polarized in only one direction
at one time; whereas charging the electrode in the full window, the electrode undergoes
alternatively positive and negative polarization. Figure IV-13 compares the CVs and EQCM
frequency responses between separate and full potential window. Both electrochemical and
frequency responses showed exactly the same behavior, indicating that, under the applied scan
speed, there is no difference in charging mechanisms between polarization held in the same
direction or alternating direction. For simplicity’s sake, only separate polarizations above and
below OCV will be shown and discussed in this chapter.
Figure IV-13: CVs and simultaneous frequency record from EQCM conducted (a) individually above and below its open-circuit voltage, and (b) with full potential window

Chapter IV: In-situ EQCM Study on Ion Dynamics in Confined Carbon Micropores
129
Except for the fundamental reason mentioned previously in section IV-2.1 (validation of
Sauerbrey equation), the motional resistance is important also for technical reason: high
motional resistance results in the broadening of the resonance frequency peak, hence making it
difficult for the EQCM apparatus to read accurate frequency value so increasing the noise. The
motional resistance of an as-received Maxtek polished quartz (measured under air) is
generally between 5 to 15 , and it was controlled to be less than 100 Ω (measured under air)
for a carbon deposited quartz. Beyond this value, no consistent measurement is achievable.
The motional resistance was further tracked and investigated after immersion in the
liquid electrolytes (neat and acetonitrile (AN)-solvated EMI-TFSI). Here, as the 2M
EMI-TFSI/AN may not be an ideal solution, motional resistances were estimated (calculation
made from Equation IV-5) for two extremes: pure salt (EMI-TFSI in this case) and pure
solvent. According to Equation IV-5, when immersing a non-coated quartz resonator in the
liquid, the motional resistance increases are calculated to be ~2200 and ~592 for neat
EMI-TFSI ionic liquid and pure AN, respectively. Therefore, the motional resistance of a
non-coated quartz immersed in the high concentration 2M EMI-TFSI/AN is expected to be in
between these two values. The motional resistance of CDC carbon-coated quartz measured in
both electrolytes situate in the range of 1700 2500 , which is a reasonable value if taking
into account the carbon deposit layer.
In all the results shown in this chapter, the motional resistance during supercapacitor
charging/discharging is stable and only exhibits a change less than 50 during cycling. An
example, using CDC-1nm tested in the viscous neat EMI-TFSI, is shown in Figure IV-14
where resonance frequency changes with potential polarization and the motional resistance is
kept almost constant during cycling. This indicates that the carbon electrode is stable on the
quartz in the electrolyte and the frequency change is originated from gravimetric events (ion
adsorption/desorption), hence the use of Sauerbrey equation to convert frequency change into
mass change is valid.

Chapter IV: In-situ EQCM Study on Ion Dynamics in Confined Carbon Micropores
130
Figure IV-14: Change of resonance frequency (f) and motional resistance (R) during one cycle versus potential after stabilization for CDC-1nm in neat EMI-TFSI
3.2 Neat EMI-TFSI
3.2.1 CDC-1nm
The Cyclic voltammograms (CVs) and EQCM results of CDC-1nm tested at room
temperature in neat EMI-TFSI is presented in Figure IV-15. For studying the individual
contribution anion and cation, results were collected in two different potential ranges in each
experiment in this chapter: starting from the open-circuit voltage (OCV) vs silver quasi-
reference indicated with purple dots in the figure, the potential was scanned negatively down to
negative potential values (Figure IV-15a) or up to positive potential values (Figure IV-15b).
CVs are presented in dashed line and frequency responses are presented in solid line, and the
different colors indicate the ion charging (orange curves) and discharge (blue curves).
According to Sauerbrey’s equation (Equation IV-3), the frequency response (Δf) decreases
when the electrode mass (Δm) increases. For visual convenience, negative frequency responses
(-Δf), proportional to m, are shown in the Figure. In all the following tests, the electrochemical
potential windows were found to be smaller than those of previously reported using
conventional CDC film electrodes (3V for neat EMI-TFSI and 2.5V for 2M EMI-TFSI/AN).[20]
It is mainly due to the small amount of carbon deposited on the quartz (20 - 45 μg/cm2) as
compare to the carbon loading of conventional supercapacitors (about 10 mg/cm2), thus
exalting the electrochemical activity of the electrolyte on the Au electrode at highly positive or
negative potentials..
-100
-80
-60
-40
-20
0
20
-20
-10
0
10
20
-0.5 0 0.5 1
f
(Hz)
R
()
E (V) vs Ag

Chapter IV: In-situ EQCM Study on Ion Dynamics in Confined Carbon Micropores
131
Figure IV-15: CV and EQCM frequency response of CDC-1nm in neat EMI-TFSI (a) below OCV and (b) above OCV. Purple dot is where the cycle starts. Orange and blue curves indicate charge and discharge of ions, respectively.
Despite the contact between carbon deposition and the quartz is not optimized (which is
made by simple drip-coating), both Figure IV-15a and 15b exhibit a characteristic capacitive
behavior with rectangular CV profiles, thus confirming previous study[20]
conducted with the
same carbons showing that both cations and anions could freely access 1 nm pores. In Figure
IV-15a, the potential scan begins first from OCV (0.22 V) down to -0.4 V (vs Ref), and then
swept back to the OCV. The simultaneous change of the opposite of the frequency (-Δf,
proportional to the electrode weight increase) versus the potential in Figure IV-15a shows that
the mass of the electrode increased during negative scan (orange solid line) and decreased
during positive scan (blue solid line). In this potential range, the charge/discharge of the double
layer can be considered to be mainly achieved by adsorption/desorption of the cations (EMI+),
in a first approximation. Therefore, the increase of the electrode mass observed during charging
(negative scan) is associated with cation adsorption, while during desorption (positive scan),
the electrode mass decreases.
In Figure IV-15b, the potential scan was achieved from OCV up to 0.9 V (vs Ref), and
then reversed back to OCV; the quartz resonance frequency response (-Δf) first increased and
then decreased. Similarly, from Sauerbrey’s equation, the electrode mass increases during
charging (positive scan) and decreases during discharging (negative scan); the weight change
fits with the adsorption and desorption of TFSI− anions which is assumed to be responsible of
the charge balance at the carbon surface within this potential range.

Chapter IV: In-situ EQCM Study on Ion Dynamics in Confined Carbon Micropores
132
Figure IV-16 shows the change of the electrode weight (Δm) vs the charge passed in the
electrode (ΔQ) during ion charging in the cyclic voltammetry: assuming that there is zero
polarization at OCV (ΔQ = 0), and the carbon electrode was negatively polarized (ΔQ < 0)
from the OCV down to -0.4 V/Ref (Figure IV-15a) and positively polarized (ΔQ > 0) from
OCV up to 0.9 V/Ref (Figure IV-15b). The theoretical weight change, indicated as red dashed
lines in Figure IV-16, could be obtained by applying Faraday’s Law (Equation IV-8) as
discussed in Section IV-2.4. It should be noted that the theoretical mass change considers that
the charge accumulated on the electrode was compensated only by EMI+ adsorption or TFSI
−
adsorption.
Figure IV-16: Electrode mass change vs charge during the polarization of CDC-1nm in neat EMI-TFSI: Blue solid lines are Red dashed lines are the theoretical mass change of neat ions calculated from Faraday’s law. Black dashed line shows the linear fitting of measured mass change.
Furthermore, the apparent molecular weight (Mw’) of the species that interact with the
electrode during electrochemical measurements could be calculated from the slope of the
experimental Δm-ΔQ curve (by Equation IV-9, as shown in Section IV-2.4). Starting from the
OCV (ΔQ = 0), the electrode mass change increases steadily during negative polarization in
neat EMI-TFSI in CDC-1nm (Figure IV-16, domain I): there is a linear change of the electrode
mass with the negative charge accumulated on the electrode. Both the mass change and the
mean slope of the experimental plot (black dashed line) are close to those of theoretical ones

Chapter IV: In-situ EQCM Study on Ion Dynamics in Confined Carbon Micropores
133
over the whole range of charge (ΔQ). The apparent molecular weight (Mw’) of the adsorbed
species calculated from the experimental slope is 97 g/mol, close to the molecular weight of
EMI+ cation (111 g/mol), showing that in domain I, the charge in the porous electrode was
balanced mainly through cation adsorption and no co–ion seems to be involved. Such behavior
has been previously reported and described by Levi et al.[14,15]
as perm-selectivity: only the
adsorption of the counter-ion balanced the charge at the carbon electrode.
A different behavior is observed during anion adsorption (positive polarization, ΔQ > 0):
the electrode mass change first increases slowly for positive charge less than 0.3 mC/cm2
(domain II), and then reaches a constant slope for charge more than 0.3 mC/cm2 (domain III). In
the linear part of domain III (ΔQ > 0.3 mC/cm2), the calculated apparent molecular weight of
the adsorbed species is 270 g/mol, close to that of the bare anions (280 g/mol for TFSI−). This
suggests that, at high polarization, the charge storage mechanism mainly involves anion
adsorption in confined nanopores. However, at lower polarization in domain II (ΔQ < 0.3
mC/cm2), the slope of the experimental curve is less than the theoretical one corresponding to
the bare anion adsorption (red dashed line), suggesting that TFSI− anion adsorption is not the
only process involved during charging process. This behavior was already reported by Levi et
al.,[15]
and corresponds to an ion exchange zone. In this small positive polarization range, the
anions enter the nanopores while the cations are expelled from the electrode at the same time,
leading to the breaking of the perm-selectivity in the 1 nm micropores.[15,18]
Hence, the net mass
change or the apparent molecular weight observed by EQCM are less than that of theoretical
ones. Upon subsequent increase of the polarization (ΔQ > 0.3 mC/cm2, domain III), the Δm-ΔQ
curve shows that only anion transfer is observed and the perm-selectivity of the electrode is
recovered. This also shows that TFSI− anions need more energy to move, when the energy is
small (weak polarization, ΔQ < 0.3 mC/cm2), EMI
+ cations respond faster than TFSI
− anion to
compensate the charge, suggesting that EMI+ cations more mobile than TFSI
− anions in the
confined 1-nm nanopores. The difference observed between negative (cation adsorption) and
positive polarization (anion adsorption) is consistent with modelling results obtained in neat
BMI-PF6 electrolyte, which showed that more counter- and co-ions were involved during
positive polarization.[7]
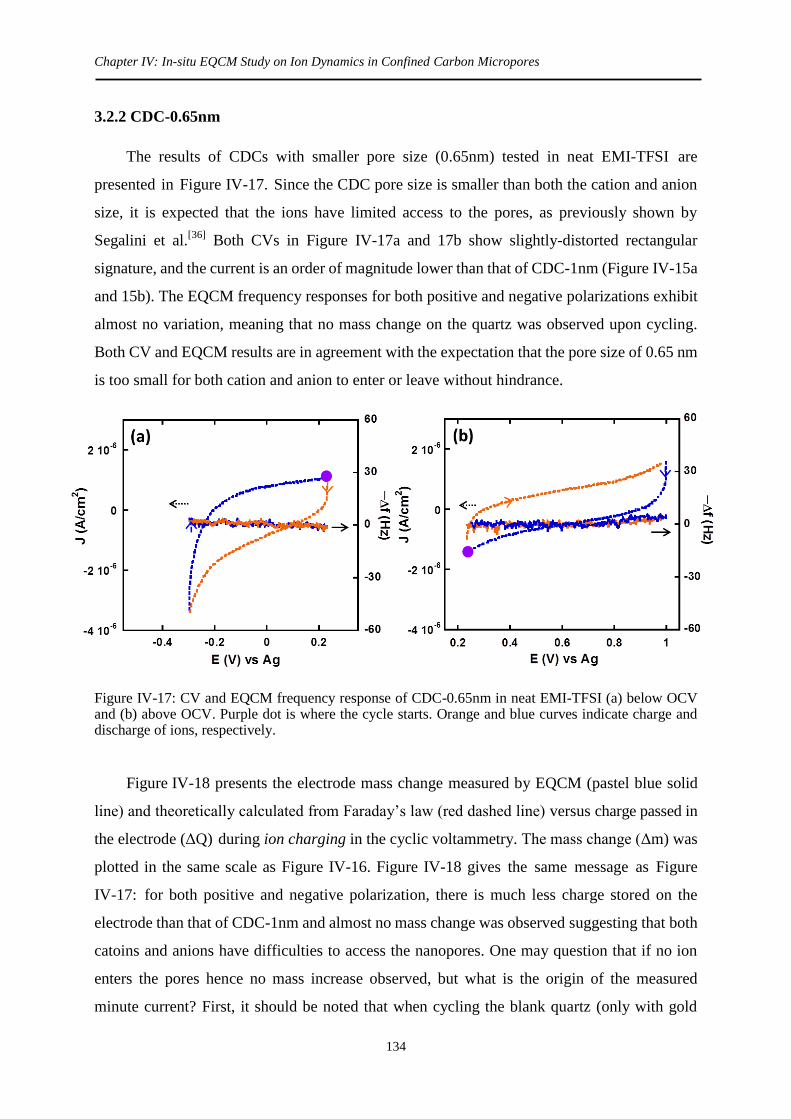
Chapter IV: In-situ EQCM Study on Ion Dynamics in Confined Carbon Micropores
134
3.2.2 CDC-0.65nm
The results of CDCs with smaller pore size (0.65nm) tested in neat EMI-TFSI are
presented in Figure IV-17. Since the CDC pore size is smaller than both the cation and anion
size, it is expected that the ions have limited access to the pores, as previously shown by
Segalini et al.[36]
Both CVs in Figure IV-17a and 17b show slightly-distorted rectangular
signature, and the current is an order of magnitude lower than that of CDC-1nm (Figure IV-15a
and 15b). The EQCM frequency responses for both positive and negative polarizations exhibit
almost no variation, meaning that no mass change on the quartz was observed upon cycling.
Both CV and EQCM results are in agreement with the expectation that the pore size of 0.65 nm
is too small for both cation and anion to enter or leave without hindrance.
Figure IV-17: CV and EQCM frequency response of CDC-0.65nm in neat EMI-TFSI (a) below OCV and (b) above OCV. Purple dot is where the cycle starts. Orange and blue curves indicate charge and discharge of ions, respectively.
Figure IV-18 presents the electrode mass change measured by EQCM (pastel blue solid
line) and theoretically calculated from Faraday’s law (red dashed line) versus charge passed in
the electrode (ΔQ) during ion charging in the cyclic voltammetry. The mass change (Δm) was
plotted in the same scale as Figure IV-16. Figure IV-18 gives the same message as Figure
IV-17: for both positive and negative polarization, there is much less charge stored on the
electrode than that of CDC-1nm and almost no mass change was observed suggesting that both
catoins and anions have difficulties to access the nanopores. One may question that if no ion
enters the pores hence no mass increase observed, but what is the origin of the measured
minute current? First, it should be noted that when cycling the blank quartz (only with gold
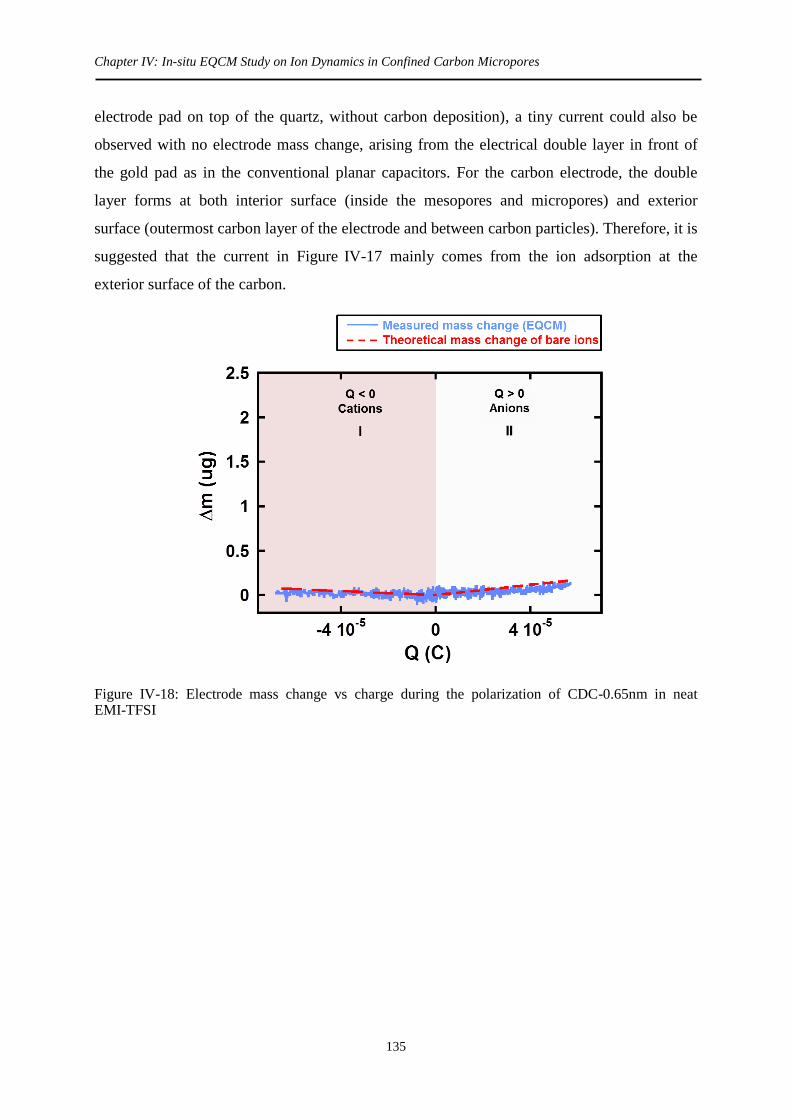
Chapter IV: In-situ EQCM Study on Ion Dynamics in Confined Carbon Micropores
135
electrode pad on top of the quartz, without carbon deposition), a tiny current could also be
observed with no electrode mass change, arising from the electrical double layer in front of
the gold pad as in the conventional planar capacitors. For the carbon electrode, the double
layer forms at both interior surface (inside the mesopores and micropores) and exterior
surface (outermost carbon layer of the electrode and between carbon particles). Therefore, it is
suggested that the current in Figure IV-17 mainly comes from the ion adsorption at the
exterior surface of the carbon.
Figure IV-18: Electrode mass change vs charge during the polarization of CDC-0.65nm in neat EMI-TFSI

Chapter IV: In-situ EQCM Study on Ion Dynamics in Confined Carbon Micropores
136
3.3 Solvated EMI-TFSI
3.3.1 CDC-1nm
The two CDC samples were also tested in 2M EMI-TFSI solvated in acetonitrile to study
the effect of solvent. First, the CVs and quartz frequency responses of CDC-1nm in solvated
EMI-TFSI are presented in Figure IV-19a and 19b. For both positive and negative polarization,
CVs exhibit capacitive behavior with nice rectangular profile, showing that both anions and
cations could access the 1 nm-pore without restraint. Regarding the frequency responses,
similar trend as in Figure IV-15 (CDC-1nm in neat EMI-TFSI) was obtained: the electrode
mass increases during cation/anion adsorption and decreases during cation/anion desorption.
Figure IV-19: CV and EQCM frequency response of CDC-1nm in 2M EMI-TFSI + AN (a) below OCV and (b) above OCV. Purple dot is where the cycle starts. Orange and blue curves indicate charge and discharge of ions, respectively.
The electrode mass change (Δm) vs charge change (ΔQ) during polarization of the
CDC-1nm electrode in solvated EMI-TFSI (Figure IV-20) shows similar results to that of neat
EMI-TFSI: three different domains could be observed. For negative charge (ΔQ < 0, domain I),
the electrode mass change increased linearly with the charge along the whole negative charge
range, and slope of the curve is much higher than that of theoretical one (red dashed line). For
positive charge (ΔQ > 0), a different behavior is observed. At the beginning of positive
polarization (domain II), the slope of the experimental Δm-ΔQ curve is almost zero and
increases with charge until 1.4 mC/cm2. The slope of the curve then keeps almost constant
after reaching 1.4 mC/cm2 (domain III). Such a behavior can only be explained by the

Chapter IV: In-situ EQCM Study on Ion Dynamics in Confined Carbon Micropores
137
existence of an cation-anion mixing zone, due to a breaking of the perm-selectivity in the
carbon micropores of 1 nm: the adsorption of counter-ions, here TFSI−, is accompanied by the
desorption of co-ions, EMI+. But whatever the charge, the slope of the experimental curve is
always less than that of theoretical curve which was obtained by considering that the charge
stored on the electrode is balanced only by neat (non-solvated) TFSI− anion adsorption.
Figure IV-20: Electrode mass change vs charge during the polarization of CDC-1nm in 2M EMI-TFSI + AN: Blue solid lines are Red dashed lines are the theoretical mass change of neat ions calculated from Faraday’s law. Black dashed line shows the linear fitting of measured mass change.
The apparent molecular weight of the adsorbed species involved in the charge storage
mechanism is proportional to the slope of the Δm-ΔQ curve and could be calculated using
Equation IV-9. For positive polarization (domain I), the calculated apparent molecular weight
is 265 g/mol which is much higher than bare EMI+ molecular weight (111 g/mol). Assuming
that the stored charge was balanced only by cations with 100% efficiency and that the
difference between these two values originates from the presence of solvent molecule
surrounding the EMI+ cation during the adsorption process, the average solvation number of the
EMI+ cations in acetonitrile can then be calculate using Equation IV-10 (Section IV-2.4). Base
on the calculation, there are 3.7 acetonitrile molecules entering the pores together with one
EMI+ cation. For negative polarization (domain III), the calculated apparent molecular weight
is around 208 g/mol, less than bare TFSI− molecular weight (280 g/mol). However, this
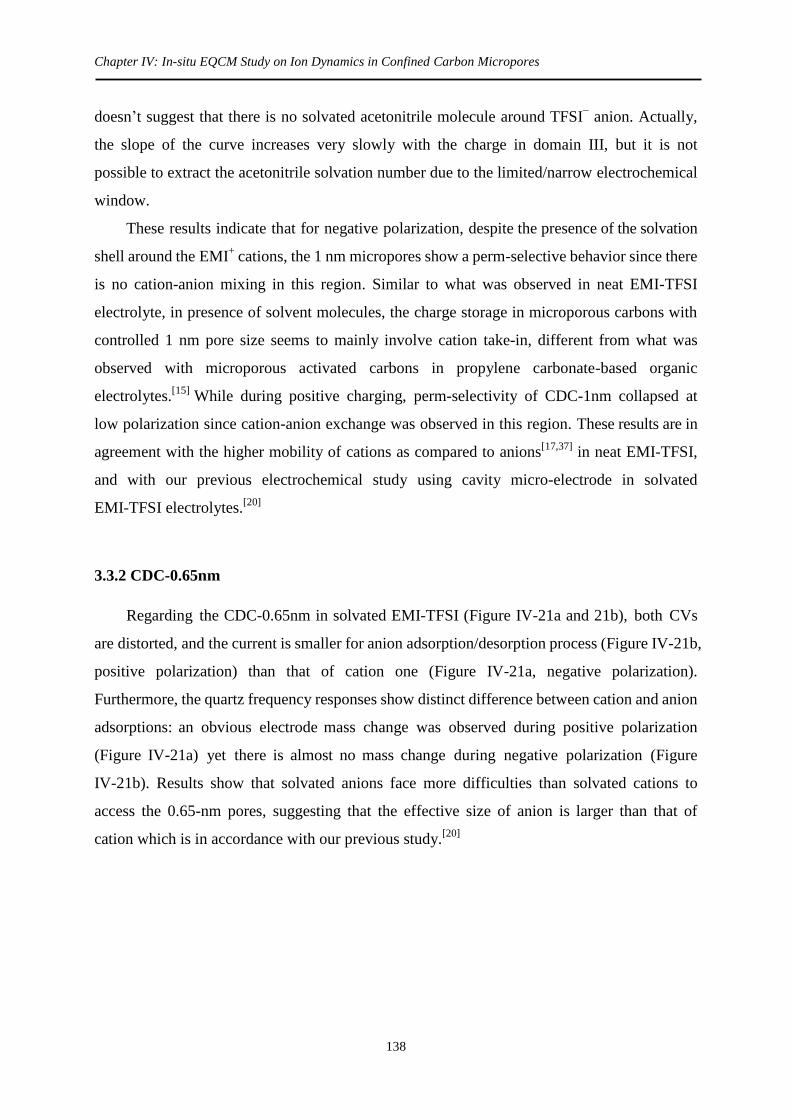
Chapter IV: In-situ EQCM Study on Ion Dynamics in Confined Carbon Micropores
138
doesn’t suggest that there is no solvated acetonitrile molecule around TFSI− anion. Actually,
the slope of the curve increases very slowly with the charge in domain III, but it is not
possible to extract the acetonitrile solvation number due to the limited/narrow electrochemical
window.
These results indicate that for negative polarization, despite the presence of the solvation
shell around the EMI+ cations, the 1 nm micropores show a perm-selective behavior since there
is no cation-anion mixing in this region. Similar to what was observed in neat EMI-TFSI
electrolyte, in presence of solvent molecules, the charge storage in microporous carbons with
controlled 1 nm pore size seems to mainly involve cation take-in, different from what was
observed with microporous activated carbons in propylene carbonate-based organic
electrolytes.[15]
While during positive charging, perm-selectivity of CDC-1nm collapsed at
low polarization since cation-anion exchange was observed in this region. These results are in
agreement with the higher mobility of cations as compared to anions[17,37]
in neat EMI-TFSI,
and with our previous electrochemical study using cavity micro-electrode in solvated
EMI-TFSI electrolytes.[20]
3.3.2 CDC-0.65nm
Regarding the CDC-0.65nm in solvated EMI-TFSI (Figure IV-21a and 21b), both CVs
are distorted, and the current is smaller for anion adsorption/desorption process (Figure IV-21b,
positive polarization) than that of cation one (Figure IV-21a, negative polarization).
Furthermore, the quartz frequency responses show distinct difference between cation and anion
adsorptions: an obvious electrode mass change was observed during positive polarization
(Figure IV-21a) yet there is almost no mass change during negative polarization (Figure
IV-21b). Results show that solvated anions face more difficulties than solvated cations to
access the 0.65-nm pores, suggesting that the effective size of anion is larger than that of
cation which is in accordance with our previous study.[20]
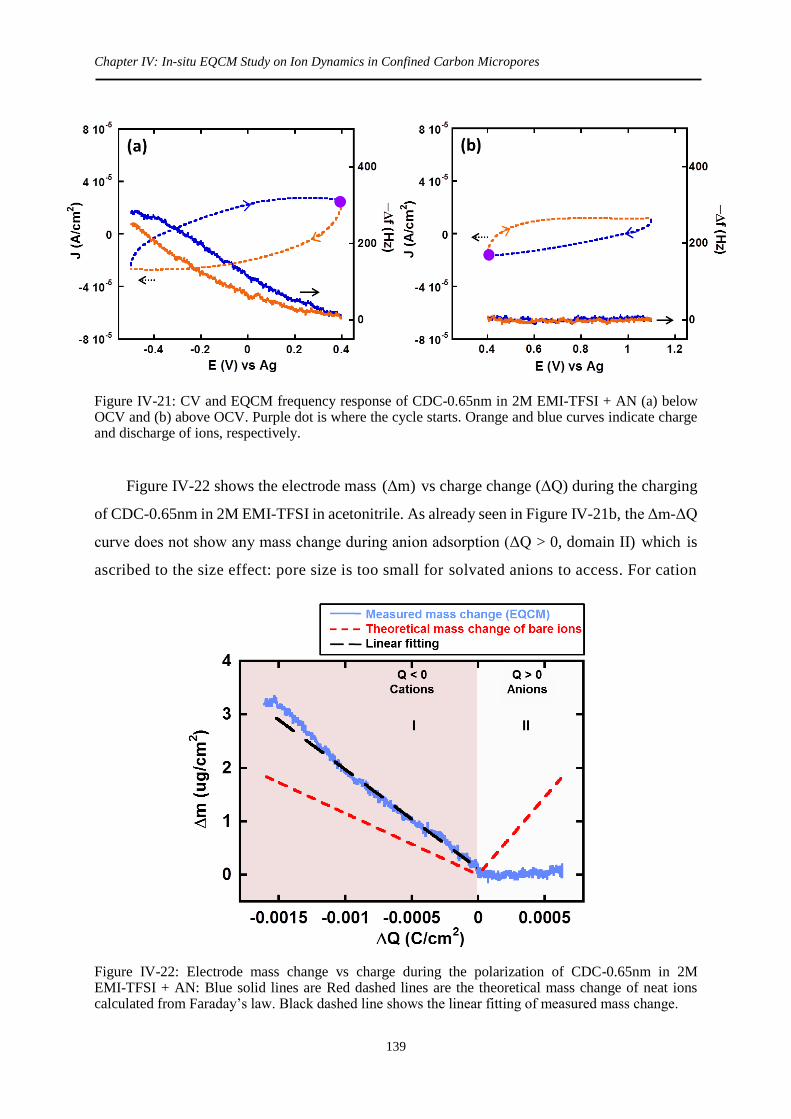
Chapter IV: In-situ EQCM Study on Ion Dynamics in Confined Carbon Micropores
139
Figure IV-21: CV and EQCM frequency response of CDC-0.65nm in 2M EMI-TFSI + AN (a) below OCV and (b) above OCV. Purple dot is where the cycle starts. Orange and blue curves indicate charge and discharge of ions, respectively.
Figure IV-22 shows the electrode mass (Δm) vs charge change (ΔQ) during the charging
of CDC-0.65nm in 2M EMI-TFSI in acetonitrile. As already seen in Figure IV-21b, the Δm-ΔQ
curve does not show any mass change during anion adsorption (ΔQ > 0, domain II) which is
ascribed to the size effect: pore size is too small for solvated anions to access. For cation
Figure IV-22: Electrode mass change vs charge during the polarization of CDC-0.65nm in 2M EMI-TFSI + AN: Blue solid lines are Red dashed lines are the theoretical mass change of neat ions calculated from Faraday’s law. Black dashed line shows the linear fitting of measured mass change.

Chapter IV: In-situ EQCM Study on Ion Dynamics in Confined Carbon Micropores
140
adsorption (ΔQ < 0, domain I), the same trend as for solvated EMI-TFSI in CDC-1nm is
observed, except that the slope of the Δm-ΔQ curve is lower. From the slope of the curve, an
average molecular weight of 179 g/mol was obtained, corresponding to a mean solvation
number of 1.6. A smaller solvation number has been found for EMI+
adsorption in the
narrower 0.65-nm pore size as compare in 1-nm pore (with solvation number of 3.7),
supporting the partial desolvation of the cations when accessing small pores.
A recent study on charge storage mechanism in confined nanoporous CDC electrodes in
another ionic liquid electrolyte (BMI-PF6) by molecular dynamic simulation shows that at null
potential (before polarizing the electrode), no ions are found into the micropores but the
acetonitrile molecules are present in all the confined pores. Under polarization, acetonitrile
molecules are replaced in the small pores with ions that can access these confined 1 nm pores by
partial desolvation, the solvation number moving from 8-9 in bulk electrolyte down to 2-3 in
confined pores,[38]
in agreement with the present experimental results.

Chapter IV: In-situ EQCM Study on Ion Dynamics in Confined Carbon Micropores
141
4. Discussions
The in-situ EQCM study using two CDCs with different pore size in neat and solvated
EMI-TFSI electrolytes has unveiled part of the charge storage mechanism in supercapacitor
electrodes, and provided some important information on ion transport and ion dynamics
during charging process. In both electrolytes, the ions encounter more difficulties in accessing
CDCs with 0.65nm-pore than that with 1nm-pore which is in good agreement with our
previous studies.Information on the compositional change in the carbon nanopores during the
electrochemical incidents could be further derived from in-situ EQCM results. Table IV-2
summarizes the calculated apparent molecular weights and the acetonitrile solvation number
in the four systems.
Table IV-2: Apparent molecular weights calculated from the experimental Δm vs ΔQ curves*
Neat EMI-TFSI (g/mol) Solvated EMI-TFSI (g/mol)
EMI
+
(111) TFSI−
(280) EMI
+
(111+n∙AN)
TFSI−
(280+n∙AN)
CDC-1nm 97 270 (high Q) 265 (n=3.7) 208 (high Q)
CDC-0.65nm - - 179 (n=1.6) -
*The apparent molecular weights regarding anion adsorption in CDC-1nm for both electrolytes
were obtained from Δm vs ΔQ curves at high polarization (high Q). n is the calculated
acetonitrile solvation number
From results of CDC-1nm in neat EMI-TFSI, it was found that negative polarization and
high positive polarization, the charge storage only involved in counter-ions (EMI+ for
negative polarization, and TFSI− for positive polarization), suggesting that the adsorption
energy is strong enough to screen ion pairing interaction between cations and anions. The
co-ions (TFSI− for negative polarization and EMI
+ for positive polarization) don’t seem to
participate in the charge storage in these regions.
For CDC-1nm in both neat and solvated EMI-TFSI electrolytes, different behaviors have
been observed between EMI+ and TFSI− adsorption, as shown in Figure IV-23 (taking neat
EMI-TFSI as example). During negative charging, only EMI+ cation adsorption is observed,
while positive charging, ion exchange was found when polarization was low. When higher

Chapter IV: In-situ EQCM Study on Ion Dynamics in Confined Carbon Micropores
142
positive polarization was applied, TFSI− anions became the dominating species that balance
the charge. The difference between cation and anion adsorption is attributed to the different
ion mobility in the system, and the ion exchange process may slow down the transport and
adsorption kinetics at the positive porous carbon electrodes.
Figure IV-23: Scheme of ion transport in 1-nm pores during different charging states (taking neat EMI-TFSI as example)
It should be noted that EQCM measures the net electrode mass change during the
electrochemical tests, but it cannot give quantitative information on each species since it
could not distinguish the weight contributed by different molecules. Therefore, regarding the
results in solvated EMI-TFSI, it is difficult to point out clearly how the solvent molecules
affect the charge storage. Do they screen the charge of counter-ions leading a less efficient
charge storage? Or does their solvation help to decrease the interaction between counter-ions
and co-ions resulting in a more efficient charge storage? The charge storage efficiency could
not be obtained since the exact amount of each ion is unknown; hence these questions were
left unanswered. Even though, since at high polarization, no ion-pairing or charge screening
by co-ions were observed during charging in confined micropores in neat EMI-TFSI, hence it
is reasonable to assume the same for solvated EMI-TFSI one net charge stored corresponds
to one single cation (100% efficiency) and further calculate the solvation numbers (Equation
IV-10). As shown in Table IV-2, by applying the same assumption on the two CDC samples,
Chapter IV: In-situ EQCM Study on Ion Dynamics in Confined Carbon Micropores
143
it has been found that the cation solvation numbers in 1nm- and 0.65nm-pore were estimated to
be 3-4 and 1-2, respectively. These numbers provide important insights into the difference in
solvation environment between CDC-1nm and CDC-0.65nm. The less solvated acetonitrile
molecules in 0.65nm-pore than in 1nm-pore signify that the ion desolvation more marked in the
smaller pores.
Hysteresis was observed in the quartz frequency response between charging and
discharging, indicating that charging and discharging involve different processes. It may
come from the different difficulties ions face to go in and depart from the micropores.
Extended experiments need to be carried out to figure out the origin of the hysteresis.
5. Conclusions
This chapter demonstrates that EQCM can serve as an electrogravimetric probe to study
compositional changes in carbon microspores during charging/discharge of supercapacitors,
thus making it a powerful tool for understanding the in-situ ion fluxes and the solvation effect.
In-situ EQCM study of CDC-1nm and CDC-0.65nm in EMI-TFSI based electrolytes has
shown that different charge storage mechanisms are involved for positive and negative
polarization.[39]
Experimental acetonitrile solvation numbers were estimated for EMI+ cation,
and partial desolvation was observed when decreasing the carbon pore size from 1 down to 0.65
nm.
Results also suggested that at high polarization under dynamic condition, one net charge
stored on the carbon electrode surface corresponds almost to one single counter-ion adsorption.
No ion-pairing or charge screening by co-ions are observed during charging in confined
micropores. These results provide important information on charge storage mechanisms.
However, to get a closer look at the EDL structure and to distinguish the contribution of each
electrolytic species, in-situ EQCM alone is insufficient as it cannot probe individual species in
the electrolytes. Therefore, in the next chapter, in-situ NMR is coupled with EQCM. The
element-selective nature of NMR technique will surely bring more fundamental insights on
EDL charging.
6. Reference
[1] J. Chmiola, G. Yushin, Y. Gogotsi, C. Portet, P. Simon, P. L. Taberna, Science 2006, 313, 1760.

Chapter IV: In-situ EQCM Study on Ion Dynamics in Confined Carbon Micropores
144
[2] J. Huang, B. G. Sumpter, V. Meunier, Chem. - Eur. J. 2008, 14, 6614. [3] R. Lin, P. L. Taberna, J. Chmiola, D. Guay, Y. Gogotsi, P. Simon, J. Electrochem. Soc.
2009, 156, A7. [4] S. Kondrat, N. Georgi, M. V. Fedorov, A. A. Kornyshev, Phys. Chem. Chem. Phys. 2011,
13, 11359. [5] Y. Shim, H. J. Kim, ACS Nano 2010, 4, 2345. [6] P. Wu, J. Huang, V. Meunier, B. G. Sumpter, R. Qiao, ACS Nano 2011, 5, 9044. [7] C. Merlet, B. Rotenberg, P. A. Madden, P.-L. Taberna, P. Simon, Y. Gogotsi, M. Salanne,
Nat. Mater. 2012, 11, 306. [8] D. Jiang, J. Wu, J. Phys. Chem. Lett. 2013, 4, 1260. [9] T. Ohba, K. Kaneko, J. Phys. Chem. C 2013, 117, 17092. [10] S. Kondrat, P. Wu, R. Qiao, A. A. Kornyshev, Nat. Mater. 2014, 13, 387. [11] H. Wang, A. C. Forse, J. M. Griffin, N. M. Trease, L. Trognko, P.-L. Taberna, P. Simon, C.
P. Grey, J. Am. Chem. Soc. 2013, 135, 18968. [12] M. Deschamps, E. Gilbert, P. Azais, E. Raymundo-Pinero, M. R. Ammar, P. Simon, D.
Massiot, F. Beguin, Nat. Mater. 2013, 12, 351. [13] F. W. Richey, B. Dyatkin, Y. Gogotsi, Y. A. Elabd, J. Am. Chem. Soc. 2013, 135, 12818. [14] M. D. Levi, G. Salitra, N. Levy, D. Aurbach, J. Maier, Nat. Mater. 2009, 8, 872. [15] M. D. Levi, N. Levy, S. Sigalov, G. Salitra, D. Aurbach, J. Maier, J. Am. Chem. Soc. 2010,
132, 13220. [16] L. Daikhin, S. Sigalov, M. D. Levi, G. Salitra, D. Aurbach, Anal. Chem. 2011, 83, 9614. [17] M. D. Levi, S. Sigalov, G. Salitra, D. Aurbach, J. Maier, ChemPhysChem 2011, 12, 854. [18] M. D. Levi, S. Sigalov, G. Salitra, R. Elazari, D. Aurbach, J. Phys. Chem. Lett. 2011, 2,
120. [19] C. Largeot, C. Portet, J. Chmiola, P.-L. Taberna, Y. Gogotsi, P. Simon, J. Am. Chem. Soc.
2008, 130, 2730. [20] R. Lin, P. Huang, J. Ségalini, C. Largeot, P. L. Taberna, J. Chmiola, Y. Gogotsi, P. Simon,
Electrochimica Acta 2009, 54, 7025. [21] C. Decaux, C. Matei Ghimbeu, M. Dahbi, M. Anouti, D. Lemordant, F. Béguin, C.
Vix-Guterl, E. Raymundo-Piñero, J. Power Sources 2014, 263, 130. [22] R. Dash, J. Chmiola, G. Yushin, Y. Gogotsi, G. Laudisio, J. Singer, J. Fischer, S.
Kucheyev, Carbon 2006, 44, 2489. [23] M. D. Ward, D. A. Buttry, Science 1990, 249, 1000. [24] D. A. Buttry, M. D. Ward, Chem. Rev. 1992, 92, 1355. [25] C. Steinem, A. Janshoff, Eds. , Piezoelectric Sensors, Springer Berlin Heidelberg, 2007. [26] A. A. Vives, Ed. , Piezoelectric Transducers and Applications, Springer Berlin
Heidelberg, Berlin, Heidelberg, 2008. [27] G. Sauerbrey, Z. Für Phys. 1959, 155, 206. [28] M. D. Ward, E. J. Delawski, Anal. Chem. 1991, 63, 886. [29] M. Rodahl, B. Kasemo, Sens. Actuators B Chem. 1996, 37, 111. [30] F. Josse, Y. Lee, S. J. Martin, R. W. Cernosek, Anal. Chem. 1998, 70, 237. [31] K. K. Kanazawa, J. G. Gordon, Anal. Chem. 1985, 57, 1770. [32] S. J. Martin, V. E. Granstaff, G. C. Frye, Anal. Chem. 1991, 63, 2272. [33] “RQCM - Quartz Crystal Microbalance Research System - INFICON,” can be found
under http://products.inficon.com/en-us/Product/Detail/CopyOf_P-RQCM?path=Products%2FResearch-QCM, n.d.
[34] M. Urbakh, L. Daikhin, Langmuir 1994, 10, 2836. [35] C. K. O’sullivan, G. G. Guilbault, Biosens. Bioelectron. 1999, 14, 663. [36] J. Segalini, E. Iwama, P.-L. Taberna, Y. Gogotsi, P. Simon, Electrochem. Commun. 2012,
15, 63. [37] A. Noda, K. Hayamizu, M. Watanabe, J. Phys. Chem. B 2001, 105, 4603. [38] C. Merlet, C. Péan, B. Rotenberg, P. A. Madden, B. Daffos, P.-L. Taberna, P. Simon, M.
Salanne, Nat. Commun. 2013, 4, DOI 10.1038/ncomms3701. [39] W.-Y. Tsai, P.-L. Taberna, P. Simon, J. Am. Chem. Soc. 2014, 136, 8722.

Chapter V:
Further understanding of the EDL
structure by combining in-situ EQCM
with in-situ NMR Spectroscopy


Chapter V: Further understanding of the EDL structure by combining in-situ EQCM with in-situ NMR
Spectroscopy
145
1. Introduction
As EQCM cannot track the individual contribution of each electrolytic species, another
in-situ technique that may offer more quantitative information of selected species is needed
for completing the charge storage puzzle. In-situ nuclear magnetic resonance (NMR)
spectroscopy is a powerful technique for studying electrochemical mechanisms[1-4]
. As the
observed resonance frequencies are sensitive to the local chemical environment, it is possible to
distinguish adsorbed and non-adsorbed species within activated carbons [5-7]
, further allowing
the amount of adsorbed (in-pore) species being quantified. This approach is also element
selective, allowing the separate observation of different chemical species in electrochemical
system. Therefore, we collaborated with Professor Clare Grey’s group (in Cambridge
University, England) whose team has been developing in-situ NMR technique to study charge
storage mechanisms and the ion dynamics inside the nanopores for supercapacitor application
since 2011[8-10]
.
In this work, YP-50F activated carbon electrodes in acetonitrile solvated
tetraethylphosphonium tetrafluoroborate (PEt4BF4) were studied by in-situ EQCM and in-situ
NMR. By choosing this salt, the PEt4 cation and BF4
anion were tracked in real time
individually by using in-situ 31
P and 19
F NMR during charging and discharging of
supercapacitor. The electrode mass change during electrochemical measurements was
monitored by EQCM to provide further information on solvation. The combination of these
two in-situ techniques is expected to provide important insight on the electric double layer
structure change during operation of supercapacitors.
Table V-1 summarizes the structures of PEt4 cation and BF4
anion and their neat and
solvated ion sizes in bulk solution. The solvated BF4 anion diameter of 1.16 nm (mentioned in
the literature [11]
) is based on the value determined using the Cerius 3.8 program. This assumes
a single solvation shell comprising 9 acetonitrile molecules. For the PEt4 cation, no literature
data for the solvated ion diameter is available. However, a recent publication by Matsumoto et
al. provides crystallographic data for PEt4BF4 salt, giving a desolvated cation diameter of 0.72
nm[12]
. Assuming the thickness of the solvation shell to be the same as that for the
tetraethylammonium (NEt4) cation (calculated in Ref 7 to be 0.32 nm for a solvation shell
comprising 7 acetonitrile molecules), the solvated PEt4 cation diameter is thus estimated to be
1.35 nm.

Chapter V: Further understanding of the EDL structure by combining in-situ EQCM with in-situ NMR
Spectroscopy
146
Table V-1: Structure of the electrolytic species, neat and solvated size of the PEt4+ cation and BF4
−
anion, and the acetonitrile solvation number in bulk electrolyte
Ions Structure Size max/min
length (nm)
Solvated ion size
in AN (nm) in
bulk solution
AN solvation
number in bulk
slution
PEt4+
---/0.72[12]
1.35* 7*
BF4−
0.51/0.50[13]
1.16 [11]
9 [11]
AN
0.58/0.40[13]
--- ---
* Estimated from NEt4 cation
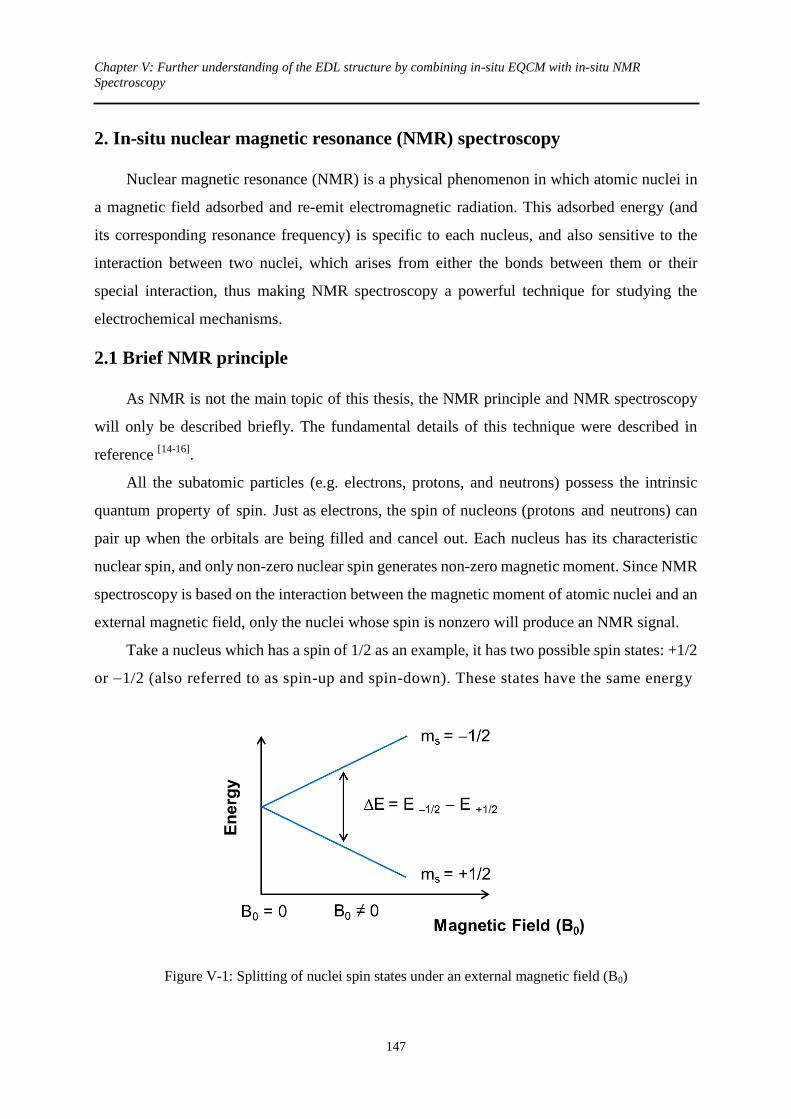
Chapter V: Further understanding of the EDL structure by combining in-situ EQCM with in-situ NMR
Spectroscopy
147
2. In-situ nuclear magnetic resonance (NMR) spectroscopy
Nuclear magnetic resonance (NMR) is a physical phenomenon in which atomic nuclei in
a magnetic field adsorbed and re-emit electromagnetic radiation. This adsorbed energy (and
its corresponding resonance frequency) is specific to each nucleus, and also sensitive to the
interaction between two nuclei, which arises from either the bonds between them or their
special interaction, thus making NMR spectroscopy a powerful technique for studying the
electrochemical mechanisms.
2.1 Brief NMR principle
As NMR is not the main topic of this thesis, the NMR principle and NMR spectroscopy
will only be described briefly. The fundamental details of this technique were described in
reference [14-16]
.
All the subatomic particles (e.g. electrons, protons, and neutrons) possess the intrinsic
quantum property of spin. Just as electrons, the spin of nucleons (protons and neutrons) can
pair up when the orbitals are being filled and cancel out. Each nucleus has its characteristic
nuclear spin, and only non-zero nuclear spin generates non-zero magnetic moment. Since NMR
spectroscopy is based on the interaction between the magnetic moment of atomic nuclei and an
external magnetic field, only the nuclei whose spin is nonzero will produce an NMR signal.
Take a nucleus which has a spin of 1/2 as an example, it has two possible spin states: +1/2
or 1/2 (also referred to as spin-up and spin-down). These states have the same energy
Figure V-1: Splitting of nuclei spin states under an external magnetic field (B0)

Chapter V: Further understanding of the EDL structure by combining in-situ EQCM with in-situ NMR
Spectroscopy
148
(degenerate) when no external magnetic field is applied. However, if the nucleus is placed in a
magnetic field (B0), the energy of these states differs due to the interaction between the nuclear
magnetic moment and the external magnetic field (as shown in Figure V-1).
The energy difference (E) between the two states is described by the following equation:
0BE (Equation V-1)
Where is the gyromagnetic ratio of the nucleus, and ℏ is the reduced Planck constant (ℏ=h/2,
where h is Planck constant = 6.63.10-34
J.s). It is possible to excite nuclei from the lower to the
higher energy level by electromagnetic radiation; in NMR it is often achieved by applying
another magnetic field (B1) which is perpendicular to B0. When energy of this electromagnetic
radiation matches the energy difference between the two energy states, resonant absorption by
nuclear spins will occur, and the nuclei is excited to the higher energy level. It is this energy
absorption which is detected in NMR. The energy of the electromagnetic radiation is described
as:
hE (Equation V-2)
where is the frequency. By combining Equation V-1 and V-2, it can then be deducted that the
excitement will only occur at a specific frequency where:
0B (Equation V-3)
where is the angular frequency of the electromagnetic radiation. In NMR, this characteristic
frequency is called Larmor frequency. When the electromagnetic radiation is given at Larmor
frequency, the nuclei that are initially at lower energy level (e.g. spin-up in Figure V-1) will be
excited to the higher energy level (e.g. spin-down in Figure V-1), resulting in the so-scalled
Larmor precession. The NMR signal intensity is dependent on the energy absorbed, if the
energy is low, the NMR signal will be too weak to be detected. Therefore, it is necessary to
increase the magnetic field (B0), which is generally in the range of few Tesla. The resonance
frequency where the radiation energy is adsorbed is in the range of radiofrequency (MHz). If an
NMR spectrometer is tuned to a particular resonance frequency, only a selected NMR active
species is observed. For instance, if a spectrometer is tuned at 400 MHz, only 1H nuclei are
observed, but if the same spectrometer is tuned at 162 MHz, only 31
P are observed. This is

Chapter V: Further understanding of the EDL structure by combining in-situ EQCM with in-situ NMR
Spectroscopy
149
similar to tuning a radio and receiving only one station at a time. This element-selective nature
is the key of NMR technique, and is different from the nature of EQCM, which measures the net
mass change of the system contributed from all the species. However, it is this difference in
nature that makes these two in-situ techniques complementary to each other.
As the nucleus is surrounded by electrons, which are also charged species and rotate with a
spin to produce a magnetic field opposite to the magnetic field produced by the nucleus, thus
generate a “shielding effect”. As a result, the local magnetic field at the nucleus is not equal to
the applied magnetic field. The energy gap and the frequency required to achieve resonance
adsorption is also reduced. This shift in the NMR frequency due to the electronic molecular
orbital coupling to the external magnetic field is called chemical shift. It is this chemical shift
which depends on the local electronic structure hence chemical bonds that makes NMR a
powerful technique to probe the chemical environment of molecules.
In NMR spectra, the NMR signal is often denoted by a chemical shift value ():
0
6
0 10)(
(Equation V-4)
where 0 and are the resonance frequency of reference and interest sample, respectively. As
the ( 0) is usually in Hz and 0 is in MHz, for convenience, the value is multiplied by 106
and the unit of chemical shift is given in ppm (part per million).
Chapter V: Further understanding of the EDL structure by combining in-situ EQCM with in-situ NMR
Spectroscopy
150
2.2 In-situ NMR experimental
Owning to the quantitative and element-selective nature of NMR, the use of this
technique for investigating the complex supercapacitor charging process is thought to bring
significant insight. It has been demonstrated early by Harris et al that NMR is capable to
distinguish between adsorbed and non-adsorbed species within activated carbons [5,17,18]
.
Other studies have further shown a general trend that regardless of the molecule or nuclear
spin studied, the resonances corresponding to the species adsorbed on the carbon surface
always shift toward a lower frequency with respect to their non-adsorbed counterparts [6,7,19,20]
.
Theoretical studies have shown that this characteristic shifts in frequency is originated from
the circulation of delocalized electrons in the carbon surface (aromatic ring current effect),
which leads to local magnetic field reduction[10,21-23]
. This nucleus-independent chemical shift
(NICS) thus becomes a measure to identify ions confined in the carbon micropores, and to
provide information on ions’ local chemical environment (e.g. local curvature of the carbon
surface or pore size). Recent study has demonstrated that magic-angle spinning (MAS)
technique, in which the NMR samples are spun at the magic angle ( ~ 54.74°) with respect
to the magnetic field [24]
, can greatly improve the spectral resolution in ex-situ NMR
measurements [25]
.
In this work, solvated PEt4BF4 electrolytes were studied with in-situ NMR, so that the
PEt4 cation and BF4
anion can be tracked in real time individually by using in-situ
31P and
19F NMR during charging and discharge of YP-50F activated carbon electrodes. This section
will describe the experimental details of in-situ NMR measurements.
2.2.1 NMR details
In-situ NMR experiments were performed using a Bruker Avance spectrometer operating
at a magnetic field strength of 7.05 T, corresponding to 19
F and 31
P Larmor frequencies of
284.2 and 121.5 MHz, respectively. A Bruker HX double-resonance static probe was used,
with a 6.8 mm inner diameter solenoid coil. The “depth” pulse sequence [26]
was used for all
experiments in order to reduce the background and probe ringing signals. The total delay
between excitation of transverse magnetization and acquisition of the free induction decay
was 90 μs. A recycle interval of 30 s was used, which was sufficient for spectra to be
quantitative. 19
F NMR spectra are referenced relative to neat hexafluorobenzene (C6F6) at
−164.9 ppm, and 31
P NMR spectra are referenced relative to 85 wt% H3PO4(aq) at 0 ppm.

Chapter V: Further understanding of the EDL structure by combining in-situ EQCM with in-situ NMR
Spectroscopy
151
2.2.2 Quantification of the adsorbed species at zero applied potential
To be able to quantify the adsorbed species, some calibration tests have been conducted.
A series of calibration bag cells were prepared, each containing one 7.4 mg YP-50F film
electrode soaked with accurately measured volumes of electrolyte between 2 and 12 L, and
the corresponding 31
P and 19
F NMR spectra collected from these bag cell samples are shown
in Figure V-2. 1.5 M electrolyte concentration was used in the calibration tests due to better
resolution.
Figure V-2: 31
P and 19
F NMR spectra of bag cells containing 7.4 mg YP50-F films soaked with different volumes of 1.5 M PEt4BF4 / CD3CN electrolyte
For low electrolyte loading (2 L of electrolyte), one single broad peak was observed in
both 31
P and 19
F NMR spectra at 30 and 158 ppm, which is ascribed to strongly bound PEt4+

Chapter V: Further understanding of the EDL structure by combining in-situ EQCM with in-situ NMR
Spectroscopy
152
cations and BF4 anions (adsorbed in the carbon pores, indicated as “in-pore” in Figure V-2),
respectively. As more electrolyte is added, a second peak appears at higher frequency in both
spectra, which corresponds to the ions that are weakly affected by the carbon surface (mainly
situated at exterior surface of the carbon particles, indicated as “ex-pore” in Figure V-2).
These NMR spectra were then fitted with two resonances (corresponding to in-pore and
ex-pore environments), and linear fits were performed for the total intensity as a function of
electrolyte volume. Since the electrolyte concentrations and total sample volumes are known,
it is then possible to quantify the absolute number of ions for a given resonance intensity in
the NMR spectrum.
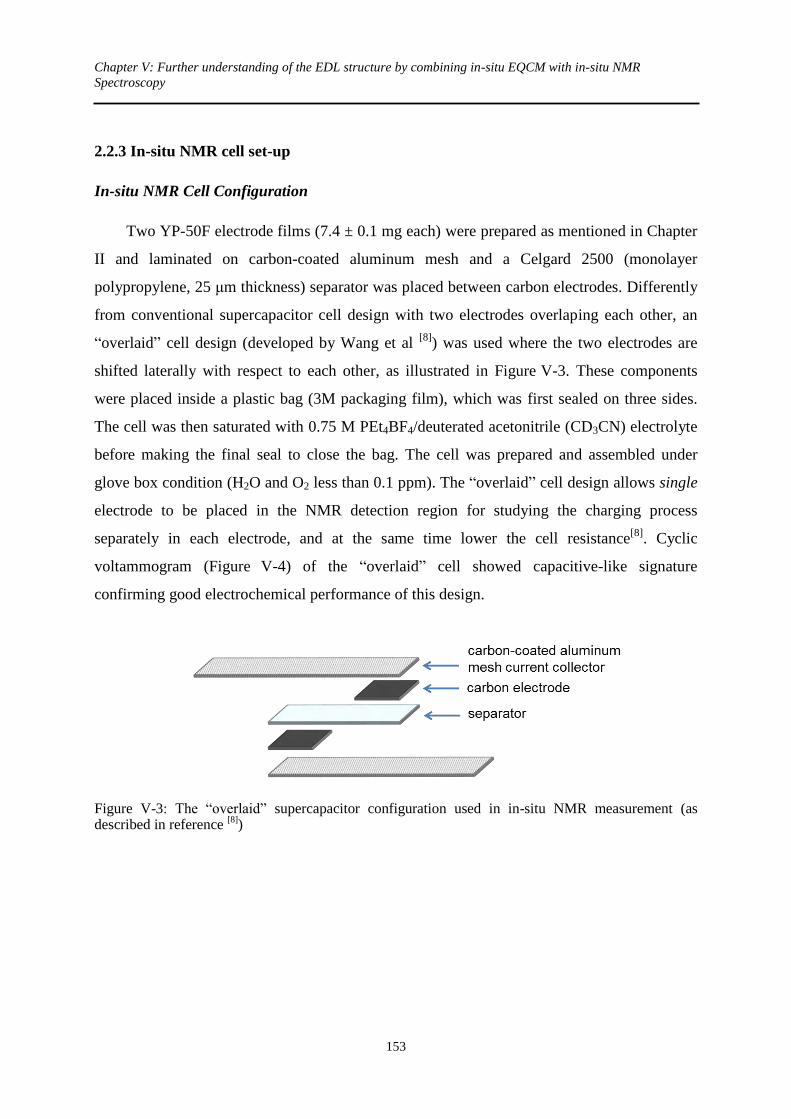
Chapter V: Further understanding of the EDL structure by combining in-situ EQCM with in-situ NMR
Spectroscopy
153
2.2.3 In-situ NMR cell set-up
In-situ NMR Cell Configuration
Two YP-50F electrode films (7.4 ± 0.1 mg each) were prepared as mentioned in Chapter
II and laminated on carbon-coated aluminum mesh and a Celgard 2500 (monolayer
polypropylene, 25 μm thickness) separator was placed between carbon electrodes. Differently
from conventional supercapacitor cell design with two electrodes overlaping each other, an
“overlaid” cell design (developed by Wang et al [8]
) was used where the two electrodes are
shifted laterally with respect to each other, as illustrated in Figure V-3. These components
were placed inside a plastic bag (3M packaging film), which was first sealed on three sides.
The cell was then saturated with 0.75 M PEt4BF4/deuterated acetonitrile (CD3CN) electrolyte
before making the final seal to close the bag. The cell was prepared and assembled under
glove box condition (H2O and O2 less than 0.1 ppm). The “overlaid” cell design allows single
electrode to be placed in the NMR detection region for studying the charging process
separately in each electrode, and at the same time lower the cell resistance[8]
. Cyclic
voltammogram (Figure V-4) of the “overlaid” cell showed capacitive-like signature
confirming good electrochemical performance of this design.
Figure V-3: The “overlaid” supercapacitor configuration used in in-situ NMR measurement (as described in reference
[8])

Chapter V: Further understanding of the EDL structure by combining in-situ EQCM with in-situ NMR
Spectroscopy
154
Figure V-4: Cyclic voltammogram of the supercapacitor bag cell with YP-50F electrodes
In-situ NMR measurements
The in-situ NMR cell was placed vertically in the NMR coil [8]
, and charged sequentially
to a series of different voltage steps. The cell voltage was controlled by a Bio-logic cycler,
and hold as the following sequence: 0, 0.25, 0.5, 0.75, 1, 1.25, 1.5, 0, –0.25, –0.5, –0.75, –1, –
1.25 and –1.5 V. Each voltage step was hold for 60 minutes until a steady current was
obtained before 19
F and 31
P NMR spectra were collected. For low voltages the residual current
was close to zero at equilibrium; whereas for voltages between 1 – 1.5 V, small constant
currents of up to 0.005 mA were observed at equilibrium. For the discharge of the cell (1.5 →
0 V), current relaxations of double duration were used. Spectral fitting was carried out using
DMfit software [27]
.
Deconvolutions were carried out using a mixture of Gaussian and Lorentzian lineshapes
to describe the different features in the spectra. In each case only the minimum number of
components required to model the spectrum were used and a single lineshape was assumed
for the in-pore resonance. Some spectra required several lineshapes to describe the free
electrolyte / ex-pore resonance. This is ascribed to bulk magnetic susceptibility (BMS) effects
and local variations in the magnetic field across the bag cell, which results in a range of
different local fields and thus shifts for the same chemical species [27]
. The spectrum obtained
at 0 V was fitted first, as this showed the best resolution of the in-pore resonance. The peak
positions and intensities obtained were then used as a starting point to fit the spectrum at the
next highest voltage. Fits were repeated up to four times for each series of data in order to
estimate errors.

Chapter V: Further understanding of the EDL structure by combining in-situ EQCM with in-situ NMR
Spectroscopy
155
3. In-situ NMR results
3.1 At zero potential
As mentioned previously, with improved in-situ NMR and imaging methods [9,28]
, it is
possible to observe change in the local environment of the ions in the electric double layer.
Figure V-5a and b show respectively 31
P and 19
F NMR spectrum of individual supercapacitor
electrode in the cell when the cell potential was held at 0 V. As observed in Figure V-3, two
peaks correspond respectively to strongly and weakly bound ions are observed in both
spectra.
Figure V-5: 31
P (a) and 19
F (b) NMR spectra of supercapacitor electrodes showing PEt4+ cation and
BF4− anion environments, respectively.
In both spectra, intense “ex-pore” resonances (31
P at 40 ppm and 19
F at -150 ppm)
corresponding the ions resides in voids between carbon particles and bulk electrolytes
between two electrodes were observed. For both spectra, the free electrolyte signal appears to
contain several superimposed features. It is attributed to bulk magnetic susceptibility (BMS)
effects owing to the irregular shape of the sample contained within plastic bag cells.[8]
Weaker
“in-pore” resonances, with a lower frequency shift by 5-7 ppm, corresponding to ions inside
the micropores close to the carbon surface are also observed. The shift of the in-pore
resonance from that of the ex-pore resonance is due diamagnetic nucleus independent
chemical shift (NICS) effects (as explained in section V-2.2) associated with the delocalized
electrons in the predominantly sp2-bonded carbon surface.
[8,10]

Chapter V: Further understanding of the EDL structure by combining in-situ EQCM with in-situ NMR
Spectroscopy
156
Furthermore, the absolute number of in-pore species could be obtained through
comparison of the in-pore resonance intensities with calibration samples. It has been found
that there are almost identical amounts of cations (0.87 mmol per gram of YP-50F) and anions
(0.85 mmol/g) confirming that in-pore ionic charges are balanced at 0 V. Moreover, using
estimated solvated ion size (Table V-1) and measured ion uptakes, the volume occupied by
the solvated ions was found to be 1.12 cm3 per gram of YP-50F. The value is much larger
than the measured total pore volume (0.7 cm3/g), indicating that the ions must be partially
desolvated or sharing their solvation shells.
3.2 Under polarization
The supercapacitors were charged positively from cell voltage of 0 to 1.5 V in steps of
0.25 V, and then discharged to 0 V before further being charged negatively to 1.5 V with
steps of 0.25 V. Each step was hold for 60 minutes until a negligible constant current was
obtained. In-situ NMR spectra recorded at different charge states were shown in Figure V-6.
For both positive and negative polarization, both in-pore cation and anion resonances move to
higher frequency in NMR spectra as the cells were charged, which is due to changes in the
NICS that result from the electronic charge that is developed within the carbon electrode.[8,9]
The changes in the in-pore resonance intensities reflect the change in the ion populations
within the EDL inside the micropores. The in-pore anion resonance intensity increased during
positive polarization; while the in-pore cation resonance intensity increased during negative
cell charging. The qualitative picture offered by these results is in agreement with the
traditional view of supercapacitor charging: as electronic charge accumulates on the carbon
electrode, ions with opposite charge are adsorbed at the electrode/electrolyte surface in the
micropores to balance the electronic charge.

Chapter V: Further understanding of the EDL structure by combining in-situ EQCM with in-situ NMR
Spectroscopy
157
Figure V-6: In-situ 31
P (left, in red) and 19
F NMR (right, in green) spectra of supercapacitor electrodes at different charge states
3.3 Quantitative information
Figure V-7 shows the absolute in-pore ion populations, obtained from the deconvoluted
in-pore resonance intensities, at different charge states. This result further gives detailed
compositional information in the EDL structure during charging. For negative cell voltage
range (from 0 to 1.5 V), the in-pore cation population increased with charge and the in-pore
anion population showed no significant change. Interestingly, a different behavior has been
found in positive cell voltage range (from 0 to 1.5 V). During positive charging, the in-pore
anion population increased with simultaneous decrease of in-pore cation population, and the
amount of cation expelled from the pores is approximately the same as anion adsorbed.

Chapter V: Further understanding of the EDL structure by combining in-situ EQCM with in-situ NMR
Spectroscopy
158
Figure V-7: In-pore ion populations for supercapacitor electrodes at different charges states in the range –1.5 to +1.5 V
From the ion populations, it is straight forward to determine the total ionic charge at each
voltage steps and compare with the electronic charge stored on the carbon electrode (by
integration of the current versus time), shown in Figure V-8. A good overall agreement has
been found between ionic charge inside the micropores and the stored electronic charge,
suggesting that only ions inside the micropores are responsible for charge storage, the ex-pore
ions work as a reservoir for interior and did not play a significant role in the charge storage
process. These results also confirm that for negative cell voltage range (from 0 to 1.5 V),
cation adsorption dominates the charge storage; whereas for positive range (from 0 to 1.5 V),
both ions are involved to balance the electronic charge, an ion-exchange was observed, which
is similar to the charging mechanisms observed in EMI-TFSI based electrolyte in chapter IV.
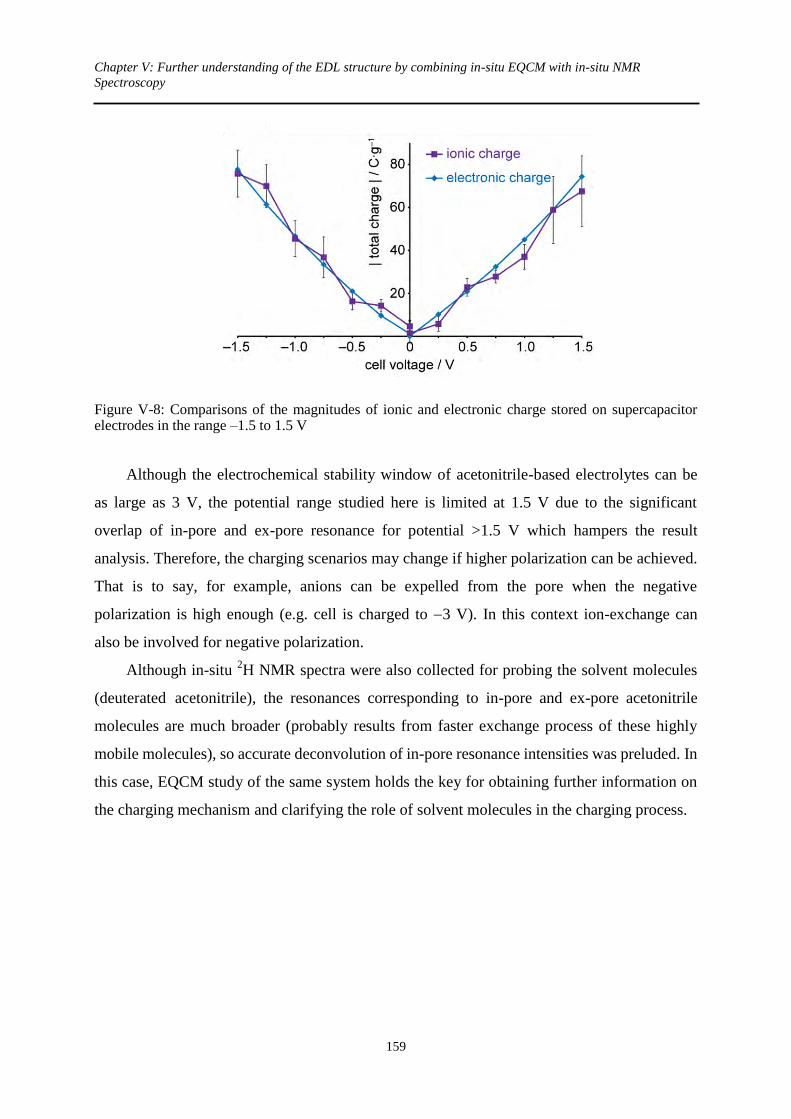
Chapter V: Further understanding of the EDL structure by combining in-situ EQCM with in-situ NMR
Spectroscopy
159
Figure V-8: Comparisons of the magnitudes of ionic and electronic charge stored on supercapacitor electrodes in the range –1.5 to 1.5 V
Although the electrochemical stability window of acetonitrile-based electrolytes can be
as large as 3 V, the potential range studied here is limited at 1.5 V due to the significant
overlap of in-pore and ex-pore resonance for potential >1.5 V which hampers the result
analysis. Therefore, the charging scenarios may change if higher polarization can be achieved.
That is to say, for example, anions can be expelled from the pore when the negative
polarization is high enough (e.g. cell is charged to 3 V). In this context ion-exchange can
also be involved for negative polarization.
Although in-situ 2H NMR spectra were also collected for probing the solvent molecules
(deuterated acetonitrile), the resonances corresponding to in-pore and ex-pore acetonitrile
molecules are much broader (probably results from faster exchange process of these highly
mobile molecules), so accurate deconvolution of in-pore resonance intensities was preluded. In
this case, EQCM study of the same system holds the key for obtaining further information on
the charging mechanism and clarifying the role of solvent molecules in the charging process.

Chapter V: Further understanding of the EDL structure by combining in-situ EQCM with in-situ NMR
Spectroscopy
160
4. In-situ EQCM results
In-situ EQCM measurement was used to study the same system (YP-50F activated
carbon in 0.75 M PEt4BF4/AN). The EQCM cell preparation and assembly were carried out as
described in chapter IV. The carbon loading on the quartz crystal was controlled in between 35
to 45 μg/cm2, and the motional resistances of the carbon-coated quartz measured under air and
in electrolyte are controlled less than 40 and less than 2300 , respectively. Less than 5 of
variation was observed in each cycle, indicating a pure gravimetric behavior thus Sauerbrey
equation (explained in section IV-2.1; equation is recalled below) applies for converting
between frequency change into mass change:
fCm f (Equation V-5)
Where Δm is the mass change, Δf is the change in resonance frequency during electrochemical
tests in Hertz, and Cf is the calibration constant (13.8 ng/Hz/cm2)
Potential of Zero Charge (PZC)
To fully mimic the in-situ NMR measurements, chronoamperometry measurements were
carried out, and separate polarizations were applied to study individual ion contribution. Prior
to the EQCM experiments, potential of zero charge (PZC) measurements were conducted using
three-electrode Swagelok cell: a YP-50F electrode film with a carbon loading of 7.5 mg/cm2 as
working electrode, silver wire as pseudo-reference electrode (same as in EQCM set-up), and a
heavy loading YP-50F electrode film (21 mg/cm2) as counter electrode. The cyclic
voltammogram (at 5 mV/s) of the full window scan in 0.75 M PEt4BF4/AN is shown in Figure
V-9a. A minimum capacitance is found at around 0.5 V vs reference, highlighted by red frame.
Figure V-9b shows an enlarged view of the highlighted part in Figure V-9a, and second order
polynomial fitting curves (black line) is also shown. The PZCs (defined at dC/dE = 0 which
means the minimum of the curves) is at ~ 0.49 V vs reference, close to the measured
open-circuit voltage (0.43 V vs reference) in EQCM set-up. Since the reference used in the
system is a quasi-reference electrode (Ag wire) without buffer solution, the small difference of
60 mV between PZC and OCV is reasonable and can be ignored. Therefore, OCV was used as
reference point to separate positive and negative polarization in this section.

Chapter V: Further understanding of the EDL structure by combining in-situ EQCM with in-situ NMR
Spectroscopy
161
Figure V-9: (a) CVs of YP-50F in 0.75 M PEt4BF4/AN at 5 mV/s (3-electrode Swagelok cell); (b) shows the zoomed zone highlighted in (a).
4.1 Primary in-situ EQCM information
The carbon-coated quartz electrode was first positively polarized from the open-circuit
voltage (OCV, 0.43 V vs reference) up to 0.8 V vs reference in steps of 0.1 V and reversed back
to OCV in steps of –0.1 V during several cycles. The electrode was then polarized negatively
from OCV down to –0.1 V vs reference in steps of 0.1 V. The electrode was held at each
voltage step for 120 s until a constant residual current was obtained. The quartz resonance
frequency was recorded simultaneously with the electrochemical measurement. The potential
step profile, the corresponding current response and the in-situ mass variation with time
(calculated using the Sauerbrey equation) during positive and negative charging are shown in
Figure V-10.

Chapter V: Further understanding of the EDL structure by combining in-situ EQCM with in-situ NMR
Spectroscopy
162
Figure V-10: Chronoamperometry in-situ EQCM test on the YP50F-coated quartz crystal in 0.75 M PEt4BF4/AN for positive (right) and negative charging (left): the potential step profile (upper part), the corresponding current response (middle) and the in situ mass variation with time
Measured mass changes (normalized by the electrochemically active area of the quartz
resonator, 1.27 cm2) are plotted versus the electrode potential in Figure V-11. At potentials
lower than OCV, the mass of the electrode is observed to increase. This behavior is
qualitatively consistent with the adsorption-driven charging mechanism inferred from the NMR
data – cations are adsorbed while anions are kept constant in the micropores results in an
increase in the total number of ions and hence mass of the electrode. For potentials higher than
OCV, the electrode mass is found to decrease over the potential range studied. This behavior is
consistent with the exchange-driven charging mechanism observed from the NMR data. The
adsorption of anions and simultaneous expulsion of cations from the electrode can result in an
overall decrease in the total ionic mass since the PEt4 cations (molar mass 147 g/mol) have a
significantly larger mass than the BF4 anions (molar mass 86.8 g/mol).

Chapter V: Further understanding of the EDL structure by combining in-situ EQCM with in-situ NMR
Spectroscopy
163
Figure V-11: In-situ electrode mass change (Δm) plotted as a function of potential during polarization of YP50-F in PEt4-BF4 / AN electrolyte
Further compositional information could be extracted from EQCM results. However, it
should be noted that these analyses are based on the calculated capacitive charge which
further leads to theoretical mass and the average molecular weight; thus it is essential to
verify that the calculated charge only originates from capacitive processes. Figure V-12
presents the current measured at the end of the potential steps shown in Figure V-10 versus
the electrode potential during the potential hold. For a constant applied potential, the current
passing across an ideal capacitor is null once the equilibrium state is reached; in this case, the
presence of electrolyte explains the small – but not null - steady state current (< 1 μA)
between 0 and +0.7 V vs reference. However, for large polarizations of –0.1 V and +0.8V vs
reference (circled in red), the increase of residual current is related to parasitic redox reactions
associated with the redox activity of the electrolyte. The potential range where the charge
storage can be considered as fully capacitive can thus be defined between 0 and +0.7 V vs
reference, again, the restriction of electrochemical window comes from the small carbon
loading on the resonator (tens of micrograms) as mentioned in previously.

Chapter V: Further understanding of the EDL structure by combining in-situ EQCM with in-situ NMR
Spectroscopy
164
Figure V-12: The average of residual current during the last 60 seconds or 30 seconds of each polarization step versus potential
As mentioned in chapter II, the capacitive charge (Qc) stored on the electrode in each
potential step was obtained by removing the contribution of residual leakage current (Ileak)
from the total charge (Qtotal, calculated from integration the current (I) versus step duration
time (t) during the potential hold using Faraday’s Law), shown as following.
tItIQQQ leakleaktotalc (Equation V-6)
4.2 Quantitative/Qualitative interpretation
A more quantitative interpretation of the EQCM results was obtained by comparing the
experimental mass changes to theoretical values based on different models for the charging
mechanism. Figure V-13 shows experimental and theoretical mass changes as a function of the
capacitive charge stored on the electrode. The theoretical mass changes were calculated based
on two different charging mechanisms. For the first model (denoted by red triangles), a purely
adsorptive mechanism is considered, based on the traditional assumption that that one negative
(positive) charge stored in the electrode is balanced by one single cation (anion) adsorption on

Chapter V: Further understanding of the EDL structure by combining in-situ EQCM with in-situ NMR
Spectroscopy
165
the electrode surface. For negative polarization, the measured mass changes are much higher
than the theoretical mass change across the entire potential range. However, it should be
noticed that in contrast to the NMR measurements, which selectively observe in-pore cation
and anion populations, mass changes measured by EQCM originate from all electrolyte species
(including solvent molecules) that enter and leave the porous electrode. The NMR data (Figure
V-7) shows that the anion population remains constant during negative polarization; therefore
the additional adsorbed species must be solvent molecules. The apparent molecular weight was
calculated to be 369 g/mol (by applying Equation IV-9 as discussed in Section IV-2.4), much
higher than unsolvated PEt4 cations (147 g/mol). Assuming that the adsorbed species are PEt4
cations and that the extra mass comes from acetonitrile molecules, the cation solvation number
is estimated to be 5.4. This value is slightly lower than the solvation number of 7 predicted for
chemically similar NEt4 cations in bulk solution
[11], indicating that cations are partially
desolvated when they enter the carbon micropores.
Figure V-13: Comparison of experimental and calculated electrode mass changes based on different models plotted as a function of capacitive charge during charging process.
For positive polarization, Figure V-13 shows that the purely adsorptive model again
predicts a mass increase as only BF4 anions are absorbed into the micropores. This is not in

Chapter V: Further understanding of the EDL structure by combining in-situ EQCM with in-situ NMR
Spectroscopy
166
agreement with the experimental data, where a slight mass decrease was observed. In view of
this, a second model based on the NMR results (Figure V-7) was considered, where for positive
(negative) electrode polarization, two charges stored in the electrode surface are compensated
by the adsorption of one anion (cation) and the concomitant desorption of one cation (anion).
The calculated values based on this model (denoted by green squares) predict a slight decrease
in electrode mass during positive charging. This gives better agreement with the experimental
values, where a mass decrease is also observed. Although it was not possible to extract clear
information regarding the solvation number because of the limited accessible voltage window
at positive potentials and low deposited mass of carbon, the fact that change of the electrode
mass follows that predicted by the NMR results confirms that the charging mechanism is driven
by ion exchange.

Chapter V: Further understanding of the EDL structure by combining in-situ EQCM with in-situ NMR
Spectroscopy
167
5. Discussions
NMR results show that at null potential, charge in the micropores is balanced with the
same amount of in-pore anions and cations, and the ions were found partially desolvated or
sharing solvation shells with their neighboring ions. Thanks to the element-selective and
quantitative nature of NMR, the absolute number of in-pore cation and anion population could
be precisely determined. It has been found that the charge storage is predominantly achieved
by the in-pore species (as the overall agreement was found between in-pore ionic charge and
electronic charge). Ions respond differently between positive and negative electrode
polarization, as previously observed in EMI-TFSI based electrolyte (chapter IV). The charge
storage was mainly dominated by pure cation adsorption when the carbon electrode was
polarized negatively; while for positive charging, the positive electronic charge on the carbon
electrode was balanced by absorption of anions into the micropores with simultaneous
expulsion of cations.
EQCM results not only show excellent agreement with NMR results, moreover, they
complement each other. Furthermore, with the help of NMR which confirms that for negative
polarization, anion population was kept constant and the additional cation population balances
perfectly the electronic charge, cations are found to enter the pores partially desolvated with
about 5 acetonitrile molecules. Cations adsorbed in the pore with additional solvent molecules
implying that extra space has to be made inside the micropores as the electrode is charged. It is
possible that solvent molecules are forced to order so that they take up less space. A recent
study using in-situ X-ray diffraction has shown the ordering of propylene carbonate (PC)
solvent molecules within micropores during charging.[29]
Electron radial distribution function
analysis identified a shortening of the average intermolecular distance by approximately 0.05 Å
as compared to bulk solution, interpreted as a densification of the packing of the PC molecules
through vertical alignment. It is also possible that the micropores may expand during charging
to accommodate the additional adsorbed species. Indeed, the expansion of micropores during
charging has recently been proposed on the basis of electrochemical dilatometry
experiments.[30]
Although the NMR results show that significant numbers of co-ions remain inside the
micropores during charging in both the positive and negative voltages ranges, the nice
agreement between electronic charge and in-pore ionic charge implies that the remaining

Chapter V: Further understanding of the EDL structure by combining in-situ EQCM with in-situ NMR
Spectroscopy
168
co-ions do not screen the charge of counter-ion. These results, especially during negative
polarization where co-ions population remains constant, highlight that the charge storage can
simply be achieved by local re-arrangement of molecules (e.g. co-ions only move slightly
further from the carbon surface thus still present in the pore).
Interestingly, BF4 anions show different behavior here and in previous in-situ NMR
study carried out using YP-50F in NEt4BF4/AN electrolyte[8]
. In previous study, the amount
of BF4 anion kept constant at lower positive-polarized region, and increased abruptly when
the polarization was high enough; whereas in PEt4BF4/AN electrolyte, the in-pore BF4 anions
increase constantly over the whole positive charge range. For negative polarization, the BF4
anions were ejected from the micropores constantly in NEt4BF4/AN, however the amount of
BF4 anion was found constant all along the polarization range in PEt4BF4/AN electrolyte.
Although the chemical environment for BF4 anions seems to be similar in both systems, BF4
anions involve in the charging process in different way. This implies that the interaction
between cation and anion plays a role in the way how ions respond to the electronic charge.
In this work, the in-situ NMR spectra were not collected from MAS NMR due to
different technical limitations, e.g. balance of the plastic bag cell under high speed spinning,
and lacking of proper material/design for connecting supercapacitor current collector to
potentiostat which needs to withstand the friction and the heat produced by friction under high
speed spinning. Once the technical issue will be overcome, the enhancement brought by MAS
NMR could reveal deeper insight on the EDL charging process.
Combining in-situ NMR and in-situ EQCM results, one can obtain a better
understanding on the role of solvent, and respond to the unanswered questions left in chapter
IV. The good agreement between electronic charge and ionic charge (Figure V-8) confirms
that the presence of solvent molecules does not affect charge storage efficiency under steady
state condition.
6. Conclusions
The combination of in-situ NMR and in-situ EQCM study on YP-50F in
PEt4BF4/acetonitrile electrolyte exhibits that different charge mechanisms have been found
for opposite electrode polarizations[31]
: negative charge on the electrode is balanced mainly by
counter-ion adsorption (perm-selectivity); on the other hand, positive charge storage is mainly

Chapter V: Further understanding of the EDL structure by combining in-situ EQCM with in-situ NMR
Spectroscopy
169
achieved by ion-exchange (breakdown of perm-selectivity), similar as previously observed in
EMI-TFSI based electrolyte. Different from precedent EQCM results of EMI-TFSI based
electrolytes, ion-exchange has been found in the whole positive potential range, not only at
low degree of polarization. Except the different natures of electrolyte and electrode materials,
the distinction may also be attributed to kinetic factor. Under steady state condition
(chronoamperometry), ions and solvent molecules have sufficient time to move and organize
in the confined environment; whereas under dynamic charging condition (cyclic voltammetry
in EMI-TFSI based electrolytes), the transport and adsorption kinetics can affect the EDL
structure. In-situ EQCM with slower scan rate in the future could possibly give an answer
regarding the kinetic factor. Furthermore, from both sets of results, it has been found that
solvent molecules are involved in the charging process, but they do not affect the efficiency of
charge storage, signifying the reorganization of solvent molecules in the micropores.
The results shown in this chapter provide a direct molecular-level insight into the charge
storage process, the physics of the ionic adsorption and transport in microporous carbon
electrodes. The methodology introduced here opens the way for the study of factors such as
relative pore/ion sizes, concentration and solvent effects on the ionic composition of the electric
double-layer during charging - questions that are at the heart of current efforts to optimize and
improve the energy storage capabilities, which further helps to design the next generation
supercapacitors.

Chapter V: Further understanding of the EDL structure by combining in-situ EQCM with in-situ NMR
Spectroscopy
170
7. Reference
[1] K. Ogata, E. Salager, C. J. Kerr, A. E. Fraser, C. Ducati, A. J. Morris, S. Hofmann, C. P. Grey, Nat. Commun. 2014, 5, DOI 10.1038/ncomms4217.
[2] A. Pestov, A. Nazirov, E. Modin, A. Mironenko, S. Bratskaya, Carbohydr. Polym. 2015, 117, 70.
[3] M. Letellier, F. Chevallier, F. Béguin, E. Frackowiak, J.-N. Rouzaud, J. Phys. Chem. Solids 2004, 65, 245.
[4] J. Xu, J. Hou, W. Zhou, G. Nie, S. Pu, S. Zhang, Spectrochim. Acta. A. Mol. Biomol. Spectrosc. 2006, 63, 723.
[5] R. K. Harris, T. V. Thompson, P. R. Norman, C. Pottage, A. N. Trethewey, J Chem Soc Faraday Trans 1995, 91, 1795.
[6] K. Shen, T. Pietrass, J. Phys. Chem. B 2004, 108, 9937. [7] R. J. Anderson, T. P. McNicholas, A. Kleinhammes, A. Wang, J. Liu, Y. Wu, J. Am. Chem.
Soc. 2010, 132, 8618. [8] H. Wang, A. C. Forse, J. M. Griffin, N. M. Trease, L. Trognko, P.-L. Taberna, P. Simon, C.
P. Grey, J. Am. Chem. Soc. 2013, 135, 18968. [9] H. Wang, T. K.-J. Köster, N. M. Trease, J. Ségalini, P.-L. Taberna, P. Simon, Y. Gogotsi,
C. P. Grey, J. Am. Chem. Soc. 2011, 133, 19270. [10] A. C. Forse, J. M. Griffin, V. Presser, Y. Gogotsi, C. P. Grey, J. Phys. Chem. C 2014, 118,
7508. [11] Y.-J. Kim, Y. Masutzawa, S. Ozaki, M. Endo, M. S. Dresselhaus, J. Electrochem. Soc.
2004, 151, E199. [12] K. Matsumoto, U. Harinaga, R. Tanaka, A. Koyama, R. Hagiwara, K. Tsunashima, Phys
Chem Chem Phys 2014, 16, 23616. [13] C. Decaux, C. Matei Ghimbeu, M. Dahbi, M. Anouti, D. Lemordant, F. Béguin, C.
Vix-Guterl, E. Raymundo-Piñero, J. Power Sources 2014, 263, 130. [14] “Wiley: NMR Spectroscopy: Basic Principles, Concepts and Applications in Chemistry,
3rd Edition - Harald Günther,” can be found under http://eu.wiley.com/WileyCDA/WileyTitle/productCd-3527330046.html, n.d.
[15] M. J. Duer, in Solid-State NMR Spectrosc. Princ. Appl. (Ed.: M.J. Duer), Blackwell Science Ltd, 2001, pp. 1–72.
[16] “NMR and MRI Applications in Chemistry and Medicine - National Historic Chemical Landmark - American Chemical Society,” can be found under http://www.acs.org/content/acs/en/education/whatischemistry/landmarks/mri.html, n.d.
[17] R. K. Harris, T. V. Thompson, P. R. Norman, C. Pottage, J Chem Soc Faraday Trans 1996, 92, 2615.
[18] R. K. Harris, T. V. Thompson, P. R. Norman, C. Pottage, Carbon 1999, 37, 1425. [19] L. Borchardt, M. Oschatz, S. Paasch, S. Kaskel, E. Brunner, Phys. Chem. Chem. Phys.
2013, 15, 15177. [20] S. Mitani, C. Murakami, Y. Korai, Y. Minato, S. Ishimoto, S. Suematsu, K. Tamamitsu,
Electrochimica Acta 2013, 94, 30. [21] D. Sebastiani, ChemPhysChem 2006, 7, 164. [22] M. Kibalchenko, M. C. Payne, J. R. Yates, ACS Nano 2011, 5, 537. [23] P. Ren, A. Zheng, X. Pan, X. Han, X. Bao, J. Phys. Chem. C 2013, 117, 23418. [24] J. W. Hennel, J. Klinowski, in New Tech. Solid-State NMR (Ed.: J. Klinowski), Springer
Berlin Heidelberg, 2005, pp. 1–14. [25] M. Deschamps, E. Gilbert, P. Azais, E. Raymundo-Pinero, M. R. Ammar, P. Simon, D.
Massiot, F. Beguin, Nat. Mater. 2013, 12, 351. [26] D. G. Cory, W. M. Ritchey, J. Magn. Reson. 1969 1988, 80, 128. [27] D. Massiot, F. Fayon, M. Capron, I. King, S. Le Calvé, B. Alonso, J.-O. Durand, B. Bujoli,
Z. Gan, G. Hoatson, Magn. Reson. Chem. 2002, 40, 70. [28] A. J. Ilott, N. M. Trease, C. P. Grey, A. Jerschow, Nat. Commun. 2014, 5, DOI
10.1038/ncomms5536. [29] M. Fukano, T. Fujimori, J. Ségalini, E. Iwama, P.-L. Taberna, T. Iiyama, T. Ohba, H.
Kanoh, Y. Gogotsi, P. Simon, K. Kaneko, J. Phys. Chem. C 2013, 117, 5752.

Chapter V: Further understanding of the EDL structure by combining in-situ EQCM with in-situ NMR
Spectroscopy
171
[30] M. M. Hantel, V. Presser, R. Kötz, Y. Gogotsi, Electrochem. Commun. 2011, 13, 1221. [31] J. M. Griffin, A. C. Forse, W.-Y. Tsai, P.-L. Taberna, P. Simon, C. P. Grey, Nat. Mater.
2015, In press

Chapter V: Further understanding of the EDL structure by combining in-situ EQCM with in-situ NMR
Spectroscopy
172

General Conclusions and Perspectives


General Conclusions and Perspectives
173
General Conclusions
The aim of this thesis was to improve the energy and power performance of EDLCs,
which has been achieved mainly from two different aspects: (1) synthesizing novel electrode
materials to increase the energy density as well as improving the electrode/electrolyte
interface and electrode microstructure to enhance the power performance; (2) improving
fundamental understanding of the double layer charging at the electrode/electrolyte interface,
in the confined pores of porous carbons, by using in-situ electrochemical techniques.
Performance Improvement via Carbon Microstructure Design
Based on the concept of adapting electrode materials to electrolyte properties, two
carbons with different microstructures have been tested with an ILs mixture
(PIP13FSI)0.5(PYR14FSI)0.5 which possesses a wide stable electrochemical window over
extended operating temperature range. In previous work [1]
, this ILs mixture showed
outstanding power performance but poor capacitance (30 F/g) with exohedral carbon
materials. Therefore, carbons with different micro-architectures have been synthesized to
improve the energy performance of this electrolyte. Results are presented in chapter III:
hierarchical micro/mesoporous SiC-CDC showed good capacitive behavior down to -40 °C
and much better capacitance retention at subzero temperature as compared to a commercial
microporous carbon. However, only little improvement in capacitance was found (55 F/g) due
to the large amount of mesopores in this carbon. Another carbon material activated graphene
(a-MEGO) presented an exceptionally high capacitance (up to 180 F/g) and wide
electrochemical window (up to 3.7 V) over a wide temperature range from -50 °C to 80 °C in
ILs mixture. The high SSA, and uniformly situated mesopores (2 to 4 nm), compared with the
mesopores of SiC-CDC whose peak ranged from 2 to 10 nm, allow a-MEGO to store the
large amount of charge maintaining high ion transport thus high power capability.
EDL Fundamental Understanding via In-situ Techniques (EQCM; EQCM & NMR)
Aside from the development of novel constituent materials, obtaining a fundamental
understanding of the charge storage mechanism at molecular scale also holds the key for future
design of supercapacitors. Among limited in-situ electrochemical techniques, Electrochemical
Quartz Crystal Microbalance (EQCM) technique has been proved to be a powerful in-situ probe
General Conclusions and Perspectives
174
for studying the electrochemical interfacial properties in a porous carbon.[2,3]
Therefore, it has
been involved to investigate the EDL charging mechanisms and ion dynamics in the confined
carbon micropores in chapter IV. Carbide-derived carbons (CDC) with two different average
pore sizes were tested in neat and acetonitrile (AN)-solvated ionic liquid (EMI-TFSI) using
in-situ EQCM. Results have shown that different charge storage mechanisms are involved for
positive and negative polarization: pure-adsorptive mechanism and ion-exchange mechanism.
Despite the strong interaction between cations and anions in neat ionic liquids, at high
polarization under dynamic condition, almost to one single counter-ion adsorption has been
found in response to one net charge stored on the carbon electrode surface. No ion-pairing or
charge screening by co-ions has been observed during charging in confined micropores.
Experimental acetonitrile solvation numbers were estimated for EMI+ cation, and partial
desolvation was observed when decreasing the carbon pore size from 1 down to 0.65 nm.
Owning to the nature of EQCM, it cannot distinguish the individual contribution of each
electrolytic species. In order to get a more complete picture of double layer charging, in-situ
NMR was coupled with in-situ EQCM to study the same electrode/electrolyte system (YP-50F
in PEt4BF4/AN) in chapter V. Thanks to the quantitative nature of NMR, the amount of cations
and anions at different charge states could be determined, and different charging mechanisms
have been found for different electrode polarizations under steady state: negative charge on the
electrode is balanced mainly by counter-ion adsorption; whereas positive charge storage is
mainly achieved by ion-exchange, similar as previously observed in EMI-TFSI based
electrolyte. In-situ EQCM results showed excellent agreement with the NMR results, and offer
important information on ion solvation inside the micropores. The PEt4+ cations are found to
enter the pores with ~ 5 acetonitrile molecules corresponding to a slight partial desolvation.
Moreover, results have also clarified the role of acetonitrile solvent molecules in EDL charging:
although they are involved in the charging process, they do not affect the charge storage
efficiency.
These results bring important molecular-level insights to the charge storage process and
the EDL structure upon charging, thus further provide the guideline for material design to
improve the EDLC performance. To summarize, in the confined micropores, ions are at least
partially desolvated and no ion-pairing has been found. Therefore, counter-ions are densely
packed in the narrow space, and neither co-ions nor solvent molecules screen the charge, thus

General Conclusions and Perspectives
175
resulting in high capacitance and high charge storage efficiency in this environment. On the
other hand, depending on ion nature and cation-anion interaction, charging process can involve
pure counter-ion adsorption or co-ion ejection, or both (ion-exchange). Local reorganization
and reorientation of the electrolytic species is also necessary to efficiently pack the ions inside
the pore. Both molecular reorganization and ion-swapping need some free space, hence
materials with only the pore size that matches the maximum capacitance at equilibrium state
will not show good performance under dynamical charging since the local reorganization is
hindered. In view of this, mesopores might be as important as micropores. However, in this
work, large mesopores, in which the pore size is more than 4 nm, are found to decrease the
capacitance. Although the charge storage mechanism is still not completely understood, these
conclusions highlight the importance of optimizing the electrode/electrolyte interface by the
proper electrode architecture design containing appropriate amount and size of micropores and
mesopores. Five papers have been published from these results.[4-8]
Perspectives
As already raised by different studies and confirmed again in this work, optimization of
the electrode/electrolyte interface holds the key for future supercapacitors. But questions now
are: what is the best microstructure for improving energy density without sacrificing high
power features? What is the best volume proportion between pores of different pore size?
How do electrolyte properties (e.g. viscosity) affect this proportion? Of course, tremendous
efforts need to be put, especially the development of synthesis strategies which can finely
control the porous structure and tailor the required pore size and PSD.
From fundamental point of view, lots of work still needs to be done. How the electrolytic
molecules re-arrange/re-orient? How the different molecular structures and different
interactions between molecules affect this re-orientation? How does the system moves from
purely-adsorptive to ion-exchange charging mechanism or vice versa? Will there be different
charging pictures between charging dynamically or under steady state? Furthermore, the role
of electrolyte permittivity, and the relationship between solvation energy, adsorption energy
and charge storage are still poorly understood. To address these points, in addition to
improving the in-situ techniques, computational simulations and modeling are definitely
needed. What is even more important is that it is important to combine different techniques
General Conclusions and Perspectives
176
for probing the same electrode/electrolyte systems. Only by incorporating the advantages of
different techniques, different aspects can be covered hence a more complete scenario of the
EDL charge storage can be achieved.
The current in-situ electrochemical techniques are still limited to providing averaged
information of the whole electrode. The local information at the electrode/electrolyte interface
at molecular scale still relies on modelling. Recently, in-situ STEM/TEM techniques has been
developed for battery-related research.[9,10]
Development of this technique, which allows local
observation, in studying EDL charging mechanism will undoubtedly bring important
fundamental insights and improve future supercapacitor designs.
[1] R. Lin, P.-L. Taberna, S. Fantini, V. Presser, C. R. Pérez, F. Malbosc, N. L. Rupesinghe, K. B. K. Teo, Y. Gogotsi, P. Simon, J. Phys. Chem. Lett. 2011, 2, 2396.
[2] M. D. Levi, G. Salitra, N. Levy, D. Aurbach, J. Maier, Nat. Mater. 2009, 8, 872. [3] M. D. Levi, N. Levy, S. Sigalov, G. Salitra, D. Aurbach, J. Maier, J. Am. Chem. Soc. 2010,
132, 13220. [4] W.-Y. Tsai, P.-C. Gao, B. Daffos, P.-L. Taberna, C. R. Perez, Y. Gogotsi, F. Favier, P.
Simon, Electrochem. Commun. 2013, 34, 109. [5] W.-Y. Tsai, R. Lin, S. Murali, L. Li Zhang, J. K. McDonough, R. S. Ruoff, P.-L. Taberna,
Y. Gogotsi, P. Simon, Nano Energy 2013, 2, 403. [6] P.-C. Gao, W.-Y. Tsai, B. Daffos, P.-L. Taberna, C. R. Pérez, Y. Gogotsi, P. Simon, F.
Favier, Nano Energy 2014, DOI 10.1016/j.nanoen.2014.12.017. [7] W.-Y. Tsai, P.-L. Taberna, P. Simon, J. Am. Chem. Soc. 2014, 136, 8722. [8] J. M. Griffin, A. C. Forse, W.-Y. Tsai, P.-L. Taberna, P. Simon, C. P. Grey, Nat. Mater.
2015, In press [9] “Poseidon 510 In Situ Electrochemistry TEM Holder,” can be found under
http://www.protochips.com/products/poseidon-500.html, n.d. [10] M. E. Holtz, Y. Yu, D. Gunceler, J. Gao, R. Sundararaman, K. A. Schwarz, T. A. Arias, H.
D. Abruña, D. A. Muller, Nano Lett. 2014, 14, 1453.

Résumé de Thèse


Résumé de Thèse
177
Introduction
Un des défis majeurs auquel notre société fait face est la raréfaction d'énergies fossiles,
la dégradation écologique ainsi que le changement climatique causé par la consommation de
ces énergies. Par conséquent, la recherche a été axée sur le développement de solutions
durables et renouvelables, pour obtenir des ressources d'énergie non-exhaustives, comme
l'énergie solaire, l'énergie éolienne, l'énergie des vagues, l'énergie géothermique, l'énergie
marémotrice, etc. En principe, ces méthodes impliquent la conversion de différentes formes
d'énergie (par exemple chaleur, nucléaire, énergie rayonnante, etc...) en énergie électrique
(systèmes de conversion d'énergie). Toutefois, l’énergie ne peut pas être produite de façon
continue mais doit répondre à une certaine demande en temps utile, soulignant ainsi la
nécessité de systèmes de stockage d'énergie.
Le diagramme de Ragone (Figure 1[1]
) est couramment utilisé pour présenter et comparer
la performance des différents systèmes de stockage d'énergie.[2]
Comme l’indique le
diagramme, les batteries, les condensateurs électrochimiques, et les condensateurs sont les trois
principaux systèmes qui peuvent être utilisés pour stocker de l'énergie. Chaque système fournit
des caractéristiques différentes en termes de puissance spécifique et d'énergie spécifique.
L’énergie spécifique indique la quantité d'énergie qui peut être stockée dans le dispositif, et la
puissance spécifique détermine la vitesse à laquelle l'appareil peut délivrer son énergie. Les
lignes en pointillés du diagramme indiquent le temps nécessaire pour retirer toute l'énergie
stockée dans le dispositif ce qui équivaut à la constante de temps des systèmes. Bien que de
grands efforts ont été effectués pour développer des batteries lithium-ion et d’autres batteries
secondaires, elles souffrent encore d’une faible puissance. Les systèmes de stockage d'énergie
ayant de grande puissance sont nécessaires dans un certain nombre d'applications. Par
conséquent, les condensateurs électrochimiques, qui sont des dispositifs de puissance et
peuvent être entièrement chargés ou déchargés en quelques secondes, sont des systèmes de plus
en plus développés.[3,4]

Résumé de Thèse
178
Figure 1: Diagramme de Ragone représentant la puissance spécifique en fonction de l’énergie spécifique de différents systèmes de stockage de l’énergie.
[1]
Comme le montre le diagramme de Ragone (Figure 1), les condensateurs électrochimiques,
également connus sous le nom de supercondensateurs ou condensateurs électrochimiques à
double couche (EDLC), ont font le lien entre les batteries et les condensateurs classiques. Ils
peuvent fournir une très haute densité de puissance (15 kW/kg) mais avec une énergie plus
faible que les batteries (6 Wh/kg). Les batteries, telles que les batteries lithium-ion, ont
généralement de fortes densités d'énergie (jusqu'à 200 Wh/kg), mais de faibles puissances
(jusqu'à 1 kW/kg).[1]
Ces caractéristiques sont définies par la façon dont l'énergie est stockée
dans ces systèmes. En raison de l’attraction électrostatique non faradique entre les ions de
l'électrolyte et les charges à la surface de la matière active dans les supercondensateurs, le
temps pour le stockage et la libération des charges stockées est beaucoup plus rapide par rapport
aux batteries. En effet, dans ces dernières, les principaux mécanismes de fonctionnements sont
les réactions faradiques dans le bulk des matériaux actifs. En outre, le processus de stockage de
charge des EDLCs est très réversible par rapport à d'autres dispositifs de stockage d'énergie qui
impliquent des réactions faradiques, ainsi les EDLCs sont en mesure de durer quelques millions

Résumé de Thèse
179
de cycles. En conséquence, les supercondensateurs sont particulièrement intéressants dans les
applications où une puissance élevée est nécessaire. Ils peuvent également être considérés
comme un complément aux batteries lithium-ion lors d’utilisations à haute énergie (batteries
lithium-ion) et à haute puissance (supercondensateurs).
Bien que les supercondensateurs aient une puissance élevée, ils souffrent d'une densité
d'énergie relativement faible par rapport aux batteries. Par conséquent, le principal défi
aujourd'hui pour les supercondensateurs est d'augmenter leur densité d’énergie. L'objectif de
cette thèse est donc d'améliorer leur densité d'énergie et leur puissance, qui peut être réalisé
principalement par deux aspects différents: (1) la recherche de nouveaux électrolytes et
matériaux d'électrodes pour augmenter la densité d'énergie et améliorer l'interface
électrode/électrolyte et la microstructure d'électrode pour améliorer la densité de puissance. (2)
Améliorer la compréhension fondamentale de la charge en double couche à l'interface
électrode/électrolyte à l'aide d'une technique électrochimique in situ.
Chapitre I
Le premier chapitre de cette thèse présente l'étude bibliographique séparée en quatre
parties. Dans un premier temps sont présentés le principe de fonctionnement, les applications
des supercondensateurs ainsi que le concept général pour améliorer leur performance. Ce
travail de thèse est axé sur les supercondensateurs utilisant des matériaux actifs à base de
carbone avec une surface spécifique élevée. Plus de 95% de supercondensateurs commerciaux
utilisent le charbon actif comme électrode.
La deuxième partie de la bibliographie présente différents types de carbones et
d'électrolytes utilisés dans les EDLCs tout en présentant leurs avantages et inconvénients. Des
carbones avec différentes microstructures, telles que les oignons de carbone (OLCs)[5-7]
, les
nanotubes de carbone (NTC)[8-11]
, le graphène[12-16]
, les carbones dérivés de carbure (CDC)
[17-21], les carbones « template »
[22-24],et les charbons actifs (AC)
[25,26] ont été étudiés comme
matériaux d'électrodes pour les EDLCs. D’autre part, les électrolytes utilisés dans les EDLCs
peuvent être classés en trois catégories: électrolytes aqueux, électrolytes organiques et liquides
ioniques à température ambiante (RTILs). En général, la fenêtre électrochimique (V) est
déterminée par la nature des électrolytes. L'augmentation de la fenêtre électrochimique est un
moyen efficace pour améliorer les performances des supercondensateurs car les densités

Résumé de Thèse
180
d'énergie (E) et de puissance (P) dépendent du carré de la tension (E=½ CV2
; P=V2/4R). Ceci
est la raison pour laquelle la recherche a évolué progressivement des électrolytes aqueux (~ 1 V)
vers les électrolytes organiques (~ 2,7 V) puis vers les liquides ioniques à température ambiante
(> 3 V). Cette thèse se concentre donc principalement sur les électrolytes organiques et les
liquides ioniques.
Bien que des efforts aient été faits sur la recherche de nouveaux matériaux d'électrodes et
d'électrolytes, l'amélioration de la densité d'énergie a en revanche été minime en raison du
manque de compréhension fondamentale sur les mécanismes de stockage de charge de la
double couche électrique. La troisième partie de la bibliographie présente l'état de l'art sur la
double couche électrochimique et sur la relation entre la taille des pores et la taille des ions : une
découverte importante a été rapportée en 2006[27]
par notre équipe en utilisant des carbones
dérivés de carbure (CDCs) avec une distribution de taille des pores finement contrôlée. Il a été
constaté que la capacité augmente de façon spectaculaire lorsque la taille des pores de carbone
est inférieure à la taille des ions solvatés, ce qui suggère que les ions pourraient perdre une
partie de leur couche de solvatation pour accéder à ces nanopores confinés (Figure 2). Suite à
cette étude, de nombreux travaux ont été dédiés à la compréhension de l'origine de cette
augmentation de capacité, ainsi que la physique d'adsorption et le transport des ions dans le
carbone microporeux confiné.
Figure 2: (A) Variation de la capacité spécifique en fonction de la taille des pores de carbone ; Illustration de l’adsorption des ions dans des pores de (B) > 2 nm, (C) 1-2 nm, et (C) < 2 nm.
[27]

Résumé de Thèse
181
De plus, il a été constaté que, dans un électrolyte sans solvant (un liquide ionique), la
capacité maximale est atteinte lorsque la taille des pores est proche de la taille de l'ion.[28]
D’un
point de vue du design du matériau, tous ces résultats ont souligné la nécessité d'adapter la taille
des pores d'électrode à la taille des ions d'électrolyte. Cela indique que les micropores (taille des
pores < 2 nm) sont importants pour l’optimisation de la capacité et donc la densité d'énergie.
Cependant, d’autres rapports suggèrent également que le carbone contenant uniquement des
micropores induit des limitations du transfert des ions, ce qui peut conduire à une diminution de
la puissance.[29]
D'autre part, il a été proposé que la présence de mésopores, généralement de 2 à
8 nm, peut accélérer le processus cinétique du transport des ions dans les électrodes et améliorer
la puissance.[30,31]
En conséquence, la conception de matériaux d'électrodes possédant de
micro-architectures hiérarchisées avec une grande quantité de micropores et une haute surface
spécifique (SSA), combinées à une courte distance effective pour le transport des ions et une
voie de recherche qui se développe.[32-36]
Cependant, pour améliorer les supercondensateurs
efficacement, la recherche fondamentale pour comprendre la dynamique des ions dans
l'électrode, en particulier dans les micropores confinés, est nécessaire.
Pour obtenir une vision claire du mécanisme de charge, de la dynamique dans l'espace
confiné et de la physique fondamentale sur l'augmentation de la capacité, il est nécessaire
d’utiliser des techniques électrochimiques in situ pour suivre les molécules des électrolytes en
temps réel. De nos jours, il nous manque encore des techniques pour étudier la relation entre le
degré locale de la séparation de charge et la structure locale des pores. Par conséquent, les
simulations et les modélisations sont aussi importantes pour comprendre ce qui explique
l'augmentation de stockage de charge et comment ça se passe. La quatrième partie de ce
chapitre résume donc l’ensemble de nos connaissances sur la charge de double couche du point
de vue de la modélisation.
Chapitre II
Le deuxième chapitre décrit les différents charbons actifs commerciaux et électrolytes
testés lors de ces travaux. Également, les différentes méthodes électrochimiques
(voltampérométrie cyclique, chronoampérométrie et spectroscopie d'impédance
électrochimique) et configurations de cellules électrochimiques (Swagelok® et microélectrode

Résumé de Thèse
182
à cavité) utilisées pour caractériser les supercondensateurs sont présentées.
Chapitre III
Les matériaux d'électrode présentent des mauvaises performances capacitives dans les
liquides ioniques à température ambiante ou à basse température [18,28,37]
en raison de la faible
mobilité des ions dans l’électrolyte confiné dans le réseau microporeux. La structure des pores
qui contient des micropores et des mésopores peut améliorer la cinétique de transport des ions
dans les matériaux. Le but de ce chapitre est de construire des supercondensateurs performants
qui permettent un fonctionnement sur une vaste plage de la température.
Un mélange de liquides ioniques (LIs), (PIP13FSI)0.5(PYR14FSI)0.5, qui possède une large
fenêtre électrochimique stable sur une grande gamme de température est choisi dans cette étude.
Dans le travail précédent [37]
, ce mélange de liquides ioniques a montré une puissance
exceptionnelle mais une faible capacité (30 F/g) avec des carbones exohédraux. Par conséquent,
des carbones avec différentes microstructures donc différentes accessibilités des ions sont
étudiés afin d'optimiser l'interface carbone/électrolyte et accroître la quantité et la qualité de
stockage de charge sur une large plage de température.
III.1 SiC-CDC à porosité hiérarchique micro/mésoporeux
Une voie originale de synthèse de carbures mésoporeux ordonnés a été développée
récemment par Favier et al utilisant la réaction de réduction magnésio-thermale sur des
composites mésoporeux en carbure de silicium.[38,39]
Cette partie examine la performance
électrochimique des carbones dérivés des carbures de silicium ordonnés micro/mésoporeux
(SiC-CDC) dans le mélange eutectique de LIs. La synthèse du carbure de silicium et une partie
des caractérisations des matériaux ont été menées par l'équipe du Dr. Fédéric Favier
(Montpellier, France). La chloration de carbure de silicium a été mise en œuvre par l'équipe du
professeur Yury Gogotsi (Drexel University, USA). Les analyses d'isotherme d’adsorption et
de MET des SiC-CDCs ont montré que la structure mésoporeuse du carbure de silicium a été
conservée après chloration, une fraction importante (~ 70%) des pores ayant des tailles
supérieures à 2 nm. En outre, le SiC-CDC contient des micropores étroitement distribué autour
de 1 nm. Le charbon actif commercial (YP-50F), qui contient principalement des micropores
(92% de pores ont une taille inférieure à 2 nm) sans structure hiérarchique, est testé aux mêmes
conditions électrochimiques pour la comparaison avec le SiC-CDC. Les caractéristiques

Résumé de Thèse
183
concernant la porosité des SiC-CDC et YP-50F sont résumées dans Tableau 1.
Tableau 1: Les caractéristiques des SiC-CDC et YP-50F
SiC-CDC YP-50F
BET SSA (m2/g) 1619 1732
Volume de pore total (cc/g) 1.59 0.75
Pourcentage de pore < 1 nm (%) 17.5 66
Pourcentage de pore entre 12 nm (%) 13.5 26
Pourcentage de pore > 2 nm (%) 69 8
Pic ou moyenne de la taille des pores (nm) 1 and 3-4 0.9
Résultats
Les Figure 3a et b montrent les voltammogrammes cycliques (CVs) du SiC-CDC et du
YP-50F à température élevée (20 ≤ T ≤ 60 °C) avec une vitesse de balayage de 20 mV/s jusqu'à
3 V. Tous les CVs conservent des caractéristiques capacitives. La capacité spécifique (calculée
à partir de la pente de la courbe de charge (Q) – tension (V) pendant la décharge à 5 mV/s à 20
°C) du SiC-CDC et du YP-50F sont de 55 et 74 F/g, respectivement. Le YP-50F présente une
capacité plus élevée en raison de sa teneur élevée en micropores, qui est également responsable
de la grande distorsion dans les CVs. Le SiC-CDC présente un comportement électrochimique
similaire entre 20 et 60 °C à 20 mV/s. Le YP-50F montre une capacité supérieure à celle du
SiC-CDC parmi toutes les températures testées.

Résumé de Thèse
184
Figure 3: caractérisation électrochimique des SiC-CDC et YP-50F (a, b) à températures élevées (20 ≤ T ≤ 60 °C) – CVs à 20 mV/s et (c, d) températures inférieures à zéro (20 et 40 °C) – CVs à 5 mV/s
La caractérisation électrochimique des SiC-CDC et YP-50F à des températures inférieures
à zéro (20 et 40 °C) sont présentés sur les Figure 3c et d. Les CVs à 5 mV/s jusqu'à 3,5 V
montrent que les deux carbones se comportent différemment lorsque la température diminue.
La capacité du YP-50F est réduite de façon considérable (de 25 et 11 F/g pour 20 et 40 °C,
respectivement), ce qui correspondent à 34% et 15% de la capacité à la température ambiante,
alors que le SiC-CDC à 40 °C garde 70% de la capacité obtenue à température ambiante. Les
résultats indiquent que, à basse température, les ions ont une faible mobilité et donc moins
d’accessibilité à la microporosité du carbone (YP-50F) comparé à un matériau qui présente un
réseau hiérarchique (SiC-CDC).
En ce qui concerne la puissance, le SiC-CDC montre une meilleure rétention de capacité
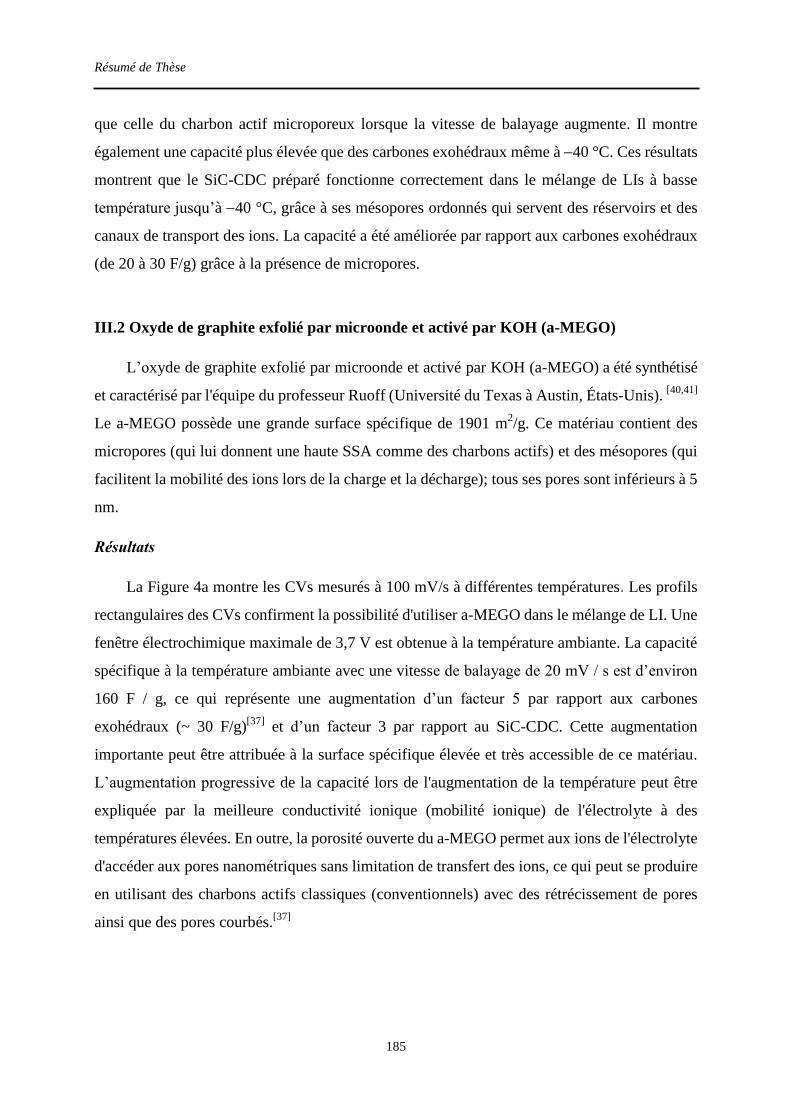
Résumé de Thèse
185
que celle du charbon actif microporeux lorsque la vitesse de balayage augmente. Il montre
également une capacité plus élevée que des carbones exohédraux même à 40 °C. Ces résultats
montrent que le SiC-CDC préparé fonctionne correctement dans le mélange de LIs à basse
température jusqu’à 40 °C, grâce à ses mésopores ordonnés qui servent des réservoirs et des
canaux de transport des ions. La capacité a été améliorée par rapport aux carbones exohédraux
(de 20 à 30 F/g) grâce à la présence de micropores.
III.2 Oxyde de graphite exfolié par microonde et activé par KOH (a-MEGO)
L’oxyde de graphite exfolié par microonde et activé par KOH (a-MEGO) a été synthétisé
et caractérisé par l'équipe du professeur Ruoff (Université du Texas à Austin, É tats-Unis). [40,41]
Le a-MEGO possède une grande surface spécifique de 1901 m2/g. Ce matériau contient des
micropores (qui lui donnent une haute SSA comme des charbons actifs) et des mésopores (qui
facilitent la mobilité des ions lors de la charge et la décharge); tous ses pores sont inférieurs à 5
nm.
Résultats
La Figure 4a montre les CVs mesurés à 100 mV/s à différentes températures. Les profils
rectangulaires des CVs confirment la possibilité d'utiliser a-MEGO dans le mélange de LI. Une
fenêtre électrochimique maximale de 3,7 V est obtenue à la température ambiante. La capacité
spécifique à la température ambiante avec une vitesse de balayage de 20 mV / s est d’environ
160 F / g, ce qui représente une augmentation d’un facteur 5 par rapport aux carbones
exohédraux (~ 30 F/g)[37]
et d’un facteur 3 par rapport au SiC-CDC. Cette augmentation
importante peut être attribuée à la surface spécifique élevée et très accessible de ce matériau.
L’augmentation progressive de la capacité lors de l'augmentation de la température peut être
expliquée par la meilleure conductivité ionique (mobilité ionique) de l'électrolyte à des
températures élevées. En outre, la porosité ouverte du a-MEGO permet aux ions de l'électrolyte
d'accéder aux pores nanométriques sans limitation de transfert des ions, ce qui peut se produire
en utilisant des charbons actifs classiques (conventionnels) avec des rétrécissement de pores
ainsi que des pores courbés.[37]

Résumé de Thèse
186
Figure 4: caractérisation électrochimique du a-MEGO (a) à températures élevées (20 ≤ T ≤ 80 °C) – CVs à 100 mV/s et (b) températures inférieures à zéro (40 et 50 °C) – CVs à 1 mV/s
La Figure 4b montre les CVs obtenus à température inférieure à zéro (40 et 50°C). Les
CVs présentent un bon comportement capacitif à 40 ° C avec des valeurs de capacité élevés de
100 à 120 F/g. Environ 70% de la capacité est conservé à 1 mV/s (ce qui est une vitesse de
balayage raisonnable en tenant compte de la mobilité ionique réduit à des températures si
basses). Cette rétention de capacité sur cette large plage de température (de 50 à +80 °C) avec
une capacité toujours au-dessus de 100 F/g n'a jamais été rapportée dans la littérature, à notre
connaissance. [42-49]
Dans ce chapitre, le SiC-CDC micro/mésoporeux hiérarchisé a montré un bon
comportement capacitif jusqu'à -40 °C et une bien meilleure rétention de capacité à basse
température par rapport à un carbone microporeux commercial. Cependant, une faible
amélioration de la capacité a été obtenue (55 F/g) en raison de la grande quantité de mésopores
de ce carbone. Un autre matériau de graphène activé (a-MEGO) a présenté une capacité
exceptionnelle (160 F/g) ainsi qu’une large fenêtre électrochimique (jusqu'à 3,7 V) sur une
grande plage de températures de 50 à +80 °C dans le mélange de LIs. La grande surface
spécifique et les mésopores uniformément situés entre 2 et 4 nm permettent au a-MEGO de
stocker une grande quantité de charge et de maintenir un transport ionique élevé donc une haute
puissance.

Résumé de Thèse
187
Chapitre IV
En dehors du développement de nouveaux matériaux, une meilleure compréhension
fondamentale du mécanisme de stockage de charge à l'échelle moléculaire est aussi nécessaire
pour concevoir de futurs supercondensateurs. Parmi les techniques électrochimiques in-situ, la
microbalance à quartz électrochimique (EQCM) est révélée particulièrement bien adaptée à
l’étude in-situ des propriétés interfaciales électrochimiques dans le carbone poreux.[50][51]
Par
conséquent, la technique EQCM est utilisée pour étudier les mécanismes de charge/décharge de
la double couche et la dynamique des ions confinés dans les micropores du carbone. Dans ce
chapitre, le liquide ionique EMI-TFSI pur et solvaté dans l'acétonitrile (AN) ainsi que des
CDCs microporeux ayant une grande (1 nm) et une petite (0,65 nm) taille de pores sont utilisés
pour étudier l'influence de la présence de solvant et l'impact de la taille des pores du carbone.
IV.1 EMITFSI pur
IV.1.1 CDC-1nm
Les résultats de l’EQCM montrent que la masse de l'électrode augmente pendant la charge
du supercondensateur et diminue pendant la décharge. La variation de masse peut être
considérée, dans une première approximation, comme étant causée par l'adsorption/désorption
des contre-ions (ion avec un signe opposé à celui de l'électrode). La Figure 5 montre la variation
de masse de l'électrode (Δm) en fonction de la charge accumulée sur l'électrode (ΔQ) au cours
de la charge des ions (la ligne solide bleu). À supposer qu'il y a aucune polarisation (ΔQ = 0) à
OCV (tension de circuit ouvert), l'électrode de carbone est polarisée négativement (ΔQ <0)
lorsque le potentiel est inférieur à OCV et polarisée positivement (ΔQ> 0) lorsque le potentiel
est au-dessus de OCV. La variation de masse théorique est indiquée en rouge pointillé sur la
Figure 5 (obtenu en appliquant la loi de Faraday). Il convient de noter que le changement de
masse théorique considère que la charge accumulée sur l'électrode est compensée par
l’adsorption d’EMI+ seulement ou l’adsorption d’TFSI
seulement.

Résumé de Thèse
188
Figure 5: la variation de masse en fonction de la charge du CDC-1nm dans le EMI-TFSI pur.
En outre, la masse moléculaire apparente (Mw’) des espèces qui interagissent avec
l'électrode pendant les mesures électrochimiques peut être calculée à partir de la pente de la
courbe expérimentale de Δm-ΔQ. À partir de l'OCV (ΔQ = 0), il y a une variation linéaire de la
masse de l'électrode lorsque la charge négative est accumulée (Figure 5, domaine I). La masse
moléculaire apparente (Mw’) des espèces adsorbées, est calculée à partir de la pente de la courbe
expérimentale et correspond à 97 g/mol, ce qui s’approche de la masse moléculaire du cation
EMI+ cations qui est de 111 g/mol. Cela montre que, dans le domaine I, la charge dans
l'électrode poreuse est compensée principalement par l’adsorption de cations. Il semble
qu’aucun co-ion (ion avec le même signe à celui de l'électrode) ne soit impliqué. Le même
comportement a déjà été signalé et décrit par Levi et al [50,51]
comme perm-sélectivité: seule
l'adsorption de les contre-ions compensent la charge à l'électrode de carbone.
Un comportement différent est observé pendant l’adsorption des anions (polarisation
positive, ΔQ > 0) : le changement de masse augmente d’abord lentement pour une charge
positive inférieure à +0,3 mC/cm2 (domaine II), et puis atteint une pente constante pour une
charge de plus de +0,3 mC/cm2 (domaine III). Dans la partie linéaire du domaine III (ΔQ > +0,3
mC/cm2), la masse moléculaire apparente des espèces adsorbées calculée est de 270 g/mol,
proche de celle des anions nus (280 g/mol pour TFSI). Cela suggère que, pour une polarisation
élévée, le mécanisme de stockage de charge consiste principalement en l’adsorption des anions

Résumé de Thèse
189
dans des nanopores confinés. Cependant, pour une polarisation plus faible dans le domaine II
(ΔQ < +0,3 mC/cm2), l’adsorption des anions TFSI
n’est pas le seul processus impliqué
pendant la charge puisque la pente experimentale est différente de la pente théorique. Ce
comportement a déjà été signalé par Levi et al., [51]
et correspond à une zone d'échange des ions.
Dans cette petite plage de polarisation positive, les anions pénètrent dans les nanopores tandis
que les cations sont expulsés de l'électrode en même temps, ce qui conduit à une rupture de la
perm-sélectivité dans les micropores de 1 nm.[51,52]
Par conséquent, la varaiation de masse et la
masse moléculaire apparente observé par EQCM sont inférieures à la théorie. Lors d'une
augmentation plus importante de la polarisation (ΔQ > +0,3 mC/cm2, le domaine III), la courbe
Δm-ΔQ montre que seul le transfert des anions est observé et la perm-sélectivité de l'électrode
est récupérée. Cela montre aussi que les anions TFSI ont besoin de plus d'énergie pour se
déplacer. Lorsque l'énergie est faible (polarisation faible, ΔQ < +0,3 mC/cm2), les cations EMI
+
réagissent plus vite que les anions TFSI pour compenser la charge. Ce qui suggère que les
cations sont plus mobiles que les anions dans les nanopores 1 nm confinés.
IV.1.2 CDC-0.65nm
Les résultats du CDC avec une plus petite taille de pores (0.65 nm) testé dans l’EMI-TFSI
pur sont présentés sur la Figure 6. Puisque la taille des pores de CDC est plus petite que celle
des cations et des anions (0,76 et 0,79 nm, respectivement), il est prévu que les ions ont un accès
limité à la porosité, comme indiqué précédemment par Segalini et al.[53]
La Figure 6 présente la
variation de la masse de l'électrode mesurée par EQCM (ligne continue bleue) et théoriquement
calculée à partir de la loi de Faraday (ligne pointillée rouge) en fonction de la charge accumulée
sur l'électrode (ΔQ) pendant la charge des ions. Il a été constaté que pour la polarisation positive
et négative, il y a beaucoup moins de charge stockée sur l'électrode que pour le CDC-1 nm
(Figure 5) et presque aucun changement de masse n’est observé. Cela suggère que les cations et
les anions ont des difficultés pour accéder aux nanopores.
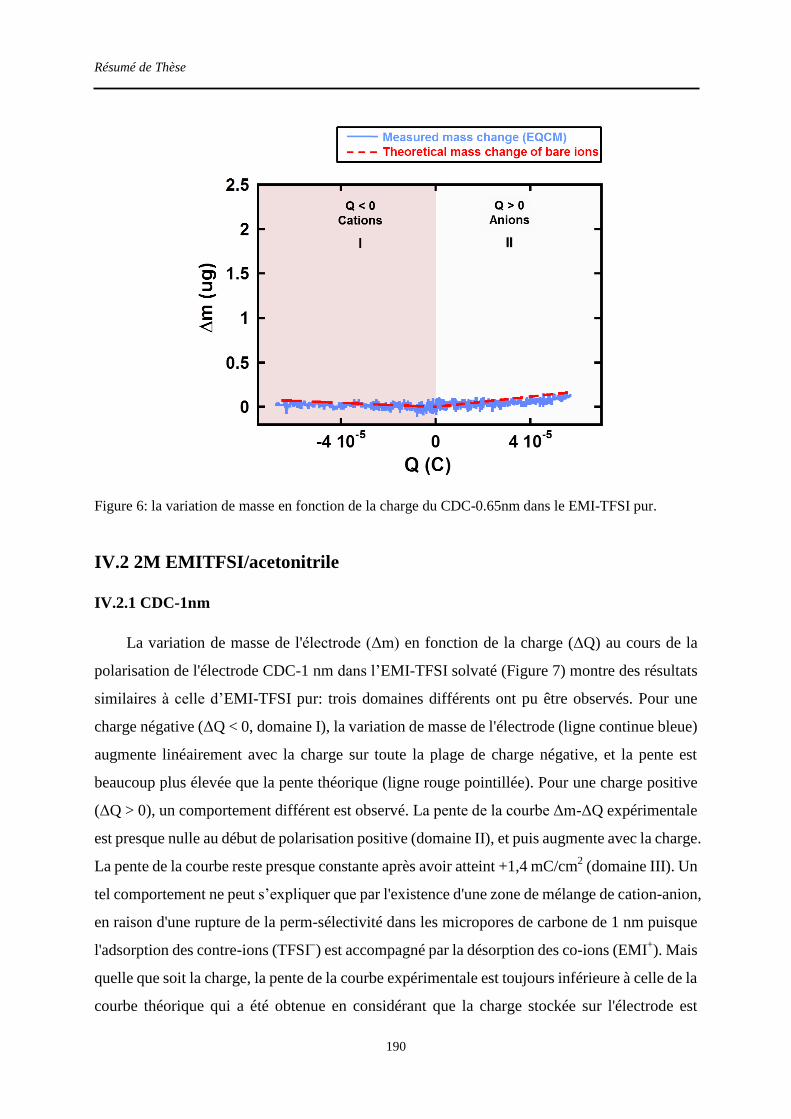
Résumé de Thèse
190
Figure 6: la variation de masse en fonction de la charge du CDC-0.65nm dans le EMI-TFSI pur.
IV.2 2M EMITFSI/acetonitrile
IV.2.1 CDC-1nm
La variation de masse de l'électrode (Δm) en fonction de la charge (ΔQ) au cours de la
polarisation de l'électrode CDC-1 nm dans l’EMI-TFSI solvaté (Figure 7) montre des résultats
similaires à celle d’EMI-TFSI pur: trois domaines différents ont pu être observés. Pour une
charge négative (ΔQ < 0, domaine I), la variation de masse de l'électrode (ligne continue bleue)
augmente linéairement avec la charge sur toute la plage de charge négative, et la pente est
beaucoup plus élevée que la pente théorique (ligne rouge pointillée). Pour une charge positive
(ΔQ > 0), un comportement différent est observé. La pente de la courbe Δm-ΔQ expérimentale
est presque nulle au début de polarisation positive (domaine II), et puis augmente avec la charge.
La pente de la courbe reste presque constante après avoir atteint +1,4 mC/cm2 (domaine III). Un
tel comportement ne peut s’expliquer que par l'existence d'une zone de mélange de cation-anion,
en raison d'une rupture de la perm-sélectivité dans les micropores de carbone de 1 nm puisque
l'adsorption des contre-ions (TFSI) est accompagné par la désorption des co-ions (EMI
+). Mais
quelle que soit la charge, la pente de la courbe expérimentale est toujours inférieure à celle de la
courbe théorique qui a été obtenue en considérant que la charge stockée sur l'électrode est

Résumé de Thèse
191
compensée seulement par l’adsorption des anions TFSI non solvatés.
Figure 7: la variation de masse en fonction de la charge du CDC-1nm dans le EMI-TFSI solvaté.
Pour une polarisation négative (domaine I), la masse moléculaire apparente calculée est
de 265 g/mol, ce qui est beaucoup plus élevé que la masse moléculaire de EMI+ non solvaté
(111 g/mol). En supposant que la charge stockée ait été équilibrée que par des cations avec
une efficacité de 100% et que la différence entre ces deux valeurs provienne de la présence de
molécules du solvant entourant les cations pendant le processus d'adsorption, le nombre de
solvatation des EMI+ cations dans l'acétonitrile peut donc être calculé. Basé sur le calcul, il y
a en moyenne 3,7 molécules d’acétonitrile entrant dans les pores avec un cation EMI+. Pour
une polarisation positive (domaine III), la masse moléculaire apparente calculée est d’environ
208 g/mol, moins de la masse moléculaire de TFSI (280 g/mol). Toutefois, cela ne signifie
pas qu'il n'y ait aucune molécule d'acétonitrile solvatée autour de l’anion TFSI. En fait, la
pente de la courbe augmente très lentement avec la charge dans le domaine III, mais il est
impossible d'extraire le nombre de solvatation d’acétonitrile en raison de la fenêtre
électrochimique limitée.
Ces résultats indiquent que pour une polarisation négative, malgré la présence de la
couche de solvatation des cations EMI+, les micropores 1 nm montrent un comportement de
perm-sélective étant donné qu’il n'y a pas de zone de mélange cations-anions dans cette
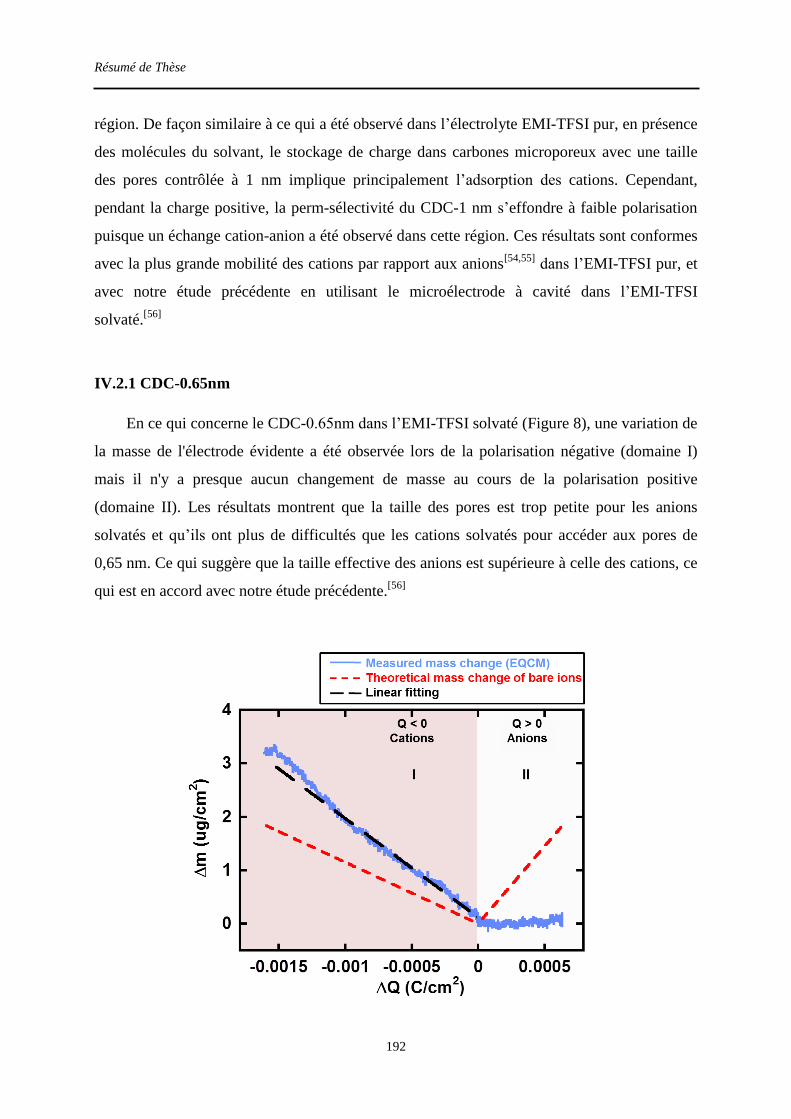
Résumé de Thèse
192
région. De façon similaire à ce qui a été observé dans l’électrolyte EMI-TFSI pur, en présence
des molécules du solvant, le stockage de charge dans carbones microporeux avec une taille
des pores contrôlée à 1 nm implique principalement l’adsorption des cations. Cependant,
pendant la charge positive, la perm-sélectivité du CDC-1 nm s’effondre à faible polarisation
puisque un échange cation-anion a été observé dans cette région. Ces résultats sont conformes
avec la plus grande mobilité des cations par rapport aux anions[54,55]
dans l’EMI-TFSI pur, et
avec notre étude précédente en utilisant le microélectrode à cavité dans l’EMI-TFSI
solvaté.[56]
IV.2.1 CDC-0.65nm
En ce qui concerne le CDC-0.65nm dans l’EMI-TFSI solvaté (Figure 8), une variation de
la masse de l'électrode évidente a été observée lors de la polarisation négative (domaine I)
mais il n'y a presque aucun changement de masse au cours de la polarisation positive
(domaine II). Les résultats montrent que la taille des pores est trop petite pour les anions
solvatés et qu’ils ont plus de difficultés que les cations solvatés pour accéder aux pores de
0,65 nm. Ce qui suggère que la taille effective des anions est supérieure à celle des cations, ce
qui est en accord avec notre étude précédente.[56]

Résumé de Thèse
193
Figure 8: la variation de masse en fonction de la charge du CDC-0.65nm dans le EMI-TFSI solvaté.
Pour l’adsorption des cations (ΔQ < 0, domaine I), la même tendance que pour le CDC-1
nm dans le EMI-TFSI solvaté est observée, sauf que la pente de la courbe Δm-ΔQ est plus
faible. De la pente de la courbe, une masse moléculaire moyenne de 179 g/mole a été obtenue,
ce qui correspond à un nombre de solvatation de 1,6. Un nombre de solvatation plus petit a
été constaté pour l’adsorption des cations EMI+ dans les pores de 0,65 nm que dans celles de
1 nm (nombre de solvatation de 3,7), ce qui met en évidence la désolvatation partielle des
cations lors de l'accès aux petits pores.
Chapter V
Puisque la technique EQCM ne permet pas de suivre la contribution individuelle de
chaque espèce électrolytique, une autre technique in-situ permettant de collecter informations
quantitatives sur des espèces choisies est nécessaire pour compléter le puzzle de stockage de
charge. La spectroscopie à résonance magnétique nucléaire (RMN) in-situ qui est une
technique puissante permettant l'observation et la quantification des différentes espèces
chimiques dans les systèmes électrochimiques [57-63]
a été choisie pour être associée à
l’EQCM in-situ pour étudier le même système électrode/électrolyte dans les mêmes
conditions (en chronoampérométrie).
Dans ce chapitre, des électrodes de charbon actif (YP-50F) ont été étudiées dans un
électrolyte de tétraéthylphosphonium tétrafluoroborate (PEt4BF4) solvaté dans l'acétonitrile par
EQCM in-situ et RMN in-situ. En choisissant ce sel, les cations PEt4 et les anions BF4
ont été
suivis individuellement en temps réel en utilisant in-situ 31
P-RMN et 19
F-RMN pendant la
charge et la décharge du supercondensateur. La variation de masse de l'électrode pendant les
mesures électrochimiques a été mesurée par EQCM pour fournir plus d’informations sur la
solvatation. La combinaison de ces deux techniques in-situ devrait fournir des informations
plus approfondies sur le changement de la structure de double couche pendant le
fonctionnement des supercondensateurs.
Résultats de RMN in situ
Les supercondensateurs ont été chargés positivement à partir de la tension de cellule de 0 à
1,5 V par pas de 0,25 V, puis déchargés à 0 V avant d’être chargé négativement à 1.5 V par pas

Résumé de Thèse
194
de 0.25 V. Les spectres RMN enregistrés à différentes états de charge sont présentés sur la
Figure 9. Pour la polarisation positive et négative, les résonances qui correspondent aux cations
et aux anions dans les micropores (marqué « in-pore ») se décalent à une fréquence plus élevée
dans les spectres RMN au cours de la charge des cellules. Cela s'explique par des changements
dans le déplacement chimique indépendant du noyau (NICS) qui résultent de la charge
électronique développé à l'intérieur de l'électrode de carbone.[64,65]
Les variations de l'intensité
de résonance « in-pore » reflètent la variation de la population des ions à l'intérieur des
micropores. L'image qualitative offerte par ces résultats est en accord avec la vision
traditionnelle de la charge du supercondensateur: quand une charge électique est accumulée sur
l'électrode de carbone, les contre-ions sont adsorbés à l’interface électrode/électrolyte dans les
micropores pour équilibrer la charge électrique.
Figure 9: Spectres du 31
P-RMN (à gauche, en rouge) et 19
F-RMN (à droite, en vert) d’électrode de supercondensateur à diffèrentes états de charge.
La Figure 10 montre les valeurs quantitatives d’ions dans les pores, obtenues à partir des
intensités de résonance « in-pore » déconvoluées à différents états de charge. Pour une plage de

Résumé de Thèse
195
tension de cellule négative (de 0 à 1,5 V), la population des cations dans les pores augmente
avec la charge et la population des anions dans les pores ne montre aucun changement
significatif. Fait intéressant, un comportement différent a été trouvé dans la plage de tension de
cellule positive (0 à +1,5 V). Au cours de la charge positive, la population des anions dans les
pores augmente tandis que celle des cations diminue, et la quantité de cations expulsés des
pores est environ la même que celle des anions adsorbés.
Figure 10: Population des ions aux électrodes de supercondensateurs à diffèrents états de charge de –1.5 à +1.5 V
A partir des populations des ions, il est relativement simple de déterminer la charge
ionique totale à chaque pas de potentiel et de comparer avec la charge électrique stockée sur
l'électrode de carbone (par intégration du courant en fonction du temps). Un bon accord global
a été trouvé entre la charge ionique à l'intérieur des micropores et la charge électrique stockée.
Cela suggère que seuls les ions à l'intérieur des micropores sont responsables du stockage de
charge, les ions à l'extérieur des micropores fonctionnant comme un réservoir pour l'intérieur et
ne jouant pas un rôle important dans le processus de stockage de charge. Ces résultats
confirment également que pour la plage de tensions négatives (de 0 à 1.5 V), l’adsorption des
cations domine le stockage de charge; tandis que pour la plage positive (de 0 à +1.5 V), les deux
ions sont impliqués pour équilibrer la charge électronique. Un échange d'ions est observé, ce

Résumé de Thèse
196
qui est similaire aux mécanismes de charge observées dans l’électrolyte à base de EMI-TFSI
dans le chapitre IV.
Résultats d’EQCM
La technique EQCM a été utilisée pour étudier le même système (YP-50F charbon actif
dans PEt4BF4/AN). À partir des résultats d’EQCM, une interprétation quantitative a été obtenue
en comparant les variations de masse expérimentales aux valeurs théoriques qui sont basées sur
différents modèles concernant les mécanismes de charge. La Figure 11 montre les variations de
masse expérimentale et théorique en fonction de la charge capacitive stockée sur l'électrode.
Les variations de masse théoriques ont été calculées par deux mécanismes de charge différents.
Pour le premier modèle (marqué par des triangles rouges), un mécanisme d’adsorption simple
est considéré, partant de l'hypothèse traditionnelle qu’une charge négative (positive) stockée
dans l'électrode est compensée par l’adsorption d’un seul cation (anion) sur la surface de
l'électrode. Pour une polarisation négative, la variation de masse mesurée est beaucoup plus
élevée que la variation théorique sur toute la gamme de charge. Cependant, il faut remarquer
que, contrairement aux mesures de RMN qui observent sélectivement les populations de
cations et d’anions dans les pores, la variation de masse mesurée par EQCM provient de toutes
les espèces dans l’électrolyte (y compris les molécules de solvant) qui entrent et sortent de
l'électrode poreuse. Les données RMN (Figure 10) montrent que la population d'anions reste
constante au cours de la polarisation négative; et par conséquent, les espèces adsorbées
additionelles doivent être des molécules de solvant. La masse moléculaire expérimentale est de
369 g/mol, ce qui est beaucoup plus élevé que celle des cations PEt4 non solvatés (147 g/mol).
En supposant que les espèces adsorbées sont des cations PEt4 et que la masse additionelle
provient de molécules d’acétonitrile, le nombre de solvatation des cations est estimé à 5,4. Cette
valeur est légèrement inférieure au nombre de solvatation des cations qui est de 7 (prédit par des
cations NEt4 [66]
), ce qui indique que les cations sont partiellement désolvaté quand ils entrent
dans les micropores de carbone.

Résumé de Thèse
197
Figure 11: Comparaison des variations de masse d’électrode expérimentale et calculée (basé sur les modèles différents) en fonction de la charge
Pour une polarisation positive, la Figure 11 montre que le modèle d’adsorption simple
prédit à nouveau une augmentation de masse puisque seuls les anions BF4 sont absorbés dans
les micropores. Ceci n’est pas en accord avec les données expérimentales, où une légère
diminution de masse est observée. Au regard de cela, un deuxième modèle basé sur les résultats
de RMN (Figure 10) est considéré, où pour une polarisation d'électrode positive (négative),
deux charges stockées à la surface d'électrode sont compensées par l'adsorption d'un anion
(cation) et désorption d’un cation (anion). Les valeurs calculées basées sur ce modèle (carrés
verts) prédisent une légère diminution de la masse de l'électrode pendant la charge positive.
Cela donne une meilleure corrélation avec les valeurs expérimentales, où une diminution de la
masse est également observée. Bien qu'il ne soit pas possible d'extraire des informations claires
concernant le nombre de solvatation à cause d’une fenêtre électrochimique étroite pour un
potentiel positif et une faible masse de carbone déposée, le fait que la variation de masse de
l'électrode suive les résultats prédits par RMN confirme que le mécanisme de charge est
gouverné par l’échange d'ions.

Résumé de Thèse
198
Conclusions
Ces résultats nous permettent d’approfondir nos connaissances à l'échelle moléculaire du
processus de stockage de charge et de la structure en double couche pendant la charge. Ils
fournissent ainsi une ligne directrice pour la conception des matériaux afin d’améliorer la
performance des EDLCs. En résumé, dans les micropores confinés, les ions sont au moins
partiellement désolvatés et aucun appariement d’ions n’est observé. Par conséquent, les
contre-ions s’arrangent de façon compacte dans un espace confiné, et ni les co-ions ni les
molécules de solvant ne font écran à la charge ce qui entraîne une haute capacité et une
efficacité du stockage de charge élevée dans cet environnement confiné. D'autre part, en
fonction de la nature des ions et de l'interaction cation-anion, le processus de charge peut soit
impliquer l’adsorption des contre-ions, soit l’éjection des co-ions, ou les deux (échange d’ions).
La réorganisation et la réorientation locale des espèces électrolytiques sont également
nécessaires pour arranger efficacement les ions à l'intérieur des pores. La réorganisation
moléculaire et l’échange des ions nécessite un volume libre, ainsi les matériaux qui ont
seulement une taille de pore qui correspond à la capacité maximale à l'état d'équilibre ne
montrera pas de bonnes performances sous une charge dynamique puisque la réorganisation
locale est entravée. Au regard de cela, les mésopores pourraient être tout aussi important que les
micropores. Toutefois, dans ce travail, les mésopores dont la taille est supérieure à 4 nm
provoquent une diminution de capacité. Bien que le mécanisme de stockage de charge ne soit
pas toujours complètement compris, ces conclusions mettent en évidence l'importance
d'optimiser l'interface électrode/électrolyte par la conception d’une architecture d’électrode
contenant la quantité et la taille des micropores et des mésopores appropriées.
References
[1] P. Simon, Y. Gogotsi, Nat. Mater. 2008, 7, 845. [2] T. Christen, M. W. Carlen, J. Power Sources 2000, 91, 210. [3] B. E. Conway, Electrochemical Supercapacitors: Scientific Fundamentals and
Technological Applications, Springer, 1999. [4] F. Beguin, E. Frackowiak, Eds. , Supercapacitors: Materials, Systems and Applications -
Max Lu, Francois Beguin, Elzbieta Frackowiak, Wiley-VCH, 2013. [5] C. Portet, G. Yushin, Y. Gogotsi, Carbon 2007, 45, 2511. [6] Y. Gao, Y. S. Zhou, M. Qian, X. N. He, J. Redepenning, P. Goodman, H. M. Li, L. Jiang,
Y. F. Lu, Carbon 2013, 51, 52. [7] J. K. McDonough, Y. Gogotsi, Electrochem Soc Interface 2013, 22, 61. [8] D. N. Futaba, K. Hata, T. Yamada, T. Hiraoka, Y. Hayamizu, Y. Kakudate, O. Tanaike, H.

Résumé de Thèse
199
Hatori, M. Yumura, S. Iijima, Nat. Mater. 2006, 5, 987. [9] S. Dörfler, I. Felhösi, T. Marek, S. Thieme, H. Althues, L. Nyikos, S. Kaskel, J. Power
Sources 2013, 227, 218. [10] M. Kaempgen, C. K. Chan, J. Ma, Y. Cui, G. Gruner, Nano Lett. 2009, 9, 1872. [11] M. Noked, S. Okashy, T. Zimrin, D. Aurbach, Carbon 2013, 58, 134. [12] Y. Zhu, S. Murali, M. D. Stoller, K. J. Ganesh, W. Cai, P. J. Ferreira, A. Pirkle, R. M.
Wallace, K. A. Cychosz, M. Thommes, D. Su, E. A. Stach, R. S. Ruoff, Science 2011, 332, 1537.
[13] M. F. El-Kady, V. Strong, S. Dubin, R. B. Kaner, Science 2012, 335, 1326. [14] P. Tamilarasan, S. Ramaprabhu, J. Nanosci. Nanotechnol. 2015, 15, 1154. [15] W. Li, H.-Y. Lü, X.-L. Wu, H. Guan, Y.-Y. Wang, F. Wan, G. Wang, L.-Q. Yan, H.-M.
Xie, R.-S. Wang, RSC Adv 2015, 5, 12583. [16] F. Bonaccorso, L. Colombo, G. Yu, M. Stoller, V. Tozzini, A. C. Ferrari, R. S. Ruoff, V.
Pellegrini, Science 2015, 347, 1246501. [17] R. Dash, J. Chmiola, G. Yushin, Y. Gogotsi, G. Laudisio, J. Singer, J. Fischer, S.
Kucheyev, Carbon 2006, 44, 2489. [18] V. Presser, M. Heon, Y. Gogotsi, Adv. Funct. Mater. 2011, 21, 810. [19] C. R. Pérez, S.-H. Yeon, J. Ségalini, V. Presser, P.-L. Taberna, P. Simon, Y. Gogotsi, Adv.
Funct. Mater. 2013, 23, 1081. [20] H. Wu, X. Wang, L. Jiang, C. Wu, Q. Zhao, X. Liu, B. Hu, L. Yi, J. Power Sources 2013,
226, 202. [21] E. Tee, I. Tallo, H. Kurig, T. Thomberg, A. Jänes, E. Lust, Electrochimica Acta 2015, 161,
364. [22] A. B. Fuertes, G. Lota, T. A. Centeno, E. Frackowiak, Electrochimica Acta 2005, 50,
2799. [23] A. Kajdos, A. Kvit, F. Jones, J. Jagiello, G. Yushin, J. Am. Chem. Soc. 2010, 132, 3252. [24] Y. Korenblit, A. Kajdos, W. C. West, M. C. Smart, E. J. Brandon, A. Kvit, J. Jagiello, G.
Yushin, Adv. Funct. Mater. 2012, 22, 1655. [25] A. G. Pandolfo, A. F. Hollenkamp, J. Power Sources 2006, 157, 11. [26] M. Sevilla, R. Mokaya, Energy Environ. Sci. 2014, 7, 1250. [27] J. Chmiola, G. Yushin, Y. Gogotsi, C. Portet, P. Simon, P. L. Taberna, Science 2006, 313,
1760. [28] C. Largeot, C. Portet, J. Chmiola, P.-L. Taberna, Y. Gogotsi, P. Simon, J. Am. Chem. Soc.
2008, 130, 2730. [29] J. Leis, M. Arulepp, A. Kuura, M. Lätt, E. Lust, Carbon 2006, 44, 2122. [30] E. Frackowiak, Phys. Chem. Chem. Phys. 2007, 9, 1774. [31] J. Huang, B. G. Sumpter, V. Meunier, Chem. - Eur. J. 2008, 14, 6614. [32] D.-W. Wang, F. Li, M. Liu, G. Q. Lu, H.-M. Cheng, Angew. Chem. Int. Ed. 2008, 47, 373. [33] D.-D. Zhou, Y.-J. Du, Y.-F. Song, Y.-G. Wang, C.-X. Wang, Y.-Y. Xia, J Mater Chem A
2013, 1, 1192. [34] A. Stein, S. G. Rudisill, N. D. Petkovich, Chem. Mater. 2014, 26, 259. [35] Q. Wang, J. Yan, Y. Wang, T. Wei, M. Zhang, X. Jing, Z. Fan, Carbon 2014, 67, 119. [36] Y. Zhang, M. Ma, J. Yang, W. Huang, X. Dong, RSC Adv. 2014, 4, 8466. [37] R. Lin, P.-L. Taberna, S. Fantini, V. Presser, C. R. Pérez, F. Malbosc, N. L. Rupesinghe, K.
B. K. Teo, Y. Gogotsi, P. Simon, J. Phys. Chem. Lett. 2011, 2, 2396. [38] P.-C. Gao, Y. Lei, A. F. C. Pérez, K. Rajoua, D. Zitoun, F. Favier, J. Mater. Chem. 2011,
21, 15798. [39] P.-C. Gao, P. Simon, F. Favier, Microporous Mesoporous Mater. 2013, 180, 172. [40] Y. Zhu, S. Murali, M. D. Stoller, K. J. Ganesh, W. Cai, P. J. Ferreira, A. Pirkle, R. M.
Wallace, K. A. Cychosz, M. Thommes, D. Su, E. A. Stach, R. S. Ruoff, Science 2011, 332, 1537.
[41] Y. Zhu, S. Murali, M. D. Stoller, A. Velamakanni, R. D. Piner, R. S. Ruoff, Carbon 2010, 48, 2118.
[42] R. Kötz, M. Hahn, R. Gallay, J. Power Sources 2006, 154, 550. [43] H. Kurig, A. Jänes, E. Lust, J. Electrochem. Soc. 2010, 157, A272. [44] V. Ruiz, T. Huynh, S. R. Sivakkumar, A. G. Pandolfo, RSC Adv. 2012, 2, 5591. [45] E. Iwama, P. L. Taberna, P. Azais, L. Brégeon, P. Simon, J. Power Sources 2012, 219,
Résumé de Thèse
200
235. [46] C. Largeot, P. L. Taberna, Y. Gogotsi, P. Simon, Electrochem. Solid-State Lett. 2011, 14,
A174. [47] E. Brandon, M. Smart, W. West, NASA Techncal Rep. Serv. 2010. [48] R. Vellacheri, A. Al-Haddad, H. Zhao, W. Wang, C. Wang, Y. Lei, Nano Energy 2014, 8,
231. [49] R. Väli, A. Laheäär, A. Jänes, E. Lust, Electrochimica Acta 2014, 121, 294. [50] M. D. Levi, G. Salitra, N. Levy, D. Aurbach, J. Maier, Nat. Mater. 2009, 8, 872. [51] M. D. Levi, N. Levy, S. Sigalov, G. Salitra, D. Aurbach, J. Maier, J. Am. Chem. Soc. 2010,
132, 13220. [52] M. D. Levi, S. Sigalov, G. Salitra, R. Elazari, D. Aurbach, J. Phys. Chem. Lett. 2011, 2,
120. [53] J. Segalini, E. Iwama, P.-L. Taberna, Y. Gogotsi, P. Simon, Electrochem. Commun. 2012,
15, 63. [54] M. D. Levi, S. Sigalov, G. Salitra, D. Aurbach, J. Maier, ChemPhysChem 2011, 12, 854. [55] A. Noda, K. Hayamizu, M. Watanabe, J. Phys. Chem. B 2001, 105, 4603. [56] R. Lin, P. Huang, J. Ségalini, C. Largeot, P. L. Taberna, J. Chmiola, Y. Gogotsi, P. Simon,
Electrochimica Acta 2009, 54, 7025. [57] K. Ogata, E. Salager, C. J. Kerr, A. E. Fraser, C. Ducati, A. J. Morris, S. Hofmann, C. P.
Grey, Nat. Commun. 2014, 5, DOI 10.1038/ncomms4217. [58] A. Pestov, A. Nazirov, E. Modin, A. Mironenko, S. Bratskaya, Carbohydr. Polym. 2015,
117, 70. [59] M. Letellier, F. Chevallier, F. Béguin, E. Frackowiak, J.-N. Rouzaud, J. Phys. Chem.
Solids 2004, 65, 245. [60] J. Xu, J. Hou, W. Zhou, G. Nie, S. Pu, S. Zhang, Spectrochim. Acta. A. Mol. Biomol.
Spectrosc. 2006, 63, 723. [61] R. K. Harris, T. V. Thompson, P. R. Norman, C. Pottage, A. N. Trethewey, J Chem Soc
Faraday Trans 1995, 91, 1795. [62] K. Shen, T. Pietrass, J. Phys. Chem. B 2004, 108, 9937. [63] R. J. Anderson, T. P. McNicholas, A. Kleinhammes, A. Wang, J. Liu, Y. Wu, J. Am. Chem.
Soc. 2010, 132, 8618. [64] H. Wang, A. C. Forse, J. M. Griffin, N. M. Trease, L. Trognko, P.-L. Taberna, P. Simon, C.
P. Grey, J. Am. Chem. Soc. 2013, 135, 18968. [65] H. Wang, T. K.-J. Köster, N. M. Trease, J. Ségalini, P.-L. Taberna, P. Simon, Y. Gogotsi,
C. P. Grey, J. Am. Chem. Soc. 2011, 133, 19270. [66] Y.-J. Kim, Y. Masutzawa, S. Ozaki, M. Endo, M. S. Dresselhaus, J. Electrochem. Soc.
2004, 151, E199.


Résumé :
L'objectif de cette thèse a été d’augmenter la densité d'énergie des supercondensateurs. La première
partie de cette thèse a été consacrée à l’amélioration des performances d’une électrode de carbone
pour supercondensateur en étudiant à la fois un mélange de liquides ioniques ainsi que des carbones
offrant différents types de microstructures. Une augmentation importante de la capacité spécifique sur
une large gamme de températures (-50°C ;100°C) est obtenue en couplant un mélange eutectique de
liquides ioniques, (PIP13-FSI)0.5 (PYR14-FSI)0.5, avec un oxyde de graphite exfolié par micro-onde et
activé par KOH (a-MEGO). Cette première partie de la thèse met ainsi l’accent sur l’importance
d’optimiser l’interface carbone/électrolyte afin de maximiser la densité. Dans la deuxième partie, les
mécanismes de stockage des charges dans les pores des carbones à l’échelle moléculaire ont été
étudiés in-situ grâce à une microbalance électrochimique à cristal de quartz (EQCM). Les études
EQCM ont été menées dans deux systèmes électrode/électrolyte : (1) des carbones dérives de carbure
dans des électrolytes à base de EMI-TFSI et (2) un carbone activé dans l’électrolyte PEt4BF4. Les
résultats d'EQCM et de RMN in-situ montrent comment les ions différents et les molécules du solvant
sont impliqués pendant la charge. Ces résultats sont très encourageants et montrent que l’EQCM
constitue une sonde dont la sensibilité permet d’étudier la dynamique des ions dans la porosité des
électrodes de carbone lors de la charge et de la décharge des supercondensateurs.
Mots-clés : Supercondensateurs, adsorption des ions, carbones poreux, EQCM, solvatation
Abstract :
The aim of this PhD work focuses on different approaches to improve the energy density of
supercapacitors. First part of this thesis work is to improve the performance of supercapacitor by using
ionic liquid mixtures as electrolytes and carbons with different microstructures. A significant increase
of specific capacitance over wide temperature range (-50 to 100°C) was obtained by using an eutectic
ionic liquid mixture, (PIP13-FSI)0.5 (PYR14-FSI)0.5, with an activated microwave exfoliated graphite
oxide (a-MEGO). These results evidence that optimization of the carbon/electrolyte interface is of
great importance for maximizing the capacitive energy. In the second part of the thesis, the charge
storage mechanisms in the porous carbons at molecular scale have been studied using Electrochemical
Quartz Crystal Microbalance (EQCM). EQCM studies were conducted on two electrode/electrolyte
systems: (1) carbide-derived carbons in neat and solvated EMI-TFSI ionic liquid under dynamic
charging condition and (2) YP-50F activated carbon in solvated PEt4BF4 electrolyte under steady state
charging condition. EQCM and in-situ NMR results showed how different ions and solvent molecules
are involved in the charging process. These results provide a direct molecular-level insight into the
charge storage process, showing that EQCM is promising electrogravimetric probe to study
compositional changes in carbon microspores during charging/discharge of supercapacitors.
Keywords : Supercapacitors, ion adsorption, porous carbons, EQCM, solvation