Aligning Secondary and Postsecondary Education: Lesson from the Past

Programs of Study: Secondary and Postsecondary Outcomes
From the NRCCTE’s Longitudinal Research
James R. Stone III
Director

Since the mid-1980s we have
Added the equivalent
of one full year of core
academics (math,
science, language
arts) to high school
graduation
requirements.
(NAEP) Reading
scores have
significantly declined
(NAEP) Science
scores have
significantly declined
(NAEP) math scores
have remained
relatively unchanged

12th Grade Math Scores 2005

One solution?
Be born to smarter parents!

It is not getting better
Worst state fail to
graduate 37-41%
2010-2011
Source: One-Third of a Nation (ETS, 2005)
Best States fail to
graduate 12-14%

Special Concern: We have a boy problem
… but many of the people who don’t fit in are boys. A decade or so ago, people started writing books and articles on the boy crisis. At the time, the evidence was disputable and some experts pushed back. Since then, the evidence that boys are falling behind has mounted. The case is closed. The numbers for boys get worse and worse.
By 12th grade, male reading
scores are below females’
11th grade boys write at an 8th
grade girl level
Boys used to have an advantage
in math and science, but that gap
is nearly gone.
Boys are more likely to have
discipline problems
Boys account for ¾ all D’s and
F’s
Men are a minority in college
(40%)
2 million fewer men graduate
from college over the past
decade than women
Grad school gap is even higher David Brooks, NYT July 5, 2012

One
Solution:
A Survival
Analysis 0.00
0.10
0.20
0.30
0.40
0.50
0.60
0.70
0.80
0.90
1.00
SES9th Grade
GPA >3 CTE NoFocus >3 CTE &
Focus
Class of 2004
Males
Females
CTE Participation helps boys
“survive” high school
There is no CTE “survival” effect for girls; but it “does no harm”

Two Key Questions:
1. What is the appropriate mix of
academic, occupational and technical
skills required for the emerging labor
market?
2. How can schools help students
develop these skills?

PROGRAMS OF STUDY –
WHAT FOCUS?

College for all? Only 40% of 27-year olds have
earned an A.A. degree or higher
Note: Represents data collected in surveys between 2006-2008; GED is approximation based on data from GED Testing Program.
Source: Current Population Survey Annual Social and Economic Supplement.
What about the
60%?
What about career
development for
the 40%

More STEM or . . .
S&E occupations make up only about one-twentieth (5%) of all workers (5.3%) in 2018 Urban
Institute, 2007; (6%) in 2018, Carnevale, 2010.
435,000 U.S. citizens and permanent residents a year graduated with bachelor's, master's, and doctoral degrees in science and engineering. Over the same period, there were about 150,000 jobs added annually to the science and engineering workforce. . http://www.businessweek.com/print/smallbiz/content/oct2007/sb20071025_827398.htm
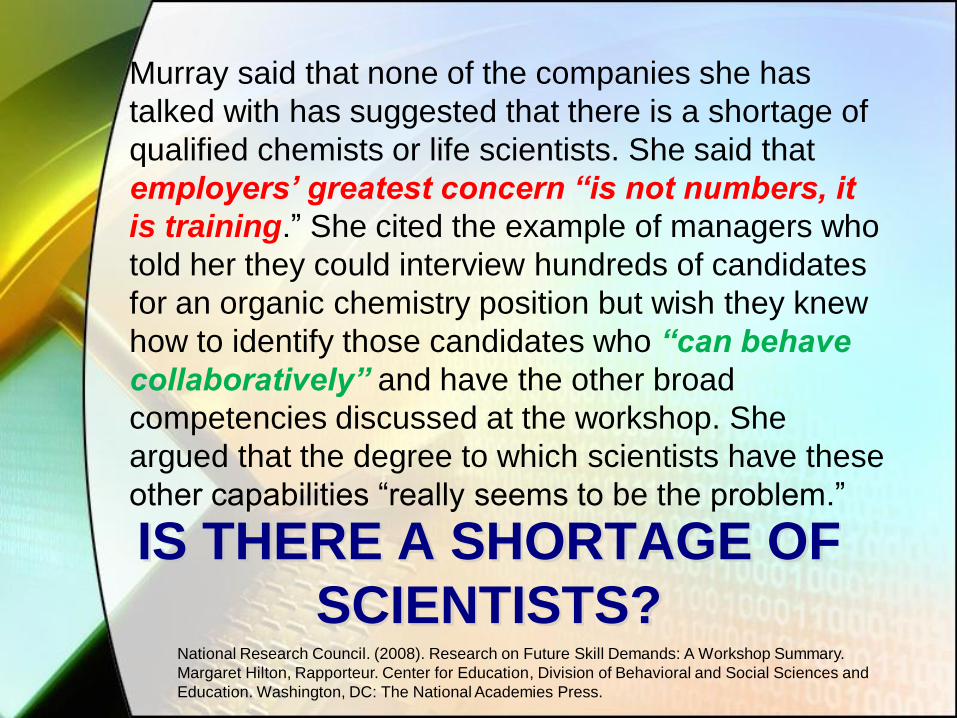
IS THERE A SHORTAGE OF
SCIENTISTS?
Murray said that none of the companies she has
talked with has suggested that there is a shortage of
qualified chemists or life scientists. She said that
employers’ greatest concern “is not numbers, it
is training.” She cited the example of managers who
told her they could interview hundreds of candidates
for an organic chemistry position but wish they knew
how to identify those candidates who “can behave
collaboratively” and have the other broad
competencies discussed at the workshop. She
argued that the degree to which scientists have these
other capabilities “really seems to be the problem.”
National Research Council. (2008). Research on Future Skill Demands: A Workshop Summary.
Margaret Hilton, Rapporteur. Center for Education, Division of Behavioral and Social Sciences and
Education. Washington, DC: The National Academies Press.

WHAT DO THE DATA SAY
ABOUT WHERE THE JOBS
ARE?
High Growth? High Demand? High Wage?
0 100,000 200,000 300,000 400,000 500,000 600,000 700,000 800,000
Registered nurses
Retail salespersons
Home health aides
Personal care aides
Office clerks, general
Food prep/service & Fast Food
Customer Service Reps
Heavy & Tractor Trailer Drivers
Laborers - freight, stock, material
Postsecondary Instructors
Nursing aides, orderlies
Child Care Workers
Booking, Accounting, Auditing Clerks
Cashiers
Elementary teachers
Receptionists and information clerks
Janitors & Cleaners
Landscaping & Groundskeeping
Sales Representatives, except technical
Construction laborers
Medical Secretaries
Office Supervisors
Carpenters
Waiters & Waitresses
Security Guards
Teacher Assistants
Accountants and Auditors
Licensed Practical Nurses
Physicians and surgeons
Medical Assistants
High Demand Occupations 2010-2020 The BLS Perspective

0% 10% 20% 30% 40% 50% 60% 70% 80%
Personal Care Aides
Home Health Aides
Biomedical Engineer
Construction Helpers
Carpenter's Helpers
Vet Tech
Rebar workers
Physical Therapy Asst
Plumber's Helpers
Event Planners
Medical Diagnostic Tech
Occ Therapy Asst
Physical Therapy Aide
Glaziers
Interpreters
Medical Secretaries
Market Research/Analysts
Marriage & Family Therapists
Brick masons
Physical Therapists
Dental Hygienists
Bicycle Repairers
Audiologists
Health Educators
Stonemasons
Cost Estimators
Medical Scientists
Mental Health Counselors
Pile-Driver Operators
Veterinarians
High Growth Occupations 2010-2020

The Other
Perspective

63% of all jobs will require some college or better by 2018.
Source: Analysis of March CPS data, various years, Center on Education and the Workforce forecasts of education demand to 2018.
Certificates
Diplomas
Apprenticeships
Other IRC

Sub-Baccalaureate Credentials
Pay Off
0%
5%
10%
15%
20%
25%
30%
35%
40%
45%
Licenses and CertificatesEarn More Than:
Associates Earn More Than:
43% 27% 31%
Associates Bachelors

Education and Future Work:
BLS & CEW
USDOL-BLS
CEW
0
10
20
30
40
50
60
23
5 6 8
58.5
33 30
36
USDOL-BLS
CEW
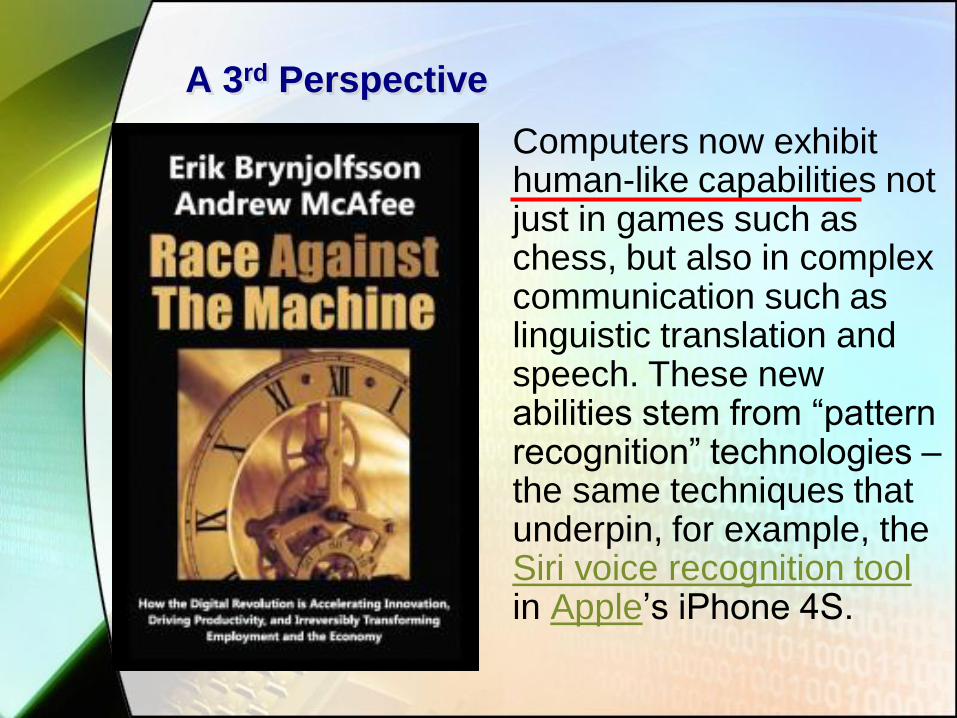
A 3rd Perspective
Computers now exhibit human-like capabilities not just in games such as chess, but also in complex communication such as linguistic translation and speech. These new abilities stem from “pattern recognition” technologies – the same techniques that underpin, for example, the Siri voice recognition tool in Apple’s iPhone 4S.

A 3rd Perspective: The Race Against the
Machine (The Machines are Winning?)
The Google car
(truck?)
IBM Watson
Deep Blue
The “Square”
Text readers/ Pattern recognition (goodbye legions of lawyers-only 60% accurate)
Automated ‘call centers’ (goodbye India)
GeoFluent (goodbye translators)
Vending machines for … everything

Can People Win?
Instructional methods
Softer skills
Instructional focus
The Human
Advantage (for now)
Khan Academy
CTSOs/WBL
Hyperspecialists,
entreprenuership
Physicality of work
Advanced pattern
recognition
General problem
solving
Creativity

PROGRAMS OF STUDY
The Solution

Why We do Experimental Research:
A Cautionary Tale
The Japanese eat very little fat and suffer fewer heart attacks than the British or Americans. The Mexicans eat a lot of fat and also suffer fewer heart attacks than the British or Americans The Japanese drink very little red wine and suffer fewer heart attacks than the British or Americans The Italians drink excessive amounts of red wine and also suffer fewer heart attacks than the British or Americans The Germans drink a lot of beer and eat lots of sausages and fats and suffer fewer heart attacks than the British or Americans CONCLUSION: Eat and drink what you like.
Speaking English is apparently what kills you.

FOR POS TO BE SUCCESSFUL
Increase Student
Engagement
Completing HS
Completing PS/
industry credential
Improve
Achievement
Academic
Occupational
Technical
Facilitate Transition
To continuing
education;
To the workplace;
To a successful
adulthood

Rigorous, Longitudinal POS Studies:
Mixed Method Studies*
A longitudinal study of three cohorts in
SC (6th, 9th, 11th graders) in three diverse
WIAs
A backward mapping (from CC) study of
three sites with 15 years of history of
POS-like programs
A random assignment or propensity
match study in five sites (3 states)
* Systems Data (transcript) & Interview, Survey Data

Caveats
These are longitudinal studies
Data collection lags actual events
• Students have to complete the “thing”
• A true POS includes HS&PS – 4+ 2-3 years minimum
• Release of system lags by 4 months to 4 years.
Early findings will point toward proximal
variables
• Progress toward graduation
• Behaviors
• Self-efficacy
• Academic & Technical Achievement
Evidence on distal variables 5+ years(?)

ENGAGEMENT

POS Student Opinion
At the comprehensive HS one student’s brother
attends,
“they don’t think about their future as much as they do
here.”
Regarding her POS HS, another student said: “I feel
really prepared because of the workload and the
different ways that we are learning why we’re doing
something. Not just learning the actual topic…[but]
the reasons behind it.”

POS Student Opinion #2
One student said she’d been disengaged from
school freshman year but by senior year, she loved
school and looked forward to her nursing career:
“This school has really changed – could really change
someone. It gets you to the career path that you
want and if you’re around people that want to do it
and succeed you’ll want to succeed.”

Do POS make a difference for students?
Over 70% of high school students reported being
in a POS made them more engaged in school and
better prepared for college and careers
35% of sample enrolled in the local (POS affiliated)
college. Of these:
• 45 - 57% continued to study in their POS area
(next slide)
• 29% of our sample (compared with 17% of
students from non-POS affiliated HS), reported
feeling “very” prepared for college level studies

Student Behavior-Engagement Percentage of POS1 2011 Cohort Switching IGP Career
Clusters, by School Poverty Index (POV)
Laurel
Poplar
Orchid
Redwood
Azalea
Apple
Iris Elm
0%
10%
20%
30%
40%
50%
60%
70%
0 2 4 6 8 10 12
Perc
en
t w
ho
Sw
itch
ed
IG
P A
rea
Poverty Index (Higher Score -> Higher Poverty)

Hot off the press:
Graduation Rates (10:30 this morning)
97.5% 95.5% 95.3%
40
50
60
70
80
90
100
POS Completers All Comparison ComparisonPathway
Completers

ACHIEVEMENT

Weighted Cumulative Overall
GPA HOT OFF THE PRESS
2.74 2.72 2.53
0.0
1.0
2.0
3.0
4.0
POSCompleters
All Comparison ComparisonPathway
Completers

Weighted Cumulative Overall
GPA (Hot off the press)
2.74 2.72 2.53
0.0
1.0
2.0
3.0
4.0
POS Completers All Comparison ComparisonPathway
Completers

Higher Math Credits Earned
(Hot of the Press!)
1.5 1.4 1.2
0
1
2
3
4
5
6
7
8
POS Completers All Comparison ComparisonPathway
Completers

Science Credits Earned
3.7 3.8 3.6
0
1
2
3
4
5
6
7
8
POS Completers All Comparison ComparisonPathway
Completers

AP Credits Earned
2.0
0.9 0.5
0
1
2
3
4
5
6
7
8
POS Completers All Comparison ComparisonPathway
Completers
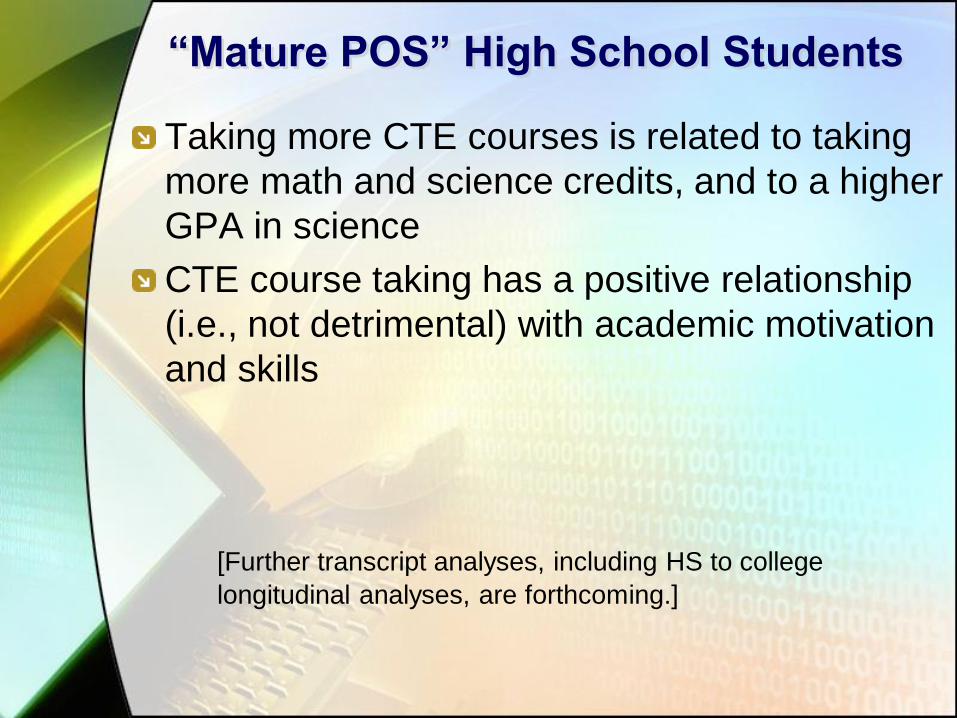
“Mature POS” High School Students
Taking more CTE courses is related to taking
more math and science credits, and to a higher
GPA in science
CTE course taking has a positive relationship
(i.e., not detrimental) with academic motivation
and skills
[Further transcript analyses, including HS to college
longitudinal analyses, are forthcoming.]

Numbers of CTE Program Completers
Comparison Group & Test Group
0
10
20
30
40
50
60
70
80
90
Laurel Poplar Apple Elm Redwood Azalea Orchid Iris

TRANSITION

Transition to Affiliated College
(35% of sample)
Of those who entered
affiliated college, 45%
stayed in the same POS
(e.g., culinary) as in HS
57% stayed in the same
career cluster
(e.g., hospitality)
as their HS POS

Did they do what they planned?
2009 plans 2012 actual status*
Technical/trade
school
8% 12%
2 year college 28% 41%
4 year college 45% 29%
Work 5% 13%
Military 6% 2%
Not sure 7% N/A
Unemployed &
Not in school
N/A 4%
* Based on final survey responses and other means of tracking
students

Factors Most Strongly Associated with
Student Retention and Completion at Three
Community Colleges
Math placement test scores
Age (older students do better)
Receipt of financial aid
Status as occupational major
Use of tutoring services in first term in college
From Bremer, C. D., Center, B. A., Medhanie, A., Opsal, C. L., Geise, A., & Jang, Y. J. (in review).
Outcome Trajectories of Developmental Reading and Writing Students in Community Colleges

Weighted Cumulative Overall GPA
(academic, CTE, elective)
2.74 2.72 2.53
0.0
1.0
2.0
3.0
4.0
POS Completers All Comparison ComparisonPathway
Completers

AP Credits Earned
2.0
0.9 0.5
0
1
2
3
4
5
6
7
8
POS Completers All Comparison ComparisonPathway
Completers

FINDINGS: THE 10 OVAE
ELEMENTS

10 Supporting Elements of POS*
Legislation and
Policies
Partnerships
Professional
Development
Accountability and
Evaluation Systems
College and Career
Readiness Standards
Course Sequences
Credit Transfer
Agreements
Guidance Counseling
& Academic
Advisement
Teaching and
Learning Strategies
Technical Skill
Assessments
*OVAE Programs of Study Design Framework, http://bit.ly/tA385f

Guidance & Counseling:
A Critical Component
Percentage of
Respondents
Class of
2009
Class of
2011
No One 12% 4%
Parent 34% 29%
Teacher 9% 5%
Guidance 36% 58%
Friends 6% 2%
Multiple Responses 4% 2%

9th Grade 10th Grade 11th Grade 12th Grade
English I or English I-Honors English II, World Lit. Honors, or Business Communications
American Lit., AP English, or Applied Communication
English IV or Technical Report Writing
Algebra I, Algebra I-Honors, Geometry, or Geometry Honors
Algebra I, Algebra I-Honors, Algebra II, Algebra II-Honors, Applied Algebra II, Geometry, or Geometry Honors
Geometry, Geometry Honors, Algebra II, Algebra II-Honors, Applied Algebra II, Pre- Calculus Honors, or Trigonometry and Prob/Stats.
Pre- Calculus or Calculus or Statistics
Principles of Science or Biology I-Honors
Biology I, Biology I-Honors, Chemistry I, or Chemistry I-Honors
Chemistry I, Chemistry I-Honors, AP Chemistry, Physics I, or Physics I-Honors
Physics or AP Physics
World History or AP World History
US History or AP US History US Government Foreign Language
Physical Education I Physical Education II Accounting I (1 credit) *Office Technology II (2 credits) or *Computerized Accounting (2 credits)
Freshman Academy Intro to Business Technology (semester) Multimedia & Desktop Publishing (semester)
Office Technology I (2 credits)
Health/Drivers’ Ed (semester)
Introductory Computer Concepts (semester)
Certifications Possible Articulated Courses Post Secondary Options MCAS (Microsoft Certified Applications Specialist)
ACC135B – Bookkeeping I IS 101
CC – Division of Business State College – Business Administration University – College of Business Administration
Typical “Progression of courses”
template

Opportunity to Acquire PS Credits (No Consistent Models)
DUAL CREDIT
At West, college credit is immediately granted if
students pass the HS course with an A or a B; the credits
are portable
At East and South, students must pass an extra exam
and/or show an IRC, and they must attend that CC to get
the credits
DUAL ENROLLMENT
At West, students are free to enroll in college courses
and earn credits
At East and South, only gen ed courses are available to
HS students

Options for College Credit:
SC Pathways
Table 11. Change in Course-Taking Over Time
2009 2011 Diff
Non-POS Students
Percent Students AP/IB 26% 28% 2%
Average Number of AP/IB Credits 3.4 3.6 0.2
Percent Dual Credit 10% 9% -1%
Average Number of Dual Credits 2.3 2.6 0.3
Number of 10/11th Credits 7.0 7.2 0.27***
POS Students
Percent Students AP/IB 11% 9% -2%
Average Number of AP/IB Credits 2.0 1.5 -0.5
Percent Dual Credit 9% 16% 7%**
Average Number of Dual Credits 2.1 2.5 0.4
Number of 10/11th Credits 8.0 8.1 0.1

Lead to Industry-Recognized
Credential, Certificate, AA, or BA
All POS in the study lead to IRC in HS or CC,
or AA/AAS or BA/BS programs
Many IRCs can be earned in HS – South
District’s goal is to have students graduate with
HS diploma “and something else”
Time, personnel, and funding cited as
problematic: East District can no longer
cover exam costs and have downplayed this
aspect of POS

What We Found
Shared vision
Flexibility
Relationships
Industry involvement
Credit transcription
Need Career Guidance
Dedicated staff
Grant funding
Students on campus
Legislation and Policies
Course Sequences
Partnerships
Credit Transfer Agreements
Guidance Counseling
Professional Development
Technical Skills Assessments
Teaching/Learning Strategies
Accountability/Evaluation
College/Career Ready
Standards
POS Framework
in Action OVAE POS Framework

Emergent trends
Some evidence of academic achievement
effect, but the evidence is mixed
Mandate did not appear to have much effect on
POS implementation (e.g., % of students
engaged in POS, use of dual credit)
10 elements are not equally important or too
costly to employ (e.g., TSA)
Other elements may be more important (e.g.,
external funding)

Emergent Trends II
Even when the policy is required by law,
implementation is uneven and may be
skewed towards lower performing
districts.
Career guidance/career development is
emerging as a necessary condition for
RPOS
Cost is a barrier (counseling, TSAs,
professional development)

Things We Don’t Know . . . Yet
Transition to postsecondary education
• Limited evidence from the Mature POS
study
• No follow up with HS cohorts in SC
Pathways or U of L Rigorous Test sites
Transition to work
• Acquisition of credentials and,
• The signaling power of the earned
credentials

Implicit Assumptions: With Policy
Implications
Education reforms operate independently of
economic context
Adolescents are rational, logical decision makers
The 10 “elements” are the right elements to ensure
POS success
Accountability challenges for POS
• What will POS success mean?
• Enrolled in any college?
• Pursuing same POS pathway?
• Student sense of contribution of POS?

Academic Mathematics
Science
Communications
POS MUST EMBRACE COLLEGE & CAREER READINESS
Occupational SCANS
21st Century Skills
“Soft” Skills
Employability Skills
Technical Job specific skills
valued by
employers
College & Career
Ready

An Industry Driven POS-Toyota THE SKILL PIPELINE PROBLEM
The U.S. community college system
produces less capable graduates than
parallel systems in competitor nations
Intentional preparation consists mostly of academic
education only, i.e. pass technical courses and get a
degree.
Schools do not produce graduates with vital preparation
for workplace success, such as a highly developed
safety culture, skills in workplace organization, lean
work skills, and problem solving.

The Toyota Solution Seamlessly Connect Paths for Career Long Growth
and to Strengthen the Whole Company
K-12
TOYOTA
Advanced Manufacturing
Career Paths
Robotics
Programmable Controls
Line Controllers
Vision system
Troubleshooting
Toyota
Maintenance
Internship
Toyota
Advanced
Program
Manufacturing
Management
Program
B.B.A.
A.B.
AMTAdvanced
Manufacturing
Technician
Program
AMEAdvanced
Manufacturing
Engineering
Program
Electrical / Industrial
Mechanicall
B.S.
TOYOTA
Engineering
Career
Design
Engineer
TTC
TOYOTA
Engineering
Career
Production
Engineer
TEMA
* 6 mo. – 2 years
* Full-time floor
experience
TOYOTA
Seibi Career
Org Mgt.
Seibi Mgt.
Seibi Tech___
TOYOTA
Maintenance
Career
MGR
AM
GL____
TL____
TM________
Special
Toyota
Degree
Program
100%
Toyota
Relevant
Project Lead the Way
NEDNew
Engineer
Development
LeanManufacturing
Certificate
AutomotiveManufacturing
M.B.A.
In development

The New Model SchoolFor Manufacturing
MORE REALISTIC
Looks Like a Factory
Feels Like a Factory
MANUFACTURING
SIMULATOR
Central Focus
Reason for Learning
Toyota Troubleshooting
PROCESS LEARNING
Students learn in a
structure sequence
ORGANIZED BY
FUNDAMENTAL SKILL
Electricity / Fluid Power
Mechanics & Fabrication
TOYOTA
LEARNING
Safety, TPS, 5S
Learning Lab
Students Learn
the Right Way
the First Time
The Solution Totally Redesign the Learning Environment
Make the
Place of Learning
look and feel like the
Place of Work

The Solution Target Best Practice K-12 Programs
Project Lead the Way
First Robotics
Attracts full spectrum of students
Certification driven!!
More choose STEM careers
Do better in ALL subjects
Toyota AMT Program:
1/3 drop-out rate of non-PLTW students
Tech Ed and vocational programs, as
they exist now, are not part of the
solution. On they whole they do not
produce graduates with the
capabilities that give U.S. companies
advantage over off-shore based
competitors and they create too much
cost to up-skill when hired.

The Solution Totally Redesign The Community College Program
3rd
Semester 4th
Semester2nd
Semester1st
Semester 5th
Semester
General Education
Technical Core
Areas
Inte
rnsh
ip
Manufacturing
Experience
Program
System Troubleshooting
RobotsWelding & Machining
Drawings
Controls
PLC
Motors
Mechanics
Intro to Electricity
Fluid Power
Public SpeakingScienceSocial ScienceHistoryMath
Priority 1 Mastery
Start
Preventive Maintenance
Support
Maintenance
Introduction
Production
Experience
Attendance – Diligence – Teamwork – Interpersonal Relations - InitiativeWork
Behavior
Advanced Manufacturing Technician Program
Associate Degree in Applied ScienceTOYOTA MAINTENANCE FUNDAMENTAL SKILLS
Selection
Process
PLTW
High School Graduates(Math ACT ≥ 19)
Communication
and critical
thinking skills
Multiskilled
Technical
Foundation
Floor experience
and hands-on
skill
Excellent worker
behavior on hire
CHARACT-
ERISTICS
WHEN
HIRED
Manufacturing
Core Exercises
Continue Practicing Activity
Continue Practicing Activity
Continue Practicing Activity
Continue Practice
Safety
5S
Problem
Solving
Toyota Production
System for Maint.
Total Productive
Maintenance
Good safety
practice on hire
5S understanding
and practice on
hire
Problem solving
thinking and use
on hire
Lean mfg thinking
and practice on
hire
Understanding of
maintenance
practice on hire
Coach
Coach
Coach
Coach
Next Generation Technical Degree

Three Reports on Career & College
Ready