Simulation programs, multimedia encyclopedia, electronic book
Upload
hoanghuongCategory
view
217download
2
1
Task 2.2.11 – CMU Report 06:
Programs for Design Analysis Support and Simulation
Integration
Department of Energy Award # EE0004261
Omer T. Karaguzel, PhD Candidate
Khee Poh Lam, PhD, RIBA, Professor Of Architecture
Center for Building Performance and Diagnostics
Carnegie Mellon University
February 2012

2
TABLES OF CONTENTS
Introduction/Executive Summary 3
1. Whole-Building Energy Parametric Analysis Tool v1.0 4
2. Disaggregated Energy Analysis Tool v1.0 (Excel Version) 7
3. Disaggregated Energy Analysis Tool v2.0 (Stand-alone Version) 11
4. Parametric Model Generator v1.0 (Without a User Interface) 11
5. Conclusions 12
LIST OF FIGURES
Figure 1 Main screen of parametric energy analysis tool 4
Figure 2 Results screen of parametric energy analysis tool 5
Figure 3 Data visualization commands screen of parametric energy analysis tool 6
Figure 4 EUI analysis results visualized automatically by the parametric energy analysis tool 6
Figure 5 Sample of error logs generated by the analysis tool 7
Figure 6 Main screen of disaggregated energy analysis tool 7
Figure 7 HTML output data file selection for analysis floors 8
Figure 8 Data visualization command screen of disaggregated analysis tool 9
Figure 9 Additional results for energy performance analysis 9
Figure 10 Sample of error logs generated by the disaggregated energy analysis tool 10
Figure 11 Main screen of disaggregated energy analysis tool version 2 11
Figure 12 Schema of parametric model generator structure 12

3
Introduction/Executive Summary
A suite of programs is developed in order to facilitate analysis and interpretation of EnergyPlus
simulation outputs for design decision support purposes. The developed programs can be
categorized into three groups with respect to their functionality:
Design Decision Support: Whole Building Parametric Analysis Tool v1.0
Performance Analysis Automation: Disaggregated Energy Analysis Tool v1.0 (Excel
Version), and v2.0 (Stand-Alone Version)
Simulation Integration: Parametric Model Generator v1.0
Embedded applications within these programs are MS Excel and EnergyPlus v6.0 and its outputs
read as HTML format. Programming language is Visual Basic and Visual Basic Express 2008
(for stand-alone version). Brief explanations of the above mentioned programs are as follows:
Whole Building Parametric Analysis Tool v1.0: An MS Excel based user interface
developed with VBA to automate the process of analyzing and interpreting a set of
simulation outputs generated during exhaustive parametric runs performed by EnergyPlus
v6.0 coupled with GenOpt v3.0. This tool searches the entire parameter space for a
matching combination of user selected parameters and extracts simulation results
(together with necessary data visualization) pertaining to this selection. This analysis is a
not a stand-alone application. It’s executed within MS Excel application as a macro with
a user form linked to an existing worksheet.
Disaggregated Energy Analysis Tool v1.0: A tool to automate the process of data
visualization for default HTML-based EnergyPlus summary outputs. Raw data from
HTML outputs are selected to produce tables of cumulative and normalized
disaggregated annual energy consumption (by end-uses) with SI and IP units. Simulation
data pertaining to zone by zone HVAC space heating and cooling design loads together
with annual unmet load hours are also visualized for quick performance interpretation.
Disaggregated Energy Analysis Tool v2.0: Previously developed MS Excel based user
interface is modified to be a stand-alone executable tool (by code modification with
Microsoft Visual Basic Express 2008). Similar functionality with the previous version
was maintained in this version which reduces user interaction with MS Excel functions.
Parametric Model Generator v1.0: This macro was developed in MS Excel environment
with the objective of automatic generation of multiple EnergyPlus input files (with IDF
extension) in which a matrix of user specified design variables (related to building
envelope retrofit options) can be implemented to different IDF files.
4
1. Whole-Building Energy Parametric Analysis Tool v1.0
An MS Excel based user interface developed with VBA to automate the process of analysing and
interpreting 720 different simulation outputs generated during exhaustive parametric runs performed by
EnergyPlus v6.0 coupled with GenOpt v3.0. This tool searches the entire parameter space for a matching
combination of user selected parameters and extracts simulation results (together with necessary data
visualization) pertaining to this selection.
Figure 1 Main screen of parametric energy analysis tool
Current version (v1.0) maps user specified
design parameters to corresponding
simulation outputs
User can select only one from a list of all
simulated alternatives for each different
class of energy efficiency measures
“Calculate Performance” initiates the search
process results of which are tabulated in the
proceeding screen
User can quit the interface anytime during
the selection process
Performance to design mapping
functionality is not implemented yet
This will reveal design features based on a
selection of performance results

5
This analysis is a not a stand-alone application. It’s executed within MS Excel application as a macro with
a user form linked to an existing worksheet. For data processing simulation outputs has to be exported to
MS Excel an sheet. Data rows can be extended, however columns should be in a specific order. Internal
search functions of excel are utilized in the VBA code.
Figure 2 Results screen of parametric energy analysis tool
“Tabulate” results command of the results screen, initiates the last screen of this tool which is the “Data
Visualization”. This screen provides alternative reporting formats from which user can make a selection.
Current data can be further analysed as tables and accompanying pie charts of disaggregated end-use
energy consumption levels in SI and IP units.
Performance data is presented as
building totals as well as
disaggregated by main end-use
categories
For relative performance analysis,
percent deviation from the baseline
simulation model is provided for each
of the energy performance category
For Building 661 analysis, total
energy consumption for space heating,
cooling, and fans is given separately
For Building 661 analysis, end-use
categories of interior lights, exterior
lights, interior equipment, and service
water heating are with faded letters.
Parametric variations are not effecting
these categories and they remain
constant between different alternatives User can give a name to his/her
analysis, this name will be given to a
newly created worksheet where
resultant data is visualized
6
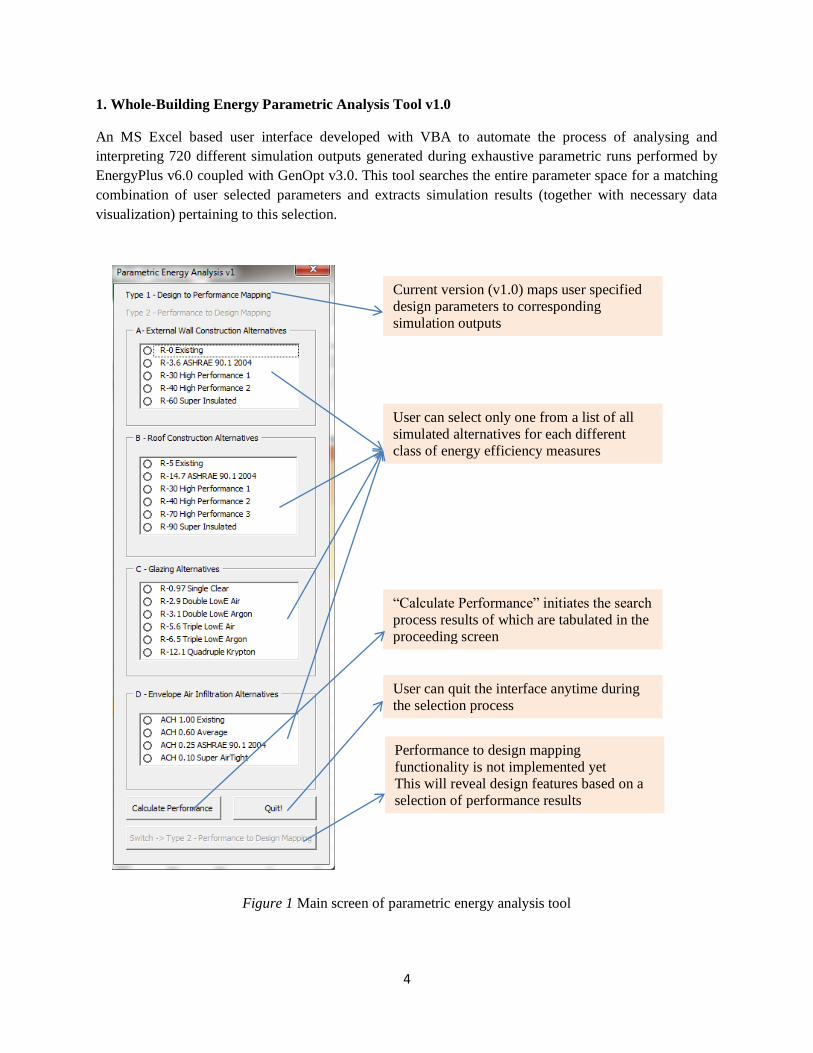
Figure 3 Data visualization commands screen of parametric energy analysis tool
Simulation results are automatically tabulated and/or visualized in a new worksheet.
Figure 4 EUI analysis results visualized automatically by the parametric energy analysis tool
Error Handling: Robustness of the tool is increased by a number of warnings and connected actions in all
possible cases of user errors.
User can make a selection for
visualization type. Current alternatives
are Energy Use Intensity (EUI)
analysis in SI and/or IP units.
Since there is no data to report for the
other possible data type, they are set
as inactive components. Other design
support tools have this functionality.
This button will open a new worksheet
in which current data is automatically
visualized/processes in the user
specified visualization style/type.
User can quit the interface at this stage
and return to original analysis screen
for another round of parametric design
analysis.

7
Figure 5 Sample of error logs generated by the analysis tool
2. Disaggregated Energy Analysis Tool v1.0 (Excel Version)
An MS Excel based user interface developed with VBA to automate the process of data visualization for
default HTML-based EnergyPlus summary outputs.
Figure 6 Main screen of disaggregated energy analysis tool
User can enter the building floor area
for the normalization of the
cumulative energy use data from
simulation outputs.
Alternatively, user can let the program
to detect building floor area from
EnergyPlus HTML output.
Program Execution section let the use
to give a name to his/her current result
analysis.
“Select Raw Data” button opens a
windows file browser from which the
user points the typical EnergyPlus
simulation summary report in HTML
format. User can enter a typical annual energy
use (kWh) amount for service water
heating category if this is not
simulated by EnergyPlus.
Alternatively, program can locate and
implement SWH energy to the
simulation output analysis routines (in
case SWH system is already
simulated).
Program can be terminated at any time
before the selection of the raw data.

8
Figure 7 HTML output data file selection for analysis
“Open” command executes the following functions:
Search the HTML format for specific EnergyPlus output tables (Building Area, End Uses, HVAC
Sizing Summary, and set-point Not Met Summary).
Copy the selected tables into a new worksheet.
Extract and manipulate useful data from such tables and create a separate end-use energy analysis
table (in cumulative and normalized format) with SI and IP units.
Initialize the second screen of the program as a prompt for data visualization formats.
After “select raw data” execution user
can browse to the directory where
EnergyPlus HTML simulation output
is saved.
Only HTML file format can be
selected, this is restricted by the
available file type.
User can enter the building floor area
for the normalization of the
cumulative energy use data from
simulation outputs.
“Open” command initiates automated
data processing functions.
“Cancel” command terminates the
program and user is prompted with a
warning.

9
Figure 8 Data visualization command screen of disaggregated analysis tool
In addition to end-use energy breakdown pie charts shown before, this tool also generated bar chart for
time set-points not met values and HVAC sizing design loads.
Figure 9 Additional results for energy performance analysis
EUI results can be visualized as pie
charts (SI and IP units).
Time set-point not met values can be
reported as bar charts for total heating
and cooling hours.
For HVAC sizing, design heating and
cooling loads can be reported for each
thermal zone of the building
separately as a bar chart. User needs to
provide the total number thermal
zones in the building model.
“Generate Charts” starts charting
process, at least one selection should
be made for the program to progress.
User can quite the program at this
stage. And continue with the already
tabulated simulation results without
visualizations.
10
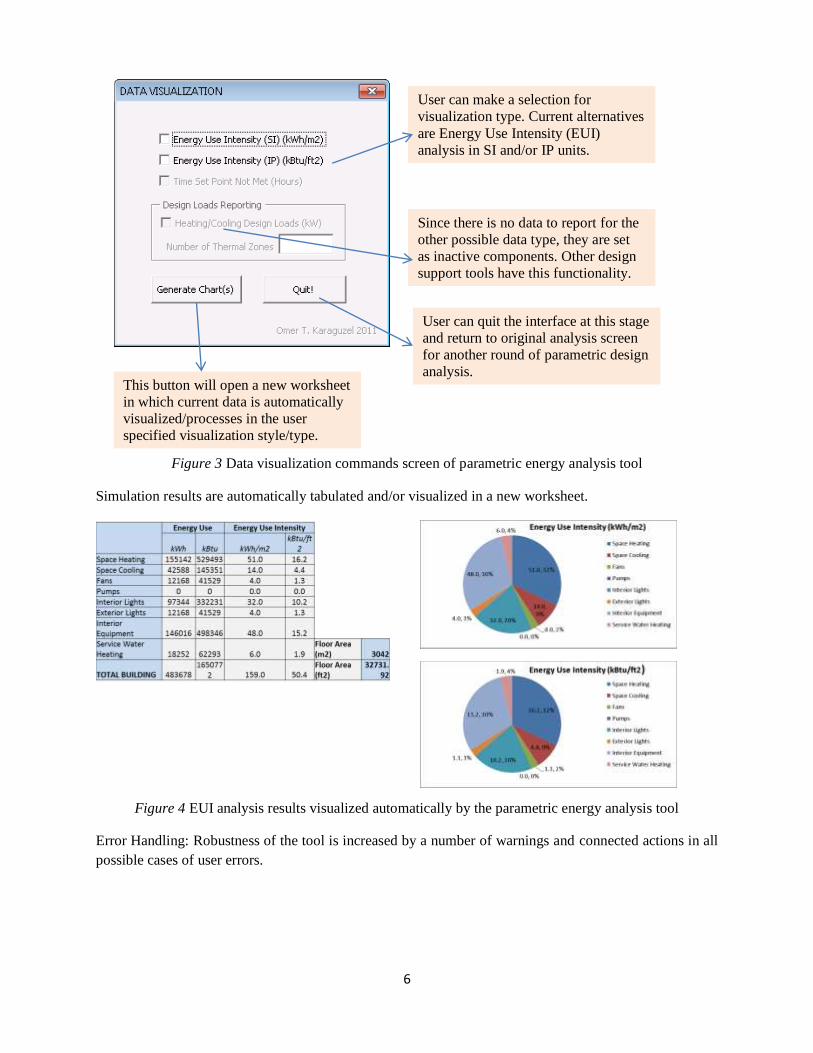
This tool is robust enough to detect possible logical errors made by the user. Incorrect commands, and/or
entries are prompted by a warning. In, most cases program is terminated. Some cases lets the user return
to latest successful phase of the tool progress.
Figure 10 Sample of error logs generated by the disaggregated energy analysis tool

11
3. Disaggregated Energy Analysis Tool v2.0 (Stand-alone Version)
Disaggregated energy Analysis Tool v2: Previously developed MS Excel based user interface was
modified to be a stand-alone executable tool (by code modification with Microsoft Visual Basic 2008).
Similar functionality with the previous version was maintained in this version which reduces user
interaction with MS Excel functions. This tool is a not a macro code within MS Excel, but a stand-alone
MS application that can be extended to communicate with other applications installed on the Windows
operation system.
Figure 11 Main screen of disaggregated energy analysis tool version 2
4. Parametric Model Generator v1.0 (Without a User Interface)
This macro was developed in MS Excel environment with the objective of automatic generation of
multiple EnergyPlus input files (with IDF extension) in which a matrix of user specified design variables
(related to building envelope retrofit options) can be implemented to different IDF files.
User first selects the EnergyPlus
raw output data in HTML format.
Selected data path is shown in the
source data section.
“Conduct Analysis” command,
automatically opens a new
worksheet, searches the HTML
data, implement raw data tables,
extract necessary data develops
tables and charts (in the same
format as in the program version
1.0)
Created excel file can be saved by
the use giving it a new name.
Saved directory path is also
displayed to the user.
“Close” command terminates the
program at any point.
12
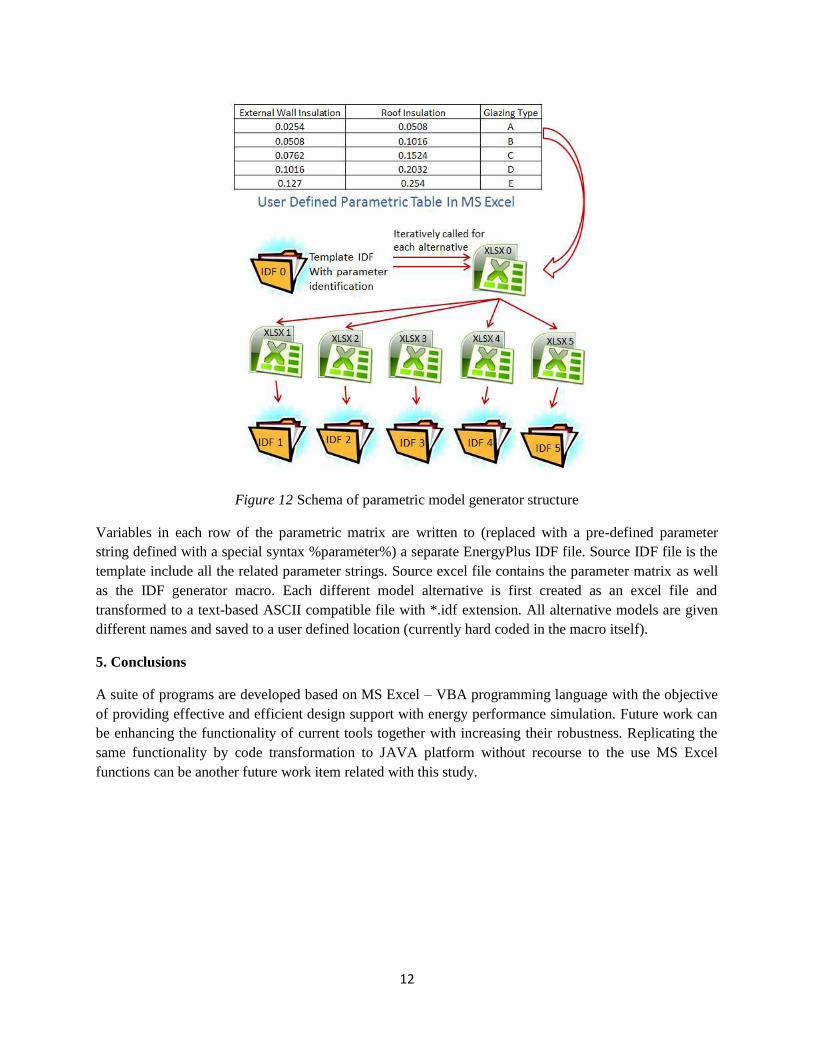
Figure 12 Schema of parametric model generator structure
Variables in each row of the parametric matrix are written to (replaced with a pre-defined parameter
string defined with a special syntax %parameter%) a separate EnergyPlus IDF file. Source IDF file is the
template include all the related parameter strings. Source excel file contains the parameter matrix as well
as the IDF generator macro. Each different model alternative is first created as an excel file and
transformed to a text-based ASCII compatible file with *.idf extension. All alternative models are given
different names and saved to a user defined location (currently hard coded in the macro itself).
5. Conclusions
A suite of programs are developed based on MS Excel – VBA programming language with the objective
of providing effective and efficient design support with energy performance simulation. Future work can
be enhancing the functionality of current tools together with increasing their robustness. Replicating the
same functionality by code transformation to JAVA platform without recourse to the use MS Excel
functions can be another future work item related with this study.