Programme for International Student Assessment for International Student Assessment Luxembourg, 16...
42
PISA 2015 School Feedback European School I Luxembourg OECD Programme for International Student Assessment Luxembourg, 16 June 2017 SCRIPT
Transcript of Programme for International Student Assessment for International Student Assessment Luxembourg, 16...

PISA 2015 School Feedback European School I Luxembourg
OECD Programme for International
Student Assessment
Luxembourg, 16 June 2017SCRIPT

INTRODUCTION
2

• Initiative by the OECD
• “What is important for citizensto know and be able do do?”
• Internationally comparableevidence on studentperformance
• At the end of compulsoryeducation
15‐year‐old students
What is PISA?
3

Student questionnaire:Familiy background, Learning experiences, attitudes towardsschool
Key Features (1)
4

Key Features (2)
5

Participants in Luxembourg
• 44 schools(public, private, and international)
• 5300 studentsBorn in 1999
6

Participants at your school
L1 students:n=98 studentsStudents assessed in their firstlanguage of instruction• English, French or German International sample
L2 students:n=93 studentsStudents assessed in their firstforeign language (English, French or German) National option, not in theinternational sample
7
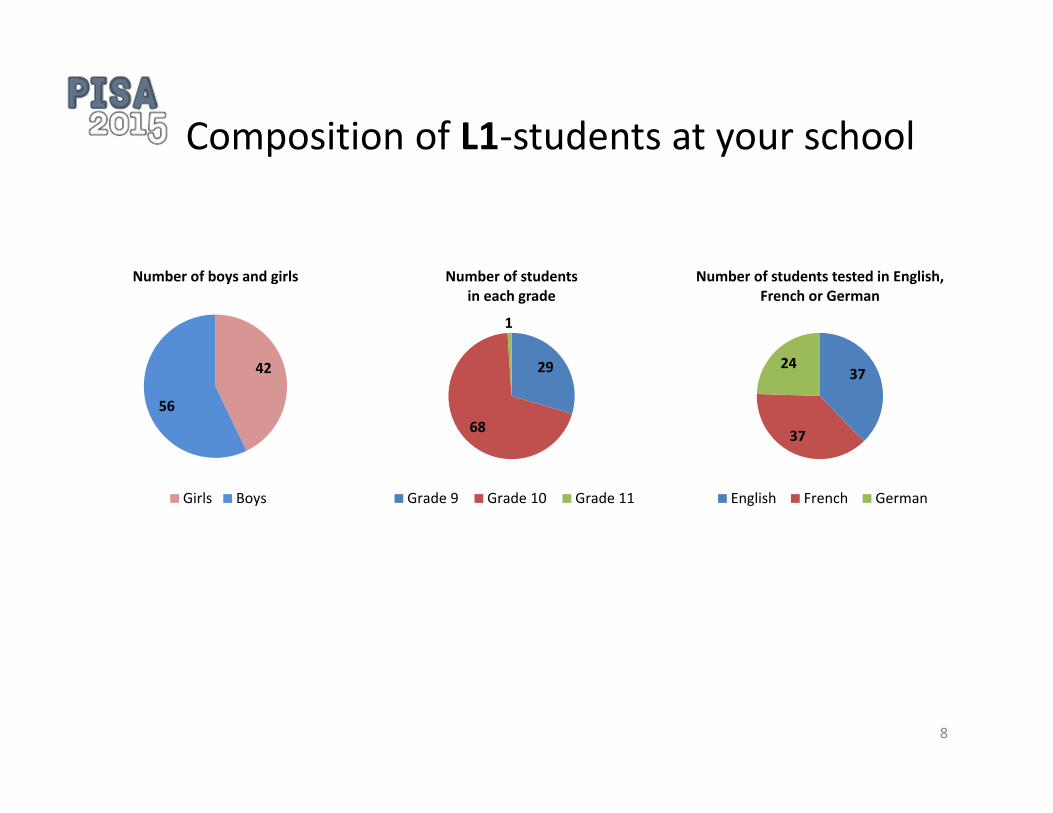
Composition of L1‐students at your school
8
37
37
24
Number of students tested in English, French or German
English French German
42
56
Number of boys and girls
Girls Boys
29
68
1
Number of studentsin each grade
Grade 9 Grade 10 Grade 11

9
42
51
Number of boys and girls
Girls Boys
39
11
1
Number of students tested in English, French or German
English French German
Composition of L2‐students at your school
19
71
1 2
Number of studentsin each grade
Grade 9 Grade 10 Grade 11 Grade 8
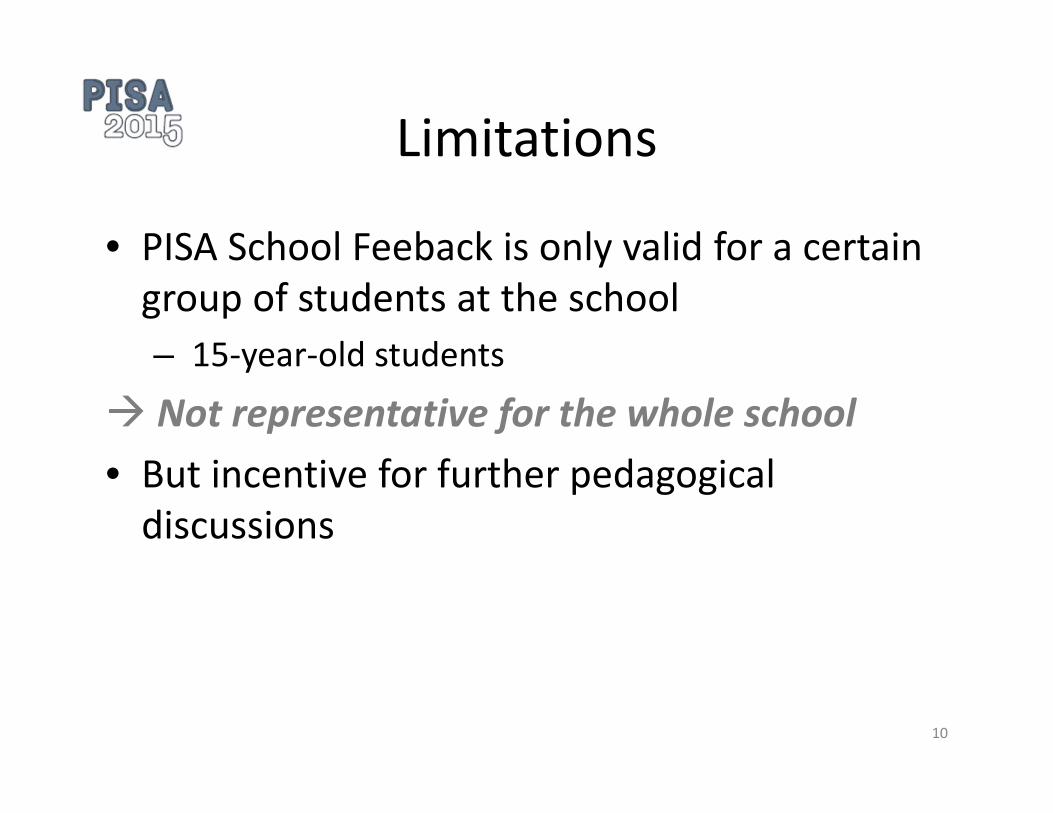
Limitations
• PISA School Feeback is only valid for a certaingroup of students at the school– 15‐year‐old students
Not representative for the whole school• But incentive for further pedagogicaldiscussions
10

HOW YOUR SCHOOL RESULTS ARECOMPARED
11

Fair comparison
• “A consistent finding throughout PISA assessments isthat socio‐economic status is related to performanceat the system, school and student levels” (OECD, 2016, p. 205)
• In PISA, the socio‐economic status is measured by the Index of economic, social and cultural status(ESCS)
12

ESCS Index
• ESCS includes the following three aspects:
1. highest parents’ education
2. highest parents’ occupation
3. material ressources(e.g. possession of cultural goods, educational ressources, material possessions, number of books at home)
13

‐1,5
‐1,0
‐,5
,0
,5
1,0
1,5
Your sc
hool
Meam ESCS
Mean ESCS* by school in Luxembourg
Distribution of mean ESCS by schoolin Luxembourg
Comparison group= similar schools by ESCS*= Roughly upper 16 % of thedistribution= from similar school types(International schools and Enseignement secondaire)
*Index of economic, social and cultural status (ESCS): Highest parents’ education, highest parents’ occupation and material ressourcesOnly schools in Luxembourg with more than 20 students are included in the graph
14

Difference in mean ESCS between “Enseignement Secondaire” (ES) and your school
‐1,5
‐1,0
‐,5
,0
,5
1,0
1,5
ES
Your sc
hool
Meam ESCS
15
Mean ESCS issignificantly lower in ES compared to yourschool. This difference needsto be taken intoaccount whencomparing resultsbetween your schooland the ES.

Names in the graphs
Your school: Students tested in their first language of instruction atyour school (= L1‐students)
Similar schools: Schools in the upper 16 % of the distribution by ESCS in Luxembourg
Comparison group: arithmetic mean of results across the 5 schools in the upper 16 % of the ESCS distribution in Luxembourg
ES: Enseignement secondaire
L2‐students: Students tested in their first foreign language at yourschool (national option, not in the international sample)
16

PISA 2015 RESULTS
17

Proficiency levels
• Levels 1 (lowest) to 6 (highest)• Each level is characterized by a description of competencies• Level 2: baseline• Level 5 and 6: top performers• For further information (e.g. a detailed description of what
students know and can do at each level), please refer to OECD PISA 2015 Volume Ihttp://www.oecd.org/publications/pisa‐2015‐results‐volume‐i‐
9789264266490‐en.htm 18

19
Proficiency levels – Science
210
13
19
37
37
35
27
116 1
0
10
20
30
40
50
60
70
80
90
100
Your school ES
Percen
tage of stude
nts on
each proficiency
level
Science
level 6
level 5
level 4
level 3
level 2
level 1
633
708*
559
484
410
*Low
erscorelim
itof eachlevel
Your school: L1‐studentsES: Luxembourg’s “Enseignement secondaire” (ES)
Top performers(levels 5 + 6)
COMPARISON TO LUXEMBOURG’S “ENSEIGNEMENT SECONDAIRE”

210 11
1926
37
33
2722
6 6
0
10
20
30
40
50
60
70
80
90
100
Your school Comparison group
Percen
tage of stude
nts on
each proficiency level
Science
level 6
level 5
level 4
level 3
level 2
level 1
Top performers(levels 5 + 6)
633
708*
559
484
410
20
Proficiency levels ‐ Science
Your school: L1‐studentsComparison group: arithmetic mean of schools in Luxembourg with a similar ESCS
COMPARISON TO THE AVERAGE OF SCHOOLS WITH A SIMILAR MEAN SOCIO‐ECONOMIC STATUS
*Low
erscorelim
itof eachlevel

21
Proficiency levels ‐ Reading
2 29 11
2233
33
38
28
146 2
0
10
20
30
40
50
60
70
80
90
100
Your school ES
Percen
tage of stude
nts on
each proficiency level
Reading
level 6
level 5
level 4
level 3
level 2
level 1
Top performers(levels 5 + 6)
626
698*
553
480
407335
*Low
erscorelim
itof eachlevel
COMPARISON TO LUXEMBOURG’S “ENSEIGNEMENT SECONDAIRE”
Your school: L1‐studentsES: Luxembourg’s “Enseignement secondaire” (ES)

2 49 10
2225
3335
28 20
6 6
0
10
20
30
40
50
60
70
80
90
100
Your school Comparison group
Percen
tage of stude
nts on
each proficiency level
Reading
level 6
level 5
level 4
level 3
level 2
level 1
Top performers(levels 5 + 6)
626
698*
553
480
407335
*Low
erscorelim
itof eachlevel
22
Proficiency levels ‐ ReadingCOMPARISON TO THE AVERAGE OF SCHOOLS WITH A SIMILAR MEAN SOCIO‐ECONOMIC STATUS
Your school: L1‐studentsComparison group: arithmetic mean of schools in Luxembourg with a similar ESCS

Proficiency levels ‐Mathematics
23
3 3
14 12
23 30
3334
21 16
5 5
0
10
20
30
40
50
60
70
80
90
100
Your school ES
Percen
tage of stude
nts on
each proficiency level
Mathematics
level 6level 5level 4level 3level 2level 1
Top performers(levels 5 + 6)
607
669*
545
482
420358
*Low
erscorelim
itof eachlevel
COMPARISON TO LUXEMBOURG’S “ENSEIGNEMENT SECONDAIRE”
Your school: L1‐studentsES: Luxembourg’s “Enseignement secondaire” (ES)

Proficiency levels ‐Mathematics
3 3
14 11
2323
3332
2122
5 10
0
10
20
30
40
50
60
70
80
90
100
Your school Comparison group
Percen
tage of stude
nts on
each proficiency level
Mathematics
level 6level 5level 4level 3level 2level 1
Top performers(levels 5 + 6)
607
669*
545
482
420358
*Low
erscorelim
itof eachlevel
24
COMPARISON TO THE AVERAGE OF SCHOOLS WITH A SIMILAR MEAN SOCIO‐ECONOMIC STATUS
Your school: L1‐studentsComparison group: arithmetic mean of schools in Luxembourg with a similar ESCS

Mean scores in science, readingand mathematics
‐40 ‐30 ‐20 ‐10 0 10 20 30 40
Mathematics
Reading
Science
Difference in mean scores between your school and comparison group
Your school scores higherComparison group scores higher
25
COMPARISON TO THE AVERAGE OF SCHOOLS WITH A SIMILAR MEAN SOCIO‐ECONOMIC STATUS
Your school: L1‐studentsComparison group: arithmetic mean of schools in Luxembourg with a similar ESCS

Differences in mean scores by test language at your school (L1‐students)
‐40 ‐30 ‐20 ‐10 0 10 20 30 40
Mathematics
Reading
Science
Difference in mean scores compared to English
Test language French Test language German
These differences arenot statistically significant
26
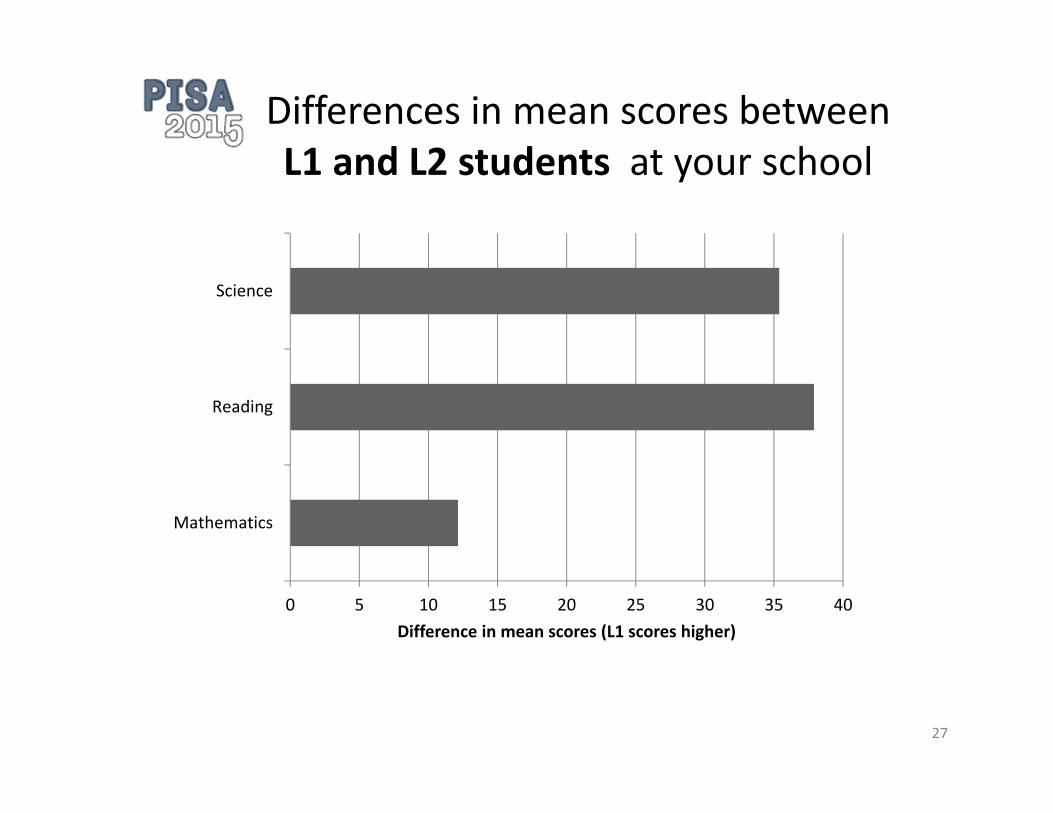
Differences in mean scores betweenL1 and L2 students at your school
0 5 10 15 20 25 30 35 40
Mathematics
Reading
Science
Difference in mean scores (L1 scores higher)
27

Science subscales ‐ Definitions
• Recognise, offer and evaluate explanationsfor a range of natural and technologicalphenomena
Explain phenomenascientifically
• Describe and appraise scientific investigations and propose ways of addressing questions scientifically
Evaluate and designscientific enquiry
• Analyse and evaluate data, claims and arguments in a variety of representationsand draw appropriate scientificconclusions
Interpret data and evidence scientifically
28
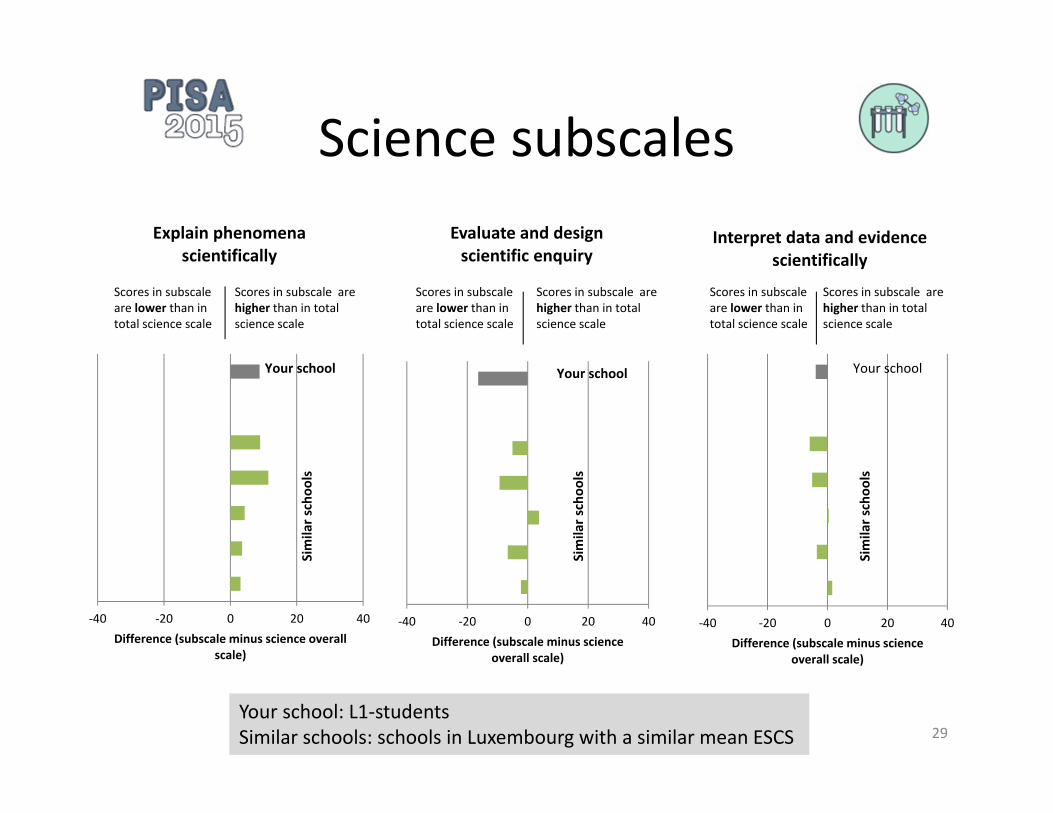
Science subscales
‐40 ‐20 0 20 40Difference (subscale minus science overall
scale)
Explain phenomena scientifically
Scores in subscaleare lower than in total science scale
Scores in subscale arehigher than in total science scale
Your school
Similarschoo
ls
‐40 ‐20 0 20 40Difference (subscale minus science
overall scale)
Evaluate and design scientific enquiry
Scores in subscaleare lower than in total science scale
Scores in subscale arehigher than in total science scale
Your school
Similarschoo
ls
‐40 ‐20 0 20 40Difference (subscale minus science
overall scale)
Interpret data and evidence scientifically
Scores in subscaleare lower than in total science scale
Scores in subscale arehigher than in total science scale
Your school
Similarschoo
ls
29Your school: L1‐studentsSimilar schools: schools in Luxembourg with a similar mean ESCS

STUDENT MOTIVATION AND EXPERIENCES AT SCHOOL*
*On the following slides, results are shown for “your school” and the “comparison group” (arithmetic mean of schools in Luxembourg with a similar ESCS). All results for Luxembourg’s Enseignement secondaire, the Luxembourg national average, or the OECD‐average can befound under www.pisaluxembourg.lu

Student motivation in science
• E.g. “I generally have fun when I am learning broad science topics.”Enjoyment of science
• E.g. “How science can help us prevent disease”
Interest in sciencetopics
• E.g. “I learn school science topics quickly.”
Self‐concept in science
31
• Answer categories: “Strongly disagree”, “Disagree”, “Agree”, “Strongly agree”
• Agreement comprises “Strongly agree” + “Agree”

Student motivation in science
69%
66%
74%
62%
63%
67%
0% 20% 40% 60% 80% 100%
Self‐concept science
Interest in science topics
Enjoyment of science
Agreement in %
Your schoolComparison group
32Your school: L1‐studentsComparison group: arithmetic mean of schools in Luxembourg with a similar ESCS
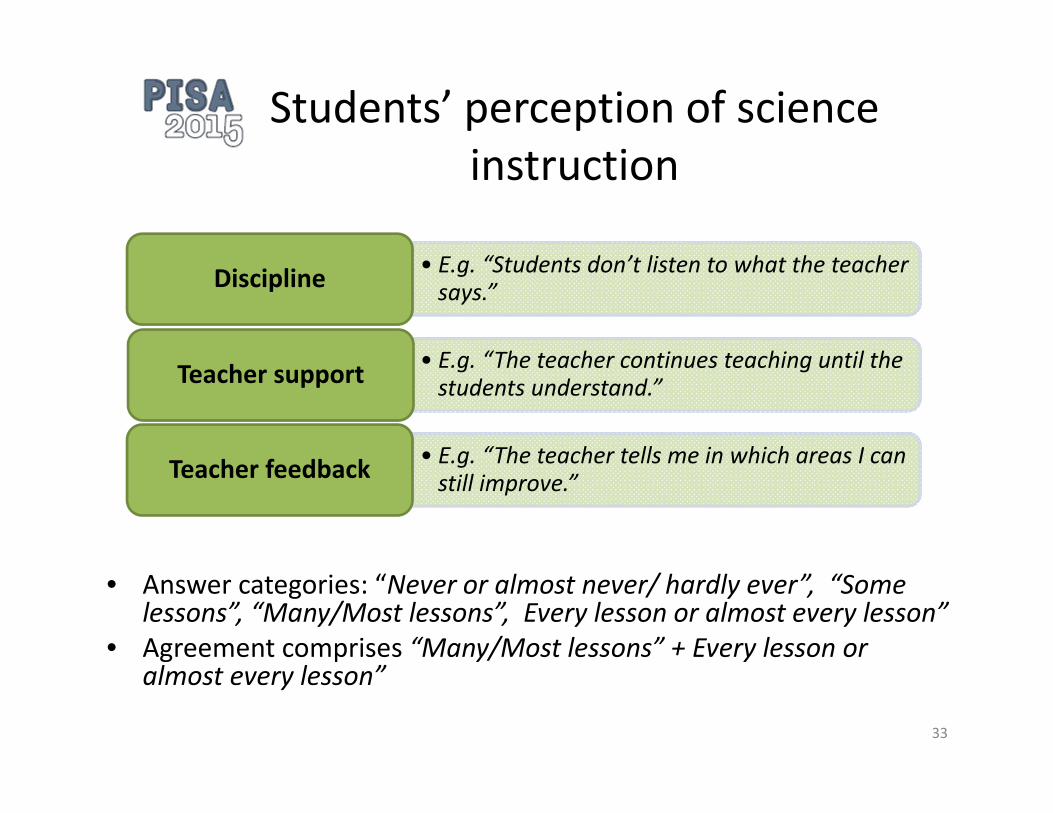
Students’ perception of scienceinstruction
• Answer categories: “Never or almost never/ hardly ever”, “Some lessons”, “Many/Most lessons”, Every lesson or almost every lesson”
• Agreement comprises “Many/Most lessons” + Every lesson or almost every lesson”
33
• E.g. “Students don’t listen to what the teacher says.”Discipline
• E.g. “The teacher continues teaching until the students understand.”Teacher support
• E.g. “The teacher tells me in which areas I can still improve.”Teacher feedback

Students’ perception of scienceinstruction
27%
68%
22%
25%
58%
20%
0% 20% 40% 60% 80% 100%
Teacher feedback
Teacher support
Discipline
Agreement*
Your schoolComparison group
34
Your school: L1‐studentsComparison group: arithmetic mean of schools in Luxembourg with a similar ESCS
*Every lesson or most lessons

Enquiry‐based scienceteaching and learning
35
36%
29%
21%
80%
22%
13%
58%
70%
48%
34%
20%
15%
70%
12%
4%
60%
59%
40%
0% 20% 40% 60% 80% 100%
Students are required to argue about science questions.
Students are asked to do an investigation to test ideas.
There is a class debate about investigations.
Students are given opportunities to explain their ideas.
Students spend time in the laboratory doing practicalexperiments.
Students are allowed to design their own experiments.
Students are asked to draw conclusions from an experimentthey have conducted.
The teacher explains how a school science idea can be appliedto a number of different phenomena.
The teacher clearly explains the relevance of broad scienceconcepts to our lives.
Agreement in %
Your school
Comparison group
*Every lesson or most lessons
Your school: L1‐studentsComparison group: arithmetic mean of schools in Luxembourg with a similar ESCS

Students’ perceptions and attitudestowards school
• Answer categories: “Strongly disagree”, “Disagree”, “Agree”, “Strongly agree”
• Agreement comprises “Strongly agree” + “Agree”
36
• E.g. “Even if I am well‐prepared for a test I feel very anxious.”Test anxiety
• E.g. “I want to be the best, whatever I do.”Achievementmotivation
• E.g. “Other students seem to like me.”Sense of belonging toschool
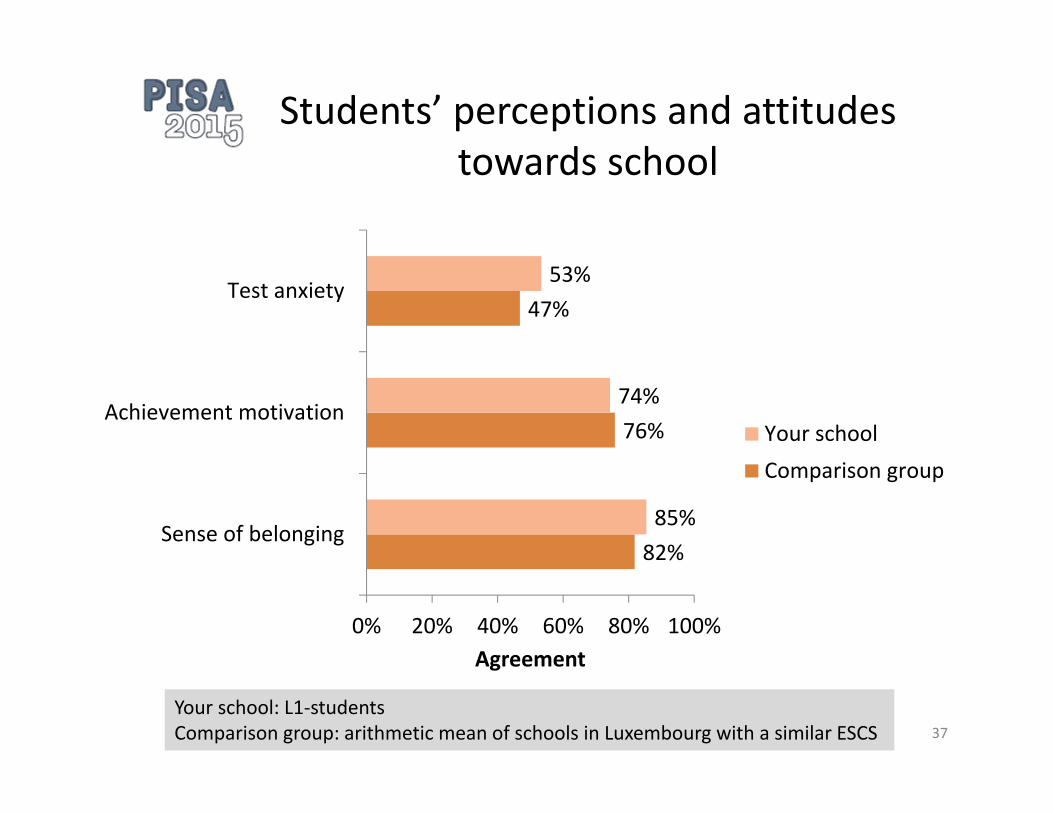
Students’ perceptions and attitudestowards school
82%
76%
47%
85%
74%
53%
0% 20% 40% 60% 80% 100%
Sense of belonging
Achievement motivation
Test anxiety
Agreement
Your schoolComparison group
37Your school: L1‐studentsComparison group: arithmetic mean of schools in Luxembourg with a similar ESCS

PARENTS’ PERCEPTION OF THESCHOOL

Parents’ perception of the school
• Parent questionnaire return rate
39
55%
84%
0% 20% 40% 60% 80% 100%
L2‐students
L1‐students
Return rate
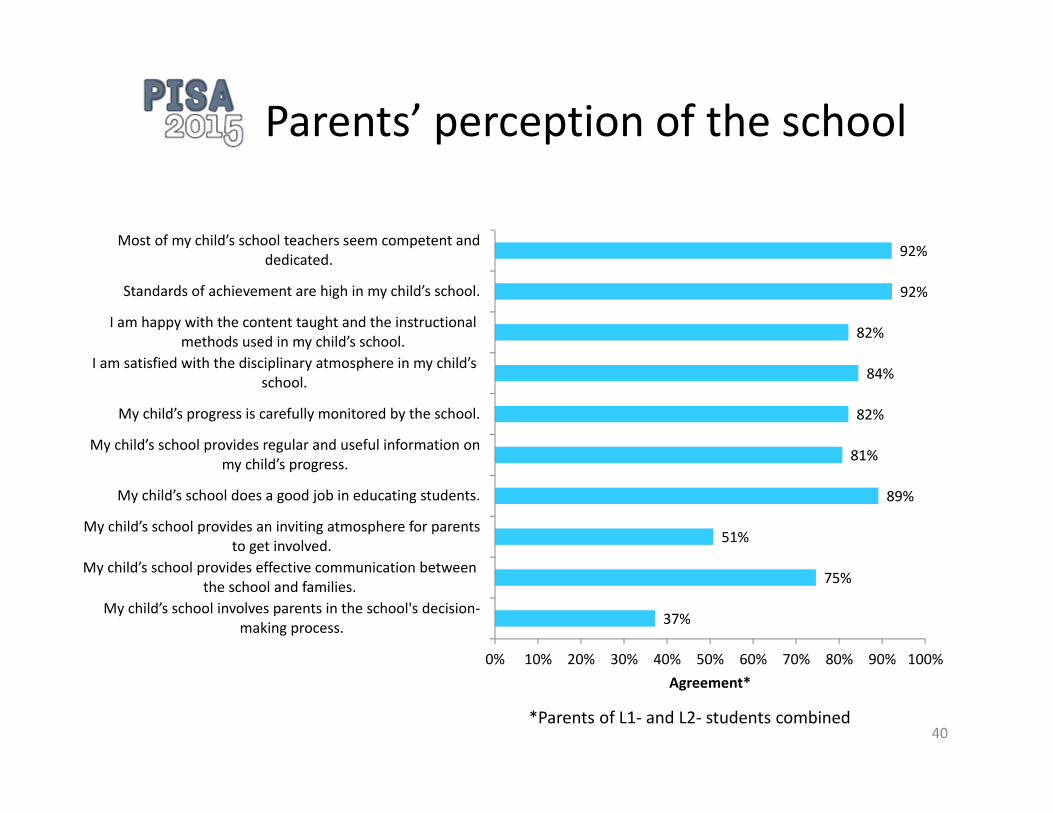
Parents’ perception of the school
37%
75%
51%
89%
81%
82%
84%
82%
92%
92%
0% 10% 20% 30% 40% 50% 60% 70% 80% 90% 100%
My child’s school involves parents in the school's decision‐making process.
My child’s school provides effective communication between the school and families.
My child’s school provides an inviting atmosphere for parents to get involved.
My child’s school does a good job in educating students.
My child’s school provides regular and useful information on my child’s progress.
My child’s progress is carefully monitored by the school.
I am satisfied with the disciplinary atmosphere in my child’s school.
I am happy with the content taught and the instructional methods used in my child’s school.
Standards of achievement are high in my child’s school.
Most of my child’s school teachers seem competent and dedicated.
Agreement*
40*Parents of L1‐ and L2‐ students combined

Further reading• Frameworks for assessing mathematics, reading and science:
– PISA 2015 Assessment and Analytical Framework (OECD, 2016) http://www.oecd.org/edu/pisa‐2015‐assessment‐and‐analytical‐framework‐
9789264255425‐en.htm
• Published sample items from PISA 2015http://www.oecd.org/pisa/test/
• PISA 2015 Results– International OECD Report, Volumes I to III (OECD, 2016)
http://www.oecd.org/pisa/– National Report Luxembourg (SCRIPT & LUCET, 2016)
http://www.pisaluxembourg.lu/
41

Thank youfor yourattention!