
Program Sustainability Analysis - AY 2020:2021
27
Program and Services Sustainability Analysis - AY 2020-2021 Lane Community College Eugene, OR April 1, 2021
Transcript of Program Sustainability Analysis - AY 2020:2021

Program and Services Sustainability Analysis - AY 2020-2021
Lane Community College Eugene, OR
April 1, 2021

Table of Contents Introduction………………………………………………………….. 1 Academic Learning Skills……………………………………….. 3 Aviation Academy…………………………………………………. 6 Culinary Arts…………………………………………………………. 12 Hotel / Restaurant / Tourism Management………….. 16 Manufacturing……………………………………………………… 19 Specialized Support Services………………………………… 24
1
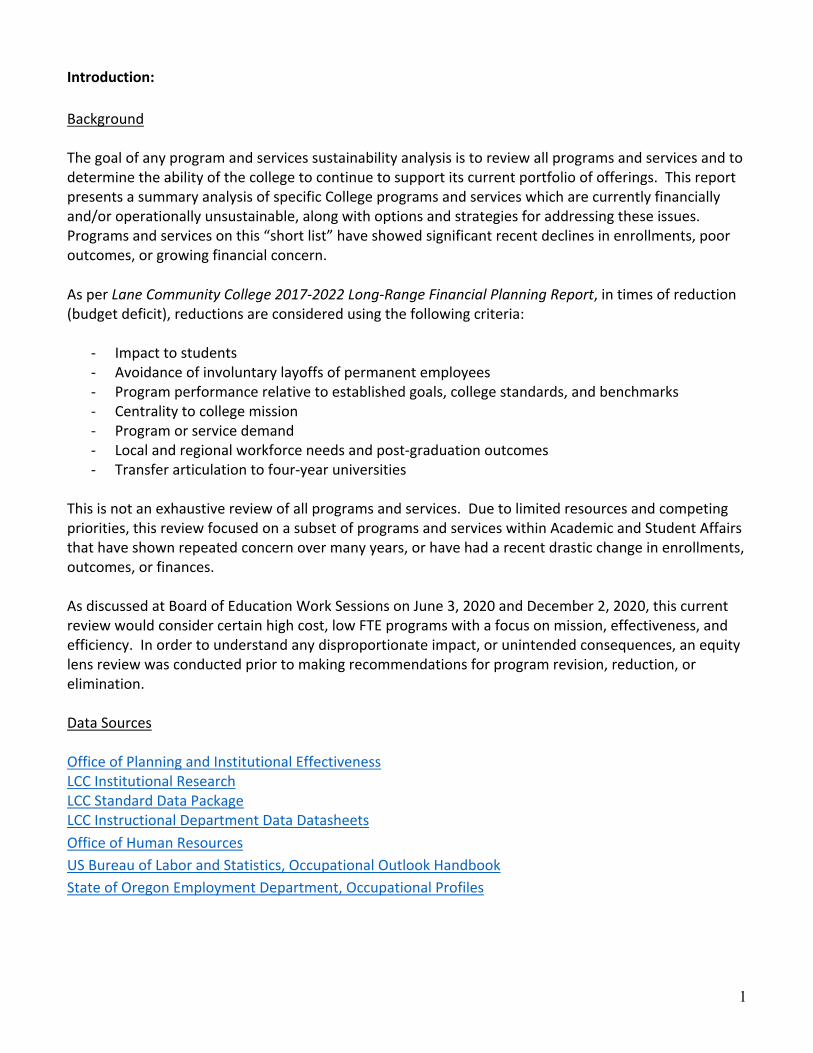
Introduction: Background The goal of any program and services sustainability analysis is to review all programs and services and to determine the ability of the college to continue to support its current portfolio of offerings. This report presents a summary analysis of specific College programs and services which are currently financially and/or operationally unsustainable, along with options and strategies for addressing these issues. Programs and services on this “short list” have showed significant recent declines in enrollments, poor outcomes, or growing financial concern. As per Lane Community College 2017-2022 Long-Range Financial Planning Report, in times of reduction (budget deficit), reductions are considered using the following criteria:
- Impact to students - Avoidance of involuntary layoffs of permanent employees - Program performance relative to established goals, college standards, and benchmarks - Centrality to college mission - Program or service demand - Local and regional workforce needs and post-graduation outcomes - Transfer articulation to four-year universities
This is not an exhaustive review of all programs and services. Due to limited resources and competing priorities, this review focused on a subset of programs and services within Academic and Student Affairs that have shown repeated concern over many years, or have had a recent drastic change in enrollments, outcomes, or finances. As discussed at Board of Education Work Sessions on June 3, 2020 and December 2, 2020, this current review would consider certain high cost, low FTE programs with a focus on mission, effectiveness, and efficiency. In order to understand any disproportionate impact, or unintended consequences, an equity lens review was conducted prior to making recommendations for program revision, reduction, or elimination. Data Sources Office of Planning and Institutional Effectiveness LCC Institutional Research LCC Standard Data Package LCC Instructional Department Data Datasheets Office of Human Resources US Bureau of Labor and Statistics, Occupational Outlook Handbook State of Oregon Employment Department, Occupational Profiles
2
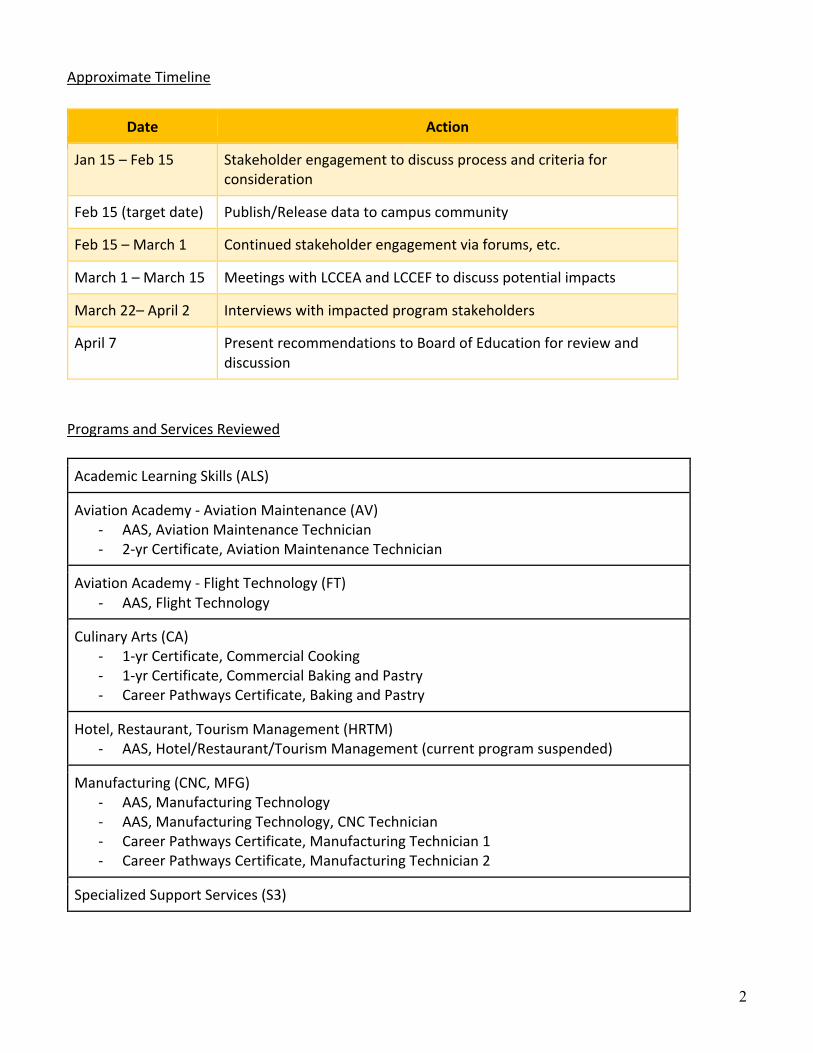
Approximate Timeline
Date Action
Jan 15 – Feb 15 Stakeholder engagement to discuss process and criteria for consideration
Feb 15 (target date) Publish/Release data to campus community
Feb 15 – March 1 Continued stakeholder engagement via forums, etc.
March 1 – March 15 Meetings with LCCEA and LCCEF to discuss potential impacts
March 22– April 2 Interviews with impacted program stakeholders
April 7 Present recommendations to Board of Education for review and discussion
Programs and Services Reviewed
Academic Learning Skills (ALS)
Aviation Academy - Aviation Maintenance (AV) - AAS, Aviation Maintenance Technician - 2-yr Certificate, Aviation Maintenance Technician
Aviation Academy - Flight Technology (FT) - AAS, Flight Technology
Culinary Arts (CA) - 1-yr Certificate, Commercial Cooking - 1-yr Certificate, Commercial Baking and Pastry - Career Pathways Certificate, Baking and Pastry
Hotel, Restaurant, Tourism Management (HRTM) - AAS, Hotel/Restaurant/Tourism Management (current program suspended)
Manufacturing (CNC, MFG) - AAS, Manufacturing Technology - AAS, Manufacturing Technology, CNC Technician - Career Pathways Certificate, Manufacturing Technician 1 - Career Pathways Certificate, Manufacturing Technician 2
Specialized Support Services (S3)

3
Programs and Services Summary: Academic Learning Skills (ALS) The ALS Department is housed within the College and Career Foundations (CCF) Division. Within the CCF Division, developmental education is provided by the ALS Department (credit) and ABSE Department (noncredit). There is some overlap between these two departments. In addition, English as a Second Language instruction is offered within this division. Specifically, the ALS Department provides instruction at both the developmental and transfer levels to prepare students for success in lower division and career/technical courses and in work, family and community settings. The Department uses assessment and placement information to offer sequenced credit courses in reading, writing, English as a Second Language, math and study skills. Current Contracted Staffing: (Data Source: Office of Human Resources) Fulltime Faculty: 2 Fulltime Classified: 1 Enrollment and Demographics: (Data Source: LCC Office of Planning and Institutional Effectiveness)
Fall 2016 Fall 2017 Fall 2018 Fall 2019 Fall 2020Course Enrollments--ALS 1132 1049 960 726 163FTE 81.52 76.46 61.09 45.97 8.93
Student to Personnel FTE (ALS Department Level) AY17 AY18 AY19 AY20 n.a.15.2 13.2 10.8 7.4
DemographicsUnduplicated student count from enrollments 715 646 547 425 122Percent Female 50% 50% 53% 56% 64%Percent Receiving PELL 60% 57% 54% 53% 59%Percent First Generation 70% 58% 50% 60% 61%Percent Receiving Veteran Benefits 4% 4% 1% 3% 1%Average Age 23.3 22.4 22.0 23.2 25.0
Percent Race/EthincityLatino (any race) 18% 19% 19% 24% 21%American Indian/Alaskan Native 2% 2% 2% 2% 1%Asian 3% 2% 2% 2% 1%Black/African American 4% 5% 5% 5% 4%Pacific Islander 1% 2% 1% 0% 0%More than one race 7% 7% 4% 5% 8%White/Non-Latino 63% 58% 62% 54% 53%International 3% 5% 5% 8% 13%

4
ALS 2020 Department Datasheet: (Data Source: LCC Office of Planning and Institutional Effectiveness)
Version: February 8, 2021
CourseCredits
Growth RateFTE
Growth Rate2020 Capacity
Utilization Rate2020 Course Success
Rate2020 Net
Revenue per FTE
College Wide -3.9% -4.7%All 53%
Credit only 69%81.5% $ (119)
Academic Learning Skills -15% -18% 71% 70% 1,457$
ALS -Academic Learning Skills Ю Ю 36% 54% 325$
ED - Education -32% -32% na na
EL - Effective Learning -10% -10% 70% 72% 841$
MTH - Mathematics -18% -18% 70% 47% (1,507)$
RD - Reading Skills -29% -29% 38% 56% na
WR - Writing -23% -23% 80% 75% 2,502$
College Wide Instructional Departments Department
16.9 7.4
Awards conferred 2019-20 5-yr Trend
Percent from Fall 2017 cohort 5-yr Trend
Transfer Total
Career Technical Total
Completed In Process Future
Academic Learning Skills (ALS)
AAOT AS AGS Direct Transfer
AAS 2-yr Cert 1-yr Cert Less than 1-yr Cert
NOTESЮ Data is not available due to 2 or more zero enrollment years during the past 4 years^^ Rates are suppressed due to low number of students.# Net Revenue per FTE was not calculated at the course/subject levelЏ No relevant programs of study are offered in this department
Џ Џ
Data not applicable
Data not applicable
Award Seeking Regular Credit Student's Declared Program of Study/Majors FALL 2020
Program Review - Year One Status
2020 Department Datasheet
Academic Learning Skills
2020 Ratio ofStudent to Personnel FTE
Awards & Transfers
AwardsTransfer to 4-yr Institution
within 3 years
Department datasheets and the standard data package are designed to be used as a reference and resource for department planning,program review, and department-level dialogue about program performance, goals, issues, opportunities, and improvement efforts. It isthrough dialogue and planning processes that program faculty, staff and managers develop and share essential context, meaning, andimprovement plans from this data.

5
Fiscal Implications: (Data Source: LCC Budget Office)
Academic Learning Skills Options and Recommendations The enrollments within the ALS Department have been declining for consecutive years. The reasons for this are multiple. Overall enrollment declines, changes in placement testing, developmental education redesign, and overlap in curriculum among multiple departments have been contributors to the decline in ALS enrollments. It is recommended that the departments undergo a curriculum review to determine the best placement of developmental education courses (credit/noncredit, ALS/ABSE/Math/Writing) and to reduce duplication among courses. The Division stakeholders should review the need for a separate ALS department, given the declining enrollments. Should the department be eliminated, current ALS faculty may need to be “transferred” to other departments where the courses reside, or to other departments in which they are certified to teach. Should retrenchment be necessary following this review, the College will work within the requirements outlined in the LCCEA Collective Bargaining Agreement. Progress will be monitored throughout the 2021-2022 Academic Year. The review will be conducted and a recommendation to the Provost will be completed by June, 2022.
Academic Learning SkillsRevenue and Expenditures - All FundsAs of 1/12/2021
2016 2017 2018 2019 2020Direct Revenue 928,683$ 983,623$ 793,890$ 645,385$ 474,124$ Personnel - Faculty 291,100 294,329 248,973 291,723 187,647 Personnel - Staff 53,842 44,488 49,241 63,301 28,075 Personnel - Management 18,203 44,726 47,773 27,076 30,790 Part- Time Labor 348,327 358,336 355,739 243,534 177,613 OPE 366,250 384,052 363,989 346,108 225,261 Materials & Services 18,033 31,375 18,724 12,480 3,785 Operating Income (167,072)$ (173,683)$ (290,549)$ (338,837)$ (179,047)$

6
Aviation Academy The Aviation Academy provides STEM training programs for pilots and service technicians (Flight Technology, Aviation Maintenance Technicians (AMT), and small unmanned aircraft systems (sUAS). Employment prospects for graduates are strong, especially when looking statewide and nationally. In 2002, the program was moved into Fund IX with the expectation it would be financially self-supporting as an alternate to the proposed elimination of the program. The program underwent a comprehensive operational review in 2014 to address chronic financial shortfalls in its Fund IX operations. The new operational and financial structure, implemented in fiscal year 2015, included reorganizations of certain positions that support both the flight technology and aviation maintenance programs, a new (increased) fee structure for students, and a recurring general fund contribution to support operations plus general fund contribution towards fleet capital investments. Aviation Maintenance Technology The Aviation Maintenance Technology Program is a FAA Approved Part 147 School. FAA-certificated Aviation Maintenance Technicians (AMT) work in highly-technical specialty occupations involving the continued operational safety of products and articles, keeping U.S.-registered aircraft operating safely and efficiently. AMTs hold highly-transferable skills that can be used in a broad-range of industries; career opportunities in the aviation sector include employment at airlines, fixed-base operators, manufacturers, repair stations, aviation maintenance schools and in business or general aviation. Flight Technology Lane's Flight Technology Program offers a two-year Associate of Applied Science degree which includes flight training for Commercial Pilot in single and multiengine airplanes with instrument rating. Additional training is available for Flight Instructor with ratings for airplane, instrument and multi-engine. In addition, non-degree seeking students may take flight training toward Private Pilot through Advanced Ratings to complement other education or career goals. Commercial Unmanned Aerial Systems The UAS degree is built upon stackable credentials in GIS and Aerial Photography. Upon completion, students are prepared for jobs such as a UAS inspection pilot, UAS cinema pilot, Mapping and Geospatial Information pilot, or Unmanned Systems specialist. Students gain the knowledge, licenses and (optional) certificates to either work for a wide range of cutting-edge companies, or transfer to a four-year institution to pursue a bachelor's degree in a field like Geographic Information Systems, Aviation, or UAS systems.

7
Aviation Academy 2020 Department Datasheet: (Data Source: LCC Office of Planning and Institutional Effectiveness)
Version: February 8, 2021
CourseCredits
Growth RateFTE
Growth Rate2020 Capacity
Utilization Rate2020 Course Success
Rate2020 Net Revenue
per FTE
College Wide -3.9% -4.7%All 53%
Credit only 69%81.5% $ (119)
Aviation Academy -13% -13% 18% 83% (13,873)$
AS - Aerospace Science 33% 50% 6% 100% 5,165$
AV - Aviation Maintenance -15% -15% 62% 93% (14,246)$
BA - Business Administration 3% 3% 60% 1 (13,809)$
FT - Flight Technology -7% -5% 14% 79% (13,429)$
GS - General Science -35% -35% Ѯ Ѯ -$
College Wide Instructional Departments Department
16.9 6.0
Awards conferred 2019-20 5-yr Trend
Percent from Fall 2017 cohort 5-yr Trend
Associate of General Studies (24.01) 1 -0.1
Transfer Total 1 -0.1 Џ Џ
Flight Technology (49.01) 9 0.6
Aviation Maintenance (47.06) 6 0.1
Career Technical Total 15 0.7 9% -1.2
Completed In Process Future
Flight Technology (49.01)
Aviation Maintenance (47.06)
AAOT AS AGS Direct Transfer
AAS 2-yr Cert 1-yr Cert Less than 1-yr CertFlight Technology 34Aviation Maintenance Tech 31 8
NOTESЮ Data is not available due to 2 or more zero enrollment years during the past 4 years¥ Data is not applicable for non-credit coursesѮ No enrollments during 2019-20 therefore data is not available^^ Rates are suppressed due to low number of students.# Net Revenue per FTE was not calculated at the course/subject levelЏ No relevant programs of study are offered in this department
Program Review - Year One Status
Award Seeking Regular Credit Student's Declared Program of Study/Majors FALL 2020
2020 Department Datasheet
Aviation Academy
2020 Ratio ofStudent to Personnel FTE
Awards & Transfers
AwardsTransfer to 4-yr Institution
within 3 years
Department datasheets and the standard data package are designed to be used as a reference and resource for department planning,program review, and department-level dialogue about program performance, goals, issues, opportunities, and improvement efforts. It isthrough dialogue and planning processes that program faculty, staff and managers develop and share essential context, meaning, andimprovement plans from this data.

8
Aviation Academy - Aviation Maintenance Technology (AV) Current Staffing: (Data Source: Office of Human Resources) Fulltime Faculty: 3 Management: 0.5 Enrollment and Demographics: (Data Source: LCC Office of Planning and Institutional Effectiveness)
Labor Market Information
Data Source: US Bureau of Labor and Statistics, Occupational Outlook Handbook State of Oregon Employment Department, Occupational Profiles
Fall 2016 Fall 2017 Fall 2018 Fall 2019 Fall 2020Course Enrollments--AV 107 84 58 77 87FTE 27.71 23.72 16.51 21.75 25.14
AY17 AY18 AY19 AY20Student to Personnel FTE (Aviation Department Level) 11.0 8.9 8.3 6.0
DemographicsUnduplicated student count from enrollments 43 34 24 34 38Percent Female 14% 12% 25% 18% 13%Percent Receiving PELL 51% 32% 33% 50% 50%Percent First Generation 53% 44% 63% 47% 55%Percent Receiving Veteran Benefits 19% 15% 21% 12% 18%Average Age 29.2 26.4 28.3 29.0 29.5
Percent Race/EthincityLatino (any race) 11% 11% 9% 12% 11%American Indian/Alaskan Native 3% 0% 0% 3% 3%Asian 0% 0% 4% 3% 3%Black/African American 3% 4% 0% 0% 3%More than one race 6% 14% 17% 6% 5%White/Non-Latino 75% 64% 65% 64% 63%International 3% 7% 4% 12% 13%
AWARDS AY17 AY18 AY19 AY20AAS: Aviation Maintenance 4 16 12 2Cert 2Yr: Aviation Maint 3 14 12 4
Aviation Maintenance
Representative JobsAnnual Job Openings
(pre-covid) State/Lane County
10 yr Labor Proj. (pre-covid)
State/Lane County
Entry-Level Education
Entry-level Wages State/Lane County
(approximate)
Median Wages State/Lane County
(approximate)
Aircraft Mechanic and Service Technician 131 / 5 7.1% / 7.0% Certificate / AAS $19.87 / $22.67 $30.01 / $39.81

9
Fiscal Implications: (Data Source: LCC Budget Office)
Aviation Maintenance Options and Recommendations Course success rates and enrollments have been increasing over the past few years. Program completions have not been strong. Students do not see the value in completing the degree and often leave the program prior to degree and certificate completion. In addition, based upon current program requirements, the AMT program is overstaffed with FT faculty, leading to excess cost relative to revenue. It is recommended that the AMT program complete Program Review process to ensure program requirements are in line with industry needs. As part of this review, the program stakeholders should consider FAA requirements and curriculum alignment with both FAA and industry needs. The college will also review staffing levels and work to align FT staffing with program needs. Should retrenchment be necessary following this review, the College will work within the requirements outlined in the LCCEA Collective Bargaining Agreement. The review will be conducted and a recommendation will be submitted to the Provost no later than June, 2022. The College has submitted a federal grant proposal to partially support and upgrade this program. Increased advertising and marketing should be performed to highlight this program for high school graduates and displaced workers interested in a hands-on career with growth potential. The College will continue to actively monitor program effectiveness and efficiency through the Program and Services Sustainability process.
Aviation Academy (Aviation Maintenance)Revenue and Expenditures - All FundsAs of 1/14/2021
2016 2017 2018 2019 2020Direct Revenue 207,161$ 392,802$ 196,915$ 185,456$ 155,203$ Personnel - Faculty 134,075 141,064 210,761 225,982 243,621 Personnel - Staff 39,127 39,613 46,825 - - Personnel - Management 39,028 39,557 25,627 - 34,312 Personnel - Part-Time 50,095 60,522 55,568 11,701 9,126 OPE 154,863 163,948 205,760 151,452 181,345 Materials & Services, Other 49,159 101,992 60,940 35,894 45,261 Operating Income (259,185)$ (153,894)$ (408,566)$ (239,573)$ (358,462)$
Capital Outlay 5,138$ 176,857$ -$ -$ 82,412$
10
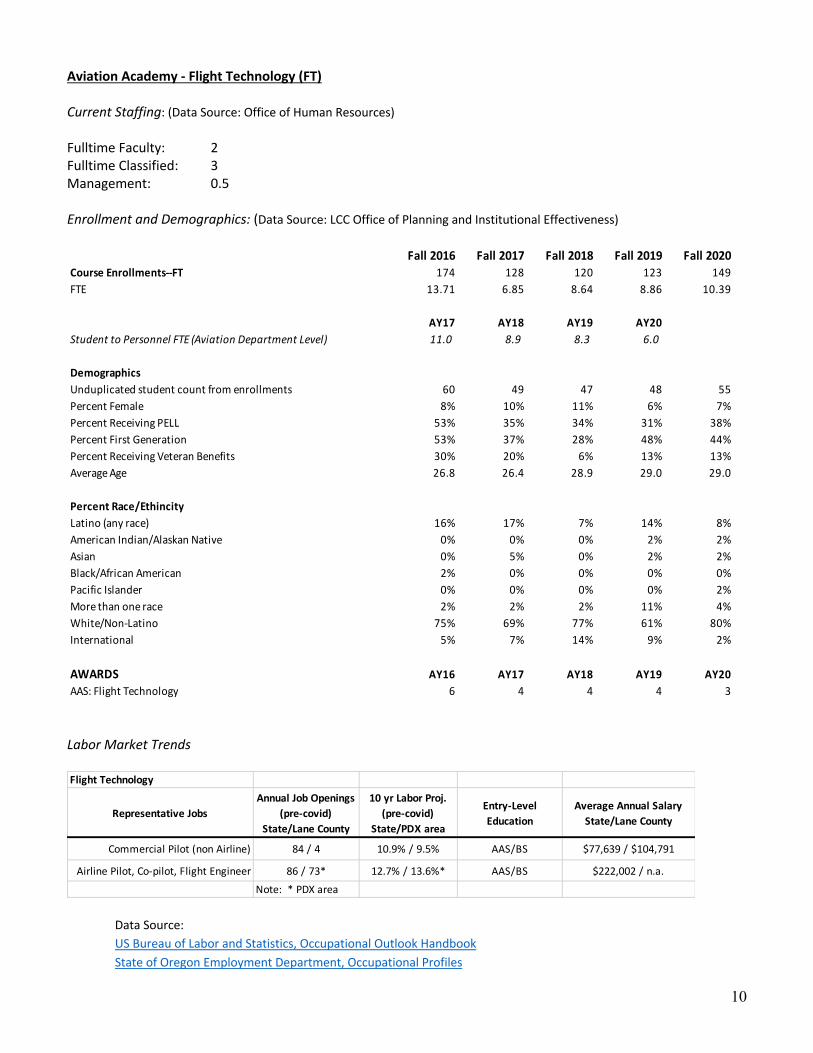
Aviation Academy - Flight Technology (FT) Current Staffing: (Data Source: Office of Human Resources) Fulltime Faculty: 2 Fulltime Classified: 3 Management: 0.5 Enrollment and Demographics: (Data Source: LCC Office of Planning and Institutional Effectiveness)
Labor Market Trends
Data Source: US Bureau of Labor and Statistics, Occupational Outlook Handbook State of Oregon Employment Department, Occupational Profiles
Fall 2016 Fall 2017 Fall 2018 Fall 2019 Fall 2020Course Enrollments--FT 174 128 120 123 149FTE 13.71 6.85 8.64 8.86 10.39
AY17 AY18 AY19 AY20Student to Personnel FTE (Aviation Department Level) 11.0 8.9 8.3 6.0
DemographicsUnduplicated student count from enrollments 60 49 47 48 55Percent Female 8% 10% 11% 6% 7%Percent Receiving PELL 53% 35% 34% 31% 38%Percent First Generation 53% 37% 28% 48% 44%Percent Receiving Veteran Benefits 30% 20% 6% 13% 13%Average Age 26.8 26.4 28.9 29.0 29.0
Percent Race/EthincityLatino (any race) 16% 17% 7% 14% 8%American Indian/Alaskan Native 0% 0% 0% 2% 2%Asian 0% 5% 0% 2% 2%Black/African American 2% 0% 0% 0% 0%Pacific Islander 0% 0% 0% 0% 2%More than one race 2% 2% 2% 11% 4%White/Non-Latino 75% 69% 77% 61% 80%International 5% 7% 14% 9% 2%
AWARDS AY16 AY17 AY18 AY19 AY20AAS: Flight Technology 6 4 4 4 3
Flight Technology
Representative JobsAnnual Job Openings
(pre-covid) State/Lane County
10 yr Labor Proj. (pre-covid)
State/PDX area
Entry-Level Education
Average Annual Salary State/Lane County
Commercial Pilot (non Airline) 84 / 4 10.9% / 9.5% AAS/BS $77,639 / $104,791
Airline Pilot, Co-pilot, Flight Engineer 86 / 73* 12.7% / 13.6%* AAS/BS $222,002 / n.a.Note: * PDX area

11
Fiscal Implications: (Data Source: LCC Budget Office)
Flight Technology Options and Recommendations Lane’s Aviation Academy program is a valued part of the College’s career technical program, providing high-quality training for students interested in flight careers or aviation maintenance careers. Multi-year issues with Veteran’s Administration rules and an aging fleet have created significant financial pressures on the program. The VA issues appear to be resolved, but there is still great need for capital investment in the program. The program created a ten-year capital fleet investment schedule in 2017. This plan is currently outdated and is under revision. The updated capital plan will reflect lease and partnership opportunities in addition to plane purchases. The College has also actively sought community investment in the fleet and has submitted a federal grant proposal in attempts to secure external capital investment. The current Flight Technology program structure was designed under restrictive FAA regulations. These regulations hinder student progress, increase student cost, and are financially unsustainable for LCC. The current degree also does not require all FAA certificates and ratings required for a successful aviation career. Additionally, the current flight program was not competitive with other community college programs. The FT program has been updated recently to less restrictive FAA regulations and includes the following:
• Increased flight instructional hours due to Academy restructuring under new government regulations • Addition of Multi-Engine, Flight Instructor and Instrument Flight Instructor to align with industry and
other community colleges • Modification of flight training from lecture to lab modality to better align with industry standards • Program structure that allows full use of federal financial aid within stackable program credentials
It is recommended that the College consider moving Flight Technology program to the general fund, along with all other career technical academic programs. External sources of capital investment along with a more efficient curriculum, should lead to better student outcomes for the program, and a more sustainable financial situation. The College will continue to regularly assess and address program outcomes – academic, access and equity, financial, and workforce – as with all other programs and services.
Aviation Academy (FT)Revenue and Expenditures - All FundsAs of 1/14/2021
2016 2017 2018 2019 2020Direct Revenue 874,374$ 977,467$ 913,499$ 826,517$ 513,304$ Personnel - Faculty 75,482 78,832 138,673 153,361 156,422 Personnel - Staff 118,557 129,394 177,498 166,356 169,734 Personnel - Management 39,031 39,556 25,327 - 34,312 Personnel - Part-Time 198,075 206,006 140,288 96,643 87,220 OPE 224,433 236,864 276,881 245,507 263,843 Materials & Services, Other 386,657 368,739 302,976 176,339 217,832 Operating Income (167,861)$ (81,924)$ (148,144)$ (11,690)$ (416,059)$
Capital Outlay 21,045$ 92,639$ 93,000$ -$ -$
Direct Support from General Fund 185,386$ 120,000$ 170,000$ -$ 311,456$
12
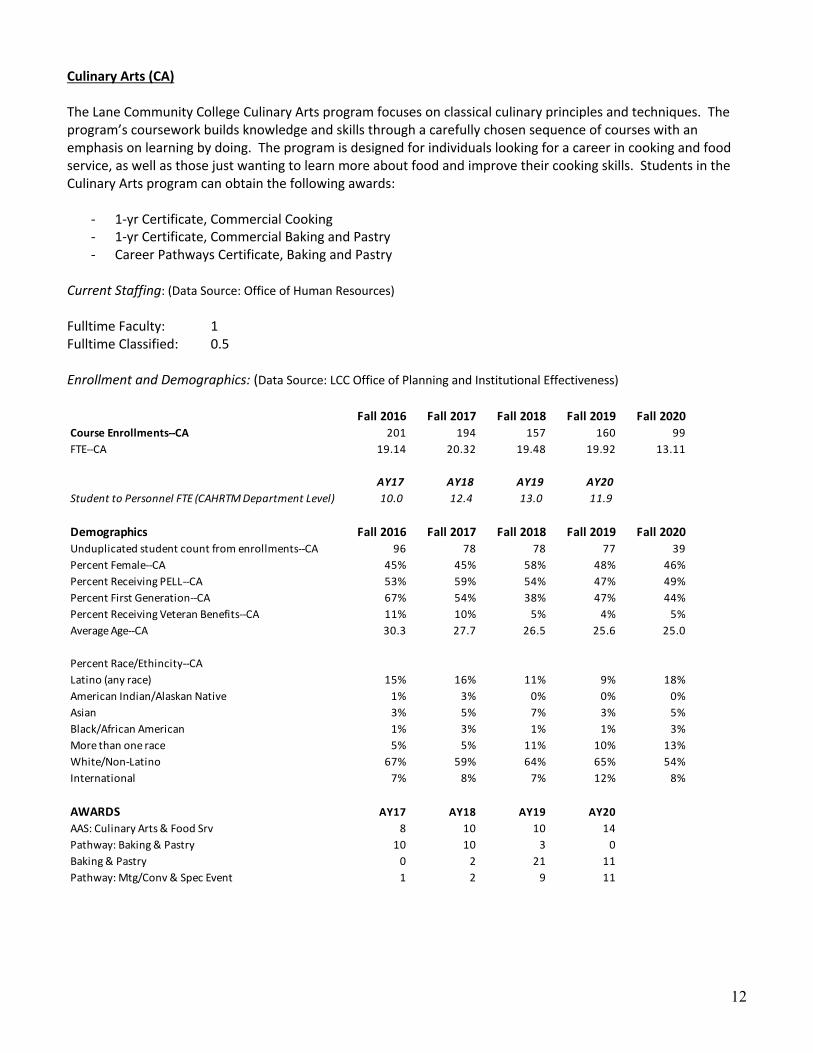
Culinary Arts (CA) The Lane Community College Culinary Arts program focuses on classical culinary principles and techniques. The program’s coursework builds knowledge and skills through a carefully chosen sequence of courses with an emphasis on learning by doing. The program is designed for individuals looking for a career in cooking and food service, as well as those just wanting to learn more about food and improve their cooking skills. Students in the Culinary Arts program can obtain the following awards:
- 1-yr Certificate, Commercial Cooking - 1-yr Certificate, Commercial Baking and Pastry - Career Pathways Certificate, Baking and Pastry
Current Staffing: (Data Source: Office of Human Resources) Fulltime Faculty: 1 Fulltime Classified: 0.5 Enrollment and Demographics: (Data Source: LCC Office of Planning and Institutional Effectiveness)
Fall 2016 Fall 2017 Fall 2018 Fall 2019 Fall 2020Course Enrollments--CA 201 194 157 160 99FTE--CA 19.14 20.32 19.48 19.92 13.11
AY17 AY18 AY19 AY20Student to Personnel FTE (CAHRTM Department Level) 10.0 12.4 13.0 11.9
Demographics Fall 2016 Fall 2017 Fall 2018 Fall 2019 Fall 2020Unduplicated student count from enrollments--CA 96 78 78 77 39Percent Female--CA 45% 45% 58% 48% 46%Percent Receiving PELL--CA 53% 59% 54% 47% 49%Percent First Generation--CA 67% 54% 38% 47% 44%Percent Receiving Veteran Benefits--CA 11% 10% 5% 4% 5%Average Age--CA 30.3 27.7 26.5 25.6 25.0
Percent Race/Ethincity--CALatino (any race) 15% 16% 11% 9% 18%American Indian/Alaskan Native 1% 3% 0% 0% 0%Asian 3% 5% 7% 3% 5%Black/African American 1% 3% 1% 1% 3%More than one race 5% 5% 11% 10% 13%White/Non-Latino 67% 59% 64% 65% 54%International 7% 8% 7% 12% 8%
AWARDS AY17 AY18 AY19 AY20AAS: Culinary Arts & Food Srv 8 10 10 14Pathway: Baking & Pastry 10 10 3 0Baking & Pastry 0 2 21 11Pathway: Mtg/Conv & Spec Event 1 2 9 11

13
CAHRTM 2020 Department Datasheet: (Data Source: LCC Office of Planning and Institutional Effectiveness)
Version: February 8, 2021
CourseCredits
Growth RateFTE
Growth Rate2020 Capacity
Utilization Rate2020 Course Success
Rate2020 Net Revenue
per FTE
College Wide -3.9% -4.7%All 53%
Credit only 69%81.5% $ (119)
CAHM Department 1% 1% 53% 79% (1,654)$
CA - Culinary Arts -7% -5% 56% 78% (1,962)$
HRTM - Hotel/Restaurant/Tourism Management 14% 19% 50% 81% (1,177)$
College Wide Instructional Departments
Department
16.9 11.9
Awards conferred 2019-20 5-yr Trend
Percent from Fall 2017 cohort 5-yr Trend
Associate of Arts Oregon Transfer (24.01) 0 0.5
Associate of General Studies (24.01) 0 0.7
Transfer Total 0 1.2 ^^ 0.1
Culinary Arts & Food Service Management (12.05) 40 4.1
Hotel/Restaurant/Tourism Management (52.09) 29 3.1
Career Technical Total 69 7.2 7% -3.6
Completed In Process Future
Culinary Arts & Hotel/Restaurant/Tourism Management
Hotel/Restaurant/Tourism Management
AAOT AS AGS Direct Transfer
Culinary Arts & Food Srv Management (24.01) 1
Hospitality Management (24.01) 3
Hotel Restaurant & Tour Mgmt (24.01) 1
Undecided_Culinary,Hosp,Tourism (24.01) 8AAS 2-yr Cert 1-yr Cert Less than 1-yr Cert
Culinary Arts & Food Srv Mgt (12.05) 2
Culinary Arts & Food Srv Mgt-admitted (12.05) 24
Hotel/Restaurant/Tourism Management-admitted ( 12
Hotel/Restaurant/Tourism Mgmt (52.09) 3
Commercial Cooking (12.05) 11Commercial Baking & Pastry and Baking & Pastry (12.05) 5 1
NOTESЮ Data is not available due to 2 or more zero enrollment years during the past 4 years¥ Data is not applicable for non-credit coursesѮ No enrollments during 2019-20 therefore data is not available^^ Rates are suppressed due to low number of students.# Net Revenue per FTE was not calculated at the course/subject levelЏ No relevant programs of study are offered in this department
Program Review - Year One Status
Award Seeking Regular Credit Student's Declared Program of Study/Majors FALL 2020
2020 Department Datasheet
Culinary Arts & Hotel/Restaurant/Tourism Management
2020 Ratio ofStudent to Personnel FTE
Awards & Transfers
Awards Transfer to 4-yr Institutionwithin 3 years
Department datasheets and the standard data package are designed to be used as a reference and resource for department planning, program review,and department-level dialogue about program performance, goals, issues, opportunities, and improvement efforts. It is through dialogue and planningprocesses that program faculty, staff and managers develop and share essential context, meaning, and improvement plans from this data.

14
Labor Market Trends
Data Source: US Bureau of Labor and Statistics, Occupational Outlook Handbook State of Oregon Employment Department, Occupational Profiles
Fiscal Implications: (Data Source: LCC Budget Office)
Culinary Arts Options and Recommendations The Culinary Arts program has been moved under the leadership of Senior Instructional Dean Chris Rehn. Dean Rehn has been working with the CA faculty and other stakeholders to align expenses with revenue (as best as possible) and operate within annual GF and ICP budgets. There has been noticeable improvement over the past year. In addition, the FT Faculty FTE has been reduced from 2.0 to 1.0, leading to lower instructional costs. The previous Culinary program was a “French Chef” style AAS curriculum. Such a curriculum, has high overhead driven by pricey product and expensive equipment. Moreover, the curriculum is student-contact intensive with few students and small labs -- often with one student per work station. Consequently, the program generated significantly fewer student credits. The curriculum challenges were further complicated by the setting. Industry representatives and CA Faculty indicated that the French-style curriculum is likely not synchronized with the local job market, where the majority of employment opportunities are as line cooks. In late 2019, Culinary Arts faculty agreed to reduce the Culinary degree to a one-year degree. We now offer one-year certificates that give students commercial cooking or baking skill sets and credentialing at half the cost. About half of our baking students are in the PASS Lane program, which has lowered their costs and supported their success.
Culinary Arts
Representative JobsAnnual Job Openings
(pre-covid) State/Lane County
10 yr Labor Proj. (pre-covid)
State/Lane County
Entry-Level Education
Entry-level Wages State/Lane County
(approximate)
Median Wages State/Lane County
(approximate)chefs and head cooks 285 / 19 12.4% / 9.1% Certificate $15.06/$16.52 $23.67 / $20.27
restaurant cook 4017 / 274 20.7% / 16.9% less than HS / HS $12.35/$12.36 $14.88 / $13.87baker 473 / 62 12.9% / 12.4% less than HS / HS $12.10/$12.29 $14.66 / $12.98
Culinary Arts Revenue and Expenditures - All FundsAs of 1/13/2021
2016 2017 2018 2019 2020Direct Revenue 265,197 332,998 437,136 360,832 282,369 Personnel - Faculty 217,853 188,685 195,381 182,855 178,307 Personnel - Staff 3,312 15,035 58,355 48,504 34,476 Personnel - Management - - - - 8,467 Personnel - Part-Time Labor 57,175 64,867 38,347 56,380 37,763 OPE 163,236 155,024 179,867 171,148 155,950 Materials & Services 147,772 166,249 190,264 135,627 75,986 Operating Income (324,152) (256,862) (225,079) (233,682) (208,579)

15
It is recommended that the College continue to support the CA program in this new design. It is hopeful that changes to the management of the program will lead to better fiscal efficiency. The curriculum redesign should allow students to earn a credential in less time and expense. Student success should improve, both by accelerating the time to a credential and by allowing reverse credentialing for those who dropped out of the program. In addition, it is recommended that the program consider creating additional stackable, short-term vocational certificates in noncredit to allow for another “on-ramp” to the credit program. The College will continue to actively monitor program effectiveness and efficiency through the Program and Services Sustainability process as the labor market recovers from the huge loss due to the Covid-19 pandemic.

16
Hotel/Restaurant/Tourism Management (HRTM) Historically, the HRTM program was intricately linked to the CA program. Recently, the CA Commercial Cooking program was restructured away from a 2 yr. AAS program into a 1 yr. Certificate, which is more appropriate for entry level employment in our area. As a result, the HRTM program had to be updated as well. Students in the redesigned HRTM program can obtain the following awards:
- AAS, Hotel/Restaurant/Tourism Management Current Staffing: (Data Source: Office of Human Resources) Fulltime Faculty: 1 Fulltime Classified: 0.5 Enrollment and Demographics: (Data Source: LCC Office of Planning and Institutional Effectiveness)
Fall 2016 Fall 2017 Fall 2018 Fall 2019 Fall 2020Course Enrollments--HRTM 123 110 159 165 41FTE--HRTM 8.19 7.85 11.57 12.99 2.64
AY17 AY18 AY19 AY20Student to Personnel FTE (CAHRTM Department Level) 10.0 12.4 13.0 11.9
Demographics Fall 2016 Fall 2017 Fall 2018 Fall 2019 Fall 2020Unduplicated student count from enrollments--HRTM 68 76 72 89 31Percent Female--HRTM 53% 51% 54% 49% 58%Percent Receiving PELL--HRTM 57% 54% 63% 52% 42%Percent First Generation--HRTM 69% 57% 42% 40% 45%Percent Receiving Veteran Benefits--HRTM 10% 9% 7% 6% 3%Average Age--HRTM 29.1 27.4 26.8 25.6 24.0
Percent Race/Ethincity--HRTMLatino (any race) 18% 10% 9% 7% 23%American Indian/Alaskan Native 2% 1% 0% 0% 0%Asian 5% 6% 4% 2% 0%Black/African American 0% 1% 1% 2% 0%International 5% 10% 14% 18% 13%More than one race 9% 6% 10% 8% 3%White/Non-Latino 62% 67% 61% 63% 61%
AWARDS AY17 AY18 AY19 AY20AAS: Hospitality Management 7 3 3 4AAS: Hotel/Rest/Tourism Mgmt 0 2 3 14

17
CAHRTM 2020 Department Datasheet: (Data Source: LCC Office of Planning and Institutional Effectiveness)
Version: February 8, 2021
CourseCredits
Growth RateFTE
Growth Rate2020 Capacity
Utilization Rate2020 Course Success
Rate2020 Net Revenue
per FTE
College Wide -3.9% -4.7%All 53%
Credit only 69%81.5% $ (119)
CAHM Department 1% 1% 53% 79% (1,654)$
CA - Culinary Arts -7% -5% 56% 78% (1,962)$
HRTM - Hotel/Restaurant/Tourism Management 14% 19% 50% 81% (1,177)$
College Wide Instructional Departments
Department
16.9 11.9
Awards conferred 2019-20 5-yr Trend
Percent from Fall 2017 cohort 5-yr Trend
Associate of Arts Oregon Transfer (24.01) 0 0.5
Associate of General Studies (24.01) 0 0.7
Transfer Total 0 1.2 ^^ 0.1
Culinary Arts & Food Service Management (12.05) 40 4.1
Hotel/Restaurant/Tourism Management (52.09) 29 3.1
Career Technical Total 69 7.2 7% -3.6
Completed In Process Future
Culinary Arts & Hotel/Restaurant/Tourism Management
Hotel/Restaurant/Tourism Management
AAOT AS AGS Direct Transfer
Culinary Arts & Food Srv Management (24.01) 1
Hospitality Management (24.01) 3
Hotel Restaurant & Tour Mgmt (24.01) 1
Undecided_Culinary,Hosp,Tourism (24.01) 8AAS 2-yr Cert 1-yr Cert Less than 1-yr Cert
Culinary Arts & Food Srv Mgt (12.05) 2
Culinary Arts & Food Srv Mgt-admitted (12.05) 24
Hotel/Restaurant/Tourism Management-admitted ( 12
Hotel/Restaurant/Tourism Mgmt (52.09) 3
Commercial Cooking (12.05) 11Commercial Baking & Pastry and Baking & Pastry (12.05) 5 1
NOTESЮ Data is not available due to 2 or more zero enrollment years during the past 4 years¥ Data is not applicable for non-credit coursesѮ No enrollments during 2019-20 therefore data is not available^^ Rates are suppressed due to low number of students.# Net Revenue per FTE was not calculated at the course/subject levelЏ No relevant programs of study are offered in this department
Program Review - Year One Status
Award Seeking Regular Credit Student's Declared Program of Study/Majors FALL 2020
2020 Department Datasheet
Culinary Arts & Hotel/Restaurant/Tourism Management
2020 Ratio ofStudent to Personnel FTE
Awards & Transfers
Awards Transfer to 4-yr Institutionwithin 3 years
Department datasheets and the standard data package are designed to be used as a reference and resource for department planning, program review,and department-level dialogue about program performance, goals, issues, opportunities, and improvement efforts. It is through dialogue and planningprocesses that program faculty, staff and managers develop and share essential context, meaning, and improvement plans from this data.

18
Labor Market Trends
Data Source: US Bureau of Labor and Statistics, Occupational Outlook Handbook State of Oregon Employment Department, Occupational Profiles
Fiscal Implications: (Data Source: LCC Budget Office)
Hospitality Options and Recommendations This Associate of Applied Science (AAS) degree is a new degree that replaces the previous HRTM AAS degree. The new version removes a number of culinary courses, adds a course on tourism, and draws on Business courses, such as introduction to business and marketing/digital marketing. After review of labor market data, education requirements, and industry needs, it is recognized that there is a continued need to modify program offerings as we evaluate entry-level requirements and changing needs in a post-pandemic environment. In particular, it is recommended to eliminate the HRTM AAS and restructure this program to a 1-year Hospitality certificate and a stackable Career Pathways Certificate. This restructure would better align the program with entry level workforce requirements. According to industry surveys, US Bureau of Labor and Statistics, Occupational Outlook Handbook and State of Oregon Employment Department, Occupational Profiles the majority of anticipated job openings in the hospitality industry require less than a college degree and could likely be served by a 1-yr. certificate. The highest earning potential in the industry is in event planning and management, which are better served with a Bachelor’s degree in hospitality or business management. These student-centric changes will better prepare students for entry-level employment, save students time and money, and create opportunities for career advancement along a stackable, career ladder pathway. The College will continue to actively monitor program effectiveness and efficiency through the Program and Services Sustainability process as the labor market recovers from the huge loss due to the Covid-19 pandemic.
Hotel, Restaurant, Tourism Mgmt
Representative JobsAnnual Job Openings
(pre-covid) State/Lane County
10 yr Labor Proj. (pre-covid)
State/Lane County
Entry-Level Education
Entry-level Wages State/Lane County
(approximate)
Median Wages State/Lane County
(approximate)
lodging front desk clerk 566 / 40 1.7% / 0.9% HS $11.93/n.a. $13.24 / $13.99*
lodging manager 123 / 8 12.6% / 9.4% HS / AAS $12.57/$17.33 $23.40 / $31.10
event planner 194 / 17 10.4% / 10.7% Bachelor's $15.53/$13.58 $24.23 / $22.80
wait staff / server 6861 / 602 5.3% / 4.0% less than HS / HS $11.98/n.a. $12.69 / $13.20*
*75th percentile
Hotel/Restaurant/Tourism ManagementRevenue and Expenditures - All FundsAs of 1/13/2021
2016 2017 2018 2019 2020Direct Revenue 109,948 99,118 102,930 163,667 149,270 Personnel - Faculty 128,253 122,852 125,361 141,088 141,132 Personnel - Staff 2,144 6,818 28,416 29,897 22,235 Personnel - Management - - - - 5,460 Personnel - Part-Time Labor 811 990 1,166 7,210 5,858 OPE 83,762 83,365 100,410 113,952 110,276 Materials & Services 16,677 17,420 11,977 14,361 10,905 Operating Income (121,698) (132,326) (164,399) (142,842) (146,596)
19
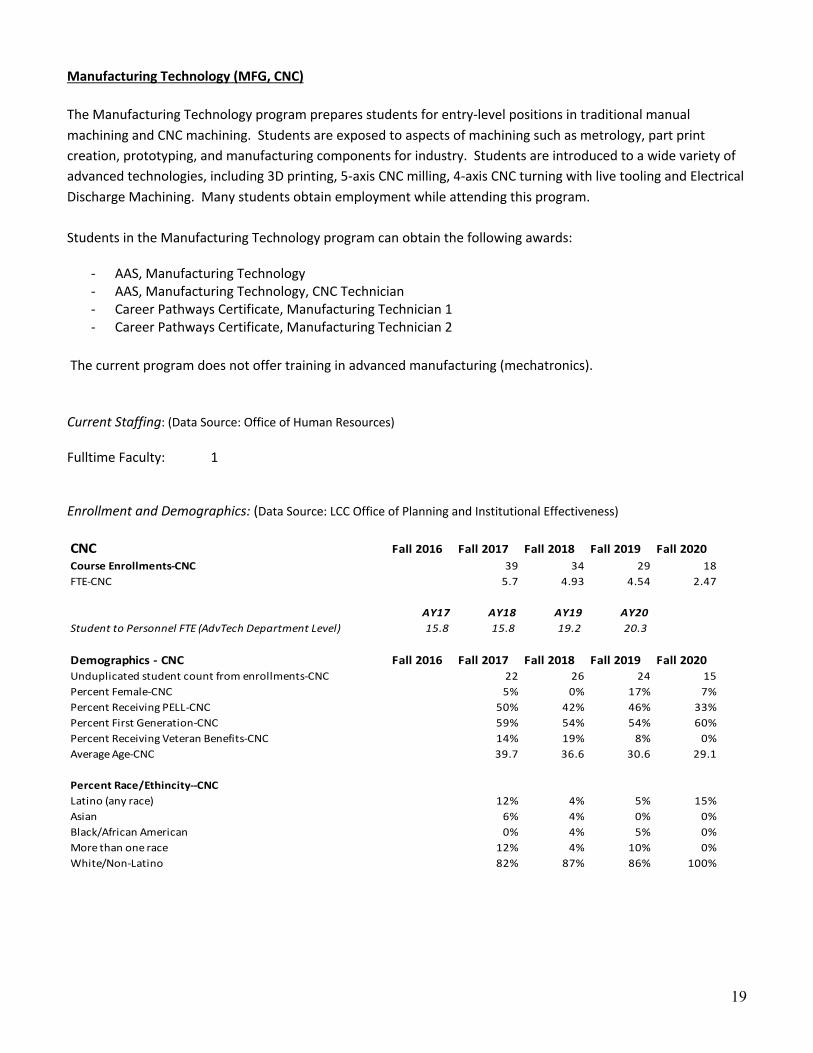
Manufacturing Technology (MFG, CNC) The Manufacturing Technology program prepares students for entry-level positions in traditional manual machining and CNC machining. Students are exposed to aspects of machining such as metrology, part print creation, prototyping, and manufacturing components for industry. Students are introduced to a wide variety of advanced technologies, including 3D printing, 5-axis CNC milling, 4-axis CNC turning with live tooling and Electrical Discharge Machining. Many students obtain employment while attending this program. Students in the Manufacturing Technology program can obtain the following awards:
- AAS, Manufacturing Technology - AAS, Manufacturing Technology, CNC Technician - Career Pathways Certificate, Manufacturing Technician 1 - Career Pathways Certificate, Manufacturing Technician 2
The current program does not offer training in advanced manufacturing (mechatronics). Current Staffing: (Data Source: Office of Human Resources) Fulltime Faculty: 1 Enrollment and Demographics: (Data Source: LCC Office of Planning and Institutional Effectiveness)
CNC Fall 2016 Fall 2017 Fall 2018 Fall 2019 Fall 2020Course Enrollments-CNC 39 34 29 18FTE-CNC 5.7 4.93 4.54 2.47
AY17 AY18 AY19 AY20Student to Personnel FTE (AdvTech Department Level) 15.8 15.8 19.2 20.3
Demographics - CNC Fall 2016 Fall 2017 Fall 2018 Fall 2019 Fall 2020Unduplicated student count from enrollments-CNC 22 26 24 15Percent Female-CNC 5% 0% 17% 7%Percent Receiving PELL-CNC 50% 42% 46% 33%Percent First Generation-CNC 59% 54% 54% 60%Percent Receiving Veteran Benefits-CNC 14% 19% 8% 0%Average Age-CNC 39.7 36.6 30.6 29.1
Percent Race/Ethincity--CNCLatino (any race) 12% 4% 5% 15%Asian 6% 4% 0% 0%Black/African American 0% 4% 5% 0%More than one race 12% 4% 10% 0%White/Non-Latino 82% 87% 86% 100%
20
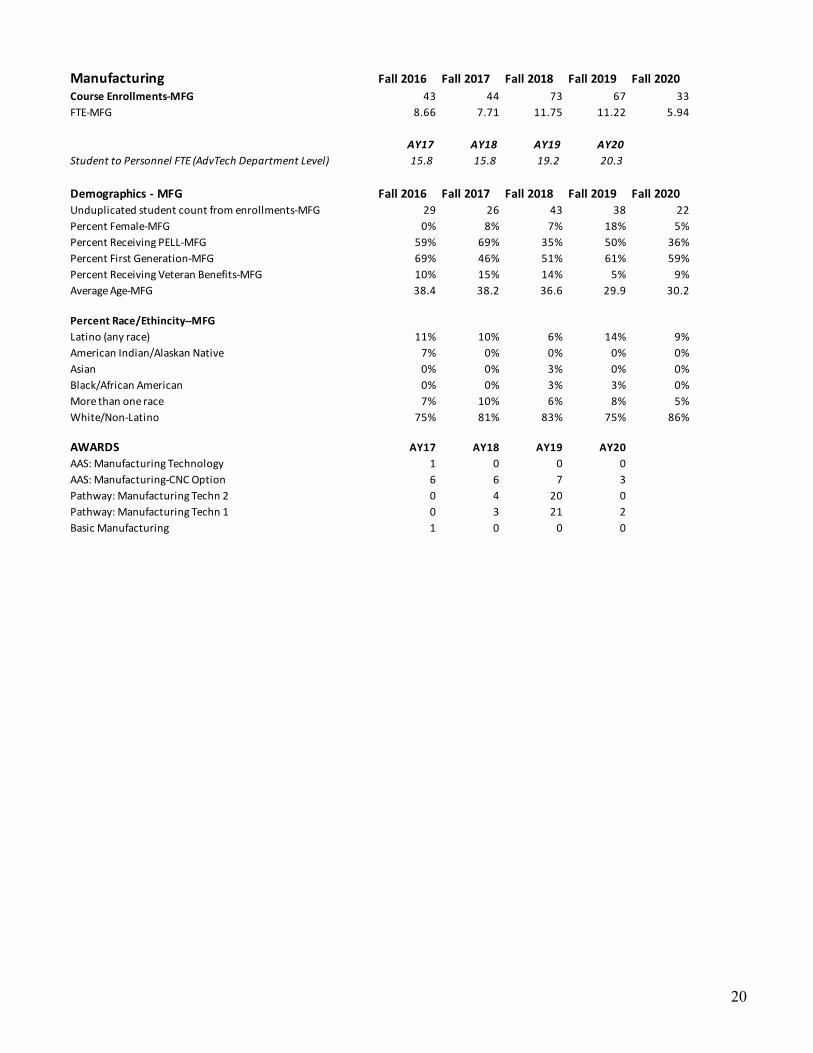
Manufacturing Fall 2016 Fall 2017 Fall 2018 Fall 2019 Fall 2020Course Enrollments-MFG 43 44 73 67 33FTE-MFG 8.66 7.71 11.75 11.22 5.94
AY17 AY18 AY19 AY20Student to Personnel FTE (AdvTech Department Level) 15.8 15.8 19.2 20.3
Demographics - MFG Fall 2016 Fall 2017 Fall 2018 Fall 2019 Fall 2020Unduplicated student count from enrollments-MFG 29 26 43 38 22Percent Female-MFG 0% 8% 7% 18% 5%Percent Receiving PELL-MFG 59% 69% 35% 50% 36%Percent First Generation-MFG 69% 46% 51% 61% 59%Percent Receiving Veteran Benefits-MFG 10% 15% 14% 5% 9%Average Age-MFG 38.4 38.2 36.6 29.9 30.2
Percent Race/Ethincity--MFGLatino (any race) 11% 10% 6% 14% 9%American Indian/Alaskan Native 7% 0% 0% 0% 0%Asian 0% 0% 3% 0% 0%Black/African American 0% 0% 3% 3% 0%More than one race 7% 10% 6% 8% 5%White/Non-Latino 75% 81% 83% 75% 86%
AWARDS AY17 AY18 AY19 AY20AAS: Manufacturing Technology 1 0 0 0AAS: Manufacturing-CNC Option 6 6 7 3Pathway: Manufacturing Techn 2 0 4 20 0Pathway: Manufacturing Techn 1 0 3 21 2Basic Manufacturing 1 0 0 0

21
MFG/CNC 2020 Department Datasheet (combined with Advanced Technologies) : (Data Source: LCC Office of Planning and Institutional Effectiveness)
22
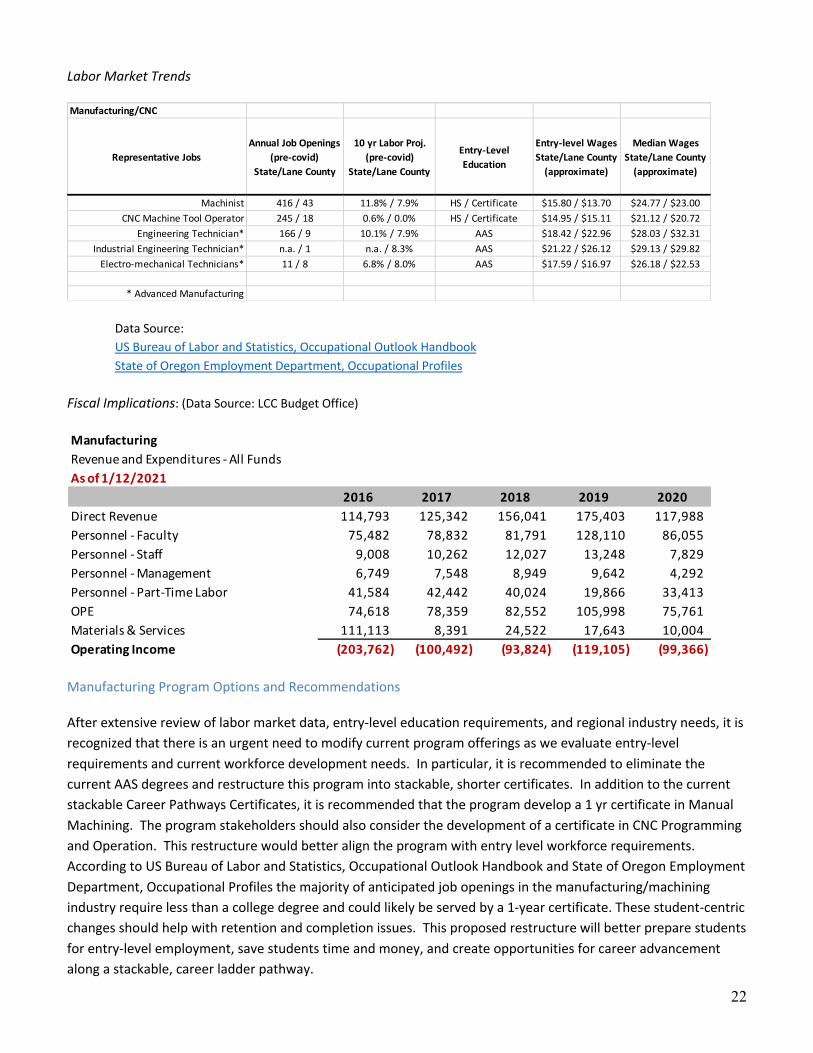
Labor Market Trends
Data Source: US Bureau of Labor and Statistics, Occupational Outlook Handbook State of Oregon Employment Department, Occupational Profiles
Fiscal Implications: (Data Source: LCC Budget Office)
Manufacturing Program Options and Recommendations After extensive review of labor market data, entry-level education requirements, and regional industry needs, it is recognized that there is an urgent need to modify current program offerings as we evaluate entry-level requirements and current workforce development needs. In particular, it is recommended to eliminate the current AAS degrees and restructure this program into stackable, shorter certificates. In addition to the current stackable Career Pathways Certificates, it is recommended that the program develop a 1 yr certificate in Manual Machining. The program stakeholders should also consider the development of a certificate in CNC Programming and Operation. This restructure would better align the program with entry level workforce requirements. According to US Bureau of Labor and Statistics, Occupational Outlook Handbook and State of Oregon Employment Department, Occupational Profiles the majority of anticipated job openings in the manufacturing/machining industry require less than a college degree and could likely be served by a 1-year certificate. These student-centric changes should help with retention and completion issues. This proposed restructure will better prepare students for entry-level employment, save students time and money, and create opportunities for career advancement along a stackable, career ladder pathway.
Manufacturing/CNC
Representative JobsAnnual Job Openings
(pre-covid) State/Lane County
10 yr Labor Proj. (pre-covid)
State/Lane County
Entry-Level Education
Entry-level Wages State/Lane County
(approximate)
Median Wages State/Lane County
(approximate)
Machinist 416 / 43 11.8% / 7.9% HS / Certificate $15.80 / $13.70 $24.77 / $23.00CNC Machine Tool Operator 245 / 18 0.6% / 0.0% HS / Certificate $14.95 / $15.11 $21.12 / $20.72
Engineering Technician* 166 / 9 10.1% / 7.9% AAS $18.42 / $22.96 $28.03 / $32.31Industrial Engineering Technician* n.a. / 1 n.a. / 8.3% AAS $21.22 / $26.12 $29.13 / $29.82
Electro-mechanical Technicians* 11 / 8 6.8% / 8.0% AAS $17.59 / $16.97 $26.18 / $22.53
* Advanced Manufacturing
ManufacturingRevenue and Expenditures - All FundsAs of 1/12/2021
2016 2017 2018 2019 2020Direct Revenue 114,793 125,342 156,041 175,403 117,988 Personnel - Faculty 75,482 78,832 81,791 128,110 86,055 Personnel - Staff 9,008 10,262 12,027 13,248 7,829 Personnel - Management 6,749 7,548 8,949 9,642 4,292 Personnel - Part-Time Labor 41,584 42,442 40,024 19,866 33,413 OPE 74,618 78,359 82,552 105,998 75,761 Materials & Services 111,113 8,391 24,522 17,643 10,004 Operating Income (203,762) (100,492) (93,824) (119,105) (99,366)

23
The highest earning potential in the industry is in the area of advanced manufacturing. Advanced manufacturing is a dynamic industry in Oregon that relies on community colleges to produce a skilled workforce. LCC does not currently have a program in advanced manufacturing. Advanced Manufacturing programs are typically interdisciplinary in nature and typically include courses in mechatronics, machining, welding, fabrication, engineering design, additive manufacturing and the use of Artificial Intelligence in manufacturing and design. Lane Community College is a member of the Oregon Consortium for Strengthening Community Colleges which has received a $5 million U.S. Department of Labor grant to boost students' access to cybersecurity and advanced manufacturing workforce training. The grant is designed to research and collate best practices in cybersecurity and advanced manufacturing education and to support students and displaced workers as they gain new skills and set out on new career paths in the wake of the COVID-19 pandemic and damaged economy. LCC will receive at least $80,000 per year for four years from the award, which the College will use to support advanced manufacturing workforce development. We will leverage this partnership to create a new Advanced Manufacturing AAS, offering stackable credentials in advanced manufacturing and mechatronics. Progress will be monitored throughout the 2021-2022 Academic Year. The curriculum and program revision will be conducted and a curriculum recommendation to the Provost will be completed no later than June, 2022. The College will continue to actively monitor the Manufacturing Technology program effectiveness and efficiency through the Program and Services Sustainability process.

24
Specialized Support Services (S3) Specialized Support Services (S3) provides vocational training and services to individuals with developmental disabilities, with the objective of successfully placing program graduates in competitive employment in the community. Lane is the only community college in Oregon that provides direct services for adults with developmental disabilities. The service model is unique in that S3 clients are integrated within the campus community, working and learning side by side with the general college population. S3 student workers develop vocational skills through modularized curriculum, employment in work sites throughout campus, and co-curricular activities and supports such as a weekly Job Club for students preparing to enter the job market. Since conducting its first program review process in 2011, S3 staff have successfully reduced the size of the program to improve financial sustainability and to better align with workforce needs and placement opportunities in the community. Current Staffing: (Data Source: Office of Human Resources) Fulltime Classified: 5 Client Workers: 50 (approximately) Fiscal Review: (Data Source: LCC Budget Office)
Specialized Support Services Options and Recommendations S3 students are part of the College’s community and represent Lane’s commitment to access, equity and inclusion through social justice. The program is not financially sustainable in the long run without general fund support, however, and the program struggles to recruit and retain staff. It is recommended that when conditions permit, the College partner with local developmental disability service providers to provide direct services, while providing on campus job opportunities through these partnerships. This would involve a coordinated process to ensure smooth transitions for current participants and transfer of contracted staff employees.
Specialized Support ServicesRevenue and Expenditures - All FundsAs of 1/12/2021
2016 2017 2018 2019 2020Direct Revenue** 1,434,944$ 1,174,078$ 1,128,206$ 1,064,878$ 982,394$ Personnel - Staff 406,840 266,978 281,743 254,679 266,426 Personnel - Management 79,603 82,230 84,845 20,446 10,263 Personnel - Part-Time Labor 215,365 207,490 197,512 190,768 155,184 Personnel - Students 312,187 281,823 259,519 259,483 198,317 OPE 427,770 333,551 344,759 279,837 256,488 Materials & Services 151,525 52,155 32,974 24,958 21,700 Operating Income (158,346)$ (50,149)$ (73,146)$ 34,707$ 74,016$
Direct Support from General Fund 1,040,010$ 300,000$ -$ -$ -
*Management restructuring in FY19. ** Grant funding ended in FY16 and revenue is generated by internal contracts (approximately 20%).

25
Currently, conditions due to the Covid-19 pandemic have resulted in a suspension of the majority of these services within the greater Lane County area. As the pandemic subsides, and conditions improve, we plan to engage with the community to discuss the potential partnerships for these services.
![ASbaba’s x r AY PLAN t r t s UPSC STORY [ AY v r]2021](https://static.fdocuments.in/doc/165x107/61879b00a2597c528f01e189/asbabas-x-r-ay-plan-t-r-t-s-upsc-story-ay-v-r2021.jpg)

![ASbaba’s AY PLAN UPSC STORY [ AY ] 2021](https://static.fdocuments.in/doc/165x107/61b163998164be3b457b12e3/asbabas-ay-plan-upsc-story-ay-2021.jpg)


![ASbaba’s x r AY PLAN t r t s UPSC STORY [ AY z] 2021](https://static.fdocuments.in/doc/165x107/61d46c229343e265912f5e40/asbabas-x-r-ay-plan-t-r-t-s-upsc-story-ay-z-2021.jpg)

![ASbaba’s x r AY PLAN t r t s UPSC STOR Y [ AY y] 2021](https://static.fdocuments.in/doc/165x107/628aef9d91f23a03de03f32a/asbabas-x-r-ay-plan-t-r-t-s-upsc-stor-y-ay-y-2021.jpg)


