Program Success of Mental Health Clients in Day … · Program Success of Mental Health Clients in...
20
© Meharry Medical College Journal of Health Care for the Poor and Underserved 27 (2016): 193–212. Program Success of Mental Health Clients in Day Reporting Centers Brian McGregor, PhD Eleanor Brown, LPC Fengxia Yan, MD Crystal Mitchell, BA Charles Robinson, BS James DeGroot, PhD Ronald Braithwaite, PhD Abstract: Day-reporting centers (DRCs) provide programming for probationers with a history of non-compliant behavior related to substance abuse, who are overrepresented among justice-involved men and women. While evaluations of DRCs demonstrate some effectiveness, results are mixed and less is known about predictors of program success. is evaluation compared indicators of program success between adult offenders with a substance use disorder (n = 144) and those with co-morbid mental illness (n = 113) at three DRCs. Analyses examined differences between and within groups on program comple- tion, personal characteristics and subjective measures of well-being. Results indicated that program completers were more likely to be participants with substance use disorders only and to have a drug-related referring charge. No significant differences between groups on most measures of well-being were observed. Future investigations should consider tracking program dropouts to understand better program attrition and explore readiness to change in treatment programming. Key words: Substance-related disorders, patient dropouts, adult, mental disorders. I n the United States, the incidence of serious mental illnesses—such as schizophrenia, major depression, bipolar disorder, and post-traumatic stress disorder—is two to four times higher among prisoners than it is among those in the general population. 1 Mental ORIGINAL PAPER BRIAN MCGREGOR is associated with the Department of Psychiatry and Behavioral Sciences Behavioral Health Disparities Researcher, Division of Health Policy, Satcher Health Leadership Institute, Morehouse School of Medicine. ELEANOR BROWN is associated with the Georgia Department of Corrections, Forsyth, GA. FENGXIA YAN is associated with the Cardiovascular Research Center, Community Health & Preventive Medicine, Morehouse School of Medicine. CRYSTAL MITCHELL is associated with the Community Health and Preventive Medicine, Morehouse School of Medicine. CHARLES ROBINSON is associated with the National SafeCare Training & Research Center, Center for Healthy Development, Georgia State University, Atlanta, GA. JAMES DEGROOT is associated with the Georgia Department of Corrections, Forsyth, GA. RONALD BRAITHWAITE is associated with the Department of Com- munity Health & Preventive Medicine, Department of Psychiatry and Behavioral Sciences, Morehouse School of Medicine. 13_HPU272Sup_McGregor.indd 193 13_HPU272Sup_McGregor.indd 193 3/23/16 1:35 PM 3/23/16 1:35 PM
Transcript of Program Success of Mental Health Clients in Day … · Program Success of Mental Health Clients in...

© Meharry Medical College Journal of Health Care for the Poor and Underserved 27 (2016): 193–212.
Program Success of Mental Health Clients in Day Reporting Centers
Brian McGregor, PhDEleanor Brown, LPC
Fengxia Yan, MDCrystal Mitchell, BA
Charles Robinson, BSJames DeGroot, PhD
Ronald Braithwaite, PhD
Abstract: Day- reporting centers (DRCs) provide programming for probationers with a history of non- compliant behavior related to substance abuse, who are overrepresented among justice- involved men and women. While evaluations of DRCs demonstrate some eff ectiveness, results are mixed and less is known about predictors of program success. Th is evaluation compared indicators of program success between adult off enders with a substance use disorder (n = 144) and those with co-morbid mental illness (n = 113) at three DRCs. Analyses examined diff erences between and within groups on program comple-tion, personal characteristics and subjective measures of well- being. Results indicated that program completers were more likely to be participants with substance use disorders only and to have a drug- related referring charge. No signifi cant diff erences between groups on most measures of well- being were observed. Future investigations should consider tracking program dropouts to understand better program attrition and explore readiness to change in treatment programming.
Key words: Substance- related disorders, patient dropouts, adult, mental disorders.
In the United States, the incidence of serious mental illnesses—such as schizophrenia, major depression, bipolar disorder, and post- traumatic stress disorder—is two to four
times higher among prisoners than it is among those in the general population.1 Mental
ORIGINAL PAPER
BRIAN MCGREGOR is associated with the Department of Psychiatry and Behavioral Sciences Behavioral Health Disparities Researcher, Division of Health Policy, Satcher Health Leadership Institute, Morehouse School of Medicine. ELEANOR BROWN is associated with the Georgia Department of Corrections, Forsyth, GA. FENGXIA YAN is associated with the Cardiovascular Research Center, Community Health & Preventive Medicine, Morehouse School of Medicine. CRYSTAL MITCHELL is associated with the Community Health and Preventive Medicine, Morehouse School of Medicine. CHARLES ROBINSON is associated with the National SafeCare Training & Research Center, Center for Healthy Development, Georgia State University, Atlanta, GA. JAMES DEGROOT is associated with the Georgia Department of Corrections, Forsyth, GA. RONALD BRAITHWAITE is associated with the Department of Com-munity Health & Preventive Medicine, Department of Psychiatry and Behavioral Sciences, Morehouse School of Medicine.
13_HPU272Sup_McGregor.indd 19313_HPU272Sup_McGregor.indd 193 3/23/16 1:35 PM3/23/16 1:35 PM
194 Program success in day reporting centers
health and substance abuse problems are overrepresented among justice- involved men and women, with approximately 50% reporting current symptoms or a recent history of mental health problems1 and a similar percentage meeting criteria for substance dependence or abuse.2 Approximately 75% of individuals in jails and prisons with a mental health problem met criteria for substance abuse or dependence.1 Existing data suggest that formerly incarcerated men and women are much less likely to return to prison when they benefi t from much needed resources including mental health coun-seling and substance abuse treatment.3,4 Unfortunately, drug treatment dropout rates are high among outpatient programs and other treatment modalities, with estimates of 30% within the fi rst month and more than 50% aft er three months in treatment.5 Th ese serious challenges have sparked a signifi cant amount of research examining reasons for high levels of program attrition, which include client- level characteristics such as low motivation for treatment,6,7 primary drug use other than alcohol,8 being non- White,8– 10 extensive criminal history,11,12 and the presence of co-occurring psychiatric illness.13,14 System- level factors including treatment confl icts with work and lack of services such as transportation and housing have also been investigated.6,11
Concomitantly, there has been a signifi cant amount of attention devoted to under-standing how to improve treatment outcomes among drug treatment program partici-pants. Th ere is strong support within the literature for positive associations between longer treatment, higher treatment motivation, and higher socioeconomic status (SES); however, considerably less evidence is available regarding these associations within legally mandated treatment programs and among individuals with co-occurring psy-chiatric diagnoses.15,16
One example of a drug treatment program is the day reporting center (DRC) which is an alternative to incarceration for individuals with alcohol and drug abuse chal-lenges.17 While evaluations of day reporting centers demonstrate some eff ectiveness with lowering recidivism and improving treatment outcomes, results are mixed and less is known about predictors of program success.18,19 Some studies have found that recidivism risk scores and, similar to treatment programs outside of a criminal justice setting, length of stay are associated with successful program completion;20,21 however, more research is needed to be conclusive. Additionally, day reporting centers vary along important lines including eligibility criteria (e.g., parolees vs. probationers), program components, caseload, goals of treatment, requirements for completion, relationship to other treatment modalities, and participant pool, which limits the generalizability of research results.22,23
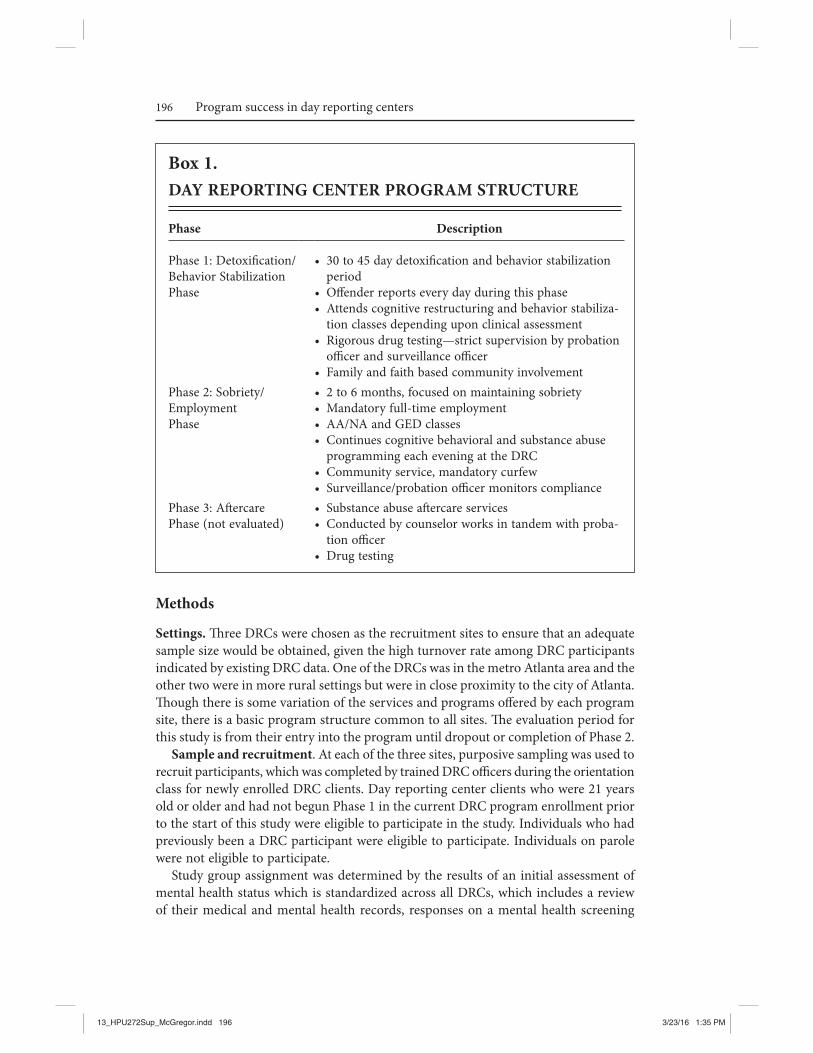
Georgia’s day reporting centers (DRCs) represent a collaborative with law enforce-ment, state agencies, non- profi ts and the faith- based community that is responsible for program components and hold clients accountable for the progress they make in each of three phases (Box 1). Th e Georgia Department of Corrections (GDC) operates 15 day reporting centers (DRCs) throughout the state. Each DRC institutes community- based, highly structured, non- residential sanctions for approximately 100 probation-ers sentenced by the Courts or for those who have not responded to more traditional supervision and treatment eff orts. Th ey provide intensive supervision and behavioral interventions as an alternative to incarceration for probationers with substance abuse
13_HPU272Sup_McGregor.indd 19413_HPU272Sup_McGregor.indd 194 3/23/16 1:35 PM3/23/16 1:35 PM

195McGregor, Brown, Yan, Mitchell, Robinson, DeGroot, and Braithwaite
and/or have co-morbid mental illness, who are failing to adhere to standard supervi-sion conditions. Th e program includes components such as substance abuse counseling, cognitive restructuring, adult basic education, employment enhancement, intensive supervision, and community service. Th ere are three phases of the DRC program. Phase 1 is the fi rst four to eight weeks of intense programming, Phase 2 is approximately two to six months and is generally when the off ender works and attends classes in the evening and Phase 3 is the aft ercare phase and lasts for six months. For participants who complete Phase 2, they are considered graduates of the DRC program and dur-ing the six months of aft ercare (Phase 3), they receive more traditional supervision.
Georgia Department of Corrections’ (GDC) protocol establishes that when a client is chronically non- adherent to DRC program requirements, they are referred to a more intensive treatment program, which is the last option before re- incarceration. Th ere is great interest and support among GDOC leadership to explore program strategies to improve treatment retention within the DRC, particularly among participants with co-occurring psychiatric illness. Georgia Department of Corrections operated one of the few DRC programs that enrolled individuals with co-occurring psychiatric illness, provided treatment groups, counselors and other resources for this population at the time of the study. Additionally, DRCs have become a popular community based alternative to incarceration and expansion of these services was well- received. Th us, GDC admin-istrators were particularly interested in the experiences and outcomes of individuals with co-occurring psychiatric illnesses. Furthermore, sentencing alternatives can also have a positive impact on state expenditures. It costs $10 to $15 a day to treat off enders participating in Georgia’s day reporting centers (DRCs), four to fi ve times less than what it costs to maintain them in prison. Finally, DRC programs are implemented in the community, where 85% of those incarcerated will eventually return; thus, they are learning to recover and manage their lives without drugs or alcohol within the social, community and occupational settings to which they belong.
Th e purpose of this evaluation was to compare and contrast indicators of program success and failure between off enders dually diagnosed with mental illness and substance abuse and those with a diagnosis of substance abuse only at three Georgia DRCs. Th is presents a unique opportunity to investigate and identify indicators of program suc-cess and program failure and use that knowledge to maintain and enhance program quality with the ultimate goal being to support successful community reentry and reduce recidivism. Increased understanding of client expectations as they matriculate through the program may provide DRC staff insight about how to address clients’ social, behavioral and cognitive process in diff erent phases of the program. Further, this evaluation seeks to inform policy decisions that determine what programs are available and funded to assist justice- involved men and women with mental illness and substance abuse in achieving success post- incarceration and beyond. Th e key goals of this evaluation were 1) to examine diff erences in program success between dually diagnosed participants and participants with substance abuse only diagnoses, and 2) to explore client indicators of program success among dually diagnosed participants and participants with only substance abuse diagnoses. Th e primary evaluation outcome of interest was program completion. See Box 1.
13_HPU272Sup_McGregor.indd 19513_HPU272Sup_McGregor.indd 195 3/23/16 1:35 PM3/23/16 1:35 PM
196 Program success in day reporting centers
Methods
Settings. Th ree DRCs were chosen as the recruitment sites to ensure that an adequate sample size would be obtained, given the high turnover rate among DRC participants indicated by existing DRC data. One of the DRCs was in the metro Atlanta area and the other two were in more rural settings but were in close proximity to the city of Atlanta. Th ough there is some variation of the services and programs off ered by each program site, there is a basic program structure common to all sites. Th e evaluation period for this study is from their entry into the program until dropout or completion of Phase 2.
Sample and recruitment. At each of the three sites, purposive sampling was used to recruit participants, which was completed by trained DRC offi cers during the orientation class for newly enrolled DRC clients. Day reporting center clients who were 21 years old or older and had not begun Phase 1 in the current DRC program enrollment prior to the start of this study were eligible to participate in the study. Individuals who had previously been a DRC participant were eligible to participate. Individuals on parole were not eligible to participate.
Study group assignment was determined by the results of an initial assessment of mental health status which is standardized across all DRCs, which includes a review of their medical and mental health records, responses on a mental health screening
Box 1.DAY REPORTING CENTER PROGRAM STRUCTURE
Phase Description
Phase 1: Detoxifi cation/ Behavior Stabilization Phase
• 30 to 45 day detoxifi cation and behavior stabilization period
• Off ender reports every day during this phase• Attends cognitive restructuring and behavior stabiliza-
tion classes depending upon clinical assessment• Rigorous drug testing—strict supervision by probation
offi cer and surveillance offi cer• Family and faith based community involvement
Phase 2: Sobriety/ EmploymentPhase
• 2 to 6 months, focused on maintaining sobriety• Mandatory full- time employment• AA/ NA and GED classes• Continues cognitive behavioral and substance abuse
programming each evening at the DRC• Community service, mandatory curfew• Surveillance/ probation offi cer monitors compliance
Phase 3: Aft ercare Phase (not evaluated)
• Substance abuse aft ercare services• Conducted by counselor works in tandem with proba-
tion offi cer• Drug testing
13_HPU272Sup_McGregor.indd 19613_HPU272Sup_McGregor.indd 196 3/23/16 1:35 PM3/23/16 1:35 PM

197McGregor, Brown, Yan, Mitchell, Robinson, DeGroot, and Braithwaite
form and mental health evaluation were reviewed to determine group assignment. Th e participants were categorized into two groups: 1) Substance Abuse Only (SAO): those with at least one substance related diagnosis with no other mental health diagnosis that is not substance related, and 2) Dually Diagnosed (DD): those with at least one substance related diagnosis at an additional mental illness that is not substance related. Day reporting center clients who have been clients at other GDC facilities have already received a full diagnostic assessment (DSM- IV- TR) and have a diagnosis in SCRIBE (GDC database) which is used to establish their eligibility in the DRC. Th ose who are newly referred to the DRC received a full diagnostic assessment from the local commu-nity service board. Individuals found to be actively psychotic are sent to a stabilization unit at an inpatient facility and are able to participate in the DRC program once they are stable and are eligible to participate in the study. Th ose with personality disorders are also eligible for the DRC program as long as that is not their primary diagnosis.
Data collection. Data for the study were collected between April 2012 and April 2013 by DRC staff , evaluation team and mental health program staff in GDC’s central offi ce. Participants completed a battery of self- administered surveys at three diff erent assessments periods: at baseline near the beginning of DRC program enrollment, at the end of Phase 1, and at the end of Phase 2, which marks program completion and begins the six month period of aft ercare. Day reporting center counselors and central offi ce staff gathered demographic information on all the participants including race, ethnicity, gender, educational background, employment status, referring charge, men-tal health status and program status. Th is information was obtained from SCRIBE, a warehouse of information of information about individuals supervised by GDC and serves as an enhanced case management tool for probation offi cers. Day reporting center counselors indicated on participant logs the dates when they completed Phases 1 and 2 and their discharge date, indicating an unsuccessful completion.
Measures. Information on participant program completion was obtained from program records. All participants completed each of the self- report surveys to assess changes self- effi cacy, perceived support, readiness to change drinking and drug use, recovery attitudes and program satisfaction from baseline to graduation. Self- effi cacy was measured using the General Self- Effi cacy Scale (GSES), a 10-item psychometric scale designed to assess optimistic self- beliefs to cope with a variety of diffi cult demands in life.24 Th e GSES assesses personal agency, i.e., the belief that one’s actions are responsible for successful outcomes. For each item, respondents use a four- point Likert scale that ranges from “not at all true” to “exactly true.” In samples from 23 nations, Cronbach’s alphas ranged from .76 to .90, with the majority in the high .80s.25 Perceived interpersonal support was measured using the 12-item version of the Interpersonal Support Evaluation Checklist (ISEL- 12) which measures functional support. Th e three subscales for this measure include appraisal support (e.g., availability of confi dant), belonging support (e.g., sense of companionship and support from a peer group) and tangible support (e.g., instrumental support for completing errands, housework). For each item, respondents use a four- point Likert scale that ranges from “defi nitely false” to “defi nitely true.” Th e ISEL has demonstrated reliability and validity across social support studies using a diverse participant pool.26,27 Retest reliability for the full measure has been reported as .87, and the retest reliability for the subscales ranges between .71– .87.26 Internal con-
13_HPU272Sup_McGregor.indd 19713_HPU272Sup_McGregor.indd 197 3/23/16 1:35 PM3/23/16 1:35 PM

198 Program success in day reporting centers
sistency reliability has been documented as ranging from .77– .86.26 Stage of readiness to change drinking and drug use behaviors was measured using the Stage of Change Readiness & Treatment Eagerness Scale (SOCRATES), a 19-item self- report measure developed to evaluate readiness- to- change among drinkers or drug users. Th ere are two separate forms, one for drinking and one for drug use.28 For each item, respondents use a fi ve- point Likert scale that ranges from “strongly disagree” to “strongly agree.” Th e factor structure of the SOCRATES was established with a sample of more than 1,600 outpatients; factor analysis has identifi ed three subscales: Recognition, Taking Steps, and Ambivalence. Th ese scales showed moderate reliability (alpha coeffi cients ranged from .60 to .85). In a second sample (n = 82), high internal consistencies (alphas = .87 to .96), and good temporal stability (two- day intraclass correlations ranged from .82 to .94) were reported.29 Th e DRC Program Satisfaction Measure was administered to assess participant program satisfaction. Th is is a 19-item measure of DRC program participant satisfaction with their experiences with the DRC. Th is survey was adapted from the Institutional Eff ectiveness Committee Sample Survey that was developed to identify areas of comes from that was developed to evaluate program satisfaction.30 Th e questions were adapted for this evaluation. Th is measure gathers demographic information and includes some open-ended questions for respondents to share their views on program experiences. Also included is an 11-item, seven- point Likert scale that asks respondents to rate their satisfaction with components of the program. Th ere is no available psychometric data on IEC- Survey from which the DRC Program Sat-isfaction Measure was adapted.
Th e Recovery Attitudes Questionnaire (RAQ- 7) was administered to assess beliefs about the concept of recovery from mental illness. Th e RAQ- 7 started with 21 items that were reduced through factor analyses to a fi nal scale of seven items.31,32 Factor analysis identifi ed two dimensions underlying the scale: 1) recovery is possible and needs faith and 2) recovery is diffi cult and diff ers among people. Psychometrically the measure was found to have good inter- item reliability (alpha = .84)31. Only the dually diagnosed group completed this survey.
Analysis. Descriptive statistics were used to characterize the sample. Paired samples t-tests were used to examine diff erences at baseline, end of Phase 1 and end of Phase 2 on multiple indicators of well- being within the two participant groups at each site. Independent samples t-tests were conducted to compare the DD group and SAO only group on the self- report measures at baseline, end of Phase 1 and end of Phase 2. Additionally, bivariate analyses were conducted to test the strength of the relation-ships between graduation status and demographic characteristics including gender, race, referring charge, mental health status, educational background and employment status. Some comparisons were not completed due to low cell sizes as turnover gener-ally increased from baseline to end of Phase 2, which is a common occurrence among drug treatment programs.
Results
Participant characteristics. A total of 272 participants were recruited from the three DRCs. Among the 272 recruited, 267 actively enrolled in the program evaluation,
13_HPU272Sup_McGregor.indd 19813_HPU272Sup_McGregor.indd 198 3/23/16 1:35 PM3/23/16 1:35 PM

199McGregor, Brown, Yan, Mitchell, Robinson, DeGroot, and Braithwaite
and a total of 258 participants that completed baseline measures (see Table 1). While recruitment data are not provided on each individual unsuccessful completion, the large majority were due to technical violations and participant absconding, while a small number acquired new charges. Th ere was considerable variation between sites on most participant characteristics. Th e majority of participants did not graduate at all sites, with DRC 2 having the lowest percentage (7%) of graduates among the 3 study sites. Approximately 69% of all participants were African Americans followed by Caucasians which represented close to 30% of the entire sample. At DRCs 1 and 2, the majority of participants were Black but slightly less than half were Black at DRC 2. Also, 57% of the participants at all 3 DRCs were in the SAO group; the general population at each of the DRCs in this study have larger percentages of SAO clients. Most participants were high school graduates or had not completed high school. Non- violent crime was
Table 1.SAMPLE CHARACTERISTICS BY PARTICIPANT GROUP FOR 3 DAY REPORTING CENTERS, 2015, N = 258 DAY REPORTING CENTER CLIENTS
Characteristic Total Sample
(n, %) DRC 1 (n, %)
DRC 2 (n, %)
DRC 3 (n, %)
Participant Group SAO Group DD Group
146 (57)112 (43)
44 (51)41 (49)
50 (57)37 (43)
52 (60)34 (40)
Race Black White Other
180 (69)77 (30)
1 (<1)
58 (68)26 (31)
1 (<1)
43 (49)44 (51)
79 (92)7 ()
Gender Male Female
195 (76)63 (24)
69 (81)16 (19)
53 (61)34 (39)
73 (85)13 (15)
Educational Background 11th Grade or less HS Graduate Some college or grad school
126 (51)103 (42)
29 (7)
45 (53)33 (39)
7 (8)
46 (53)32 (37)
9 (10)
35 (41)38 (44)
13(15)Employment Status (%) Employed Unemployed
119 (46)139 (54– )
33 (40)52 (60)
54 (63)33 (37)
32 (38)54 (62)
Referring Charge (%) Drugs and Alcohol Violent Crime Non- violent Crime
118 (46)37 (14)
103 (40)
33 (38)15 (18)37 (44)
54 (62)11 (12)22 (25)
31 (36)11 (13)44 (51)
Graduation Status (%) Complete Not Complete
40 (15)218 (85)
6 (7)79 (93)
14 (16)73 (84)
20 (23)66 (77)
13_HPU272Sup_McGregor.indd 19913_HPU272Sup_McGregor.indd 199 3/23/16 1:35 PM3/23/16 1:35 PM

200 Program success in day reporting centers
the referring charge for the highest percentage of people at DRC 1 and 3, while 23% of participants at DRC 2 were referred there on a drug and alcohol charge.
Bivariate analyses. Relationships between demographic characteristics and gradua-tion status were explored across all sites. Chi- square test results indicated that completers were signifi cantly more likely to be employed and non- completers were more likely to be unemployed, (p = .0001) and a gender eff ect was also found (p = .033) (Table 2). No other statistically signifi cant relationships between graduation status and demographic characteristics were found.
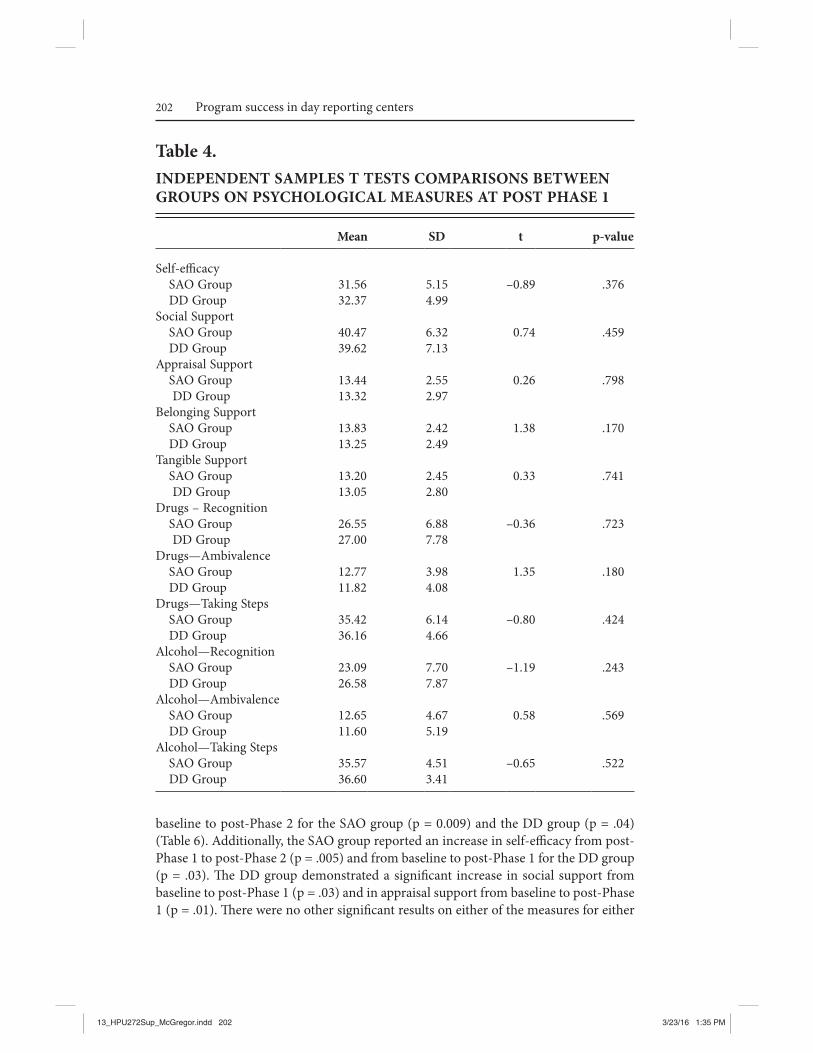
Psychological scales. A total of 258 participants provided data on self- effi cacy, social support, recovery, readiness to change drinking and drug use and program satisfac-tion. Independent samples t tests were utilized to assess diff erences between the SAO group and the DD group at baseline, post- Phase 1 and post- Phase 2 (Table 3– 5). Th e SAO group reported signifi cantly higher scores than DD at baseline on self- effi cacy, t = 2.46, (p = .005), social support t = 3.14, (p = .002), appraisal support, 2.54 (p = .012), belonging support, 3.15, (p = .002), and tangible support, 2.14, (p = .033). Th e DD
Table 2.CHI SQUARE TEST OF RELATIONSHIP BETWEEN GRADUATION STATUS AND DEMOGRAPHIC CHARACTERISTICS
Completers
(n=38)a Non- completers
(N=227)a p- value
Education 0.345 someHS/ less than HS 16 (42.11) 115 (50.66) HS graduate 16 (42.11) 92 (40.53) some College/ college grad 6 (15.79) 20 (8.81)Gender 0.033a
Male 24 (63.16) 180 (78.95) Female 14 (36.84) 48 (21.05)Mental health status 0.666 DD group 20 (52.63) 128 (56.39) SAO group 18 (69.05) 99 (43.61)Employment status 0.0001a
Employed 22 (57.89) 80 (35.24) Unemployed 16 (42.11) 147 (64.76)Race 0.585 Black 28 (73.68) 158 (69.30) white 10 (26.32) 70 (30.70)Referring charge 0.688 drug 20 (52.63) 109 (48.02) violent crime 6 (15.79) 30 (13.22) non- violent property crime 12 (31.58) 88 (38.77)
asome participants did not complete any psychological measures
13_HPU272Sup_McGregor.indd 20013_HPU272Sup_McGregor.indd 200 3/23/16 1:35 PM3/23/16 1:35 PM

201McGregor, Brown, Yan, Mitchell, Robinson, DeGroot, and Braithwaite
group participants who were identifi ed as having drug abuse or drug disorder indicated greater recognition that they had a drug problem than the SAO group, – 2.72, (p = .007). Th e SAO group reported signifi cantly higher self- effi cacy than the DD group at post- Phase 2, t = 2.23, (p = .032). No other signifi cant diff erences were found between the two groups on any of the measures at post- Phase 1 or post- Phase 2.
Paired sample t-tests demonstrated that for graduates, self- effi cacy improved from
Table 3.INDEPENDENT SAMPLES T TESTS COMPARISONS BETWEEN GROUPS ON PSYCHOLOGICAL MEASURES AT BASELINE
Mean SD t p- value
Self- effi cacy SAO Group DD GroupSocial Support SAO Group DD GroupAppraisal Support SAO Group DD GroupBelonging Support SAO Group DD GroupTangible Support SAO Group DD GroupDrugs—Recognition SAO Group DD GroupDrugs—Ambivalence SAO Group DD GroupDrugs—Taking Steps SAO Group DD GroupAlcohol—Recognition SAO Group DD GroupAlcohol—Ambivalence SAO Group DD GroupAlcohol—Taking Steps SAO Group DD Group
31.5629.89
39.9037.40
13.1012.23
13.8812.93
12.9212.24
25.3827.92
12.5813.09
34.8235.50
20.8922.34
11.4410.98
31.5231.76
4.594.72
6.086.71
2.562.91
2.282.58
2.452.68
7.587.07
3.834.09
5.205.03
8.829.44
4.544.64
8.058.80
2.46
3.14
2.54
3.15
2.14
– 2.72
– 1.02
– 1.05
– 0.90
0.56
– 0.16
.005*
.002*
.012*
.002*
.033*
.007*
.307
.296
.372
.576
.871
13_HPU272Sup_McGregor.indd 20113_HPU272Sup_McGregor.indd 201 3/23/16 1:35 PM3/23/16 1:35 PM
202 Program success in day reporting centers
baseline to post- Phase 2 for the SAO group (p = 0.009) and the DD group (p = .04) (Table 6). Additionally, the SAO group reported an increase in self- effi cacy from post- Phase 1 to post- Phase 2 (p = .005) and from baseline to post- Phase 1 for the DD group (p = .03). Th e DD group demonstrated a signifi cant increase in social support from baseline to post- Phase 1 (p = .03) and in appraisal support from baseline to post- Phase 1 (p = .01). Th ere were no other signifi cant results on either of the measures for either
Table 4.INDEPENDENT SAMPLES T TESTS COMPARISONS BETWEEN GROUPS ON PSYCHOLOGICAL MEASURES AT POST PHASE 1
Mean SD t p- value
Self- effi cacy SAO Group DD GroupSocial Support SAO Group DD GroupAppraisal Support SAO Group DD GroupBelonging Support SAO Group DD GroupTangible Support SAO Group DD GroupDrugs – Recognition SAO Group DD GroupDrugs—Ambivalence SAO Group DD GroupDrugs—Taking Steps SAO Group DD GroupAlcohol—Recognition SAO Group DD GroupAlcohol—Ambivalence SAO Group DD GroupAlcohol—Taking Steps SAO Group DD Group
31.5632.37
40.4739.62
13.4413.32
13.8313.25
13.2013.05
26.5527.00
12.7711.82
35.4236.16
23.0926.58
12.6511.60
35.5736.60
5.154.99
6.327.13
2.552.97
2.422.49
2.452.80
6.887.78
3.984.08
6.144.66
7.707.87
4.675.19
4.513.41
– 0.89
0.74
0.26
1.38
0.33
– 0.36
1.35
– 0.80
– 1.19
0.58
– 0.65
.376
.459
.798
.170
.741
.723
.180
.424
.243
.569
.522
13_HPU272Sup_McGregor.indd 20213_HPU272Sup_McGregor.indd 202 3/23/16 1:35 PM3/23/16 1:35 PM

203McGregor, Brown, Yan, Mitchell, Robinson, DeGroot, and Braithwaite
group. While the mean change from baseline to post- Phase 2 was an increase on all measures for the SAO group except for ambivalence about changing drug behaviors, they were not statistically signifi cant. Th e SAO group also reported a non- signifi cant decrease in program satisfaction from post- Phase 1 to post- Phase 2. A similar pat-tern was found among the DD group scores from baseline to post- Phase 2 except for recovery and program satisfaction.
Table 5.INDEPENDENT SAMPLES T TESTS COMPARISONS BETWEEN GROUPS ON PSYCHOLOGICAL MEASURES AT POST PHASE 2
Mean SD t p- value
Self- effi cacy SAO Group DD GroupSocial Support SAO Group DD GroupAppraisal Support SAO Group DD GroupBelonging Support SAO Group DD GroupTangible Support SAO Group DD GroupDrugs—Recognition SAO Group DD GroupDrugs—Ambivalence SAO Group DD GroupDrugs—Taking Steps SAO Group DD GroupAlcohol—Recognition SAO Group DD GroupAlcohol—Ambivalence SAO Group DD GroupAlcohol—Taking Steps SAO Group DD Group
35.2932.94
41.7240.67
14.0413.93
14.1313.53
13.5513.20
27.4129.27
12.4213.67
36.4837.47
25.7527.38
11.7511.25
34.5034.00
5.573.93
5.896.32
2.232.02
2.262.90
2.412.24
7.405.30
4.333.02
6.773.52
7.808.06
1.715.74
11.009.42
2.23
0.52
0.15
0.71
0.44
– 0.83
– 0.96
– 0.57
– 0.29
0.17
0.07
.032*
.604
.878
.482
.660
.413
.345
.572
.782
.873
.947
13_HPU272Sup_McGregor.indd 20313_HPU272Sup_McGregor.indd 203 3/23/16 1:35 PM3/23/16 1:35 PM

204 Program success in day reporting centers
Th ere were too few participants available to complete some analyses. T-tests were not conducted measuring changes from baseline to post- Phase 2 and post- Phase 1 to post- Phase 2 on the readiness to change drinking measures for both the DD and SAO groups.
Individual DRCs. A total of 85 participants at DRC 1 were included in the study, with 44 in the SAO group and 41 in the DD group. Th ere were only six participants who graduated from DRC 1 during the study: four in the SAO group and two in the DD group. DRC 1 had the lowest number of graduates among the three DRCs par-
Table 6.PAIRED SAMPLES T TESTS FOR THE DUALLY DIAGNOSED GROUP BETWEEN BASELINE AND POST PHASE 1, BASELINE AND POST PHASE 2, AND POST PHASE 1 AND POST PHASE 2 ON PSYCHOLOGICAL MEASURES
Baseline to
Post Phase 1 Baseline to
Post Phase 2 Post Phase 1 and
Post Phase 2
Self- effi cacy – 1.39 (4.51) p= 0.023*
– 2.34 (4.10)p=.044*
– 0.57 (5.43)p=.690
Social Support – 2.01(6.86)p=.030*
– 3.47 (6.97)p=.075
– 0.44 (6.58)p=.798
Appraisal Support – 0.97 (2.90)p=.271
– 1.53 (2.75)p=0.049
– 0.20 (2.57)p=0.768
Belonging Support – 0.32(2.17)p=.180
– 0.73 (3.47)p=.427
– 0.18 (2.97)p=.822
Tangible Support – 0.72(3.00)p=.071
– 1.20 (2.14)p=.048*
– 0.07 (2.40)p=.916
Alcohol—Recognition 3.00(5.27)p=.152
Alcohol—Ambivalence 2.75(4.13)p=.102
Alcohol—Taking Steps 0.63(4.24)p=.689
Drugs—Recognition 0.64(5.71)p=.418
– 0.01(3.19)p=.989
0.20 (1.90)p=.689
Drugs—Ambivalence 0.97(4.34)p=.111
0.80 (2.70)p=.271
– 0.33 (2.77)p=.648
Drugs—Taking Steps .23(5.05)p=.746
0.67(2.79)p=.371
– 0.07 (1.94)p=.896
Recovery – 0.17(5.04)p=.830
2.63 (6.23)p = .272
1.13 (1.89)p = .135
Program Satisfaction
2.00 (7.59)p=.325
13_HPU272Sup_McGregor.indd 20413_HPU272Sup_McGregor.indd 204 3/23/16 1:35 PM3/23/16 1:35 PM

205McGregor, Brown, Yan, Mitchell, Robinson, DeGroot, and Braithwaite
ticipating in this evaluation. A total of 87 participants at DRC 2 provided survey data, with 50 in the substance abuse only (SAO) group and 37 in the dual diagnosis (DD) group. Th ere were eight graduates from the SAO group and six graduates from the DD group for a total of 14 graduates. A total of 86 participants at DRC 3 provided survey data, with 52 in the substance abuse only (SAO) group and 34 in the dually diagnosed (DD) group. Th ere were 12 graduates from the SAO group and eight graduates from the DD group for a total of 20 graduates.
Table 7.PAIRED SAMPLES T TESTS FOR THE SUBSTANCE ABUSE ONLY GROUP BETWEEN BASELINE AND POST PHASE 1, BASELINE AND POST PHASE 2, AND POST PHASE 1 AND POST PHASE 2 ON PSYCHOLOGICAL MEASURES
Baseline to
Post Phase 1 Baseline to
Post Phase 2 Post Phase 1 and
Post Phase 2
Self- effi cacy 0.22 (5.04) p= 0.691
– 2.36 (3.81)p=.009*
– 3.04 (4.51) p=.023*
Social Support – 0.21(6.34)p=.761
– 1.80 (5.57)p=.145
– 1.80 (5.57)p=.798
Appraisal Support – 0.12 (2.63)p=.678
– 0.64 (2.34)p= 0.216
– 0.05 (2.46)p=0.932
Belonging Support 0.22 (2.69)p=.455
– 0.23 (2.02)p= 604
– 0.93 (2.28)p=.071
Tangible Support – 0.31(2.61)p=.278
– 0.93 (2.89)p=.145
– 0.66 (3.01) p=.315
Alcohol—Recognition – 2.42 (7.21)p=.161
Alcohol—Ambivalence – 1.16 (4.22)p=.247
Alcohol—Taking Steps – 1.95 (5.22)p=.122
Drugs—Recognition – 0.61 (6.39)p=.394
0.80 (4.86)p=.461
– 0.98 (4.86)p=.365
Drugs—Ambivalence 0.17 (4.15)p=.701
– 0.28 (4.21)p=.763
– 1.33 (5.13)p=.250
Drugs—Taking Steps 0.02(7.31)p=.978
0.43 (4.59)p=.673
.– 0.52 (4.83)p=.625
RecoveryProgram Satisfaction
4.79 (18.44)
p=.216
13_HPU272Sup_McGregor.indd 20513_HPU272Sup_McGregor.indd 205 3/23/16 1:35 PM3/23/16 1:35 PM

206 Program success in day reporting centers
Discussion
Th is survey study analysis of DRC participants reveals dynamics about the DRC pro-gram and experiences of participants. Th e investigators were able to analyze data on 258 individuals, equal to 85% of the target sample of 300 individuals. Th ese analyses revealed several interesting fi ndings that provide valuable insight and directions that future investigators may pursue.
Th ere was a low percentage of those who completed Phase 2 (15%), indicating pro-gram completion which is a similar fi nding found in the literature on drug treatment programs among individuals under community supervision. Additionally, individuals with co-occurring psychiatric illnesses graduated at a lower rate (15%) than individu-als with a substance abuse diagnosis only, which has been observed elsewhere.13 Th is suggests that individuals with co-occurring psychiatric disorders encounter more challenges with program completion. Within the Georgia Department of Corrections, there is a stepped- care approach to treatment such that more intensive programming is available, such as residential programming, for those individuals demonstrating a need for more intense services. However, while the number of individuals who completed the program with a co-occurring disorder was small, further investigation of their program experiences may help identify individual and program factors contributing to their success, which is important for appropriate service matching related to indi-vidual risk factors for recidivism.33 Th is would help to ensure that only those high risk individuals are treated in intensive programming, reducing the human resource and fi nancial burden on those systems.
Additionally, there were not signifi cant diff erences between the SAO and DD groups on most self- report measures at baseline, post- Phase 1 or post- Phase 2. For the comparisons where statistically signifi cant diff erences were found, most were not clinically signifi cant when considering the score range for each measure. Th ere was no hypothesis that predicted expected diff erences between the two group on the self- report measures; no strong evidence exists that those with substance abuse diagnoses only and those with substance abuse diagnoses plus an additional mental illness in treatment programs report diff erent levels of self- effi cacy, social support, and readiness to change at program entry or completion. Th ere were no diff erences in self- reported recovery across measurement points at either of the three sites. Average scores were similar between all three sites and indicated that respondents agreed that recovery is possible and requires faith, and that it is diffi cult and diff ers among people.
An interesting trend that occurred was the response patterns for both the SAO group and DD group on the SOCRATES, indicating low recognition and low ambiva-lence at baseline, post- Phase 1 and post- Phase 2. Th is suggests that DRC participants in study are unequivocal about not having drinking or drug use that they need to change. Further, the average scores on the taking steps subscales of both the drink-ing and drug measures for both the SAO and DD group were in the medium to high range, indicating that individuals were making positive changes in their drinking and drug use. Furthermore, in most cases self- effi cacy and social support scores indicated moderate levels of both for both groups. Some individuals may have resolved to (as it were) go through the motions, viewing that taking steps to make positive changes
13_HPU272Sup_McGregor.indd 20613_HPU272Sup_McGregor.indd 206 3/23/16 1:35 PM3/23/16 1:35 PM

207McGregor, Brown, Yan, Mitchell, Robinson, DeGroot, and Braithwaite
in substance use is necessary for program completion. Individuals at baseline, post- Phase 1 and even post- Phase 2 may be at higher risk for relapse if they maintain the belief that they do not have a substance use problem, although this may be mitigated if they maintain adequate self- effi cacy and social support (which was indicated in survey responses for all three sites for both groups). It should also be considered that some respondents were hesitant to admit a problem with drinking or drugs for fear of negative consequences. Th is hesitancy may be operating in spite of investigator eff orts to protect their privacy and confi dentiality, in part by explaining to them that their individual responses to survey questions would not be shared with DRC staff and it wouldn’t aff ect their standing in the program. Both groups indicated favorable views of the program based on their PSS responses.
Limitations. Th ere are several limitations of this study’s design and methodology that likely aff ected the application or interpretation of the results. Th ese limitations may place constraints on the utility of fi ndings and are thus presented below.
Length of study period. Th ough we were able to recruit and enroll a majority of individuals who were eligible to participate at orientation at all three sites, we were not able to achieve our target sample for each site within a 4 month time frame. Th is led to the decision to recruit individuals into the study until February 2013, two months prior to the scheduled end of the study period. Th erefore, some of these individuals have graduated within eight to 12 months, but this study was not able to collect data on these individuals past April 2013.
Th is decision was made as a response to several methodological challenges. Th e number of individuals enrolled in the study each month was lower than expected on some occasions. On several occasions, the participating DRCs chose to reschedule or cancel orientations in response to other program considerations, holidays and other reasons. Furthermore, some potential participants that completed informed consent procedures did not remain in the study long enough to gather any data. Finally, a key interest of the GDC was to compare graduation rates between substance abuse only participants and dually diagnosed participants. It was soon realized that signifi cant program attrition and program sanctions that resulted in program re- starts would decrease the number of study participants and extend the time it took for remaining DRC participants to graduate.
While this adjustment increased the study’s ability to recruit more individuals into the study, those who were recruited August 2012 or later were not followed beyond the April 2013 study period end date, but may have graduated within eight to 12 months of their start date. Th us, details of their DRC program experience are not documented beyond April 2013, which could not be extended due to resource con-straints. It is recommended that future investigations interested in graduation rates determine the study period based on available data regarding average program length for graduates. Th is would likely increase the number of study participants completing self- report measures, thereby increasing the statistical power and representativeness of the sample.
Self- report measures. A main purpose of administering the self- report measures of self- effi cacy, interpersonal support, readiness to change drinking and drug use, recovery from mental illness and program satisfaction was to determine if participants’ responses
13_HPU272Sup_McGregor.indd 20713_HPU272Sup_McGregor.indd 207 3/23/16 1:35 PM3/23/16 1:35 PM

208 Program success in day reporting centers
changed as they matriculated through the DRC program. While many of the questions on the self- report measures related to DRC program experiences, they were not designed to predict specifi c behavior change associated with the DRC program. Future studies should develop surveys and questionnaires that are more specifi c to DRC participants program behavioral goals that the program is designed to impact, as was done in the current study with the Program Satisfaction Scale (PSS). Doing this may have increased the likelihood that these changes would be captured in survey responses. Additionally, existing scales can be modifi ed to tap into specifi c behavior change. For example, the authors of the General Self- Effi cacy Scale (GSES) indicate that it is appropriate to add a few items to cover the particular content of the survey or intervention.
Study sample. While the investigators were able to recruit a majority of the partici-pants that were available at orientation, there may have been participant characteristics important to the outcomes of this analysis that was not accounted for during recruit-ment and group assignment. Th e investigators only controlled for primary diagnoses of mental illness and substance related disorders in determining group assignment. Information provided by DRC staff and personnel indicated that many participants coming into the program at orientation were sanctioned to the program as a community supervision condition, though some were not. Individuals came to the program from various criminal record backgrounds. Further, some individuals had been in the DRC program before prior to attending the orientation they were recruited and some were new to the program. It would have been a considerable challenge to achieving the desired sample size if the investigators pursued eff orts to recruit and screen for more unifor-mity between the groups as it may have resulted in more stringent eligibility criteria.
Recommendations. Th e fi ndings in this survey analysis provide important insight into the attitudes and behaviors of DRC program participants with substance abuse and other mental illnesses. Several recommendations are made based on the results of this analysis that can help guide future investigations interested in exploring the current fi ndings further with the goal of understanding how better to serve diff erent types of clients in the DRCs and similar court sanctioned drug treatment programs in graduating from the program and achieving sobriety. Future studies should explore opportunities to monitor and track DRC program participants who do not successfully complete the program, given the high rate of program attrition. Administration of self- report measures including self- effi cacy, social support, readiness to change should be included. Additionally, while those who graduate were more likely to have a job isn’t surprising due to obtaining employment is a major Phase 2 goal, exploring employ-ment characteristics such as job type, hours per work week, timing of obtaining the job would be useful to program staff given program policies about employment. An important goal of this eff ort would be to further clarify the distinctions between those who complete drug treatment programs and those who do not and those diff erences may serve as intervention targets that can be implemented in program components. It is recommended that studies include measures of self- effi cacy, social support, recovery and other subjective measures similar to those administered in the current pilot study. If this already occurs, analysis of this data should be conducted to determine correlates of program success (e.g., graduation). It is recommended that readiness to change drug and alcohol use at baseline, post- Phase 1 and post- Phase 2 is measured given
13_HPU272Sup_McGregor.indd 20813_HPU272Sup_McGregor.indd 208 3/23/16 1:35 PM3/23/16 1:35 PM

209McGregor, Brown, Yan, Mitchell, Robinson, DeGroot, and Braithwaite
literature fi ndings that treatment motivation is related to program retention.11 Assess-ment results can be factored in to intervention eff orts at the appropriate stage within appropriate program phases, including aft ercare components, which was not included in the current pilot project. Given the consistent fi nding that study participants did not recognize that they have drug and alcohol problems, research should explore the extent to which current program components address client beliefs and views about their use that may operate as barriers to program completion and mitigate relapse risk. Future investigations of DRC programs should incorporate a longer study period to develop a larger sample of program graduates to increase the representativeness of graduates sample to conduct comparisons and also to increase the statistical power of analyses. Th e study results highlight the need to include a research component to criminal justice policy reforms aimed at reducing recidivism, improving mental and medical health outcomes and improve community integration of justice- involved men and women. A lack of research in this area impedes the development of data- driven criminal justice and public health policies designed to achieve these important goals. Research fi ndings that consistently demonstrate the benefi ts of community- based sanctions that focus on treatment and rehabilitation instead of punishment will lead to policies that sup-port reduced recidivism and improved community health.11,34 Funding for research to develop the evidence base of solutions and eff orts to disseminate results would provide broader support for these initiatives. Th ese results also highlight the signifi cant needs that clients in the day reporting center program have. Court- mandated drug treatment programs may consider increasing staff mental health resources and personnel to improve their capacity to monitor and track outcomes and to reduce program attrition at clients are at the greatest risk for dropping out, including those with co-occurring psychiatric illnesses.
Acknowledgments
Th is study was supported as a sub- project of the Morehouse– Diversity Institutions on Drug Abuse Research Development Program (M- DIDARP) project (PI: Ronald Braith-waite, PhD) by a grant from the National Institutes of Drug Abuse’s (NIDA). (Grant: 3R24DA02157). Special acknowledgements to the Georgia Department of Corrections’ partners/ collaborators. Th e content is solely the responsibility of the authors and does not necessarily represent the offi cial views of NIDA or the NIH.
References 1. James D, Glaze L. Bureau of Justice special report mental health problems of prison
and jail inmates. Washington, DC: US Department of Justice, Offi ce of Justice Pro-grams, 2006.
2. Mumola C, Karberg J. Bureau of Justice Statistics special report. Drug use and depen-dence, state and federal prisoners, 2004. US Department of Justice; Offi ce of Justice Programs, 2007.
3. LaVigne N, Davies E, Palmer T, et al. Release planning for successful reentry: a guide for corrections, service providers, and community groups. Washington, DC: Urban Institute, Justice Policy Center, 2008.
13_HPU272Sup_McGregor.indd 20913_HPU272Sup_McGregor.indd 209 3/23/16 1:35 PM3/23/16 1:35 PM

210 Program success in day reporting centers
4. French MT, Zarkin GA, Hubbard RL, et al. Th e eff ects of time in drug abuse treat-ment and employment on posttreatment drug use and criminal activity. Am J Drug Alcohol Abuse. 1993;19(1):19– 33.http:// dx.doi .org/ 10.3109/ 00952999309002663PMid:8382448
5. Harris PM. Attrition revisited. Am J Evaluation. 1998;19:293– 305.http:// dx.doi .org/ 10.1177/ 109821409801900303http:// dx.doi .org/ 10.1016/ S1098-2140(99)80213-6
6. Ball SA, Carroll KM, Canning- Ball M, et al. Reasons for dropout from drug abuse treat-ment: symptoms, personality, and motivation. Addict Behav. 2006 Feb;31(2):320– 30. Epub 2005 Jun 17.http:// dx.doi .org/ 10.1016/ j.addbeh.2005.05.013PMid:15964152
7. Joe GW, Simpson DD, Broome KM. Eff ects of readiness for drug abuse treatment on client retention and assessment of process. Addiction. 1998 Aug;93(8):1177– 90.http:// dx.doi .org/ 10.1046/ j.1360-0443.1998.93811776.xhttp:// dx.doi .org/ 10.1080/ 09652149835008PMid:9813899
8. King AC, Canada SA. Client- related predictors of early treatment drop- out in a substance abuse clinic exclusively employing individual therapy. J Subst Abuse Treat. 2004 Apr;26(3):189– 95.http:// dx.doi .org/ 10.1016/ S0740-5472(03)00210-1
9. Magruder KM, Ouyang B, Miller S, et al. Retention of under- represented minorities in drug abuse treatment studies. Clin Trials. 2009 Jun;6(3):252– 60.http:// dx.doi .org/ 10.1177/ 1740774509105224PMid:19528134 PMCid:PMC3123893
10. UCLA Integrated Substance Abuse Programs, 2006. Evaluation of the Substance and Crime Prevention Act: report. Los Angeles, CA: UCLA Integrated Substance Abuse Programs, 2005.
11. Evans E, Li L, Hser Y. Client and program factors associated with dropout from court mandated drug treatment. Eval Program Plann. 2009 Aug;32(3):204– 12. Epub 2008 Dec 11.http:// dx.doi .org/ 10.1016/ j.evalprogplan.2008.12.003PMid:19150133 PMCid:PMC2703685
12. Perron BE, Bright CL. Th e infl uence of legal coercion on dropout from substance abuse treatment: results from a national survey. Drug Alcohol Depend. 2008 Jan 1;92(1– 3):123– 31. Epub 2007 Sep 14.http:// dx.doi .org/ 10.1016/ j.drugalcdep.2007.07.011PMid:17869030 PMCid:PMC2265782
13. Amodeo, M., Chassler, D., Oettinger, C., et al. Client retention in residential drug treatment for Latinos. Eval Program Plann. 2008 Feb;31(1):102– 12. Epub 2007 Jul 4.http:// dx.doi .org/ 10.1016/ j.evalprogplan.2007.05.008PMid:18222144
14. Claus RE, Kindleberger LR. Engaging substance abusers aft er centralized assess-ment: predictors of treatment entry and dropout. J Psychoactive Drugs. 2002 Jan- Mar;34(1):25– 31.http:// dx.doi .org/ 10.1080/ 02791072.2002.10399933PMid:12003110
13_HPU272Sup_McGregor.indd 21013_HPU272Sup_McGregor.indd 210 3/23/16 1:35 PM3/23/16 1:35 PM

211McGregor, Brown, Yan, Mitchell, Robinson, DeGroot, and Braithwaite
15. Greenfi eld SF, Brooks AJ, Gordon SM, et al. Substance abuse treatment entry, reten-tion, and outcome in women: a review of the literature. Drug Alcohol Depend. 2007 Jan 5;86(1):1– 21. Epub 2006 Jun 8.http:// dx.doi .org/ 10.1016/ j.drugalcdep.2006.05.012PMid:16759822 PMCid:PMC3532875
16. Zhang Z, Friedmann PD, Gerstein DR. Does retention matter? Treatment duration and improvement in drug use. Addiction. 2003 May;98(5):673– 84.http:// dx.doi .org/ 10.1046/ j.1360-0443.2003.00354.xPMid:12751985
17. Curtin EL. Day reporting centers, a promising alternative. IARCA Journal. 1990;(3):8.18. Boyle DJ, Ragusa L, Lanterman J, et al. An evaluation of day reporting centers for
parolees. Criminology Public Policy. 2011;12(1):119– 43.http:// dx.doi .org/ 10.1111/ 1745-9133.12010
19. Roy S, Grimes JN. Adult off enders in a day reporting center: a preliminary study. Federal Probation. 2002;66(1):44– 50.
20. Spence DH, Hass SM. Predictors of client success in day report centers: successful program completion and its relationship to recidivism. Charleston, WV: Criminal Justice Statistical Analysis Center, Division of Justice and Community Services, Department of Military Aff airs and Public Safety, 2014.
21. Kim D, Hee- Jong J, McCarty W. Risk assessment and classifi cation of day reporting center clients: an actuarial approach. Criminal Justice Behavior. 2008;35(6):792– 12.http:// dx.doi .org/ 10.1177/ 0093854808315067
22. Osternmann M. An analysis of New Jersey’s day reporting center and halfway back programs: embracing the rehabilitative ideal through evidence based practices. J Off ender Rehabilitation. 2009;48(2):139– 53.http:// dx.doi .org/ 10.1080/ 10509670802640958
23. Diggs DW, Pieper SL. Using day reporting centers as an alternative to jails. Federal Probation. 1994;58(1):9– 12.
24. Schwarzer R, Jerusalem M. Generalized Self- Effi cacy scale. In J. Weinman, S. Wright, & M. Johnston, Measures in health psychology: A user’s portfolio. Causal and control beliefs. Windsor, UK: 1995.PMCid:PMC1005530
25. Scholz U, Gutiérrez- Do- a B, Sud S, et al. Is perceived self- effi cacy a universal con-struct? Psychometric fi ndings from 25 countries. European Journal of Psychological Assessment. 2001;18(3):242– 51. Available at: http:// userpage.fu- berlin.de/ ~health/ self/ gse- 25countries_2002 .pdf.http:// dx.doi .org/ 10.1027// 1015-5759.18.3.242
26. Cohen S, Hoberman H. Positive events and social supports as buff ers of life change stress. J Applied Soc Psychol. 1983;13:99– 125.http:// dx.doi .org/ 10.1111/ j.1559-1816.1983.tb02325.x
27. Cohen S, Wills TA. Stress, social support, and the buff ering hypothesis. Psychological Bulletin. 1985;98(2):310– 57.http:// dx.doi .org/ 10.1037/ 0033-2909.98.2.310PMid:3901065
28. Prochaska JO, DiClemente CC, Norcross J. In search of how people change: applica-tions to addictive behaviors. Am Psychol. 1992 Sep;47(9):1102– 14.http:// dx.doi .org/ 10.1037/ 0003-066X.47.9.1102PMid:1329589
13_HPU272Sup_McGregor.indd 21113_HPU272Sup_McGregor.indd 211 3/23/16 1:35 PM3/23/16 1:35 PM
212 Program success in day reporting centers
29. Miller WR, Tonigan JS. Assessing drinkers’ motivation for change: Th e Stages of Change Readiness and Treatment Eagerness Scale (SOCRATES). Psychol Addict Behav. 1996;10:81– 9.http:// dx.doi .org/ 10.1037/ 0893-164X.10.2.81
30. Willett T. IEC Sample survey questions for assessing program satisfaction. Gilroy, CA: Gavilan College Institutional Research Offi ce, 2003.
31. Borkin JR, Steff en JJ, Ensfi eld LB, et al. Recovery Attitudes Questionnaire: develop-ment and evaluation. Psychiatric Rehabilitation Journal. 2000;(24)95– 102.http:// dx.doi .org/ 10.1037/ h0095112
32. Steff en JJ, Borkin JR, Krzton K, et al. Consumer, family member, mental health pro-fessional, and student versions of the Recovery Attitudes Questionnaire. Manuscript in preparation, 1998.
33. Chen S, Barnett PG, Sempel JM, et al. Outcomes and costs of matching the intensity of dual- diagnosis treatment to patients’ symptom severity. J Subst Abuse Treat. 2006 Jul;31(1):95– 105.http:// dx.doi .org/ 10.1016/ j.jsat.2006.03.015PMid:16814015
34. Boutwell AE, Freedman J. Coverage expansion and the criminal justice- involved population: implications for plans and service connectivity. Health Aff (Millwood). 2014 Mar;33(3):482– 6.http:// dx.doi .org/ 10.1377/ hlthaff .2013.1131PMid:24590949
13_HPU272Sup_McGregor.indd 21213_HPU272Sup_McGregor.indd 212 3/23/16 1:35 PM3/23/16 1:35 PM