Program expenditure classification - Cristina CLASARA, Philippines
17
-
Upload
oecd-governance -
Category
Government & Nonprofit
-
view
21 -
download
0
Transcript of Program expenditure classification - Cristina CLASARA, Philippines

Program Expenditure Classification (PREXC) Restructuring an agency’s
budget by grouping all recurring activities and projects under the Program they contribute to
Understanding a Program’s Objective and providing performance indicators (outputs and outcomes) for each
Presenter
Presentation Notes
The Program Expenditure Classification (PREXC) approach is a 2-step process: (1) restructuring an agency’s budget by aligning all recurring activities and projects under programs; and (2) providing performance indicators (outputs and outcomes) for every program. PREXC is a refinement of the PIB. An MFO has become a general grouping of various outputs produced through different programs of an agency. In both the 2014 and the 2015 GAA, the performance indicators of the MFOs of many agencies do not capture the whole range and variety of the programs being delivered. We needed to get more performance information at a lower level in order to better understand how well an agency is operating. According to the OPIF, Programs are the level lower than the MFOs.
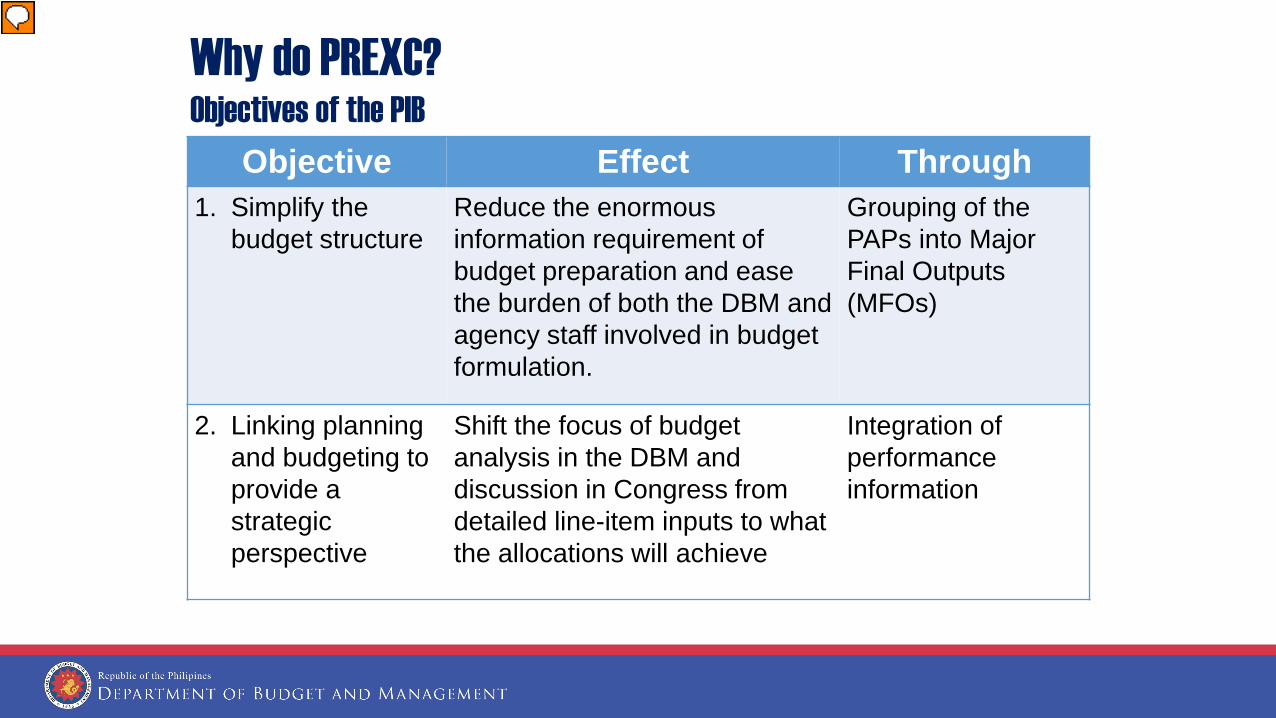
Objective Effect Through 1. Simplify the
budget structure Reduce the enormous information requirement of budget preparation and ease the burden of both the DBM and agency staff involved in budget formulation.
Grouping of the PAPs into Major Final Outputs (MFOs)
2. Linking planning and budgeting to provide a strategic perspective
Shift the focus of budget analysis in the DBM and discussion in Congress from detailed line-item inputs to what the allocations will achieve
Integration of performance information
Why do PREXC? Objectives of the PIB
Presenter
Presentation Notes
Now let us see why we need to do PREXC. The slide shows the objectives of PIB. First it wants to simplify the budget structure. Prior to PREXC, this is done by grouping the PAPs into MFOs or Major Final Outputs. This reduces the enormous information requirement of budget preparation and eases the burden of both DBM and agency staff involved in budget formulation. Second, PIB links planning and budgeting to provide a strategic perspective by integrating performance information. This intends to shift the focus of budget analysis both in DBM and in Congress from detailed line-item inputs to what the allocations will achieve.
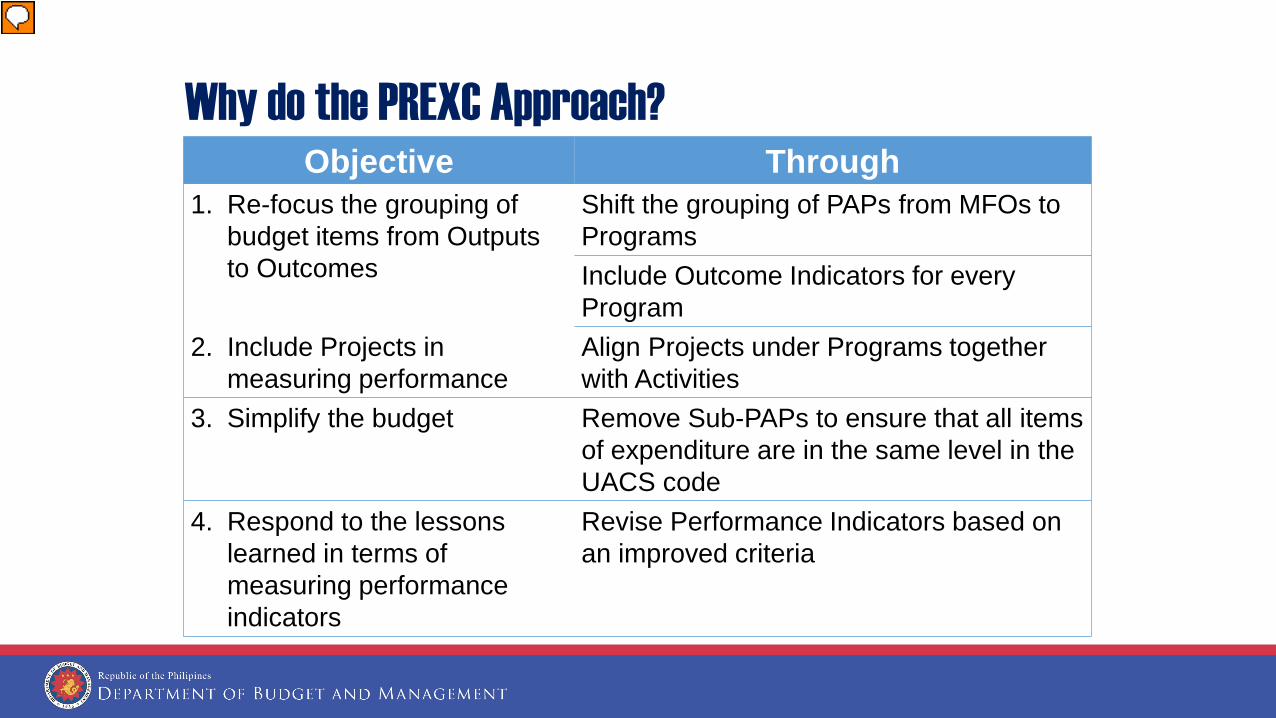
Objective Through 1. Re-focus the grouping of
budget items from Outputs to Outcomes
Shift the grouping of PAPs from MFOs to Programs Include Outcome Indicators for every Program
2. Include Projects in measuring performance
Align Projects under Programs together with Activities
3. Simplify the budget Remove Sub-PAPs to ensure that all items of expenditure are in the same level in the UACS code
4. Respond to the lessons learned in terms of measuring performance indicators
Revise Performance Indicators based on an improved criteria
Why do the PREXC Approach?
Presenter
Presentation Notes
The objectives of PREXC are as follows: Refocus the grouping of budget items from outputs to outcomes. This is by shifting the grouping of PAPs from MFOs to Programs and including outcome indicators for every program. Include projects in measuring performance by aligning the projects (LFPs and FAPs) together with the activities under programs. Simplify the budget by removing sub-PAPs to ensure that all items of expenditure are in the same level in the UACS code. Respond to lessons learned in measuring performance indicators by revising the PIs based on improved criteria which include checking against the PDP-RM and the Sustainable Development Goals (SDGs) indicators.
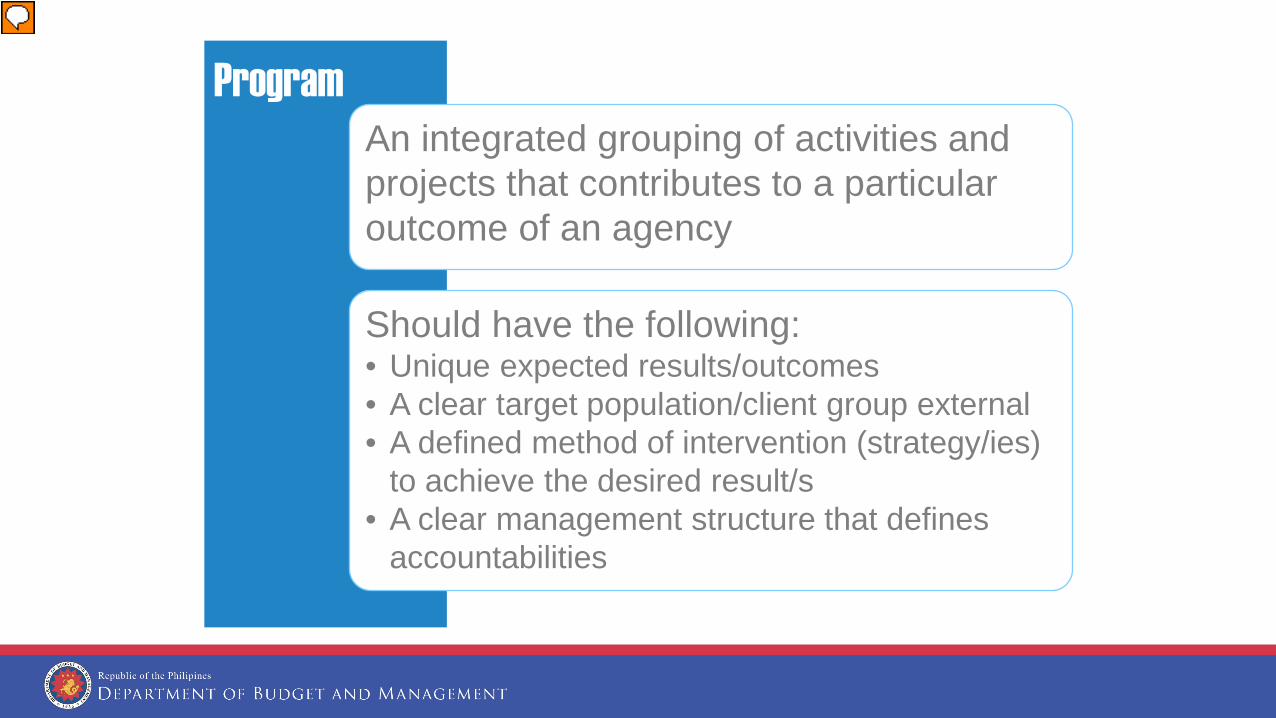
Program An integrated grouping of activities and projects that contributes to a particular outcome of an agency
Should have the following: • Unique expected results/outcomes • A clear target population/client group external • A defined method of intervention (strategy/ies)
to achieve the desired result/s • A clear management structure that defines
accountabilities
Presenter
Presentation Notes
A Program should have at least one activity or project in it. Activity - a recurring work process that contributes to the implementation of a program or sub-program Project - a special undertaking carried out within a definite time frame and intended to result in some pre-determined measure of goods and services A Program’s appropriation is the total of the appropriations of the activities and projects in it

Presenter
Presentation Notes
A program with either a more specific method of intervention or more defined target clients that is contained within a bigger program of an agency Applicable when: - Program is too big - Program provides service to different groups of the same beneficiary type - There are different forms of interventions within the Program
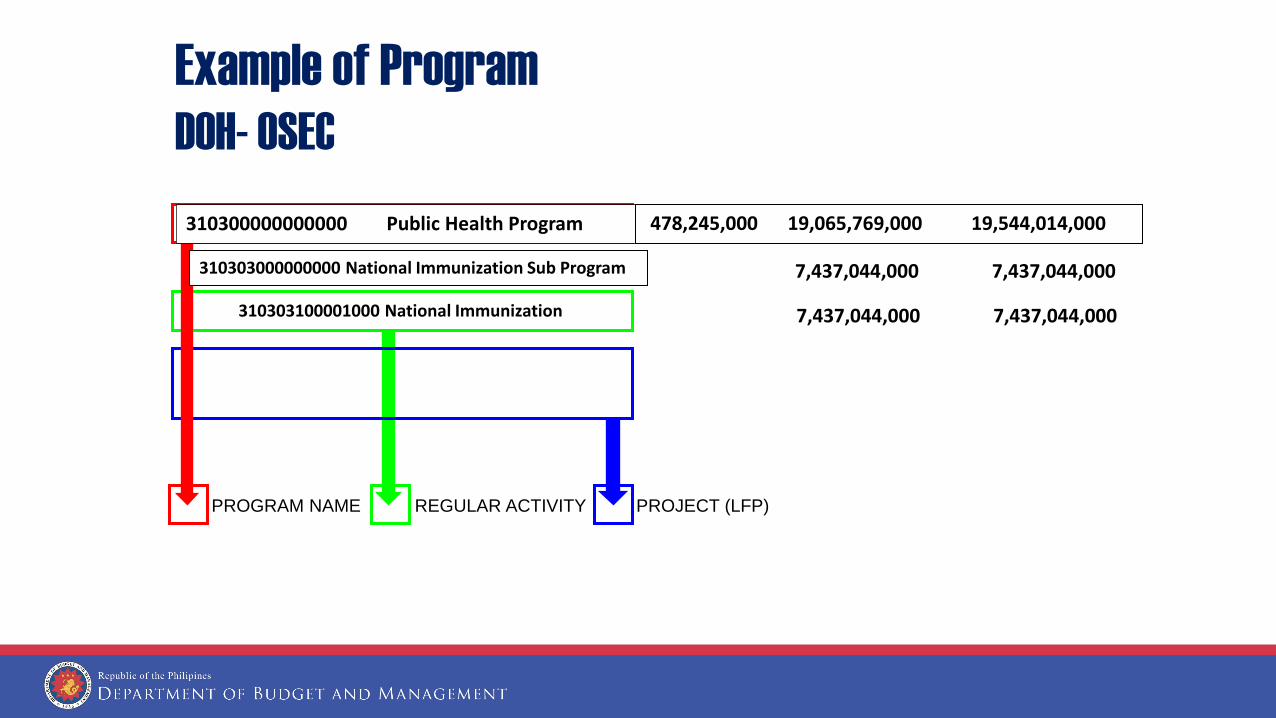
PROGRAM NAME REGULAR ACTIVITY PROJECT (LFP)
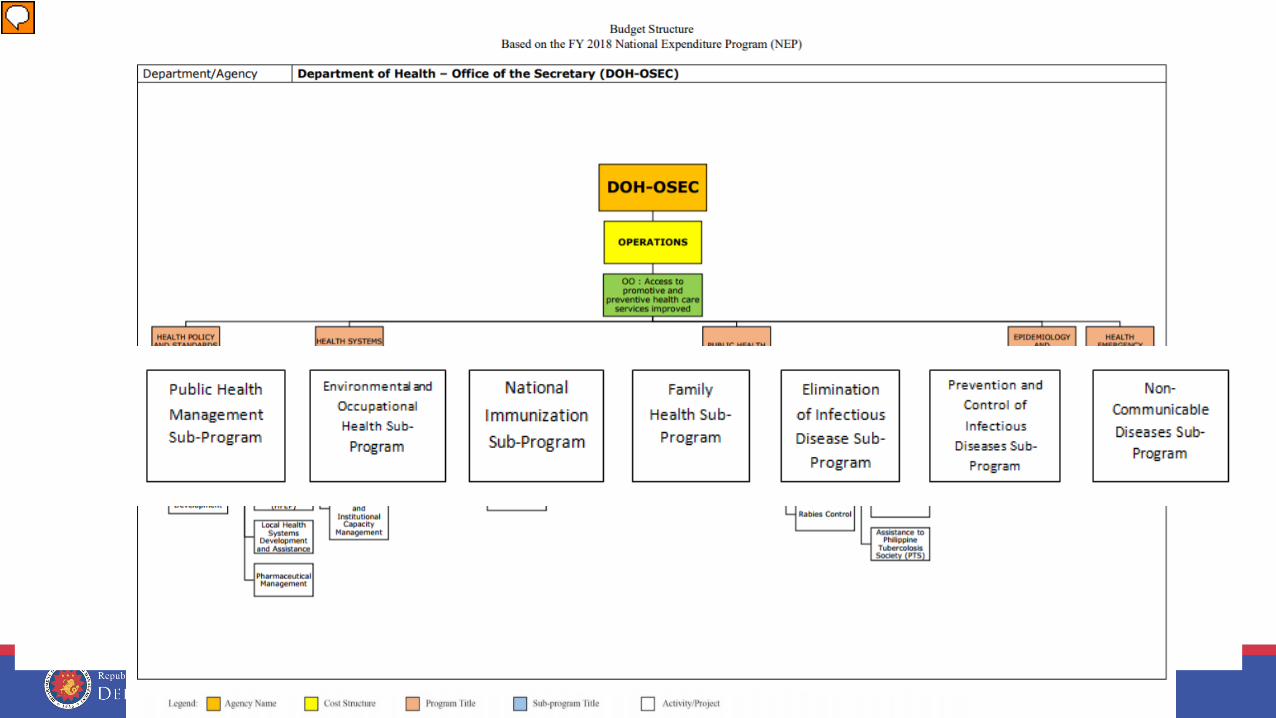
Example of Program DOH- OSEC
310300000000000 Public Health Program 478,245,000 19,065,769,000 19,544,014,000
310303000000000 National Immunization Sub Program 7,437,044,000 7,437,044,000
310303100001000 National Immunization 7,437,044,000 7,437,044,000
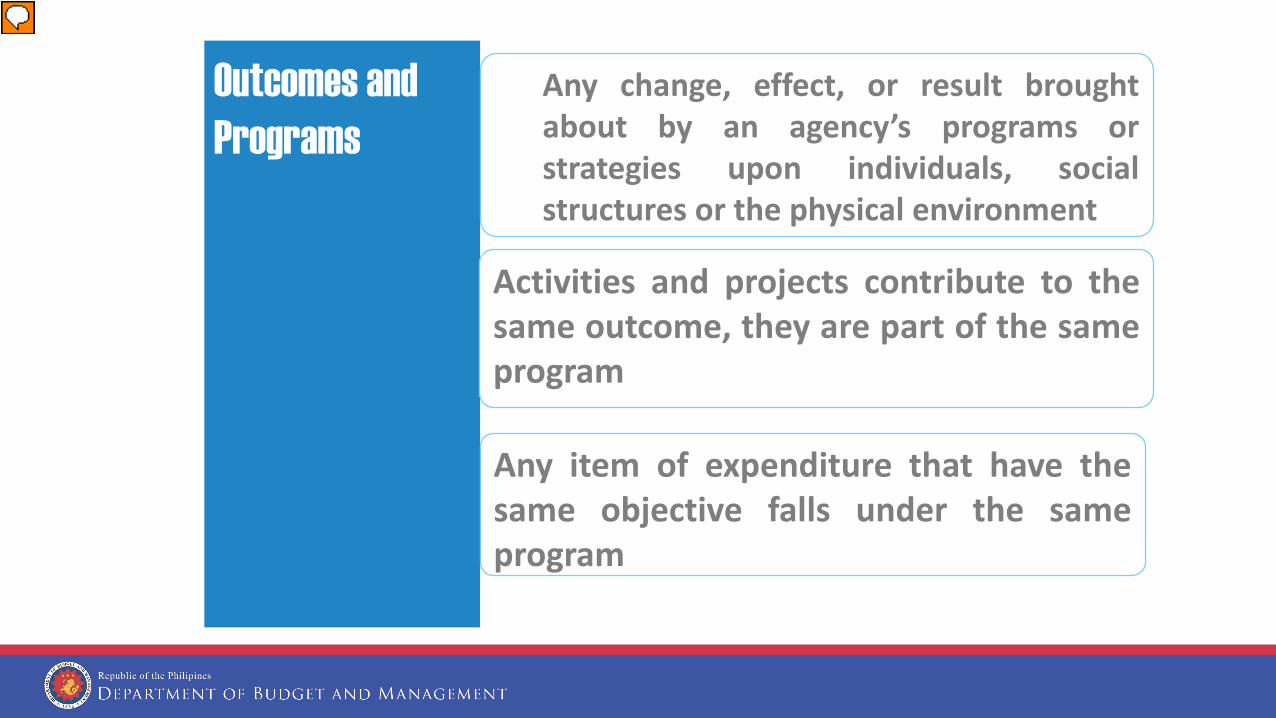
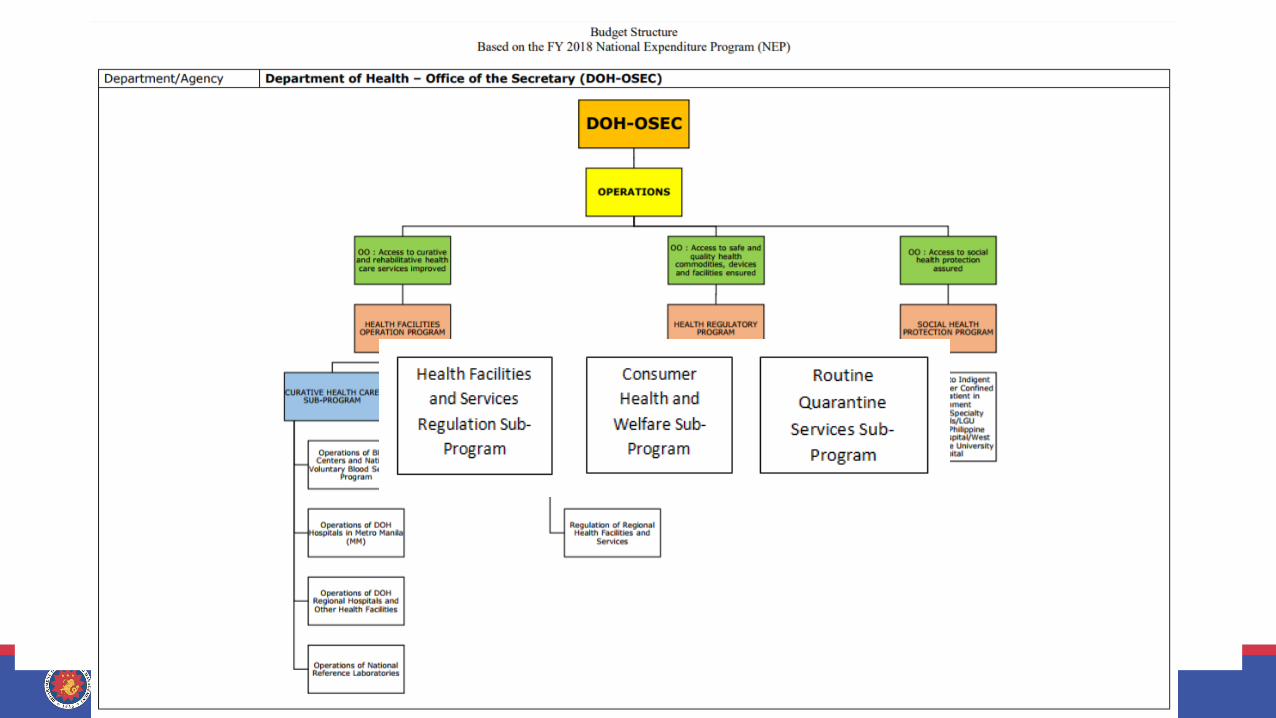
Outcomes and Programs
Activities and projects contribute to the same outcome, they are part of the same program
Any item of expenditure that have the same objective falls under the same program
Any change, effect, or result brought about by an agency’s programs or strategies upon individuals, social structures or the physical environment
Presenter
Presentation Notes
As long as the activities and projects contribute to the same outcome, they are part of the same program. The items of expenditure that have the same objective fall under the same program.

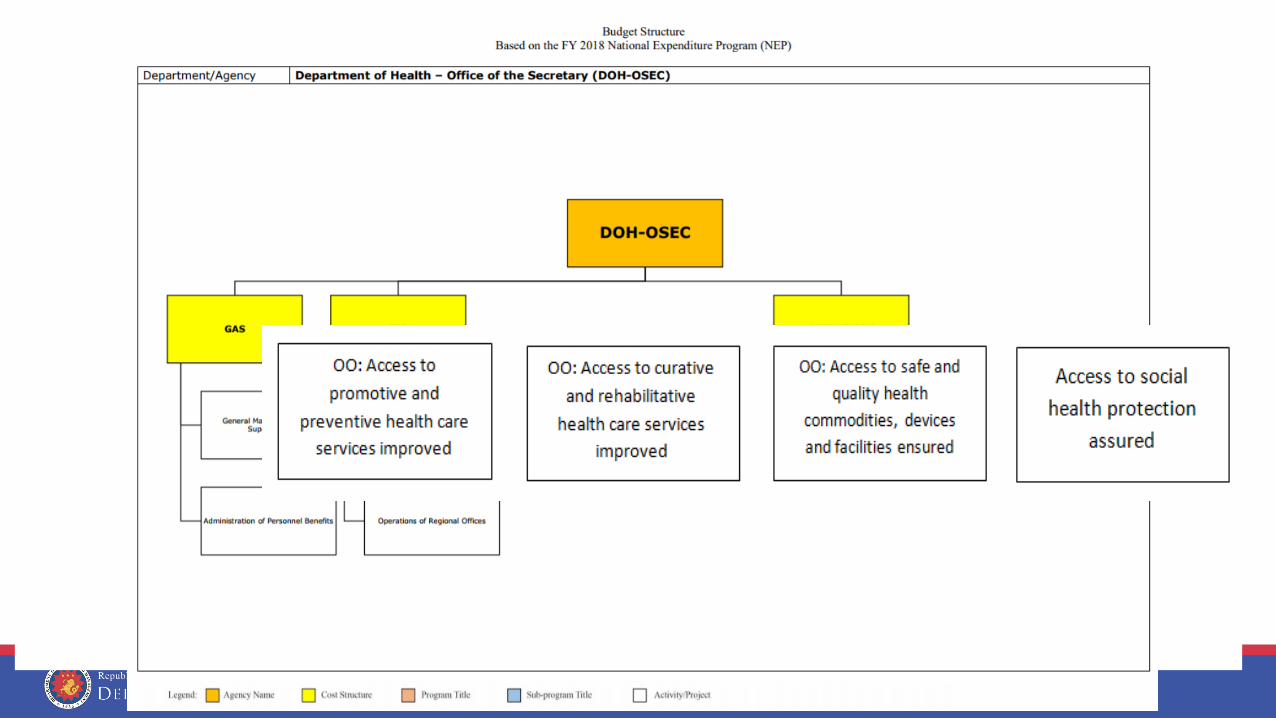
DOH OSEC
GAS
General Management and
Supervision
Administration of Personnel Benefits
SUPPORT TO OPERATIONS
Health information
systems and technology dev’t
Support to regional delivery
to services
OPERATIONS
MFO 1: Health Sector Policy
Services
Formulation and development of National Health
Policies and Plans including
essential National Health Research
Dev’t of policies, support
mechanisms and collaboration for
int’l health cooperation
Health system dev’t program
including policy support
Formulation of policies,
standards and plans for
hospitals and other health
facilities
Nat’l Pharmaceutical Policy Dev’t including provision of drugs and
medicines , medical and dental supplies to make affordable quality drugs
available
Public health dev’t program Health policy
development
MFO 2: Technical Support Services
Health Human Resource
Development
Health Human Resource
Development
HHR Policy Dev’t and Planning for LGU and
regional support
Implementation of the Doctors to the Barrios
and RH Practice Program
Local health systems dev’t
and assistance Health care assistance
Assistance to private sector health centers
Disease prevention and
control
Epidiomology and disease surveillance
Elimination of disease as public
threat
Rabies control EPI
TB control Other infectious diseases
Environmental and occupational
health
Non-communicable
diseases
Family health and responsible parenthood
Operation of PMAC secretariat Health promotion
Health emergency
management HFEP
Barangay Health Stations
Rural Health Units
Public/LGU Hospitals
Special Hospitals
Operation of Regional Medical
Centers Operation of
Dangerous Drug Abuse Treatment
and Rehab Centers
Other Health Care Facilities
MFO 3: Hospital Services
National voluntary blood
services program and operation of
blood centers
Operation of special hospitals
Operation of regional medical
centers
Operation of drug abuse treatment
and rehab centers
MFO 4: Health Sector Regulation
Services
Implementation of health
regulations
Regulation of health facilities and services
Regulation of devices and
radiation health
Regulation of food and drugs
Operations of satellite
laboratories
Quarantine services
Regional health regulations
Access to preventive primary health care services improved
Access to quality hospital services improved
Safe and quality health commodities, health devices, health facilities and food
ensured
Department of Health - Office of the Secretary
Legend: Agency Name Cost Structure Organizational Outcome
MFO Activity/Project
Based on 2017 GAA
Presenter
Presentation Notes
Example: Organization Outcomes/Performance Indicators Access to promotive and preventive health care services improved Performance Indicators and Targets Percentage of children fully immunized (with BCG, OVP3, DPV3, HepaB, measles vaccines) before 12 months of age increased – Targets 95% Percentage of birth delivered in health facilities increased (RHUs, birthing homes, district and provincial hospitals, DOH hospitals and private hospitals) –Targets 85% Treatment success rate of Tuberculosis increased – Targets 95% MFO 2: Technical Support Services (Disease Prevention) Performance Indicators and 2017 Targets Number of commodities and services to LGUs: Vaccination, Doctors Hours, Nurses and Midwives – Targets 2,828,493,944 % of stakeholders who rate the commodity supply/service good or better – Targets 89% % of requests for commodities and human resource services met in full within 48 hours – Targets 90%
Presenter
Presentation Notes
Example: Organization Outcomes (OOs) Access to promotive and preventive health care services improved Public Health Program Output Indicators and Targets 1. Percentage of external clients who rated the technical assistance provided as satisfactory or better – Targets 85% 2. Percentage of fully immunized children – Targets 95% 3. Modern contraceptive prevalence rate – Targets 32.50% 4. Number of malaria-free provinces – Targets (Additional 13 provinces (cumulative: 45 provinces) 5. Number of filariasis-free provinces – Targets (Additional 6 provinces (cumulative: 41 provinces) 6. Number of rabies-free areas – Targets (Additional 6 provinces (cumulative: 47 areas) 7. Percentage of Anti-Retroviral Treatment (ART) eligible people living with HIV on ART – Targets 90% 8. Treatment success rate for all forms of Tuberculosis – Targets 90% 9. Premature mortality rate attributed to cardiovascular disease, cancer diabetes, and chronic respiratory diseases – Targets No annual target Output Indicators 1. Percentage of LGUs and other health partners provided with technical assistance on public health programs – Targets 80% 2. Average percentage of LGUs provided with at least 80% of commodities – Targets 80%

Example: Difference between old PIB (2017) vs PRECX Structure (2018)
OLD PIB (FY 2017)
Organization Outcomes/Performance Indicators
Access to promotive and preventive health care services improved
Percentage of children fully immunized (with BCG, OVP3, DPV3, HepaB, measles vaccines) before 12 months of age increased
95%
Percentage of birth delivered in health facilities increased (RHUs, birthing homes, district and provincial hospitals, DOH hospitals and private hospitals)
85%
Treatment success rate of Tuberculosis increased 95%

Example: Difference between old PIB (2017) vs PRECX Structure (2018)-cont.
MFO 2: Technical Support Services (Disease Prevention) Performance Indicators 2017 Targets
Number of commodities and services to LGUs: Vaccination, Doctors Hours, Nurses and Midwives
2,828,493,944
% of stakeholders who rate the commodity supply/service good or better
89%
% of requests for commodities and human resource services met in full within 48 hours
90%
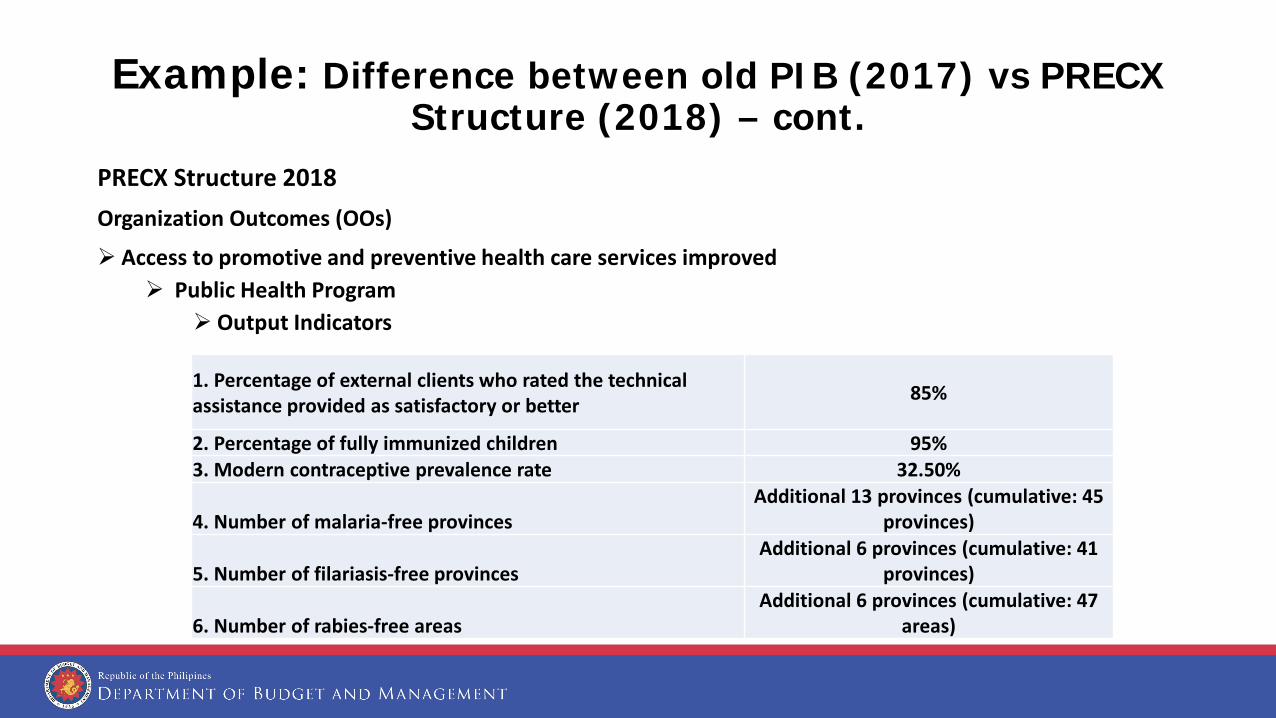
Example: Difference between old PIB (2017) vs PRECX Structure (2018) – cont.
PRECX Structure 2018 Organization Outcomes (OOs)
Access to promotive and preventive health care services improved Public Health Program
Output Indicators 1. Percentage of external clients who rated the technical assistance provided as satisfactory or better
85%
2. Percentage of fully immunized children 95% 3. Modern contraceptive prevalence rate 32.50%
4. Number of malaria-free provinces Additional 13 provinces (cumulative: 45
provinces)
5. Number of filariasis-free provinces Additional 6 provinces (cumulative: 41
provinces)
6. Number of rabies-free areas Additional 6 provinces (cumulative: 47
areas)

Example: Difference between old PIB (2017) vs PRECX Structure (2018)-cont.
7. Percentage of Anti-Retroviral Treatment (ART) eligible people living with HIV on ART 90%
8. Treatment success rate for all forms of Tuberculosis 90% 9. Premature mortality rate attributed to cardiovascular disease, cancer diabetes, and chronic respiratory diseases No annual target
Output Indicators 1. Percentage of LGUs and other health partners provided with technical assistance on public health programs 80% 2. Average percentage of LGUs provided with at least 80% of commodities 80%


![Country Chapter - Regional developmentNov 2017] Philippines.pdf · This country chapter for the Philippines was prepared as an ... Prof. Vella Atienza. ... Delia Cristina Valdez (NSWMC);](https://static.fdocuments.in/doc/165x107/5aea85567f8b9a36698d2424/country-chapter-regional-nov-2017-philippinespdfthis-country-chapter-for-the.jpg)