Program Appraisal Document - World Bankdocuments.worldbank.org/curated/en/...program appraisal...
71
Report No. 121282‐JO DOCUMENT OF THE WORLD BANK FOR OFFICIAL USE ONLY INTERNATIONAL BANK FOR RECONSTRUCTION AND DEVELOPMENT PROGRAM APPRAISAL DOCUMENT ON A PROPOSED LOAN IN THE AMOUNT OF US$200 MILLION (INCLUDING AN IBRD LOAN AND SUPPORT FROM THE GLOBAL CONCESSIONAL FINANCING FACILITY) TO THE HASHEMITE KINGDOM OF JORDAN FOR AN EDUCATION REFORM SUPPORT PROGRAM‐FOR‐RESULTS Education Global Practice Middle East And North Africa Region This document has a restricted distribution and may be used by recipients only in the performance of their official duties. Its contents may not otherwise be disclosed without World Bank authorization. Public Disclosure Authorized Public Disclosure Authorized Public Disclosure Authorized Public Disclosure Authorized
Transcript of Program Appraisal Document - World Bankdocuments.worldbank.org/curated/en/...program appraisal...

Report No. 121282‐JO DOCUMENT OF
THE WORLD BANK
FOR OFFICIAL USE ONLY
INTERNATIONAL BANK FOR RECONSTRUCTION AND DEVELOPMENT
PROGRAM APPRAISAL DOCUMENT
ON A
PROPOSED LOAN
IN THE AMOUNT OF US$200 MILLION (INCLUDING AN IBRD LOAN AND SUPPORT FROM THE GLOBAL CONCESSIONAL FINANCING
FACILITY)
TO THE
HASHEMITE KINGDOM OF JORDAN
FOR AN
EDUCATION REFORM SUPPORT PROGRAM‐FOR‐RESULTS
Education Global Practice Middle East And North Africa Region
This document has a restricted distribution and may be used by recipients only in the performance of their official duties. Its contents may not otherwise be disclosed without World Bank authorization.
Pub
lic D
iscl
osur
e A
utho
rized
Pub
lic D
iscl
osur
e A
utho
rized
Pub
lic D
iscl
osur
e A
utho
rized
Pub
lic D
iscl
osur
e A
utho
rized

CURRENCY EQUIVALENTS (As of October 31, 2017)
Unit of Currency = Jordanian Dinar (JOD) US$1 = JOD 0.709
ABBREVIATIONS AND ACRONYMS
AB Audit Bureau CBJ Central Bank of Jordan CPF Country Partnership Framework DA Designated Account DCU Development Coordination Unit DFID Department for International Development DLI Disbursement‐Linked Indicator DLR Disbursement‐Linked Result DOS Department of Statistics ECE ERfKE
Early Childhood Education Education Reform for Knowledge Economy
EGMA Early Grade Math Assessment EGRA Early Grade Reading Assessment EMIS Education Management Information System ETC Education Training Center EU European Union FS Fiduciary System Assessment GCFF Global Concessional Financing Facility GIS Geographical Information System GOJ Government of Jordan GPSC General Policy Steering Committee HDI Human Development Index IMF International Monetary Fund IPF Investment Project Financing IUFR Interim Unaudited Financial Report IVA Independent Verification Agency JEGP Jordan Economic Growth Plan KfW Kreditanstalt für Wiederaufbau (German Development Cooperation) KG KPIs
Kindergarten Key Performance Indicators
M&E Monitoring and Evaluation MOE Ministry of Education MOF Ministry of Finance MOHESR Ministry of Higher Education and Scientific Research MOPIC Ministry of Planning and International Cooperation NAFKE National Assessment for Knowledge Economy

NCHRD National Center for Human Resources Development NESP National Education Sector Plan NHRDS National Human Resources Development Strategy NTEAF National Teacher Evaluation and Appraisal Framework NTPSF National Teacher Policy and Strategic Framework OECD Organization for Economic Cooperation and Development OM Operational Manual PFM Public Finance Management PforR Program‐for‐Results PISA QRC
Program for International Student Assessment Queen Rania Center
RF Results Framework STEP Systematic Tracking and Exchanges in Procurement TA Technical Assistance TIMSS Trends in Mathematics and Science Study TVET Technical and Vocational Education and Training UNESCO United Nations Educational Scientific and Cultural Organization UNHCR United Nations High Commissioner for Refugees UNICEF USAID
United Nations International Children’s Emergency Fund United States Agency for International Development
VLD Voluntary Land Donation
Regional Vice President: Global Practice Senior Director:
Hafez Ghanem Jaime Saavedra Chanduvi
Country Director: Saroj Kumar Jha Practice Manager: Safaa El Tayeb El‐Kogali
Task Team Leader(s): Karine Pezzani, Juan Manuel Moreno Olmedilla


i
HASHEMITE KINGDOM OF JORDAN Education Reform Support Program‐for‐Results
Table of Contents
I. STRATEGIC CONTEXT .................................................................................................................... 1
A. COUNTRY CONTEXT ............................................................................................................................... 1 B. SECTORAL AND INSTITUTIONAL CONTEXT ................................................................................................... 2 C. RELATIONSHIP TO THE COUNTRY PARTNERSHIP FRAMEWORK AND RATIONALE FOR USE OF INSTRUMENT ............ 7
II. PROGRAM DESCRIPTION .............................................................................................................. 8
A. GOVERNMENT PROGRAM ........................................................................................................................ 8 B. PROGRAM DEVELOPMENT OBJECTIVES (PDO) AND KEY RESULTS .................................................................. 9 C. PFORR PROGRAM SCOPE ........................................................................................................................ 9 D. DISBURSEMENT‐LINKED INDICATORS AND VERIFICATION PROTOCOLS ........................................................... 13 E. CAPACITY BUILDING AND INSTITUTIONAL STRENGTHENING ......................................................................... 14
III. PROGRAM IMPLEMENTATION ................................................................................................ 14
A. INSTITUTIONAL AND IMPLEMENTATION ARRANGEMENTS............................................................................ 14 B. RESULTS MONITORING AND EVALUATION ................................................................................................ 15 C. DISBURSEMENT ARRANGEMENTS ........................................................................................................... 16
IV. ASSESSMENT SUMMARY ........................................................................................................ 17
A. TECHNICAL ......................................................................................................................................... 17 B. FIDUCIARY .......................................................................................................................................... 24 C. ENVIRONMENTAL AND SOCIAL ............................................................................................................... 25 D. RISK ASSESSMENT ................................................................................................................................ 27
Annex 1. Results Chain ........................................................................................................................ 28 Annex 2. Results Framework Matrix ................................................................................................... 30 Annex 3. Disbursement Linked Indicators, Disbursement Arrangements and Verification Protocols 33 Annex 4. Systematic Operations Risk Rating (SORT) ........................................................................... 44 Annex 5. Program Action Plan ............................................................................................................ 45 Annex 6. IPF Component ..................................................................................................................... 47 Annex 7. Economic Analysis ................................................................................................................ 54 Annex 8. Map ...................................................................................................................................... 61


ii
PAD DATA SHEET
.
Hashemite Kingdom of Jordan
Education Reform Support Program‐for‐Results .
PROGRAM APPRAISAL DOCUMENT .
Middle East and North Africa Education Global Practice
.
Basic Information
Date: November 8, 2017 Sectors: Education
Country Director: Saroj Kumar Jha Themes: Basic and Secondary Education, Early Childhood Education
Practice Manager Global Practice Senior Director:
Safaa El Tayeb El‐Kogali Jaime Saavedra Chanduvi
Program ID:
P162407
Team Leader(s): Karine Pezzani, Juan Manuel Moreno Olmedilla
Program Implementation Period: Expected Financing Date: Effectiveness Date: Expected Financing Closing Date:
Start:
November 30, 2017 December 10, 2017 May 31, 2023
End Date:
November 30, 2022
.
Program Financing Data
[ X ] Loan [ X ] Grant [] Other
[ ] Credit
For Loans/Credits/Others (US$M):
Total Program Cost: 700.0 Total Bank Financing: 200.0 (PforR Component: 192.0 & TA IPF : 8.0)
Total Cofinancing (Borrower):
500.0
Financing Gap: 0.00

iii
.
Financing Source Amount
BORROWER Global Concessional Financing Facility
500.0 52.3
IBRD 147.7
Total 700.0 .
Borrower: Ministry of Planning and International Cooperation (MOPIC)
Responsible Agency: Ministry of Education (MOE)
Contact:
Telephone No.:
.
Expected Disbursements (in USD Million)
Program‐for‐Results
Fiscal Year (FY)
2018 2019 2020 2021 2022 2023
Annual 77.0 0.0 26.0 40.0 38.0 11.0
Cumulative 77.0 77.0 103.0 143.0 181.0 192.0
Technical Assistance IPF
Annual 0.5 2.5 2.0 2.0 1.0 0.0
Cumulative 0.5 3.0 5.0 7.0 8.0 8.0
Total Operation
Annual 77.5 2.5 28.0 42.0 39.0 11.0
Cumulative 77.5 80.0 108.0 150.0 189.0 200.0
.
Program Development Objective(s)
The Program Development Objective (PDO) is to expand access to early childhood education, and to improve student assessment and teaching and learning conditions for Jordanian children and Syrian refugee children.
.
Compliance
Policy
Does the program depart from the CAS in content or in other significant respects?
Yes [ ] No [ X ]
.
Does the program require any waivers of Bank policies applicable to Program‐for‐Results operations?
Yes [ ] No [ X ]
Have these been approved by Bank management? Yes [ ] No [ X ]
Is approval for any policy waiver sought from the Board? Yes [ ] No [ X ]
Overall Risk Rating: Substantial
iv
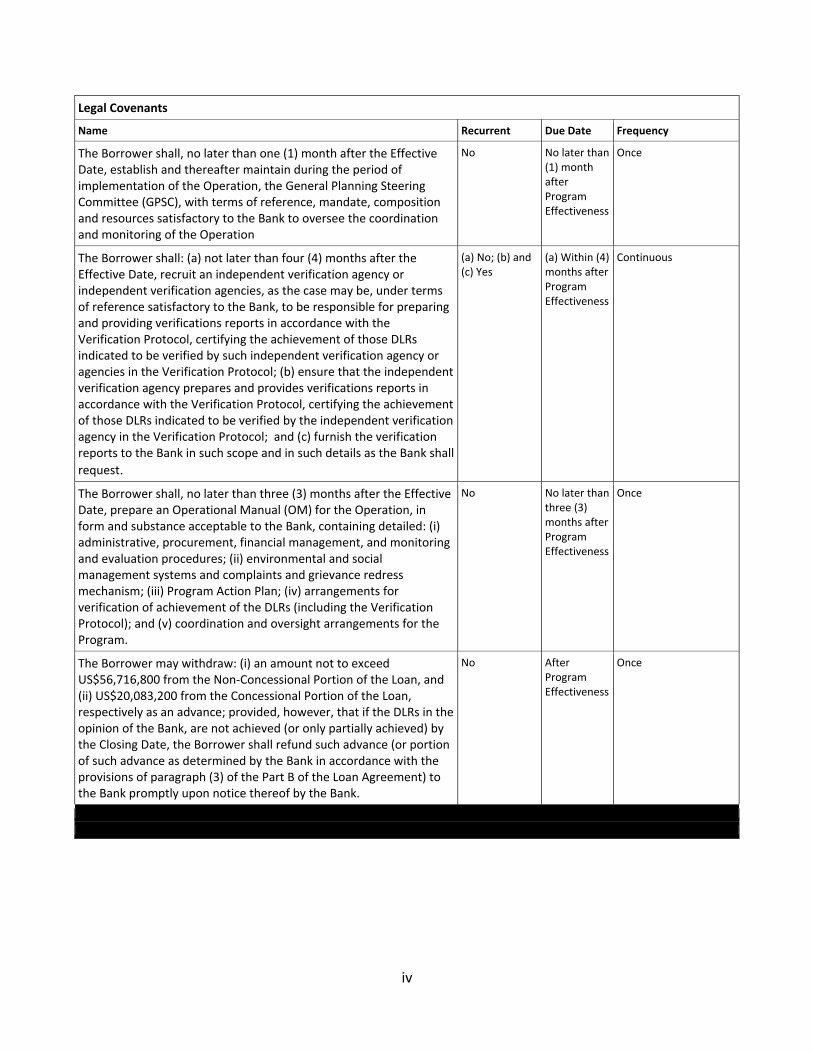
Legal Covenants
Name Recurrent Due Date Frequency
The Borrower shall, no later than one (1) month after the Effective Date, establish and thereafter maintain during the period of implementation of the Operation, the General Planning Steering Committee (GPSC), with terms of reference, mandate, composition and resources satisfactory to the Bank to oversee the coordination and monitoring of the Operation
No No later than (1) month after Program Effectiveness
Once
The Borrower shall: (a) not later than four (4) months after the Effective Date, recruit an independent verification agency or independent verification agencies, as the case may be, under terms of reference satisfactory to the Bank, to be responsible for preparing and providing verifications reports in accordance with the Verification Protocol, certifying the achievement of those DLRs indicated to be verified by such independent verification agency or agencies in the Verification Protocol; (b) ensure that the independent verification agency prepares and provides verifications reports in accordance with the Verification Protocol, certifying the achievement of those DLRs indicated to be verified by the independent verification agency in the Verification Protocol; and (c) furnish the verification reports to the Bank in such scope and in such details as the Bank shall
request.
(a) No; (b) and (c) Yes
(a) Within (4) months after Program Effectiveness
Continuous
The Borrower shall, no later than three (3) months after the Effective Date, prepare an Operational Manual (OM) for the Operation, in form and substance acceptable to the Bank, containing detailed: (i) administrative, procurement, financial management, and monitoring and evaluation procedures; (ii) environmental and social management systems and complaints and grievance redress mechanism; (iii) Program Action Plan; (iv) arrangements for verification of achievement of the DLRs (including the Verification Protocol); and (v) coordination and oversight arrangements for the Program.
No No later than three (3) months after Program Effectiveness
Once
The Borrower may withdraw: (i) an amount not to exceed US$56,716,800 from the Non‐Concessional Portion of the Loan, and (ii) US$20,083,200 from the Concessional Portion of the Loan, respectively as an advance; provided, however, that if the DLRs in the opinion of the Bank, are not achieved (or only partially achieved) by the Closing Date, the Borrower shall refund such advance (or portion of such advance as determined by the Bank in accordance with the provisions of paragraph (3) of the Part B of the Loan Agreement) to the Bank promptly upon notice thereof by the Bank.
No After Program Effectiveness
Once
.
v
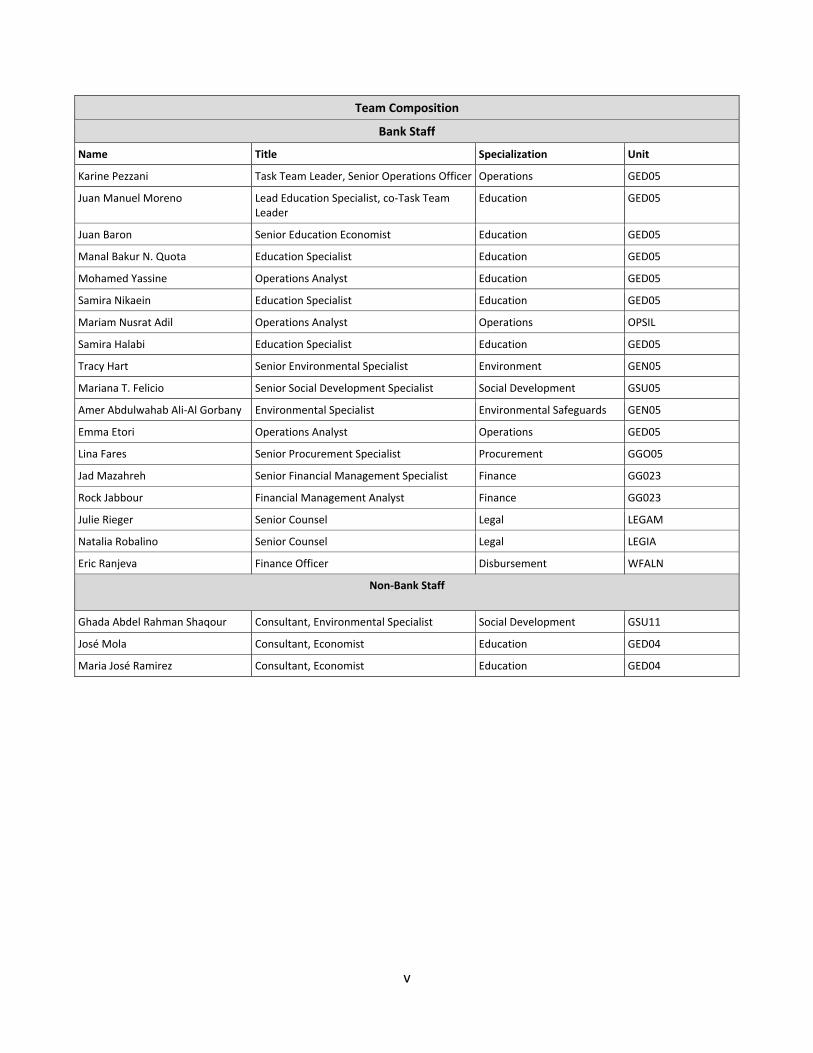
Team Composition
Bank Staff
Name Title Specialization Unit
Karine Pezzani Task Team Leader, Senior Operations Officer Operations GED05
Juan Manuel Moreno Lead Education Specialist, co‐Task Team Leader
Education GED05
Juan Baron Senior Education Economist Education GED05
Manal Bakur N. Quota Education Specialist Education GED05
Mohamed Yassine Operations Analyst Education GED05
Samira Nikaein Education Specialist Education GED05
Mariam Nusrat Adil Operations Analyst Operations OPSIL
Samira Halabi Education Specialist Education GED05
Tracy Hart Senior Environmental Specialist Environment GEN05
Mariana T. Felicio Senior Social Development Specialist Social Development GSU05
Amer Abdulwahab Ali‐Al Gorbany Environmental Specialist Environmental Safeguards GEN05
Emma Etori Operations Analyst Operations GED05
Lina Fares Senior Procurement Specialist Procurement GGO05
Jad Mazahreh Senior Financial Management Specialist Finance GG023
Rock Jabbour Financial Management Analyst Finance GG023
Julie Rieger Senior Counsel Legal LEGAM
Natalia Robalino Senior Counsel Legal LEGIA
Eric Ranjeva Finance Officer Disbursement WFALN
Non‐Bank Staff
Ghada Abdel Rahman Shaqour Consultant, Environmental Specialist Social Development GSU11
José Mola Consultant, Economist Education GED04
Maria José Ramirez Consultant, Economist Education GED04
1
HASHEMITE KINGDOM OF JORDAN Education Reform Support Program‐for‐Results
I. STRATEGIC CONTEXT
A. Country Context 1. Despite strong economic and social progress in previous decades, Jordan continues to face challenges that have been amplified by the Syrian refugee crisis. Economic growth has slowed down in 2016 for the second year in a row—to an estimated 2 percent from 2.4 percent in 2015. Indicators of human development and living standards have stagnated since 2009, after strong improvements from 1990 to 2008. The Human Development Index (HDI), which measures long‐term progress in three basic dimensions of human development (a long and healthy life, access to knowledge, and a decent standard of living), has remained at 0.742 since 2008, placing Jordan in the 86th position of 188 in the HDI ranking.1 This situation is explained by various factors, including the effects of the Syrian refugee crisis and the fallout from the 2007–2008 global financial crisis. 2. Jordan faces a significant demographic challenge with the influx of large numbers of Syrian refugees. The Syrian refugee crisis adds to the fiscal stress and puts serious strains on the government’s ability to provide public services, including health and education. As of August 2017, Jordan hosts 660,5822 registered Syrian refugees, of which 232,8683 are school‐aged children requiring the provision of education services. Eighty percent of refugees live in host communities, representing 10 percent of Jordan’s population, while the rest live in dedicated refugee camps. Per the recent 2016 government census, the total number of Syrians in Jordan reached an estimated 1.265 million, representing 13.2 percent of population.4 Jordan has been committed to integrating Syrian refugee children in the public formal sector, and as of June 2017, approximately 10 percent of children in public schools were Syrian refugees. Therefore, it is important that education services to refugee children in Jordan respond to the nature of the challenges they face in the education system.
3. Jordan’s economic development hinges on the existence of an education system that provides students with the cognitive and socioemotional skills needed to succeed in the labor market. Realizing the full potential of educational investments for economic prosperity requires improving access and quality of education for both girls and boys.5 Additionally, the cost of not educating refugee children is high in terms of loss of human capital for regional economic development, as well as for the long‐term processes of peace, stability, and reconstruction. It is thus necessary for the education system to be agile and address the existing education quality challenges by strengthening the system's ability to manage a growing number of students, including refugee and vulnerable children.
1 Human Development Data (1990–2015); Human Development Report. 2016. 2 United Nations High Commissioner for Refugees (UNHCR). August 6, 2017. 3 Brussels Conference Paper. 2017. 4 Department of Statistics (DOS); National census. November 2016. 5 OECD. 2016. PISA. 2015 Results (Volume I): Excellence and Equity in Education, OECD Publishing, Paris. http://dx.doi.org/10.1787/9789264266490‐en.

2
B. Sectoral and Institutional Context
4. The pre‐tertiary education system in Jordan is organized in three levels: (1) early childhood education (ECE) or preprimary—kindergarten (KG) 1 and 2; (2) compulsory basic education, comprising primary and lower secondary levels (grades 1–10); and (3) upper secondary education comprising both academic and vocational streams (grades 11 and 12). The pre‐tertiary education system is managed by the Ministry of Education (MOE), while the Ministry of Higher Education and Scientific Research (MOHESR) manages tertiary institutions (universities and vocational colleges).
5. Over the last two decades, Jordan has made efforts to improve access to education for boys and girls, and to increase the efficiency of its education system. The country has spent many years pursuing reforms toward a knowledge economy. Through multi‐donor development programs such as the Education Reform for Knowledge Economy (ERfKE), Jordan made impressive strides in terms of school access and attainment and enrollment rates. Under the first phase of ERfKE, the primary gross enrollment ratio increased from 71 percent in 1994 to 99 percent in 2010 (98 percent for girls and 99 percent for boys), and the transition rate to secondary school increased from 63 percent to 98 percent over the same period (98 percent for both girls and boys).6 The transition rate between grades is relatively stable above 96 percent from grades 1–8; however, in grade 9, there is a marked drop down to 90 percent and a corresponding surge in dropout up to 7 percent. Repetition peaks at 3 percent in grade 10, but it is comparatively lower than in many other Middle East and North Africa (MENA) countries and beyond.
6. Most Syrian refugee children have access to education services in Jordan but challenges remain. The Government of Jordan (GOJ) has committed to protecting Syrian refugee children’s right to education and has provided free education services to Syrian refugee students by accommodating them in existing classrooms and creating double‐shifts to meet the demand for schooling. In 2016, the GOJ adopted the Jordan Compact7 in which several donor partners8 increased their support to bring more children into the public education system, notably through the “Accelerating Access to Quality Formal Education for Syrian Refugees” plan. Through its “Catch‐up” program, the United Nations International Children’s Emergency Fund (UNICEF) has also been providing Syrian refugee children 9 to 12 years old with a pathway into formal schooling. Out of the 232,868 school‐aged Syrian refugee children in Jordan, approximately 83 percent of Syrian refugee children have access to education services: 54 percent through formal public provision and an additional 29 percent through non‐formal education. 9 However, enrollment in formal education is not uniform across grade levels. While more than half of basic education refugee children are enrolled in formal education, less than 10 percent are enrolled in preprimary formal education. The GOJ’s recent National Education Sector Plan (NESP) 2016–2022 sets out clear objectives to increase the enrollment of Syrian refugee students (boys and girls) in public schools in formal and non‐formal sectors, with the assistance of donors, civil society organizations, and the United Nations High Commissioner for Refugees (UNHCR). 7. Interventions to increase education access for Syrian refugee children should be targeted at those aspects of the education system in which there is greatest need. Enrollment rates for Syrians
6 World Bank EdStats data base—illiteracy rates, primary gross enrollment ratio, and transition rate to secondary school. 7 The Jordan Compact was presented at the 2016 London conference and sets out a series of major commitments aimed at improving the resilience of refugee and host communities, focusing mainly on livelihoods and education. 8 These include the governments of the United States (USAID), UK (DFID), EU, Canada, Norway, and Germany (KFW). 9 Brussels conference paper. 2017.
3
are dramatically low in early childhood education ‐ less than 20 percent, and secondary education – approximately 20 percent. While there are significant challenges in absorbing both Jordanian and Syrian refugee children in ECE, low enrollment rates in secondary education are due to high dropout rates—often linked to early marriage for girls and to child labor for boys. So, while it is paramount to increase the supply of education services for the youngest children, it is also necessary to retain students in classrooms to the end of secondary school and provide a quality education throughout. 8. Syrian refugee children face substantial challenges, many of which are the same as those faced by disadvantaged Jordanian children. Not only do Syrian refugee children face a limited supply of places in ECE and a system that fails to efficiently and effectively graduate students from the end of secondary school (as do their Jordanian counterparts), but they carry the consequences of family disruption, the psychological and emotional consequences of forced displacement, and the challenges of integration in the host communities. Given these circumstances, it is important that any intervention that targets Syrian refugee children is accompanied by a strong component that fosters pro‐social behavior, promotes respect and peaceful cohabitation, and reduces violence and bullying in schools, which have been documented, particularly in boys’ schools. These interventions would benefit both Syrian refugees and Jordanian students, particularly those from disadvantaged backgrounds.10
9. The expansion of education access to Syrian refugee children has exacerbated challenges in maintaining and improving the quality of education. While the immediate focus of the MOE has been on its ability to provide additional classrooms or school buildings, including furniture and textbooks, the most concerning impact of the crisis is the protracted deterioration of the quality of education that jeopardizes the delivery of services. The introduction of double shifts in schools is constraining instructional time for students in both shifts. In addition, newly recruited teachers are insufficiently trained, and are expected to manage large class sizes, making the school environment less conducive for learning. 10. Jordan needs to improve learning outcomes and make its education system more resilient to shocks by deepening and implementing policies to enhance quality and access. The main underlying challenges that significantly impact the performance of the education system, as outlined below, are low access to quality early childhood education (ECE) and its impact on school readiness, and a learning crisis attributable to the existing learning environment, teaching quality, and the student assessment and examination system. Any intervention that increases the quality of education would impact not only all Jordanian children in the system, but also all Syrian refugee children. 11. A key challenge facing the education system is the low access to quality ECE services that leads to poor school readiness, particularly for children from poorer and disadvantaged backgrounds, including Syrian refugee children. High‐quality ECE yields numerous benefits for children that affect them well into adulthood, including improved school performance, lower repetition rates, fewer dropouts, and better outcomes in the labor market.11 Yet, enrollment in the first and second years of kindergarten (KG) remains low at 13 and 59 percent, respectively, in sharp contrast to the universal enrollment rates achieved for primary and secondary schools. With KG enrollment strongly associated with family income,12 it is estimated that most children from the two bottom income quintiles are deprived of the benefits of an early childhood education. Far from leveling the playing field for all children, this enrollment structure is likely to widen the school readiness gap across socioeconomic
10 Environmental and Social Systems Assessment, World Bank, 2017 11 Gertler and others 2014; Karoly 2016; Phillips and others 2016; Dickens and others 2006. 12 El‐Kogali and Krafft 2015; EDI 2014.

4
lines in the first years of primary school.13 Limited specialized in‐service training opportunities and pedagogical support constrain KG teachers’ ability to structure learning around age‐appropriate and play‐based activities that stimulate child development and early noncognitive skills. This, coupled with a lack of an efficient quality assurance system for KGs means that there is no mechanism to monitor progress or incentivize continuous quality improvements, and likely is restricting the ECE’s contribution to children’s school readiness in the country. The 2014 Early Development Instrument, for example, revealed that a quarter of children enrolled in public KG2 in Jordan are “not ready to learn”, mainly due to inadequate levels of socioemotional development. As such, expanding access and ensuring quality in the provision of KG are likely to transform Jordanian and non‐Jordanian students’ ability to learn and succeed in school. 12. Poor student learning outcomes at all levels are a challenge in Jordan. One in five students in grade 2 cannot read a single word from a reading passage, while nearly half are unable to perform a single subtraction task correctly, thus lacking the foundational literacy and numeracy skills that enable further cognitive skill development.14 With a weak start, skills deficits compound such that by age 15, two‐thirds of students do not meet the most basic level of proficiency in mathematics, and half are below basic proficiency in reading and science, as measured by the 2015 Program for International Student Assessment (PISA). Furthermore, learning outcome data show a reverse gender gap with girls performing better than boys in reading, mathematics, and science.15 International comparisons place Jordan in the bottom 20 percent of PISA‐participating countries and economies, substantially below average in mathematics, reading, and science. 13. A key contributor to the learning crisis is the misalignment of policies related to teacher selection, preparation, management, and pedagogical practices. Teachers in Jordan are ill‐prepared for the challenges of classroom teaching. This is largely because they receive insufficient and highly theoretical preservice training, limited in‐service training, and often suffer from weaknesses in subject specific knowledge and skills to advance the potential of children irrespective of their gender and socioeconomic background. The profession attracts poorly performing students (despite comparatively higher salaries and working conditions) and does not have sufficient professional development mechanisms to nurture novice entrants into the profession. Moreover, high‐performing teachers are not recognized in the system, and incentives to motivate improved performance do not exist and would be hard to assess in any event given the absence of professional standards for teachers. Teacher career paths are still dependent on seniority and offer few avenues for promotion based on performance outcomes. 14. The MOE has been working toward the development and implementation of a comprehensive and integrated National Teacher Policy and Strategic Framework (NTPSF). The framework will outline policies for teacher preparation, selection, utilization, development, performance evaluation, and career path. Despite wide agreement with the NTPSF, the MOE has only been able to implement a few of its initiatives over the last seven years, mostly due to the prioritization of other activities and budget constraints. This has hindered the ability of the MOE to attract high‐performing candidates to teaching profession and to effectively manage teachers in improving teacher classroom practices. With renewed political commitment, along with the directives outlined in the National Human Resource Development Strategy (NHRDS) (2016–2025), the MOE is working toward formalizing and implementing the NTPSF. The overall aim of the NTPSF is to tackle the low status, social prestige, and quality of the professional performance of Jordanian teaching staff, and to expand preservice training.
13 According to MOE data for the 2015‐2016 academic year, enrollment is similar for girls and boys. 14 Latest (2012) EGRA and EGMA scores for Jordan. 15 PISA 2015

5
This will be achieved by integrating all significant policies related to the teaching profession in a consistent and coherent vision that includes: (1) the National Teacher Professional Standards, including a code of conduct; (2) the National Professional Development Framework; (3) a national teacher evaluation and appraisal framework; and (4) a national teacher career path and ranking framework.
15. The significant expansion in access to education, coupled with a weak maintenance system, has put serious strains on the education system’s infrastructure. Schools do not prepare maintenance plans, or conduct preventive maintenance; in many cases, there are significant differences between the way girls’ and boys’ schools are managed. Additionally, the ceiling for maintenance works conducted by an individual school is low and does not exceed 200 Jordanian Dinars (JOD) per transaction (approximately US$282 equivalent). For maintenance works exceeding the ceiling, schools are required to request the works to be conducted by the regional offices (for works not exceeding JOD 10,000) or the central office of MOE (for works exceeding JOD 10,000 and below JOD 250,000). The school‐level ceiling has not increased with the Syrian refugee crisis, even for schools that are enrolling a larger number of students or for the approximately 200 schools that are operating double shifts. In contrast, the average number of maintenance requests from schools to the MOE has increased by 8.8 percent in the three‐year period of 2013–2015 compared to the 2010–2012 period, which predates the Syrian refugee crisis. In parallel, total spending by the MOE on maintenance has nearly doubled over this same period, increase of 92.5 percent. 16. Competition for scarce resources between Jordanian students and Syrian refugee students is resulting in heightened social tensions and increased cases of school–based violence. Tensions between Syrian refugee and Jordanian students are visible and have been a matter of concern for teachers and school leaders who have limited capacity and support to manage violent and disruptive behaviors in a positive and constructive manner. It is estimated that 70 percent of Syrian refugee students are bullied or verbally abused in schools (UNICEF 2016), while 78 percent of parents state that their children are subject to physical violence from teachers (UNICEF 2016). Syrian refugee students are reported to leave school (1,600 students left due to bullying in 2016), or not enter at all, to preserve their safety and self‐respect. 17. Teachers and school leaders are poorly trained to handle violence and disruptive behaviors. Teachers themselves are still prone to use aggressive means for managing classrooms and disciplining students. In the 2015–2016 school year, 18 percent of children reported experiencing verbal violence in schools and 11 percent reported experiencing corporal punishment. Serious concerns also exist about the increase in student‐to‐student violence and disruptive behaviors (particularly in schools with Syrian refugees), including vandalism, harassment, bullying, and gender‐based violence. The MOE has made concerted efforts, including the introduction of the school‐based program Ma’an, to promote nonviolent and positive student discipline. The MOE has also initiated monthly violence surveys that act as deterrents for teachers from using violence and help to keep all actors accountable for their actions. However, further efforts are needed to support safe school environments and to understand and tackle the different challenges faced in gender‐segregated schools. 18. Jordan faces an additional major challenge in relation to its student assessment system. Jordan administers several census and sample‐based student assessments that appear to have weak feedback loops and therefore fail to inform the system on its performance early and effectively. There are three major national student assessments: (a) census‐based national tests for grades 4, 8, and 10 in four core subjects (Arabic, mathematics, science, and English); (b) the sample‐based National Assessment for Knowledge Economy (NAFKE) for grades 5, 9, and 11 (in Arabic, mathematics, and science; and (c) the general Secondary Certificate Examination (Tawjihi), which serves the double

6
function of secondary education graduation and competitive screening for university admission. The Tawjihi is administered twice a year to grade 12 students, although any Jordanian having completed grade 12 is entitled to take the examination. In addition, Jordan has participated in the Trends in International Mathematics and Science Study (TIMSS) for grade 8 in mathematics and science since 1999, and PISA for 15‐year‐olds in reading, mathematics, and science since 200616. Jordan also recently started administering the Early Grade Reading and Math Assessments (EGRA and EGMA)17 for grades 2 and 3 students, although this assessment is run by external donors and has not been institutionalized. 19. The general Secondary Certificate Examination (Tawjihi) is the single most influential and decisive high‐stakes exam in Jordan’s education system. This examination has been used for many decades with the dual purpose of a gateway to high school (upon achieving a passing score), and to determine the admissions track to higher education. Results from the exam split students into either technical education and vocational training (TVET) tertiary colleges or universities (with extremely demanding cut‐off scores to access the most sought‐after faculties and programs). Since approximately half the students who sit for the Tawjihi do not obtain a passing score and a further 20–25 percent simply do not show up for the examination, the issue of graduation and certification for secondary school remains unresolved for most students. This leaves them empty‐handed in terms of qualifications and with just a “Tawjihi failure certificate” (which, paradoxically, is required in some public‐sector jobs of low qualification). In other words, the focus and prevalence of the competitive/selective function of the Tawjihi has a devastating exclusionary effect on an overwhelming percentage of Jordanian youth. Moreover, despite the efforts of previous reforms in basic education around the integration of knowledge economy skills, the examination focuses on the memorization of facts and basic data, which means it fails to test the full range of skills required to succeed in tertiary education and in the 21st century labor market. 20. As it stands today, the Tawjihi seems to exacerbate inequality of opportunity: 81 percent of schools in which no student passed Tawjihi were in rural areas. A fundamental reform of the Tawjihi, as part of a comprehensive and coherent redesign of all national student assessments, is an indispensable requirement for the new education reform to reach its full potential. Such reform of the Tawjihi would need to be aligned with a revision of the curriculum of secondary education and its implementation. The double purpose of certification and university admission, and the selection criteria of tertiary education institutions must also be simultaneously reformed to better align schools toward learning, not passing exams. The GOJ has shown commitment by creating a High Commission for the reform of the Tawjihi, with specific changes already to become effective in the 2017/18 school year, and by deepening the dialogue with the MOHESR. 21. The final challenge that hinders further improvements in access and quality of education for all children is the MOE’s ability to manage the education system efficiently, including the system’s capacity to absorb growing populations of students. Since the start of the Syrian refugee crisis, Syrian refugees have accounted for an increase of more than 10 percent of the public student population. Additional financial resources are essential to cater to a growing number of students, many of them coming from vulnerable backgrounds and refugee populations, while improving and preserving gains in learning and education quality. Despite the increase in financial and technical support by international partners, the current capacity does not align with the challenges on the ground.
16 TIMSS assesses grades 4 and 8 students worldwide, but Jordan only participates in the grade 8 assessment. 17 EGRA and EGMA were sponsored and supported by USAID and are considered by GOJ to be part of the institutional student assessment system in the country. Assessments were conducted nationwide over five years (2012‐2017) in grades K‐3 (about 400,000 children).

7
22. Moreover, investments in strengthening data systems (both technical and financial) need to continue to deepen the use of data for evidence‐based decision making in the sector and further improve resource allocation. The MOE has successfully deployed an education management information system (EMIS), which is now hosting data on all schools and students in the system. Additional investments in a geographical information system (GIS) are ongoing and will allow MOE to better plan for expansion of access across all regions in the country. Leveraging the data available through the EMIS for decision making in the sector is a key opportunity for the MOE which will require additional technical assistance and capacity building to materialize. In addition, the collection, analysis, and use of student learning data and disaggregated and gender‐sensitive data are essential for monitoring, targeting pedagogical interventions, and improving teacher practices in the classroom.
C. Relationship to the Country Partnership Framework and Rationale for Use of Instrument
23. Relationship to the CPF. The proposed operation is fully aligned with the Jordan Country Partnership Framework (CPF) discussed by the World Bank Group Board on July 14, 2016. The CPF covers the period FY17–22 and highlights the economic, geopolitical, and social challenges that Jordan has been facing, particularly with the Syrian refugee crisis. The CPF also acknowledges Jordan’s commitment to reforms for a more sustainable growth path with stronger job creation, better service delivery, a more conducive investment climate, and a larger involvement of citizens in the decision‐making process. In this respect, it is fully aligned with the government’s Vision Jordan 2025. The proposed operation directly supports the second pillar of the CPF, which aims to improve the quality and equity of service delivery, particularly its objective 2.2. “Improved delivery of education services.” The proposed operation will seek to help Jordan improve the delivery of education services and strengthen its resilience in response to the current Syrian refugee crisis. 24. Rationale for the use of PforR. The PforR instrument will enhance the impact of the World Bank’s financial and technical support and increase the overall results orientation of the government’s National Human Resources Development Strategy (NHRDS). The decision to use this instrument was based on the following considerations: • Results orientation: The GOJ’s program as depicted by the NESP provides a comprehensive set of
activities for making the education system more result‐oriented. The PforR will push forward the results orientation of the sector plan by rewarding the achievement of results with disbursements.
• Upfront momentum: The PforR instrument will be used to generate momentum around key activities that are potential bottlenecks in the system. Disbursement‐linked indicators (DLI) will be a critical tool for shifting the policy dialogue toward results, especially in the initial years.
• Stakeholder harmonization: The PforR will not only enhance the partnership between the government and the World Bank by using the government’s own systems, but also the harmonization of donor interventions in the sector targeting a common results framework. The NESP lays out a comprehensive results framework that has been developed in coordination with education partners.
• Institutionalization of measurement: The use of the PforR instrument is an opportunity to leverage MOE’s investments in data systems, such as the OpenEMIS, and to strengthen and institutionalize a culture of measurement of results.
8
25. The proposed PforR links closely with the World Bank Group’s twin goals of eliminating extreme poverty and boosting shared prosperity in a sustainable manner. It is also aligned with core interventions of the Education for Competitiveness (E4C) initiative in the MENA Regional Strategy. By focusing on making education service delivery more inclusive, the proposed PforR is expected to enhance opportunities for a better future for both refugees and the host population children. The activities undertaken as a part of the Program link to four of the core pillars of E4C: early childhood development, early grade numeracy and literacy, information for accountability, and 21st century skills and values.
26. The proposed PforR is technically and operationally aligned with the World Bank Group’s MENA regional strategy. The proposed operation contributes to the overall strategic objective of supporting peace and stability through social and economic inclusion. It makes a direct contribution to the strategy’s pillars on renewing the social contract and building resilience to refugee shocks by supporting inclusive policies to provide access to quality education for Jordanian children and Syrian refugee children. In accessing concessional resources from the Global Concessional Financing Facility (GCFF – see Box 1 below) the operation exemplifies the MENA strategy’s call for leveraging partnerships with other regional development institutions and international development partners in response to the refugee crisis.
Box 1. Global Concessional Financing Facility The Global Concessional Financing Facility (GCFF) is a partnership sponsored by the World Bank, the UN, and the Islamic Development Bank Group to mobilize the international community in addressing the financing needs of middle‐income countries hosting large numbers of refugees. By combining donor contributions with multilateral development bank loans, the GCFF enables eligible middle‐income countries that are facing refugee crises to borrow at concessional rates for providing a global public good. The GCFF represents a coordinated response by the international community to the Syrian refugee crisis, bridging the gap between humanitarian and development assistance, as well as enhancing the coordination between the UN, supporting countries, multilateral development banks, and benefitting (hosting) countries. The GCFF is currently supported by Canada, Denmark, the European Commission, Germany, Japan, the Netherlands, Norway, Sweden, the United Kingdom, and the United States.
II. PROGRAM DESCRIPTION
A. Government program
27. The government’s education program is based on the five‐year National Education Sector Plan, which is embedded in the broader National Human Resources Development Strategy (2016–2025).18 The NHRDS cuts across all education levels with strategic objectives categorized into five cross‐cutting themes: access, quality, accountability, innovation, and mindset. The NESP narrows in on these themes for ECE, basic, and secondary education, and prioritizes a set of reform‐related solutions to: (a) increase KG2 capacity and enrolment while exploring innovative financing approaches to ECE, (b) improve the provision of basic and secondary education services to all Jordanian and non‐Jordanian children, (c) improve the quality of education through the professionalization of the teaching profession, curriculum reform, rationalization of schools, and revision of national student assessment systems, including the Tawjihi, and (d) strengthen governance throughout the system. A cross‐cutting theme of the NHRDS responds to the immediate needs for improving quality and access to education services for Syrian refugee children, and to make the Jordanian education system more resilient to external and internal challenges. This focus is essential for building education systems that nurture
18 The NHRDS was approved by the Cabinet and launched in September 2016.
9
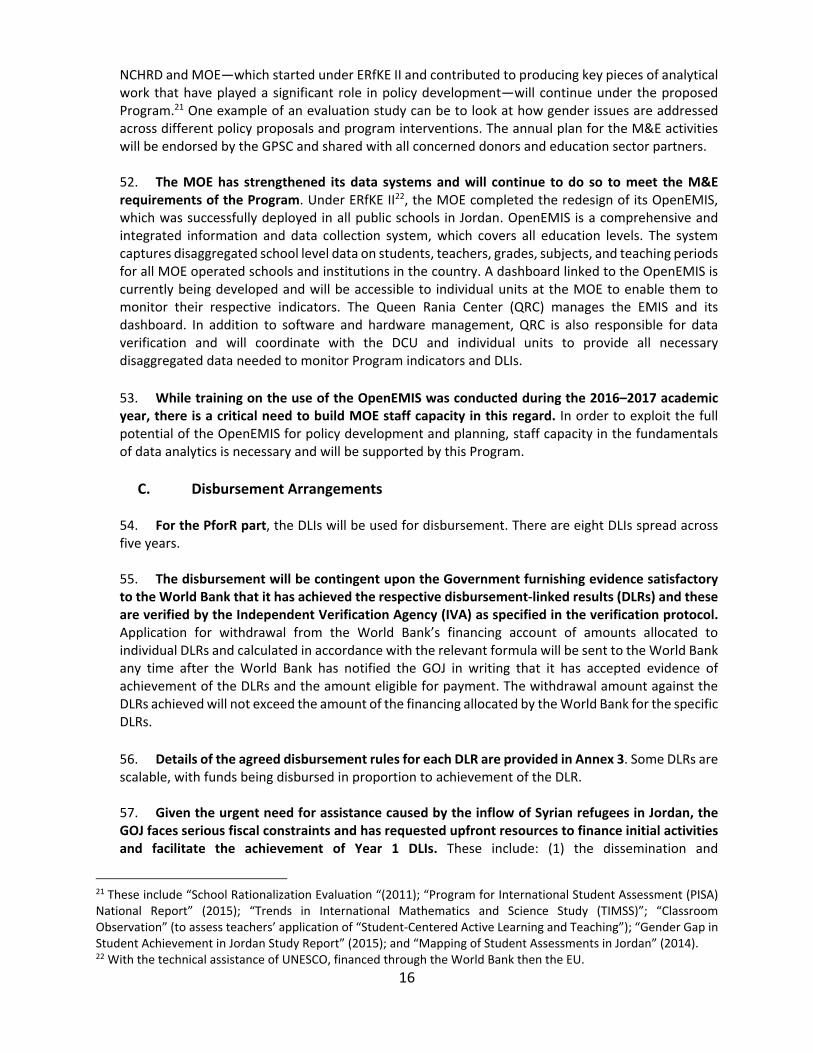
greater social cohesion and allow for equal opportunities for all children. The NESP has been prepared in full coordination with the donor partners in Jordan and provides the bridge between the NHRDS vision and the GOJ and donor interventions. 28. The financing plan for the National Education Sector Plan includes two types of costs: operational plan costs and core costs. The core costs are based on the MOE budget allocations, while operational plan costs are external and correspond to key activities that need to be undertaken to achieve the results of the NHRDS. The government program is valued at US$7.3 billion which includes US$6.0 billion as projections for MOE budget allocations from 2018–2022, as well as NESP operational plan costs of US$1.3 billion (which are not already included in MOE budget allocations). Teacher salaries, wages, and allowances make up a large share (US$5.1 billion) of the core costs, leaving little room for the MOE to undertake transformational reforms that are required to meet the goals of the NHRDS. GOJ needs to increase the overall government budget by US$1.3 billion over the next five years to ensure that these reforms are undertaken. With regards to donor contributions for the achievement of NESP results, US$815 million is committed or planned to support the education sector in Jordan during the lifetime of the program. Of this, approximately US$84 million is expected to be channeled through budget support and US$731 million through alternative arrangements.
B. Program Development Objectives (PDO) and Key Results 29. The Program Development Objective (PDO) is to expand access to early childhood education, and to improve student assessment and teaching and learning conditions for Jordanian children and Syrian refugee children. 30. The PDO Indicators are:
Number of Jordanian children and Syrian refugee children enrolled in KG2, disaggregated by nationality, gender, and type of school;
Percentage point reduction in the dropout rate of Syrian refugee children, disaggregated by gender;
Number of teachers evaluated against the new National Teacher Professional Standards (NTPS) who meet the minimum performance standards;
First phase of Tawjihi reform completed.
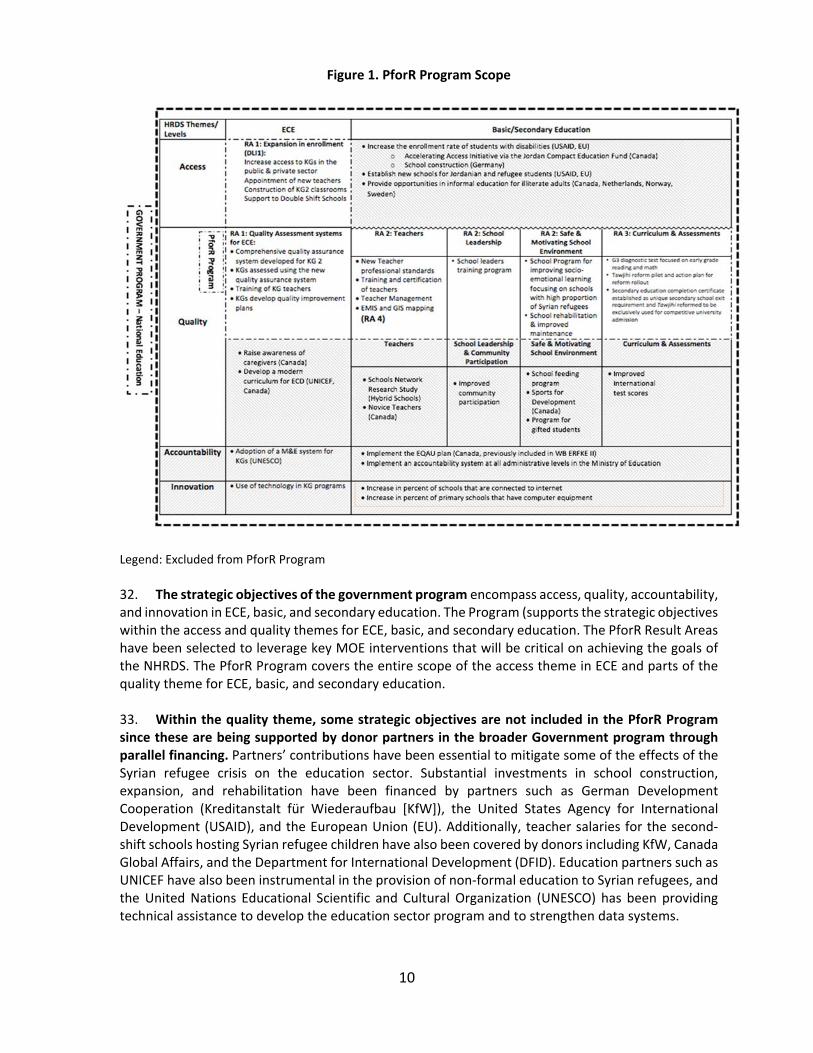
C. PforR Program Scope 31. The PforR Program supports a sub‐portion of the government program (NESP) across four key Result Areas. These Result Areas fall under the access and quality themes for ECE, basic, and secondary education. The PforR Program is valued at US$700.0 million, or 10 percent of the US$7.3 billion NESP, and includes key activities that focus on access for ECE and quality for ECE, basic, and secondary education. Figure 1 provides an overview of the boundaries of the government program and the PforR Program. The Program consists of the MOE budget core costs corresponding to the Result Areas of the Program under KG, basic education, and secondary education, as well as NESP operational plan costs of activities that are critical for achieving program results. The expenditure framework indicates that US$114.0 million is required for Result Area 1, US$113.0 million for Result Area 2, US$98.0 million for Result Area 3 and US$375.0 million for Result Area 4 (details in section IV.A).
10
Figure 1. PforR Program Scope
Legend: Excluded from PforR Program
32. The strategic objectives of the government program encompass access, quality, accountability, and innovation in ECE, basic, and secondary education. The Program (supports the strategic objectives within the access and quality themes for ECE, basic, and secondary education. The PforR Result Areas have been selected to leverage key MOE interventions that will be critical on achieving the goals of the NHRDS. The PforR Program covers the entire scope of the access theme in ECE and parts of the quality theme for ECE, basic, and secondary education. 33. Within the quality theme, some strategic objectives are not included in the PforR Program since these are being supported by donor partners in the broader Government program through parallel financing. Partners’ contributions have been essential to mitigate some of the effects of the Syrian refugee crisis on the education sector. Substantial investments in school construction, expansion, and rehabilitation have been financed by partners such as German Development Cooperation (Kreditanstalt für Wiederaufbau [KfW]), the United States Agency for International Development (USAID), and the European Union (EU). Additionally, teacher salaries for the second‐shift schools hosting Syrian refugee children have also been covered by donors including KfW, Canada Global Affairs, and the Department for International Development (DFID). Education partners such as UNICEF have also been instrumental in the provision of non‐formal education to Syrian refugees, and the United Nations Educational Scientific and Cultural Organization (UNESCO) has been providing technical assistance to develop the education sector program and to strengthen data systems.
11
34. However, the MOE requires additional support and resources to continue expanding access to education, including preprimary education, and to improve the learning environment through investments in professional development of teachers and school principals and in maintenance and enhancement of the physical environment. The PforR Program is an essential instrument not only to address these outstanding challenges but also to leverage the DLIs to address bottlenecks that are being faced by the wider donor community.
35. The first Result Area is expanded access and improved quality of early childhood education. This includes increasing access to KG for girls and boys by supporting expansion in public provision and providing technical assistance to help the government set up public‐private partnerships (PPPs) (see annex 6).19 It also includes supporting the development and implementation of a harmonized quality assurance system for public and private KGs, and rolling‐out of an in‐service training program to improve teaching practices in KG classrooms.20 The training program will include a number of thematic modules, such as the early socioemotional development of children, preventing gender stereotyping and integrating play‐based learning in the classroom, as identified by a diagnostic study of teaching practices. This Result Area is fully aligned with the ECE strategic objectives of the NESP. The MOE recognizes that the largest gains in education can be made by investing in ECE. However, it has struggled so far to secure financing and technical expertise to achieve all intended objectives within this realm. The PforR Program will incentivize focused interventions to be undertaken to expand access to and enhance quality of ECE provision. 36. The second Result Area aims to achieve improved teaching and learning conditions. The mechanism to achieve this goal is a focus on improving the school physical environment and the capacity of teachers and school leaders, and fostering positive student and teacher behavior and civic awareness toward schools and their communities. The focus of this Result Area is both on the physical school infrastructure and on the softer environmental factors that create a school climate that is conducive for learning, such as peer and teacher modes of communication and school values.
37. The third Result Area is a reformed student assessment and certification system that will focus on strengthening the MOE’s ability to measure and monitor student learning at all grade levels and to bridge the gap between learning and certification. This notably includes the reform of Tawjihi and the institutionalization of an early grade diagnostic learning assessment.
38. The fourth Result Area is strengthened education system management by focusing on supporting MOE and strengthening its capacity to manage an increasing number of schools and students, notably due to the expansion of early childhood education and to the enrollment of a large number of refugee children in Jordanian schools. The focus of this Result Area is to provide and enhance the tools and resources available to the MOE for decision making and implementation. These tools include information systems such as the operationalization of the GIS, which will allow the MOE to map school construction, expansion, and rehabilitation needs, and the strengthening of the existing OpenEMIS to allow MOE to analyze and make use of disaggregated and gender‐sensitive data for decision making. This Result Area will also support the MOE in securing budget additionality to the sector in an efficient and effective manner to ensure that resources are available for undertaking the necessary reforms.
19 In an effort to shed light on gender dynamics in the education sector in Jordan, the impact evaluation will assess heterogeneous effects by student gender. 20 By “private KG” is meant: all non‐public provision including for profit private KGs, community‐based KGs, and NGO KGs.

12
39. The Result Areas have a common objective of enhancingthe quality of education available to Syrian refugees. By expanding access to quality KG education, Result Area 1 ensures the availability of greater opportunities for Syrian refugee children to establish a strong foundation for their learning paths at the preschool level. Given that through parallel financing, several donors partners are focusing on making basic education accessible to Syrian refugees, Result Area 2 ensures that, as access is expanded, the quality of learning remains available to Jordanian children and Syrian refugee children, and that the teaching and learning environment is conducive to large learning gains. Furthermore, this Result Area includes a dedicated focus on building a school environment that promotes tolerance and positive social behavior, and provides a sense of belonging and identity for Syrian refugee children. This focus is also reflected in the DLIs (1 and 5) and the Results Framework with dedicated indicators capturing the impact of the PforR Program on the learning experience of Syrian refugee children.
Table 1. Number of Syrian Refugee Children Benefitting from the Program
Level of Education Result
Area (RA) Number of Syrian Beneficiaries
of the PforR Program
Total Number of Syrian Refugee Children within
Age Group
% Benefitting from Program
Basic Education RA 2, RA 3, RA 4
150,000 182,000
71% Secondary Education 30,000
ECE (KG2) RA 1, RA 4 10,000 20,000 50%
Total RA 1‐4 160,000 232,000 69% (*) Through DLI 1 (“Number of beneficiaries from the Program”) the Program targets an increased enrollment of 30,000 students into the formal sector (one‐third of them expected at the ECE level). Increased enrollment through the Program is mostly achieved by activities that support expansion of ECE where Syrian refugee children enrollment is very low and retention of basic education and secondary education students.
Structure of the World Bank supported operation 40. The total cost for the proposed operation is US$200.0 million, out of which the GCFF will provide US$52.3 million. The proposed operation is a hybrid operation consisting of: (1) a Program‐for‐Results (PforR) component (US$192.0 million) that comprises the four Results Areas described above; and (2) a technical assistance (TA) component using Investment Project Financing (IPF). The TA component, estimated to cost US$8.0 million, will support a set of TA and capacity building activities (see Annex 6) that will contribute to the achievement of the Program results and outcomes.
41. The rationale for using an IPF for TA activities —applying the IPF procedures—is to allow for the timely procurement of consultants and firms to produce strategic studies, impact evaluations, and technical assistance, and capacity building activities. While the GOJ has strong systems for procurement of goods and services, the Program implementation would benefit from applying the World Bank procedures for contracting consulting services to ensure the timely procurement of high quality consultants and firms to undertake upfront analytical activities that will critically inform the design and implementation of core Program activities.
13
Table 2. Program Financing (in US$ million)
Source Amount % of Total
Total Operation Cost 700.0 ‐
Total Program Cost 692.0 100
TA IPF Component Cost 8.0 ‐
Total Program Financing 700.0 100
Government 500.0 71
IBRD (with global concessional financing) 200.0 29
Financing Gap 0.0 0
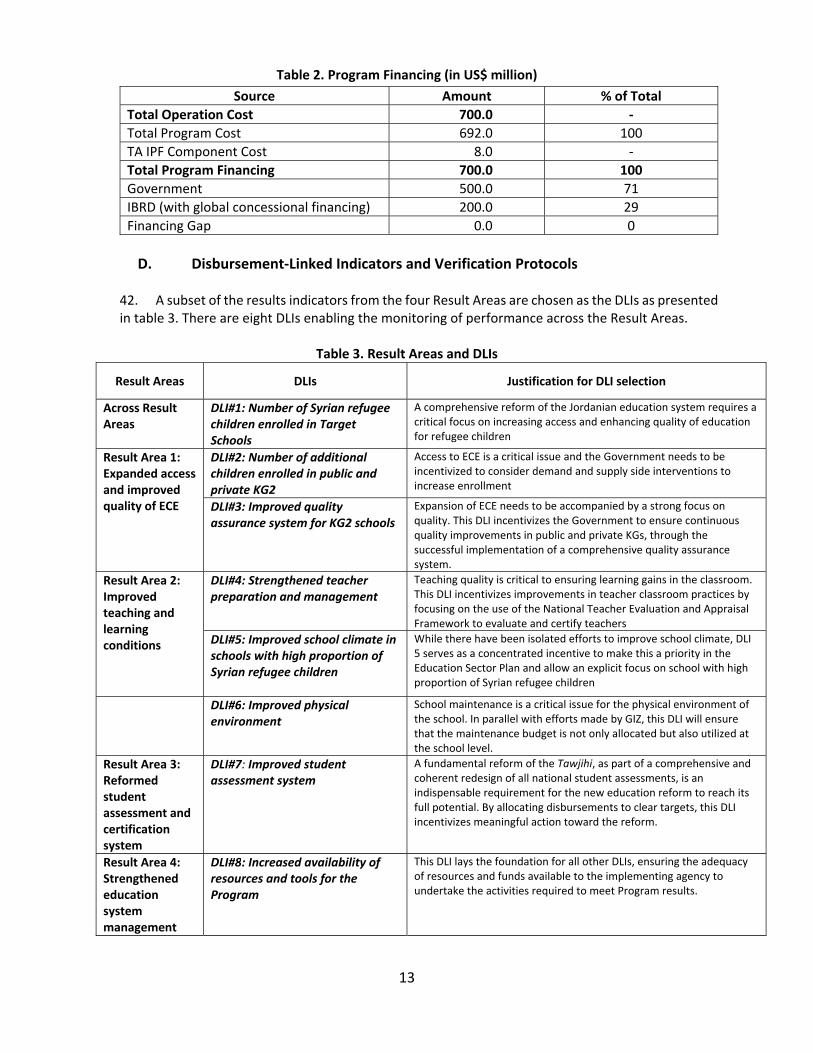
D. Disbursement‐Linked Indicators and Verification Protocols
42. A subset of the results indicators from the four Result Areas are chosen as the DLIs as presented in table 3. There are eight DLIs enabling the monitoring of performance across the Result Areas.
Table 3. Result Areas and DLIs
Result Areas DLIs Justification for DLI selection
Across Result Areas
DLI#1: Number of Syrian refugee children enrolled in Target Schools
A comprehensive reform of the Jordanian education system requires a critical focus on increasing access and enhancing quality of education for refugee children
Result Area 1: Expanded access and improved quality of ECE
DLI#2: Number of additional children enrolled in public and private KG2
Access to ECE is a critical issue and the Government needs to be incentivized to consider demand and supply side interventions to increase enrollment
DLI#3: Improved quality assurance system for KG2 schools
Expansion of ECE needs to be accompanied by a strong focus on quality. This DLI incentivizes the Government to ensure continuous quality improvements in public and private KGs, through the successful implementation of a comprehensive quality assurance system.
Result Area 2: Improved teaching and learning conditions
DLI#4: Strengthened teacher preparation and management
Teaching quality is critical to ensuring learning gains in the classroom. This DLI incentivizes improvements in teacher classroom practices by focusing on the use of the National Teacher Evaluation and Appraisal Framework to evaluate and certify teachers
DLI#5: Improved school climate in schools with high proportion of Syrian refugee children
While there have been isolated efforts to improve school climate, DLI 5 serves as a concentrated incentive to make this a priority in the Education Sector Plan and allow an explicit focus on school with high proportion of Syrian refugee children
DLI#6: Improved physical environment
School maintenance is a critical issue for the physical environment of the school. In parallel with efforts made by GIZ, this DLI will ensure that the maintenance budget is not only allocated but also utilized at the school level.
Result Area 3: Reformed student assessment and certification system
DLI#7: Improved student assessment system
A fundamental reform of the Tawjihi, as part of a comprehensive and coherent redesign of all national student assessments, is an indispensable requirement for the new education reform to reach its full potential. By allocating disbursements to clear targets, this DLI incentivizes meaningful action toward the reform.
Result Area 4: Strengthened education system management
DLI#8: Increased availability of resources and tools for the Program
This DLI lays the foundation for all other DLIs, ensuring the adequacy of resources and funds available to the implementing agency to undertake the activities required to meet Program results.

14
43. The DLIs have been selected based on their capacity to clearly reflect significant progress in implementing the Program and to lead to unambiguous decisions regarding disbursements. The achievement of the DLIs will be verified and recommended to the World Bank by independent agencies, with relevant technical expertise, before the disbursement of funds. The verification protocols for the DLIs are spelled out in more detail in Annex 3.
E. Capacity Building and Institutional Strengthening 44. Capacity‐building and system‐strengthening activities will be provided to support all four Result Areas of the Program through direct support to the government education program (PforR component) and through targeted interventions (TA Component). Under Result Area 1, activities will contribute to strengthening the education system by establishing a quality assurance system for ECE. Under Result Area 2, the operation will include a range of TA services to support the institutional development of the Education Training Center (ETC), as well as to support its institutional and staffing capacity to plan, measure, monitor, and regulate the implementation of the NTPSF. Under Result Area 3, the operation will support the MOE in the design, piloting, and implementation of the student assessment, examination, and certification reform. In addition, it will provide capacity‐building activities to strengthen the research and development function of the Department of Tests and Examinations, particularly as the transition of this responsibility takes place under the newly created National Center for Curriculum and Assessment. Under Result Area 4, the operation will support the strengthening of the monitoring and evaluation system and the capacity of MOE staff in data analysis. Furthermore, it will support the MOE Gender Unit’s capacity to mainstream gender efforts across all activities through TA services (see para. 83 for more details). Capacity‐building and system‐strengthening interventions supported by the operation are further described in other sections of this document.
III. PROGRAM IMPLEMENTATION
A. Institutional and Implementation Arrangements 45. Institutional and implementation arrangements will follow, to a great extent, those that were in place under the previous multi‐donor financed Education Reform for Knowledge Economy (ERfKE II) project. The arrangements will be as follows:
Program implementation
46. The Ministry of Education (MOE) is the government’s responsible entity for implementing the Program, with the administrative support of the Development Coordination Unit (DCU). Under the leadership of the Minister, MOE directorates will plan and implement activities related to their component. The MOE is ultimately accountable for meeting the program objectives, providing program oversight through the General Policy Steering Committee (GPSC), monitoring and evaluation, and technical support to the various MOE directorates involved in implementation, and coordinating activities among various stakeholders and donors.
47. The Ministry of Public Works and Housing (MOPWH), which was mandated to manage the construction and extension of schools under ERfKE II, will continue to be responsible for the procurement processing and implementation of civil works under the proposed Program. MOPWH will be commissioned by the MOE for any works contract over the threshold limit of JOD 250,000.
15
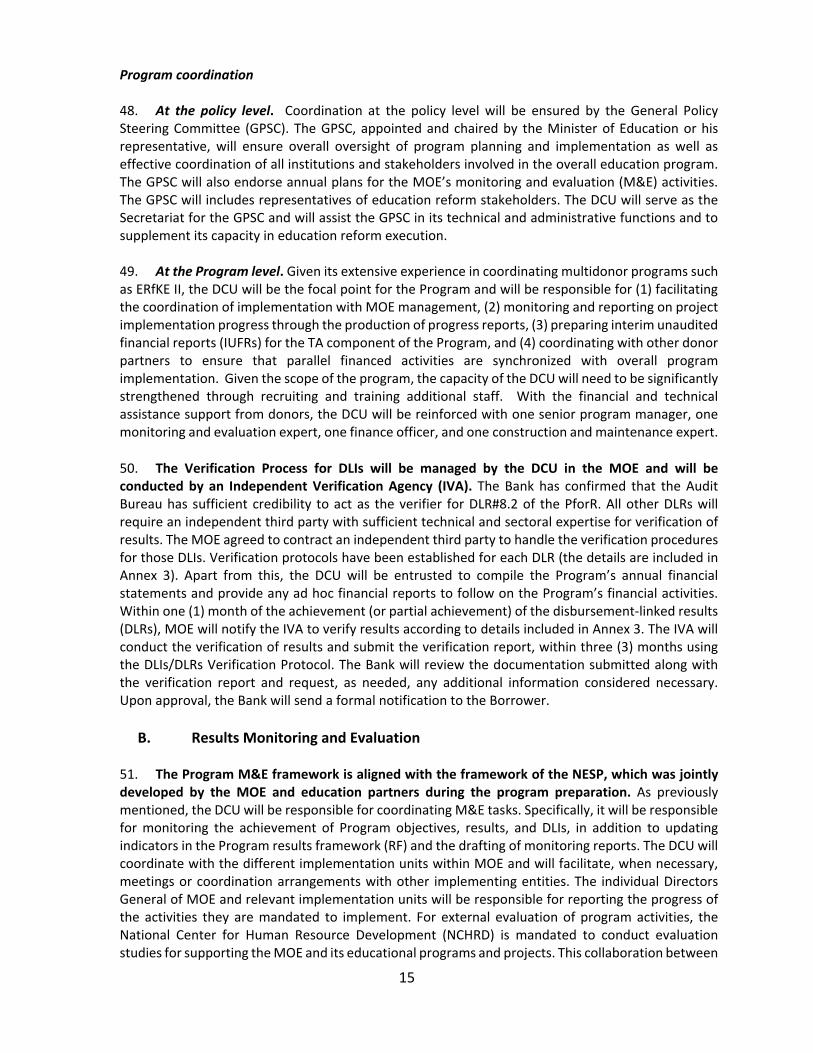
Program coordination 48. At the policy level. Coordination at the policy level will be ensured by the General Policy Steering Committee (GPSC). The GPSC, appointed and chaired by the Minister of Education or his representative, will ensure overall oversight of program planning and implementation as well as effective coordination of all institutions and stakeholders involved in the overall education program. The GPSC will also endorse annual plans for the MOE’s monitoring and evaluation (M&E) activities. The GPSC will includes representatives of education reform stakeholders. The DCU will serve as the Secretariat for the GPSC and will assist the GPSC in its technical and administrative functions and to supplement its capacity in education reform execution. 49. At the Program level. Given its extensive experience in coordinating multidonor programs such as ERfKE II, the DCU will be the focal point for the Program and will be responsible for (1) facilitating the coordination of implementation with MOE management, (2) monitoring and reporting on project implementation progress through the production of progress reports, (3) preparing interim unaudited financial reports (IUFRs) for the TA component of the Program, and (4) coordinating with other donor partners to ensure that parallel financed activities are synchronized with overall program implementation. Given the scope of the program, the capacity of the DCU will need to be significantly strengthened through recruiting and training additional staff. With the financial and technical assistance support from donors, the DCU will be reinforced with one senior program manager, one monitoring and evaluation expert, one finance officer, and one construction and maintenance expert.
50. The Verification Process for DLIs will be managed by the DCU in the MOE and will be conducted by an Independent Verification Agency (IVA). The Bank has confirmed that the Audit Bureau has sufficient credibility to act as the verifier for DLR#8.2 of the PforR. All other DLRs will require an independent third party with sufficient technical and sectoral expertise for verification of results. The MOE agreed to contract an independent third party to handle the verification procedures for those DLIs. Verification protocols have been established for each DLR (the details are included in Annex 3). Apart from this, the DCU will be entrusted to compile the Program’s annual financial statements and provide any ad hoc financial reports to follow on the Program’s financial activities. Within one (1) month of the achievement (or partial achievement) of the disbursement‐linked results (DLRs), MOE will notify the IVA to verify results according to details included in Annex 3. The IVA will conduct the verification of results and submit the verification report, within three (3) months using the DLIs/DLRs Verification Protocol. The Bank will review the documentation submitted along with the verification report and request, as needed, any additional information considered necessary. Upon approval, the Bank will send a formal notification to the Borrower.
B. Results Monitoring and Evaluation 51. The Program M&E framework is aligned with the framework of the NESP, which was jointly developed by the MOE and education partners during the program preparation. As previously mentioned, the DCU will be responsible for coordinating M&E tasks. Specifically, it will be responsible for monitoring the achievement of Program objectives, results, and DLIs, in addition to updating indicators in the Program results framework (RF) and the drafting of monitoring reports. The DCU will coordinate with the different implementation units within MOE and will facilitate, when necessary, meetings or coordination arrangements with other implementing entities. The individual Directors General of MOE and relevant implementation units will be responsible for reporting the progress of the activities they are mandated to implement. For external evaluation of program activities, the National Center for Human Resource Development (NCHRD) is mandated to conduct evaluation studies for supporting the MOE and its educational programs and projects. This collaboration between
16
NCHRD and MOE—which started under ERfKE II and contributed to producing key pieces of analytical work that have played a significant role in policy development—will continue under the proposed Program.21 One example of an evaluation study can be to look at how gender issues are addressed across different policy proposals and program interventions. The annual plan for the M&E activities will be endorsed by the GPSC and shared with all concerned donors and education sector partners. 52. The MOE has strengthened its data systems and will continue to do so to meet the M&E requirements of the Program. Under ERfKE II22, the MOE completed the redesign of its OpenEMIS, which was successfully deployed in all public schools in Jordan. OpenEMIS is a comprehensive and integrated information and data collection system, which covers all education levels. The system captures disaggregated school level data on students, teachers, grades, subjects, and teaching periods for all MOE operated schools and institutions in the country. A dashboard linked to the OpenEMIS is currently being developed and will be accessible to individual units at the MOE to enable them to monitor their respective indicators. The Queen Rania Center (QRC) manages the EMIS and its dashboard. In addition to software and hardware management, QRC is also responsible for data verification and will coordinate with the DCU and individual units to provide all necessary disaggregated data needed to monitor Program indicators and DLIs.
53. While training on the use of the OpenEMIS was conducted during the 2016–2017 academic year, there is a critical need to build MOE staff capacity in this regard. In order to exploit the full potential of the OpenEMIS for policy development and planning, staff capacity in the fundamentals of data analytics is necessary and will be supported by this Program.
C. Disbursement Arrangements 54. For the PforR part, the DLIs will be used for disbursement. There are eight DLIs spread across five years. 55. The disbursement will be contingent upon the Government furnishing evidence satisfactory to the World Bank that it has achieved the respective disbursement‐linked results (DLRs) and these are verified by the Independent Verification Agency (IVA) as specified in the verification protocol. Application for withdrawal from the World Bank’s financing account of amounts allocated to individual DLRs and calculated in accordance with the relevant formula will be sent to the World Bank any time after the World Bank has notified the GOJ in writing that it has accepted evidence of achievement of the DLRs and the amount eligible for payment. The withdrawal amount against the DLRs achieved will not exceed the amount of the financing allocated by the World Bank for the specific DLRs.
56. Details of the agreed disbursement rules for each DLR are provided in Annex 3. Some DLRs are scalable, with funds being disbursed in proportion to achievement of the DLR.
57. Given the urgent need for assistance caused by the inflow of Syrian refugees in Jordan, the GOJ faces serious fiscal constraints and has requested upfront resources to finance initial activities and facilitate the achievement of Year 1 DLIs. These include: (1) the dissemination and
21 These include “School Rationalization Evaluation “(2011); “Program for International Student Assessment (PISA) National Report” (2015); “Trends in International Mathematics and Science Study (TIMSS)”; “Classroom Observation” (to assess teachers’ application of “Student‐Centered Active Learning and Teaching”); “Gender Gap in Student Achievement in Jordan Study Report” (2015); and “Mapping of Student Assessments in Jordan” (2014). 22 With the technical assistance of UNESCO, financed through the World Bank then the EU.

17
implementation of a comprehensive and harmonized quality assurance system for public and private KG2 providers; (2) the deployment and implementation of a new maintenance system; (3) the evaluation and training of teachers based on the new professional standards; and (4) the initiation of construction activities for the expansion of KG enrollment. Given that most of these activities are new initiatives planned by the Government, there is currently inadequate provision for them in the MOE’s budget. These activities are critical foundational blocks for the achievement of Program results and cannot be undertaken without sufficient financial support. In the absence of other immediate financial resources, the GOJ requires 40 percent of the total financing proceeds to be disbursed as a PforR advance to allow for critical activities to be undertaken and ensure achievement of key Program results.
58. TA component. The TA component, estimated to cost US$8.0 million, will be managed by the DCU which has extensive prior experience with the World Bank‐financed operations through the implementation of the ERfKE I and ERfKE II projects. Details on the TA‐related disbursements are provided in Annex 6. The TA component will be disbursed using IPF disbursement procedures.
IV. ASSESSMENT SUMMARY
A. Technical Strategic relevance 59. The Program supports directly the Jordanian NHDRS (2016–2025) and NESP, which identified strategic education reform programs along with key performance indicators (KPIs) that address critical challenges within the sector. At the heart of the NHRDS and NESP is the ambition of developing a national workforce with the “skills, qualifications, capabilities, and behaviors necessary to achieve Jordan’s economic and societal ambitions.” Similarly, Jordan’s Economic Growth Plan (JEGP) for 2018–2025 recognizes high quality human capital education as a key component of Jordan’s historic economic growth and outlines key components of the NHRDS as crucial to revitalizing Jordan’s economic growth. 60. The Program will contribute to Jordan’s macroeconomic stability and long‐term development in line with the Jordan Economic Growth Plan (2018–2022). The Program will play a critical role in supporting Jordan’s pressing fiscal and current account needs particularly given Jordan’s commitment to the Program under the International Monetary Fund (IMF) Extended Fund Facility. Enhanced quality of human capital advances a country’s productivity and economic growth. Investing in education, via access to education and better quality education, earlier in the process provides higher economic returns. This is evidenced by the recognition of the importance of ECE, also a Sustainable Development Goal target. By focusing on improving the school environment, expanding the quality of ECE, and bettering learning outcomes, the Program seeks to better prepare students for learning and skills for the labor market. The Program is also supporting gender equality and equal opportunities, which will encourage both girls and boys to achieve their full potential and support women’s economic and public participation. Program technical soundness 61. The Program draws heavily on the accomplishments and lessons from the previous ERfKE projects, and is designed to incentivize the GOJ to tackle the crucial challenges and gaps that remain in the education system, as well as to pursue meaningful reforms. The Program is assessed to be

18
technically sound and includes DLIs that have been selected in accordance with NHRDS and NESP key priorities, in that it focuses on areas that are considered the foundation for quality teaching and learning. Evidence shows that the pathway to a strong future workforce begins with ensuring that students have a stable and safe learning environment, are ready to learn, and are interacting with qualified teachers who function within a school support system that respects rights and equal opportunities. The Program focuses on: (1) supporting ECE, as high‐quality ECE yields numerous benefits for children that affect them well into adulthood; (2) increasing the quality of the professional performance of Jordanian teaching staff; and (3) improving the school climate to foster learning.
Economic analysis
62. In the case of ECE, primary, and secondary education, the rationale for supporting public sector provision with the World Bank financing is the appropriate option. Education and human capital have long been directly linked to economic growth, productivity, and the improvement of living standards.23 However, a series of factors, notably the positive social externalities of education, together with market imperfections, result in a chronic underinvestment in the sector by private actors. The role of increasing investment in education must, therefore, be carried out by the public sector. Public involvement is also relevant in improving the management of the education system, the learning conditions for all students, and ultimately the access to quality education. 63. The activities that would be implemented under the Program would have a direct development impact on the capacity of the MOE to carry out key activities to manage the education system (including increasing access for refugees, improve quality of education, and learning conditions), which, in the long term, would improve educational outcomes and labor market outcomes at the individual level. This impact would be seen through two channels in life‐earning profiles: (a) a higher probability of school completion which, to a great extent, determines lifetime earnings and type of employment, and (b) higher labor productivity growth, using labor earnings as a proxy for labor productivity. In addition, as public schools are able to offer better learning conditions and the capacity to absorb and integrate disadvantaged Jordanians and refugees, the gap in learning outcomes between the disadvantaged and the non‐disadvantaged would be reduced. The net effect of the Program on beneficiaries has been estimated using a present discounted value (PDV) approach. This approach entails estimating the stream of benefits and costs of better schooling over the lifetime of a representative student with and without the Program. According to the analysis, the Program interventions are expected to yield a PDV of incremental benefits of JOD 679.0 (US$957.0) per final beneficiary student (in 2017 JOD) (see details in Annex 7). 64. The World Bank adds value by providing technical knowledge, operational and implementation experience, and convening power in the areas of recruitment and training of teachers, student assessment, ECE, and decentralized school management. Program expenditure 65. The MOE budget represents the strategic objectives of the Ministry, with a total 2017 allocation of JOD 874.0 million (see table 4). Out of these, ECE was allocated JOD4.5 million, basic education JOD 687.8 million and secondary education JOD 97.1 million (tables 4‐7).
23 Barro, R. 2001. Human Capital and Economic Growth. The American Economic Review, Vol. 91 (2), pp. 12‐17 and OECD. 2010. The High Cost of Low Educational Performance: The Long‐Run Economic Impact of Improving PISA Outcomes. Paris: Organization for Economic Co‐Operation and Development (OECD).

19
Table 4. 2017 MOE Budget – Distribution According to Program
Table 5. 2017 MOE Budget KG Education–4420
20
Table 6. 2017 MOE Budget Basic Education–4425
Table 7. 2017 MOE Budget Secondary Education–4430
66. The financing plan for the NESP includes two types of costs: operational plan costs and core costs. The core costs are based on the MOE budget allocations, while the operational plan corresponds to key activities that need to be undertaken to achieve the results of the NHRDS. The Government program is valued at US$7.3 billion, which includes US$6.0 billion as projections for MOE budget allocations from 2018–2022, as well as NESP Operational plan costs of US$1.30 billion (which are not already included in MOE budget allocations). Teacher salaries, wages, and allowances form a large share (US$5.1 billion, see table 9) of the core costs, leaving little room for the MOE to undertake transformational reforms that are required to meet the goals of the NHRDS. The GOJ must increase the overall Government budget by US$1.3 billion over the next five years to ensure that these reforms are undertaken.

21
Table 8. Government program and PforR 1. Total NESP Operational Plan (without TVET)
2.Of Which Already Included in Core Costs
3.Op Plan w/o Core Costs (1‐2)
4.Core Costs
5.Total Govt Program (3+4)
Total Government program (US$b) 2.59 1.28 1.30 6.04 7.34
Total PforR (US$ million)
134.00 566.00 700.00
Table 9. Teacher Salaries 2017–2022
Teacher Salaries KG (JOD million) 19.74
Teacher Salaries Basic (JOD million) 3200.00
Teacher Salaries Secondary (JOD million) 360.00
Salaries Total (JOD billion) 3.58
Salaries Total (US$ billion) 5.05
67. The PforR Program is valued at US$700.0 million of the larger US$7.3 billion government program and includes key activities of the NESP that focus on access for ECE and quality for both ECE and basic education. The expenditure framework consists of the MOE budget core costs corresponding to the Result Areas of the Program under KG, basic education, and secondary education, as well as NESP operational plan costs of activities that are critical for achieving program results. 68. The expenditure framework indicates that US$114.0 million is required for Result Area 1, US$113.0 million for Result Area 2, US$98.0 million for Result Area 3, and US$375.0 million for Result Area 4 (US$700.0 million in total). Within Result Area 1, the Program focuses on expansion of ECE and major expenditures include expansion costs (construction, vouchers, awareness campaigns) as well as salaries for KG teachers. For Result Area 2, expenditures related to teacher training, school maintenance, and establishing a safe and motivating learning environment contribute to the Program costs. For Result Area 3, the General Secondary School Examination and activities for the reform of student assessments are included. Finally, Result Area 4 includes the overall MOE Administration and Support Services Program of the budget (see table 4, line 4401) which aims to improve the administrative capacities in the Ministry's headquarters and education directorates and improve management efficiency. The basic and secondary teacher salaries while being part of the Government program are outside of the Program boundary since the Program Result Areas do not cover compensation reforms. Other costs excluded from the PforR include capital and current expenditures under basic and secondary education that are outside the scope of the Program and are in most cases being supported by the wider donor community.24 The Program Expenditures are detailed in table 10. 69. Of the US$700.0 million, existing MOE budget allocations cover US$566.0 million, while an additional allocation of US$134.0 million will be required for the new initiatives under the Program. It is expected that the MoE budget will be increased over the next five years to ensure adequate resources are available to achieve Program results. Given that the NESP lays out comprehensive plans for Quality Assurance and expansion of ECE, and training, evaluation and certification for K–12 teachers, the current budget allocations are not sufficient to implement these reforms.
24 Including construction of basic and secondary education classrooms, developing school e‐linkages, Queen Rania Teacher Academy and Award for Excellence and school feeding and the MOE budget programs of Social, Sports and Educational Activities–4410, Special Education–4415.

22
Table 10. Program Expenditures
Result Area (RA)/Theme
Category Source Estimated Cost/ Year
Total Cost JOD (‘18‐‘22)
Total Cost US$
Total US$m
Comments Additional Required
RA 1 ‐ ECE
MOE Current Expenditures
KG Salaries, Wages & Allowances
MOE budget line 4420 ‐ 601 (indicative 2019)
3,137,000 15,685,000 22,115,850 22.12 Adequate MOE allocation
MOE Capital Expenditures
Expansion in access to KG
MOE estimates (includes MOE 4420 ‐002 indicative 2019 $21.8m)
55,000,000 77,550,000 77.56 US$77 million estimated, US$21 million allocated
56
NESP Domain 1 ‐ KG
Quality Assurance & Accreditation
NESP 2.1.1 ‐ 2.1.4, 2.3.1 (aligned with MOE 512)
379,000 1,895,000 2,671,950 2.67 New activity, no existing allocation
3
NESP Domain 1 ‐ KG
Qualification Improv.: Teacher Training
NESP 2.6 (to be assigned to MOE 512)
1,446,000 7,230,000 10,194,300 10.19 KG training against new QA, allocation needed
10
Sector Plan Domain 1 ‐ KG
M&E for KG new QA NESP 2.7 (assigned to 4401‐601)
219,000 1,095,000 1,543,950 1.54 No existing allocation 2
RA total 114
RA 2 ‐ Quality Basic Educ.
MOE Capital Expenditure
Maintaining and repairing basic education buildings
MOE budget line 4425‐004 (Indicative 2019)
4,000,000 20,000,000 28,200,000 28.2 MOE allocation is adequate
MOE Capital Expenditure
Teacher Training MOE estimate (50m) includes MOE 512 (2,985,000*5=14,925,000)
50,000,000 70,500,000 70.5 Teacher Training aligned with new teacher standards, allocation not adequate
49
Sector Plan ‐ Domain 4
Safe and Motivating School Environment
NESP 5.1.1,5.3.1 + MOE estimates for new program
10,052,156 14,173,540 14.17 Additional Allocation 14
RA total 113
RA 3 ‐ Assessments
Sector Plan ‐ Domain 4
Assessments (Studies, capacity building, institutionalization) (to be aligned to MOE 512)
NESP 1.1.1,1.2.1,1.7.1,1.8.1
314,000 442,740 0.442 New reform, allocation required
0.44
MOE Capital Expenditure
General Secondary School Examination
MOE 4430‐602 (indicative 2017)
13,845,000 69,225,000 97,607,250 97.61 Existing allocation
RA total 98
RA 4 ‐ System Strength.
MOE 4401 Cap and Current
Ministry's management
MOE 4401 (includes EMIS, gender sensitization)
53,171,000 265,855,000 374,855,550 374.86 Existing allocation
RA total 375
MOE PforR Program 700 134

23
Financial sustainability and funding predictability 70. Budget execution appears to be free of major problems and the outlook for the sector economy and public finances leads to the anticipation that the Program will be sustainable. Since 2012 the percentage gap between budget provision and total expenditure has ranged between ‐11 percent and 18 percent for KG, ‐2 percent and 1 percent for basic education and ‐4 percent and 8 percent for secondary education (tables 11–13). Even in years when budget increases were sharp, the expenditure reflected the rise (such as in 2013). This reflects on the positive utilization capacity of MOE and its ability to absorb allocated budget amounts, even when there have been significant increases in budget from one year to another.
Table 11. Budget Provision and Total Expenditure: MOE Budget Line 4420–Kindergarten
2012 2013 2014 2015 2016
Budget provision (US$, millions) 3,730,000 5,694,000 5,469,250 5,484,000 5,142,000
Total expenditure (US$, millions) 3,377,979 4,693,458 6,080,779 5,098,324 5,135,361
Gap ‐ budget and expenditure 352,021 1,000,542 ‐611,529 385,676 6,639
% 9% 18% ‐11% 7% 0.1%
Table 12. Budget Provision and Total Expenditure: MOE Budget Line 4425–Basic Education
2012 2013 2014 2015 2016
Budget provision (US$, millions) 597,011,000 661,646,000 687,790,250 694,685,500 713,166,500
Total expenditure (US$, millions) 590,393,837 657,026,257 695,392,533 709,684,472 708,624,976
Gap ‐ budget and expenditure 6,617,163 4,619,743 ‐7,602,283 ‐14,998,972 4,541,524
% 1% 1% ‐1% ‐2% 1%
Table 13. Budget Provision and Total Expenditure: MOE Budget Line 4430–Secondary Education
2012 2013 2014 2015 2016
Budget provision (US$, millions) 86,130,100 98,355,000 100,928,250 97,045,000 111,594,000
Total expenditure (US$, millions) 84,067,087 95,449,872 104,842,958 96,322,459 102,777,179
Gap ‐ budget and expenditure 2,063,013 2,905,128 ‐3,914,708 722,541 8,816,821
% 2% 3% ‐4% 1% 8%
24
B. Fiduciary
71. A Fiduciary System Assessment (FSA) of the World Bank‐financed operation was conducted in accordance with the World Bank’s policy on PforR financing. The FSA considered whether the Program systems provide reasonable assurance that the financing proceeds will be used for the intended purposes, with due attention to the principles of economy, efficiency, effectiveness, transparency, and accountability. The scope of the FSA covered the Program Institutional Framework, and fiduciary management and procurement capacity, as well as implementation performance, institutions, and systems responsible for anticorruption aspects within the Program. Findings from the assessment, as well as a review of existing analytical and diagnostic work, conclude that the overall fiduciary and governance framework provides reasonable assurance that the financing processes will be used for the intended purposes to support the implementation of the proposed PforR. The FSA concludes that the overall Program’s fiduciary framework is adequate to provide reasonable assurance, and the Program financing proceeds will be used for intended purposes, with due attention to the principles of economy, efficiency, effectiveness, transparency, and accountability. 72. The Program will follow the country’s public financial management (PFM) systems, in accordance with the World Bank’s Guidelines on Preventing and Combating Fraud and Corruption25 in Program‐for‐Results Financing. The World Bank funds will be transferred to the Treasury’s account at the Central Bank of Jordan (CBJ). The Ministry of Planning and International Cooperation (MOPIC) will be responsible for submitting withdrawal applications with the necessary supporting documents evidencing DLI achievements. 73. The overall fiduciary risk is rated Moderate. The main risks and corresponding mitigation measures are specified in the below. 74. Financial management risks for the Program were examined along different dimensions. The PFM cycle has four key stages: (a) planning and budgeting, (b) budget execution, (c) internal controls, and (d) auditing. The FSA focuses on assessing critical elements of the public finance management (PFM) cycle that are relevant to the PforR Program and the implementing agency. Key risks include the challenge of ensuring that Program proceeds reach the MOE and MOPWH. To address this, starting next fiscal year, budget line items will be included under each ministry’s annual budget. Other challenges involve strengthening the skills of the internal audit staff at the MOE and the MOPWH so that staff can produce quality audits as well as verify the quality of the external audit conducted by the Jordan Audit Bureau (AB). A consultant with public sector financial audit experience will be hired to support the Jordan AB in conducting the program’s financial audit in accordance with leading international standards. 75. The key procurement risks to development outcomes of the Program are: (1) difficulty in defining technical specifications (supplies and construction); (2) cumbersome procurement processing; (3) weak capacity for contract management and administration; (4) lack of independent complaint mechanisms, including clarity on how they are utilized; (5) lack of an integrated contract cycle from needs assessment to inventory up to the level of school unit; and (6) nonsystematic coordination and integration of procurement of works implemented centrally by MOPWH.
25 Anti‐Corruption Guidelines” are the Bank’s “Guidelines on Preventing and Combating Fraud and Corruption in Program‐for‐Results Financing,” dated February 1, 2012, and revised July 10, 2015.

25
76. The proposed procurement mitigations are: (1) revisions of technical specifications of regularly supplied goods and schools construction based on observed quality and entailed maintenance/replacement cost; (2) systematic integration of procurement processing and contract management; (3) creation/nomination of an independent complaint unit (for example, Ministry of Public Administration); and (4) systematic coordination and updates on procurement processing as well as contract management and forecasting with MOPWH. 77. Procurement exclusions. Any individual contract which is above the Operations Procurement Review Committee high risk projects thresholds should be excluded from the PforR Program. It is foreseen that no exclusion will be observed since all individual contracts under this PforR are deemed to be modest in relation to the overall Program and their estimated monetary value is equal to or less than 25 percent of the estimated total Program expenditures. Therefore, for ease of reference, the excluded contracts, if any, are of the following values: (a) works, estimated to cost US$50,000,000 equivalent or more per contract, (b) goods, estimated to cost US$30,000,000 equivalent or more per contract, (c) non‐consulting services, estimated to cost US$30,000,000 equivalent or more per contract, and (d) consulting services, estimated to cost US$15,000,000 equivalent or more per contract.
C. Environmental and Social
78. The assessment of the environmental and social risk level associated with the Program is Substantial. It is envisaged that the Program will not include any Category‐A type investments. While the use of Government land or swapping of land between ministries is a common practice, it is likely that it will be necessary to acquire land under the Program under Result Area 1. Land availability is a significant barrier to school expansion in Jordan; therefore, it will be necessary to introduce adequate screening systems to assess land availability, and provide technical support during implementation to ensure that land acquisition and compensation to potential project affected people follow the World Bank safeguards standards. Direct economic and social impacts could include loss of land, assets and income, access to assets or housing resulting in adverse impacts to livelihoods. Unless properly managed, involuntary resettlement may result in long‐term hardship and impoverishment for affected persons and communities, as well as social stress in areas to which they have been displaced. The Program Action Plan (PAP) includes procedures to make sure that adequate measures are taken to prevent negative impacts on physical cultural resources and natural protected areas. The Program will require that engineers or other MOE staff screen out construction of new schools on private land, as well as closely monitor cases that are categorized as Voluntary Land Donation (VLD) to ensure that the act of donation is undertaken without coercion, manipulation, or any form of pressure on those donating. Impacts on informal land users will also need to be addressed if these occur. 79. The broader social risks associated with the Program, particularly in Result Area 2, are deemed Moderate. These broader, contextual and political risks have not been caused by the Program or contributed to the risks. However, if not mitigated, they may exacerbate the risks related to inclusion and access. These include: violence in schools (various forms), gender biases in school curriculum, inadequate support to children with disabilities and special needs, vulnerability and psychological distress among poor Jordanians and Syrian refugees leading to negative coping strategies such as child labor, early marriage, and begging which may contribute to children dropping out. 80. The applicable federal and governorate environmental and social management systems in Jordan, from a legal, regulatory, and institutional perspective, are considered to be generally
26
appropriate and comprehensive. Therefore, no significant changes to the overall structure of these management systems are required or proposed. However, enforcement of the legal framework governing compliance on child protection, labor, and environmental standards is weak.
81. It is proposed that Jordan’s environmental and social management systems will be enhanced by: (a) strengthening the capacity of the MOE in land acquisition processes through recruitment of staff, development of standard procedures aligned with World Bank standards and training, (b) implementing a socioemotional learning program to improve school environment and minimize violence, (c) updating of Jordan school construction standards to emphasize design alternatives with low‐to‐no maintenance costs, (d) piloting of private sector contracts for school operations and maintenance, and (e) enhancing the capacity of MOE staff and respective partners to mainstream gender in teacher training (KG–12 grade), and processing of constructing and maintaining schools.
82. Gender assessment. Gender inequalities and gaps in the educational system are qualitative in nature. Gender issues within the education system are multifaceted and integral to the Ministry’s overall operation. Enrollment rates in primary education for girls and boys are almost equal. However, the learning environment, curricula, teaching methods, physical environment, and management systems continue to reinforce the socially ascribed and stereotyped gender roles. Differences in the education system are visible in enrollment rates in secondary school, as well as in the performance and achievement of girls, boys, and their teachers. Girls achieve better results than boys. In addition, boys’ dropout rates in secondary school are higher than girls’ rates. Inadequate teacher accountability and qualification, lack of ownership of learning process, and a focus on rote learning have contributed to disengaging the students, both girls and boys, from the learning process. Violence toward students and among students (bullying), especially boys, is yet another factor that leads to low attainment and drop out. In rural areas drop out is also associated with the distance of secondary schools from student homes. In addition, economic fragility and increased inflation have led families to encourage—or force—children to leave school and as a result, rates of child labor, early marriages, and violence have increased. 83. To minimize and mitigate these risks, the Program will contribute to strengthening MOE’s Gender Unit by mainstreaming gender through various activities including: (1) investing in training and certification of teachers on gender‐specific modules; (2) introducing a socioemotional learning intervention which will, among others, address issues of gender‐based violence and discrimination, integrating gender considerations and specificities in handling cases of violence; (3) capacity building for the gender unit; and (4) tailoring student assessments to analyze for potential differences in attainment and performance of girls and boys.
84. Grievance redress. Communities and individuals who believe that they are adversely affected as a result of a World Bank supported PforR operation, as defined by the applicable policy and procedures, may submit complaints to the existing program grievance redress mechanism or the World Bank’s Grievance Redress Service (GRS). The GRS ensures that complaints received are promptly reviewed in order to address pertinent concerns. Affected communities and individuals may submit their complaint to the World Bank’s independent Inspection Panel, which determines whether harm occurred, or could occur, as a result of World Bank noncompliance with its policies and procedures. Complaints may be submitted at any time after concerns have been brought directly to the World Bank’s attention, and World Bank Management has been given an opportunity to respond. For information on how to submit complaints to the World Bank’s corporate Grievance Redress

27
Service (GRS), please visit http://www.worldbank.org/GRS. For information on how to submit complaints to the World Bank Inspection Panel, please visit www.inspectionpanel.org.
D. Risk Assessment
85. The overall risk of the proposed operation is rated as Substantial. 86. Macroeconomic risks are Substantial. The ongoing projected growth in the youth population and the external shocks to the system as a result of displaced Syrians seeking safety in Jordan have the potential to amplify opportunities or intensify challenges. So far, the GOJ has demonstrated an ability to manage these shocks. The macroeconomic stability objective is supported by several programs and donors, including a US$723 million extended arrangement under the Extended Fund Facility approved by the IMF Executive Board in August 2016. 87. Sector strategies and policies risk is Substantial. A key risk to the success of the Program includes insufficient funding of MOE’s budget to implement the interventions that are needed to achieve the education reform. The Program will include a DLI to ensure that the funds that will be transferred to MOE reflects its annual budget needs to achieve the Program results, thereby mitigating this risk. 88. The institutional capacity for implementation and sustainability risk is High. It relates to the ambitious goals of the education reform that the Program will support: the NESP seeks to introduce major changes in the Jordan education system, which include a reform of the student assessment and examination systems, in particular the Tawjihi. This has been a sensitive and long‐lasting issue that, without any doubt, will face major resistance from within and beyond the education sector. However, the time to tackle this reform has certainly arrived in Jordan, given the mounting evidence of how costly the Tawjihi has become to Jordanian society and economy. In addition, the GOJ is highly committed to embark on a major transformation of the examination and the key policy makers have it as a top priority. The proposed World Bank‐financed operation will include—through its TA component—a set of targeted interventions to ensure proper guidance during the preparation and implementation of the reform. 89. The combined social and environmental risks are Substantial. The risks for both social and environmental aspects are described in details under section “C. Environmental and Social” and are considered Substantial. While it is envisaged that the Program will not include any Category‐A type investments, it is possible that the Government will acquire land to achieve KG2 enrollment targets under the Program’s Result Area 1. Therefore, specific actions as proposed in the PAP. The Program will not pose any risk to natural habitats or physical cultural resources. Only Result Area 1 will have some environmental impact as it includes construction of new classrooms. The other Result Areas consist of activities related to the educational system and the provision of computers. The risk mitigation measures are described in the section above.
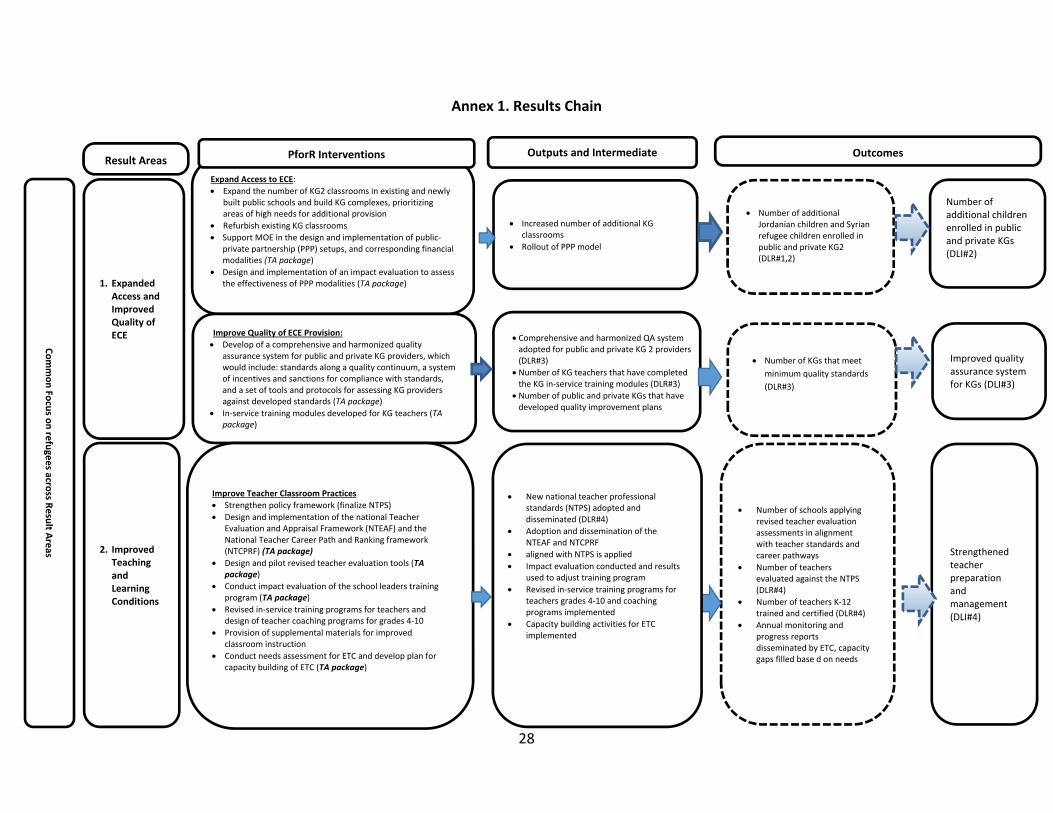
28
Annex 1. Results Chain
Increased number of additional KG classrooms
Rollout of PPP model
Expand Access to ECE:
Expand the number of KG2 classrooms in existing and newly built public schools and build KG complexes, prioritizing areas of high needs for additional provision
Refurbish existing KG classrooms
Support MOE in the design and implementation of public‐private partnership (PPP) setups, and corresponding financial modalities (TA package)
Design and implementation of an impact evaluation to assess the effectiveness of PPP modalities (TA package)
Result Areas PforR Interventions Outputs and Intermediate Outcomes
2. Improved Teaching and Learning Conditions
Number of additional children enrolled in public and private KGs (DLI#2)
Improve Quality of ECE Provision:
Develop of a comprehensive and harmonized quality assurance system for public and private KG providers, which would include: standards along a quality continuum, a system of incentives and sanctions for compliance with standards, and a set of tools and protocols for assessing KG providers against developed standards (TA package)
In‐service training modules developed for KG teachers (TA package)
Comprehensive and harmonized QA system adopted for public and private KG 2 providers (DLR#3)
Number of KG teachers that have completed the KG in‐service training modules (DLR#3)
Number of public and private KGs that have developed quality improvement plans
Number of KGs that meet
minimum quality standards
(DLR#3)
1. Expanded Access and Improved Quality of ECE
Number of additional
Jordanian children and Syrian refugee children enrolled in public and private KG2 (DLR#1,2)
Improved quality assurance system for KGs (DLI#3)
Strengthened teacher preparation and management (DLI#4)
Improve Teacher Classroom Practices
Strengthen policy framework (finalize NTPS)
Design and implementation of the national Teacher Evaluation and Appraisal Framework (NTEAF) and the National Teacher Career Path and Ranking framework (NTCPRF) (TA package)
Design and pilot revised teacher evaluation tools (TA package)
Conduct impact evaluation of the school leaders training program (TA package)
Revised in‐service training programs for teachers and design of teacher coaching programs for grades 4‐10
Provision of supplemental materials for improved classroom instruction
Conduct needs assessment for ETC and develop plan for capacity building of ETC (TA package)
Number of schools applying revised teacher evaluation assessments in alignment with teacher standards and career pathways
Number of teachers evaluated against the NTPS (DLR#4)
Number of teachers K‐12 trained and certified (DLR#4)
Annual monitoring and progress reports disseminated by ETC, capacity gaps filled base d on needs
New national teacher professional standards (NTPS) adopted and disseminated (DLR#4)
Adoption and dissemination of the NTEAF and NTCPRF
aligned with NTPS is applied
Impact evaluation conducted and results used to adjust training program
Revised in‐service training programs for teachers grades 4‐10 and coaching programs implemented
Capacity building activities for ETC implemented
Common Fo
cus o
n re
fuge
es acro
ss Result A
reas

29
Schools using maintenance and upkeep budget (DLI#6)
Improved physical environment (DLI#6)
Improved maintenance system adopted (DLR#6)
Improve School Environment
Support the set‐up of a new maintenance system
National assessment strategy developed
and adopted (DLR#7)
Grade 3 diagnostic test on early grade reading and math implemented (DLR#7)
Strengthen Student Assessment System
Development of a strategic plan of Jordan’s learning assessment system for the next 10‐15 years (TA package)
Strengthen the research and development function of the Department of Examinations (TA package)
Support the design and implementation of the first phase of the Tawjihi reform of the exam, including changes in secondary certification and university admission (TA package)
Result Area PforR Interventions Outputs and Intermediate Outcomes Outcomes
4. Strengthen Education Management System
Improved Student Assessment System (DLI#7)
Strengthen Management of Education System
Data systems software and hardware upgrade
Capacity building for use of data for evidence‐informed policy making
Annual planning and budgeting
3. Reformed Student Assessment and Certification System
First phase of Tawjihi reform completed and action plan for reform rollout is produced (DLR#7)
Reform of the Tawjihi is fully implemented so that its secondary graduation and certification function is separated from its function as a screening mechanism for university entrance (DLR#7)
Timely and adequate resources and tools are available to the Program
Strengthened Management Education System (DLI#8)
Geographical Information System (GIS) operational and updated with latest data (DLR#8)
Approved annual budget increased to meet PforR Program needs (DLR#8)
2. Improved Teaching and Learning Conditions (continued)
Improve School Climate
Develop and program interventions for improving socioemotional learning in schools with high proportion of Syrian refugees
Program for improving socio‐emotional learning completed (DLR#5)
Proportion of schools with high number of Syrian refugees implementing the socioemotional learning program (DLR# 5)
Reduction in number of reports of school disruption in targeted schools
Improved school climate (DLI#5)
Common Fo
cus o
n re
fuge
es acro
ss Result A
reas

30
PDO Indicators by Objectives / Outcomes DLI # CRI Unit of Measure
Baseline End
Target Frequency Data Source
Definition and Methodology for Data Collection
Expanded access to quality early childhood education
PDO Indicator #1: Number of Jordanian children and Syrian refugee children enrolled in KG2, disaggregated by nationality, gender and type of school 2
No
Number
80,000
110,000
Annually
MOE (OpenEMIS)
Site visits and spot checks in a sample of randomly selected schools to verify enrollment numbers
Improved Teaching and Learning Environment
PDO Indicator #2: Percentage point reduction in the dropout rate of Syrian refugees, disaggregated by gender
No % 0 5 Annually MOE (OpenEMIS)
PDO Indicator #3: Number of teachers evaluated against the new National Teacher Professional Standards (NTPS) who meet the minimum performance standards
4.3
No
Number
0
5,000
Annually
MOE
The verification agency will verify teacher evaluation records
Reformed student assessment and certification system
PDO Indicator #4: First phase of Tawjihi reform completed 7.3
No Yes/No No Yes Annually MOE Review of Tawjihi exam
Annex 2. Results Framework Matrix

31
Intermediate Results Indicators by Result Areas DLI # CRI Unit of Measure
Baseline End
Target Frequency
Data Source
Definition and Methodology for Data Collection
Expanded access and improved quality of early childhood education
Indicator 1.1: In‐service training modules developed for KG teachers
No Yes/No No Yes Annually MOE
Indicator 1.2: Percentage of public KG teachers that have completed the in‐service training modules
3.3
No Number 0 100% Annually MOE (ETC)
Successful completion of the training will be verified through reviewing training records
Indicator 1.3: Number of public and private KGs that have developed and implemented quality improvement plans
No Number 0 400 Annually MOE
Indicator 1.4 Public‐private partnership (PPP) setup designed and implementation plan for PPP rollout developed
No Yes/No No Yes Annually MOE
Improved teaching and learning environment
Indicator 2.1: Improved maintenance system adopted
6.1
No Yes/No No Yes Annually MOE Review of maintenance system document and operating procedures produced and adopted by MOE
Indicator 2.2: Number of K‐12 teachers trained and certified 4.4
No Number 0 50,000 Annually MOE The verification agency will verify training records for teachers' training
Indicator 2.3: Percentage of schools with high proportion of Syrian refugees implementing the socioemotional learning program
5.2
No Percentage 0 70% Annually MOE Schools with a high proportion of Syrian refugees are schools where Syrian refugee students represent 30 percent or more of the student body.
School visits to document the implementation of the socioemotional learning intervention in schools
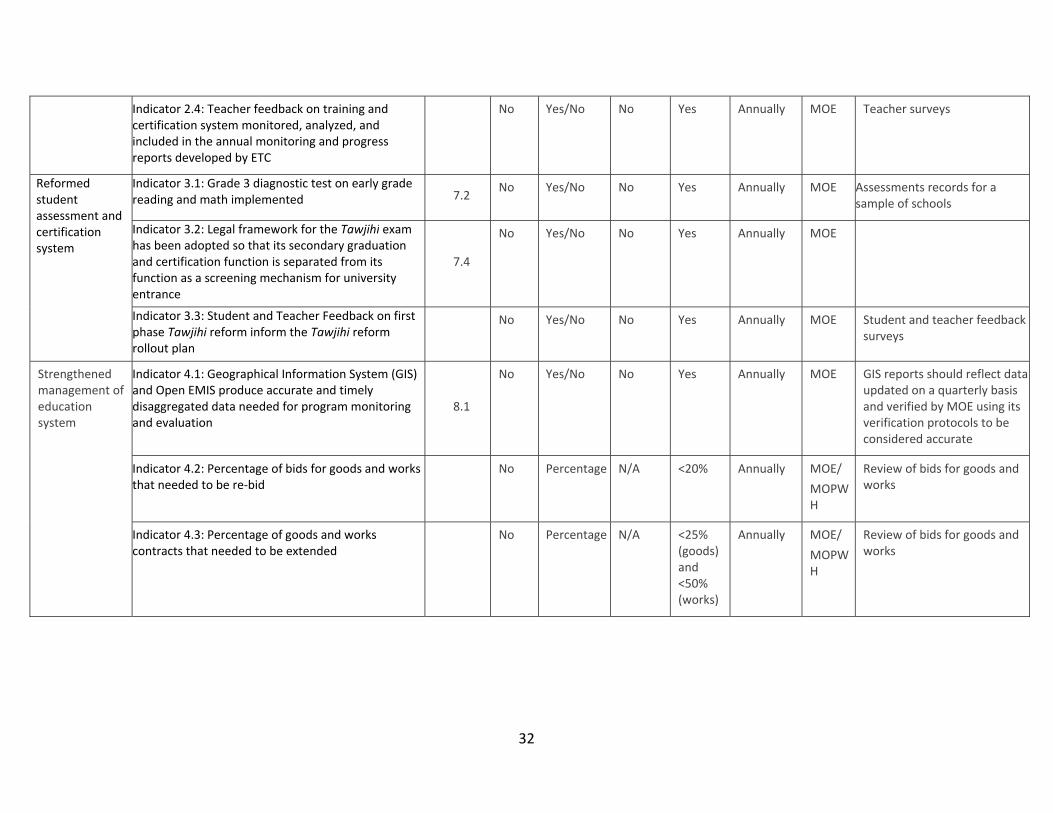
32
Indicator 2.4: Teacher feedback on training and certification system monitored, analyzed, and included in the annual monitoring and progress reports developed by ETC
No Yes/No No Yes Annually MOE Teacher surveys
Reformed student assessment and certification system
Indicator 3.1: Grade 3 diagnostic test on early grade reading and math implemented 7.2
No Yes/No No Yes Annually MOE Assessments records for a sample of schools
Indicator 3.2: Legal framework for the Tawjihi exam has been adopted so that its secondary graduation and certification function is separated from its function as a screening mechanism for university entrance
7.4
No Yes/No No Yes Annually MOE
Indicator 3.3: Student and Teacher Feedback on first phase Tawjihi reform inform the Tawjihi reform rollout plan
No Yes/No No Yes Annually MOE Student and teacher feedback
surveys
Strengthened management of education system
Indicator 4.1: Geographical Information System (GIS) and Open EMIS produce accurate and timely disaggregated data needed for program monitoring and evaluation
8.1
No Yes/No No Yes Annually MOE GIS reports should reflect data updated on a quarterly basis and verified by MOE using its verification protocols to be considered accurate
Indicator 4.2: Percentage of bids for goods and works that needed to be re‐bid
No Percentage N/A <20% Annually MOE/
MOPWH
Review of bids for goods and works
Indicator 4.3: Percentage of goods and works contracts that needed to be extended
No Percentage N/A <25% (goods) and <50% (works)
Annually MOE/
MOPWH
Review of bids for goods and works

33
Annex 3. Disbursement Linked Indicators, Disbursement Arrangements and Verification Protocols
Table A3.1. Disbursement Linked Indicators Matrix
DLI Y1 Y2 Y3 Y4 Y5 Total
DLI#1 Number of Syrian refugee children enrolled in Target Schools
160,000 refugees (of which 10,000 enrolled in KG2)
Baseline Unity of Measure (UoM): Number 125,000 Syrian refugee children enrolled in Target Schools (2,500 refugees enrolled in Target Schools at KG2 level)
Allocation 15 (avg 3/year) + 5 (avg 1/year) 20
DLI#2 Number of additional children enrolled in public and private KG2
30,000 additional children in KG2
Baseline UoM: Number 80,000 children
Allocation 15 (avg 3/year) 15
DLI#3 Improved quality assurance system for KG2 schools
Comprehensive and harmonized quality assurance system adopted for public and private KG2 schools
80% of KG2 schools assessed through the newly established quality assurance system
95% of public KG2 teachers have completed the KG in‐service training modules
25% of KG2 schools that have improved quality as per the quality assurance system
Baseline UoM: Yes/No, % No 0% 0% 0%
Allocation 4 8 (3,3,2) 8 7 27
DLI#4 Strengthened teacher preparation and management
New national teacher professional standards adopted and disseminated
Teacher evaluation framework adopted
5,000 teachers evaluated against the National Teacher Professional Standards (NTPS)
30,000 K‐12 teachers trained and certified
Baseline UoM: Yes/No, Number No No 0 0
Allocation 6 6 7 15 (7,8) 34

34
DLI Y1 Y2 Y3 Y4 Y5 Total
DLI#5 Improved school climate in schools with high proportion of Syrian refugee children
School program for improving student socioemotional learning designed and tested in schools
70% of schools with high proportion of Syrian refugee children implementing the socioemotional learning program
Baseline UoM: Yes/No, % No 0%
Allocation 4 4 8
DLI#6 Improved physical environment
Improved maintenance system adopted
Legal framework approved for allowing transfer of school‐level maintenance and upkeep budget to schools
3,000 schools using a maintenance and upkeep budget
Baseline UoM: Yes/No, Number No No 0
Allocation 5 5
2
12
DLI#7 Improved student assessment system
National assessment strategy adopted
Grade 3 diagnostic test on early grade reading and math implemented in all target schools
First phase of Tawjihi reform completed and action plan for reform rollout is produced
Legal framework for reform of the Tawjihi Exam has been adopted so that its secondary graduation and certification function is separated from its function as a screening mechanism for university entrance
Baseline UoM: Yes/No No No No No
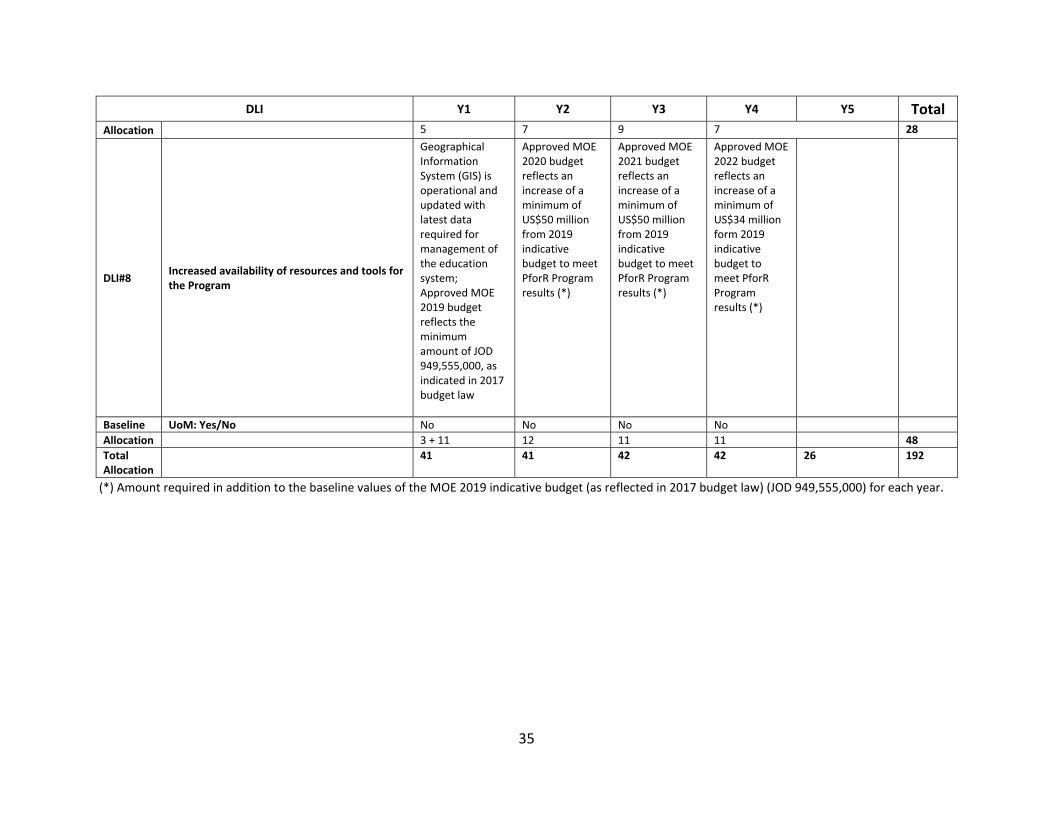
35
DLI Y1 Y2 Y3 Y4 Y5 Total Allocation 5 7 9 7 28
DLI#8 Increased availability of resources and tools for the Program
Geographical Information System (GIS) is operational and updated with latest data required for management of the education system; Approved MOE 2019 budget reflects the minimum amount of JOD 949,555,000, as indicated in 2017 budget law
Approved MOE 2020 budget reflects an increase of a minimum of US$50 million from 2019 indicative budget to meet PforR Program results (*)
Approved MOE 2021 budget reflects an increase of a minimum of US$50 million from 2019 indicative budget to meet PforR Program results (*)
Approved MOE 2022 budget reflects an increase of a minimum of US$34 million form 2019 indicative budget to meet PforR Program results (*)
Baseline UoM: Yes/No No No No No
Allocation 3 + 11 12 11 11 48
Total Allocation
41 41 42 42 26 192
(*) Amount required in addition to the baseline values of the MOE 2019 indicative budget (as reflected in 2017 budget law) (JOD 949,555,000) for each year.
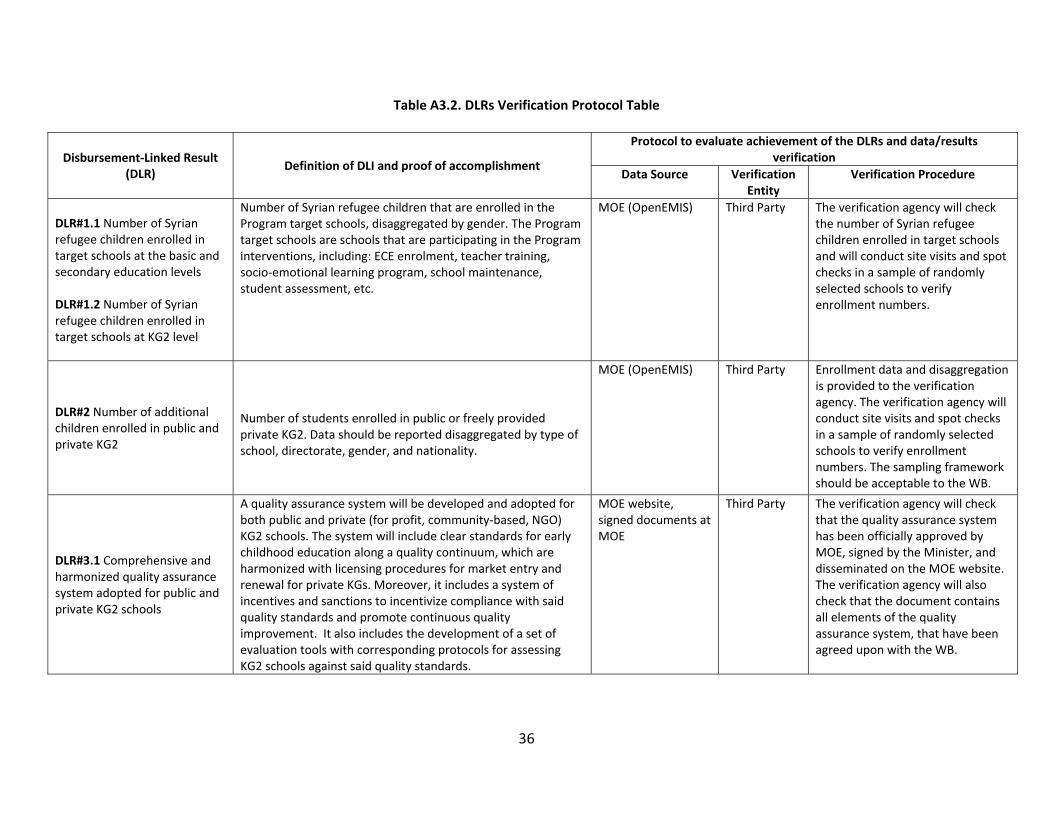
36
Table A3.2. DLRs Verification Protocol Table
Disbursement‐Linked Result (DLR)
Definition of DLI and proof of accomplishment
Protocol to evaluate achievement of the DLRs and data/results verification
Data Source Verification Entity
Verification Procedure
DLR#1.1 Number of Syrian refugee children enrolled in target schools at the basic and secondary education levels DLR#1.2 Number of Syrian refugee children enrolled in target schools at KG2 level
Number of Syrian refugee children that are enrolled in the Program target schools, disaggregated by gender. The Program target schools are schools that are participating in the Program interventions, including: ECE enrolment, teacher training, socio‐emotional learning program, school maintenance, student assessment, etc.
MOE (OpenEMIS) Third Party The verification agency will check the number of Syrian refugee children enrolled in target schools and will conduct site visits and spot checks in a sample of randomly selected schools to verify enrollment numbers.
DLR#2 Number of additional children enrolled in public and private KG2
Number of students enrolled in public or freely provided private KG2. Data should be reported disaggregated by type of school, directorate, gender, and nationality.
MOE (OpenEMIS) Third Party Enrollment data and disaggregation is provided to the verification agency. The verification agency will conduct site visits and spot checks in a sample of randomly selected schools to verify enrollment numbers. The sampling framework should be acceptable to the WB.
DLR#3.1 Comprehensive and harmonized quality assurance system adopted for public and private KG2 schools
A quality assurance system will be developed and adopted for both public and private (for profit, community‐based, NGO) KG2 schools. The system will include clear standards for early childhood education along a quality continuum, which are harmonized with licensing procedures for market entry and renewal for private KGs. Moreover, it includes a system of incentives and sanctions to incentivize compliance with said quality standards and promote continuous quality improvement. It also includes the development of a set of evaluation tools with corresponding protocols for assessing KG2 schools against said quality standards.
MOE website, signed documents at MOE
Third Party The verification agency will check that the quality assurance system has been officially approved by MOE, signed by the Minister, and disseminated on the MOE website. The verification agency will also check that the document contains all elements of the quality assurance system, that have been agreed upon with the WB.

37
Disbursement‐Linked Result (DLR)
Definition of DLI and proof of accomplishment
Protocol to evaluate achievement of the DLRs and data/results verification
Data Source Verification Entity
Verification Procedure
DLR#3.2 Percentage of KG2 schools assessed through the newly established quality assurance system
The quality assurance system will include a set of evaluation tools and protocols to asses KGs against the quality standards. Assessment of KGs includes site visits to administer the evaluation tools following the corresponding protocols. The score of the assessments will be made publicly available.
Quality reports for all KG2 schools
Third Party The verification agency will verify the assessment scores for KGs on the MOE website and ensure completion of the evaluation tools. The assessment procedure and methodology will be agreed upon with the WB.
DLR#3.3 Percentage of public KG2 teachers that have completed the KG in‐service training modules
KG in‐service modules will be developed through technical assistance from the WB.
MOE training records
Third Party The verification agency will verify successful completion of the training through reviewing training records. It will also conduct interviews to a sample of randomly selected KG teachers to verify completion of training. The sampling framework and training modules should be acceptable to the WB.
DLR#3.4 Percentage of KG2 schools that have improved quality as per the quality assessment system
The quality assurance system will include the development of standards that allow assessing KGs along a quality continuum. This continuum should include, at minimum, the following quality classification levels:
‐ Inadequate quality: KGs that do not meet minimum quality standards
‐ Minimum quality: KGs that meet minimum quality standards
‐ Good quality: KGs that perform above minimum quality standards
Improved quality is defined as the movement to at least one higher level in the KG school quality classification continuum. A quality report needs to be produced for each school detailing the classification justification as per the quality assurance system.
Quality reports for all KG2 schools
Third Party The verification agency will review the quality reports for all KG2 schools at baseline and endline. It will also conduct spot checks in a sample of randomly selected KG2 schools from those that have improved quality as per the quality assurance system to verify endline quality classification levels. The sampling framework should be acceptable to the WB.

38
Disbursement‐Linked Result (DLR)
Definition of DLI and proof of accomplishment
Protocol to evaluate achievement of the DLRs and data/results verification
Data Source Verification Entity
Verification Procedure
DLR# 4.1 New national teacher professional standards (NTPS) adopted and disseminated
National teacher professional standards are adopted by the steering committee for central planning, published on MOE's website, and disseminated to the field directorates and schools. 2‐day awareness sessions for teachers will take place in a cascade approach.
MOE website, signed documents at MOE
Third Party The verification agency will check that the national teacher professional standards have been adopted, signed, and published on MOE's website.
DLR# 4.2 Teacher evaluation framework adopted and disseminated
MOE will design and adopt a National Teacher Evaluation and Appraisal Framework (NTEAF), which will include teacher evaluation tools based on the national teacher professional standards (NTPS).
MOE website, signed documents at MOE
Third Party The verification agency will check that the teacher evaluation framework has been adopted, signed, and published on MOE's website.
DLR #4.3 Number of newly appointed teachers evaluated against the National Teacher Professional Standards (NTPS) using the teacher evaluation framework
The National Teacher Evaluation and Appraisal Framework (NTEAF) aims to evaluate teacher performance and to provide feedback to teachers, teacher training institutes and MOE supervisors. MOE will then evaluate teachers against this framework to identify teacher professional development needs and to determine teachers’ placement on the career path (certification level). Data should be disaggregated by gender.
MOE Teacher evaluation records
Third Party The verification agency will verify teacher evaluation records.
DLR#4.4. Number of K‐12 teachers trained and certified
In‐service training for grade 4 to 10 teachers to be delivered with the aim of aligning teacher skills and competencies with the new Teacher Standards. The training would also place emphasis on the application of targeted instruction strategies and the use of student assessments (formative and summative). Instructional support materials, whether paper or technology based, that are closely aligned with the curriculum and that teachers will be trained on, will be introduced as supplementary means for fostering improved teaching practices. Successful completion of the training by the awarding of a teacher certificate will serve as the verification means. Data should be disaggregated by gender.
MOE Training and certification records
Third Party The verification agency will verify training records for teachers' training and will check teacher certification records. The certification mechanism will need to be compliant with the requirements agreed upon with the WB as specified in the Program Operations Manual.

39
Disbursement‐Linked Result (DLR)
Definition of DLI and proof of accomplishment
Protocol to evaluate achievement of the DLRs and data/results verification
Data Source Verification Entity
Verification Procedure
DLR#5.1 School program for improving student socioemotional learning designed and tested in schools
The program would promote socio‐emotional learning in schools with 30 percent or more Syrian refugee students and where there is a prevalence for violence and disruptive behavior (to be determined post‐assessment in Year 1). The intervention will include community, school and classroom supports in the form of trainings, management and institutional strengthening, outreach, and one‐on‐one targeted aid.
Implementation report
Third Party The verification agency checks the pilot implementation report of the intervention.
DLR#5.2 Percentage of schools with high proportion of Syrian refugee children implementing the socioemotional learning program
Schools with high proportion of Syrian refugee children have 30 percent or more Syrian refugee children. Implementation plans from schools, and mid‐term program evaluation assessing project progress and impact.
School records/evaluation reports
Third Party The verification agency conducts school visits to document the implementation of the socioemotional learning intervention in schools.
DLR#6.1 Improved maintenance system adopted
MOE updates and adopts an improved maintenance system, which includes preventive and corrective maintenance. The maintenance system needs to be approved by MOE, in addition to all relevant standard operating procedures, which need to be issued, including decisions about the structure of the maintenance units and their committees and decisions for training to staff and school‐level actors on the maintenance system.
Maintenance system document and operating procedures
Third Party The verification agency will review the maintenance system document and operating procedures produced and adopted by MOE.
DLR#6.2 Legal framework approved for allowing transfer of school‐level maintenance and upkeep budget to schools
MOE approves a mechanism including standard operating procedures for transfer of a maintenance and upkeep budget to schools.
Standard operating procedures for budget mechanism
Third Party The verification agency will review the standard operating procedures for budget mechanism and ensure that they have been approved and adopted by MOE.
DLR#6.3 Number of schools that are using a maintenance and upkeep budget
Number of schools that have disbursed at least once from the newly established maintenance and upkeep budget to conduct eligible maintenance and upkeep activities as per the maintenance system adopted by MOE.
Schools budget and invoices
Third Party The verification agency will conduct school visits on a sample of schools to review school‐level budgets and check that schools are disbursing from this budget.
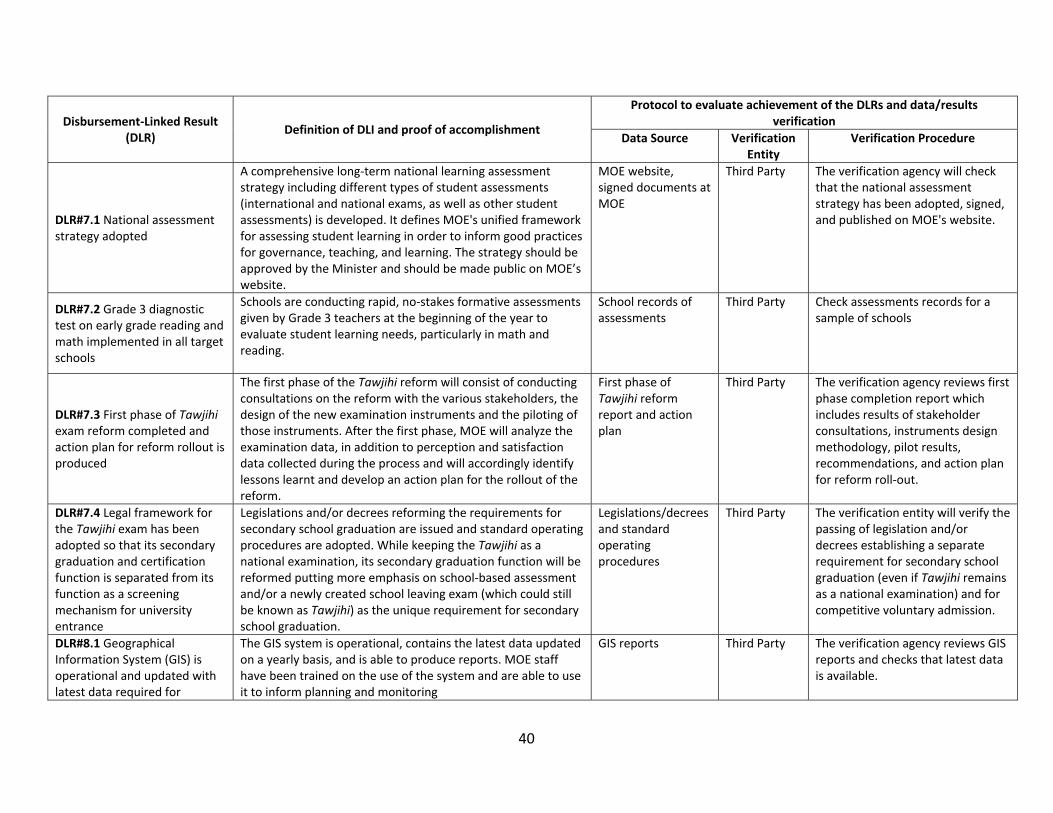
40
Disbursement‐Linked Result (DLR)
Definition of DLI and proof of accomplishment
Protocol to evaluate achievement of the DLRs and data/results verification
Data Source Verification Entity
Verification Procedure
DLR#7.1 National assessment strategy adopted
A comprehensive long‐term national learning assessment strategy including different types of student assessments (international and national exams, as well as other student assessments) is developed. It defines MOE's unified framework for assessing student learning in order to inform good practices for governance, teaching, and learning. The strategy should be approved by the Minister and should be made public on MOE’s website.
MOE website, signed documents at MOE
Third Party The verification agency will check that the national assessment strategy has been adopted, signed, and published on MOE's website.
DLR#7.2 Grade 3 diagnostic test on early grade reading and math implemented in all target schools
Schools are conducting rapid, no‐stakes formative assessments given by Grade 3 teachers at the beginning of the year to evaluate student learning needs, particularly in math and reading.
School records of assessments
Third Party Check assessments records for a sample of schools
DLR#7.3 First phase of Tawjihi exam reform completed and action plan for reform rollout is produced
The first phase of the Tawjihi reform will consist of conducting consultations on the reform with the various stakeholders, the design of the new examination instruments and the piloting of those instruments. After the first phase, MOE will analyze the examination data, in addition to perception and satisfaction data collected during the process and will accordingly identify lessons learnt and develop an action plan for the rollout of the reform.
First phase of Tawjihi reform report and action plan
Third Party The verification agency reviews first phase completion report which includes results of stakeholder consultations, instruments design methodology, pilot results, recommendations, and action plan for reform roll‐out.
DLR#7.4 Legal framework for the Tawjihi exam has been adopted so that its secondary graduation and certification function is separated from its function as a screening mechanism for university entrance
Legislations and/or decrees reforming the requirements for secondary school graduation are issued and standard operating procedures are adopted. While keeping the Tawjihi as a national examination, its secondary graduation function will be reformed putting more emphasis on school‐based assessment and/or a newly created school leaving exam (which could still be known as Tawjihi) as the unique requirement for secondary school graduation.
Legislations/decrees and standard operating procedures
Third Party The verification entity will verify the passing of legislation and/or decrees establishing a separate requirement for secondary school graduation (even if Tawjihi remains as a national examination) and for competitive voluntary admission.
DLR#8.1 Geographical Information System (GIS) is operational and updated with latest data required for
The GIS system is operational, contains the latest data updated on a yearly basis, and is able to produce reports. MOE staff have been trained on the use of the system and are able to use it to inform planning and monitoring
GIS reports Third Party The verification agency reviews GIS reports and checks that latest data is available.

41
Disbursement‐Linked Result (DLR)
Definition of DLI and proof of accomplishment
Protocol to evaluate achievement of the DLRs and data/results verification
Data Source Verification Entity
Verification Procedure
management of the education system
DLR#8.2 Approved annual MOE budget reflects an increase of US$134 million for the Program
On an annual basis, MOE updates its expenditure framework and the Ministry of Finance approves the following:
Approved MOE 2019 budget reflects the minimum amount of JOD 949,555,000 as indicated in 2017 budget law;
Approved MOE 2020 budget reflects an increase of a minimum of US$50 million based on the 2019 indicative budget (as reflected in the 2017 budget law) of JOD 945,555,000
Approved MOE 2021 budget reflects an increase of a minimum of US$50 million based on the 2019 indicative budget (as reflected in the 2017 budget law) of JOD 945,555,000
Approved MOE 2022 budget reflects an increase of a minimum of US$34 million based on the 2019 indicative budget (as reflected in the 2017 budget law) of JOD 945,555,000
MOE expenditure framework and MOF approved annual budget
Jordan Audit Bureau
The verification agency reviews MOE's budget and checks that the intended additionality from the baseline is reflected.

42
Table A3.3. DLRs Disbursement Tables
Disbursement‐Linked Result (DLR) Allocated Amount (US$m)
Disbursements Scalability
Disbursements Formula
DLR#1.1 Number of Syrian refugee children enrolled in target schools at the basic and secondary education levels
15 Scalable
Starting AY18, US$100,000 for every 1000 Syrian refugee children enrolled in Target Schools at the basic and secondary education level in each AY, up to a maximum of US$3,000,000 in each AY. For each subsequent AY, the number of students enrolled in the previous year against which the Bank disbursed under this DLR 1.1 is subtracted.
DLR#1.2 Number of Syrian refugee children enrolled in target schools at KG2 level
5 Scalable
From a baseline of 2,500, US$50,000 for every 100 additional students in each AY, starting in AY 2018, up to the allocated amount. For each subsequent AY, the number of students enrolled in the previous year against which the Bank disbursed under this DLR 1.2 is subtracted.
DLR#2 Number of additional children enrolled in public and private KG2
15 Scalable
From a Baseline of 80,000, US$50,000 for every 100 additional students enrolled in each AY, starting in AY 2018, up to the allocated amount. For each subsequent AY, the number of students enrolled in the previous year against which the Bank disbursed under this DLR 2 is subtracted.
DLR#3.1 Comprehensive and harmonized quality assurance system adopted for public and private KG2 schools
4 Non‐scalable US$4,000,000 by Closing Date.
DLR#3.2 Percentage of KG2 schools assessed through the newly established quality assurance system
8 Non‐scalable
For 30% of KG2 schools assessed, US$3,000,000; for 60% of KG2 schools assessed, additional US$3,000,0000; for 80% of KG2 schools assessed, the remaining balance of US$2,000,000.
DLR#3.3 Percentage of public KG2 teachers that have completed the KG in‐service training modules
8 Scalable
From a Baseline of 0, for every one (1) percentage point increase in percentage of KG2 teachers completing the KG in‐service training modules pre‐agreed by the WB, US$85,000, up to a maximum of US$8,000,000. For each subsequent AY, the percentage point increase in the previous years against which the Bank disbursed under this DLR 3.3 is subtracted.
DLR#3.4 Percentage of KG2 schools that have improved quality as per the quality assurance system
7 Non‐Scalable For 25 percent (%) of schools with improved quality, US$7,000,000 by Closing Date.
DLR#4.1 New National Teacher Professional Standards (NTPS) adopted and disseminated
6 Non‐scalable US$6,000,000 by Closing Date.
DLR#4.2 Teacher evaluation framework adopted and disseminated
6 Non‐scalable US$6,000,000 by Closing Date.
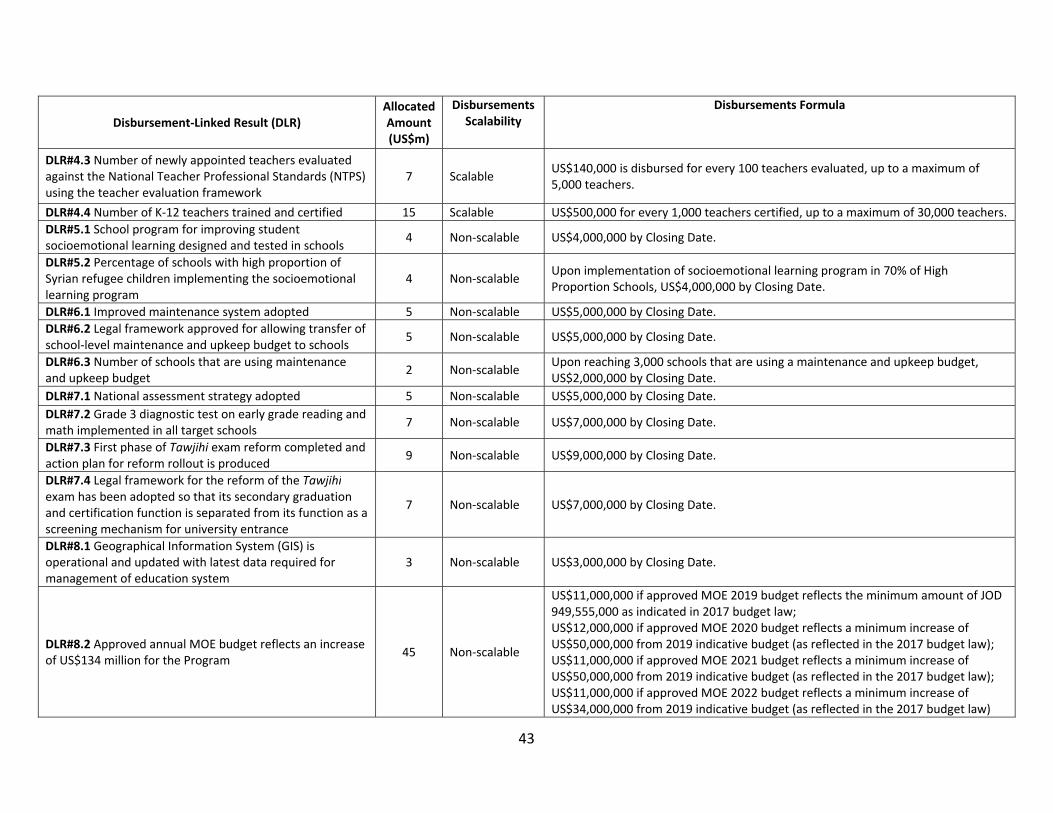
43
Disbursement‐Linked Result (DLR) Allocated Amount (US$m)
Disbursements Scalability
Disbursements Formula
DLR#4.3 Number of newly appointed teachers evaluated against the National Teacher Professional Standards (NTPS) using the teacher evaluation framework
7 Scalable US$140,000 is disbursed for every 100 teachers evaluated, up to a maximum of 5,000 teachers.
DLR#4.4 Number of K‐12 teachers trained and certified 15 Scalable US$500,000 for every 1,000 teachers certified, up to a maximum of 30,000 teachers.
DLR#5.1 School program for improving student socioemotional learning designed and tested in schools
4 Non‐scalable US$4,000,000 by Closing Date.
DLR#5.2 Percentage of schools with high proportion of Syrian refugee children implementing the socioemotional learning program
4 Non‐scalable Upon implementation of socioemotional learning program in 70% of High Proportion Schools, US$4,000,000 by Closing Date.
DLR#6.1 Improved maintenance system adopted 5 Non‐scalable US$5,000,000 by Closing Date.
DLR#6.2 Legal framework approved for allowing transfer of school‐level maintenance and upkeep budget to schools
5 Non‐scalable US$5,000,000 by Closing Date.
DLR#6.3 Number of schools that are using maintenance and upkeep budget
2 Non‐scalable Upon reaching 3,000 schools that are using a maintenance and upkeep budget, US$2,000,000 by Closing Date.
DLR#7.1 National assessment strategy adopted 5 Non‐scalable US$5,000,000 by Closing Date.
DLR#7.2 Grade 3 diagnostic test on early grade reading and math implemented in all target schools
7 Non‐scalable US$7,000,000 by Closing Date.
DLR#7.3 First phase of Tawjihi exam reform completed and action plan for reform rollout is produced
9 Non‐scalable US$9,000,000 by Closing Date.
DLR#7.4 Legal framework for the reform of the Tawjihi exam has been adopted so that its secondary graduation and certification function is separated from its function as a screening mechanism for university entrance
7 Non‐scalable US$7,000,000 by Closing Date.
DLR#8.1 Geographical Information System (GIS) is operational and updated with latest data required for management of education system
3 Non‐scalable US$3,000,000 by Closing Date.
DLR#8.2 Approved annual MOE budget reflects an increase of US$134 million for the Program
45 Non‐scalable
US$11,000,000 if approved MOE 2019 budget reflects the minimum amount of JOD 949,555,000 as indicated in 2017 budget law; US$12,000,000 if approved MOE 2020 budget reflects a minimum increase of US$50,000,000 from 2019 indicative budget (as reflected in the 2017 budget law); US$11,000,000 if approved MOE 2021 budget reflects a minimum increase of US$50,000,000 from 2019 indicative budget (as reflected in the 2017 budget law); US$11,000,000 if approved MOE 2022 budget reflects a minimum increase of US$34,000,000 from 2019 indicative budget (as reflected in the 2017 budget law)

44
Annex 4. Systematic Operations Risk Rating (SORT)
HASHEMITE KINDOM OF JORDAN – EDUCATION REFORM PROGRAM
.
Systematic Operations Risk‐Rating Tool (SORT)
Risk Category Rating (H, S, M, L)
1. Political and Governance M
2. Macroeconomic S
3. Sector Strategies and Policies S
4. Technical Design of Program M
5. Institutional Capacity for Implementation and Sustainability H
6. Fiduciary M
7. Environment and Social S
8. Stakeholders M
OVERALL S

45
Annex 5. Program Action Plan
Action Description DLI#* Responsibility Recurrent Frequency Due Date Completion Measurement**
M&E
Complete and verify baselines for the PforR Program indicators
MOE Once No later than March 31, 2018
Procurement
Establish an integrated system which captures procurement/contract cycle (Goods, Works, Consultants)
MOE/ MOPWH
Once (in two phases)
Phase 1: one year after project effectiveness Phase 2
‐ MOE: Integration of works and supplies departments level is completed. ‐ MOE: Integration (covering MOE departments, governorates, up to school levels) is completed to align with OpenEMIS deployment timeline. ‐ MOPWH: Integration of procurement, contract management and finance departments is completed and generating reports. ‐MOE and MOPWH: Systematic reports reflecting performance indicators of procurement processing and contract management.
Systematic Reporting for constructions activities, between MOE and MOPWH
MOE/ MOPWH
Recurrent ‐ Systematic sharing of MOE Annual procurement plans, Procurement plans updates. ‐ Systematic MOPWH reporting on contract management including payments and expected variations.
Environmental and Social Safeguards
Environmental and Social Standard Operating Procedures and Guidelines including different measures to bridge identified gaps, adopted.
MOE 3 months after effectiveness
Environmental and Social Standard Operating Procedures adopted.
Systematically integrating gender mainstreaming efforts
MOE (1) By year 3
(1) Education Training Center trainers trained on

46
Action Description DLI#* Responsibility Recurrent Frequency Due Date Completion Measurement**
into MOE activities through: (1) enhancing the capacity of MOE staff and respective partners to mainstream gender in program activities (e.g. teacher training, school construction and maintenance); (2) reducing gender biases and stereotypes in teacher trainings, (3) developing gender‐sensitive guidelines for classroom management, and (4) supporting teachers to provide a safe learning environment for girls and boys.
(2) By year 2 (3) By year 5 (4) By year 3
highlighting and addressing gender issues in the delivered curricula. (2) Three teacher training courses are sensitized from a gender perspective
by the MOE staff. Guidelines to address gender issues in classrooms introduced to 70% of teachers of whom 60% are female teachers. At least 60% of teachers of grades 1‐3 have participated in discussions and or trainings that address safe learning environment.

47
Annex 6. IPF Component
Result Area Estimated Cost
(in ‘000 US$)
Activity
Result Area 1: Expanded Access and Improved Quality of ECE
Expanded access to ECE
650.0 Expanding access of KG
Design of public‐private partnership (PPP) setup and development of plan for PPP rollout (*)
Impact evaluation to assess the effectiveness of the PPP modalities
Improved quality of ECE provision
750.0 Improving teaching practices in KG classrooms
Study on teaching practices in public and private KG classrooms
Development of in‐service training modules for KG teachers focusing on strengthening specific teaching practices identified through the study
Training of relevant MOE staff on recently developed in‐service teacher training modules
500.0 Enhancing quality assurance system for KGs
Development of a quality assurance system for public and private KG providers, which would include: standards along a quality continuum, a system of incentives and sanctions for compliance with standards, a set of tools and protocols for assessing KG providers against developed standards, and an instrument to measure child development outcomes
Training of relevant MOE staff on new quality assurance system, tools and protocols
Result Area 2: Improved Teaching and Learning Conditions
120.0 TA to design National Teacher Policy and Strategy Framework
120.0 Teacher career path
350.0 TA to design and pilot new teacher evaluation tools, including analysis of pilot results and finalization of evaluation tool design
200.0 Design and pilot grade 4‐12 teacher training program that aim to improve teacher instructional and classroom management practices (ensuring gender sensitivity)
745.0 Impact evaluation of the school leader’s training program
400.0 Capacity building of ETC
Improved School Climate
1,200.0 Socioemotional learning interventions (needs assessment for socioemotional learning program (SEL), including: (1) design of SEL models and implementation plan, (3) design of pre‐pilot and impact evaluation, (4) data collection and analysis of results, (5) analysis and finalization of study, (6) design of teaching and learning materials (sensitive to gender and abuse type); (7) design of training for principals and teachers (sensitive to gender and abuse type); and, (7) communication outreach plan

48
Result Area 3: Reformed Student Assessment and Certification System
Strengthened student assessment systems
350.0 Development of a strategic plan of Jordan’s learning assessment system for the next 10‐15 years
Strengthen the research and development function of the Department of Examinations
600.0 TA to support the design and implementation of the first phase of the Tawjihi reform of the exam, including changes in secondary certification and university admission. Key steps in this first phase would be: (1) to define evaluation criteria, key competencies to be evaluated for each upper secondary education track/stream, examination procedures, etc.; (2) consultation process with key stakeholders on the changes proposed (universities, teachers and principals, districts, families civil society, employers); (3) Alternative legal and administrative frameworks for the secondary graduation function; (4) Empirical validation of instruments and procedures; (5) carry out a predictive study following a cohort of students to check if the new admission exam and related policies has better predictive capacity of success in tertiary education; (6) communications strategy for the Tawjihi reforms
Result Area 4: Strengthened Management of Education System Total 35.0 Support the Audit Bureau in conducting the program’s financial
audit in accordance with leading international standards (recruitment of an experienced consultant with public sector financial audit)
250.0 TA to support the implementation of the MOE communications strategy on the outreach and awareness raising elements targeting the poor on: (1) access to education, (2) benefits of schooling for girls and boys, (2) development of a mobile app to monitor and report school environment, (3) demystification of the impediments for Syrian refugees to register in schools, and (4) Tawjihi reform
150.0 TA to strengthen MOE’s capacity on land acquisition and assessments (environment and social safeguards) via: (1) the development of standard operating procedures and guidelines (i.e., social impact assessments, consultations, grievance redress, land compensation and handling resettlement), (2) training and capacity building to existing staff, new staff, and related staff), (3) establishing grievance redress mechanism to handle complaints with land acquisition and resettlement, and (4) strengthening M&E in this area
180.0 TA to strengthen the capacity of the Gender Unit in gender mainstreaming
400.0 TA to assess procurement and contract management systems at MOE and MOPWH and recommend integration (**)
1,000 Recruitment of IVA TOTAL 8,000.0
49
(*) Design of public‐private partnership (PPP) setup and development of plan for PPP rollout: The MOE has set an annual target of enrolling 7,875 additional children into KG2, for the next five years. To achieve this target, the Ministry envisages an unprecedented expansion in both public and private provision. With respect to public provision, the MOE estimates that 3,550 additional children could be served every year, by refurbishing existing classrooms, constructing KG extensions in existing and newly built schools, and building KG complexes on available Government land. Even after exhausting public spaces and land, the MOE estimates that 55 percent of the KG2 enrolment target would remain unmet, motivating the Ministry to seek for PPP to fill the gap. The MOE has requested the Bank’s support in identifying a PPP modality that would allow for a rapid expansion in access, especially to the most disadvantaged and underserved areas, while ensuring adequate quality of service. In response to this, the Program includes a multi‐year technical assistance package on PPPs. In year 1, the TA will support the Government in the design of a PPP modality, such as a tuition waiver program or a targeted vouchers program that can best serve the context of Jordan. In years 2‐3, the TA will assist the MOE in the development of an implementation plan for rolling out the PPP modality. An impact evaluation will also be embedded in the design of the PPP requiring data collection at both baseline (year 2) and endline (year 5). (**) TA activity for integration of procurement and financial systems at MOE and MOPWH Context and Systems Assessment The fiduciary assessment recommends integration of the automation at both the MOE and the MOPWH to enhance administrative procurement performance, contract management and reporting. At the MOE, the level of automation of procurement management is satisfactory at the Department of Supplies, and has the following elements: (i) inventory‐ Oracle backbone, (ii) technical specifications, (iii) taxonomies (i.e., coding/classification of supplies) using United Nations Standard Products and Services Code (UNSPSC), and (iv) procurement business management. However, at the Department of Building and Projects (MOE), automation is less developed. In parallel, the MOPWH is conducting an effort of automation (already initiated) covering e‐procurement). Ultimately, the MOE will need to be ready to use e‐procurement in a couple of years, once it is tested by MOPWH. Meanwhile to enhance the current level of coordination and automation, and for greater preparedness for the future e‐procurement deployment, MOE and MOPWH will explore respectively a consolidation of their different internal systems into an integrated platform, as detailed below: a/ Procurement Basics:
‐ e‐Registration system: to manage the users and the rights ‐ Searching system: flexible search ‐ e‐Procurement Plan system: Publication of procurement plan and consolidation with budget
allocation ‐ e‐Publishing/Notification system: Publication of contract awards and allowing a stand‐still period
for receiving complaints, if any. ‐ Non‐functional aspects: compatibility, scalability, etc.
b/ Advanced Procurement:
‐ Contract Management system: Acceptance, payments, variations, duration, penalties, etc. ‐ Vendor Management system: Registrations of the vendors; Past performance; Connection to e‐
Government if possible‐taxes clearance, MOF, etc.

50
‐ Business Intelligence Reporting & Dashboard system: for auditing purposes, and monitoring/ reporting on procurement/contract management, producing indicators of performance, efficiency, etc.
‐ Inventory/ putting orders: escalate the current governorate warehouse level to the level of the school unit.
Contract administration: The MOE and the MOPWH are expected to mitigate the frequently observed time overrun (and extensions) of contracts. Quality control is to be put in place for solid supervision and verification of deliverables. With respect to cost overrun, MOE contract administration was found acceptable while the MOPWH will need to consolidate its financial contract management in terms of anticipation of variations and execution of works. Both institutions observe frequent time overruns, needing contract extensions. Quality control prior to acceptance is to be enforced. Coordination of procurement and contract management between the MOE and the MOPWH is to be seriously tackled at all levels. Close coordination should be at all stages: (1) planning of activities: the MOE needs to send annual procurement plans and updates to the MOPWH, (2) execution of works: the MOPWH needs to report on progress to enable MOE equipping and furnishing delivered to schools timely, (3) contract payments and variations: MOPWH reporting should include an accurate payment scheme to include potential variations. Disbursements Arrangements
1. The TA component will be managed by the DCU, housed at the MOE, that has extensive prior
experience with WB‐financed operations as a result of the implementation of ERfKE I and ERfKE II. The Financial Officer (FO) of the DCU will be following on the TA’s FM and disbursement activities.
2. The same accounting system used for the closed ERfKE II will be used to capture the TA financial transactions. Semiannual Interim un‐audited financial reports (IFRs) will be submitted by the DCU to the Bank. The IFRs will include the following statements: (i) Statement of sources and uses of funds, indicating sources of funds received and TA expenditures, showing semimanual, yearly and cumulative balances; and (ii) DA reconciliation statements reconciling period‐opening and end balances; and iii) Statement of TA commitments, i.e., the unpaid balances under the TA’s signed contracts. All TA‐related invoices in the MOE, whether for advance payments or for expenses incurred, will be subject to the Government applicable controls and procedures which stipulate the following process: (a) invoices and supporting documents are received by the DCU and then the Finance Officer, and checked technically by the relevant DCU staff; (b) invoices are checked for their accuracy, eligibility and validate of payment before the Finance Officer prepares a payment voucher; (c) the internal auditor performs an ex‐ante compliance check regarding the expenditure’s compliance with the financial by laws; (d) the MOF Controller checks the accuracy of the payment voucher against the financial by laws, signs and stamps the payment voucher; (e) once approved, the expenditure is recorded in the accounting books of the MOE; and (f) finally, the Finance Officer prepares a check. 3. A Designated Account (DA) will be opened at the CBJ in US Dollars and will be managed by the DCU. Disbursements under the TA component will be made primarily as reimbursements on the basis of Statement of Expenditures (SOEs). The proceeds of the Loan will be disbursed in accordance with the Bank's disbursement guidelines. Transaction based disbursement will be used under this TA. Accordingly, requests for payments from the Loan account will be initiated through the use of withdrawal applications (WAs) either for Direct Payments, Reimbursements, Replenishments to the

51
DAs, or Issuance of Special Commitments. All WAs will include appropriate supporting documentation, including detailed SOEs for reimbursements and replenishments to the DA. Authorized signatories, names and corresponding specimens of their signatures will be submitted to the Bank prior to the receipt of the first replenishment application. 4. The TA annual financial statements will be audited by the Jordan Audit Bureau (AB). The audit report and opinion will cover the TA’s financial statements, reconciliation and use of the Designated Account (DA), use of direct payments, and withdrawals based on SOEs. In addition, the AB is required to prepare a “management letter” identifying any observations, comments and deficiencies in the system and controls that the auditor considers pertinent, and shall provide recommendations for their improvements. An experienced consultant with public sector financial audit will be hired to support the AB in conducting the Program’s financial audit in accordance with leading international standards.
Procurement Management
5. The implementation of the Program’s procurement will be handled by the MOE. The compilation of reports and monitoring of progress will be the responsibility of the MOE.
Ministry of Education: Unlike other ministries housing procurement under the Financial Department, the MOE has established a separate Directorate for Procurement of Supplies (including selection of consultants). It is composed of the following: Technical Specifications and Costing, established in 2006 (5 engineers and technical people), an International Projects Department, including the coordinators of bids (10 staff), and a Monitoring Department which is also handling procurement of consultants (6 staff). The overall yearly procurement envelope carried out by the MOE is JD7 million (US$10 million) funded by the government budget and JD 14 million (US$20 million) by international funding.
Special Tender Committee (STC): The mandate of the current STC at the MOE shall have its mandate extended to cover the TA. The STC shall be operational after project effectiveness and will handle procurement processed by the MOE related to consultant services.
6. Risk rating is substantial: The MOE has proven its capacity in implementing projects and processing procurement of supplies. However, for the current TA, the key procurement risks identified are inherent to (i) the MOE’s technical capacity in selecting consultants and managing their contracts, (ii) inefficient bureaucratic procurement processing, (iii) national market capabilities in responding to the requirements of sophisticated assignments, and (iv) appetite of the international market to compete for relatively small contracts.
7. Mitigation measures: To mitigate the above risks, the MOE needs to implement the following measures: (i) increase technical resources within the evaluation committees, (ii) use the Bank template for selections and contracts, (iii) target the local market for activities that are within the area of expertise of the local firms, (iv) advertise internationally the activities even for small amounts, (v) include in the assignments’ scope capacity building of MOE staff, and (vi) rely on the technical expertise of the Bank to review and support the terms of reference (TORs) and the deliverables.
8. The overall project risk for procurement remains Substantial until implementation of the mitigation measures has taken place.

52
B. Procurement Arrangements
9. Regulations. Procurement for the proposed TA of the IPF part will be carried out in accordance with the World Bank’s “Guidelines On Preventing and Combating Fraud and Corruption in Projects Financed by IBRD Loans and IDA Credits and Grants” dated October 15, 2006 and updated January 2011, and World Bank “Procurement regulations in Investment Project Financing‐ Goods, Works, Non‐Consulting and Consulting Services” dated July 2016.26 10. Consulting services. The TA will only finance consulting services (Firms and Individual Consultants) as per consultant selection methods specified in the guidelines. The Standard Request for Proposals as published on the World Bank website will be used. The project is expected to conduct: (a) National & International Quality Cost Based Selection (QCBS), (b) Fixed Budget Based Selection (FBS), (c) Least Cost Based Selection (LCS), (d) Quality Based Selection (QBS), (e) Consultant’s Qualification Based Selection (CQS), (f) Direct Selection (SSS), (g) Selection of individual consultants.
11. Operating Costs. The Loan will not finance operating costs expenditures.
12. Procurement Thresholds: As per the Substantial risk, and in line with Bank policies, Table 1 below defines the prior review thresholds, and Table 2 the threshold for procurement approaches and methods to be observed:
Table 1: “Bank Procedure in IPF, dated July 1, 2016” on:
Prior Review Thresholds for moderate contract risk (US$ million)
Table 2: “Bank Guidance, dated July 2016” on: Threshold for Procurement Approaches and Methods by country (US$ thousands)
13. STEP and procurement plan: At appraisal, the preliminary procurement plan providing the basis for the procurement methods was developed. Packaging of the activities was based on the information gathered on the private sector structure and absorption capacity. The DCU will maintain the Procurement Plan, and seeks the World Bank’s no objection to any changes. The estimated costs, prior review requirements, and timeframe have been agreed between the Borrower and the Bank in the Procurement Plan. In accordance with paragraph 5.9 of the “World Bank Procurement Regulations
26 These guidelines can be found on the World Bank website at: http://www.worldbank.org/en/projects‐operations/products‐and‐services/procurement‐projects‐programs.

53
for IPF Borrowers” (July 2016) (“Procurement Regulations”), the Bank’s Systematic Tracking and Exchanges in Procurement (STEP) system will be used to clear and update Procurement Plans and conduct all procurement exchanges for the Project. It will also be used as a repository of procurement documents for activities above and below the prior review thresholds. STEP will be used for publication of the procurement plan, notices, and contract award. Through STEP, the General Procurement Notice shall be published as well. A training will be administered for the different users of STEP. The procurement plan shall integrate the prior review thresholds associated with contract risks considered “Substantial”. 14. Staffing. The DCU will need an experienced procurement officer, to carry out the consultant selection process and communicate with the consultants. The procurement officer will rely on the expertise of the MOE for technical aspects of the selection process and contract management.
15. Procurement monitoring. The efficiency indicator related to procurement processing, and time used for evaluation shall be monitored. In addition to the desk support provided through enquiries and prior review, a supervision mission once every 6 months and a yearly post‐review of procurement actions will be carried out.
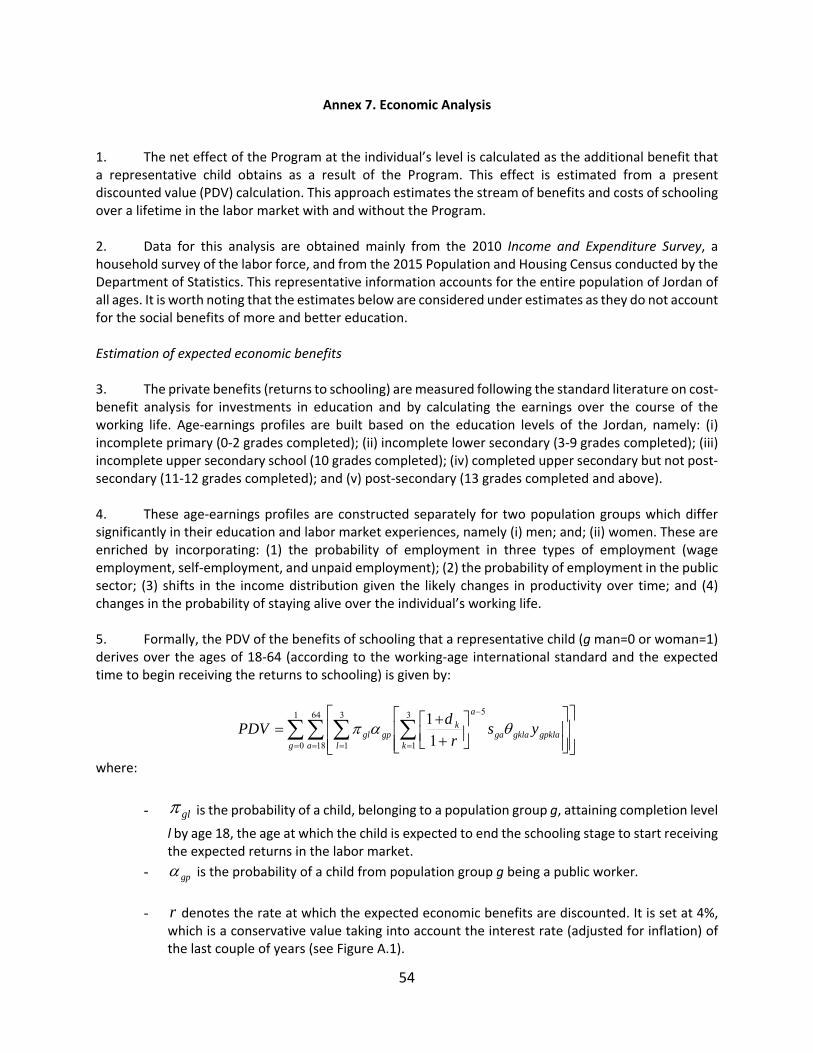
54
Annex 7. Economic Analysis
1. The net effect of the Program at the individual’s level is calculated as the additional benefit that a representative child obtains as a result of the Program. This effect is estimated from a present discounted value (PDV) calculation. This approach estimates the stream of benefits and costs of schooling over a lifetime in the labor market with and without the Program. 2. Data for this analysis are obtained mainly from the 2010 Income and Expenditure Survey, a household survey of the labor force, and from the 2015 Population and Housing Census conducted by the Department of Statistics. This representative information accounts for the entire population of Jordan of all ages. It is worth noting that the estimates below are considered under estimates as they do not account for the social benefits of more and better education. Estimation of expected economic benefits 3. The private benefits (returns to schooling) are measured following the standard literature on cost‐benefit analysis for investments in education and by calculating the earnings over the course of the working life. Age‐earnings profiles are built based on the education levels of the Jordan, namely: (i) incomplete primary (0‐2 grades completed); (ii) incomplete lower secondary (3‐9 grades completed); (iii) incomplete upper secondary school (10 grades completed); (iv) completed upper secondary but not post‐secondary (11‐12 grades completed); and (v) post‐secondary (13 grades completed and above). 4. These age‐earnings profiles are constructed separately for two population groups which differ significantly in their education and labor market experiences, namely (i) men; and; (ii) women. These are enriched by incorporating: (1) the probability of employment in three types of employment (wage employment, self‐employment, and unpaid employment); (2) the probability of employment in the public sector; (3) shifts in the income distribution given the likely changes in productivity over time; and (4) changes in the probability of staying alive over the individual’s working life. 5. Formally, the PDV of the benefits of schooling that a representative child (g man=0 or woman=1) derives over the ages of 18‐64 (according to the working‐age international standard and the expected time to begin receiving the returns to schooling) is given by:
1
0
64
18
3
1
3
1
5
1
1
g a l kgpklagklaga
a
kgpgl ys
r
dPDV
where:
- gl is the probability of a child, belonging to a population group g, attaining completion level
l by age 18, the age at which the child is expected to end the schooling stage to start receiving the expected returns in the labor market.
- gp is the probability of a child from population group g being a public worker.
- r denotes the rate at which the expected economic benefits are discounted. It is set at 4%,
which is a conservative value taking into account the interest rate (adjusted for inflation) of the last couple of years (see Figure A.1).
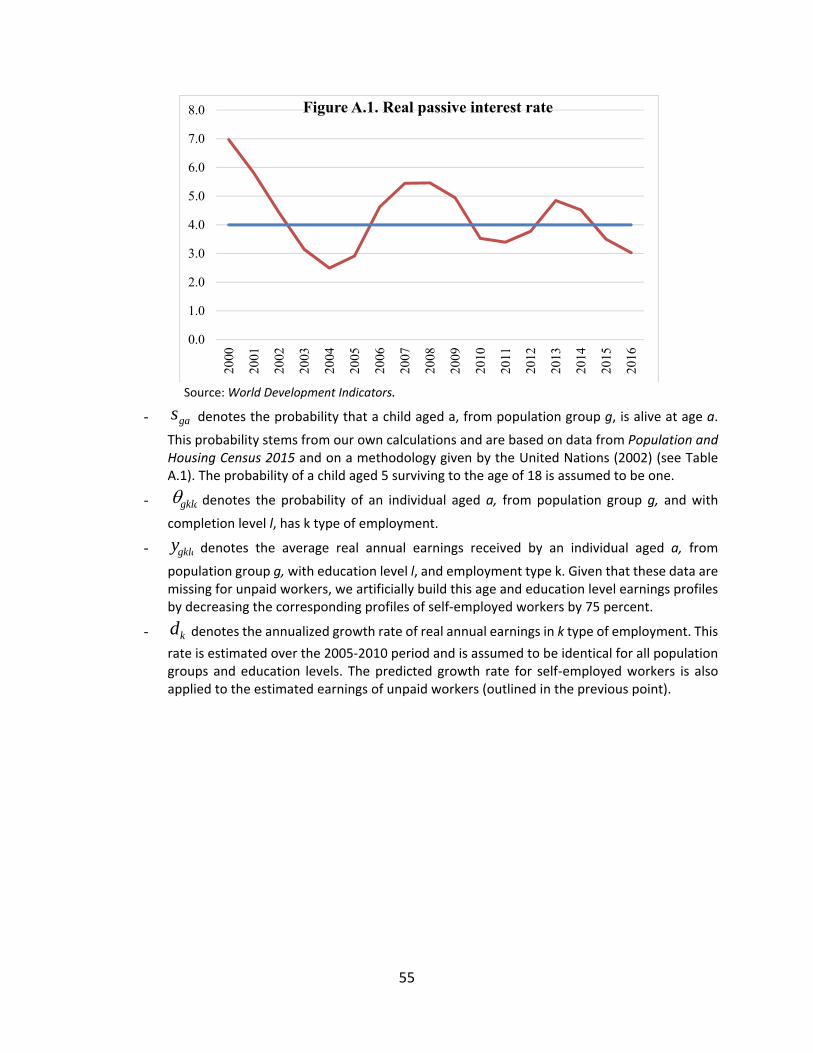
55
Source: World Development Indicators.
- gas denotes the probability that a child aged a, from population group g, is alive at age a.
This probability stems from our own calculations and are based on data from Population and Housing Census 2015 and on a methodology given by the United Nations (2002) (see Table A.1). The probability of a child aged 5 surviving to the age of 18 is assumed to be one.
- gkla denotes the probability of an individual aged a, from population group g, and with
completion level l, has k type of employment.
- gklay denotes the average real annual earnings received by an individual aged a, from
population group g, with education level l, and employment type k. Given that these data are missing for unpaid workers, we artificially build this age and education level earnings profiles by decreasing the corresponding profiles of self‐employed workers by 75 percent.
- kd denotes the annualized growth rate of real annual earnings in k type of employment. This
rate is estimated over the 2005‐2010 period and is assumed to be identical for all population groups and education levels. The predicted growth rate for self‐employed workers is also applied to the estimated earnings of unpaid workers (outlined in the previous point).
0.0
1.0
2.0
3.0
4.0
5.0
6.0
7.0
8.0
2000
2001
2002
2003
2004
2005
2006
2007
2008
2009
2010
2011
2012
2013
2014
2015
2016
Figure A.1. Real passive interest rate

56
Table A.1. Life statistics for Jordan, 2015
Age group
Adult‐Age specific death
rate Age
Probability of dying at age x
Probability of living at age x
Probability of living from age 15 to age x
Men Women x Men Women Men Women Men Women
(1) (2) (3) (4) (5) (6) (7) (8) (9)
15‐19 0.0006 0.0011 15 0.003 0.006 0.997 0.994 1.000 1.000
20‐24 0.0007 0.0016 20 0.003 0.008 0.997 0.992 0.997 0.994
25‐29 0.0007 0.0015 25 0.004 0.007 0.996 0.993 0.994 0.986
30‐34 0.0010 0.0019 30 0.005 0.009 0.995 0.991 0.990 0.979
35‐39 0.0012 0.0023 35 0.006 0.012 0.994 0.988 0.985 0.970
40‐44 0.0021 0.0039 40 0.011 0.020 0.989 0.980 0.979 0.958
45‐49 0.0030 0.0059 45 0.015 0.029 0.985 0.971 0.969 0.939
50‐54 0.0058 0.0109 50 0.029 0.055 0.971 0.945 0.954 0.909
55‐59 0.0081 0.0170 55 0.040 0.085 0.960 0.915 0.924 0.855
60‐64 0.0171 0.0304 60 0.086 0.152 0.914 0.848 0.884 0.770
Source: Own calculations based on the Population and Housing Census 2015 and following the methodology provided in United Nations (2002).
Estimation of expected economic costs 6. Estimating the expected economic costs basically entails predicting the direct and indirect cost of schooling at each education‐completion level. These costs include: (i) the household’s school‐related expenses; (ii) the Government’s spending on the education of each child; and (iii) the opportunity cost of schooling, i.e., the child’s forgone earnings. 7. The PDV of the expected economic costs that a representative child aged 5 incurs from going to school during the ages of 5 to 17 is given by:
1
018
17
3
1
6
62
16
6
3
1
6
61
1)1(
1
1)1(
1
g
a kgkagka
ak
pubpriag
a kgkagka
ak
pubpriag
EC
ydeer
ydeer
PDV
Where: ‐ The first and second terms are the expected costs of primary and secondary school completion, respectively. Based on the organization of the educational system in Jordan, the expected length of primary school completion is 10 years (basic education), and it is 2 years for secondary level completion. We assume that the costs of education for those who have not completed primary education is zero, given that the majority of those aged 18 and above without complete basic education have zero years of education. ‐
21 , are the probabilities that a child aged 18, from population group g, completes primary and
secondary school respectively.

57
‐ pubpri ee , denote the average real annual expenditure per student of the household (private) and the
Government (public) for a child aged a. Expenditure per student is assumed to be identical for all population given the data availability. Per student expenditure in 2017 is taken from Government statistics.
‐ gka denotes the probability that a child aged a, from population group g, works in k type of
employment. These probabilities are calculated for children 10+, given the available data.
‐ gkay denotes the average real annual earnings of a child aged a, from population group g, working in k
type of employment. As earnings for unpaid workers are unavailable, these earnings are calculated by decreasing 50 percent the age‐earnings profile of self‐employed child workers.
‐ kd denotes the annualized growth rate of real annual earnings in k type of employment. The rate is
estimated over the 2005‐2011 period and is assumed to be identical for all population groups and education levels. The predicted growth rate for self‐employment is applied to the constructed earnings of unpaid employment. The expected impact of the Program 8. As investment in human capital is at the heart of the National Development Strategy, the Program would support the Government in implementing key priority policies and activities in the four Results Areas of results described above. 9. The implementation of these policies and strategies, and the results that would be achieved in each area are expected to have a direct impact on the quality of education that in the medium to long term would improve labor market outcomes at the individual level. We expect to see this impact through two channels in the life‐earnings profiles: (i) School completion levels: The school completion levels would determine the lifetime earnings and the type of work in which individuals are employed. To see this, the program must change the average probability of completing each education level; and (ii) earnings growth rates: By approximating the labor productivity with the labor earnings, there is a direct method to evaluate the effect of education quality on productivity. There is an expectation that each additional level of schooling produces an increase in labor productivity, so that the change in earnings captures this effect.
10. Table A.2 shows the forecasted school completion with and without the Program. To guide our forecast to future school completion rates, we study the change in the distribution over 2005 to 2010. As Table A.4 shows, the distribution of school completion levels has changed positively, as all population groups exhibit an increase in secondary school completion and a decrease in the proportion of children who only complete lower primary school. However, the rate of change differs among the population gender groups.
11. For the purpose of forecasting, we focus on the change in the probability of at least completing secondary school. To set the forecasted probability in the absence of the Program, we assume that the annual growth of this probability remains the same future years as it has been during the last years for the following population groups: (i) men and (ii) women.
12. We take this forecasted annualized growth to calculate the probability that a child currently aged 6 completes secondary school when the child reaches the age of 18. The full distribution of school completion at age 18 years is thus constructed by taking the residual probability and dividing it between
58
the four remaining education levels in proportion to the relative participation they had in 2010 (column 7 in Table A.2).
13. To adjust the predicted education level under the Program, we estimate that the program will increase the annual growth rate of the probability of completing secondary school by 1 percent point. Then the full completion profile is constructed as described before (see columns 8 and 9 in Table A.2).
14. The second effect that we can expect from the Program is related to the growth in labor productivity produced by the increase in the quality of education, across each school level. To approximate this effect, we will adjust the labor earnings growth rates as mentioned. Table A.3 shows the average annual labor earnings in 2005 and 2010 for each population group and for two type of employments (wage and self‐employment). Over this period, there has been a reduction in the average labor earnings for almost all the population groups. Only the wages of employed urban workers have increased over this period.
15. To estimate the earnings growth without the program, we assume that the annual growth rate of earnings for these two population‐employment groups will be the same in the future as they were in the recent past.
16. The forecasted labor earnings growth rate with the Program is constructed by adding 0.015 percent points to the forecasted annual growth rate in the absence of the Program (see column 7 in Table A.3).
17. We calculate costs with and without the Program using the predicted population group‐specific completion probabilities presented in Table A.2. The increased completion in secondary school is expected as a result of both incremental spending in education, as well as expected effectiveness and efficiency of all expenditure in public education. The activities covered by the Program, as briefly mentioned above, are expected to add JD 208 (2017 JOD) to the private and public expenditure per student. This additional cost is included in the PDV of the expected economic costs of the Program.
Calculation of the individual economic gains 18. The individual economic gains induced by the existence of the Program are obtained by estimating the discounted values of the increased costs and the benefits according to the assumptions outlined above. These changes are presented in Table A.4. The Program is expected to yield a PDV of 679 Jordanian dinar per child in increased benefits (in 2017 $JD). 19. Table A.4 also present results of the sensitivity analysis, where we vary some parameters of the model to verify how gains change. The scenarios considered are: i) reducing the expected adult labor earnings growth rate gains of the Program from 0.015 to 0.01 percent points; ii) halving the expected program effect on secondary school completion (see Table A.2 for the original); and iii) combining i) and ii). As expected, under these three scenarios, the expected economic gains of the Program are smaller than the base scenario, but in scenarios ii) and combining i) and ii) they are negative.

59
Table A.2. Predicted school completion probability profiles for children aged 17 to 18 years, with and without the program
Population group
Completion level (x)
Probability of
completing level x in 2005
Probability of
completing level x in 2010
% Change 2005‐ 2010
Annualized %
change, 2005‐ 2010
Forecasted annualized % growth
rate without the Program
Forecasted probability
of completing
level x without the
Program
Forecasted annualized
% growth rate
with the Program
Forecasted probability
of completing level x with
the Program
(1) (2) (3) (4) (5) (6) (7) (8) (9)
Female Incomplete primary 16.00 11.40 ‐0.29 ‐0.06 8.96 7.62
Incomplete lower secondary 25.00 20.90 ‐0.16 ‐0.03 18.46 17.12
Incomplete upper secondary 22.00 25.80 0.17 0.03 23.36 22.02 Completed upper secondary but not post‐secondary 12.00 14.20 0.18 0.04 0.02 21.53 0.03 25.53
Post‐secondary 25.00 27.70 0.11 0.02 27.70 27.70
Male Incomplete primary 8.00 5.60 ‐0.30 ‐0.06 3.93 2.60
Incomplete lower secondary 22.00 23.00 0.05 0.01 21.33 20.00
Incomplete upper secondary 34.00 32.40 ‐0.05 ‐0.01 30.73 29.40
Completed upper secondary but not post‐secondary 12.00 13.50 0.13 0.03 0.01 18.50 0.02 22.50
Post‐secondary 24.00 25.50 0.06 0.01 25.50 25.50
Source: Income and Expenditure Survey, 2010, Department of Statistics and own calculations.

60
Table A.3. Predicted labor earning growth rates
Population group
Type of employment
Annual labor
earning in 2005
Annual labor
earning in 2010
Growth 2005‐ 2010
Annual growth
2005‐2011
Forecasted annualized
labor income growth
Forecasted annualized
labor income
growth with the Program
(1) (2) (3) (4) (5) (6) (7)
Female Self employed 2292 2350 0.025 0.005 0.005 0.020
Wage employment 2537 2585 0.019 0.004 0.004 0.019
Male Self employed 2575 2640 0.025 0.005 0.005 0.020
Wage employment 2850 2904 0.019 0.004 0.004 0.019 Source: Income and Expenditure Survey, 2010, DOS and own calculations.
Table A.4: PDV estimates of the expected individual economic gains from the Program
Case
PDV of expected incremental economic benefits (in 2017 JD)
PDV of expected incremental
economic costs (in 2017 JD)
PDV of expected incremental
economic benefits (in 2017 JD)
Base 2582 1903 679
Reduced adult labor earnings growth rates 2558 1903 655
Reduced program effect on the probability of completion secondary school. 1469 1586 ‐117
Reduced adult labor earnings growth rates + probability of secondary school completion 1446 1586 ‐140

61
Annex 8. Map