Prognostic factors in children with severe acute ...
33
Prognostic factors in children with severe acute malnutrition at a tertiary hospital in Cape Town, South Africa Dr Lenise C Swanson Submitted in partial fulfilment for the degree of MASTERS IN MEDICINE (Paediatrics) Supervisors: Dr Etienne Nel Dr Melissa Louise Cooke Department of Paediatrics and Child health Stellenbosch University Faculty of Health Sciences Tygerberg Hospital
Transcript of Prognostic factors in children with severe acute ...

Prognostic factors in children with severe acute
malnutrition at a tertiary hospital in Cape Town, South
Africa
Dr Lenise C Swanson
Submitted in partial fulfilment for the degree of
MASTERS IN MEDICINE (Paediatrics)
Supervisors: Dr Etienne Nel
Dr Melissa Louise Cooke
Department of Paediatrics and Child health
Stellenbosch University
Faculty of Health Sciences
Tygerberg Hospital December 2014
P a g e | 2
DECLARATION:
I, the undersigned, hereby declare that the work contained in this assignment is my original work
and that I have not previously submitted it, in its entirety or in part, at any university for a
degree.
Signature:
Name: Dr Lenise Swanson
Date: 24 November 2014
Copyright É 2014 Stellenbosch UniversityAll rights reserved
Stellenbosch University http://scholar.sun.ac.za

P a g e | 3
TABLE OF CONTENTS:
Abstract Page 4
Acknowledgments Page 5
List of figures and tables Page 6
Introduction Page 7
Background Page 9
Aims Page 10
Methods Page 10
Results Page 12
Discussion Page 21
Limitations Page 26
Conclusion Page 26
Recommendations Page 28
References Page 30
Stellenbosch University http://scholar.sun.ac.za

P a g e | 4
ABSTRACT:
Severe acute malnutrition (SAM) remains a common problem worldwide and causes many
childhood deaths. The World Health Organisation (WHO) aims for a case-fatality rate of <5%
and has an established protocol to optimally manage patients.
AIMS AND METHODS: We aimed to identify prognostic factors affecting the outcome of
children under the age of 5 years admitted with severe acute malnutrition with oedema. This was
a retrospective descriptive study over 2 years at a tertiary hospital in Cape Town, South Africa,
documenting demographic details, co-morbidity including HIV exposure or infection, referral
pattern, laboratory results, complications and clinical outcome.
RESULTS: There were 59 patients with a median age of 12 months of whom 33 (56%) were
male. Thirty-two children (54%) already had documented growth faltering and 9 of these 32
children (28.1%) died. There were 24 patients (40.6%) transferred from other hospitals, and they
did significantly worse than children referred from community clinics (mortality rate 58.3% vs.
5.7%) (p<0.01). Fourteen children (23.7%) were HIV positive with a mortality rate of 42.8%.
The overall mortality was 28.9%, with 81% of deaths occurring within the first 72 hours. Liver
impairment (p<0.05), very low serum phosphate (p<0.01), and positive blood cultures (p<0.02)
were all significantly associated with an increased risk of dying.
CONCLUSION: Our mortality rate for SAM is high. Children with SAM need to be carefully
assessed and managed, particularly during the first 72 hours, when mortality is highest, with
additional vigilance in those who have poor prognostic factors. Growth faltering should be
identified early and appropriately acted upon.
Stellenbosch University http://scholar.sun.ac.za
P a g e | 5
ACKNOWLEDGEMENTS
I wish to acknowledge several people for their contribution to this study.
Dr’s EDLR Nel and ML Cooke for their patient supervision and mentorship
My fellow registrars and colleagues for their constant motivation
My family, for their support and encouragement
Stellenbosch University http://scholar.sun.ac.za

P a g e | 6
LIST OF FIGURES AND TABLES
FIGURES 1 to 4
Figure 1: Bar chart showing age and gender distribution
Figure 2: Bar chart depicting Mortality rate per age group
Figure 3: Box & Whisker plot showing temperature at time of
presentation
Figure 4: Box & Whisker Plot showing lowest temperature within
first 72 hours of presentation
TABLES 1 to 6
Table 1: Mortality rates per referral facility
Table 2: HIV status compared with clinical outcome
Table 3: Mean glucose at time of presentation
Table 4: Various laboratory findings and their clinical outcomes
Table 5: Analysis of organisms cultured from blood and their
clinical outcomes
Table 6: Summary of presenting complaints and the number of
children with each complaint who died
Stellenbosch University http://scholar.sun.ac.za

P a g e | 7
INTRODUCTION
Severe acute malnutrition (SAM) represents a medical emergency and its management should be
regarded as a public health priority.
It constitutes 11% of the total global burden of disease, and
is an underlying factor in many preventable childhood deaths each year. 1
Many cases are
complicated by coexisting infective illnesses which contribute to both the morbidity and
mortality of this serious condition. Furthermore, the HIV–epidemic has resulted in the number of
severely malnourished children in sub-Saharan Africa increasing, as well as causing a rise in
case-fatality rates. 2
The WHO has developed a set of guidelines aimed at the management of SAM. 3 This guideline
covers many important aspects of well-recognized prognostic features (such as hypoglycaemia,
sepsis, etc.) and has recently expanded to address the challenges of caring for the HIV-infected
malnourished child. Recommendations on HIV testing, initiation of antiretroviral therapy (ART)
as well as therapeutic feeding strategies are now included in the WHO guideline. 4
Through the implementation of their guideline, the WHO hopes to achieve a case-fatality rate of
less than 5% amongst children younger than 5 years affected by SAM. Unfortunately in sub-
Saharan Africa the mortality rate for SAM has remained higher than the WHO target. Whether
this is attributable to poor case management or the clinical severity of patients is not entirely
clear in the literature. However, a Kenyan-based study showed that the combination of proper
WHO protocol-driven management coupled with adequately trained medical staff failed to
reduce the SAM mortality rates sufficiently. While the WHO cautions against the use of
intravenous fluids, their study shows evidence that hypovolaemic shock may have contributed
Stellenbosch University http://scholar.sun.ac.za

P a g e | 8
significantly to poor patient outcome. 5 This suggests that there may be additional prognostic
factors and management strategies not considered in the WHO guidelines which are relevant to
our setting.
Stellenbosch University http://scholar.sun.ac.za
P a g e | 9
BACKGROUND
Globally, it is estimated that one in four children are malnourished. In 2011, approximately 101
million children worldwide under the age of 5 years were underweight (weight-for-age <-2 Z-
score), 165 million stunted (height-for-age <-2 Z-score), and 52 million wasted (weight-for-
height <-2 Z-score). Wasted children are at great risk of progressing to severe acute malnutrition
and death.6
Locally, there appears to have been in an improvement in the nutritional status of
young children in comparison with data from 1999.7 However, a recent survey of children
between the confirmed that malnutrition still remains a serious problem in South Africa. There is
a reported rate of 12.9% for stunting and 2.9% for wasting in children between the ages of 0 and
14 years. 8
SAM can be defined as a measurement of <-3 Z-score below the World Health Organization
standards for weight, length or weight-for-height and /or symmetrical oedema involving at least
the feet, in children under 5 years. It is a potentially life-threatening condition and requires
urgent treatment. 9
Malnutrition is responsible, either directly or indirectly, for more than 50% of the 10-11 million
annual preventable deaths in children under 5 years.10
Risk factors for malnutrition are poverty,
poor feeding practices, large family size and parenteral illiteracy.7 The risk of mortality is
directly related to the severity of malnutrition. In sub-Saharan Africa the case fatality rate for
SAM has been reported to be greater than 20%, and in some other African countries it is
>50%.11,12
Deaths are attributed to nutritional deprivation as well as complications such as
electrolyte imbalances, micronutrient deficiencies and sepsis. Many cases of SAM are further
Stellenbosch University http://scholar.sun.ac.za

P a g e | 10
complicated by concurrent infective illnesses, particularly acute respiratory infection, diarrhoea,
gram-negative septicaemia, and HIV. In HIV-infected children, this may be due to a number of
factors including the increased risk of infections, the negative effects of HIV infection on
nutrition, Immune Reconstitution Inflammatory Syndrome (IRIS) and drug side-effects. 2
Malnutrition has been shown to have long-term implications such as growth retardation,
behavioural problems, and poor cognitive performance. The extent of these complications is
dependent on the severity of malnutrition, the duration of the insult, and the stage of childhood
development.13
AIMS
The primary aim of this study was to describe the clinical features and outcomes of children
admitted with severe acute malnutrition with oedema, comparing those who died with survivors,
in order to identify prognostic factors and compare these with those previously described in the
literature. Our secondary aim was to identify aspects of management in the hospital setting that
could be modified to improve the outcome of severely malnourished children with oedema
METHODS
This was a retrospective descriptive study. All children under the age of 5 years with severe acute
malnutrition with oedema admitted to the Paediatric Gastroenterology Unit of Tygerberg
Children’s Hospital (TCH) over a 2 year period between 01 January 2008 and 31 December 2009
were included. These children had either been admitted directly to TCH from a primary health
clinic within the drainage area, or from a level-one / level-two hospital if the response to initial
management was poor or the clinical severity warranted specialist care. The patients were
Stellenbosch University http://scholar.sun.ac.za

P a g e | 11
identified through the ward admission / discharge database and their folders and laboratory data
manually analysed. The following parameters were recorded: demographic details, co-morbidity
including HIV exposure or infection, referral pattern, clinical management within the first 72
hours of admission, laboratory results, complications encountered during hospital stay, clinical
outcome, and if applicable, time to death. Patients were excluded from the study if the initial
diagnosis of SAM was later found to be incorrect or if clinical records were no longer available.
Upon admission to our hospital patients were managed according to WHO guidelines. All
laboratory tests were performed at the National Health Laboratory Service (NHLS) at Tygerberg
Hospital with standard laboratory techniques. A child was classified HIV-exposed if the mother
was tested HIV-positive during pregnancy, and HIV-infected if there was a positive HIV DNA
PCR in children younger than 18 months, or by 2 positive HIV ELISA tests if 18 months or
older. Information copied into patient notes from the Road to Health Chart (patient held health
record) was also captured and analysed. Data was originally captured on data acquisition forms,
and later transferred to an Excel® spread sheet and then to an Access ® Database. Patient
confidentiality was maintained by assigning each study candidate a study number, all identifiable
data was removed from the data capture tools. The study was approved by the Human Research
Ethics Committee of the Faculty of Health Sciences, Stellenbosch University, and the hospital
CEO provided consent for access to medical records. Statistical analysis was performed using
Statistica® version 10 (StatSoft). Results have been summarised as either means with standard
deviations or as medians with interquartile ranges. Categorical data were compared using the Chi
Square test and medians with the Wilcoxan Rank Sum test. A p value of less than 0.05 is
considered to be statistically significant.
Stellenbosch University http://scholar.sun.ac.za
P a g e | 12
RESULTS
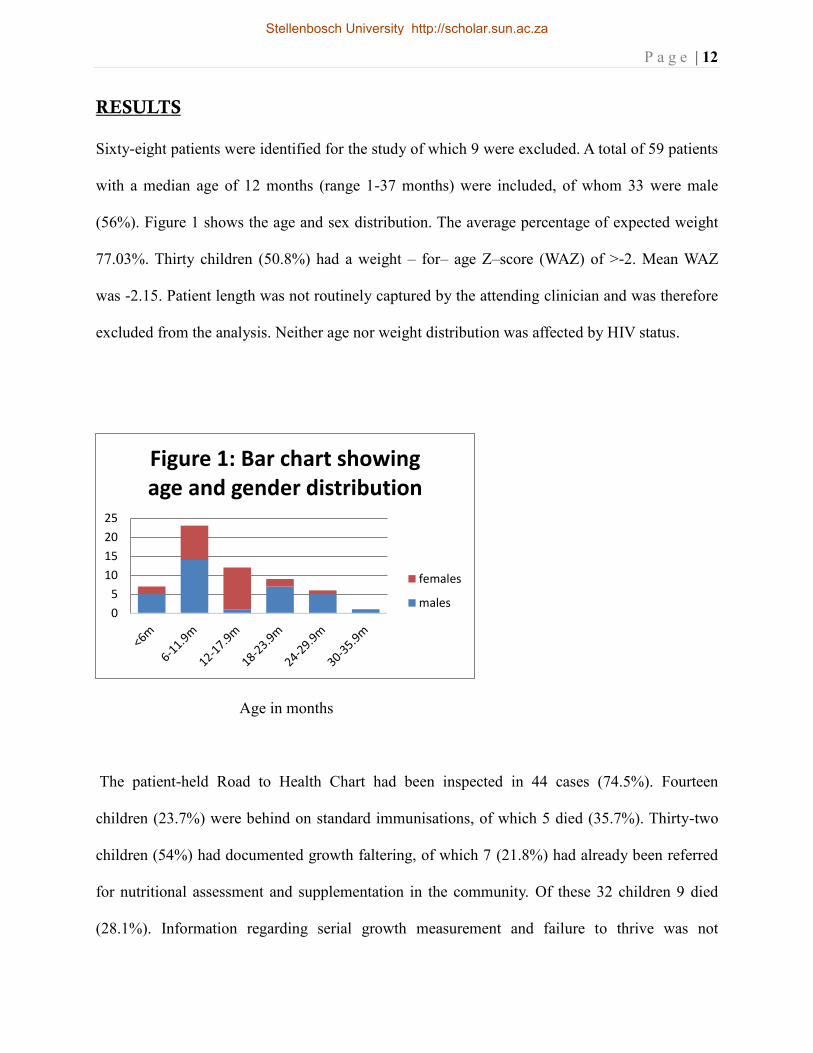
Sixty-eight patients were identified for the study of which 9 were excluded. A total of 59 patients
with a median age of 12 months (range 1-37 months) were included, of whom 33 were male
(56%). Figure 1 shows the age and sex distribution. The average percentage of expected weight
77.03%. Thirty children (50.8%) had a weight – for– age Z–score (WAZ) of >-2. Mean WAZ
was -2.15. Patient length was not routinely captured by the attending clinician and was therefore
excluded from the analysis. Neither age nor weight distribution was affected by HIV status.
Age in months
The patient-held Road to Health Chart had been inspected in 44 cases (74.5%). Fourteen
children (23.7%) were behind on standard immunisations, of which 5 died (35.7%). Thirty-two
children (54%) had documented growth faltering, of which 7 (21.8%) had already been referred
for nutritional assessment and supplementation in the community. Of these 32 children 9 died
(28.1%). Information regarding serial growth measurement and failure to thrive was not
0
5
10
15
20
25
Figure 1: Bar chart showing age and gender distribution
females
males
Stellenbosch University http://scholar.sun.ac.za
P a g e | 13
available for 27 (45.7%) of the 59 children.
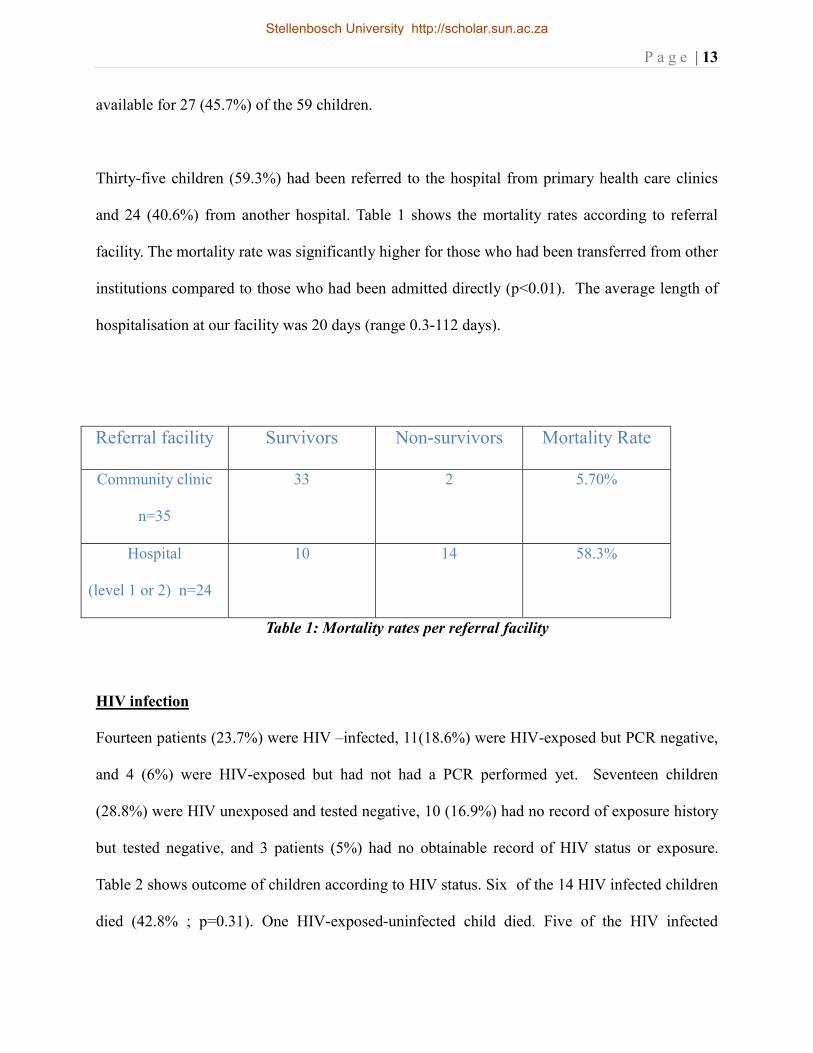
Thirty-five children (59.3%) had been referred to the hospital from primary health care clinics
and 24 (40.6%) from another hospital. Table 1 shows the mortality rates according to referral
facility. The mortality rate was significantly higher for those who had been transferred from other
institutions compared to those who had been admitted directly (p<0.01). The average length of
hospitalisation at our facility was 20 days (range 0.3-112 days).
Referral facility Survivors Non-survivors Mortality Rate
Community clinic
n=35
33 2 5.70%
Hospital
(level 1 or 2) n=24
10 14 58.3%
Table 1: Mortality rates per referral facility
HIV infection
Fourteen patients (23.7%) were HIV –infected, 11(18.6%) were HIV-exposed but PCR negative,
and 4 (6%) were HIV-exposed but had not had a PCR performed yet. Seventeen children
(28.8%) were HIV unexposed and tested negative, 10 (16.9%) had no record of exposure history
but tested negative, and 3 patients (5%) had no obtainable record of HIV status or exposure.
Table 2 shows outcome of children according to HIV status. Six of the 14 HIV infected children
died (42.8% ; p=0.31). One HIV-exposed-uninfected child died. Five of the HIV infected
Stellenbosch University http://scholar.sun.ac.za

P a g e | 14
patients (35%) were already receiving Anti-retroviral therapy (ART), of which 2 died (40%). The
duration of treatment with ART’s for these 2 children was 5 months and 16 months respectively.
HIV status Survivors Non-Survivors Mortality rate
HIV infected
n=14
8 6 42.8%
HIV uninfected
n=38(11 exposed
negative, 27 neg)
29 9 23.7%
HIV status
unknown n=7 (4
exposed, 3 not
tested)
5 2 28.5%
Table 2: HIV status compared with clinical outcome
Mortality and Risk factors
There was an overall mortality rate of 28.9% (17/59), with 81% of children dying within the first
72 hours of admission. Children under the age of 1 year tended to have a worse clinical outcome,
with mortality rates of 57.1% for the 0 – 6 month age group, and 34.7% for the 6 - 12 month
group. For those over one year of age, the mortality rate was 17.8% (5/28).
Stellenbosch University http://scholar.sun.ac.za

P a g e | 15
Age in months
Temperature and Blood glucose
Table 3 shows the blood glucose at time of admission to the ward. Twelve children(20.3%) had
no record of blood glucose at time of presentation to our hospital. One of these twelve children
subsequently died (8%). The lowest recorded blood glucose measurement at time of admission
was 3.5mmol/l for survivors and 0.6mmol/l for non-survivors. Neither admission temperature
nor blood glucose (p=0.2) were identified as being significantly associated with mortality. The
mean temperature on admission was 36.5 and 36.6 degrees Celsius for survivors and non-
survivors respectively.
Figures 4 and 5 demonstrate that low temperature within the first 72 hours of admission was a
stronger predictor of death than admission temperature. The lowest mean temperature recorded
within the first 72hrs of presentation was 35.8 degrees Celsius for survivors and 35.2 degrees
Celsius for non-survivors (p=0.004).
0%
20%
40%
60%
80%
100%
<6m 6-11.9m 12-17.9m >18m
Figure 2: Bar chart depicting Mortality rate per age group
survived
died
Stellenbosch University http://scholar.sun.ac.za

P a g e | 16
Status Mean glucose at
presentation
Standard Deviation
Survivors n=31 7.52 4.956
Non-survivors
n=16
9.91 7.647
All groups n=47 8.34 6.033
Table 3: Mean glucose at time of presentation (p=0.2)
Categ. Box & Whisker Plot: temp @ presentatio
Mean Mean±SE Mean±1.96*SE
alive died
status
35.8
36.0
36.2
36.4
36.6
36.8
37.0
37.2
37.4
tem
p @
pre
sent
atio
Figure 3: Box & Whisker plot showing temperature at time of presentation
Stellenbosch University http://scholar.sun.ac.za

P a g e | 17
Categ. Box & Whisker Plot: Lowest temp
Mean Mean±SE Mean±1.96*SE
alive died
status
34.6
34.8
35.0
35.2
35.4
35.6
35.8
36.0
Low
est t
emp
Figure 4: Box & Whisker Plot showing lowest temperature within first 72 hours of
presentation
Stellenbosch University http://scholar.sun.ac.za

P a g e | 18
Laboratory findings
Table 4 shows the mean laboratory values for liver biochemistry and phosphate levels for the
children who had these values measured. Bloods were taken at time of admission to our hospital.
Children who died had significantly higher ALT (120 vs 60) and total bilirubin (71 µmol/l vs 34
µmol/l) levels with mean values being double that of the survivors group. In addition to this they
also displayed significantly more prolonged INR and lower minimum phosphate levels than their
surviving counterparts.
Variable(mean) Survivors Non-survivors Significance
Maximum bilirubin
µmol/l (n=37)
34 71 p=0.008
Maximum ALT U/l
(n=37)
60 120 p=0.04
INR (n=32) 2.1 5.9 p<0.001
Minimum phosphate
mmol/l (n=59)
0.86 0.6 p<0.01
Table 4: Various laboratory findings and their clinical outcomes
Stellenbosch University http://scholar.sun.ac.za

P a g e | 19
Fifty-one blood cultures were done of which 9 were positive (17.6%). Table 5 shows the
outcome of children with positive blood cultures, and the organism cultured. Six of the 9
children with positive blood cultures died ( 66.6% ; p=0.02). Seven of the nine positive cultures
were gram negative organisms. Ten patients with proven negative cultures died (23.8%).
Status Organism
Alive Escherichiae coli
Alive Streptococcus pneumonia
Alive Klebsiella pneumonia
Died ESBL Klebsiella pneumonia
Died Enterobacter cloacae
Died Gram negative bacilli,
unspecified
Died Escherichiae coli
Died Gram positive bacilli,
unspecified
Died ESBL Klebsiella pneumonia
Table 5: Analysis of organisms cultured from blood and their clinical outcomes
*ESBL = Extended-spectrum beta-lactamase producing organism
Stellenbosch University http://scholar.sun.ac.za

P a g e | 20
Co-morbidity
Table 6 shows a summary of children with specific presentations or co-morbid conditions. Forty-
two children (71%) had associated diarrhoea and 31(53%) chest infections at the time of
presentation, but these were not identified as being associated with a significant increase in
mortality (diarrhoea p=0.1; pneumonia p=0.37). Three children presented with a history of
convulsions. Oedema was a volunteered presenting symptom in only 11 cases (19%).
Presenting symptom/
comorbid condition
Total Deaths
Diarrhoea 42 15 (35.7%)
Chest infection 31 11 (35.4%)
Fever 21 6 (28.5%)
Loss of appetite 15 4 (26.6%)
Loss of weight 11 0 (0%)
Skin Rash 11 2 (18.1%)
Oedema 9 1 (11.1%)
Lethargy 4 1 (25%)
Convulsions 3 2 (66.6%)
Jaundice 1 0 (0%)
Mouth sores 1 0 (0%)
Pericardial effusion 1 0 (0%)
Table 6: Summary of presenting complaints and the number of children with each complaint
Stellenbosch University http://scholar.sun.ac.za

P a g e | 21
who died
DISCUSSION
The overall mortality of this study was 29%, which is much higher than that recommended by
the WHO. However it is a tertiary referral centre for complex cases. The majority of deaths
occurred within the first 72 hours of admission to our health-care facility, with those under the
age of 1 year having an increased risk of dying. Deaths were likely due to both severity of illness
as well as delayed presentation. There was a ten-fold difference in mortality between children
referred to us directly from a primary health care (PHC) clinic and those transferred from a level
1 / 2 hospital for further care. No direct comparison pertaining to prognostic factors was made
between these two groups of patients. However, many of those children in the latter category
were in a pre-morbid state on arrival, and died shortly after admission to our facility. None of
these children had been transferred on the same day that they were admitted to their initial
hospital. Although the aim of this study was not to determine the length of hospitalization prior
to transfer, it is clear to the authors that under-recognition of disease severity and/or delay in
transfer to a tertiary centre contributed significantly to the poor outcome of these patients. Due to
study design limitations we did not have access to other hospital records so are unable to make
any deductions regarding the appropriateness of care received before transfer. However, we do
feel that in addition to basic management, a malnutrition management guideline should also
include “red flag” signs which alert the clinician to children requiring urgent / semi-urgent
transfer to a higher level of care.
More than half of our patients’ Road to Health booklets depicted growth faltering. Despite this,
Stellenbosch University http://scholar.sun.ac.za

P a g e | 22
only 7 of 32 children had been referred for nutritional support in the community. While it is
encouraging that children’s growth parameters are being measured and plotted on growth charts,
the correct interpretation and management of these parameters is crucial. Primary health care
clinics are the access point to the healthcare system, and primary care workers should be
competent in identifying children at risk, and intervene timeously with referrals for nutritional
support and other appropriate forms of social welfare. Our greatest number of patients were in
the weaning phase i.e. 6 – 12 months of age, and we as healthcare providers should be
particularly vigilant in monitoring the growth and development of this extremely vulnerable
group of children.
HIV infection
The HIV-epidemic in Sub-Saharan Africa has resulted in an increase in the number of severely
malnourished children. In a study of more than 4500 children with all categories of SAM, 29%
were found to be infected with HIV, with a three-fold increase in mortality compared to their
HIV-uninfected counterparts.11
Several other studies have shown similar results.15,16
This may be
due to a number of factors including the increased risk of comorbid infections, the negative
effects of HIV infection on nutrition, the development of an immune reconstitution
inflammatory syndrome (IRIS), and the effects of various anti-retroviral drugs.2 Our rate of HIV
infection has shown to be similar. While small sample size may have rendered the statistical
interpretation of the mortality rate in this particular subset of patients as “not significant”, we do
believe it to be of great clinical importance, and thus the extremely high mortality rate of 43% in
the HIV - infected group must be appreciated.
It is of concern that 30% of our study population known to be HIV-exposed had not yet had their
Stellenbosch University http://scholar.sun.ac.za

P a g e | 23
definitive HIV status established prior to admission. All these children were older than 6 months.
The current national policy dictates HIV DNA PCR testing at primary care level for all HIV-
exposed infants at 6 weeks of age. This suggests a breakdown in the Prevention of Mother-to-
Child Transmission (PMTCT) programme. Any child presenting with SAM should have their
HIV status checked urgently as this impacts on short- and long- term management.
There is limited data available on long-term outcomes of children with severe malnutrition
complicated by HIV. Thus far, studies done on the timing of ART initiation in severely
malnourished children have shown conflicting results, with some suggesting that earlier initiation
leads to improved outcomes, 1
while an Africa – based study reports clinical deterioration within
12 weeks of ART initiation. 17
Reasons for possible deterioration include the unmasking of pre-
existing infections (IRIS phenomenon), and anti – retroviral drug toxicity. 17
However, despite
poor evidence, the WHO strongly recommends that severely malnourished children qualifying
for lifelong antiretroviral treatment should be initiated onto ART once metabolic complications
have stabilized and sepsis resolved, and that they should then be closely monitored during the
first 6-8 weeks to identify drug-related metabolic complications and opportunistic infections.
Currently ART drug regimens and dosages remain the same as for the HIV-uninfected child.4
Further research into the optimal timing of ART introduction, choice of drug regimen as well as
ART pharmacokinetics in the acutely malnourished child is needed.
WHO guidelines and prognosis
The World Health Organization has proposed a timeframe for the management of severe
Stellenbosch University http://scholar.sun.ac.za

P a g e | 24
malnutrition, consisting of both stabilization and rehabilitation phases. The stabilization phase
addresses issues which need correction during the first 0-7 days, with hypoglycaemia,
hypothermia, and dehydration requiring urgent intervention and correction.13
The first 24-48
hours represents a high-risk period for these complications, as well as those of various electrolyte
abnormalities, and the clinician should actively seek and address these complications. During a
study done in an emergency setting in Nigeria, hypoglycaemia was found to be significantly
associated with death and the risk of dying within 24hours of admission.18
A Kenyan-based study
looking at the outcome of hypoglycaemia on admission found a 20% mortality rate amongst
hypoglycaemic children, compared with 3.8% in normoglycaemic children.19
Mortality was
particularly high in hypoglycaemic children with signs of severe malnutrition. Our study did not
find hypoglycaemia at the time of presentation to be a good predictor of death, but it should be
borne in mind that most of our patients had already received dextrose-containing oral,
nasogastric or intravenous fluids prior to arrival at our facility as per primary management
protocol, which may have affected our results.
There is minimal evidence in the literature to support a close association between hypothermia
and the risk of dying. Although a common complication of malnutrition, a large study found that
hypothermia on admission was neither sensitive nor specific enough to identify those at an
increased risk of early mortality.20
The admission temperatures of our patients were similar
irrespective of clinical outcome. There was however, a 0.6 Celsius degree difference in the
lowest recorded temperature during the first 72 hours of admission between survivors and non-
survivors, with death more likely to occur at temperatures <35.2 degrees Celsius. Hypothermia
may be an indirect marker of overwhelming sepsis.
Stellenbosch University http://scholar.sun.ac.za
P a g e | 25
We found documented bacteraemia to be associated with a significant increase in mortality. The
majority were gram-negative organisms and the resistance spectrum indicated that many were
nosocomial infections. Most children transferred from other facilities would have been on
antibiotics and so the rate of bacteraemia prior to transfer could have been higher. Any child with
SAM showing signs of clinical deterioration after 48 hours in any hospital setting should receive
second line antibiotics to cover for nosocomial pathogens.
Metabolic complications
SAM is known to cause liver damage through mechanisms such as fatty infiltration and aflatoxin
accumulation.21,22
Various studies looking at biochemical and histological changes of the liver
have already been conducted, some dating as far back as the early 1950’s.23,24
In our study,
impaired liver function, indicated by prolonged INR and raised total Bilirubin, and hepatocellular
damage (elevated ALT) were strongly associated with a poor clinical outcome. Children with
SAM should be assessed for liver dysfunction and referred early if signs of significant
derangement are present.
We have found that a very low serum phosphate of <0.6mmol/l was associated with an increased
risk of dying. Tests for serum phosphate were done at the time of admission, before feeds had
been established, and thus should not be attributed to a refeeding syndrome (which usually
occurs within 5 days of starting to refeed25,26
). This is in keeping with other studies where low
serum phosphate has been associated with a higher death rate.27,28
This low phosphate could
therefore be regarded as an additional prognostic marker and measurement of phosphate is
Stellenbosch University http://scholar.sun.ac.za

P a g e | 26
recommended in all patients with oedematous SAM, especially those with diarrhoea, to allow
appropriate supplementation and possible referral. 28
LIMITATIONS
As this was a retrospective study, the collection of data has been influenced by the availability of
patient records and quality of clinical record keeping. The study population was small, which
may have affected statistical analysis. We have only included children with oedematous
malnutrition in this study, making it difficult to compare our results with other, more inclusive,
studies. Data pertaining to HIV status was incomplete thus we could not reliably make any
inferences regarding the risk of dying in children affected by both HIV and oedematous
malnutrition. While the WHO guidelines were followed at our hospital, information regarding
clinical severity and care prior to admission to our facility was not well documented. No direct
comparisons were made between patients transferred from different health facilities. Such data
may be linked to the health outcomes of our patients.
CONCLUSION
Severe acute malnutrition remains a common reason for hospital admission in the under-5 year
population, and is still one of the leading causes of preventable childhood deaths worldwide. Our
study shows that in a tertiary setting in sub-saharan Africa, the mortality rate for children with
SAM remains above the WHO target. Factors contributing to the high mortality include young
Stellenbosch University http://scholar.sun.ac.za

P a g e | 27
age (<12 months), a delay in presentation, and HIV infection. The WHO guideline now includes
aspects of managing the HIV-infected malnourished child and addresses issues such as ART
initiation, drug dosages and feeding strategies.
The first 72 hours of management are crucial as this is when the risk of dying is greatest. The
WHO guideline remains a valuable tool in managing patients with SAM during this high risk
period. However, our study suggests that there may be additional prognostic factors applicable to
patients at a referral hospital and we propose that these be considered in future management
strategies.
We have found a significant difference in the mortality rates of children transferred from level 1
or 2 hospitals compared to those transferred from a primary health care facility. This can be
accounted for by a difference in the time taken for very sick children to receive more specialized
care. This suggests that improved clinical guidelines are needed to help identify patients not
responding to treatment in order to hasten transfer to a specialist unit.
We are hopeful that the findings and recommendations of this study will make a significant
contribution towards lowering the mortality rate for SAM to <5%, in keeping with the WHO
target.
.
Stellenbosch University http://scholar.sun.ac.za

P a g e | 28
RECOMMENDATIONS
General recommendations:
1 Adhere to standard WHO 10 steps, with emphasis on temperature regulation, glucose
control, fluid management and treatment of sepsis.
2 Establish guidelines to assist in the identification of high risk patients.
3 All children with SAM should have HIV status documented, and should be considered
for anti-retroviral treatment where indicated.
4 Further research is needed to determine the best time to institute anti-retroviral therapy in
severely malnourished children.
5 Further prospective studies are needed to identify risk factors for increased mortality.
Recommendations for primary health care clinics / district hospitals:
1 High risk patients should be transferred early for more specialized care.
2 At primary care level, recognition and appropriate management of growth faltering must
be optimized.
Recommendations for secondary / tertiary level hospitals:
1 Aggressive treatment for nosocomial sepsis should be instituted in any inpatient with
clinical deterioration after 48 hours of hospitalization
Stellenbosch University http://scholar.sun.ac.za

P a g e | 29
2 Any very ill child should have liver biochemistry and phosphate levels checked with
awareness of implications of results.
Stellenbosch University http://scholar.sun.ac.za

P a g e | 30
REFERENCES
1. Trehan I, O’Hare BA, Phiri A, Heikens GT. Challenges in the management of HIV-
infected malnourished children in sub-Saharan Africa. AIDS Res Treat. Vol 2012, Article
ID 790786
2. De Maayer T, Saloojee H. Clinical outcomes of severe malnutrition in a high tuberculosis
and HIV setting. Arch Dis Child 2011; 96: 560-564
3. Ashworth A, Jackson A, Khanum S, Scholfield C. Ten steps to recovery: Child health
dialogue 1996 (3-4): 10-12
4. WHO. Guideline: Updates on the management of severe acute malnutrition in infants and
children. Geneva: World Health Organization; 2013: 55-59
5. Maitland K, Berkley JA, Shebbe M, Peshu N, English M, Newton,C. Children with
severe malnutrition: Can those at highest risk of death be identified with the WHO
protocol? PLos Med 2006; 3: e500-e500
6. United Nations Children’s Fund, World Health Organization, The World Bank. UNICEF-
WHO-World Bank Joint Child Malnutrition Estimates (UNICEF, New York; WHO,
Geneva; The World Bank, Washington DC; 2012): 3
www.who.int/nutgrowthdb/jme_unicef_who_wb.pdf Accessed 09 June 2013
7. Labadarios D, Swart R, Maunder E, Kruger H, Gericke G, Kuzwayo P, Ntsie P, Steyn N,
Schloss I, Dhansay M, Jooste P, Danhauser A, Nel J, Molefe D, Kotze T. Executive
summary of the National Food Consumption Survey - Fortification Baseline (NFCS-FB-
I). South Africa 2005. S Afr J Clin Nutr. 2008; 21(3)(Suppl 2): 255
8. Shisana O, Labadarios D, Rehle T, Simbayi L, Zuma K, Dhansay A, Reddy P, Parker W,
Hoosain E, Naidoo P, Homgoro C, Mchiza Z, Steyn N, Dwane N, Makoae M, Maluleke
T, Ramlagan S, Zungu N, Evans M, Jacobs L, Faber M, & SANHANES-1 Team (2013).
Stellenbosch University http://scholar.sun.ac.za
P a g e | 31
South African National Health and Nutrition Examination Survey (SANHANES-1). Cape
Town: HSRC Press : 206-209
9. World Health Organization. Community-based management of severe acute malnutrition.
Geneva: World Health Organization (2007): 2-5
10. Jamro B, Junejo A, Lal S, Bouk G, Jamro S. Pak J Med Res 2012; 51(4): 111-112
11. Maitland K. Severe malnutrition: therapeutic challenges and treatment of hypovolaemic
shock. Proceedings of the Nutrition Society 2009; 68: 274-280
12. Bachou H, Tumwine JK, Mwadime RKN, Tylleskar T. Risk factors in hospital deaths in
severely malnourished children in Kampala, Uganda. BMC Pediatr 2006; 6: 7
13. Grantham-McGregor, SM; Fernald, LC; Sethuraman, K. Effects of health and nutrition
on cognitive and behavioural development in children in the first three years of life. Part
1: Low birthweight, breastfeeding, and protein-energy malnutrition. Food and Nutrition
Bulletin 1999; 20(1): 53-7
14. Heikens G, Bunn J, Amadi B, Manary M, Chhagan M, Berkley JA, Rollins N, Kelly P,
Adamczick C, Maitland K, Tomkins A. Case management of HIV-infected severely
malnourished children: challenges in the areas of highest prevalence. Lancet 2008;
371(9620): 1305- 1307
15. Thurstons S, Kerac M, Maleta K, Banda T, Nesbitt A. HIV prevalence in severely
malnourished children admitted to nutrition rehabilitation units in Malawi: Geographical
& seasonal variations: a cross-sectional study. BMC Pediatr 2008; 8: 22
16. Fergusson P, Tomkins A. HIV prevalence and mortality among children undergoing
treatment for severe acute malnutrition in sub-Saharan Africa: a systematic review and
meta-analysis. Trans R Soc Trop Med Hyg. 2009; 103(6): 541-548
17. Prendergast A, Bwakura-Dangarembizi MF, Cook AD, Bakeera-Kitaka S, Natukunda E,
Stellenbosch University http://scholar.sun.ac.za
P a g e | 32
Ntege P, Nathoo K, Karungi C, Lutaakome J, Kekitiinwa A, Gibb D. Hospitalization for
severe malnutrition among HIV – infected children starting antiretroviral therapy. Aids
2011; 25(7): 951-956
18. Elusiyan JB, Adejuyigbe EA, Adeodu OO. Hypoglycaemia in a Nigerian paediatric
emergency ward. J Trop Paed 2006; 52(2): 96-102
19. Osier FH, Berkley JA, Ross A, Sanderson F, Mohammed S, Newton CR. Abnormal blood
glucose concentrations on admission to a rural Kenyan district hospital: prevalence and
outcome. Arch Dis Child 2003; 88: 621-625
20. Talbert A, Atkinson S, KarisaJ, Chesaro C, Maitland K. Hypothermia in Children with
Severe Malnutrition: Low Prevalence on the Tropical Coast of Kenya. J Trop Paed 2009;
55(6): 413-416
21. Lamplugh S, Hendrickse R. Aflatoxins in the livers of children with kwashiorkor. Ann
Trop Paediatr 1982; 2(3): 101-104
22. Chanda N. Pathological study of the liver in kwashiorkor. Br Med J 1958; 5082: 1263-
1266
23. Sriramachari S, Ramamlingaswami V. Liver changes in Kwashiorkor. Ind J Ped 1953;
20(1): 1-6
24. Waterlow J, Bras G. Nutritional liver damage in man. Br Med Bull 1957; 13(2): 107-112
25. Khan LUR, Ahmed J, Khan S, MacFie J . Refeeding Syndrome: a literature Review.
Gastroenterol Res Prac 2011; 2011: pii: 410971.
26. Mehanna HM, Moledina J, Travis J. Refeeding syndrome: what it is, and how to prevent
and treat it. BMJ 2008; 336: 1495-1498
27. Frieman I, Pettifor JM, Moodley GM. Serum phosphorous in protein energy malnutrition.
Stellenbosch University http://scholar.sun.ac.za

P a g e | 33
J Pediatr Gastroenterol Nutr 1982; 1: 547-550
28. Manary M, Hart CA, Whyte MP. Severe hypophosphatemia in children with kwashiorkor
is associated with increased mortality. J Pediatr 1998; 133: 789-791
Stellenbosch University http://scholar.sun.ac.za