PROFITABILI TY IMPRO VED
50
Cargotec’s interim report January–September 2019 PROFITABILITY IMPROVED
Transcript of PROFITABILI TY IMPRO VED

Cargotec’s interim report January–September 2019
PROFITABILITY IMPROVED

CARGOTEC CORPORATION Q3 2019 INTERIM REPORT 22 OCTOBER 2019 AT 2.00 PM EEST
Cargotec’s interim report January–September 2019: Profitability improved
₋ Sales increased ₋ Operating profit continued to increase in Kalmar and Hiab ₋ MacGregor’s result still weak. TTS Group acquisition completed
July–September 2019 in brief: Comparable operating profit increased
● Orders received decreased by 7 percent and totalled EUR 858 (921) million. ● Order book amounted to EUR 2,251 (31 Dec 2018: 1,995) million at the end of the period. ● Sales increased by 12 percent and totalled EUR 901 (805) million. ● Service sales increased by 13 percent and totalled EUR 269 (239) million. ● Service and software sales represented 35 (35) percent of consolidated sales. ● Operating profit was EUR 57.9 (54.5) million, representing 6.4 (6.8) percent of sales. ● Comparable operating profit increased by 18 percent and amounted to EUR 68.3 (57.8)
million, representing 7.6 (7.2) percent of sales. ● Cash flow from operations before financial items and taxes totalled EUR 80.8 (17.0) million. ● Net income for the period amounted to EUR 29.7 (37.9) million. ● Earnings per share was EUR 0.46 (0.58).
January–September 2019 in brief: Sales increased ● Orders received totalled EUR 2,752 (2,766) million. ● Sales increased by 11 percent and totalled EUR 2,669 (2,394) million. ● Service sales increased by 8 percent and totalled EUR 777 (722) million. ● Service and software sales represented 34 (34) percent of consolidated sales. ● Operating profit was EUR 162.0 (129.1) million, representing 6.1 (5.4) percent of sales. ● Comparable operating profit increased by 10 percent and amounted to EUR 190.0 (172.5)
million, representing 7.1 (7.2) percent of sales. ● Cash flow from operations before financial items and taxes totalled EUR 153.1 (39.8)
million. ● Net income for the period amounted to EUR 89.7 (73.9) million. ● Earnings per share was EUR 1.39 (1.13).
Outlook for 2019 Cargotec reiterates its outlook published on 8 February 2019 and expects its comparable operating profit for 2019 to improve from 2018 (EUR 242.1 million).
2 / 50

CARGOTEC CORPORATION Q3 2019 INTERIM REPORT 22 OCTOBER 2019 AT 2.00 PM EEST
Cargotec’s key figures Cargotec applies the accounting standard IFRS 16, Leases, and the interpretation IFRIC 23, Uncertainty over Income Tax Treatments, starting from 1 January 2019. More information on the standards is available in Note 2, Accounting principles and new accounting standards. Cargotec has also refined the definition of service business for Hiab and MacGregor from the beginning of 2019. The figures related to service business have been restated for the comparison period 2018 accordingly. Cargotec has published a stock exchange release on 4 April 2019 regarding the changes.
MEUR Q3/19 Q3/18 Change Q1-Q3/19 Q1-Q3/18 Change 2018 Orders received 858 921 -7% 2,752 2 766 0% 3,756 Service orders received 262 251 4% 803 766 5% 1,031 Order book, end of period 2,251 1,887 19% 2,251 1,887 19% 1,995 Sales 901 805 12% 2,669 2,394 11% 3,304 Service sales 269 239 13% 777 722 8% 980 Software sales* 44 39 11% 122 100 22% 147 Service and software sales, % of Cargotec’s sales 35% 35% 34% 34% 34% Operating profit 57.9 54.5 6% 162.0 129.1 26% 190.0 Operating profit, % 6.4% 6.8% 6.1% 5.4% 5.8% Comparable operating profit 68.3 57.8 18% 190.0 172.5 10% 242.1 Comparable operating profit, % 7.6 % 7.2% 7.1 % 7.2% 7.3% Income before taxes 50.0 47.0 7% 137.7 108.9 26% 161.1 Cash flow from operations before financing items and taxes 80.8 17.0 > 100% 153.1 39.8 > 100% 125.8 Net income for the period 29.7 37.9 -22% 89.7 73.9 21% 108.0 Earnings per share, EUR 0.46 0.58 -21% 1.39 1.13 23% 1.66 Interest-bearing net debt, end of period 927 639 45% 927 639 45% 625 Gearing, % 64.5% 45.3% 64.5% 45.3% 43.8% Interest-bearing net debt / EBITDA** 2.8 2.5 2.8 2.5 2.3 Return on capital employed (ROCE), last 12 months, % 8.6% 7.9% 8.6% 7.9% 8.0% Personnel, end of period 12,742 11,652 9% 12,742 11,652 9% 11,987 *Software sales include the strategic business unit Navis and automation software **Last 12 months’ EBITDA
3 / 50
CARGOTEC CORPORATION Q3 2019 INTERIM REPORT 22 OCTOBER 2019 AT 2.00 PM EEST
Cargotec’s CEO Mika Vehviläinen: Operating profit continued to increase in Kalmar and Hiab I am pleased with the good development that continued in Kalmar and Hiab in the third quarter. Kalmar’s comparable operating profit increased by 24 percent and Hiab’s by 41 percent. Our actions to solve Hiab’s supply chain challenges which we started earlier this year proceeded as well.
MacGregor’s market situation continued to be challenging, and its operating profit was negative. We will continue to streamline MacGregor operations during the last quarter of 2019.
During the third quarter, Hiab’s orders received increased by four percent and MacGregor’s by 10 percent compared to the comparison period. Kalmar’s orders received declined by 19 percent. The customer interest towards port automation increased, but they consider their decisions carefully, targeting their investments mostly to phased renewals of existing ports.
Our service and software business progressed according to our plans. Service orders received increased by four percent, while service sales increased by 13 percent. Software sales grew by 11 percent. The sales of our services and software business was about 1.2 billion euros during the last 12 months, which is in line with our strategic target of 1.5 billion euros.
During the third quarter we completed the acquisition of the marine and offshore businesses of TTS Group ASA. The acquired businesses have been consolidated into MacGregor's financial figures as of 1 August 2019, and the process to integrate the companies is ongoing. The scale benefits of the acquisition create an opportunity to further improve MacGregor’s productivity and global presence. The merger of the two leading companies in their field provides us with excellent opportunities to better serve our customers, strengthen our competitiveness and continue to develop our products and services.
4 / 50

CARGOTEC CORPORATION Q3 2019 INTERIM REPORT 22 OCTOBER 2019 AT 2.00 PM EEST
Reporting segments’ key figures Orders received MEUR Q3/19 Q3/18 Change Q1-Q3/19 Q1-Q3/18 Change 2018 Kalmar 396 486 -19% 1,329 1,469 -9% 1,919 Hiab 307 294 4% 988 902 9% 1,259 MacGregor 156 141 10% 437 396 10% 580 Internal orders 0 0 -1 -1 -1 Total 858 921 -7% 2,752 2,766 0% 3,756
Order book MEUR 30 Sep 2019 31 Dec 2018 Change Kalmar 1,083 1,012 7% Hiab 458 453 1% MacGregor 712 530 34% Internal orders -1 -1 Total 2,251 1,995 13%
Sales MEUR Q3/19 Q3/18 Change Q1-Q3/19 Q1-Q3/18 Change 2018 Kalmar 424 415 2% 1,252 1,174 7% 1,618 Hiab 307 260 18% 982 831 18% 1,149 MacGregor 170 130 31% 436 389 12% 538 Internal sales 0 0 0 -1 -2 Total 901 805 12% 2,669 2,394 11% 3,304
Operating profit MEUR Q3/19 Q3/18 Change Q1-Q3/19 Q1-Q3/18 Change 2018 Kalmar 47.5 38.6 23% 113.3 91.0 24% 138.1 Hiab 30.3 23.9 27% 111.0 99.4 12% 133.8 MacGregor -9.8 0.2 < -100% -23.4 3.1 < -100% -4.2 Corporate administration and support functions -10.1 -8.2 -23% -38.9 -64.5 40% -77.7 Total 57.9 54.5 6% 162.0 129.1 26% 190.0
Comparable operating profit MEUR Q3/19 Q3/18 Change Q1-Q3/19 Q1-Q3/18 Change 2018 Kalmar 47.8 38.6 24% 117.8 92.5 27% 143.6 Hiab 34.1 24.2 41% 118.4 99.6 19% 134.5 MacGregor -5.8 1.0 < -100% -15.6 5.2 < -100% -1.6 Corporate administration and support functions -7.7 -6.0 -29% -30.5 -24.9 -22% -34.4 Total 68.3 57.8 18% 190.0 172.5 10% 242.1
5 / 50

CARGOTEC CORPORATION Q3 2019 INTERIM REPORT 22 OCTOBER 2019 AT 2.00 PM EEST
Press conference for analysts and media A press conference for analysts and media, combined with a live international telephone conference, will be arranged on the publishing day at 3.00 p.m. EEST at Cargotec's head office, Porkkalankatu 5, Helsinki. The event will be held in English. The report will be presented by CEO Mika Vehviläinen and Executive Vice President, CFO Mikko Puolakka. The presentation material will be available at www.cargotec.com by latest 2.30 p.m. EEST.
The telephone conference, during which questions may be presented, can be accessed by registering at https://bit.ly/2lSD6zm. The registration opens 15 minutes prior to the event. The event conferencing system will call the participant on the phone number provided and place the participant into the event.
The telephone conference can also be accessed without advance registration with code 965922 by calling to one of the following numbers:
FI +358 (0)9 7479 0360
UK +44 (0)330 336 9104
US +1 323-794-2095
The event can also be viewed as a live webcast at www.cargotec.com. Conference call will be recorded, and an on-demand version of the conference will be published at Cargotec's website later during the day.
Note that by dialling in to the conference call, the participant agrees that personal information such as name and company name will be collected.
For further information, please contact: Mikko Puolakka, Executive Vice President and CFO, tel. +358 20 777 4105 Carina Geber-Teir, SVP Communications, tel. +358 20 777 4000 Cargotec (Nasdaq Helsinki: CGCBV) enables smarter cargo flow for a better everyday with its leading cargo handling solutions and services. Cargotec's business areas Kalmar, Hiab and MacGregor are pioneers in their fields. Through their unique position in ports, at sea and on roads, they optimise global cargo flows and create sustainable customer value. Cargotec's sales in 2018 totalled approximately EUR 3.3 billion and it employs around 13,000 people. www.cargotec.com
6 / 50

CARGOTEC CORPORATION Q3 2019 INTERIM REPORT 22 OCTOBER 2019 AT 2.00 PM EEST
Cargotec’s January–September 2019 interim report
Operating environment The number of containers handled at ports globally grew by 2.6 percent during January–September 2019 compared to the comparison period (Drewry). The demand for mobile equipment stabilised compared to the comparison period. The customer interest towards port automation increased, but they consider their decisions carefully, targeting their investments mostly to phased renewals of existing ports.
The demand for Hiab’s load handling equipment in January–September was supported in the United States and Europe by the construction activity, which increased in Europe and grew slightly in the US. The demand for services improved from the comparison period.
The merchant ship contracting remained at a low level during January–September. New vessel contracting in the offshore sector remained at an exceptionally low level. The demand for MacGregor’s services improved from the comparison period.
Financial performance Orders received and order book
Orders received by reporting segment MEUR Q3/19 Q3/18 Change Q1-Q3/19 Q1-Q3/18 Change 2018 Kalmar 396 486 -19% 1,329 1,469 -9% 1,919 Hiab 307 294 4% 988 902 9% 1,259 MacGregor 156 141 10% 437 396 10% 580 Internal orders 0 0 -1 -1 -1 Total 858 921 -7% 2,752 2,766 0% 3,756
7 / 50
CARGOTEC CORPORATION Q3 2019 INTERIM REPORT 22 OCTOBER 2019 AT 2.00 PM EEST
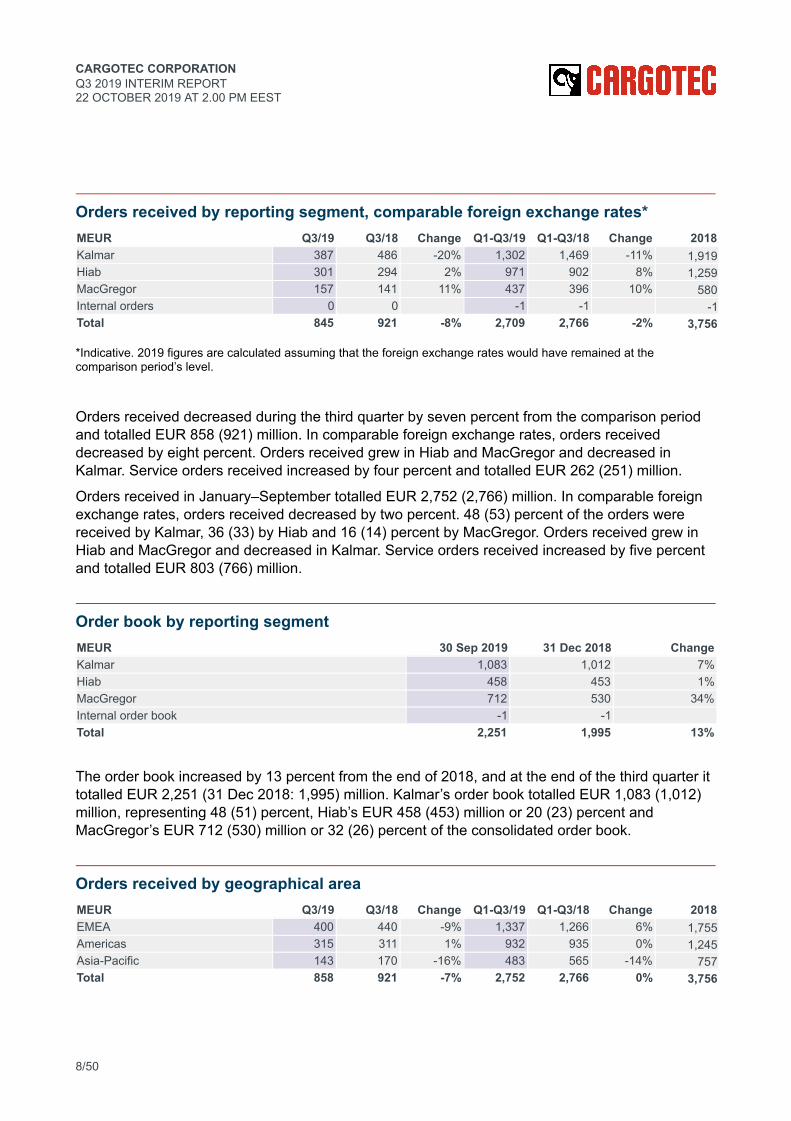
Orders received by reporting segment, comparable foreign exchange rates* MEUR Q3/19 Q3/18 Change Q1-Q3/19 Q1-Q3/18 Change 2018 Kalmar 387 486 -20% 1,302 1,469 -11% 1,919 Hiab 301 294 2% 971 902 8% 1,259 MacGregor 157 141 11% 437 396 10% 580 Internal orders 0 0 -1 -1 -1 Total 845 921 -8% 2,709 2,766 -2% 3,756 *Indicative. 2019 figures are calculated assuming that the foreign exchange rates would have remained at the comparison period’s level.
Orders received decreased during the third quarter by seven percent from the comparison period and totalled EUR 858 (921) million. In comparable foreign exchange rates, orders received decreased by eight percent. Orders received grew in Hiab and MacGregor and decreased in Kalmar. Service orders received increased by four percent and totalled EUR 262 (251) million.
Orders received in January–September totalled EUR 2,752 (2,766) million. In comparable foreign exchange rates, orders received decreased by two percent. 48 (53) percent of the orders were received by Kalmar, 36 (33) by Hiab and 16 (14) percent by MacGregor. Orders received grew in Hiab and MacGregor and decreased in Kalmar. Service orders received increased by five percent and totalled EUR 803 (766) million.
Order book by reporting segment MEUR 30 Sep 2019 31 Dec 2018 Change Kalmar 1,083 1,012 7% Hiab 458 453 1% MacGregor 712 530 34% Internal order book -1 -1 Total 2,251 1,995 13%
The order book increased by 13 percent from the end of 2018, and at the end of the third quarter it totalled EUR 2,251 (31 Dec 2018: 1,995) million. Kalmar’s order book totalled EUR 1,083 (1,012) million, representing 48 (51) percent, Hiab’s EUR 458 (453) million or 20 (23) percent and MacGregor’s EUR 712 (530) million or 32 (26) percent of the consolidated order book.
Orders received by geographical area MEUR Q3/19 Q3/18 Change Q1-Q3/19 Q1-Q3/18 Change 2018 EMEA 400 440 -9% 1,337 1,266 6% 1,755 Americas 315 311 1% 932 935 0% 1,245 Asia-Pacific 143 170 -16% 483 565 -14% 757 Total 858 921 -7% 2,752 2,766 0% 3,756
8 / 50

CARGOTEC CORPORATION Q3 2019 INTERIM REPORT 22 OCTOBER 2019 AT 2.00 PM EEST
In geographical terms, the share of orders received in the third quarter was 47 (48) percent in EMEA and 37 (34) percent in Americas. Asia-Pacific’s share of orders received was 16 (18) percent.
In January–September, the share of orders received in the third quarter was 49 (46) percent in EMEA and 34 (34) percent in Americas. Asia-Pacific’s share of orders received was 17 (20) percent.
Sales
Sales by reporting segment MEUR Q3/19 Q3/18 Change Q1-Q3/19 Q1-Q3/18 Change 2018 Kalmar 424 415 2% 1,252 1,174 7% 1,618 Hiab 307 260 18% 982 831 18% 1,149 MacGregor 170 130 31% 436 389 12% 538 Internal sales 0 0 0 -1 -2 Total 901 805 12% 2,669 2,394 11% 3,304
Sales by reporting segment, comparable foreign exchange rates* MEUR Q3/19 Q3/18 Change Q1-Q3/19 Q1-Q3/18 Change 2018 Kalmar 417 415 1% 1,230 1,174 5% 1,618 Hiab 303 260 16% 966 831 16% 1,149 MacGregor 170 130 31% 436 389 12% 538 Internal sales 0 0 0 -1 -2 Total 890 805 11% 2,631 2,394 10% 3,304 *Indicative. 2019 figures are calculated assuming that the foreign exchange rates would have remained at the comparison period’s level.
Third quarter 2019 sales increased by 12 percent from the comparison period to EUR 901 (805) million. In comparable foreign exchange rates, sales increased by 11 percent. Sales increased in all business areas. Service sales increased by 13 percent from the comparison period and totalled EUR 269 (239) million, representing 30 (30) percent of consolidated sales. In comparable foreign exchange rates, service sales increased by 11 percent. Software sales increased by 11 percent and amounted to EUR 44 (39) million. In comparable foreign exchange rates, software sales increased by six percent. In total, service and software sales amounted to EUR 312 (278) million, representing 35 (35) percent of consolidated sales.
January–September sales increased by 11 percent from the comparison period to EUR 2,669 (2,394) million. In comparable foreign exchange rates, sales increased by 10 percent. Sales increased in all business areas. Service sales increased by eight percent from the comparison period and totalled EUR 777 (722) million, representing 29 (30) percent of consolidated sales. In comparable foreign exchange rates, service sales increased by six percent. Software sales increased by 22 percent and amounted to EUR 122 (100) million. In comparable foreign exchange rates, software sales increased by 17 percent. In total, service and software sales amounted to EUR 899 (823) million, representing 34 (34) percent of consolidated sales.
9 / 50

CARGOTEC CORPORATION Q3 2019 INTERIM REPORT 22 OCTOBER 2019 AT 2.00 PM EEST
Sales by geographical area MEUR Q3/19 Q3/18 Change Q1-Q3/19 Q1-Q3/18 Change 2018 EMEA 407 386 5% 1,253 1,150 9% 1,610 Americas 305 251 21% 921 766 20% 1,039 Asia-Pacific 189 167 13% 495 478 4% 655 Total 901 805 12% 2,669 2,394 11% 3,304 In geographical terms, sales increased in all market areas during the third quarter. EMEA’s share of consolidated sales was 45 (48) percent, Americas’ 34 (31) percent and Asia-Pacific’s 21 (21) percent.
January–September sales increased in all market areas. EMEA’s share of consolidated sales was 47 (48) percent, Americas’ 34 (32) percent and Asia-Pacific’s 19 (20) percent.
Financial result
Operating profit by reporting segment MEUR Q3/19 Q3/18 Change Q1-Q3/19 Q1-Q3/18 Change 2018 Kalmar 47.5 38.6 23% 113.3 91.0 24% 138.1 Hiab 30.3 23.9 27% 111.0 99.4 12% 133.8 MacGregor -9.8 0.2 < -100% -23.4 3.1 < -100% -4.2 Corporate administration and support functions -10.1 -8.2 -23% -38.9 -64.5 40% -77.7 Total 57.9 54.5 6% 162.0 129.1 26% 190.0
Operating profit for the third quarter totalled EUR 57.9 (54.5) million. The operating profit includes items affecting comparability worth EUR -10.5 (-3.3) million. EUR -0.3 (0.0) million of the items were related to Kalmar, EUR -3.7 (-0.3) million to Hiab, EUR -4.0 (-0.8) million to MacGregor and EUR -2.3 (-2.2) million to corporate administration and support functions.
January–September operating profit totalled EUR 162.0 (129.1) million. The operating profit includes items affecting comparability worth EUR -28.1 (-43.4) million. EUR -4.5 (-1.5) million of the items were related to Kalmar, EUR -7.4 (-0.3) million to Hiab, EUR -7.8 (-2.1) million to MacGregor and EUR -8.4 (-39.5) million to corporate administration and support functions. In the comparison period, EUR 30 million of the items affecting comparability in the corporate administration and support functions were related to the lowered balance sheet valuation of the associated company Jiangsu Rainbow Heavy Industries Co. Ltd (RHI).
10 / 50

CARGOTEC CORPORATION Q3 2019 INTERIM REPORT 22 OCTOBER 2019 AT 2.00 PM EEST
Comparable operating profit by reporting segment MEUR Q3/19 Q3/18 Change Q1-Q3/19 Q1-Q3/18 Change 2018 Kalmar 47.8 38.6 24% 117.8 92.5 27% 143.6 Hiab 34.1 24.2 41% 118.4 99.6 19% 134.5 MacGregor -5.8 1.0 < -100% -15.6 5.2 < -100% -1.6 Corporate administration and support functions -7.7 -6.0 -29% -30.5 -24.9 -22% -34.4 Total 68.3 57.8 18% 190.0 172.5 10% 242.1 Comparable operating profit for the third quarter increased by 18 percent and totalled EUR 68.3 (57.8) million, representing 7.6 (7.2) percent of sales. Comparable operating profit for Kalmar amounted to EUR 47.8 (38.6) million, for Hiab to EUR 34.1 (24.2) million, and for MacGregor to EUR -5.8 (1.0) million. Kalmar’s comparable operating profit increased due to growth in sales and a favourable mix. Hiab’s comparable operating profit increased due to growth in sales. MacGregor’s comparable operating profit declined due to low capacity utilisation, lower sales margins, and cost overruns in certain offshore projects.
January–September comparable operating profit increased by 10 percent and totalled EUR 190.0 (172.5) million, representing 7.1 (7.2) percent of sales. Comparable operating profit for Kalmar amounted to EUR 117.8 (92.5) million, for Hiab to EUR 118.4 (99.6) million, and for MacGregor to EUR -15.6 (5.2) million.
Net financing expenses and net income Net interest expenses for interest-bearing debt and assets for the third quarter totalled EUR 5.3 (4.0) million. Net financing expenses totalled EUR 7.9 (7.6) million. January–September net interest expenses for interest-bearing debt and assets totalled EUR 15.7 (12.1) million. Net financing expenses totalled EUR 24.3 (20.1) million.
Net income for the third quarter totalled EUR 29.7 (37.9) million, and earnings per share EUR 0.46 (0.58). January–September net income totalled EUR 89.7 (73.9) million, and earnings per share EUR 1.39 (1.13).
Balance sheet, cash flow and financing The consolidated balance sheet total was EUR 4,245 (31 Dec 2018: 3,684) million at the end of the third quarter. Equity attributable to the equity holders of the parent was EUR 1,434 (1,426) million, representing EUR 22.26 (22.16) per share. Property, plant and equipment on the balance sheet amounted to EUR 471 (309) million and intangible assets to EUR 1,341 (1,249) million.
Return on equity (ROE, last 12 months) was 8.7 (30 Sep 2018: 7.2) percent at the end of the third quarter, and return on capital employed (ROCE, last 12 months) was 8.6 (7.9) percent. Cargotec’s financial target is to reach 15 percent return on capital employed in the next 2–4 years.
Cash flow from operating activities, before financial items and taxes, increased and totalled EUR 153.1 (39.8) million during January–September. Inventories remained on a high level due to improved demand in certain product categories in Kalmar and Hiab as well as supply chain issues. Improved profitability and higher advances received supported cash flow. At the end of the third quarter, net working capital increased to EUR 360 million from the level of EUR 271 million at the end of 2018.
11 / 50

CARGOTEC CORPORATION Q3 2019 INTERIM REPORT 22 OCTOBER 2019 AT 2.00 PM EEST
Cargotec’s liquidity position is healthy. During the third quarter, Cargotec issued two senior unsecured bonds in the total aggregate nominal amount of EUR 250 million. The first, an approximately 5.5-year bond in the nominal amount of EUR 100 million, matures on 23 January 2025 and it carries a fixed annual interest of 1.250 per cent. The other, a 7-year bond in the nominal amount of EUR 150 million, matures on 23 September 2026 and it carries a fixed annual interest of 1.625 per cent.
Cash and cash equivalents and the undrawn long-term credit limits amounted to EUR 688 (31 Dec 2018: 556) million at the end of the third quarter. In addition, Cargotec had access to a commercial paper programme as well as undrawn bank overdraft facilities totalling EUR 189 (31 Dec 2018: 249) million. At the end of the third quarter, interest-bearing net debt totalled EUR 927 (31 Dec 2018: 625) million. Interest-bearing net debt includes EUR 183 (19) million in lease liabilities. Interest-bearing debt amounted to EUR 1,345 (920) million, of which EUR 377 (203) million was current and EUR 968 (717) million non-current debt. The average interest rate of interest-bearing liabilities, excluding on-balance sheet lease liabilities, was 1.8 (2.4) percent. Cash and cash equivalents, loans receivable, and other interest-bearing assets totalled EUR 418 (294) million.
At the end of the third quarter, Cargotec’s total equity/total assets ratio was 36.0 (31 Dec 2018: 40.9) percent. Gearing was 64.5 (43.8) percent. Gearing increased due to the application of the IFRS 16 accounting standard and due to the net working capital increase.
Corporate topics Research and development Research and product development expenditure in January–September totalled EUR 72.5 (65.7) million, representing 2.7 (2.7) percent of sales. EUR 0.1 (0.4) million was capitalised. Research and development investments were focused on digitalisation as well as projects that aim to improve the competitiveness, cost efficiency and eco-efficiency of products.
Kalmar In July, Kalmar’s multi-assembly unit in Stargard, Poland celebrated the 1,000th straddle carrier produced at the site. The multi-assembly unit in Poland started operations in 2010 and has since delivered a wide range of Kalmar and Hiab equipment to customers globally.
During the same month Kalmar opened its new customer experience and training centre in North Charleston, USA. The facility serves as a showroom, training facility, and customer service centre for Kalmar’s US mobile equipment business.
In June, Kalmar took a step towards its target to provide its full offering as electrically powered versions by 2021 by introducing a medium electric forklift powered by emission-free lithium-ion (Li-ion) battery technology. This is the first forklift in the medium-capacity range to be powered by Li-ion batteries.
In connection with the target, Kalmar introduced in April a fully electric version of the Kalmar Empty Container Handler. The machine is designed to help customers reduce overall fuel costs and comply with increasingly strict airborne and noise emissions standards without compromising on performance.
In May, Navis released N4 3.7, the newest version of its flagship TOS with upgraded product features and expanded capabilities. With this upgrade, Navis continues to enhance its core TOS
12 / 50

CARGOTEC CORPORATION Q3 2019 INTERIM REPORT 22 OCTOBER 2019 AT 2.00 PM EEST
functionality to meet the needs of its manual, semi-automated and fully automated terminal customers.
In March, Navis organised the Navis World event in San Francisco, USA, where Navis and Kalmar customers, experts and partners discussed new innovations that are boosting productivity and operational efficiency in the maritime supply chain. Navis World is an essential event for the industry.
In February, Kalmar announced Cummins as the electrification solution provider for Kalmar’s terminal tractor offering. Cummins will provide powertrain technology, including the batteries, for the Kalmar Electric Terminal Tractor (KT2E) that will be launched in 2020. Kalmar launched the electrically powered Kalmar Ottawa T2E Terminal Tractor in the United States in 2018.
Hiab In August, Hiab started to build a new paint shop at its demountables assembly unit in Raisio, Finland. The expansion is needed to meet the growing demand for demountables. The total investment is over EUR 4 million, which is divided between Hiab and the supplier FSP Finnish Steel Painting that will eventually operate the new paint shop. The expansion is expected to be in operation in January 2020.
In the same month, Hiab announced that it will globally extend the standard warranty to two years for all LOGLIFT and JONSERED forestry and recycling crane models. The warranty will be valid for all cranes ordered from 1 August 2019. Terms and conditions remain the same, including the three year warranty on steel components.
In July, Hiab launched a specialised drywall crane HIAB K-505 HiPro for the US and Canadian markets. It is the longest and strongest drywall crane from Hiab to date with a reach of nine floors and a lifting capacity of almost 300,000 foot-pound force (ft-lbf). The crane is packed with technologically advanced features to enhance operator safety and productivity. It is also the heaviest of Hiab’s drywall cranes.
Starting in the second half of 2019, Hiab will connect the majority of its equipment (all electronic control equipment) as a standard feature from factory. Customers will get equipment prepared for the future and enabled for Connected Services, such as HiConnect™.
The HIAB S-HiPro 230W waste collection crane was announced in June. Specialised for use with underground refuse containers, it is engineered to make it easier for operators to efficiently and safely perform their work in crowded urban centres.
A milestone was reached, when the 75,000th Hiab truck mounted forklift was delivered to Die Behrens-Gruppe of Germany in May. The customer travelled to the MOFFETT production centre in Dundalk, Ireland, to receive an emission-free electric MOFFETT E-series.
During the first half of 2019, Hiab’s HiVision™ system has been expanded to MULTILIFT hooklifts, making hooklift operation easier, safer and quicker. HiVision creates an Augmented Reality experience by overlaying operation guidance and equipment information to real-life footage captured by rear cameras. The driver sees it on a touch-screen display inside the truck cabin that can also be used to operate the hooklift.
In April, Hiab introduced the next generation column lift DEL DL500, which is the most popular choice for 3.5-tonne vehicles in the UK. The new DEL DL500 is lighter, easier to install and comes with new safety features.
Hiab also launched two new modular installation systems for truck bodies; Hiab BodyWorks for heavy cranes and Hiab T-Body for HIAB T-series light range cranes. The modules are
13 / 50

CARGOTEC CORPORATION Q3 2019 INTERIM REPORT 22 OCTOBER 2019 AT 2.00 PM EEST
pre-manufactured and reduce body installation times and costs. Both have a weld-free bolted construction with parts that are easy to remove and replace.
In March, Hiab’s Effer promoted R.A.C.E (Remote Assistance Control EFFER), a function that is part of their electronic management system PROGRESS 2.0. R.A.C.E lets operators to monitor the state of the crane, and access operation data from connected devices, such as smartphones, tablets and PCs. When needed, an Effer service point can immediately provide remote assistance, which can save time and money for the customer.
Effer announced the launch of two brand new light range crane models, 105 and 120. The improved, minimalist design of the new cranes provides an outstanding power-to-weight ratio.
January was the first month of full operations of MULTILIFT’s test area in Raisio, Finland, where Hiab will test trucks equipped with skiploaders and hooklifts. The area gives Hiab the opportunity to test equipment from a customer point of view in difficult weather conditions and terrain. The data gathered under the testing will enable Hiab to improve its products and to come up with new solutions to customer problems.
In January, Hiab opened up a workshop in Longjumeau, south of Paris, which serves customers located around the French capital.
MacGregor MacGregor designed the cargo system and supplied the majority of components for the world’s largest containership, MSC Gülsün, which was delivered by South Korea’s Samsung Heavy Industries in July. The ship is 400 meters long, 62 meters wide and is the first in a series of 11 ultra-large containerships with a capacity of more than 23,000 TEU. Six of the containerships will be built by Samsung Heavy Industries, and the other five by Daewoo Shipbuilding & Marine Engineering. The cargo system design was developed in close collaboration with MSC and, in addition to maximising cargo intake, provides for a high degree of operational and planning flexibility.
In July, MacGregor had the opportunity to travel on the Eidesvik Offshore Support Vessel, Viking Neptun, on a four-day voyage between Rotterdam and Stavanger and hold detailed discussions about the new condition and predictive maintenance digital offering, OnWatch Scout, which has been installed onboard. Eidesvik is one of three Offshore and Merchant pilot customers operating in Europe and Asia that MacGregor is currently working with as part of the OnWatch Scout development and in-service testing process.
During the third quarter, development work on another new digital offering, Breakbulk Optimiser, continued in advance of planned market introduction in December. Breakbulk Optimiser is an automated, cloud-based application that increases cargo planning efficiency and optimises vessel and fleet capacity utilisation.
To further support the development and market adoption of intelligent services, all operationally critical MacGregor equipment have been delivered to customers with the capability to transmit data through an internet gateway included as standard from the second half of 2019.
In June, MacGregor announced an agreement with Kongsberg Maritime to supply an automated mooring system for the world's first autonomous containership, Yara Birkeland. The system will enable mooring operations to be undertaken without human intervention which supports effective operations of the fully electric, zero emission vessel.
Also in June, MacGregor’s new digitally-enabled predictive maintenance service, OnWatch Scout, was introduced to the market at the Nor-Shipping international maritime exhibition held in Oslo,
14 / 50

CARGOTEC CORPORATION Q3 2019 INTERIM REPORT 22 OCTOBER 2019 AT 2.00 PM EEST
Norway. The OnWatch Scout enables operationally critical equipment to be connected to land based monitoring systems that continuously analyse component condition, and can identify changes that indicate a risk of failure. This information enhances the ability to maximise equipment availability, minimise unplanned downtime and more effectively plan maintenance activities - thereby increasing the operational availability of valuable offshore and merchant shipping assets. The OnWatch Scout advanced data analytics capability is being developed in collaboration with one of MacGregor’s recently selected Rainmaking Trade & Transport Impact Programme partners, Arundo Analytics.
MacGregor completed the construction of a FibreTrac crane, the first fibre-rope offshore crane to enter the market. The crane’s full potential and capabilities were demonstrated at an event held in Kristiansand, Norway.
A Google Design Sprint was held during March to support the accelerated development of certain new digital offerings. Through a highly intensive process over a 7-day period, seven MacGregor and customer domain experts focused on the application and customisation of the ‘C-How’ simulation tool to provide an ability to predict and enable increased operational windows within an offshore oil & gas environment. The design sprint outcome was an interactive model that will be taken forward with customers for further validation in operation.
In March, Cargotec, Kalmar, Navis and MacGregor met the 14 most promising start-ups out of more than 600 that were pre-screened at Rainmaking’s Trade & Transport programme. The meeting took place in Hamburg, Germany. The programme connects world leading corporations and innovative startups to address the biggest challenges in maritime, cargo transport and logistics.
Capital expenditure Capital expenditure, excluding acquisitions and customer financing, totalled EUR 39.9 (37.1) million in January–September. Investments in customer financing were EUR 32.6 (26.2) million. Of the capital expenditure, EUR 3.7 (5.7) million concerned intangible assets, such as global systems that in future will enable higher efficiency in operational activities as well as in support functions. Depreciation, amortisation and impairment amounted to EUR 90.2 (57.6) million.
Acquisitions and divestments in 2019 Cargotec announced on 31 July 2019 that its MacGregor business area has completed the acquisition of the marine and offshore businesses of TTS Group ASA. Cargotec announced in February 2018 an agreement to acquire the businesses for an enterprise value of EUR 87 million. The completion of the acquisition follows receipt of required approvals. The acquired businesses will be integrated within MacGregor's operating structure, and their results have been consolidated into MacGregor's financial figures as of 1 August 2019. Based on preliminary estimates, approximately 30 percent of TTS sales are related to TTS companies where the group's ownership is 50 percent. Cargotec plans to consolidate these companies using the equity method, whereby 50 percent of the companies' net profit will be presented in Cargotec's financial statements on the row “Share of associated companies' and joint ventures' net income” before operating profit. This means that sales income from these companies will not be consolidated into Cargotec's sales.
On 7 March 2019 Navis, part of Cargotec, acquired the privately owned company Cetus Labs, Inc. in the US, a provider of a SaaS- and cloud-based terminal operating system (TOS) Octopi for small container and mixed cargo terminals. With the acquisition, Navis is better positioned to support
15 / 50

CARGOTEC CORPORATION Q3 2019 INTERIM REPORT 22 OCTOBER 2019 AT 2.00 PM EEST
thousands of smaller terminals around the world that are eager to modernise terminal operations, yet lack the technology infrastructure and technical expertise required to support a full-scale Navis N4 TOS deployment.
Operational restructurings In May 2017, Cargotec announced it will target EUR 50 million savings by reducing indirect purchasing spend, streamlining processes and planning Cargotec Business Services operations. Cargotec targets annual cost savings of EUR 50 million from 2020 onwards. Approximately EUR 30 million of the savings will come from reductions in global indirect purchasing spend like logistics, external services and facilities. The remaining part of the savings will come from applying new technologies, like automation, in support processes and from the new Cargotec Business Services operations that has started its activities in Sofia, Bulgaria. In January–September 2019, the realised savings from the programme amounted to around EUR 9.5 million and cumulatively since the beginning of the programme EUR 30.7 million. The estimated restructuring costs related to the programme are around EUR 16 million in 2019.
We estimate the restructuring costs in 2019 to be around EUR 75 million in total, of which EUR 50 million will relate to the fourth quarter. The majority of this will relate to adjustments at MacGregor business and reaching the synergy benefits from the TTS acquisition.
More information regarding restructuring costs and other items affecting comparability is available in Note 5, Comparable operating profit.
Personnel Cargotec employed 12,742 (31 Dec 2018: 11,987) people at the end of the third quarter. Kalmar employed 5,762 (5,737) people, Hiab 4,033 (3,879), MacGregor 2,377 (1,879), and corporate administration and support functions 570 (492). The average number of employees in January–September was 12,417 (1–12/2018: 11,589).
At the end of September, 9 (31 Dec 2018: 9) percent of the employees were located in Sweden, 8 (8) percent in Finland, and 49 (48) percent in the rest of Europe. Asia-Pacific personnel represented 19 (20) percent, Americas 13 (13) percent, and the rest of the world 2 (2) percent of total employees.
Sustainability Climate change is one of the megatrends affecting the industry. One of Cargotec’s main focus areas and business drivers is to minimise the carbon footprint of logistics by using eco-efficient solutions, continue developing the offering of products as electrically powered versions and using renewable energy in own operations. There is a lot of potential to reduce the industry’s carbon footprint by optimising cargo handling with smart solutions.
Eco-efficiency offering accounted for 20 percent of the total sales in January–September 2019 (1–9/2018: 20%).
In order to be even better prepared for the future requirements on e.g. non-financial reporting and to identify more opportunities in reducing the carbon footprint in the value chain, a detailed carbon footprint calculation was carried out during the third quarter. The results highlight the need to focus
16 / 50

CARGOTEC CORPORATION Q3 2019 INTERIM REPORT 22 OCTOBER 2019 AT 2.00 PM EEST
on the greenhouse gas emissions in the supply chain and continue developing our eco-efficiency product portfolio.
Our industrial injury frequency rate (IIFR) at the end of Q3 was 6.4. The IIFR in our assembly sites 1
was 5.7 and in our other operations 6.8. Our target is to reach an IIFR of 5.0 in our assembly in 2019 and an IIFR of 4.0 in 2021. Continuous improvement actions across all businesses with a focus on safety during the period have led to an overall decrease in the injury rate.
Our target for this year is to re-audit 50 percent of the suppliers that failed in the 2018 sustainability self-assessment questionnaire. The low-scored questionnaires have been reviewed and re-audits are currently taking place. Sourcing function has focused also on increasing the coverage of the Supplier Code of Conduct. In addition, the supplier sustainability audit process has been defined and approved by the Cargotec Sourcing Council, which includes Cargotec’s CEO, business area presidents and sourcing heads.
Leadership Team On 30 September 2019, Cargotec’s Leadership Team consisted of Mika Vehviläinen, CEO; Mikko Puolakka, Executive Vice President, CFO; Mikko Pelkonen, Senior Vice President, Human Resources; Mikael Laine, Senior Vice President, Strategy; Soili Mäkinen, CIO; Outi Aaltonen, General Counsel; Carina Geber-Teir, Senior Vice President, Communications; Antti Kaunonen, President, Kalmar Automation Solutions; Stefan Lampa, President, Kalmar Mobile Solutions; Scott Phillips, President, Hiab; and Michel van Roozendaal, President, MacGregor.
1 Industrial injury frequency rate: number of injuries per million hours worked, last 12 months
17 / 50

CARGOTEC CORPORATION Q3 2019 INTERIM REPORT 22 OCTOBER 2019 AT 2.00 PM EEST
Reporting segments Kalmar MEUR Q3/19 Q3/18 Change Q1-Q3/19 Q1-Q3/18 Change 2018 Orders received 396 486 -19% 1,329 1,469 -9% 1,919 Order book, end of period 1,083 1,003 8% 1,083 1,003 8% 1,012 Sales 424 415 2% 1,252 1,174 7% 1,618 Service sales 116 111 4% 340 333 2% 449
% of sales 27% 27% 27% 28% 28% Software sales 44 39 10% 122 100 22% 147
% of sales 10% 10% 10% 9% 9% Operating profit 47.5 38.6 23% 113.3 91.0 24% 138.1
% of sales 11.2% 9.3% 9.0% 7.8% 8.5% Comparable operating profit 47.8 38.6 24% 117.8 92.5 27% 143.6
% of sales 11.3% 9.3% 9.4% 7.9% 8.9% Personnel, end of period 5,762 5,670 2% 5,762 5,670 2% 5,737
In the third quarter, orders received by Kalmar decreased by 19 percent and totalled EUR 396 (486) million. In comparable foreign exchange rates, orders received decreased by 20 percent.
Major orders received by Kalmar in the third quarter included:
● 25 hybrid shuttle carriers in the US, ● software maintenance and support agreement covering the customer’s entire automated
guided vehicle (AGV) fleet in Singapore, ● order of two ship-to-shore (STS) cranes and three rubber-tyred gantry cranes (RTGs) in
Mexico, ● upgrade of four ship-to-shore (STS) cranes in Morocco, and ● preventive and corrective maintenance services to customer's container terminal in Las
Palmas, Spain.
In January–September, orders received by Kalmar decreased by nine percent and totalled EUR 1,329 (1,469) million. In comparable foreign exchange rates, orders received decreased by 11 percent.
Kalmar’s order book increased by seven percent from the end of 2018, and at the end of the third quarter it totalled EUR 1,083 (31 Dec 2018: 1,012) million.
Kalmar’s third quarter sales increased by two percent from the comparison period and totalled EUR 424 (415) million. Service sales increased by four percent and totalled EUR 116 (111) million, representing 27 (27) percent of sales. In comparable foreign exchange rates and excluding the impact of divested and acquired businesses, service sales increased by three percent. Software sales increased by 10 percent and amounted to EUR 44 (39) million. In comparable foreign exchange rates, software sales increased by six percent.
January–September sales increased by seven percent from the comparison period and totalled EUR 1,252 (1,174) million. Service sales increased by two percent and totalled EUR 340 (333) million, representing 27 (28) percent of sales. In comparable foreign exchange rates and excluding the impact of divested and acquired businesses, service sales increased by five percent. Software
18 / 50

CARGOTEC CORPORATION Q3 2019 INTERIM REPORT 22 OCTOBER 2019 AT 2.00 PM EEST
sales increased by 22 percent and amounted to EUR 122 (100) million. In comparable foreign exchange rates, software sales increased by 17 percent.
Kalmar’s third quarter operating profit totalled EUR 47.5 (38.6) million. Operating profit includes EUR -0.3 (0.0) million in items affecting comparability. Comparable operating profit amounted to EUR 47.8 (38.6) million, representing 11.3 (9.3) percent of sales. Kalmar’s comparable operating profit increased due to growth in sales and a favourable mix.
January–September operating profit totalled EUR 113.3 (91.0) million. Operating profit includes EUR -4.5 (-1.5) million in items affecting comparability. Comparable operating profit amounted to EUR 117.8 (92.5) million, representing 9.4 (7.9) percent of sales.
19 / 50

CARGOTEC CORPORATION Q3 2019 INTERIM REPORT 22 OCTOBER 2019 AT 2.00 PM EEST
Hiab MEUR Q3/19 Q3/18 Change Q1-Q3/19 Q1-Q3/18 Change 2018 Orders received 307 294 4% 988 902 9% 1,259 Order book, end of period 458 371 23% 458 371 23% 453 Sales 307 260 18% 982 831 18% 1,149 Service sales 86 75 14% 256 227 13% 309
% of sales 28% 29% 26 % 27% 27% Operating profit 30.3 23.9 27% 111.0 99.4 12% 133.8
% of sales 9.9% 9.2% 11.3 % 12.0% 11.6% Comparable operating profit 34.1 24.2 41% 118.4 99.6 19% 134.5
% of sales 11.1% 9.3% 12.1 % 12.0% 11.7% Personnel, end of period 4,033 3,650 10% 4,033 3,650 10% 3,879 Hiab’s orders received for the third quarter increased by four percent from the comparison period and totalled EUR 307 (294) million. In comparable foreign exchange rates, orders received increased by two percent. Orders received decreased in EMEA and Asia-Pacific and increased in Americas. Hiab’s orders received included a record-breaking agreement, announced in July, to supply MOFFETT truck mounted forklifts with five year ProCare Essential service contracts and equipped with HiConnect™ for each unit with one of the largest home improvement chains in the USA. The total order value is over EUR 60 million, of which EUR 29 million was booked for the third quarter and EUR 31 million to the second quarter. During the third quarter, Hiab also received three separate loader crane orders worth over EUR 1 million in total. Other Hiab orders were relatively small individual ones, which is typical for its business.
In January–September, orders received by Hiab increased by nine percent from the comparison period and totalled EUR 988 (902) million. In comparable foreign exchange rates, orders received increased by eight percent.
Hiab’s order book increased by one percent from the end of 2018 and totalled EUR 458 (31 Dec 2018: 453) million at the end of the third quarter.
Hiab’s third quarter sales increased by 18 percent and totalled EUR 307 (260) million. Sales increased in EMEA and Americas and declined in Asia-Pacific. Service sales grew by 14 percent to EUR 86 (75) million, representing 28 (29) percent of sales. In January–September, sales increased by 18 percent and totalled EUR 982 (831) million. Service sales grew by 13 percent to EUR 256 (227) million, representing 26 (27) percent of sales.
Operating profit for Hiab in the third quarter increased from the comparison period and totalled EUR 30.3 (23.9) million. Operating profit includes EUR -3.7 (-0.3) million in items affecting comparability. Comparable operating profit amounted to EUR 34.1 (24.2) million, representing 11.1 (9.3) percent of sales. Hiab’s comparable operating profit increased due to growth in sales.
Operating profit for Hiab in January–September increased from the comparison period and totalled EUR 111.0 (99.4) million. Operating profit includes EUR -7.4 (-0.3) million in items affecting comparability. Comparable operating profit amounted to EUR 118.4 (99.6) million, representing 12.1 (12.0) percent of sales.
20 / 50

CARGOTEC CORPORATION Q3 2019 INTERIM REPORT 22 OCTOBER 2019 AT 2.00 PM EEST
MacGregor MEUR Q3/19 Q3/18 Change Q1-Q3/19 Q1-Q3/18 Change 2018 Orders received 156 141 10% 437 396 10% 580 Order book, end of period 712 513 39% 712 513 39% 530 Sales 170 130 31% 436 389 12% 538 Service sales 67 53 27% 181 163 11% 222
% of sales 40% 41% 42% 42% 41% Operating profit -9.8 0.2 < -100% -23.4 3.1 < -100% -4.2
% of sales -5.8% 0.1% -5.4% 0.8% -0.8% Comparable operating profit -5.8 1.0 < -100% -15.6 5.2 < -100% -1.6
% of sales -3.4% 0.8% -3.6% 1.3% -0.3% Personnel, end of period 2,377 1,884 26% 2,377 1,884 26% 1,879
MacGregor’s orders received in the third quarter increased by 10 percent from the comparison period to EUR 156 (141) million. In comparable foreign exchange rates, orders received increased by 11 percent. Around three fourths of the orders received were related to merchant ships and one fourth to the offshore sector. Orders received increased in EMEA and Americas and decreased in Asia-Pacific.
MacGregor’s orders received in the third quarter included TTS orders worth EUR 21 million. TTS sales were EUR 18 million, and its comparable operating profit was EUR 1.9 million. The TTS order book at the end of the third quarter was EUR 218 million.
Major orders received by MacGregor in the third quarter included:
● MacGregor and TTS products (ramps, car deck and lifting platform equipment) to a naval project in Europe and to a RoRo project in Asia,
● a framework purchasing agreement with COSCO Shipping to support MacGregor equipment installed on more than 1,000 ships operating worldwide, and
● folding hatch covers for four 8,000 dwt coal carriers to be built at Cochin shipyard, India. The turnkey project includes design and supply of key components, hatch cover fabrication and commissioning of the complete system.
MacGregor’s orders received in January–September increased by 10 percent from the comparison period to EUR 437 (396) million. In comparable foreign exchange rates, orders received increased by 10 percent.
MacGregor’s order book increased by 34 percent from the end of 2018, totalling EUR 712 (31 Dec 2018: 530) million at the end of the third quarter. Around three fourths of the order book is merchant ship-related and one fourth is offshore vessel-related.
MacGregor’s third quarter sales increased by 31 percent from the comparison period to EUR 170 (130) million. Service sales totalled EUR 67 (53) million, representing 40 (41) percent of sales. January–September sales increased by 12 percent from the comparison period to EUR 436 (389) million. Service sales grew by 11 percent to EUR 181 (163) million, representing 42 (42) percent of sales.
MacGregor’s operating profit for the third quarter totalled EUR -9.8 (0.2) million. Operating profit includes EUR -4.0 (-0.8) million in items affecting comparability. Comparable operating profit
21 / 50

CARGOTEC CORPORATION Q3 2019 INTERIM REPORT 22 OCTOBER 2019 AT 2.00 PM EEST
totalled EUR -5.8 (1.0) million, representing -3.4 (0.8) percent of sales. MacGregor’s comparable operating profit declined due to low capacity utilisation, lower sales margins, and cost overruns in certain offshore projects.
January–September operating profit totalled EUR -23.4 (3.1) million. Operating profit includes EUR -7.8 (-2.1) million in items affecting comparability. Comparable operating profit totalled EUR -15.6 (5.2) million, representing -3.6 (1.3) percent of sales.
22 / 50

CARGOTEC CORPORATION Q3 2019 INTERIM REPORT 22 OCTOBER 2019 AT 2.00 PM EEST
Annual General Meeting and shares Decisions taken at the Annual General Meeting Cargotec Corporation’s Annual General Meeting (AGM), held on 19 March 2019, adopted the financial statements and the consolidated financial statements of the year 2018. The meeting granted discharge from liability for the CEO and the members of the Board of Directors for the accounting period 1 January–31 December 2018. The AGM approved a dividend of EUR 1.09 to be paid for each class A share and a dividend of EUR 1.10 to be paid for each class B share outstanding. The dividend was decided to be paid in two instalments, EUR 0.55 in March and the rest in October 2019. The first instalment was paid on 28 March 2019 and the second instalment on 10 October 2019.
The AGM authorised the Board to decide on the repurchase of Cargotec's shares with non-restricted equity. Altogether no more than 6,400,000 shares in the company may be purchased, of which no more than 952,000 are class A shares and 5,448,000 are class B shares. The authorisation shall remain in effect for a period of 18 months from the resolution by the general meeting and it supersedes the previous one. In addition, the AGM authorised the Board of Directors to decide on the issuance of shares as well as the issuance of options and other special rights entitling to shares referred to in chapter 10 section 1 of the Finnish Companies Act. The authorisation remains in effect for a period of five years following the date of decision of the general meeting and it supersedes the previous one.
The number of the Board members was confirmed at nine. Jorma Eloranta, Tapio Hakakari, Ilkka Herlin, Peter Immonen, Teresa Kemppi-Vasama, Johanna Lamminen, Kaisa Olkkonen, Teuvo Salminen and Heikki Soljama were re-elected to the Board of Directors. The AGM elected accounting firm PricewaterhouseCoopers Oy as auditor. The auditors' fees were decided to be paid according to their invoice reviewed by the company.
On 19 March 2019, Cargotec Corporation's Board of Directors elected by the Annual General Meeting elected at its organising meeting Ilkka Herlin to continue as Chairman of the Board. Tapio Hakakari was elected to continue as Vice Chairman. The Board also elected the Chairmen and the members for the Audit and Risk Management Committee as well as the Nomination and Compensation Committee.
Outi Aaltonen, Senior Vice President, General Counsel, continues as Secretary to the Board. Cargotec published stock exchange releases on the decisions taken at the AGM as well as the Board of Directors’ organising meeting on 19 March 2019. The stock exchange releases and presentations of the members of the Board of Directors are available on Cargotec’s website at www.cargotec.com.
Shares and trading Share capital, own shares and share issue Cargotec Corporation’s share capital totalled EUR 64,304,880 at the end of September. The number of class B shares was 55,182,079, while the number of class A shares totalled 9,526,089.
On 19 March 2019, the Board of Directors decided on a directed share issue related to the reward payments for share-based incentive programmes. The share reward payments are related to Cargotec's share-based incentive programme launched in 2016, 2018 allocation of restricted
23 / 50

CARGOTEC CORPORATION Q3 2019 INTERIM REPORT 22 OCTOBER 2019 AT 2.00 PM EEST
shares programme 2016–2018 under the share-based incentive programme 2016 and performance period 2017–2018 of share-based incentive programme launched in 2017.
In the share issue, 115,275 own class B shares held by the company were transferred without consideration to the key employees participating in the share based incentive programmes in accordance with the programme specific terms and conditions. More detailed information about the launch and the terms and conditions of the programmes is available in stock exchange releases published on 10 February 2016 and on 8 February 2017.
The decision on the directed share issue is based on the authorisation granted to the Board of Directors by the Annual General Meeting on 19 March 2019. According to the authorisation, the Board of Directors can decide on a share issue amounting to a maximum of 952,000 class A shares and 5,448,000 class B shares.
In January 2019, Cargotec repurchased a total of 40,000 class B shares based on the authorisation of the Annual General Meeting on 20 March 2018 for a total cost of EUR 1,116,632.00. The shares were repurchased for use as reward payments for the share-based incentive programmes.
At the end of September, Cargotec held a total of 304,328 own class B shares, accounting for 0.47 percent of the total number of shares and 0.20 percent of the total number of votes. At the end of September, the number of outstanding class B shares totalled 54,877,751.
Share-based incentive programmes In February 2019, the Board of Directors of Cargotec Corporation has resolved on the performance criteria for the share-based incentive programme for the year 2019. The performance share programme, approved by the Board of Directors in 2017, includes three performance periods, calendar years 2017–2018, 2018–2019 and 2019–2020. Each performance period includes two measuring periods, both lasting for one calendar year. The Board of Directors will annually resolve on the performance criteria for each measuring period.
For the performance period of 2018–2019 started in 2018, the potential reward for the measuring period 2019 will be based on each business area’s comparable operating profit for the key employees of the business areas Kalmar, Hiab and MacGregor, and for Navis software divisions’ key employees, on Navis’ sales. For Cargotec Corporate key employees, the performance criterion is Cargotec’s comparable operating profit. After the end of the performance period, the Board of Directors will confirm the cumulative amount of rewards earned from the measuring periods 2018 and 2019, and potential rewards from the performance period 2018–2019 will be paid partly in Cargotec's class B shares and partly in cash in 2020. As a rule, no reward will be paid, if a key employee's employment or service ends before the reward payment. The shares paid as reward may not be transferred during an approximate one-year ownership and value creation period established for the shares.
For the new performance period of 2019–2020, the programme is directed to approximately 150 key employees, including the members of the Leadership Team. The incentive programme supports increasing growth of the service and software business according to Cargotec’s strategy. For the key employees of the business areas Kalmar, Hiab and MacGregor, the potential reward of the measuring period 2019 will be based on each business area’s comparable service gross profit, and for Navis software divisions’ key employees, on Navis’ sales and on sales excluding TOS business. For the Cargotec Corporate key employees, the performance criterion is Cargotec’s service gross profit. The rewards to be paid on the basis of the performance period 2019–2020 will amount up to an approximate maximum total of 294,000 Cargotec’s class B shares. In addition, the
24 / 50

CARGOTEC CORPORATION Q3 2019 INTERIM REPORT 22 OCTOBER 2019 AT 2.00 PM EEST
rewards include cash proportions that are intended to cover taxes and tax-related costs arising from the reward to the key employees.
In February 2019, the Board of Directors of Cargotec Corporation has also resolved to establish a new restricted shares programme for 2019. As a part of total compensation, additional restricted share grants can be allocated for selected key employees for recruitment and retention purposes in 2019. Restriction period of the shares continues until the end of March 2021. The rewards to be paid on the basis of the programme will amount up to an approximate maximum total of 27,000 Cargotec’s class B shares. In addition, the rewards include cash proportions that are intended to cover taxes and tax-related costs arising from the reward to the key employees.
In February 2019, the Board of Directors of Cargotec Corporation has also resolved to establish a new matching share programme directed to the Group executives. The aim is to align the objectives of the shareholders and the executives in order to increase the value of the company in the long-term, and to further strengthen the shareowner alignment by encouraging the executives to personally invest in the company’s shares. The Matching Share Programme is directed to maximum seven Group executives in total, including the Chief Executive Officer. More detailed information about the launch and the terms and conditions of the programme is available in stock exchange release published on 20 February 2019.
Market capitalisation and trading At the end of September, the total market value of class B shares was EUR 1,620 (2,128) million, excluding own shares held by the company. The period-end market capitalisation, in which unlisted class A shares are valued at the average price of class B shares on the last trading day of the period, was EUR 1,902 (2,498) million, excluding own shares held by the company.
The class B share closed at EUR 29.52 (38.72) on the last trading day of September on Nasdaq Helsinki. The volume-weighted average share price in January–September was EUR 31.35 (44.04), the highest quotation being EUR 38.48 (51.30) and the lowest EUR 24.12 (38.06). During the period, a total of 22 (25) million class B shares were traded on Nasdaq Helsinki, corresponding to a turnover of EUR 702 (1,097) million. In addition, according to Euroland, a total of 2.3 (2.6) million class B shares were traded in alternative marketplaces Chi-X and BATS.
Short-term risks and uncertainties Developments in the global economy and cargo flows have a direct effect on Cargotec’s business environment and customers’ willingness to invest. A slowdown in global economic growth could reduce the growth in container traffic. Project executions face risks related to schedule, cost and delivery guarantees. Furthermore, potential bottlenecks in the supply chain could postpone deliveries and have a negative impact on sales and results. Also challenges related to the availability of skilled workforce and the company’s ability to retain it can impact operational performance negatively. Political uncertainty and trade war could have an impact on global flow of goods and therefore on the demand of Cargotec’s solutions. Hiab’s demand is impacted by the development of the construction market. A significant share of Hiab’s orders are from the United States. Even though the cash flows are hedged for the existing order book, the weakening of the US dollar in the longer term could weaken Hiab’s results. Greater difficulty in obtaining financing would weaken customers’ liquidity and investments.
MacGregor's market situation still involves uncertainties. It is anticipated that the oversupply in the merchant ship market will take time to balance out, since capacity will continue to increase while demand is expected to grow very moderately. The tightening emission regulation for ships may
25 / 50

CARGOTEC CORPORATION Q3 2019 INTERIM REPORT 22 OCTOBER 2019 AT 2.00 PM EEST
limit new investments in the short term. The uncertainty regarding oil price development has led to an intense fall in investments by the oil industry and created oversupply in the offshore market. The concurrent deterioration in both markets has a negative impact on the financial situation of shipyards and ship owners, as well as ship operators. In the challenging market situation, customers may also try to postpone or cancel orders. In some cases, the financial situation of customers may deteriorate significantly or even lead to customer insolvency.
Cargotec is involved in certain legal disputes and trials. The interpretation of international agreements and legislation may weaken the predictability of the end results of legal disputes and trials.
Risks regarding Cargotec’s acquisitions are related to, for example, the knowledge of the local markets, authority processes, customers, corporate culture, integration as well as key employees.
There are also ethical risks related to the industries and the geographical scope where Cargotec operates in. Cargotec has increased its investments to ensure ethical business practices and the related internal processes are continuously being developed further.
More information on risks is available at www.cargotec.com, under Investors > Governance > Internal control and risk management.
Outlook for 2019 Cargotec reiterates its outlook published on 8 February 2019 and expects its comparable operating profit for 2019 to improve from 2018 (EUR 242.1 million).
Financial calendar 2020 Financial Statements review 2019 on Thursday, 6 February 2020
Cargotec's Financial Statements 2019 and Annual Report 2019 will be available at www.cargotec.com on week 8
The Annual General Meeting of Cargotec Corporation will be held on Tuesday, 17 March 2020.
Interim report January–March 2020 on Thursday, 23 April 2020
Half year financial report January–June 2020 on Friday, 17 July 2020
Interim report January–September 2020 on Thursday, 22 October 2020
Helsinki, 22 October 2019 Cargotec Corporation Board of Directors
This interim report is unaudited.
26 / 50

CARGOTEC CORPORATION Q3 2019 INTERIM REPORT 22 OCTOBER 2019 AT 2.00 PM EEST
Consolidated statement of income
MEUR Q3/19 Q3/18 Q1-Q3/19 Q1-Q3/18 2018 Sales 901.3 804.6 2,668.6 2,393.7 3,303.5 Cost of goods sold -691.1 -607.8 -2,035.2 -1,795.3 -2,489.3 Gross profit 210.2 196.7 633.4 598.4 814.2 Gross profit, % 23.3% 24.4% 23.7% 25.0% 24.6%
Other operating income 8.4 8.6 24.8 30.1 44.8 Selling and marketing expenses -56.5 -57.9 -175.8 -173.3 -234.4 Research and development expenses -23.7 -22.2 -75.2 -70.5 -94.7 Administration expenses -61.8 -60.3 -193.2 -188.6 -252.9 Restructuring costs -10.0 -2.6 -26.6 -41.3 -53.8 Other operating expenses -7.7 -8.7 -23.3 -26.3 -35.4
Costs and expenses -151.3 -143.1 -469.4 -469.9 -626.5 Share of associated companies’ and joint ventures’ net income -1.0 0.9 -2.1 0.6 2.3 Operating profit 57.9 54.5 162.0 129.1 190.0 Operating profit, % 6.4% 6.8% 6.1% 5.4% 5.8% Financing income and expenses -7.9 -7.6 -24.3 -20.1 -28.9 Income before taxes 50.0 47.0 137.7 108.9 161.1 Income before taxes, % 5.6% 5.8% 5.2% 4.6% 4.9% Income taxes -20.3 -9.0 -48.0 -35.0 -53.1 Net income for the period 29.7 37.9 89.7 73.9 108.0 Net income for the period, % 3.3% 4.7% 3.4% 3.1% 3.3% Net income for the period attributable to: Equity holders of the parent 29.7 37.6 89.6 73.0 107.0 Non-controlling interest 0.0 0.4 0.1 0.9 1.1 Total 29.7 37.9 89.7 73.9 108.0 Earnings per share for profit attributable to the equity holders of the parent:
Earnings per share, EUR 0.46 0.58 1.39 1.13 1.66 Diluted earnings per share, EUR 0.46 0.58 1.39 1.13 1.65 The notes are an integral part of the interim report.
27 / 50

CARGOTEC CORPORATION Q3 2019 INTERIM REPORT 22 OCTOBER 2019 AT 2.00 PM EEST
Consolidated statement of comprehensive income MEUR Q3/19 Q3/18 Q1-Q3/19 Q1-Q3/18 2018 Net income for the period 29.7 37.9 89.7 73.9 108.0 Other comprehensive income Items that cannot be reclassified to statement of income:
Actuarial gains (+) / losses (-) from defined benefit plans 0.3 -0.3 1.3 1.8 -2.1 Taxes relating to items that cannot be reclassified to statement of income -0.1 0.1 -0.2 -0.8 -0.1
Items that can be reclassified to statement of income:
Gains (+) / losses (-) on cash flow hedges -17.8 -2.8 -12.0 -20.3 -31.2 Gains (+) / losses (-) on cash flow hedges transferred to statement of income 3.7 3.1 3.5 7.3 11.5 Translation differences 8.3 -0.7 19.8 -8.0 -13.0 Taxes relating to items that can be reclassified to statement of income 2.7 -0.1 1.6 2.8 4.0
Other comprehensive income, net of tax -2.8 -0.9 13.9 -17.2 -30.8 Comprehensive income for the period 26.9 37.0 103.6 56.7 77.3
Comprehensive income for the period attributable to: Equity holders of the parent 26.9 36.7 103.5 55.8 76.2 Non-controlling interest 0.0 0.3 0.1 0.9 1.0 Total 26.9 37.0 103.6 56.7 77.3 The notes are an integral part of the interim report.
28 / 50

CARGOTEC CORPORATION Q3 2019 INTERIM REPORT 22 OCTOBER 2019 AT 2.00 PM EEST
Consolidated balance sheet
ASSETS, MEUR 30 Sep
2019 30 Sep
2018 31 Dec
2018 Non-current assets
Goodwill 1,041.9 956.7 970.9 Other intangible assets 299.1 251.0 278.6 Property, plant and equipment 471.0 306.8 308.7 Investments in associated companies and joint ventures 112.6 96.8 99.8 Share investments 0.3 0.3 0.3 Loans receivable and other interest-bearing assets* 28.2 36.6 36.0 Deferred tax assets 128.1 149.1 137.3 Other non-interest-bearing assets 9.9 10.0 9.5
Total non-current assets 2,091.2 1,807.3 1,841.1 Current assets
Inventories 834.0 699.0 688.8 Loans receivable and other interest-bearing assets* 1.2 2.5 1.8 Income tax receivables 41.1 66.5 56.0 Derivative assets 10.9 16.9 17.4 Accounts receivable and other non-interest-bearing assets 878.1 768.7 822.5 Cash and cash equivalents* 388.2 189.3 256.3
Total current assets 2,153.5 1,742.9 1,842.8 Total assets 4,244.6 3,550.3 3,683.9
29 / 50

CARGOTEC CORPORATION Q3 2019 INTERIM REPORT 22 OCTOBER 2019 AT 2.00 PM EEST
EQUITY AND LIABILITIES, MEUR 30 Sep
2019 30 Sep
2018 31 Dec
2018 Equity attributable to the equity holders of the parent
Share capital 64.3 64.3 64.3 Share premium account 98.0 98.0 98.0 Translation differences -24.4 -39.2 -44.2 Fair value reserves -20.4 -8.1 -13.5 Reserve for invested non-restricted equity 57.4 69.0 58.5 Retained earnings 1,258.8 1,224.6 1,262.5
Total equity attributable to the equity holders of the parent 1,433.6 1,408.5 1,425.6
Non-controlling interest 2.8 2.9 3.0 Total equity 1,436.5 1,411.4 1,428.5 Non-current liabilities
Interest-bearing liabilities* 967.5 585.6 717.1 Deferred tax liabilities 33.5 17.7 28.1 Pension obligations 93.5 87.2 92.3 Provisions 7.8 14.9 10.7 Other non-interest-bearing liabilities 64.5 57.5 58.6
Total non-current liabilities 1,166.8 763.0 906.8 Current liabilities
Current portion of interest-bearing liabilities* 230.2 166.9 168.4 Other interest-bearing liabilities* 146.8 124.7 44.5 Provisions 92.7 87.4 86.7 Advances received** 258.4 168.4 190.3 Income tax payables 16.9 42.9 39.6 Derivative liabilities 22.6 9.3 5.8 Accounts payable and other non-interest-bearing liabilities** 873.8 776.3 813.5
Total current liabilities 1,641.4 1,375.9 1,348.6 Total equity and liabilities 4,244.6 3,550.3 3,683.9 *Included in interest-bearing net debt. **Starting from 31 Dec 2018, amounts due to customers from construction contracts as well as advance payments from service contracts and software business have been presented on the balance sheet on “Advances received” instead of “Accounts payable and other non-interest-bearing liabilities”. The regrouped amount in the comparison period on 30 Sep 2018 was EUR 86.5 million. The notes are an integral part of the interim report.
30 / 50

CARGOTEC CORPORATION Q3 2019 INTERIM REPORT 22 OCTOBER 2019 AT 2.00 PM EEST
Consolidated statement of changes in equity
Attributable to the equity holders of the parent
Non- controllin g interest
Total equity MEUR
Share capital
Share premium account
Translation differences
Fair value reserves
Reserve for invested
non-restricted equity
Retained earnings Total
Equity 1 Jan 2019 64.3 98.0 -44.2 -13.5 58.5 1,262.5 1,425.6 3.0 1,428.5 +/- IFRS 16 transition effect -9.9 -9.9 0.0 -9.9
+/- IFRIC 23 transition effect -14.6 -14.6 -14.6 Restated equity 1 Jan 2019 64.3 98.0 -44.2 -13.5 58.5 1,237.9 1,401.0 3.0 1,404.0
Net income for the period 89.6 89.6 0.1 89.7
Cash flow hedges -6.9 -6.9 0.0 -6.9
Translation differences 19.8 19.8 0.0 19.8 Actuarial gains (+) / losses (-) from defined benefit plans 1.0 1.0 1.0
Comprehensive income for the period* - - 19.8 -6.9 - 90.7 103.5 0.1 103.6
Profit distribution -70.6 -70.6 -0.3 -70.9
Treasury shares acquired -1.1 - -1.1 -1.1
Share-based payments* 0.9 0.9 0.9 Transactions with owners of the company - - - - -1.1 -69.7 -70.8 -0.3 -71.1
Transactions with non-controlling interests - 0.0 0.0
Equity 30 Sep 2019 64.3 98.0 -24.4 -20.4 57.4 1,258.8 1,433.6 2.8 1,436.5
Equity 1 Jan 2018 64.3 98.0 -31.2 2.1 69.0 1,226.5 1,428.7 2.3 1,431.0 Net income for the period 73.0 73.0 0.9 73.9
Cash flow hedges -10.3 -10.3 0.0 -10.3
Translation differences -8.0 -8.0 0.0 -8.0 Actuarial gains (+) / losses (-) from defined benefit plans 1.0 1.0 1.0
Comprehensive income for the period* - - -8.0 -10.3 - 74.0 55.8 0.9 56.7
Profit distribution -67.6 -67.6 -0.3 -68.0
Treasury shares acquired - -6.1 -6.1 -6.1
Share-based payments* -2.3 -2.3 -2.3 Transactions with owners of the company - - - - - -76.0 -76.0 -0.3 -76.3
Transactions with non-controlling interests - 0.0 0.0
Equity 30 Sep 2018 64.3 98.0 -39.2 -8.1 69.0 1,224.6 1,408.5 2.9 1,411.4 *Net of tax
The notes are an integral part of the interim report.
31 / 50

CARGOTEC CORPORATION Q3 2019 INTERIM REPORT 22 OCTOBER 2019 AT 2.00 PM EEST
Consolidated condensed statement of cash flows MEUR Q1-Q3/19 Q1-Q3/18 2018 Net cash flow from operating activities Net income for the period 89.7 73.9 108.0 Depreciation, amortisation and impairment 90.2 57.6 77.2 Other adjustments 73.9 73.0 99.2 Change in net working capital -100.7 -164.7 -158.7 Cash flow from operations before financing items and taxes 153.1 39.8 125.8 Cash flow from financing items and taxes -69.2 -83.8 -85.6 Net cash flow from operating activities 83.8 -44.0 40.2 Net cash flow from investing activities Acquisitions of businesses, net of cash acquired -107.0 -20.2 -70.7 Disposals of businesses, net of cash sold - -15.8 -15.5 Investments in associated companies and joint ventures - -0.5 -0.5 Cash flow from investing activities, other items -30.6 -48.2 -50.6 Net cash flow from investing activities -137.5 -84.8 -137.3 Net cash flow from financing activities Treasury shares acquired -2.2 -6.1 -9.4 Repayments of lease liabilities -32.0 -1.0 -1.3 Proceeds from long-term borrowings 298.2 50.0 199.5 Repayments of long-term borrowings -151.8 -66.6 -83.7 Proceeds from short-term borrowings 270.1 96.2 3.4 Repayments of short-term borrowings -145.0 -3.0 -2.6 Profit distribution -35.6 -65.8 -68.0 Net cash flow from financing activities 201.6 3.6 37.7 Change in cash and cash equivalents 147.9 -125.2 -59.3 Cash and cash equivalents, and bank overdrafts at the beginning of period 225.5 284.7 284.7 Effect of exchange rate changes 7.0 1.0 0.1 Cash and cash equivalents, and bank overdrafts at the end of period 380.3 160.5 225.5 Bank overdrafts at the end of period 7.8 28.8 30.8 Cash and cash equivalents at the end of period 388.2 189.3 256.3 The notes are an integral part of the interim report.
32 / 50

CARGOTEC CORPORATION Q3 2019 INTERIM REPORT 22 OCTOBER 2019 AT 2.00 PM EEST
Key figures Q1-Q3/19 Q1-Q3/18 2018 Equity / share EUR 22.26 21.84 22.16 Total equity / total assets* % 36.0% 41.7% 40.9% Interest-bearing net debt MEUR 927.0 639.4 625.5 Interest-bearing net debt / EBITDA, last 12 months 2.8 2.5 2.3 Gearing % 64.5% 45.3% 43.8% Return on equity (ROE), last 12 months % 8.7% 7.2% 7.6% Return on capital employed (ROCE), last 12 months % 8.6% 7.9% 8.0%
*Starting from 31 Dec 2018, amounts due to customers from construction contracts as well as advance payments from service contracts and software business have been presented on the balance sheet on “Advances received” instead of “Accounts payable and other non-interest-bearing liabilities”. Due to the restatement of the comparison period's figures, the total equity / total assets ratio increased by 1.0 percentage points in Q1-Q3/18.
Additional information regarding interest-bearing net debt and gearing is disclosed in note 9, Interest-bearing net debt and liquidity.
Notes to the interim report 1. General information Cargotec Corporation (1927402-8) is a limited liability company domiciled in Helsinki, Finland. The registered address is Porkkalankatu 5, 00180 Helsinki, Finland. Cargotec Corporation and its subsidiaries form the Cargotec Group (later referred to as Cargotec or company). Cargotec Corporation's class B shares are listed on Nasdaq Helsinki Ltd since 1 June 2005.
2. Accounting principles and new accounting standards The interim report has been prepared according to IAS 34 Interim Financial Reporting. The accounting policies adopted are consistent with those of the annual financial statements for 2018 and comply with changes in IAS/IFRS standards effective from 1 January 2019. All figures presented have been rounded which may cause, for example, the sum of individual figures to deviate from the presented sum total.
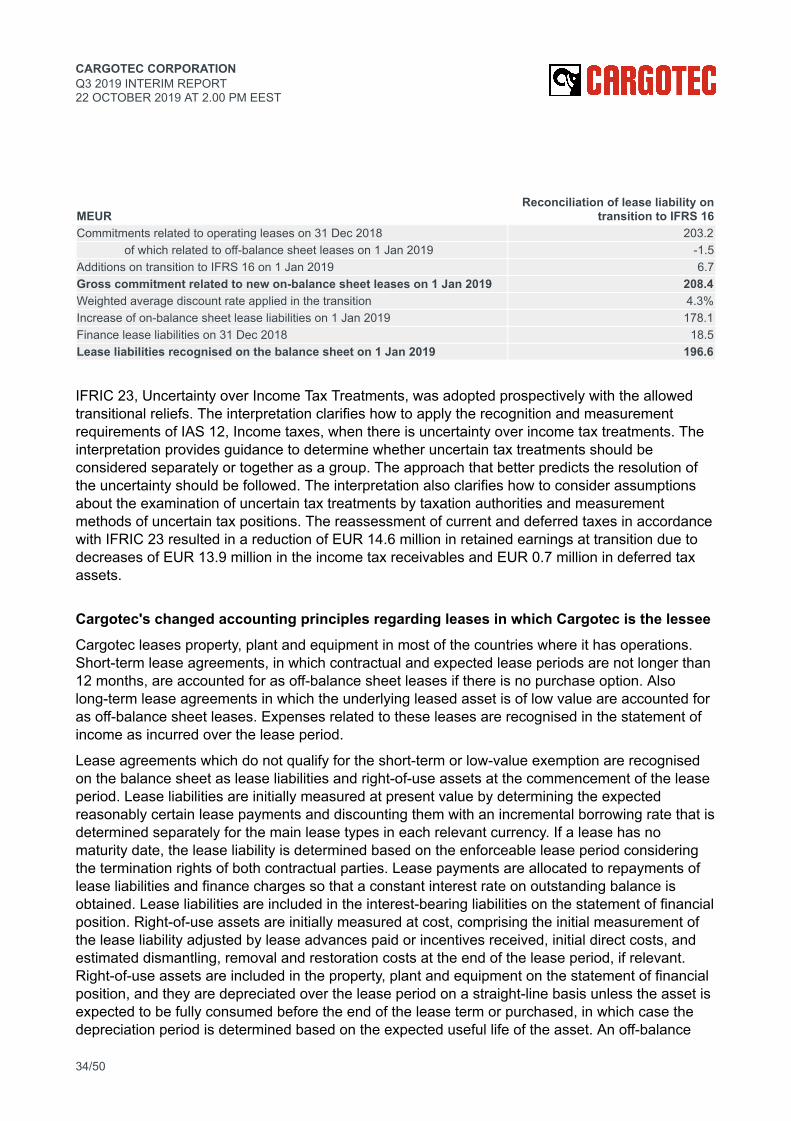
IFRS 16, Leases, was adopted by applying the modified retrospective transition method. The majority of the lease agreements Cargotec reported as operating leases in 2018 were converted as lease agreements recognised on the balance sheet on the adoption of IFRS 16. The transition adjustments related to the adoption of IFRS 16 resulted in a net decrease of EUR 9.9 million in retained earnings based on increases of EUR 178.1 million in interest-bearing liabilities, EUR 163.9 million in property, plant and equipment, and EUR 3.1 million in deferred tax assets, and a decrease of EUR 1.1 million in non-interest-bearing liabilities. The weighted average discount rate applied to determine the present value of lease liability was 4.3% on the date of transition. IFRS 16 is estimated to have a positive impact of approximately EUR 7 million on Cargotec's operating profit in 2019 based on the lease contracts effective on the date of transition.
33 / 50
CARGOTEC CORPORATION Q3 2019 INTERIM REPORT 22 OCTOBER 2019 AT 2.00 PM EEST
MEUR Reconciliation of lease liability on
transition to IFRS 16 Commitments related to operating leases on 31 Dec 2018 203.2
of which related to off-balance sheet leases on 1 Jan 2019 -1.5 Additions on transition to IFRS 16 on 1 Jan 2019 6.7 Gross commitment related to new on-balance sheet leases on 1 Jan 2019 208.4 Weighted average discount rate applied in the transition 4.3% Increase of on-balance sheet lease liabilities on 1 Jan 2019 178.1 Finance lease liabilities on 31 Dec 2018 18.5 Lease liabilities recognised on the balance sheet on 1 Jan 2019 196.6
IFRIC 23, Uncertainty over Income Tax Treatments, was adopted prospectively with the allowed transitional reliefs. The interpretation clarifies how to apply the recognition and measurement requirements of IAS 12, Income taxes, when there is uncertainty over income tax treatments. The interpretation provides guidance to determine whether uncertain tax treatments should be considered separately or together as a group. The approach that better predicts the resolution of the uncertainty should be followed. The interpretation also clarifies how to consider assumptions about the examination of uncertain tax treatments by taxation authorities and measurement methods of uncertain tax positions. The reassessment of current and deferred taxes in accordance with IFRIC 23 resulted in a reduction of EUR 14.6 million in retained earnings at transition due to decreases of EUR 13.9 million in the income tax receivables and EUR 0.7 million in deferred tax assets.
Cargotec's changed accounting principles regarding leases in which Cargotec is the lessee Cargotec leases property, plant and equipment in most of the countries where it has operations. Short-term lease agreements, in which contractual and expected lease periods are not longer than 12 months, are accounted for as off-balance sheet leases if there is no purchase option. Also long-term lease agreements in which the underlying leased asset is of low value are accounted for as off-balance sheet leases. Expenses related to these leases are recognised in the statement of income as incurred over the lease period.
Lease agreements which do not qualify for the short-term or low-value exemption are recognised on the balance sheet as lease liabilities and right-of-use assets at the commencement of the lease period. Lease liabilities are initially measured at present value by determining the expected reasonably certain lease payments and discounting them with an incremental borrowing rate that is determined separately for the main lease types in each relevant currency. If a lease has no maturity date, the lease liability is determined based on the enforceable lease period considering the termination rights of both contractual parties. Lease payments are allocated to repayments of lease liabilities and finance charges so that a constant interest rate on outstanding balance is obtained. Lease liabilities are included in the interest-bearing liabilities on the statement of financial position. Right-of-use assets are initially measured at cost, comprising the initial measurement of the lease liability adjusted by lease advances paid or incentives received, initial direct costs, and estimated dismantling, removal and restoration costs at the end of the lease period, if relevant. Right-of-use assets are included in the property, plant and equipment on the statement of financial position, and they are depreciated over the lease period on a straight-line basis unless the asset is expected to be fully consumed before the end of the lease term or purchased, in which case the depreciation period is determined based on the expected useful life of the asset. An off-balance
34 / 50

CARGOTEC CORPORATION Q3 2019 INTERIM REPORT 22 OCTOBER 2019 AT 2.00 PM EEST
sheet lease commitment becoming onerous leads to a recognition of a separate loss provision, whereas an on-balance sheet lease becoming onerous leads to an impairment of the related right-of-use asset.
Lease modifications are accounted for either as new lease contracts or as changes in the existing lease contracts depending on the type of the modification. Modifications accounted for as changes in the existing leases, and changes in the estimates applied in lease accounting, such as those related to the use of an option to prolong a lease or to purchase a leased asset, trigger a remeasurement of the lease liability and the right-of-use asset at an updated discount rate. Contractual rent changes tied to indexes also trigger a remeasurement of the lease liability and the right-of-use asset but without a change in the applied discount rate.
Cargotec's changed accounting principles regarding income taxes Income taxes in the statement of income include group companies’ taxes based on the taxable income, changes in deferred taxes and adjustments to taxes for previous periods. Income taxes based on the taxable income are calculated by using the local tax rates and laws enacted or substantively enacted at the end of the reporting period. Tax is recognised in the statement of income except to the extent that it relates to items recognised in the statement of other comprehensive income, in which case the tax is presented in the statement of other comprehensive income.
Deferred taxes are calculated on the temporary differences between the tax bases of assets and liabilities and their carrying amounts in the consolidated financial statements and on the unutilised tax losses. Deferred tax liabilities are recognised in full and deferred tax assets are recognised to the extent that it is probable that future taxable profit will be available against which the deductible temporary differences and unutilised tax losses can be utilised. Deferred taxes are measured with the tax rates and laws that are enacted or substantively enacted at the end of the reporting period and that are expected to apply when the asset is realised or liability settled.
When there is uncertainty over an income tax treatment, Cargotec considers uncertain tax positions either separately or together as a group based on the approach that better predicts the resolution of the uncertainty. Income taxes are in that case recognised either based on an estimate of the most likely amount or the expected weighted average value of the final tax amount, taking into account the tax authorities' expected acceptance of the chosen tax treatment.
35 / 50

CARGOTEC CORPORATION Q3 2019 INTERIM REPORT 22 OCTOBER 2019 AT 2.00 PM EEST
3. Segment information Sales, MEUR Q3/19 Q3/18 Q1-Q3/19 Q1-Q3/18 2018 Kalmar 424 415 1,252 1,174 1,618 Hiab 307 260 982 831 1,149 MacGregor 170 130 436 389 538 Internal sales 0 0 0 -1 -2 Total 901 805 2,669 2,394 3,304 Sales by geographical area, MEUR Q3/19 Q3/18 Q1-Q3/19 Q1-Q3/18 2018 EMEA 407 386 1,253 1,150 1,610 Americas 305 251 921 766 1,039 Asia-Pacific 189 167 495 478 655 Total 901 805 2,669 2,394 3,304 Sales by geographical area, % Q3/19 Q3/18 Q1-Q3/19 Q1-Q3/18 2018 EMEA 45% 48% 47% 48% 49% Americas 34% 31% 34% 32% 31% Asia-Pacific 21% 21% 19% 20% 20% Total 100% 100% 100% 100% 100% Operating profit and EBITDA, MEUR Q3/19 Q3/18 Q1-Q3/19 Q1-Q3/18 2018 Kalmar 47.5 38.6 113.3 91.0 138.1 Hiab 30.3 23.9 111.0 99.4 133.8 MacGregor -9.8 0.2 -23.4 3.1 -4.2 Corporate administration and support functions -10.1 -8.2 -38.9 -64.5 -77.7 Operating profit 57.9 54.5 162.0 129.1 190.0 Depreciation and amortisation 32.1 19.4 90.2 57.6 77.2 EBITDA 90.0 73.9 252.2 186.6 267.2 Operating profit, % Q3/19 Q3/18 Q1-Q3/19 Q1-Q3/18 2018 Kalmar 11.2% 9.3% 9.0% 7.8% 8.5% Hiab 9.9% 9.2% 11.3% 12.0% 11.6% MacGregor -5.8% 0.1% -5.4% 0.8% -0.8% Cargotec 6.4% 6.8% 6.1% 5.4% 5.8% Items affecting comparability, MEUR Q3/19 Q3/18 Q1-Q3/19 Q1-Q3/18 2018 Kalmar -0.3 0.0 -4.5 -1.5 -5.4 Hiab -3.7 -0.3 -7.4 -0.3 -0.7 MacGregor -4.0 -0.8 -7.8 -2.1 -2.6 Corporate administration and support functions -2.3 -2.2 -8.4 -39.5 -43.3 Total -10.5 -3.3 -28.1 -43.4 -52.1
Comparable operating profit, MEUR Q3/19 Q3/18 Q1-Q3/19 Q1-Q3/18 2018 Kalmar 47.8 38.6 117.8 92.5 143.6 Hiab 34.1 24.2 118.4 99.6 134.5 MacGregor -5.8 1.0 -15.6 5.2 -1.6 Corporate administration and support functions -7.7 -6.0 -30.5 -24.9 -34.4 Total 68.3 57.8 190.0 172.5 242.1
36 / 50

CARGOTEC CORPORATION Q3 2019 INTERIM REPORT 22 OCTOBER 2019 AT 2.00 PM EEST
Comparable operating profit, % Q3/19 Q3/18 Q1-Q3/19 Q1-Q3/18 2018 Kalmar 11.3% 9.3% 9.4% 7.9% 8.9 % Hiab 11.1% 9.3% 12.1% 12.0% 11.7 % MacGregor -3.4% 0.8% -3.6% 1.3% -0.3 % Cargotec 7.6% 7.2% 7.1% 7.2% 7.3 % Orders received, MEUR Q3/19 Q3/18 Q1-Q3/19 Q1-Q3/18 2018 Kalmar 396 486 1,329 1,469 1,919 Hiab 307 294 988 902 1,259 MacGregor 156 141 437 396 580 Internal orders received 0 0 -1 -1 -1 Total 858 921 2,752 2,766 3,756 Orders received by geographical area, MEUR Q3/19 Q3/18 Q1-Q3/19 Q1-Q3/18 2018 EMEA 400 440 1,337 1,266 1,755 Americas 315 311 932 935 1,245 Asia-Pacific 143 170 483 565 757 Total 858 921 2,752 2,766 3,756 Orders received by geographical area, % Q3/19 Q3/18 Q1-Q3/19 Q1-Q3/18 2018 EMEA 47% 48% 49% 46% 47% Americas 37% 34% 34% 34% 33% Asia-Pacific 16% 18% 17% 20% 20% Total 100% 100% 100% 100% 100%
Order book, MEUR 30 Sep
2019 30 Sep
2018 31 Dec
2018 Kalmar 1,083 1,003 1,012 Hiab 458 371 453 MacGregor 712 513 530 Internal order book -1 -1 -1 Total 2,251 1,887 1,995
Number of employees at the end of period 30 Sep
2019 30 Sep
2018 31 Dec
2018 Kalmar 5,762 5,670 5,737 Hiab 4,033 3,650 3,879 MacGregor 2,377 1,884 1,879 Corporate administration and support functions 570 448 492 Total 12,742 11,652 11,987 Average number of employees Q1-Q3/19 Q1-Q3/18 2018 Kalmar 5,743 5,682 5,685 Hiab 4,071 3,517 3,604 MacGregor 2,051 1,888 1,887 Corporate administration and support functions 552 389 413 Total 12,417 11,476 11,589
37 / 50

CARGOTEC CORPORATION Q3 2019 INTERIM REPORT 22 OCTOBER 2019 AT 2.00 PM EEST
4. Revenue from contracts with customers
Cargotec, MEUR Q3/19 Q3/18 Q1-Q3/19 Q1-Q3/18 2018 Equipment sales 589 526 1,769 1,571 2,177 Service sales 269 239 777 722 980 Software sales 44 39 122 100 147 Total sales 901 805 2,669 2,394 3,304
Recognised at a point in time 775 696 2,307 2,112 2,898 Recognised over time 127 109 362 281 406
Kalmar, MEUR Q3/19 Q3/18 Q1-Q3/19 Q1-Q3/18 2018 Equipment sales 265 264 790 741 1,022 Service sales 116 111 340 333 449 Software sales 44 39 122 100 147 Total sales 424 415 1,252 1,174 1,618
Recognised at a point in time 343 360 1,020 1,016 1,377 Recognised over time 81 54 231 158 241
Hiab, MEUR Q3/19 Q3/18 Q1-Q3/19 Q1-Q3/18 2018 Equipment sales 221 185 725 605 840 Service sales 86 75 256 227 309 Total sales 307 260 982 831 1,149
Recognised at a point in time 305 259 974 824 1,139 Recognised over time 3 1 8 7 9
MacGregor, MEUR Q3/19 Q3/18 Q1-Q3/19 Q1-Q3/18 2018 Equipment sales 103 77 254 226 317 Service sales 67 53 181 163 222 Total sales 170 130 436 389 538
Recognised at a point in time 128 75 313 272 382 Recognised over time 43 54 123 117 156
38 / 50

CARGOTEC CORPORATION Q3 2019 INTERIM REPORT 22 OCTOBER 2019 AT 2.00 PM EEST
5. Comparable operating profit MEUR Q3/19 Q3/18 Q1-Q3/19 Q1-Q3/18 2018 Operating profit 57.9 54.5 162.0 129.1 190.0 Restructuring costs
Employment termination costs 7.2 -0.6 14.2 0.8 3.2 Impairments of non-current assets* 0.0 0.0 0.1 31.6 32.2 Impairments of inventories 0.0 0.0 0.3 1.4 1.4 Restructuring-related disposals of businesses** 0.0 -0.3 0.0 -8.6 -8.4 Other restructuring costs*** 2.7 3.6 12.0 16.2 25.5
Restructuring costs, total 10.0 2.6 26.6 41.3 53.8 Other items affecting comparability
Insurance benefits - - - - -5.0 Expenses related to business acquisitions 0.5 0.7 1.4 2.1 3.3
Other items affecting comparability, total 0.5 0.7 1.4 2.1 -1.7 Comparable operating profit 68.3 57.8 190.0 172.5 242.1
*Includes an impairment loss of EUR 30.0 million, recognised in the second quarter of 2018, related to impairment testing of Cargotec's investment in the associated company Jiangsu Rainbow Heavy Industries Co., Ltd (RHI), that is listed on the Shenzhen stock exchange in China.
**Additional information regarding disposals of businesses is presented in note 12, Acquisitions and disposals.
***Includes e.g. contract termination costs (other than employment contracts), costs arising from outsourcing or transferring operations to new locations, costs of vacant premises, gains and losses on sale of intangible assets and property, plant and equipment as well as establishment costs of Cargotec Business Services operations. In addition, the sum in 2018 includes costs related to discontinuation of unprofitable product ranges in Kalmar.
6. Capital expenditure, depreciation and amortisation Capital expenditure, MEUR Q1-Q3/19 Q1-Q3/18 2018 Owned assets
Intangible assets 3.7 5.7 7.7 Land and buildings 1.9 1.5 6.6 Machinery and equipment 49.7 45.8 56.9
Right-of-use assets Land and buildings 10.3 10.2 8.8 Machinery and equipment 6.9 0.2 0.2
Total 72.5 63.3 80.3
Depreciation, amortisation and impairment, MEUR Q1-Q3/19 Q1-Q3/18 2018 Owned assets
Intangible assets 23.5 23.0 31.0 Land and buildings 5.2 4.7 6.5 Machinery and equipment 30.3 29.2 38.7
Right-of-use assets Land and buildings 20.4 0.1 0.2 Machinery and equipment 10.7 0.6 0.8
Total 90.2 57.6 77.2
39 / 50

CARGOTEC CORPORATION Q3 2019 INTERIM REPORT 22 OCTOBER 2019 AT 2.00 PM EEST
7. Taxes in statement of income MEUR Q1-Q3/19 Q1-Q3/18 2018 Current year tax expense 37.1 28.2 35.2 Change in current year's deferred tax assets and liabilities 8.2 7.0 18.3 Tax expense for previous years 2.7 -0.2 -0.4 Total 48.0 35.0 53.1
8. Net working capital
MEUR 30 Sep
2019 30 Sep
2018 31 Dec
2018 Inventories 834.0 699.0 688.8 Operative derivative assets 16.8 11.4 9.2 Accounts receivable 628.6 573.1 626.3 Other operative non-interest-bearing assets 257.2 202.8 202.7 Provisions -100.4 -102.4 -97.4 Advances received -258.4 -168.4 -190.3 Operative derivative liabilities -39.1 -20.3 -18.9 Accounts payable -421.9 -391.3 -424.2 Pension obligations -93.5 -87.2 -92.3 Other operative non-interest-bearing liabilities -463.3 -431.3 -432.5 Total 359.9 285.5 271.4 Assets and liabilities that are not allocated to business operations are not included in net working capital. Unallocated assets comprise loans and other interest-bearing receivables, cash and cash equivalents, income tax receivables, deferred tax assets, deferred interests, deferred considerations on disposals, and derivatives designated as hedges of future treasury transactions. Unallocated liabilities comprise loans and other interest-bearing liabilities, income tax payables, deferred tax liabilities, accrued interests, deferred considerations on acquisitions, dividend liabilities, and derivatives designated as hedges of future treasury transactions.
40 / 50

CARGOTEC CORPORATION Q3 2019 INTERIM REPORT 22 OCTOBER 2019 AT 2.00 PM EEST
9. Interest-bearing net debt and liquidity
MEUR 30 Sep
2019 30 Sep
2018 31 Dec
2018 Interest-bearing liabilities* 1,344.6 877.3 929.9
Lease liabilities included in interest-bearing liabilities 183.1 20.0 18.5 Loans receivable and other interest-bearing assets -29.4 -39.1 -37.9 Cash and cash equivalents -388.2 -189.3 -256.3 Interest-bearing net debt on balance sheet 927.0 648.8 635.8 Foreign currency hedge of corporate bonds* - -9.5 -10.3 Interest-bearing net debt 927.0 639.4 625.5 Equity 1,436.5 1,411.4 1,428.5 Gearing 64.5% 45.3% 43.8%
*Cash flow hedge accounting was applied to the cash flows of the US Private Placement corporate bond (30 Sep 2018 and 31 Dec 2018: USD 85 million), which matured in February 2019. The cash flows of the bond were converted into euro flows through a cross-currency swap. As a result of the hedging, Cargotec effectively held a EUR 64 million fixed rate debt on 30 Sep 2018 and 31 Dec 2018. The fair values of interest-bearing assets and liabilities are not significantly different from their carrying amounts.
MEUR 30 Sep
2019 30 Sep
2018 31 Dec
2018 Cash and cash equivalents 388.2 189.3 256.3 Committed long-term undrawn revolving credit facilities 300.0 300.0 300.0 Repayments of interest-bearing liabilities in the following 12 months -377.0 -291.6 -212.8 Total liquidity 311.1 197.7 343.5
41 / 50

CARGOTEC CORPORATION Q3 2019 INTERIM REPORT 22 OCTOBER 2019 AT 2.00 PM EEST
10. Derivatives
Fair values of derivative financial instruments Positive Negative Net Net Net fair value fair value fair value fair value fair value
MEUR 30 Sep
2019 30 Sep
2019 30 Sep
2019 30 Sep
2018 31 Dec
2018 Non-current - -
Currency forwards, other 0.0 1.8 -1.8 - - Total non-current 0.0 1.8 -1.8 - - Current
Currency forwards, cash flow hedge accounting 0.6 13.3 -12.7 -2.2 2.2 Currency forwards, other 10.3 7.5 2.8 0.7 -0.7 Cross-currency and interest rate swaps - - - 8.9 10.1
Total current 10.9 20.8 -9.9 7.4 11.7 Total derivatives 10.9 22.6 -11.7 7.4 11.7 A cross-currency and interest rate swap hedged the US Private Placement corporate bond which was issued in February 2007 and matured in February 2019. Cash flow hedge accounting was applied for this instrument and it was recognised at fair value through profit and loss. Financial assets and liabilities recognised at fair value through profit and loss comprise mainly currency derivatives. The recurring measurement of these instruments at fair value is based on commonly applied valuation methods and uses observable market-based variables. Therefore, these measurements are categorised in the fair value hierarchy as level 2 fair values.
Nominal values of derivative financial instruments
MEUR 30 Sep
2019 30 Sep
2018 31 Dec
2018 Currency forward contracts 2,928.4 2,182.4 2,260.7
Cash flow hedge accounting 1,580.5 1,298.3 1,265.8 Other 1,347.9 884.1 994.8
Cross-currency and interest rate swaps - 73.4 74.2 Total 2,928.4 2,255.8 2,334.9 The derivatives have been recognised at gross fair values on the balance sheet, as the netting agreements related to derivatives allow unconditional netting only in the occurrence of credit events, but not in a normal situation. The group has not given or received collateral related to derivatives from the counterparties.
42 / 50

CARGOTEC CORPORATION Q3 2019 INTERIM REPORT 22 OCTOBER 2019 AT 2.00 PM EEST
11. Commitments
MEUR 30 Sep
2019 30 Sep
2018 31 Dec
2018 Guarantees given on behalf of associated companies and joint ventures 42.0 41.0 41.5 Guarantees given on behalf of others 0.8 - - Customer financing 26.0 26.5 26.7 Off-balance sheet leases 3.3 199.1 203.2 Other contingent liabilities 3.8 0.5 0.5 Total 76.0 267.1 271.9 Cargotec Corporation has guaranteed obligations of Cargotec companies arising from ordinary course of business. The total amount of these guarantees on 30 Sep 2019 was EUR 417.8 (30 Sep 2018: 422.3 and 31 Dec 2018: 460.8) million.
Certain products are sold under customer finance arrangements in which some level of risk is typically retained by Cargotec. When the level of retained risk is low and, therefore, not reflected on the balance sheet, it is reported in full as a contingent liability under commitments. No significant liabilities are expected to arise from the commitments related to customer financing. Off-balance sheet leases include from 1 Jan 2019 the lease commitments related to short-term leases, low-value leases, and leases that have not yet commenced. The aggregate off-balance sheet lease expenses totalled EUR 2.4 (1–9/2018: 33.1 and 1–12/2018: 45.0) million. Additional information regarding the IFRS 16 transition is presented in note 2, Accounting principles and new accounting standards. Cargotec received in October 2016 a USD 13 million verdict in a local jury trial in Hempstead, USA. The verdict was related to business acquisition negotiations Cargotec USA had in 2010 and 2011. The negotiations were closed without results. The claim was based on Cargotec having breached confidentiality obligations related to the negotiations. In December 2018, Cargotec won its appeal to dispute the verdict of damages. The opponent has appealed to the Supreme Court of Texas. There are also certain other legal claims and disputes based on various grounds pending against Cargotec around the world. Management believes that the outcome of these disputes will not have a material effect on Cargotec's financial position.
43 / 50

CARGOTEC CORPORATION Q3 2019 INTERIM REPORT 22 OCTOBER 2019 AT 2.00 PM EEST
12. Acquisitions and disposals Acquisitions in 2019 MacGregor acquired on 31 July 2019 the marine and offshore businesses of the Norwegian listed company TTS Group ASA ("TTS") at a consideration of EUR 57.9 million. The purchase price was fully paid on closing but its final amount is still subject to change. The acquisition strengthens MacGregor's product portfolio and market position in the main cargo and load handling markets, and related services. Additionally, significant synergy benefits are expected to be obtained from the transaction. The acquired entities are operating in more than 10 countries from which China, Germany, Norway and Sweden are the most significant ones. The acquired businesses consist of 19 fully owned subsidiaries and investments in three 50% owned Chinese joint ventures. The integration of the joint ventures is subject to temporary restrictions set by the competition authorities. As a result of the acquisition, approximately 580 employees transferred to Cargotec. The result of TTS has been consolidated into MacGregor segment from the beginning of August 2019 after which TTS has contributed EUR 18.3 million to Cargotec's sales. The harmonization of the revenue recognition principles is ongoing on the reporting date, and, therefore, the impact on Cargotec's sales is presented on a preliminary basis. The contribution of TTS to Cargotec's operating profit has not been material. Consolidation of the acquired businesses and measurement of intangible assets and goodwill recognised in the acquisition are provisional as of reporting date as the related valuations are ongoing.
Acquired net assets and goodwill, MEUR Intangible assets 46.5 Property, plant and equipment 5.3 Investments in associated companies and joint ventures 14.0 Inventories 65.6 Accounts receivable and other non-interest-bearing assets 19.0 Cash and cash equivalents 24.8 Deferred tax assets 0.3 Accounts payable and other non-interest-bearing liabilities -82.4 Interest-bearing liabilities -69.8 Deferred tax liabilities -10.6 Net assets 12.7 Purchase price, payable in cash 57.9 Total consideration 57.9 Goodwill 45.2 Purchase price, paid in cash 57.9 Cash and cash equivalents acquired 44.7 Cash flow impact 102.7
Navis, part of Kalmar, acquired on 7 March 2019 the share capital of the US-based privately owned company Cetus Labs, Inc. ("Cetus") at the price of EUR 11.6 million of which EUR 3.5 million was paid on the date of acquisition. The remaining amount, which is conditional, is expected to be paid over the next three years. The main product of Cetus is a SaaS- and cloud-based terminal operating system (TOS), Octopi, designed for small container and mixed
44 / 50

CARGOTEC CORPORATION Q3 2019 INTERIM REPORT 22 OCTOBER 2019 AT 2.00 PM EEST
cargo terminals. The result of Cetus has been consolidated into Kalmar segment from the beginning of March. Cetus is not expected to have a material impact on Cargotec's sales during 2019. Consolidation of the acquired business is provisional on reporting date and the fair value measurements are preliminary. In the preliminary valuation, a technology-related intangible asset has been identified. According to the preliminary valuation, the acquisition will generate goodwill that is not tax-deductible. Goodwill is primarily based on personnel and expected synergy benefits.
Acquired net assets and goodwill, MEUR Intangible assets 6.0 Accounts receivable and other non-interest-bearing assets 0.0 Cash and cash equivalents 0.2 Accounts payable and other non-interest-bearing liabilities -0.2 Interest-bearing liabilities -0.4 Deferred tax liabilities -1.6 Net assets 4.0 Purchase price, payable in cash 11.6 Total consideration 11.6 Goodwill 7.6 Purchase price, paid in cash 3.5 Cash and cash equivalents acquired -0.2 Cash flow impact 3.4
Hiab acquired the sales and service business of ATS Aufbau und Transportsysteme GmbH in Germany on 2 May 2019 for a consideration of EUR 0.8 million. The acquisition had no material impact on the reported figures.
Acquisitions in 2018 On 6 November 2018, Hiab acquired the share capital of Effer S.p.A ("Effer"), located in Italy, at the price of EUR 44.6 million. Effer was a privately owned company which is known as a high-quality knuckle-boom crane manufacturer. Effer's product range includes truck loader cranes, special application truck cranes, and marine cranes. Acquisition complements Hiab's product portfolio especially in heavy cranes, and Effer's global dealer network strengthens Hiab's sales network. Additionally, acquisition strengthens Hiab's product development, and increases the sales and efficiency of Hiab's service business. Effer's all operations are located in Italy. As a result of the acquisition, 400 employees were transferred to Cargotec. The result of Effer has been consolidated into Hiab segment from the beginning of November 2018. In 2018, Effer contributed EUR 16.1 million and EUR 0.8 million to Cargotec's sales and operating profit, respectively. Had Effer been acquired on 1 January 2018, it would have increased Cargotec's full year sales by approximately EUR 96.6 million and operating profit by approximately EUR 5.1 million.
Consolidation of the acquired businesses is presented as final on reporting date. In the final valuation, customer relationships, trademarks and technology were identified as the acquired intangible assets. The goodwill recognised in the acquisition is primarily based on personnel and expected synergy benefits, and is not tax-deductible.
45 / 50

CARGOTEC CORPORATION Q3 2019 INTERIM REPORT 22 OCTOBER 2019 AT 2.00 PM EEST
Acquired net assets and goodwill, MEUR Intangible assets 19.1 Property, plant and equipment 3.4 Inventories 12.1 Accounts receivable and other non-interest-bearing assets 15.9 Cash and cash equivalents 5.1 Deferred tax assets 1.2 Accounts payable and other non-interest-bearing liabilities -19.6 Interest-bearing liabilities -12.2 Deferred tax liabilities -5.3 Net assets 19.6 Purchase price, payable in cash 44.6 Total consideration 44.6 Goodwill 25.1 Purchase price, paid in cash 43.5 Cash and cash equivalents acquired 6.3 Cash flow impact 49.8
On 5 February 2018, MacGregor acquired the share capital of Rapp Marine Group AS ("RMG") at the price of EUR 8.5 million. RMG was a privately owned company and it is specialised in providing winches and related equipment to fishery and research vessels. The acquisition supports MacGregor’s growth strategy by enabling a strong position in the product areas related to fishery and research vessels, completing the product offering of winches and related control systems, and increasing service sales. RMG's main locations are in Norway, the United States and the United Kingdom. As a result of the acquisition, 135 employees were transferred to Cargotec. The result of RMG has been consolidated into MacGregor segment from the beginning of February 2018. In 2018, RMG contributed EUR 49.2 million and EUR 0.1 million to Cargotec's sales and operating profit, respectively. Had RMG been acquired on 1 January 2018, it would have increased Cargotec's full year sales by approximately EUR 53.7 million and operating profit by approximately EUR 0.1 million.
Fair value measurements of the acquired assets and assumed liabilities are final. In determining the fair values, intangible assets related to customer relationships, trademarks and technology were identified as the acquired intangible assets. The acquisition generated goodwill that is not tax-deductible. The generated goodwill is primarily based on personnel and expected synergy benefits.
46 / 50

CARGOTEC CORPORATION Q3 2019 INTERIM REPORT 22 OCTOBER 2019 AT 2.00 PM EEST
Acquired net assets and goodwill, MEUR Intangible assets 5.2 Property, plant and equipment 1.0 Inventories 15.3 Accounts receivable and other non-interest-bearing assets 23.1 Interest-bearing receivables 0.0 Cash and cash equivalents 0.9 Deferred tax assets 0.4 Accounts payable and other non-interest-bearing liabilities -44.2 Interest-bearing liabilities -11.9 Deferred tax liabilities -1.0 Net assets -11.1 Purchase price, payable in cash 7.7 Total consideration 7.7 Goodwill 18.8 Purchase price, paid in cash 8.5 Cash and cash equivalents acquired 10.7 Cash flow impact 19.2
Hiab acquired the service business of Londonderry Garage Limited in the UK on 8 October 2018 for a consideration of EUR 1.1 million, the sales and service business of Logan Inglis Limited in Scotland on 10 August 2018 for a consideration of EUR 0.6 million, and the service business of Berendsen & Merz in Germany on 1 June 2018 for a consideration of EUR 0.4 million. These acquisitions had no material impact on reported figures. The combined cash flow impact of these acquisitions was EUR 1.4 million.
Disposals in 2018 On 29 June 2018, Kalmar sold its rough terrain container handling business in the U.S. for a consideration of EUR 8.0 million, of which EUR 1.3 million was agreed to be paid during the next 18 months. The transaction follows Kalmar's strategy to focus on container ports, heavy industry and distribution segments, and it resulted in a net loss of EUR 4.1 million that is included in the restructuring costs in the statement of income. The disposal reduced Cargotec's personnel by 71 employees. During 2018, the rough terrain container handling business contributed EUR 8.2 million and EUR -0.9 million to Cargotec's sales and operating profit, respectively.
On 9 May 2018, Kalmar entered into an agreement with JCE Invest AB to establish a joint venture, Bruks Siwertell Group ("BSG"), specialised in dry bulk handling. The joint venture consists of the businesses of Siwertell AB and BRUKS Holding AB contributed by Kalmar and JCE Invest AB respectively. Kalmar accounts for the transaction as a disposal of the subsidiary Siwertell AB, and the new 48 percent ownership in BSG is consolidated as an associated company. As a result of the transaction, Kalmar recognised an investment of EUR 18.9 million in the associated company, and a vendor note receivable of EUR 33.0 million from BSG that will be redeemed in annual instalments. The transaction follows Kalmar's strategy to focus on container ports, heavy industry and distribution segments, and it resulted in a net profit of EUR 12.6 million that is included in the restructuring costs in the statement of income. The disposal reduced Cargotec's personnel by 111
47 / 50

CARGOTEC CORPORATION Q3 2019 INTERIM REPORT 22 OCTOBER 2019 AT 2.00 PM EEST
employees. In 2018, Siwertell contributed EUR 8.7 million and EUR -0.3 million to Cargotec's sales and operating profit, respectively.
On 15 June 2018, Hiab disposed of its 40 percent ownership in the associated company Hymetal S.A. at a price of EUR 0.9 million. The transaction had no material impact on reported figures.
Key exchange rates for the euro
Closing rates 30 Sep 2019 30 Sep 2018 31 Dec 2018 SEK 10.696 10.309 10.255 USD 1.089 1.158 1.145 Average rates Q1-Q3/19 Q1-Q3/18 2018 SEK 10.555 10.239 10.259 USD 1.124 1.194 1.181
48 / 50

CARGOTEC CORPORATION Q3 2019 INTERIM REPORT 22 OCTOBER 2019 AT 2.00 PM EEST
Calculation of key figures
Earnings per share (EUR) = Net income for the period attributable to the equity holders of the parent
Average number of outstanding shares during the period
Diluted earnings per share (EUR) = Net income for the period attributable to the equity holders of
the parent
Average number of outstanding diluted shares during the period
According to the ESMA Guidelines on Alternative Performance Measures, an Alternative Performance Measure (APM) is understood as a financial measure of historical or future financial performance, financial position, or cash flows, other than a financial measure defined or specified in the applicable financial reporting framework. In addition to IFRS performance measures, Cargotec uses the following alternative performance measures.
Comparable operating profit (MEUR and % of sales)
= Operating profit excluding items significantly affecting comparability
Items significantly affecting comparability include, in addition to restructuring costs, mainly capital gains and losses, gains and losses related to business acquisitions and disposals, impairments of assets and reversals of impairments, insurance benefits, and expenses related to legal proceedings. Cargotec uses comparable operating profit to better convey underlying business performance and to enhance comparability from period to period.
Equity / share (EUR) = Total equity attributable to the equity holders of the parent Number of outstanding shares at the end of period
Total equity / total assets (%) = 100 x Total equity Total assets - advances received
Interest-bearing net debt (MEUR) = Interest-bearing liabilities - loans receivable and other interest-bearing assets +/- foreign currency hedge of corporate bonds
Interest-bearing net debt / EBITDA, last 12 months =
Interest-bearing net debt EBITDA (earnings before interest, taxes, depreciation and amortisation), last 12 months
Gearing (%) = 100 x Interest-bearing net debt Total equity
Return on equity (ROE) (%), last 12 months = 100 x Net income (last 12 months) Total equity (last 12 months’ average)
Return on capital employed (ROCE) (%), last 12 months = 100 x
Income before taxes + interest and other financing expenses (last 12 months) Total assets - non-interest-bearing debt (last 12 months’ average)
Items included in net working capital are presented in note 8, Net working capital.
49 / 50

CARGOTEC CORPORATION Q3 2019 INTERIM REPORT 22 OCTOBER 2019 AT 2.00 PM EEST
Quarterly key figures
Cargotec Q3/19 Q2/19 Q1/19 Q4/18 Q3/18 Orders received MEUR 858 872 1 022 991 921 Service orders received MEUR 262 279 261 265 251 Order book MEUR 2,251 2,072 2,145 1,995 1,887 Sales MEUR 901 911 856 910 805 Service sales MEUR 269 259 249 257 239 Software sales MEUR 44 41 38 47 39 Service and software sales, % of sales % 35% 33% 33% 33% 35% Operating profit MEUR 57.9 53.0 51.0 60.9 54.5 Operating profit % 6.4% 5.8% 6.0% 6.7% 6.8% Comparable operating profit MEUR 68.3 64.3 57.4 69.6 57.8 Comparable operating profit % 7.6% 7.1% 6.7% 7.7% 7.2% Earnings per share EUR 0.46 0.45 0.48 0.53 0.58 Kalmar Q3/19 Q2/19 Q1/19 Q4/18 Q3/18 Orders received MEUR 396 417 516 450 486 Order book MEUR 1,083 1,101 1,127 1,012 1,003 Sales MEUR 424 427 401 444 415 Service sales MEUR 116 114 110 116 111 Software sales MEUR 44 41 38 47 39 Comparable operating profit MEUR 47.8 37.7 32.3 51.0 38.6 Comparable operating profit % 11.3% 8.8% 8.1% 11.5% 9.3% Hiab Q3/19 Q2/19 Q1/19 Q4/18 Q3/18 Orders received MEUR 307 340 341 357 294 Order book MEUR 458 453 483 453 371 Sales MEUR 307 358 316 318 260 Service sales MEUR 86 88 83 83 75 Comparable operating profit MEUR 34.1 50.6 33.7 34.9 24.2 Comparable operating profit % 11.1% 14.1% 10.7% 11.0% 9.3% MacGregor Q3/19 Q2/19 Q1/19 Q4/18 Q3/18 Orders received MEUR 156 116 165 184 141 Order book MEUR 712 519 536 530 513 Sales MEUR 170 127 139 149 130 Service sales MEUR 67 58 56 59 53 Comparable operating profit MEUR -5.8 -11.0 1.2 -6.8 1.0 Comparable operating profit % -3.4% -8.7% 0.9% -4.6% 0.8%
50 / 50