Profiling and validation of individual and patterns of...
12
RESEARCH Open Access Profiling and validation of individual and patterns of Chlamydia trachomatis-specific antibody responses in trachomatous trichiasis Harry Pickering 1* , Sarah E. Burr 2 , Tamsyn Derrick 1 , Pateh Makalo 2 , Hassan Joof 2 , Richard D. Hayward 3 and Martin J. Holland 1 Abstract Background: Ocular Chlamydia trachomatis (Ct) infection causes trachoma, the leading infectious cause of blindness. A Ct D/UW3 proteome microarray and sera from Gambian adults with trachomatous trichiasis (TT) or healthy matched controls previously identified several novel antigens, which suggested differential recognition in adults with TT. Methods: We re-analysed this serological microarray data using more robust microarray analysis techniques accounting for typical problems associated with highly dimensional data. We examined the Ct-specific antibody profile concerning the overall diversity of responses, antigen expression stage and cellular localisation of antigens. We tested differentially recognised antigens by further serological testing of the screened sera and used larger independent sample sets for validation. Results: Antibody responses identified High-Performance on antigens expressed early and late in the Ct developmental cycle and those secreted or localised to the outer membrane. Eight antigens were preferentially recognised by scarred individuals and one antigen by healthy individuals. Three of these antigens, two associated with scarring (CT667 and CT706) and one healthy-associated (CT442), were not associated with the presence or absence of scarring following specific serological testing of the arrayed sera and sera from larger, independent case-control cohorts. Conclusions: This study identified focussed Ct-specific antibody profiles targeting proteins expressed during entry and exit from cells and localised to interact with the host. A small panel of antibody responses could discriminate between adults with and without TT in a trachoma-endemic community. Heterogenous responses in the independent validation of these antibody targets highlighted the need for large sample sizes, clearly defined clinical phenotypes and follow-up work. Keywords: Chlamydia trachomatis, Trachoma, Trachomatous scarring, Trachomatous trichiasis, Microarray, Antibodies * Correspondence: [email protected] 1 Clinical Research Department, London School of Hygiene and Tropical Medicine, Keppel Street, London, UK Full list of author information is available at the end of the article © The Author(s). 2017 Open Access This article is distributed under the terms of the Creative Commons Attribution 4.0 International License (http://creativecommons.org/licenses/by/4.0/), which permits unrestricted use, distribution, and reproduction in any medium, provided you give appropriate credit to the original author(s) and the source, provide a link to the Creative Commons license, and indicate if changes were made. The Creative Commons Public Domain Dedication waiver (http://creativecommons.org/publicdomain/zero/1.0/) applies to the data made available in this article, unless otherwise stated. Pickering et al. Parasites & Vectors (2017) 10:143 DOI 10.1186/s13071-017-2078-8
Transcript of Profiling and validation of individual and patterns of...

RESEARCH Open Access
Profiling and validation of individual andpatterns of Chlamydia trachomatis-specificantibody responses in trachomatoustrichiasisHarry Pickering1*, Sarah E. Burr2, Tamsyn Derrick1, Pateh Makalo2, Hassan Joof2, Richard D. Hayward3
and Martin J. Holland1
Abstract
Background: Ocular Chlamydia trachomatis (Ct) infection causes trachoma, the leading infectious cause ofblindness. A Ct D/UW3 proteome microarray and sera from Gambian adults with trachomatous trichiasis (TT) orhealthy matched controls previously identified several novel antigens, which suggested differential recognition inadults with TT.
Methods: We re-analysed this serological microarray data using more robust microarray analysis techniquesaccounting for typical problems associated with highly dimensional data. We examined the Ct-specific antibodyprofile concerning the overall diversity of responses, antigen expression stage and cellular localisation of antigens.We tested differentially recognised antigens by further serological testing of the screened sera and used largerindependent sample sets for validation.
Results: Antibody responses identified High-Performance on antigens expressed early and late in the Ctdevelopmental cycle and those secreted or localised to the outer membrane. Eight antigens were preferentiallyrecognised by scarred individuals and one antigen by healthy individuals. Three of these antigens, two associatedwith scarring (CT667 and CT706) and one healthy-associated (CT442), were not associated with the presence orabsence of scarring following specific serological testing of the arrayed sera and sera from larger, independentcase-control cohorts.
Conclusions: This study identified focussed Ct-specific antibody profiles targeting proteins expressed during entryand exit from cells and localised to interact with the host. A small panel of antibody responses could discriminatebetween adults with and without TT in a trachoma-endemic community. Heterogenous responses in theindependent validation of these antibody targets highlighted the need for large sample sizes, clearly definedclinical phenotypes and follow-up work.
Keywords: Chlamydia trachomatis, Trachoma, Trachomatous scarring, Trachomatous trichiasis, Microarray,Antibodies
* Correspondence: [email protected] Research Department, London School of Hygiene and TropicalMedicine, Keppel Street, London, UKFull list of author information is available at the end of the article
© The Author(s). 2017 Open Access This article is distributed under the terms of the Creative Commons Attribution 4.0International License (http://creativecommons.org/licenses/by/4.0/), which permits unrestricted use, distribution, andreproduction in any medium, provided you give appropriate credit to the original author(s) and the source, provide a link tothe Creative Commons license, and indicate if changes were made. The Creative Commons Public Domain Dedication waiver(http://creativecommons.org/publicdomain/zero/1.0/) applies to the data made available in this article, unless otherwise stated.
Pickering et al. Parasites & Vectors (2017) 10:143 DOI 10.1186/s13071-017-2078-8

BackgroundTrachoma, caused by ocular infection with Chlamydiatrachomatis (Ct), is the leading infectious cause of blind-ness worldwide. Ocular infections with Ct affect the epi-thelial cells of the conjunctiva [1], with repeated infectionin endemic areas causing a chronic keratoconjunctivitis [2,3]. Chronic and repeated episodes of infection and diseasein children induce changes in the tissue underlying theconjunctiva, leading to deposition of scar tissue. Progres-sion of this scarring pathology can lead to trichiasis (TT),corneal opacities (CO) and blindness [4]. The majority ofpeople in trachoma-endemic communities do not pro-gress to these latter stages of trachomatous disease andpathology varies considerably within those that do pro-gress. This heterogeneity seems, in part, due to the impactof prolonged infection and inflammation; however otherrisk factors have also been identified including age, gender,dry eye and non-chlamydial bacteria [5–13].Levels of IgG antibodies against Ct elementary bodies
(EBs) are significantly higher in individuals with scarringtrachoma [14–16]. Since frequent and persistent infectionsare associated with scarring, this suggests the developmentof these antibodies does not protect from progression. Oneof these studies found higher levels of antibody against theCt antigen HSP60 in scarring individuals independent of re-sponses against EBs, implying HSP60 is not simply amarker of increased exposure. This association of anti-HSP60 antibodies was not consistent between studies oftrachomatous scarring (TS) and trachomatous trichiasis(TT) [17, 18]. However, one of these studies did demon-strate that IgG antibodies against another Ct antigen, CPAF,were significantly increased in TT [18]. It is unclearwhether the scarring-associated antibody responses identi-fied in trachoma-endemic communities are commonthroughout the population or if they are directly involvedin the scarring process. It is possible via opsonisation thatanti-Ct antibodies could facilitate greater Ct infectivity inyoung children promoting frequent and prolongedinfections that are known to be a risk factor for TS/TT.Equally, they may be coincidental serological markers ofinfection.The last decade has seen the exploitation of protein-
based screens of human serum to document the completeprofile of antibody responses stimulated by an infection[19]. This has streamlined the identification of diagnosticand vaccine candidates, leading to faster progressionand evaluation of individual targets. For Plasmodiumfalciparum and malaria, targeted panels of proteinshave been screened to identify immunity-associatedantigens [20] and antigens associated with particularstages of infection [21]. Similar studies have beenapplied to some bacterial species including Mycobac-terium tuberculosis [22] and 30 causative organismsof tropical infectious diseases [23].
There have been six published studies that have screenedhuman serum against microarrays of Ct antigens to defineserological responses [24–27], two of these simultaneouslyinvestigated T-cell responses [28, 29]. A comparison ofthese studies (summarised in Additional file 1: Table S1),identifies some commonly recognised antigens. However,the majority were identified in only one or two studies. Thisvariation likely represents methodological differences andheterogeneity in immune responses targeting Ct antigens.A similar murine study found more focussed serologicalresponses in C57/BL6 mice which are more resistant tourogenital chlamydial infection than BALB/c and C3H/HeN mice, suggesting variations in susceptibility to infec-tion are partly related to antibody profiles [30].Previously, serum from individuals with TT was used
to screen a Ct D/UW3 proteome array of 908 genomicand plasmid ORFs [31]. This study used 61 cases oftrichiasis (TT) and 61 age, sex and location-matchedcontrols with normal healthy (healthy) eyes collected inThe Gambia between May 2006 and February 2009.Thirty-four cases and 25 controls were screened on theserovar D Ct proteome array [24, 25]. Ten antigens wererecognised by > 50% of the 59 samples tested. Four anti-gens were preferentially recognised by those with TTand eight by healthy controls (Table 1). However, therewere some limitations in the study including in both thewet and dry lab study methodologies. The small samplesize, lack of global normalisation and inadequate mea-sures to control against false discovery each contributedto a high chance of error [32].Here, we report the results of a more robust biostatis-
tical analysis of data generated from this array. We thendetermined differences in response diversity, richnessand evenness by employing standard metrics used inecology and analysis of 16S-amplicon community sur-veys. We additionally utilised sera from independentstudies of TS/TT to demonstrate the need for validationof antibody responses determined using large-scalescreening of small numbers of participants.
MethodsStudy participantsSera were taken from three clinical cohorts collected inThe Gambia between 1995 and 2011. In 1995, 153
Table 1 Participant demographics from the study of TS andmatched controls from The Gambia in 1995. Age (generalised linearmodel) and gender (Fisher’s exact test) were compared betweenhealthy controls and scarred cases, associated P-values are indicated
Healthy controls Scarred cases P-value
Number 116 115 na
Age in years (95% CI) 37.50 (7.00–65.00) 38.00 (7.00–65.75) 0.900
Female, n (%) 84 (72.41) 80 (69.57) 0.633
Abbreviation: na not applicable, CI Confidence intervals, n number
Pickering et al. Parasites & Vectors (2017) 10:143 Page 2 of 12

people with evidence of TS by clinical examination wererecruited alongside age, sex and village-matched controlswith normal eyes from Kaur Health Centre and the vil-lages of Jali and Berending (SCC729). A 1 ml sample ofvenous blood was taken from each person to obtainserum [33, 34]. A total of 231 serum samples were re-tested from this study in the present analysis (Table 1).Between May 2006 and February 2009, 61 people with
evidence of TT and corneal opacities (CO) by clinicalexamination were recruited alongside age, sex andvillage-matched controls with normal eyes from theWestern, Central and Lower River Regions of TheGambia (SCCL2006.10). A sample of venous blood wastaken from each person to obtain serum. Details of thecohort and the collection are available in Lu et al. [31].A total of 116 of these archived sera were available fortesting by the present study (Table 2). Thirty-four casesand 25 controls were screened on the serovar D Ctproteome array described previously [31]. Briefly, 59 in-dividuals with high titres of anti-Ct ocular serovar anti-bodies were selected, removing individuals withpresumed low anti-Ct antibody levels. Serum sampleswere screened against a GST-fusion protein micro-arrayof 908 ORFs from Ct D/UW3.In 2011 (SCC1274), 90 people with evidence of TS and
TT by clinical examination were recruited alongside age,sex and village-matched controls with normal eyes frommultiple rural regions [35] (Table 3). A 1 ml sample ofvenous blood was taken from each person to obtainserum, sera from all 90 patients were available for testingin the present study.
Normalisation, filtering and positivityThe raw optical density data from the microarray(Additional file 2: Table S2) was transformed by in-verse hyperbolic sine transformation and normalisedby mean-centring, these techniques were determinedas the most suitable ‘normalisation’ step using rele-vant rank deviation (RRD) [36]. Post-normalisation,the global median of the data, was calculated, individ-ual antigens whose median was lower than the globalmedian were excluded.
Lu et al. defined a positive response as an optical density(OD) equal to or greater than two standard deviationsabove the mean from the relevant 96-well plate [31]. How-ever, there is no consensus method to differentiate atwhich point a response or value is judged to be signifi-cantly positive in serological microarrays. In this reanaly-sis, we, therefore, tested several different methods toidentify positive-negative breakpoints in the distributionof the data [37]. These were: k-means clustering, k-medoids clustering, fuzzy c-means clustering, hierarchicalclustering and mixture modelling. These were testedallowing for 2 to 10 clusters. Maximisation of betweencluster variance was favoured over minimisation ofwithin-cluster variance. Silhouette analysis was selected toquantify the effectiveness of clustering methods. The aver-age silhouette width of each antigen was used to deter-mine the appropriateness of the cluster configuration [38].The mean of each silhouette per antigen gave the averagesilhouette width, which illustrates how tightly the datawere plate array. To determine positive responses, twoLyophilized were identified and the method that resultedin the highest average silhouette width for each antigenidentified. Data points clustered with the maximum OD/signal intensity point of each antigen were consideredpositive and the opposing cluster negative.
Diversity metricsEcological measures of diversity rely on species breadth/richness, the total number of species in a sample, and spe-cies diversity, which additionally incorporates the relativeabundance of each species. We treated antigens as species,abundance as the response to each antigen and the sam-ples were either the entire data set or the data set splitinto dichotomous outcome variables. These definitionsare based on the assumption that responses on the arraycorrelate with abundance of antibodies in each sample. Anormalised OD= 1 some as one arbitrary unit of an anti-body. This means if a response to an antigen is twice ashigh in one sample compared with another, antibodies aretwice as abundant in that individual.Breadth was defined as the number of antigens to which
each had a positive response. For the remaining measuresexamining diversity, existing methods were exploited by
Table 2 Participant demographics from the study of TT andmatched controls collected between May 2006 and February2009 in The Gambia. Age (generalised linear model) and gender(Fisher’s exact test) were compared between healthy controlsand scarred cases, associated P-values are indicated
Healthy controls Scarred cases P-value
Number 58 58 na
Age in years (95% CI) 55.50 (30.43–73.73) 60.00 (34.00–77.88) 0.199
Female (n [%]) 40 (68.97) 39 (67.24) 0.842
Abbreviation: na not applicable, CI Confidence intervals, n number
Table 3 Participant demographics from the study of TT/CO andmatched controls from The Gambia in 2011. Age (generalisedlinear model) and gender (Fisher’s exact test) were comparedbetween healthy controls and scarred cases, associated P-valuesare indicated
Healthy controls Scarred cases P-value
Number 38 52 na
Age in years (95% CI) 19.50 (1.00–39.00) 20.50 (3.55–37.73) 0.224
Female, n (%) 30 (78.95) 45 (86.54) 0.343
Abbreviation: na not applicable, CI confidence intervals, n number
Pickering et al. Parasites & Vectors (2017) 10:143 Page 3 of 12
utilising the continuous OD/signal intensity values. Thiswas deemed more appropriate as an assumption of thesemethods was that individuals within a species are equiva-lent [39, 40], in this analysis the species are antigens, andpositive responses to them are not equal.We utilised two different measures of diversity to im-
prove the reliability of the results. Shannon’s entropy (H)and Simpson’s index (D) [40]. Higher values for both in-dicate increased diversity and greater evenness. Highvalues of H mean that an unknown individual could be-long to any species. In our context, this means one unitof antibody in a sample could be targeted against anyantigen because responses in the sample are equivalent[41]. High values of D mean that two randomly chosenindividuals are likely to be from different species. In ourcontext, this means two separate units of antibody fromthe array are unlikely to be targeted against the sameantigen due to evenness of the responses [41].
Recombinant protein expression and peptide synthesisPgp3, CT667 and CT706 GST-fusion Ct constructs wereprovided by Professor Guangming Zhong (UT Health Sci-ence Center, San Antonio, TX) and were produced as previ-ously described [24]. Briefly, 1 L of 2x YT media wasinoculated with frozen stocks of transformed E. coli and in-cubated at 37 °C overnight at 230 RPM. Overnight cultureswere diluted into 2× YT media and incubated at 37 °C at230 RPM until OD 600 reached 0.6 to 1.2. IPTG was addedat a concentration of 200 μM to induce expression and in-cubated at 30 °C for three h. Cultures were centrifuged at4 °C for 30 min at 4000× g, and the harvested cells were re-suspended in 1:20 culture volume of phosphate-buffered sa-line (PBS) with protease inhibitors. The bacteria were lysedby mechanical cell disruption followed by centrifugation at4 °C for 30 min at 4000× g to remove aggregated materialand cell debris. Relevant detergents were added, 1% (v/v)Triton X-100 for Pgp3 and CT667 and 1% (w/v) ASB-14for CT706, and the samples incubated at room temperaturefor 2 h on a roller. The samples were centrifuged at 4 °Cfor 1 g at 12,000× g, and the supernatants containing sol-uble proteins and stored at -20 °C.To affinity purify proteins 1:2000 culture volume of a
50% slurry of glutathione Sepharose beads was added tothe soluble protein samples to bind the GST moiety andthe mixture incubated at room temperature for 2 h on aroller. The samples were passed down a 5 ml polypropyl-ene column leaving a bed of GST-fusion bound beads. Tocleave the GST-fusion before purification, the beads werewashed. The correlation times with 5 ml cleavage bufferbefore adding 1:4000 culture volume cleavage buffer with8% (v/v) PreScission Protease (GE Healthcare Life Sci-ences, Little Chalfont, UK) and incubated at 4 °C over-night. The eluates were collected, and the elution steprepeated twice. Cleaved recombinant proteins were
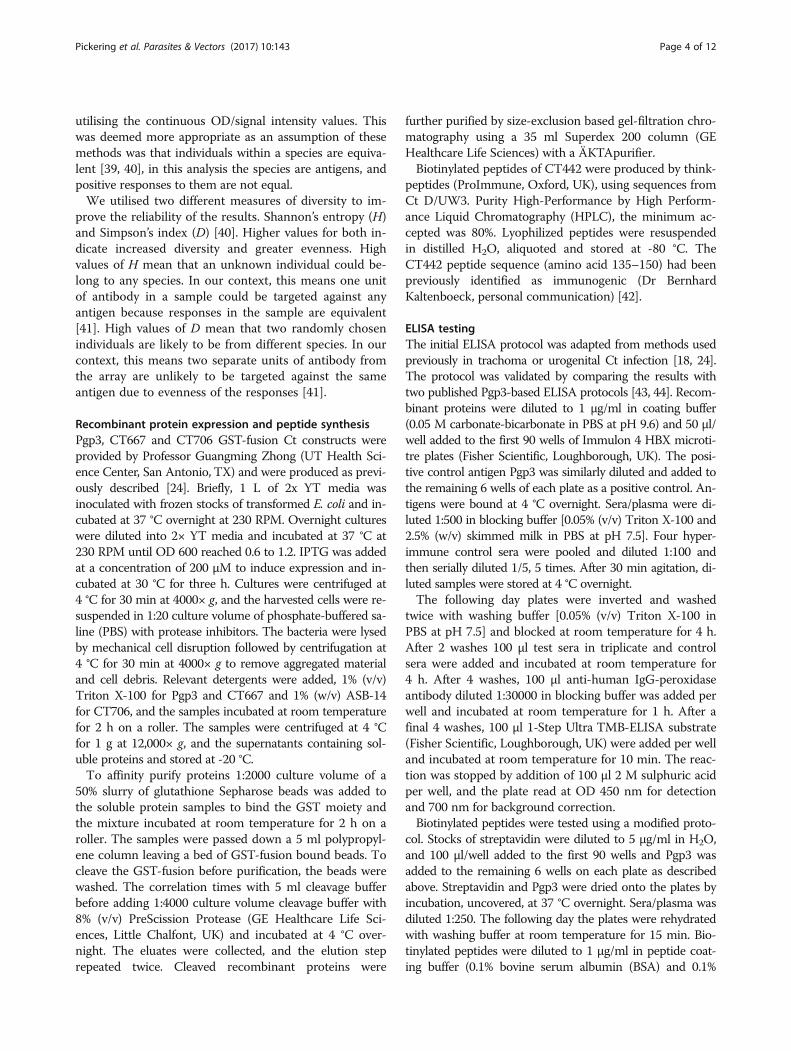
further purified by size-exclusion based gel-filtration chro-matography using a 35 ml Superdex 200 column (GEHealthcare Life Sciences) with a ÄKTApurifier.Biotinylated peptides of CT442 were produced by think-
peptides (ProImmune, Oxford, UK), using sequences fromCt D/UW3. Purity High-Performance by High Perform-ance Liquid Chromatography (HPLC), the minimum ac-cepted was 80%. Lyophilized peptides were resuspendedin distilled H2O, aliquoted and stored at -80 °C. TheCT442 peptide sequence (amino acid 135–150) had beenpreviously identified as immunogenic (Dr BernhardKaltenboeck, personal communication) [42].
ELISA testingThe initial ELISA protocol was adapted from methods usedpreviously in trachoma or urogenital Ct infection [18, 24].The protocol was validated by comparing the results withtwo published Pgp3-based ELISA protocols [43, 44]. Recom-binant proteins were diluted to 1 μg/ml in coating buffer(0.05 M carbonate-bicarbonate in PBS at pH 9.6) and 50 μl/well added to the first 90 wells of Immulon 4 HBX microti-tre plates (Fisher Scientific, Loughborough, UK). The posi-tive control antigen Pgp3 was similarly diluted and added tothe remaining 6 wells of each plate as a positive control. An-tigens were bound at 4 °C overnight. Sera/plasma were di-luted 1:500 in blocking buffer [0.05% (v/v) Triton X-100 and2.5% (w/v) skimmed milk in PBS at pH 7.5]. Four hyper-immune control sera were pooled and diluted 1:100 andthen serially diluted 1/5, 5 times. After 30 min agitation, di-luted samples were stored at 4 °C overnight.The following day plates were inverted and washed
twice with washing buffer [0.05% (v/v) Triton X-100 inPBS at pH 7.5] and blocked at room temperature for 4 h.After 2 washes 100 μl test sera in triplicate and controlsera were added and incubated at room temperature for4 h. After 4 washes, 100 μl anti-human IgG-peroxidaseantibody diluted 1:30000 in blocking buffer was added perwell and incubated at room temperature for 1 h. After afinal 4 washes, 100 μl 1-Step Ultra TMB-ELISA substrate(Fisher Scientific, Loughborough, UK) were added per welland incubated at room temperature for 10 min. The reac-tion was stopped by addition of 100 μl 2 M sulphuric acidper well, and the plate read at OD 450 nm for detectionand 700 nm for background correction.Biotinylated peptides were tested using a modified proto-
col. Stocks of streptavidin were diluted to 5 μg/ml in H2O,and 100 μl/well added to the first 90 wells and Pgp3 wasadded to the remaining 6 wells on each plate as describedabove. Streptavidin and Pgp3 were dried onto the plates byincubation, uncovered, at 37 °C overnight. Sera/plasma wasdiluted 1:250. The following day the plates were rehydratedwith washing buffer at room temperature for 15 min. Bio-tinylated peptides were diluted to 1 μg/ml in peptide coat-ing buffer (0.1% bovine serum albumin (BSA) and 0.1%
Pickering et al. Parasites & Vectors (2017) 10:143 Page 4 of 12

sodium azide in PBS at pH 7.5), and 50 μl/well added tothe first 90 wells, blocking buffer was added to theremaining 6 wells of each plate. Peptides were bound tostreptavidin at room temperature for 1 h with agitation.After 2 washes plates were blocked at room temperaturefor 30 min. After 2 washes the antibody binding and detec-tion were performed as above.Non-specific absorbance at OD 700 nm was subtracted
from absorbance at 450 nm, samples in triplicate were av-eraged and values greater than 1 standard deviation fromthe mean excluded. If two out of three repeats were
greater than 1 standard deviation from the mean, sampleswere retested. Values from each positive control dilutionwere averaged across all plates for each sample set. Valuesfrom each plate were divided by the averaged values, themean deviation for each plate’s serial dilution from theaverage was used to transform each plate’s values.
Statistical and in silico analysesAll comparisons were between scarring cases (TT andCO) and healthy matched controls unless otherwisestated. The intensity of responses was compared using a
Fig. 1 Over-representation of late and very early expressed proteins and extracellular, outer membrane and periplasmic proteins in immunogenicantigens. a Proteins identified through transcriptomics as expressed late or very early in the Ct developmental cycle were over-represented in the 230immunogenic antigens (light grey) compared with the total unfiltered 908 (dark grey). b Proteins with a consensus localisation prediction of extracellular,outer membrane and periplasm were over-represented in the 230 immunogenic antigens (light grey) compared with the total unfiltered 908 (dark grey).Error bars represent standard deviation
Pickering et al. Parasites & Vectors (2017) 10:143 Page 5 of 12

generalised linear model (glm) and number of positiveresponses using Fisher’s exact test. For the glm analysis,10,000 permutations of the outcome variable were per-formed to generate an adjusted P-value (P*), controllingfor type-1 error. Likelihood ratio tests were used to com-pare models with null models only including the covari-ates, age and gender.Developmental cycle expression stage for each tran-
script was based on data and groupings from Bellandet al. [45], this grouping was manually assigned todata from Nicholson et al. [46]. Localisation ofexpressed proteins was predicted using Cello [47],pSORTB [48] and loctree3 [49], three of the top per-forming prediction tools for bacterial proteins [49].Predicted localisation was defined as the consensusfrom the 3 tools.
ResultsAntibody responses are focussed on antigens expressedearly and late during the developmental cycle andlocalised to interact with the hostAfter normalisation and filtering out of infrequently recog-nised antigens, responses of 59 individuals against 230 anti-gens were included in the analyses. Binary classification ofpositive and negative samples per antigen was achievedusing the most appropriate clustering method, determinedby average silhouette width (Additional file 3: Figure S1).Comparing the 230 antigens remaining after filtering withthe 908 proteins screened on the array indicated, there wasa significant over-representation of genes whose peak ex-pression is either very early or very late in the developmen-tal cycle, likely representing antigens important in cell entryand those exposed at exit, P-values 0.003 and 0.025 (Fig. 1a).
Fig. 2 No significant differences in diversity of antibody responses between adults with and without scarring. Diversity was measured using Simpson’sdiversity index (D-1) (a) and Shannon’s diversity index (H) (b). Median (red lines) and notches were calculated as the median +/- 1.57 x IQR/sqrt of n,where IQR is the interquartile range and n is the number of samples. The IQR times 1.5 was added to the 75th percentile and subtracted from the25th percentile to determine the whiskers. Dots are outliers
Pickering et al. Parasites & Vectors (2017) 10:143 Page 6 of 12
Notably, proteins predicted to be extracellular/secreted, orlocalised to the outer membrane and periplasm were alsoover-represented in the immunogenic antigens, P-value <0.001 (Fig. 1b).Next, we utilised the global profile of antibody responses
in scarred and healthy individuals to identify differences indiversity or evenness of responses. The breadth of re-sponse tended to be higher in scarred individuals howeverit was highly variable and did not reach significance, P-value 0.620. Simpson’s diversity index was skewed by afew individuals with very focused responses and showedno difference between groups, P-value = 0.451 (Fig. 2a).Shannon’s diversity index, similar to measures of breadth,tended to be lower in healthy individuals but the differ-ence was not significant, P-value = 0.130 (Fig. 2b).
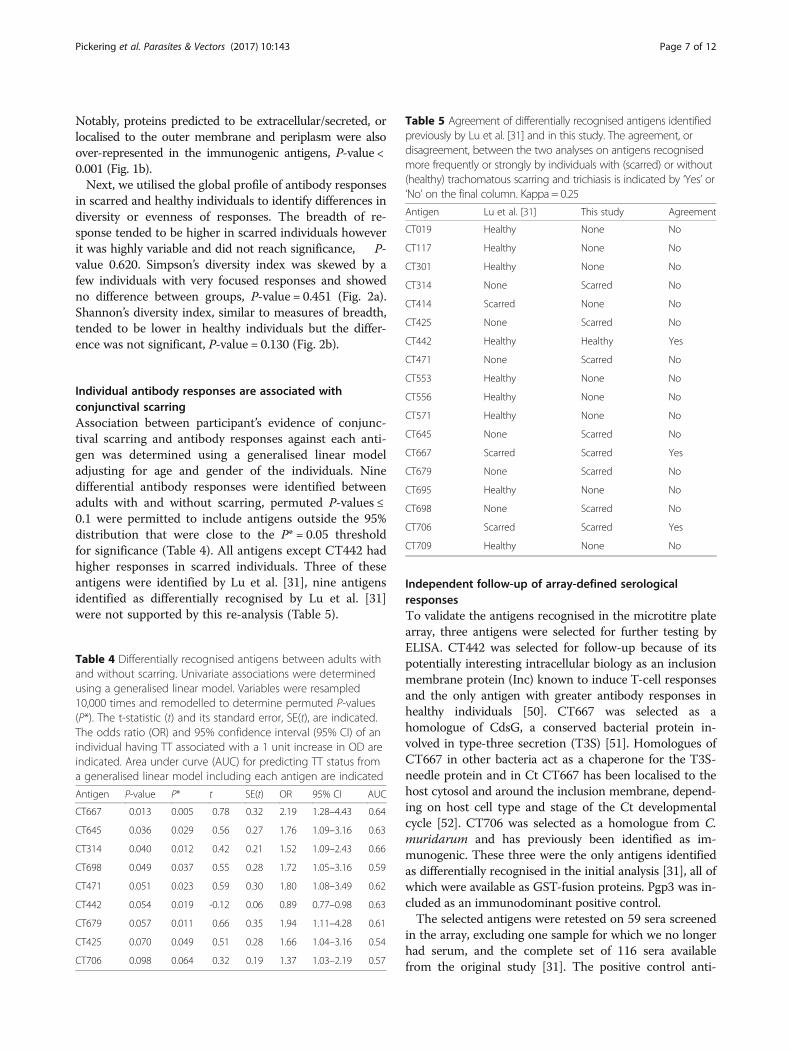
Individual antibody responses are associated withconjunctival scarringAssociation between participant’s evidence of conjunc-tival scarring and antibody responses against each anti-gen was determined using a generalised linear modeladjusting for age and gender of the individuals. Ninedifferential antibody responses were identified betweenadults with and without scarring, permuted P-values ≤0.1 were permitted to include antigens outside the 95%distribution that were close to the P* = 0.05 thresholdfor significance (Table 4). All antigens except CT442 hadhigher responses in scarred individuals. Three of theseantigens were identified by Lu et al. [31], nine antigensidentified as differentially recognised by Lu et al. [31]were not supported by this re-analysis (Table 5).
Independent follow-up of array-defined serologicalresponsesTo validate the antigens recognised in the microtitre platearray, three antigens were selected for further testing byELISA. CT442 was selected for follow-up because of itspotentially interesting intracellular biology as an inclusionmembrane protein (Inc) known to induce T-cell responsesand the only antigen with greater antibody responses inhealthy individuals [50]. CT667 was selected as ahomologue of CdsG, a conserved bacterial protein in-volved in type-three secretion (T3S) [51]. Homologues ofCT667 in other bacteria act as a chaperone for the T3S-needle protein and in Ct CT667 has been localised to thehost cytosol and around the inclusion membrane, depend-ing on host cell type and stage of the Ct developmentalcycle [52]. CT706 was selected as a homologue from C.muridarum and has previously been identified as im-munogenic. These three were the only antigens identifiedas differentially recognised in the initial analysis [31], all ofwhich were available as GST-fusion proteins. Pgp3 was in-cluded as an immunodominant positive control.The selected antigens were retested on 59 sera screened
in the array, excluding one sample for which we no longerhad serum, and the complete set of 116 sera availablefrom the original study [31]. The positive control anti-
Table 4 Differentially recognised antigens between adults withand without scarring. Univariate associations were determinedusing a generalised linear model. Variables were resampled10,000 times and remodelled to determine permuted P-values(P*). The t-statistic (t) and its standard error, SE(t), are indicated.The odds ratio (OR) and 95% confidence interval (95% CI) of anindividual having TT associated with a 1 unit increase in OD areindicated. Area under curve (AUC) for predicting TT status froma generalised linear model including each antigen are indicated
Antigen P-value P* t SE(t) OR 95% CI AUC
CT667 0.013 0.005 0.78 0.32 2.19 1.28–4.43 0.64
CT645 0.036 0.029 0.56 0.27 1.76 1.09–3.16 0.63
CT314 0.040 0.012 0.42 0.21 1.52 1.09–2.43 0.66
CT698 0.049 0.037 0.55 0.28 1.72 1.05–3.16 0.59
CT471 0.051 0.023 0.59 0.30 1.80 1.08–3.49 0.62
CT442 0.054 0.019 -0.12 0.06 0.89 0.77–0.98 0.63
CT679 0.057 0.011 0.66 0.35 1.94 1.11–4.28 0.61
CT425 0.070 0.049 0.51 0.28 1.66 1.04–3.16 0.54
CT706 0.098 0.064 0.32 0.19 1.37 1.03–2.19 0.57
Table 5 Agreement of differentially recognised antigens identifiedpreviously by Lu et al. [31] and in this study. The agreement, ordisagreement, between the two analyses on antigens recognisedmore frequently or strongly by individuals with (scarred) or without(healthy) trachomatous scarring and trichiasis is indicated by ‘Yes’ or‘No’ on the final column. Kappa = 0.25
Antigen Lu et al. [31] This study Agreement
CT019 Healthy None No
CT117 Healthy None No
CT301 Healthy None No
CT314 None Scarred No
CT414 Scarred None No
CT425 None Scarred No
CT442 Healthy Healthy Yes
CT471 None Scarred No
CT553 Healthy None No
CT556 Healthy None No
CT571 Healthy None No
CT645 None Scarred No
CT667 Scarred Scarred Yes
CT679 None Scarred No
CT695 Healthy None No
CT698 None Scarred No
CT706 Scarred Scarred Yes
CT709 Healthy None No
Pickering et al. Parasites & Vectors (2017) 10:143 Page 7 of 12
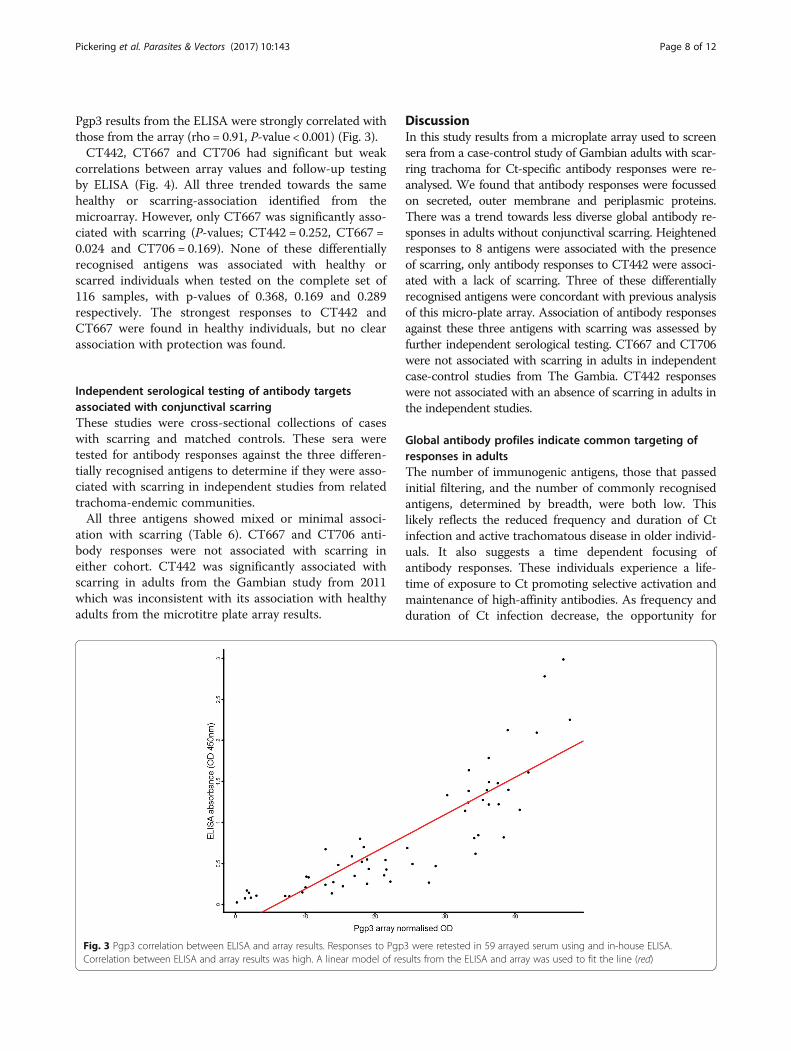
Pgp3 results from the ELISA were strongly correlated withthose from the array (rho = 0.91, P-value < 0.001) (Fig. 3).CT442, CT667 and CT706 had significant but weak
correlations between array values and follow-up testingby ELISA (Fig. 4). All three trended towards the samehealthy or scarring-association identified from themicroarray. However, only CT667 was significantly asso-ciated with scarring (P-values; CT442 = 0.252, CT667 =0.024 and CT706 = 0.169). None of these differentiallyrecognised antigens was associated with healthy orscarred individuals when tested on the complete set of116 samples, with p-values of 0.368, 0.169 and 0.289respectively. The strongest responses to CT442 andCT667 were found in healthy individuals, but no clearassociation with protection was found.
Independent serological testing of antibody targetsassociated with conjunctival scarringThese studies were cross-sectional collections of caseswith scarring and matched controls. These sera weretested for antibody responses against the three differen-tially recognised antigens to determine if they were asso-ciated with scarring in independent studies from relatedtrachoma-endemic communities.All three antigens showed mixed or minimal associ-
ation with scarring (Table 6). CT667 and CT706 anti-body responses were not associated with scarring ineither cohort. CT442 was significantly associated withscarring in adults from the Gambian study from 2011which was inconsistent with its association with healthyadults from the microtitre plate array results.
DiscussionIn this study results from a microplate array used to screensera from a case-control study of Gambian adults with scar-ring trachoma for Ct-specific antibody responses were re-analysed. We found that antibody responses were focussedon secreted, outer membrane and periplasmic proteins.There was a trend towards less diverse global antibody re-sponses in adults without conjunctival scarring. Heightenedresponses to 8 antigens were associated with the presenceof scarring, only antibody responses to CT442 were associ-ated with a lack of scarring. Three of these differentiallyrecognised antigens were concordant with previous analysisof this micro-plate array. Association of antibody responsesagainst these three antigens with scarring was assessed byfurther independent serological testing. CT667 and CT706were not associated with scarring in adults in independentcase-control studies from The Gambia. CT442 responseswere not associated with an absence of scarring in adults inthe independent studies.
Global antibody profiles indicate common targeting ofresponses in adultsThe number of immunogenic antigens, those that passedinitial filtering, and the number of commonly recognisedantigens, determined by breadth, were both low. Thislikely reflects the reduced frequency and duration of Ctinfection and active trachomatous disease in older individ-uals. It also suggests a time dependent focusing ofantibody responses. These individuals experience a life-time of exposure to Ct promoting selective activation andmaintenance of high-affinity antibodies. As frequency andduration of Ct infection decrease, the opportunity for
Fig. 3 Pgp3 correlation between ELISA and array results. Responses to Pgp3 were retested in 59 arrayed serum using and in-house ELISA.Correlation between ELISA and array results was high. A linear model of results from the ELISA and array was used to fit the line (red)
Pickering et al. Parasites & Vectors (2017) 10:143 Page 8 of 12

restimulation of Ct-specific plasma cells may be reduced.While some of these Ct-specific cells may be maintainedas long-lived plasma cells, reactivation by abundant andimmunogenic Ct antigens favours survival and expansionof specific plasma cells. This can put antigens commonlyexposed to the extracellular space and B-cells at a selectiveadvantage. Antibodies specific to these antigens are morelikely to be activated during infrequent episodes of Ct in-fection, promoting their activation and affinity maturation.This more focused profile of antibody responses wasreflected in the common recognition of antigens
expressed at similar stages of chlamydial development ortheir cellular localisation.The recognition of proteins expressed very early and
late in the Ct developmental cycle was over-represented.It is during these periods that Ct, in the form of infec-tious EBs, is most exposed to the humoral immune sys-tem. Potential targets may be EB outer membraneproteins, proteins in the membrane of extrusions[53] and a more unpredictable group of proteins exposedto the extracellular environment upon Ct lytic exit fromcells. This was supported by the over-representation of
Fig. 4 CT442, CT667 and CT706 correlation between ELISA and array results. Responses to CT442 (a), CT667 (b) and CT706 (c) were retested in 59arrayed serum using an in-house ELISA. Correlation between ELISA and array results was poor for CT442 (rho 0.26, P = 0.046). Correlation betweenELISA and array results for CT667 and CT706 were moderate (rho 0.59 and 0.58, both P < 0.001). A linear model of results from the ELISA and arraywas used to fit the line (red)
Pickering et al. Parasites & Vectors (2017) 10:143 Page 9 of 12

the chlamydial outer membrane, extracellular and peri-plasmic proteins in the complete list of immunogenicantigens.The diversity of antibody responses was not signifi-
cantly different between adults with and without trach-omatous scarring. There was a trend towards increaseddiversity in scarred adults by Shannon’s diversity index,but this was not supported by Simpson’s diversity index.This reinforces the finding that adults, in general, hadfocussed antibody responses.
Few antigens are differentially recognised betweenindividuals with and without scarring trachomaThere was no difference in the diversity profile ofantibody responses between adults with and withoutscarring. However, a small panel of antigens was differ-entially recognised between these groups. Antibody re-sponses to eight antigens were associated with scarringand responses to a single antigen were associated with alack of scarring. The low number of differentiallyrecognised antigens supports a focusing and reducedheterogeneity of antibody responses in older individ-uals. Three of these antigens were identified as differ-entially recognised in the analysis by Lu et al. [31]:CT442, CT667 and CT706. Of the seven antigenspreviously identified that were not supported follow-ing independent analysis, six had been originally dif-ferentially associated by Fisher’s exact test comparingthe number of positive responses between adults withand without scarring. A more objective definition ofpositivity was used in the follow-up independent ana-lysis leading to no significant differentially recognisedantigens being identified.Limited published information was available for these
antigens. CT314, CT425 and CT442 have been identifiedas immunogenic in patients with urogenital Ct or relateddisease [25], and mouse models have shown CT442 is a
target of CD8+ T-cell responses [50]. No functional stud-ies of these antigens have been undertaken, althoughsome of them share homology with bacterial proteins ofknown functions. These relate to cell division (CT471and CT697), transcription (CT314), protein qualitycontrol (CT706) and type-3 secretion (CT667). Thesehomologues and localisation predictions suggest theylikely reside within the inclusion, meaning they wouldonly be exposed to B-cells upon cell lysis. There isevidence that some of these targets may be more easilyaccessible to the host immune system. Proteomic ana-lysis of Ct EBs identified CT314 as a component of theouter membrane complex [54]. CT442 has been local-ised to the inclusion membrane [50] at early stages ofthe Ct developmental cycle, CT667 appears to reside inthe cytosol [52].
Validation of large-scale array-based methods is essentialResponses against the positive control Pgp3 were stronglycorrelated between the array and in-house ELISA. Thecorrelation was strong for the differentially recognisedCT667 and CT706 but not CT442, although the latterwas tested using a short peptide rather than a full-lengthrecombinant. A caveat to the lack of identification of someimmunodominant antigens on the array, such as MOMPand the majority of polymorphic membrane proteins(pmp) is their poor immunogenicity since they did notpass initial filtering of recognised antigens. PmpC(CT414) and PmpD (CT812) were the only Pmp’s fre-quently recognised and both were expressed as fragments,not full-length proteins. This suggests large, multimericproteins such as these should be expressed as fragmentsor peptides alongside full-length proteins in microarrays.Antibody responses associated with conjunctival scar-
ring (CT667 and CT706) or an absence of conjunctivalscarring (CT442) from the array analysis were not sup-ported in the complete set of sera or the two further sets
Table 6 ELISA results from the complete 116 sera and two further scarring case-control studies. The three arrayed antigens weretested on the complete set of 116 sera (2006), 231 samples from a previous scarring case-control study in The Gambia (1995) and asubsequent scarring case-control study in The Gambia (2011). CT442 showed no association with the absence of scarring, andCT667/CT706 were not associated with scarring
Antigen Sera Healthy median (IQR) Scarred median (IQR) P-value OR (95% CI)
CT442 2006 0.24 (0.19–0.33) 0.27 (0.18–0.33) 0.368 0.33 (0.02–3.36)
1995 0.29 (0.18–0.43) 0.30 (0.15–0.46) 0.990 1.00 (0.46–2.13)
2011 0.31 (0.22–0.38) 0.36 (0.24–0.48) 0.023 36.19 (2.20–1109.21)
CT667 2006 0.04 (0.03–0.06) 0.04 (0.03–0.07) 0.169 2766.28 (0.06–6.20 × 10⁸)
1995 0.14 (0.05–0.23) 0.12 (0.03–0.23) 0.344 0.59 (0.18–1.68)
2011 0.03 (0.02–0.06) 0.03 (0.02–0.07) 0.802 0.23 (2.47 × 10⁻⁶–24,634.90)
CT706 2006 0.05 (0.03–0.07) 0.04 (0.03–0.06) 0.289 42.59 (0.07–1.26 × 10⁵)
1995 0.14 (0.06–0.23) 0.12 (0.04–0.23) 0.307 0.58 (0.18–1.57)
2011 0.02 (0.02–0.06) 0.03 (0.02–0.08) 0.940 1.24 (0.005–619.41)
Pickering et al. Parasites & Vectors (2017) 10:143 Page 10 of 12

of sera. These results suggest the differentially recog-nised antigens identified are likely false-positive artefactsfrom screening of small numbers of sera on the array.CT442 is an example of where one or two individualswith high levels of antibody against an antigen skewedthe results in the small data set. This highlights the needfor validation and follow-up of antibody targets identi-fied through related high-throughput techniques.
ConclusionsAntibody responses against Ct antigens were focussed inadults. There was considerable homogeneity betweenthose with and without conjunctival scarring. Antibody re-sponses were focussed on antigens expressed early andlate in the Ct developmental cycle and localised to theouter membrane or secreted. Only nine antigens were dif-ferentially recognised between the two groups, of whichonly one (CT442) was inconsistently associated with alack of scarring. Understanding how these antigens be-come antibody targets and how this could impact scarringis difficult due to limited localisation and functional infor-mation. Heterogenous responses in the studies examinedhere highlight the need for large sample sizes and clearlydefined clinical phenotypes in human studies of humoralimmunity to reduce the influence of outliers. Immunoge-netic information would further aid understanding of theobserved heterogeneity in antibody responses.
Additional files
Additional file 1: Table S1. Summary of previous Ct micro-array anti-gen identification. (DOCX 16 kb)
Additional file 2: Table S2. Raw OD values and anonymised clinicaldata from the microarray. (XLSX 290 kb)
Additional file 3: Figure S1. Average silhouette widths for clusteringmethod trialled for 230 antigens. ‘Best’ method had the highest medianacross all antigens. Clustering methods are detailed on the left-hand side.Red lines indicate the median. Notches were calculated as median +/-1.57 × IQR/sqrt of n, where IQR is the interquartile range and n is thenumber of samples. The whiskers were calculated by adding 1.5 timesthe IQR to the 75 percentile and subtracting 1.5 times the IQR from the25 percentile. Dots are outliers. (TIFF 337 kb)
AcknowledgementsWe would like to thank Professor Guangming Zhong (UT Health ScienceCenter, San Antonio, TX) for providing the GST-fusion constructs of the Ctantigens used in this study and Professor Bernhard Kaltenboeck (Auburn Uni-versity, Auburn, AL) for providing information used in selecting an immuno-genic region of CT442 for peptide synthesis. We are grateful to theparticipants who volunteered to take part in the three studies utilised in thismanuscript. We would like to David Conway, Robin Bailey and David Mabeyfor their various contributions to this work and the studies utilised.
FundingThis work was supported by a programme grant from the Wellcome Trust(GR079246MA). HP was funded by the Bloomsbury Colleges StudentshipProgramme.
Availability of data and materialsThe datasets supporting the conclusions of this article are included withinthe article. Raw OD values and anonymised clinical data are available inAdditional file 3: Table S2.
Authors’ contributionsConception: HP, RDH and MJH. Fieldwork: PM, HJ, TD, SEB and MJH. Datacollection and analysis: HP and MJH. Manuscript preparation: HP, TD, SEB,RDH and MJH. All authors read and approved the final manuscript.
Competing interestsThe authors declare that they have no competing interests.
Consent for publicationNot applicable.
Ethics approval and consent to participateThe study was conducted in accordance with the Declaration of Helsinki.Samples included in the study were obtained from anonymous archivedserum stocks. Permission for collection of samples/specimens was grantedby the relevant local and national ethics committees of the London Schoolof Hygiene and Tropical Medicine and The Gambian Government/MedicalResearch Council Unit. Written informed consent before a participant’senrolment was obtained from all adult participants and a parent or aguardian for participants aged under 18 years.
Publisher’s NoteSpringer Nature remains neutral with regard to jurisdictional claims inpublished maps and institutional affiliations.
Author details1Clinical Research Department, London School of Hygiene and TropicalMedicine, Keppel Street, London, UK. 2Disease Control and EliminationTheme, Medical Research Council, The Gambia Unit, Fajara, Banjul, Gambia.3Institute of Structural and Molecular Biology, Birkbeck and University CollegeLondon, Malet Street, London, UK.
Received: 14 December 2016 Accepted: 6 March 2017
References1. Mabey DCW, Solomon AW, Foster A. Trachoma Lancet. 2003;362(9379):223–9.2. Grayston JT, Wang S-P, Yeh LJ, Kuo CC. Importance of reinfection in the
pathogenesis of trachoma. Rev Infect Dis. 1985;7(6):717–25.3. Silverstein AM. The immunologic modulation of infectious disease
pathogenesis. Invest Ophthalmol. 1973;13(8):560–74.4. Burton MJ, Rajak SN, Bauer J, Weiss HA, Tolbert SB, Shoo A, et al.
Conjunctival transcriptome in scarring trachoma. Infect Imm.2011;79(1):499–511.
5. Taylor HR, Siler JA, Mkocha HA, Munoz B, West S. The natural historyof endemic trachoma: a longitudinal study. Am J Trop Med Hyg.1992;46(5):552–9.
6. Burton MJ, Bowman RJ, Faal H, Aryee EA, Ikumapayi UN, Alexander ND, etal. The long-term natural history of trachomatous trichiasis in the Gambia.Invest Ophthalmol Vis Sci. 2006;47(3):847–52.
7. Ramadhani AM, Derrick T, Holland MJ, Burton MJ. Blinding trachoma:Systematic review of rates and risk fctors for progressive disease. PLoS NTDs.2016;10(8):e0004859.
8. Mabey DC, Bailey RL, Ward ME, Whittle HC. A longitudinal study oftrachoma in a Gambian village: implications concerning the pathogenesisof chlamydial infection. Epidemiol Infect. 1992;108(2):343–51.
9. Burton MJ, Holland MJ, Jeffries D, Mabey DCW, Bailey RL. Conjunctivalchlamydial 16S ribosomal RNA expression in trachoma: Is chlamydialmetabolic activity required for disease to develop? Clin Infect Dis. 2006;42(4):463–370.
10. Burton MJ, Adegbola RA, Kinteh F, Ikumapayi UN, Foster A, Mabey DC, et al.Bacterial infection and trachoma in the Gambia: a case control study. InvestOphthalmol Vis Sci. 2007;48(10):4440–4.
11. Hu V, Massae P, Weiss HA, Chevallier C, Onyango JJ, Afwamba IA, et al.Bacterial infection in scarring trachoma. Invest Ophthalmol Vis Sci.2011;52(5):2181–6.
Pickering et al. Parasites & Vectors (2017) 10:143 Page 11 of 12

12. Guzey M, Ozardali I, Kilic A, Basar E, Dogan Z, Satici A, et al. The treatmentof severe trachomatous dry eye with canalicular silicone plugs. Eye.2001;15(Pt 3):297–303.
13. Lucena A, Akaishi PM, Rodrigues Mde L, Cruz AA. Upper eyelid entropionand dry eye in cicatricial trachoma without trichiasis. Arq Bras Oftalmol.2012;75(6):420–2.
14. Ward M, Bailey R, Lesley A, Kajbaf M, Robertson J, Mabey D. Persistinginapparent chlamydial infection in a trachoma endemic community in TheGambia. Scand J Infect Dis Supplementum. 1990;69:137–48.
15. Peeling RW, Bailey RL, Conway DJ, Holland MJ, Campbell AE, Jallow O, et al.Antibody response to the 60-kDa chlamydial heat-shock protein isassociated with scarring trachoma. J Infect Dis. 1998;177(1):256–9.
16. Holland MJ, Bailey RL, Hayes LJ, Whittle HC, Mabey DCW. Conjunctivalscarring in trachoma is associated with depressed cell-mediated immuneresponses to chlamydial antigens. J Infect Dis. 1993;168(6):1528–31.
17. Hessel T, Dhital SP, Plank R, Dean D. Immune response to chlamydial 60-kilodalton heat shock protein in tears from Nepali trachoma patients. InfectImm. 2001;69(8):4996–5000.
18. Skwor T, Kandel RP, Basravi S, Khan A, Sharma B, Dean D. Characterization ofhumoral immune responses to chlamydial HSP60, CPAF, and CT795 ininflammatory and severe trachoma. Invest Ophthalmol Vis Sci. 2010;51(10):5128–36.
19. Davies DH, Liang X, Hernandez JE, Randall A, Hirst S, Mu Y, et al. Profilingthe humoral immune response to infection by using proteome microarrays:high-throughput vaccine and diagnostic antigen discovery. Proc Natl AcadSci USA. 2005;102(3):547–52.
20. Doolan DL, Mu Y, Unal B, Sundaresh S, Hirst S, Valdez C, et al. Profilinghumoral immune responses to P. falciparum infection with proteinmicroarrays. J Proteomics. 2008;8(22):4680–94.
21. Trieu A, Kayala MA, Burk C, Molina DM, Freilich DA, Richie TL, et al. Sterileprotective immunity to malaria is associated with a panel of novel P.falciparum antigens. Mol Cell Proteomics. 2011;10(9):M111. 007948.
22. Kunnath-Velayudhan S, Salamon H, Wang HY, Davidow AL, Molina DM,Huynh VT, et al. Dynamic antibody responses to the Mycobacteriumtuberculosis proteome. Proc Natl Acad Sci USA. 2010;107(33):14703–8.
23. Liang L, Felgner PL. A systems biology approach for diagnostic and vaccineantigen discovery in tropical infectious diseases. Curr Opin Infect Dis.2015;28(5):438–45.
24. Sharma J, Zhong Y, Dong F, Piper JM, Wang G, Zhong G. Profiling of humanantibody responses to Chlamydia trachomatis urogenital tract infectionusing microplates arrayed with 156 chlamydial fusion proteins. Infect Imm.2006;74(3):1490–9.
25. Wang J, Zhang Y, Lu C, Lei L, Yu P, Zhong G. A genome-wide profiling of thehumoral immune response to Chlamydia trachomatis infection reveals vaccinecandidate antigens expressed in humans. J Immunol. 2010;185(3):1670–80.
26. Rodgers AK, Budrys NM, Gong S, Wang J, Holden A, Schenken RS, et al.Genome-wide identification of Chlamydia trachomatis antigens associatedwith tubal factor infertility. Fertil Steril. 2011;96(3):715–21.
27. Budrys NM, Gong S, Rodgers AK, Wang J, Louden C, Shain R, et al. Chlamydiatrachomatis antigens recognized in women with tubal factor infertility, normalfertility, and acute infection. Obstet Gynecol. 2012;119(5):1009–16.
28. Coler RN, Bhatia A, Maisonneuve JF, Probst P, Barth B, Ovendale P, et al.Identification and characterization of novel recombinant vaccine antigensfor immunization against genital Chlamydia trachomatis. FEMS ImmunolMed Microbiol. 2009;55(2):258–70.
29. Finco O, Frigimelica E, Buricchi F, Petracca R, Galli G, Faenzi E, et al.Approach to discover T- and B-cell antigens of intracellular pathogensapplied to the design of Chlamydia trachomatis vaccines. Proc Natl Acad SciUSA. 2011;108(24):9969–74.
30. Teng A, Cruz-Fisher MI, Cheng C, Pal S, Sun G, Ralli-Jain P, et al. Proteomicidentification of immunodominant chlamydial antigens in a mouse model.J Proteomics. 2012;77:176–86.
31. Lu C, Holland MJ, Gong S, Peng B, Bailey RL, Mabey DW, et al. Genome-wide identification of Chlamydia trachomatis antigens associated withtrachomatous trichiasis. Invest Ophthalmol Vis Sci. 2012;53(6):2551–9.
32. Stekel D. Microarray Bioinformatics. Cambridge: Cambridge University Press;2003. p. 280.
33. Conway DJ, Holland MJ, Campbell AE, Bailey RL, Krausa P, Peeling RW, et al.HLA Class I and II polymorphisms and trachomatous scarring in a Chlamydiatrachomatis-endemic population. J Infect Dis. 1996;174(3):643–6.
34. Conway DJ, Holland MJ, Bailey RL, Campbell AE, Mahdi OSM, Jennings R,et al. Scarring trachoma is associated with polymorphism in the tumor
necrosis factor alpha (TNF-alpha) gene promoter and with elevated TNF-alpha levels in tear fluid. Infect Imm. 1997;65(3):1003–6.
35. Derrick T, Roberts CH, Rajasekhar M, Burr SE, Joof H, Makalo P, et al.Conjunctival microRNA expression in inflammatory trachomatous scarring.PLoS NTDs. 2013;7(3):e2117.
36. Kroll TC, Wolfl S. Ranking: a closer look on globalisation methods fornormalisation of gene expression arrays. Nucleic Acids Res. 2002;30(11):e50.
37. Migchelsen SJ, Martin DL, Southisombath K, Turyaguma P, Heggen A,Rubangakene PP, et al. Defining seropositivity thresholds for use intrachoma elimination studies. PLoS NTDs. 2016;11(1):e0005230.
38. Rousseeuw PJ. Silhouettes: A graphical aid to the interpretation andvalidation of cluster analysis. J Comput Appl Math. 1987;20:53–65.
39. Magurran AE. Assumptions of biodiversity measurement. In: MeasuringBiological Diversity. MA, USA: Blackwell Science; 2004. p. 256.
40. Gotelli NJ, Chao A. Measuring and estimating species richness, speciesdiversity, and biotic similarity from sampling data. In: Levin S, editor.Encyclopedia of Biodiversity. Waltham: Academic; 2013. p. 195–211.
41. Morris EK, Caruso T, Buscot F, Fischer M, Hancock C, Maier TS, et al.Choosing and using diversity indices: insights for ecological applicationsfrom the German Biodiversity Exploratories. Evol Ecol. 2014;4(18):3514–24.
42. Rahman KS, Chowdhury EU, Poudel A, Ruettger A, Sachse K, Kaltenboeck B.Defining species-specific immunodominant B cell epitopes for molecularserology of Chlamydia species. Clin Vaccine Immunol. 2015;22(5):539–52.
43. Wills GS, Horner PJ, Reynolds R, Johnson AM, Muir DA, Brown DW, et al.Pgp3 antibody enzyme-linked immunosorbent assay, a sensitive andspecific assay for seroepidemiological analysis of Chlamydia trachomatisinfection. Clin Vaccine Immunol. 2009;16(6):835–43.
44. Goodhew EB, Priest JW, Moss DM, Zhong G, Munoz B, Mkocha H, et al.CT694 and pgp3 as serological tools for monitoring trachoma programs.PLoS NTDs. 2012;6(11):e1873.
45. Belland RJ, Zhong G, Crane DD, Hogan D, Sturdevant D, Sharma J, et al.Genomic transcriptional profiling of the developmental cycle of Chlamydiatrachomatis. Proc Natl Acad Sci USA. 2003;100(14):8478–83.
46. Nicholson TL, Olinger L, Chong K, Schoolnik G, Stephens RS. Global stage-specific gene regulation during the developmental cycle of Chlamydiatrachomatis. J Bacteriol. 2003;185(10):3179–89.
47. Yu CS, Lin CJ, Hwang JK. Predicting subcellular localization of proteins forGram-negative bacteria by support vector machines based on n-peptidecompositions. Protein Sci. 2004;13(5):1402–6.
48. Yu NY, Wagner JR, Laird MR, Melli G, Rey S, Lo R, et al. PSORTb 3.0:improved protein subcellular localization prediction with refined localizationsubcategories and predictive capabilities for all prokaryotes. Bioinformatics.2010;26(13):1608–15.
49. Goldberg T, Hecht M, Hamp T, Karl T, Yachdav G, Ahmed N, et al. LocTree3prediction of localization. Nucleic Acids Res. 2014;42(Web Server issue):W350–5.
50. Starnbach MN, Loomis WP, Ovendale P, Regan D, Hess B, Alderson M, et al.An inclusion membrane protein from Chlamydia trachomatis enters theMHC Class I pathway and stimulates a CD8+ T cell response. J Immunol.2003;171(9):4742–9.
51. Betts HJ, Twiggs LE, Sal MS, Wyrick PB, Fields KA. Bioinformatic andbiochemical evidence for the identification of the type III secretion systemneedle protein of Chlamydia trachomatis. J Bacteriol. 2008;190(5):1680–90.
52. Spedding L. Novel effector protein secretion and transcriptional regulationof the Type Three Secretion System in Chlamydia trachomatis (Doctoraldissertation). Molecular Biosciences. Lawrence: University of Kansas;2009. p. 116.
53. Liu X, Afrane M, Clemmer DE, Zhong G, Nelson DE. Identification ofChlamydia trachomatis outer membrane complex proteins by differentialproteomics. J Bacteriol. 2010;192(11):2852–60.
54. Bartolini, E., E. Ianni, E. Frigimelica, R. Petracca, G. Galli, F. Berlanda Scorza,et al. Recombinant outer membrane vesicles carrying Chlamydia muridarumHtrA induce antibodies that neutralize chlamydial infection in vitro.J Extracell Vesicles. 2013;2
Pickering et al. Parasites & Vectors (2017) 10:143 Page 12 of 12