NCAER Profile... · NCAER State Investment Potential Index N-SIPI 2016 Study supported by Foreign...
24
NCAER State Investment Potential Index N-SIPI 2016 Study supported by Foreign and Commonwealth Office, British High Commission, India National Council of Applied Economic Research 11 Indraprastha Estate, New Delhi 110 002 NCAER | QUALITY . RELEVANCE . IMPACT March 2016
Transcript of NCAER Profile... · NCAER State Investment Potential Index N-SIPI 2016 Study supported by Foreign...
NCAER State Investment Potential Index N-SIPI 2016
Study supported byForeign and Commonwealth Office, British High Commission, India
National Council of Applied Economic Research11 Indraprastha Estate, New Delhi 110 002
NCAER | QUALITY . RELEVANCE . IMPACT
March 2016
© National Council of Applied Economic Research, 2016
All rights reserved. The material in this publication is copyrighted. NCAER encourages the dissemination of its work and will normally grant permission to reproduce portions of the work promptly. For permission to photocopy or reprint any part of this work, please send a request with complete information to the publisher below.
Published byAnil K. SharmaSecretary and Head of Operations and Senior Fellow, NCAERThe National Council of Applied Economic Research Parisila Bhawan, 11, Indraprastha EstateNew Delhi–110 002Tel: +91-11-2337-9861 to 3Fax: [email protected]
Disclaimer: The findings, interpretations, and conclusions expressed are those of the authors and do not necessarily reflect the views of the Governing Body of NCAER.
iiiNCAER State Investment Potential Index (N-SIPI)
Foreword
Emerging market economies have been the bulwark of global growth over the last decade. With the recent slowdown in the major emerging markets, including China, Russia, Brazil, and South Africa, India stands out as the one major economy in the world with the highest potential to grow rapidly. In 2016, India is poised to grow at around 7.5 percent and is emerging out of the shadow of its BRICS competitors. In terms of market size, the World Economic Forum’s 2015-16 Global Competitiveness Index ranks India third in the world after China and the United States.
These global trends and the focus of the NDA Government on creating a more investment friendly climate are expanding the opportunities for doing business in India. These opportunities all lie in India’s states, influenced not just by policies emanating from New Delhi but very much conditioned by what is happening in each state. In 2015, NCAER launched a research initiative to measure each state’s investment climate and to track it over time to see how it was changing. This NCAER Report presents the first output of this initiative, the NCAER State Investment Potential Index 2016 (N-SIPI 2016), which uniquely provides a single composite investment rating of how the 29 Indian states and the Union Territory of Delhi are positioned to encourage and attract investment. N-SIPI seeks to bridge the many information gaps surrounding questions of what, how much and where to invest. It provides an entry point in thinking about new investment for domestic and overseas firms and encouraging a more competitive ethos among India’s states. N-SIPI is also a response to the policy initiatives of the Union Government on its Make in India and Start-up India campaigns.
That there is need to systematize such information is more than evident from the distance India still needs to cover in improving its investment climate. While it represents a huge market globally, the 2015-16 Global Competitiveness Index also ranks India 55th overall, 80th on basic requirements such as institutions and infrastructure, and 58th on efficiency enhancers such as goods and labor market efficiency and financial market development.
N-SIPI is an evidence-based index that combines published secondary data on key relevant parameters with an extensive industry survey conducted by NCAER across twenty states and the Union Territory of Delhi. N-SIPI uniquely incorporates a perception-based index that uses qualitative responses to questions covering the current business climate, the availability of land, labor and infrastructure, and other hurdles faced by firms in their state. The survey builds on one of NCAER’s core strengths of conducting large, national surveys that are rigorously designed and scientifically carried out. The results from the industry survey shed interesting light on the pace of business reforms and government policy at the state level, something that we hope will be of immense value to the leadership of India’s states as they move towards improving their investment climate.
This first N-SIPI report also investigates in greater detail three key sectors—automobiles, pharmaceuticals, and retail—that are important drivers of growth and investment at the state level. N-SIPI ranks states on their investment and growth potential in these sectors. Future editions of N-SIPI will focus on different sectors and will aim to provide credible sectoral information to both policy makers and industry.
N-SIPI complements the Government of India’s initiative through its Department of Industrial Policy and Promotion (DIPP) to improve India’s ranking on the Ease of Doing Business Index of the World Bank. This index is much more procedure- and transactions-driven, while N-SIPI focuses on the policy and structural backdrop that determines the business environment in any state. N-SIPI should therefore complement the work of DIPP with the states on their 98-point action plan for business reforms to improve state performance. We are grateful to DIPP Secretary Mr Amitabh Kant for his leadership in our consultations with his Department officers during the course of this work. We also greatly welcome the enthusiasm shown by Mr Kant’s successor, Mr Ramesh Abhishek, in the work at NCAER for N-SIPI, and for Mr Kant’s continuing interest in N-SIPI as the new CEO of the NITI Aayog.
iv NCAER State Investment Potential Index (N-SIPI)
I would like to thank the Foreign Commonwealth Office of the British High Commission, New Delhi, for their generous support for this work. I am also grateful to the entire N-SIPI research team at NCAER led by Dr Indira Iyer and comprising Mythili Bhusnurmath, Dr Poonam Munjal, Dr Pallavi Chaudhuri, Asrar Alam, Amit Sharma, Deepshika, Ishita Gambhir, Kanika Bhatnagar, Nishit Mittal and Shashi Singh. Their excitement in doing this work will, I am sure, be matched by the success of N-SIPI in becoming the first of its kind, go-to state investment index that is transparent, realistic and reliable for investors and policymakers. We hope to roll out the N-SIPI every year in the month of March and we look forward to working hard in the coming year to improve the value of N-SIPI 2017 by next March.
N-SIPI 2016 represents a significant new initiative that NCAER is undertaking as part of its 60th Anniversary Year celebrations. It is aimed at helping fulfil the vision of India’s founding fathers and their dream of building a Union composed of competitive, inclusive, enlightened and opportunity-creating Indian states.
New Delhi Shekhar ShahMarch 2016 Director-General NCAER
vNCAER State Investment Potential Index (N-SIPI)
Acknowledgements
This study was carried out under the guidance of our Research Advisory Committee which comprised of Prof Biswanath Goldar, Institute of Economic Growth; Shri Ashok Jha, former Finance Secretary, Ministry of Finance; Shri Partha Pratim Mitra, Principal Adviser, Ministry of Labour and Employment; Dr K P Krishnan, Additional Secretary, Department of Land Resources, Ministry of Rural Development; and Shri Shailendra Singh, Joint Secretary, Department of Industrial Policy and Promotion. We, at NCAER, wish to extend our sincere gratitude to each of them for their valuable insights and support. Despite their busy schedules, they spared the time to discuss key aspects of the report with the project team and we deeply appreciate their interest and involvement.
This research has also been enriched by the constructive suggestions received from the participants at the Round Table Conference on N-SIPI held on September 15, 2015 at NCAER, New Delhi. We are immensely grateful to all the participants from the central and state governments, the private sector, and academicians for their suggestions at these discussions.
The N-SIPI project is supported by the Foreign and Commonwealth Office, British High Commission, India. We are particularly thankful to Claire Tynte-Irvine, Head Economic and Trade Policy; Aurodeep Nandi, Senior Economic Adviser, and Pallavi Nayek, Programme Manager, Ease of Doing Business, British High Commission for their valuable contributions and partnership.
At NCAER, the work benefitted from important inputs from Dr. Rajesh Chadha, Senior Research Councillor and the overall guidance of Dr. Shekhar Shah, Director General. In conclusion, we would like to thank our entire research team who worked tirelessly throughout the study. Their enthusiasm and energy kept us all motivated till the end. Ms. Shashi Singh deserves special thanks for ably looking after the administrative aspects of the study and making sure that the team was on kept on track.
March 2016 Indira Iyer Mythili Bhusnurmath Poonam Munjal

vi NCAER State Investment Potential Index (N-SIPI)
viiNCAER State Investment Potential Index (N-SIPI)
Project Team Members
Team Leader
Indira Iyer
Research Leads
Mythili Bhusnurmath
Poonam MunjalResearch Team
Pallavi Choudhuri
Asrar Alam
Amit Sharma
Deepshikha
Ishita Gambhir
Kanika Bhatnagar
Nishit Mittal
Shashi Singh
Project Advisory Committee Members
Biswanath Goldar, Professor, Institute of Economic Growth
Ashok Jha, former Finance Secretary, Ministry of Finance
Partha Pratim Mitra, Principal Adviser, Ministry of Labour and Employment
K P Krishnan, Additional Secretary, Ministry of Rural Development
Shailendra Singh, Joint Secretary, Dept. of Industrial Policy and Promotion

viii NCAER State Investment Potential Index (N-SIPI)
ixNCAER State Investment Potential Index (N-SIPI)
Foreword iiiAcknowledgments vAbbreviations xiExecutive Summary xiiiSection 1 Introduction, Methodology 1 and Main Findings1.1 Introduction 11.2 Methodology 21.3 Main Findings 41.4 The Five Pillars of N-SIPI 51.5 Sector Studies 10
Section 2 State Profiles 112.1 N-SIPI 21
Andhra Pradesh 11Assam 15Bihar 19Chhattisgarh 23Delhi 27Gujarat 31Haryana 35Himachal Pradesh 39Jharkhand 43Karnataka 47Kerala 51Madhya Pradesh 55Maharashtra 59Odisha 63Punjab 67Rajasthan 71Tamil Nadu 75Telangana 79Uttar Pradesh 83Uttarakhand 87West Bengal 91
2.2 N-SIPI 30Arunachal Pradesh 95Goa 99Jammu and Kashmir 103Manipur 107Meghalaya 111Mizoram 115Nagaland 119Sikkim 123Tripura 127
Contents
Section 3 Survey Results 131Section 4 Sector Focus Reports 1394.1 Pharmaceutical Industry 1394.2 Automobile Industry 1454.3 Retail Sector 150
Appendix A: Methodology, Data and Indicators 155A.1 Methodology 155A.2 The Five Pillars and Sub-indicators: Details and Data 156A.3 Definition of Sub-indicators and Significance 158
Appendix B: State rankings 164
Appendix C: Survey Results 187
Appendix D: Sector Focus Reports 203D.1 Pharmaceutical Industry 203D.2 Automobile Industry 205D.3 Retail Sector 209

x NCAER State Investment Potential Index (N-SIPI)
xiNCAER State Investment Potential Index (N-SIPI)
Abbreviations
JNPC Jawaharlal Nehru Pharma CityKwH Kilo Watt HourLFPR Labour Force Participation RateLWE Left-wing ExtremismMHA Ministry of Home AffairsMin-Max Minimum-MaximumMOSPI Ministry of Statistics and Programme
ImplementationMPCE Monthly Per Capita ExpenditureMPCM Monthly Per Capita Medical ExpenditureMSME Micro Small and Medium EnterprisesNATRiP National Automotive Testing and R&D
Infrastructure ProjectNCAER National Council of Applied Economic
ResearchNCR National Capital RegionNCRB National Crime Records BureauNEIIPP North-East Industrial and Investment
Promotion PolicyNIC National Industrial ClassificationNIMZ National Investment Manufacturing ZoneNSDC National Skill Development CorporationNSE National Stock Exchange of India Ltd.N-SIPI NCAER State Investment Potential IndexNSS National Sample SurveyNSSO National Sample Survey OfficePM Particulate MatterPPP Purchasing Power ParityPPP Public Private PartnershipPV Passenger VehiclesR&D research and DevelopmentRBI Reserve Bank of IndiaROA Return on AssetsRs RupeesRSBY Rashtriya Swasthya Bima YojnaSEZ Special Economic ZoneSIAM Society of Indian Automobile
ManufacturesSLL Special and Local LawsTI Transparency InternationalTPP Trans-Pacific PartnershipTRIPS Trade-Related Aspects of Intellectual
Property Rights UK United KingdomUS$ United States DollarUSA United States of America USD United States DollarUT Union TerritoryVAT Value Added TaxWGI Worldwide Governance IndicatorWHO World Health OrganizationWTO World Trade OrganizationY-O-Y Year over Year
2W Two-wheelers3W Three-wheelersASDC Automotive Skills Development CouncilASI Annual Survey of IndustriesBDMA Bulk Drug Manufacturers AssociationBPR&D Bureau of Policy Research and
DevelopmentCAGR Compounded Annual Growth RateCES Consumer Expenditure SurveyCGHS Central Government Health SchemeCMIE Centre for Monitoring Indian EconomyCNG Compressed Natural GasCSO Central Statistical OfficeCST Central Sales TaxCV Commercial VehiclesDDA Delhi Development AuthorityDFID The Department for International
Development DIPP Department of Investment Promotion and
PolicyEME Emerging Market EconomyESIS Employees’ State Insurance SchemeESMA Essential Services Maintenance ActEU Employment and UnemploymentFAME Faster Adaptation and Manufacturing of
Hybrid and Electric VehiclesFCO Foreign and Commonwealth OfficeFDI Foreign Direct InvestmentFICCI Federation of Indian Chambers of
Commerce and IndustryFPI Foreign Portfolio InvestmentFY Fiscal yearGCI Global Competitiveness IndexGDP Gross Domestic ProductGMP Good Manufacturing PracticesGOI Government of IndiaGRDI Global Retail Development IndexGSDP Gross State Domestic ProductGST Goods and Services TaxGVA Gross Value AddedHc Hectare HDI Human Development IndexHH HouseholdHS Higher SecondaryICT Information and Communications
TechnologyIMF International Monetary FundIPC Indian Penal CodeIPM Indian Pharmaceutical MarketIPR Intellectual Property RightsITES Information Technology Enabled ServicesITI Industrial Training InstituteJ&K Jammu & Kashmir

xii NCAER State Investment Potential Index (N-SIPI)
xiiiNCAER State Investment Potential Index (N-SIPI)
To say that India lives in her states is a truism in more ways than one. However, over the years that truism has remained largely on paper. In recent years though, there has been a distinct effort to shift gear from the more centralised approach of the past to a decentralised one that recognises states as equal partners.
This change in tack, symbolized, among others, by the makeover of the Planning Commission to the Niti Aayog and the much higher devolution of taxable resources to the States, following the recommendations of the Fourteenth Finance Commission, combined with the government’s ambitious Make in India and Start-up India initiatives has effectively shifted the scene of action to the states.
States are now vying with one other in their effort to make it easier to do business and attract investment. While India is growing as a land of investment opportunities, informational asymmetries quite often drive a wedge between investment decisions and spatial location.
The NCAER’s State Investment Potential Index (N-SIPI) is uniquely poised to address these informational asymmetries by providing a single composite investment score that gives a comprehensive measure of how the 29 states and one Union Territory in this Index are positioned to encourage and attract investment. While N-SIPI does not measure streamlining of regulatory procedures and business reforms, it perfectly complements the recent World Bank/Department of Investment Promotion and Policy (DIPP) ranking of states’ on how well they performed on a 98-point action plan for business reforms. Both these indices are in response to the present government’s focus on increasing investment opportunities at the state level.
N-SIPI is an evidence-based index that is built around five main pillars and 51 sub-indicators identified after several rounds of brain-storming sessions and discussions with industry, academics, central and state government functionaries. The five pillars of N-SIPI include Labour, Infrastructure, Economic Conditions,
Political Stability and Governance, and Perceptions of a good business climate.
A unique component of N-SIPI is the exhaustive Industry Survey conducted across 20 states and 1 union territory (Delhi) on which the fifth pillar based on perception is built. As the industry survey covered only 21 states, this study reports two types of rankings. The first is N-SIPI 21 which is the comprehensive ranking based on all five pillars. It is the Main Index, and hence the Index of choice reported for the 21 states covered by the industry surveys. For the remaining 9 states not covered by industry surveys, this report presents ranking under N-SIPI 30. These are rankings based on only the four fundamental pillars driving investment choices.
In 2016, the N-SIPI 21 ranks Gujarat, Delhi and Tamil Nadu as the top three states for medium-term investment decisions. States that have a significant amount of catching up to do include Bihar, Uttar Pradesh and Jharkhand.
At a more disaggerated level, there is significant variation across states. In N-SIPI 21, Kerala, Tamil Nadu and Karnataka top the list under the Labour Pillar. In the Infrastructure Pillar, Delhi tops followed by Punjab and Gujarat. In the Economic Climate Pillar, while Delhi comes out top again, it is closely followed by Andhra Pradesh and Maharashtra. Gujarat is the top state under the two pillars of Political Stability and Governance as well as Perceptions of a good business climate. Following Gujarat in the Political Stability and Governance Pillar are Tamil Nadu and Madhya Pradesh, while in the Perceptions Pillar it is Rajasthan and Chhattisgarh.
The rankings change in N-SIPI 30 which covers all 29 states and 1 Union Territory but does not include the fifth pillar based on industry perceptions. Gujarat now comes second in the modified Index without perceptions and Delhi moves to the top. States like Tamil Nadu, Goa, Maharashtra, Karnataka and Andhra Pradesh feature more prominently in the game, while Jharkhand, Jammu and Kashmir and Arunachal Pradesh have significant catching up to do.
Executive Summary
xiv NCAER State Investment Potential Index (N-SIPI)
In addition to N-SIPI, which is a broad overall state level Index, NCAER has taken up three sectors for a more detailed study to better capture state-level nuances that could be crucial when it comes to attracting sector-specific investment. To eliminate any subjective bias in the choice of sectors, the automobile sector and the pharmaceutical sector have been selected in this report on the basis of their contribution to the country’s GVA (Gross Value Added). The retail sector has also been included in view of recent relaxations allowed in foreign direct investment (FDI) in multi-brand retail, its large employment potential, and the freedom of states to frame their own policies and vie with each other to attract investment. In terms of profitability in the pharmaceutical industry, Maharashtra, Andhra Pradesh (including Telangana), and Gujarat appear to be the top players followed by Karnataka and Uttarakhand. In terms of the market demand for pharmaceutical products, Kerala, Punjab and Karnataka top the list followed by Jammu and Kashmir and Tamil Nadu.
The dominant states in the automobile sector, on the other hand, are Delhi, Maharashtra, and West Bengal, followed by Haryana and Goa. In the retail sector, Delhi, Goa, and Kerala come out as the top three states with the highest potential for growth, followed closely by Maharashtra and Karnataka.
As the focus of policy reforms slowly but surely shifts to the States of India, NCAER’s evidence-based State Index will be useful to both governments for planning and policy choices and to domestic and foreign investors in their investment decisions. NCAER intends to make this an annual exercise and NCAER’s N-SIPI, along with the World Bank/DIPP’s index on ease of doing business, would provide potential investors, both Indian and foreign, with a go-to Index to guide their investment decisions.
1NCAER State Investment Potential Index (N-SIPI)
1.1 INTRODUCTION
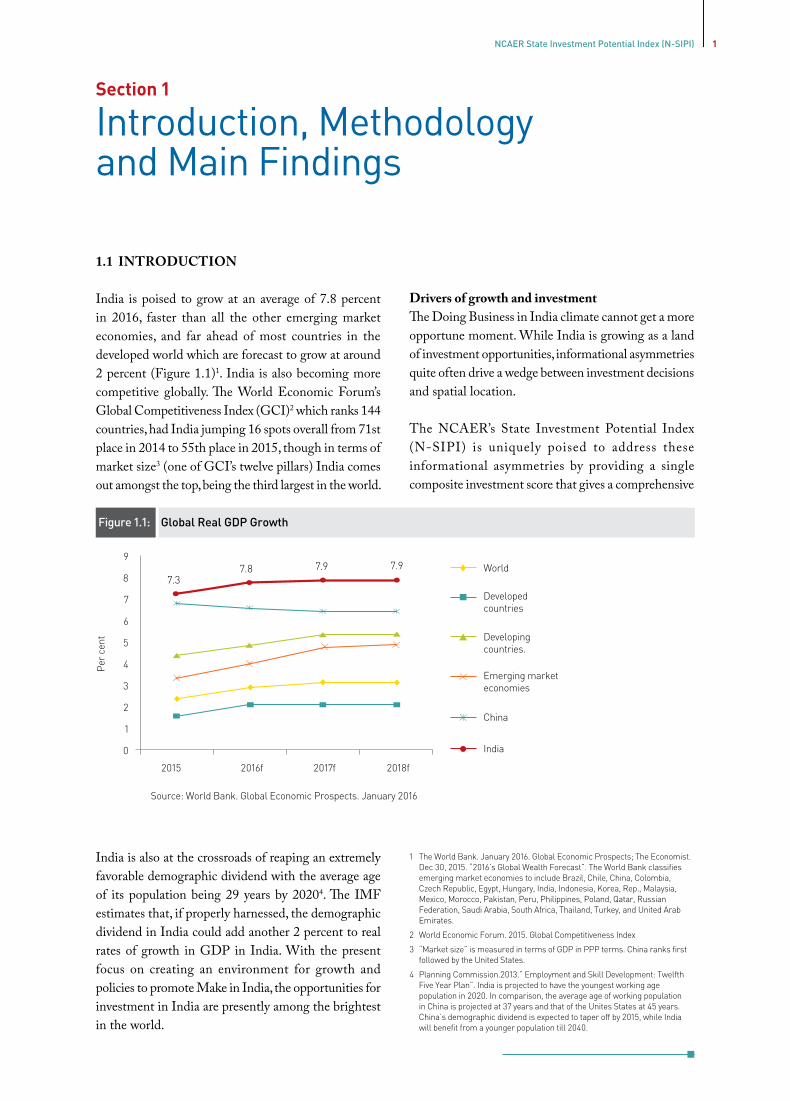
India is poised to grow at an average of 7.8 percent in 2016, faster than all the other emerging market economies, and far ahead of most countries in the developed world which are forecast to grow at around 2 percent (Figure 1.1)1. India is also becoming more competitive globally. The World Economic Forum’s Global Competitiveness Index (GCI)2 which ranks 144 countries, had India jumping 16 spots overall from 71st place in 2014 to 55th place in 2015, though in terms of market size3 (one of GCI’s twelve pillars) India comes out amongst the top, being the third largest in the world.
India is also at the crossroads of reaping an extremely favorable demographic dividend with the average age of its population being 29 years by 20204. The IMF estimates that, if properly harnessed, the demographic dividend in India could add another 2 percent to real rates of growth in GDP in India. With the present focus on creating an environment for growth and policies to promote Make in India, the opportunities for investment in India are presently among the brightest in the world.
Introduction, Methodology and Main Findings
Section 1
Drivers of growth and investmentThe Doing Business in India climate cannot get a more opportune moment. While India is growing as a land of investment opportunities, informational asymmetries quite often drive a wedge between investment decisions and spatial location.
The NCAER’s State Investment Potential Index (N-SIPI) is uniquely poised to address these informational asymmetries by providing a single composite investment score that gives a comprehensive
Figure 1.1: Global Real GDP Growth
Per
cen
t
2015 2016f 2017f 2018f
Emerging marketeconomies
China
India
Source: World Bank. Global Economic Prospects. January 2016
9
8
7
6
5
4
3
2
1
0
7.37.8 7.9 7.9 World
Developedcountries
Developingcountries.
1 The World Bank. January 2016. Global Economic Prospects; The Economist. Dec 30, 2015. “2016’s Global Wealth Forecast”. The World Bank classifies emerging market economies to include Brazil, Chile, China, Colombia, Czech Republic, Egypt, Hungary, India, Indonesia, Korea, Rep., Malaysia, Mexico, Morocco, Pakistan, Peru, Philippines, Poland, Qatar, Russian Federation, Saudi Arabia, South Africa, Thailand, Turkey, and United Arab Emirates.
2 World Economic Forum. 2015. Global Competitiveness Index
3 “Market size” is measured in terms of GDP in PPP terms. China ranks first followed by the United States.
4 Planning Commission.2013.” Employment and Skill Development: Twelfth Five Year Plan”. India is projected to have the youngest working age population in 2020. In comparison, the average age of working population in China is projected at 37 years and that of the Unites States at 45 years. China’s demographic dividend is expected to taper off by 2015, while India will benefit from a younger population till 2040.
2 NCAER State Investment Potential Index (N-SIPI)
measure of how the 29 states and the Union Territory of Delhi in this Index are positioned to encourage and attract investment. N-SIPI assesses the factors creating investment opportunities and driving investment decisions as measured by certain specific parameters. These parameters include a state’s factors of production, its efficiency in the use of these factors of production, the growth prospects in this state and industries’ perception of investment opportunities in that state. N-SIPI is envisaged to be a go-to Index for policy-makers and investors, and is planned to be rolled out every year in the month of March.
A unique component of N-SIPI is that it merges a perception based index (constructed using surveys) with fundamentals driving investment decisions. The data on perceptions has been used in the construction of N-SIPI as perceptions matter in an agency’s choice of location. Using an extensive survey spanning 21 states, existing firms and companies were asked to rate the difficulties they had faced with respect to obtaining land, labor and access to infrastructure in addition to their perceptions of future business opportunities in their state – all of which are critical apriori information for making investment decisions.
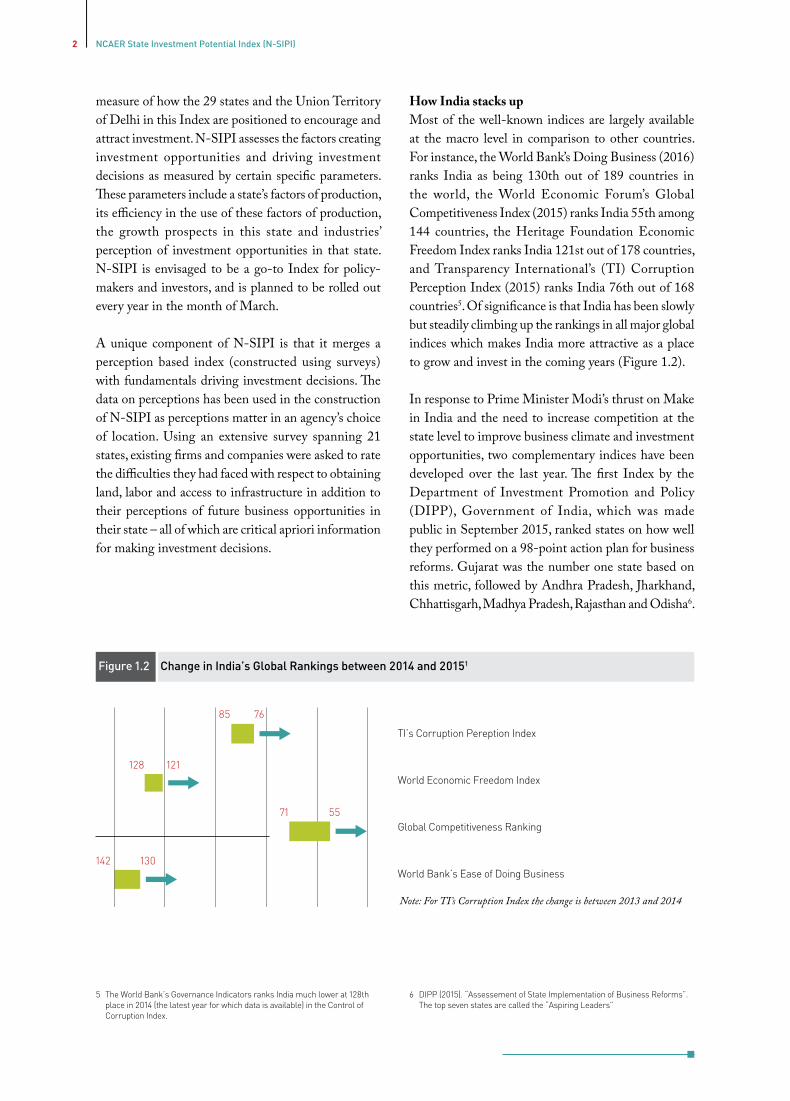
Figure 1.2 Change in India’s Global Rankings between 2014 and 20151
142 130
128 121
85 76
71 55
140 120 100 80 60 40
TI’s Corruption Pereption Index
World Economic Freedom Index
Global Competitiveness Ranking
World Bank’s Ease of Doing Business
Note: For TI’s Corruption Index, thechange is between 2013 and 2014
5 The World Bank’s Governance Indicators ranks India much lower at 128th place in 2014 (the latest year for which data is available) in the Control of Corruption Index.
How India stacks upMost of the well-known indices are largely available at the macro level in comparison to other countries. For instance, the World Bank’s Doing Business (2016) ranks India as being 130th out of 189 countries in the world, the World Economic Forum’s Global Competitiveness Index (2015) ranks India 55th among 144 countries, the Heritage Foundation Economic Freedom Index ranks India 121st out of 178 countries, and Transparency International’s (TI) Corruption Perception Index (2015) ranks India 76th out of 168 countries5. Of significance is that India has been slowly but steadily climbing up the rankings in all major global indices which makes India more attractive as a place to grow and invest in the coming years (Figure 1.2).
In response to Prime Minister Modi’s thrust on Make in India and the need to increase competition at the state level to improve business climate and investment opportunities, two complementary indices have been developed over the last year. The first Index by the Department of Investment Promotion and Policy (DIPP), Government of India, which was made public in September 2015, ranked states on how well they performed on a 98-point action plan for business reforms. Gujarat was the number one state based on this metric, followed by Andhra Pradesh, Jharkhand, Chhattisgarh, Madhya Pradesh, Rajasthan and Odisha6.
Note: For TI’s Corruption Index the change is between 2013 and 2014
6 DIPP (2015). “Assessement of State Implementation of Business Reforms”. The top seven states are called the “Aspiring Leaders”
3NCAER State Investment Potential Index (N-SIPI)
The second Index, NCAER’s SIPI, does not measure regulatory procedures and business reforms, but rather it assesses States’ potential for investment, business, and job creation in industry and services in general, as measured by their policy intent and frameworks, availability of land and labour, in addition to the ground-level realities of infrastructure, rule of law, and economic and political climate.
Like the DIPP Index, Gujarat tops the list followed by Delhi and Tamil Nadu. This is no surprise. However, if the N-SIPI pillar based on perceptions is dropped from the Index, the rankings change with some states like Kerala, West Bengal and Punjab moving up the rankings and others like Andhra Pradesh, Chhattisgarh and Madhya Pradesh moving down the rankings. By providing a highly credible, evidence-based yardstick to address information gaps, N-SIPI complements the present focus of the government on business reforms and policies to promote the Make in India and Start-up India campaigns. N-SIPI can be especially helpful in balancing risks and rewards in making locational choice for domestic and FDI investments.
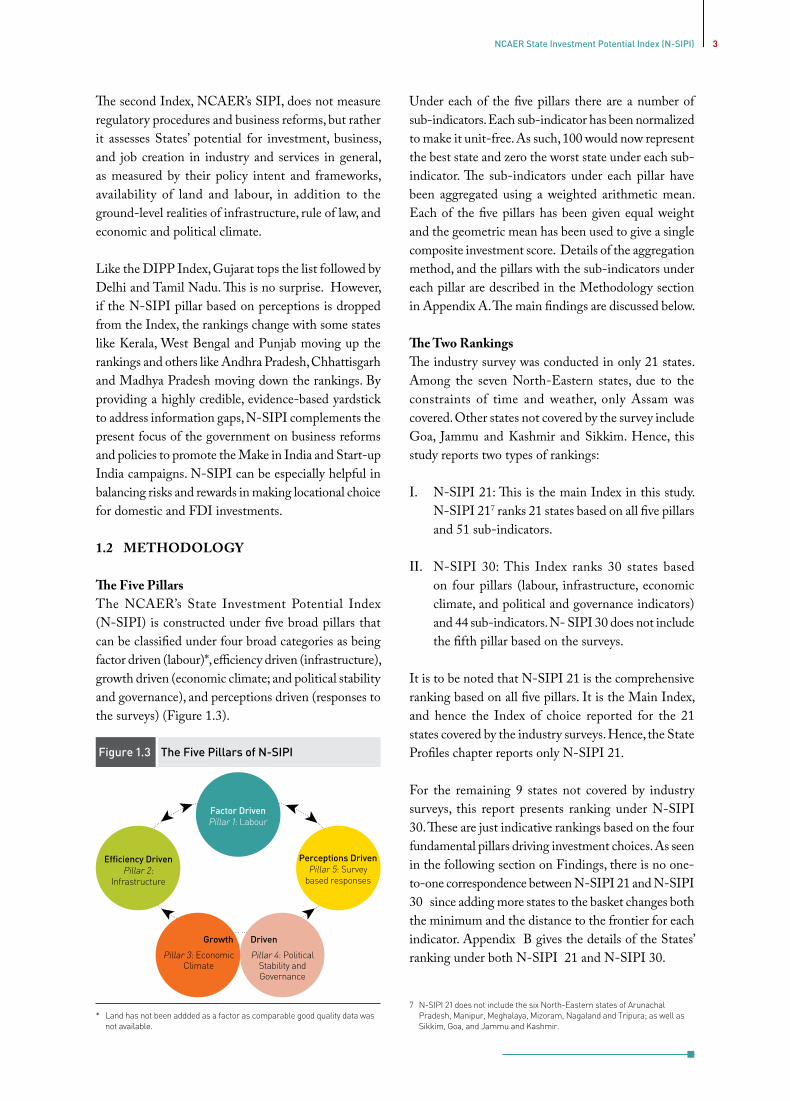
1.2 METHODOLOGY
The Five PillarsThe NCAER’s State Investment Potential Index (N-SIPI) is constructed under five broad pillars that can be classified under four broad categories as being factor driven (labour)*, efficiency driven (infrastructure), growth driven (economic climate; and political stability and governance), and perceptions driven (responses to the surveys) (Figure 1.3).
Figure 1.3 The Five Pillars of N-SIPI
Factor DrivenPillar 1: Labour
Perceptions DrivenPillar 5: Survey
based responses
Efficiency DrivenPillar 2:
Infrastructure
Under each of the five pillars there are a number of sub-indicators. Each sub-indicator has been normalized to make it unit-free. As such, 100 would now represent the best state and zero the worst state under each sub-indicator. The sub-indicators under each pillar have been aggregated using a weighted arithmetic mean. Each of the five pillars has been given equal weight and the geometric mean has been used to give a single composite investment score. Details of the aggregation method, and the pillars with the sub-indicators under each pillar are described in the Methodology section in Appendix A. The main findings are discussed below.
The Two RankingsThe industry survey was conducted in only 21 states. Among the seven North-Eastern states, due to the constraints of time and weather, only Assam was covered. Other states not covered by the survey include Goa, Jammu and Kashmir and Sikkim. Hence, this study reports two types of rankings:
I. N-SIPI 21: This is the main Index in this study. N-SIPI 217 ranks 21 states based on all five pillars and 51 sub-indicators.
II. N-SIPI 30: This Index ranks 30 states based on four pillars (labour, infrastructure, economic climate, and political and governance indicators) and 44 sub-indicators. N- SIPI 30 does not include the fifth pillar based on the surveys.
It is to be noted that N-SIPI 21 is the comprehensive ranking based on all five pillars. It is the Main Index, and hence the Index of choice reported for the 21 states covered by the industry surveys. Hence, the State Profiles chapter reports only N-SIPI 21.
For the remaining 9 states not covered by industry surveys, this report presents ranking under N-SIPI 30. These are just indicative rankings based on the four fundamental pillars driving investment choices. As seen in the following section on Findings, there is no one-to-one correspondence between N-SIPI 21 and N-SIPI 30 since adding more states to the basket changes both the minimum and the distance to the frontier for each indicator. Appendix B gives the details of the States’ ranking under both N-SIPI 21 and N-SIPI 30.
7 N-SIPI 21 does not include the six North-Eastern states of Arunachal Pradesh, Manipur, Meghalaya, Mizoram, Nagaland and Tripura; as well as Sikkim, Goa, and Jammu and Kashmir.
* Land has not been addded as a factor as comparable good quality data was not available.
Growth Driven
Pillar 4: Political Stability and Governance
Pillar 3: Economic Climate
4 NCAER State Investment Potential Index (N-SIPI)
1.3 FINDINGS
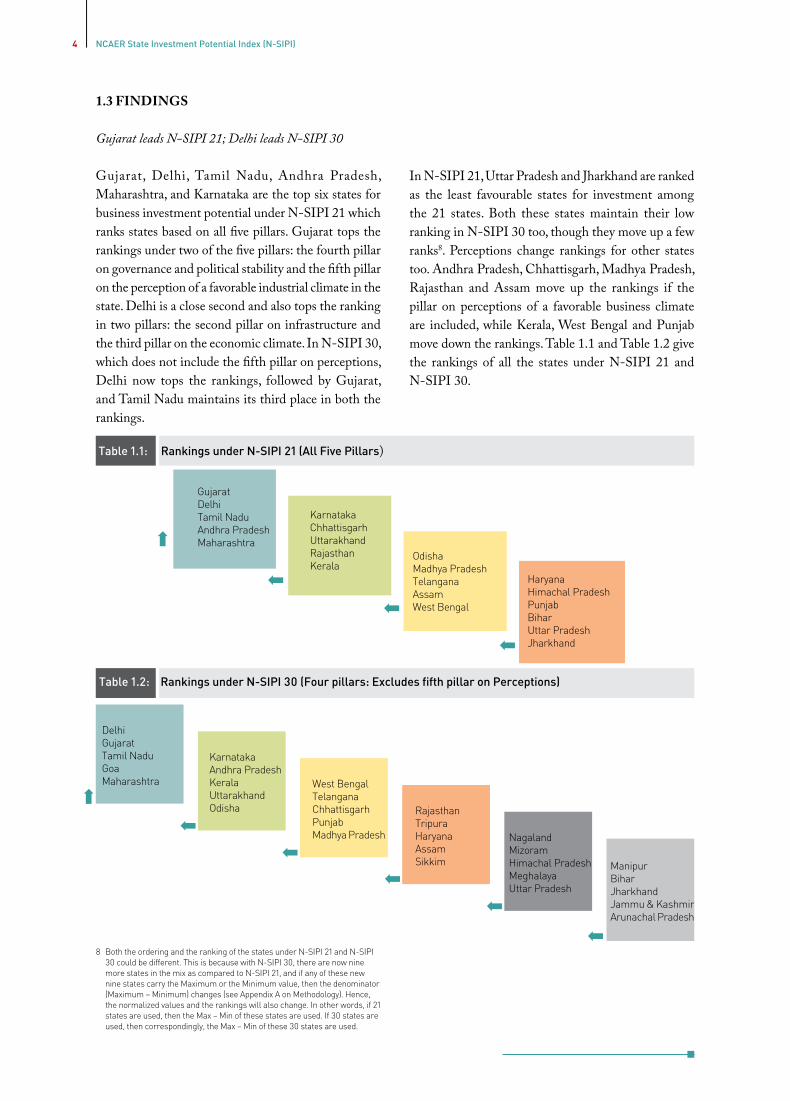
Gujarat leads N-SIPI 21; Delhi leads N-SIPI 30
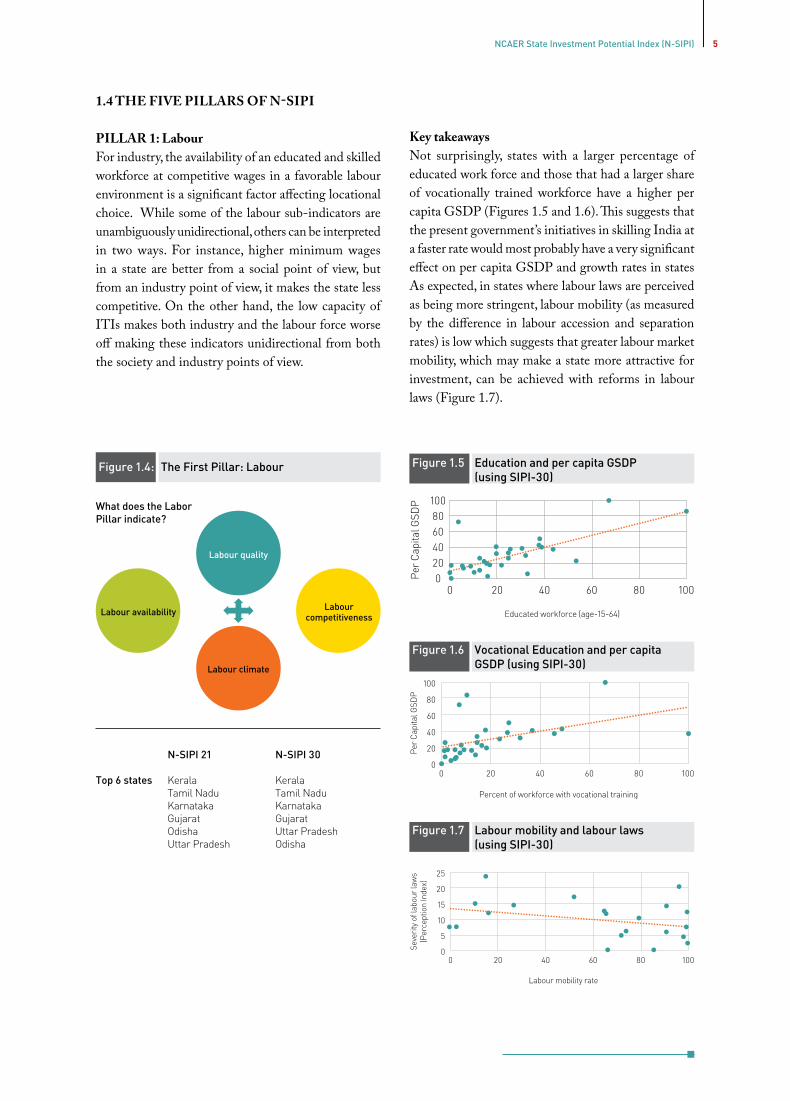
Gujarat, Delhi, Tamil Nadu, Andhra Pradesh, Maharashtra, and Karnataka are the top six states for business investment potential under N-SIPI 21 which ranks states based on all five pillars. Gujarat tops the rankings under two of the five pillars: the fourth pillar on governance and political stability and the fifth pillar on the perception of a favorable industrial climate in the state. Delhi is a close second and also tops the ranking in two pillars: the second pillar on infrastructure and the third pillar on the economic climate. In N-SIPI 30, which does not include the fifth pillar on perceptions, Delhi now tops the rankings, followed by Gujarat, and Tamil Nadu maintains its third place in both the rankings.
8 Both the ordering and the ranking of the states under N-SIPI 21 and N-SIPI 30 could be different. This is because with N-SIPI 30, there are now nine more states in the mix as compared to N-SIPI 21, and if any of these new nine states carry the Maximum or the Minimum value, then the denominator (Maximum – Minimum) changes (see Appendix A on Methodology). Hence, the normalized values and the rankings will also change. In other words, if 21 states are used, then the Max – Min of these states are used. If 30 states are used, then correspondingly, the Max – Min of these 30 states are used.
Table 1.2: Rankings under N-SIPI 30 (Four pillars: Excludes fifth pillar on Perceptions)
ManipurBiharJharkhandJammu & KashmirArunachal Pradesh
KarnatakaAndhra PradeshKeralaUttarakhandOdisha
West BengalTelanganaChhattisgarhPunjabMadhya Pradesh
RajasthanTripuraHaryanaAssamSikkim
NagalandMizoramHimachal PradeshMeghalayaUttar Pradesh
DelhiGujaratTamil NaduGoaMaharashtra
In N-SIPI 21, Uttar Pradesh and Jharkhand are ranked as the least favourable states for investment among the 21 states. Both these states maintain their low ranking in N-SIPI 30 too, though they move up a few ranks8. Perceptions change rankings for other states too. Andhra Pradesh, Chhattisgarh, Madhya Pradesh, Rajasthan and Assam move up the rankings if the pillar on perceptions of a favorable business climate are included, while Kerala, West Bengal and Punjab move down the rankings. Table 1.1 and Table 1.2 give the rankings of all the states under N-SIPI 21 and N-SIPI 30.
Table 1.1: Rankings under N-SIPI 21 (All Five Pillars)
HaryanaHimachal PradeshPunjabBiharUttar PradeshJharkhand
OdishaMadhya PradeshTelanganaAssamWest Bengal
KarnatakaChhattisgarhUttarakhandRajasthanKerala
Gujarat DelhiTamil NaduAndhra PradeshMaharashtra
5NCAER State Investment Potential Index (N-SIPI)
Key takeawaysNot surprisingly, states with a larger percentage of educated work force and those that had a larger share of vocationally trained workforce have a higher per capita GSDP (Figures 1.5 and 1.6). This suggests that the present government’s initiatives in skilling India at a faster rate would most probably have a very significant effect on per capita GSDP and growth rates in states As expected, in states where labour laws are perceived as being more stringent, labour mobility (as measured by the difference in labour accession and separation rates) is low which suggests that greater labour market mobility, which may make a state more attractive for investment, can be achieved with reforms in labour laws (Figure 1.7).
What does the Labor Pillar indicate?
Labour quality
Labour climate
Labour availability Labour competitiveness
N-SIPI 21 N-SIPI 30
Top 6 states Kerala Kerala Tamil Nadu Tamil Nadu Karnataka Karnataka Gujarat Gujarat Odisha Uttar Pradesh Uttar Pradesh Odisha
Per
Cap
ital G
SDP
Educated workforce (age-15-64)
100806040200
0 20 40 60 80 100
Figure 1.6 Vocational Education and per capita GSDP (using SIPI-30)
100
80
60
40
20
00 20 40 60 80 100
Per
Cap
ital G
SDP
Percent of workforce with vocational training
Figure 1.5 Education and per capita GSDP (using SIPI-30)
Figure 1.7 Labour mobility and labour laws (using SIPI-30)
Labour mobility rate
25
20
15
10
5
00 20 40 60 80 100
Seve
rity
of la
bour
law
s(P
erce
ptio
n In
dex)
1.4 THE FIVE PILLARS OF N-SIPI
PILLAR 1: Labour For industry, the availability of an educated and skilled workforce at competitive wages in a favorable labour environment is a significant factor affecting locational choice. While some of the labour sub-indicators are unambiguously unidirectional, others can be interpreted in two ways. For instance, higher minimum wages in a state are better from a social point of view, but from an industry point of view, it makes the state less competitive. On the other hand, the low capacity of ITIs makes both industry and the labour force worse off making these indicators unidirectional from both the society and industry points of view.
Figure 1.4: The First Pillar: Labour
6 NCAER State Investment Potential Index (N-SIPI)
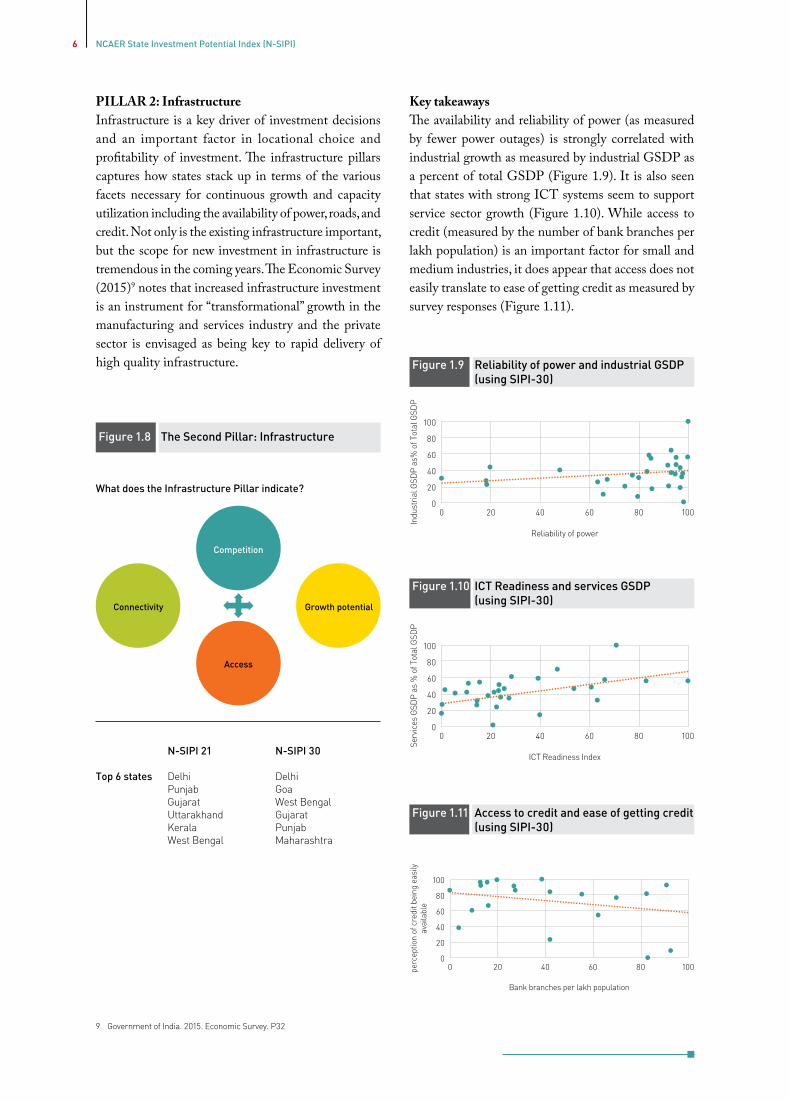
Key takeawaysThe availability and reliability of power (as measured by fewer power outages) is strongly correlated with industrial growth as measured by industrial GSDP as a percent of total GSDP (Figure 1.9). It is also seen that states with strong ICT systems seem to support service sector growth (Figure 1.10). While access to credit (measured by the number of bank branches per lakh population) is an important factor for small and medium industries, it does appear that access does not easily translate to ease of getting credit as measured by survey responses (Figure 1.11).
Figure 1.11 Access to credit and ease of getting credit (using SIPI-30)
Figure 1.10 ICT Readiness and services GSDP (using SIPI-30)
PILLAR 2: InfrastructureInfrastructure is a key driver of investment decisions and an important factor in locational choice and profitability of investment. The infrastructure pillars captures how states stack up in terms of the various facets necessary for continuous growth and capacity utilization including the availability of power, roads, and credit. Not only is the existing infrastructure important, but the scope for new investment in infrastructure is tremendous in the coming years. The Economic Survey (2015)9 notes that increased infrastructure investment is an instrument for “transformational” growth in the manufacturing and services industry and the private sector is envisaged as being key to rapid delivery of high quality infrastructure.
Figure 1.8 The Second Pillar: Infrastructure
What does the Infrastructure Pillar indicate?
Competition
Access
Connectivity Growth potential
N-SIPI 21 N-SIPI 30
Top 6 states Delhi Delhi Punjab Goa Gujarat West Bengal Uttarakhand Gujarat Kerala Punjab West Bengal Maharashtra
Figure 1.9 Reliability of power and industrial GSDP (using SIPI-30)
100
80
60
40
20
00 20 40 60 80 100
Indu
stria
l GSD
P a
s% o
f Tot
al G
SDP
Reliability of power
100
80
60
40
20
00 20 40 60 80 100
Serv
ices
GSD
P a
s %
of T
otal
GSD
P
ICT Readiness Index
100
80
60
40
20
00 20 40 60 80 100pe
rcep
tion
of c
redi
t bei
ng e
asily
avai
labl
e
Bank branches per lakh population
9 Government of India. 2015. Economic Survey. P32
7NCAER State Investment Potential Index (N-SIPI)
10 World Development Report, World bank. 2009. Reshaping Economic Geography.
11 World Bank and Department of Industrial Policy and Promotion. September 2015. “Assessment of State Implementation of Business Reforms”.
What does the Economic Pillar indicate?
Microeconomic fundamentals
Market Demand
Resourceendowments Government
N-SIPI 21 N-SIPI 30
Top 6 states Delhi Delhi Andhra Pradesh Goa Maharashtra Andhra Pradesh Gujarat Maharashtra Telangana Gujarat Tamil Nadu Telangana
Figure 1.13 Urban Bias and per capita GSDP (using SIPI-30)
Figure 1.14 VAT Productivity and Ease of Doing Business (using SIPI-30)
Figure 1.15 Favourable Industrial Policies and Developmental Expenditure (using SIPI-30)
100
50
00 20 40 60 80 100
Pop
ulat
ion
in M
illio
n P
lus
Citi
es a
s%
of T
otal
Per capita GSDP
100
80
60
40
20
00 20 40 60 80 100
Wor
ld B
ank/
DIP
P D
oing
Bus
ines
sSc
ore
VAT Produtivity
100
80
60
40
20
00 20 40 60 80 100
Dev
elop
men
t exp
endi
ture
as
% o
fto
tal e
xpen
ditu
re
Perception of Favourable Industrial Policies
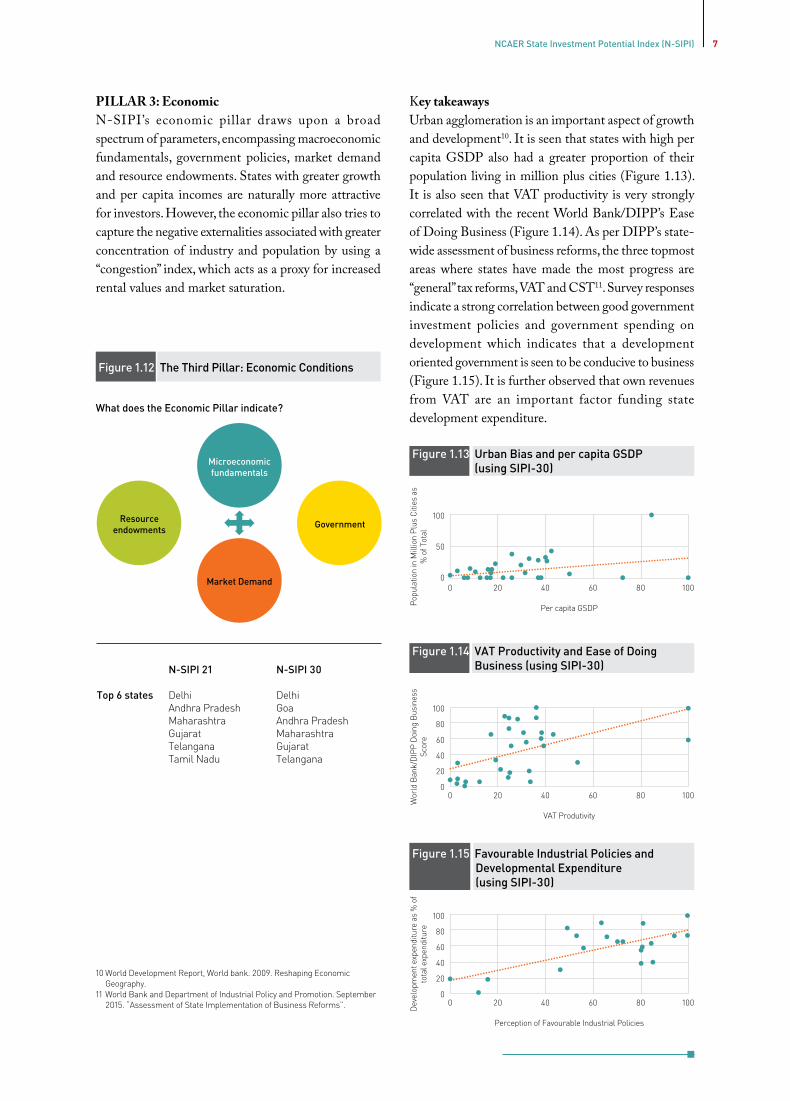
Key takeawaysUrban agglomeration is an important aspect of growth and development10. It is seen that states with high per capita GSDP also had a greater proportion of their population living in million plus cities (Figure 1.13). It is also seen that VAT productivity is very strongly correlated with the recent World Bank/DIPP’s Ease of Doing Business (Figure 1.14). As per DIPP’s state-wide assessment of business reforms, the three topmost areas where states have made the most progress are “general” tax reforms, VAT and CST11. Survey responses indicate a strong correlation between good government investment policies and government spending on development which indicates that a development oriented government is seen to be conducive to business (Figure 1.15). It is further observed that own revenues from VAT are an important factor funding state development expenditure.
PILLAR 3: EconomicN-SIPI’s economic pillar draws upon a broad spectrum of parameters, encompassing macroeconomic fundamentals, government policies, market demand and resource endowments. States with greater growth and per capita incomes are naturally more attractive for investors. However, the economic pillar also tries to capture the negative externalities associated with greater concentration of industry and population by using a “congestion” index, which acts as a proxy for increased rental values and market saturation.
Figure 1.12 The Third Pillar: Economic Conditions
8 NCAER State Investment Potential Index (N-SIPI)
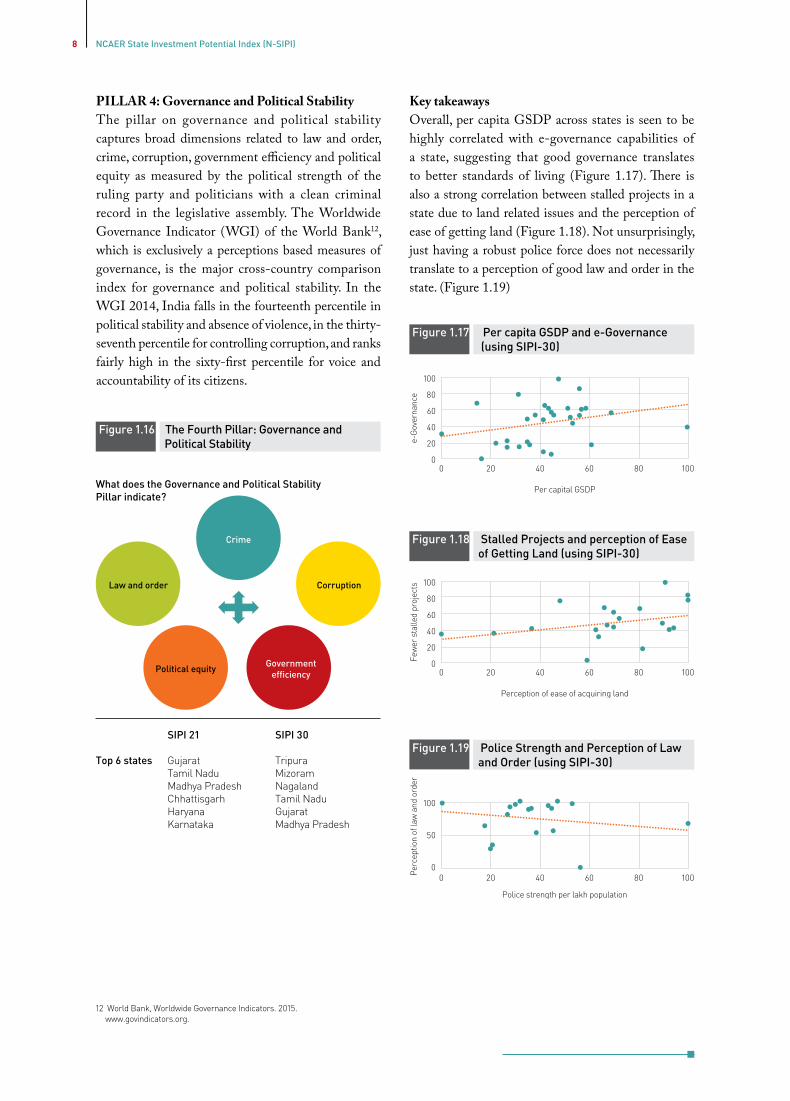
Key takeawaysOverall, per capita GSDP across states is seen to be highly correlated with e-governance capabilities of a state, suggesting that good governance translates to better standards of living (Figure 1.17). There is also a strong correlation between stalled projects in a state due to land related issues and the perception of ease of getting land (Figure 1.18). Not unsurprisingly, just having a robust police force does not necessarily translate to a perception of good law and order in the state. (Figure 1.19)
What does the Governance and Political Stability Pillar indicate?
Figure 1.17 Per capita GSDP and e-Governance (using SIPI-30)
100
80
60
40
20
00 20 40 60 80 100
e-G
over
nanc
e
Per capital GSDP
Figure 1.18 Stalled Projects and perception of Ease of Getting Land (using SIPI-30)
100
80
60
40
20
00 20 40 60 80 100
Few
er s
talle
d pr
ojec
ts
Perception of ease of acquiring land
Figure 1.19 Police Strength and Perception of Law and Order (using SIPI-30)
Per
cept
ion
of la
w a
nd o
rder
100
50
00 20 40 60 80 100
Police strength per lakh population
12 World Bank, Worldwide Governance Indicators. 2015. www.govindicators.org.
Crime
Political equity
Law and order Corruption
SIPI 21 SIPI 30
Top 6 states Gujarat Tripura Tamil Nadu Mizoram Madhya Pradesh Nagaland Chhattisgarh Tamil Nadu Haryana Gujarat Karnataka Madhya Pradesh
Government efficiency
PILLAR 4: Governance and Political StabilityThe pillar on governance and political stability captures broad dimensions related to law and order, crime, corruption, government efficiency and political equity as measured by the political strength of the ruling party and politicians with a clean criminal record in the legislative assembly. The Worldwide Governance Indicator (WGI) of the World Bank12, which is exclusively a perceptions based measures of governance, is the major cross-country comparison index for governance and political stability. In the WGI 2014, India falls in the fourteenth percentile in political stability and absence of violence, in the thirty-seventh percentile for controlling corruption, and ranks fairly high in the sixty-first percentile for voice and accountability of its citizens.
Figure 1.16 The Fourth Pillar: Governance and Political Stability
9NCAER State Investment Potential Index (N-SIPI)
What does the Perceptions Pillar indicate?
SIPI 21
Top 6 states Gujarat Rajasthan Chhattisgarh Uttarakhand Andhra Pradesh Madhya Pradesh
Land related issues
Political stability and governance related issues
Labour related issues
Infrastructure related issues
Business expectations
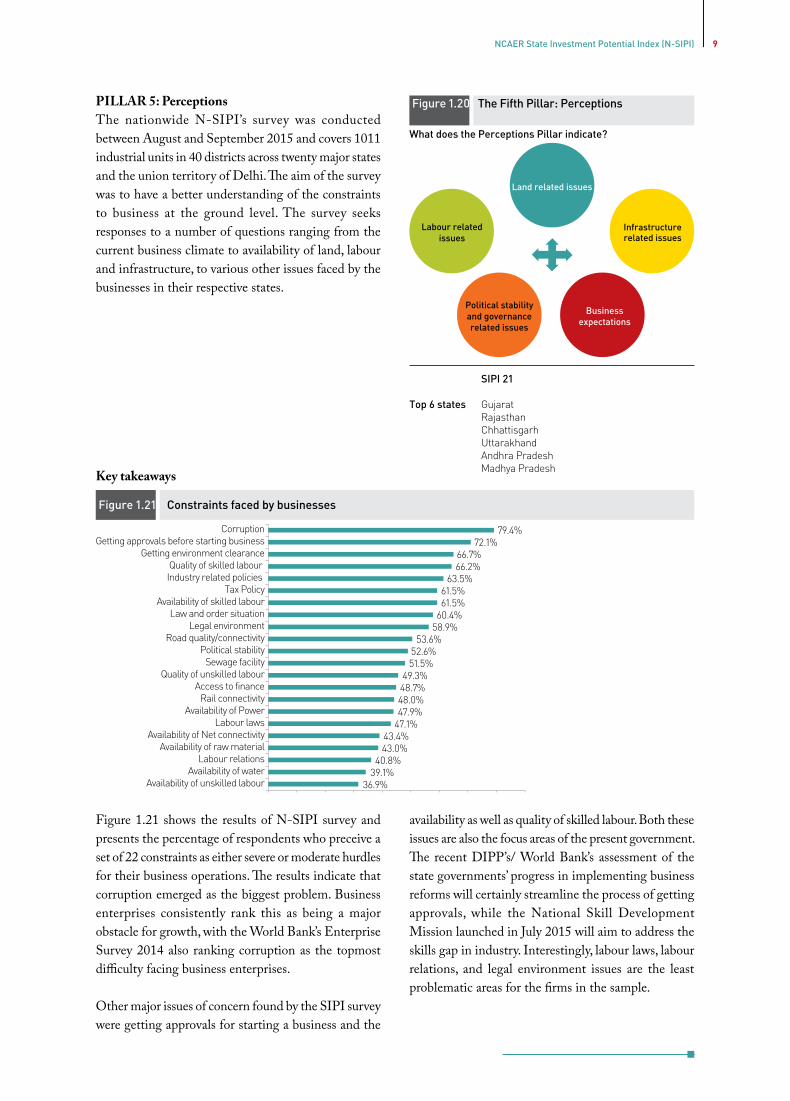
PILLAR 5: PerceptionsThe nationwide N-SIPI’s survey was conducted between August and September 2015 and covers 1011 industrial units in 40 districts across twenty major states and the union territory of Delhi. The aim of the survey was to have a better understanding of the constraints to business at the ground level. The survey seeks responses to a number of questions ranging from the current business climate to availability of land, labour and infrastructure, to various other issues faced by the businesses in their respective states.
CorruptionGetting approvals before starting business
Getting environment clearanceQuality of skilled labour Industry related policies
Tax PolicyAvailability of skilled labour
Law and order situationLegal environment
Road quality/connectivityPolitical stability
Sewage facilityQuality of unskilled labour
Access to financeRail connectivity
Availability of PowerLabour laws
Availability of Net connectivityAvailability of raw material
Labour relationsAvailability of water
Availability of unskilled labour
79.4%72.1%
66.7%66.2%
63.5%61.5%61.5%
60.4%58.9%
53.6%52.6%51.5%
49.3%48.7%48.0%47.9%
47.1%43.4%43.0%
40.8%39.1%
36.9%
Figure 1.20 The Fifth Pillar: Perceptions
Key takeaways
Figure 1.21 Constraints faced by businesses
Figure 1.21 shows the results of N-SIPI survey and presents the percentage of respondents who preceive a set of 22 constraints as either severe or moderate hurdles for their business operations. The results indicate that corruption emerged as the biggest problem. Business enterprises consistently rank this as being a major obstacle for growth, with the World Bank’s Enterprise Survey 2014 also ranking corruption as the topmost difficulty facing business enterprises.
Other major issues of concern found by the SIPI survey were getting approvals for starting a business and the
availability as well as quality of skilled labour. Both these issues are also the focus areas of the present government. The recent DIPP’s/ World Bank’s assessment of the state governments’ progress in implementing business reforms will certainly streamline the process of getting approvals, while the National Skill Development Mission launched in July 2015 will aim to address the skills gap in industry. Interestingly, labour laws, labour relations, and legal environment issues are the least problematic areas for the firms in the sample.
10 NCAER State Investment Potential Index (N-SIPI)
1.5 SECTOR STUDIES
The main aim of the NCAER’s SIPI is to assess States’ potential for investment and business as measured by the importance of certain specific parameters driving investment decisions. These parameters - labour, infrastructure, macroeconomic fundamentals, policy orientation, governance, political stability, and perceptions – though undeniably important, give a broad picture of overall capabilities and potential of a state but may be unable to capture state-level nuances that could be crucial when it comes to attracting investment in specific sectors.
To fully understand not only the drivers of investment but also what works and what doesn’t and why, the NCAER Project Team has taken up a few specific sectors for a more detailed study. The purpose of the study is to identify what is the current position in the identified sectors and to examine the potential of these sectors.
Auto, Pharma and Retail on top In order to eliminate any subjective bias in the choice of sectors, the sectors have been selected on the basis of their contribution to the country’s registered manufacturing GVA (Gross Value Added). Data sourced from the 2011 Annual Survey of Industries show that (at the three-digit level) the auto industry13 is the second largest contributor to India’s GVA,
13 The auto industry includes the manufacture of motor vehicles (291), manufacture of motor vehicle bodies (292) and manufacture of motor parts and accessories (293),
14 The largest contributor to GVA, refined petrol products (192), which accounts for 11.70% of GVA and 25% of profits, has not been selected for in-depth study given the lumpiness of investments in this sector and keeping in mind the underlying rationale of constructing such an index of state readiness for investment and growth).
15 The Economist. Dec 29, 2015. “How will the global industry fare in 2016?”. http://www.economist.com/blogs/graphicdetail/2015/12/daily-chart-3
contributing almost 7% to India’s GVA and accounting for 8% of total profits. Pharmaceuticals are the third largest contributor, contributing 6% of the GVA and an even higher percentage of total profits (8%). Hence both these industries have been taken up for study at greater depth14. In fact, for both these sectors, not only is the domestic market large and growing, but the scope for exports is tremendous. A recent Economist article predicts that the global healthcare spending and automobile purchases in 2016 will be the fastest growing in the world with consumer spending in these two sectors in Asia and Australia alone growing at close to 8 percent per annum15. Apart from these two sectors, the retail sector has also been singled out for more detailed study in view of the recent relaxations allowed in foreign direct investment (FDI) in multi-brand retail. Also, this is a sector where states have been given considerable freedom to frame their own policies. Given the huge employment potential of organized retail, we believe this is a sector where states will vie keenly with each other to attract investment.
States vary in their potential for specific investments
Based on a comprehensive analysis of these sectors, the following states emerge as the top guns (Table 1.3). Details of these studies and the methodology in given in Section 4 of this report.
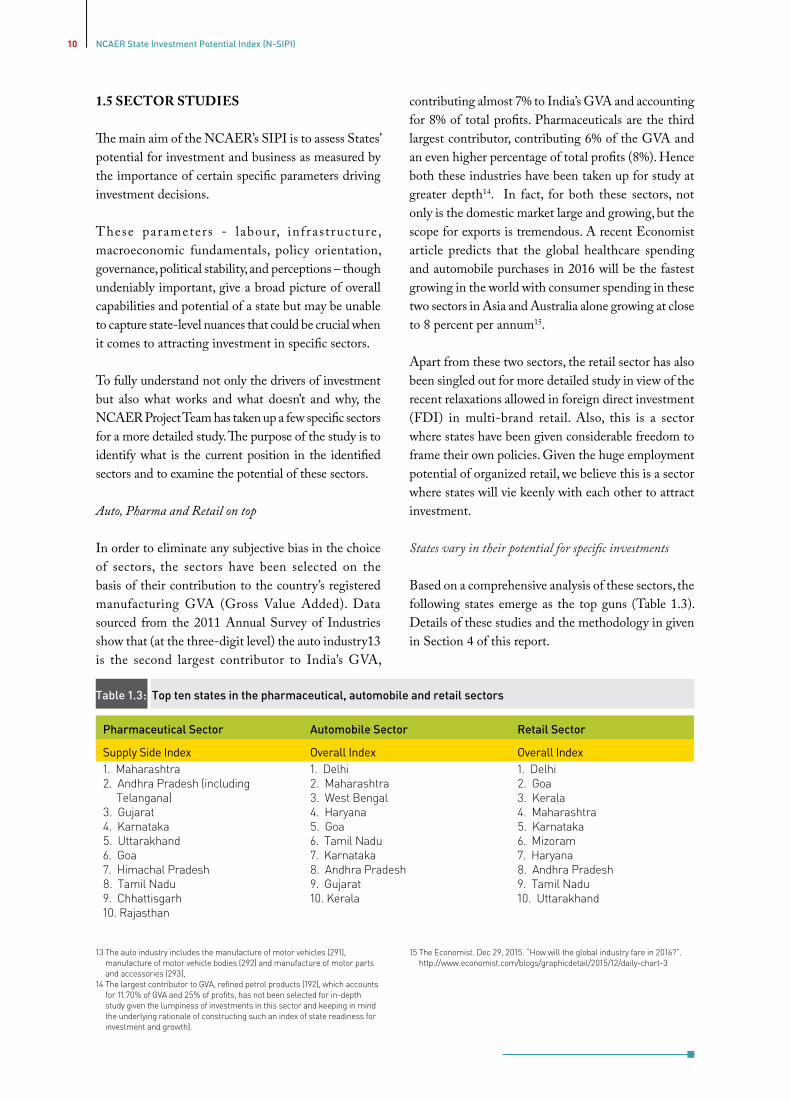
Table 1.3: Top ten states in the pharmaceutical, automobile and retail sectors
Pharmaceutical Sector Automobile Sector Retail Sector
Supply Side Index Overall Index Overall Index1. Maharashtra2. Andhra Pradesh (including Telangana)3. Gujarat4. Karnataka5. Uttarakhand6. Goa7. Himachal Pradesh8. Tamil Nadu9. Chhattisgarh10. Rajasthan
1. Delhi2. Maharashtra3. West Bengal4. Haryana5. Goa6. Tamil Nadu7. Karnataka8. Andhra Pradesh9. Gujarat10. Kerala
1. Delhi2. Goa3. Kerala4. Maharashtra5. Karnataka6. Mizoram7. Haryana8. Andhra Pradesh9. Tamil Nadu10. Uttarakhand