Profile of GMAT Testing: Residence - gmac.com/media/Files/gmac/Research/... · The GMAT exam is an...
32
Profile of GMAT ® Testing 2017 Profile of GMAT ® Testing: Residence Five-Year Summary, TY2013 - TY2017 November 2017 Globally, more than 1.2 million Graduate Management Admission Test ® (GMAT ® ) exams have been taken over the past five years by individuals interested in pursuing graduate management education. The GMAT exam is an important part of the admissions process for more than 6,900 graduate management programs worldwide. A total of 250,884 GMAT exams were taken by prospective business school students around the world in testing year 2017 (TY2017), which ran from July 1, 2016 through June 30, 2017. These examinees sent a total of 517,774 score reports to graduate—level management programs across the globe. This report summarizes five-year global GMAT testing trends for: • GMAT exams taken by residence, • GMAT exams taken by gender, • Mean age of GMAT examinees, • Mean GMAT Total Score, and • GMAT score-sending breakdowns by program type (MBA, business master’s, and doctoral/other), for TY 2017. Mean GMAT Total Scores and mean age of examinees are provided for groups with five or more exams taken and 10 or more score reports sent. What Can I Do With the Data? Use the data to build candidate profiles for specific country and regional groups. For example, using the tables you can determine the following about Zimbabwean residents who sat for the GMAT exam in TY2017: • Zimbabwean residents sat for 80 GMAT exams. • The mean age of Zimbabwean test takers was 29.3 and the mean GMAT Total Score was 473. • Of the 200 GMAT score reports sent by Zimbabwean residents, 19 percent were directed to business master’s programs. • Men in Zimbabwe 73% of scores sent) were equally as likely as women in Zimbabwe (70%) to send scores to MBA programs. • Zimbabwean residents represent 3 percent of GMAT test taking by African residents and 0.03 percent of global testing. Make this report your starting point to target your search of potential students and enhance your recruitment efforts. For example, you can purchase names of prospective students using the Graduate Management Admission Search Service ® (GMASS ® ) database or develop profiles of candidates based on data in the mba.com Prospective Students Survey Interactive Report. About This Report This Data Brief summarizes five years of data for GMAT exams taken and score reports sent worldwide, filtered by residence at time of GMAT registration. Review GMAT exam and score reporting trends by: • Region of Residence • Country/Territory of Residence About GMAT Examinees Data in the tables reflect the total number of GMAT exams that generated valid Total Scores during a given testing year. Test takers who took the exam more than once during the year are included in the aggregate data. For example, an individual who took the GMAT exam twice in TY2017 would represent a total of two exams taken during that year.
-
Upload
phungthuan -
Category
Documents
-
view
224 -
download
2
Transcript of Profile of GMAT Testing: Residence - gmac.com/media/Files/gmac/Research/... · The GMAT exam is an...

Profile of GMAT® Testing 2017
Profile of GMAT® Testing: Residence
Five-Year Summary, TY2013 - TY2017 November 2017
Globally, more than 1.2 million Graduate Management Admission Test® (GMAT®) exams have been taken over the past five years by individuals interested in pursuing graduate management education. The GMAT exam is an important part of the admissions process for more than 6,900 graduate management programs worldwide. A total of 250,884 GMAT exams were taken by prospective business school students around the world in testing year 2017 (TY2017), which ran from July 1, 2016 through June 30, 2017. These examinees sent a total of 517,774 score reports to graduate—level management programs across the globe.
This report summarizes five-year global GMAT testing trends for:
• GMAT exams taken by residence,
• GMAT exams taken by gender,
• Mean age of GMAT examinees,
• Mean GMAT Total Score, and
• GMAT score-sending breakdowns by program type (MBA, business master’s, and doctoral/other), for TY 2017.
Mean GMAT Total Scores and mean age of examinees are provided for groups with five or more exams taken and 10 or more score reports sent.
What Can I Do With the Data? Use the data to build candidate profiles for specific country and regional groups. For example, using the tables you can determine the following about Zimbabwean residents who sat for the GMAT exam in TY2017:
• Zimbabwean residents sat for 80 GMAT exams.
• The mean age of Zimbabwean test takers was 29.3 and the mean GMAT Total Score was 473.
• Of the 200 GMAT score reports sent by Zimbabwean residents, 19 percent were directed to business master’s programs.
• Men in Zimbabwe 73% of scores sent) were equally as likely as women in Zimbabwe (70%) to send scores to MBA programs.
• Zimbabwean residents represent 3 percent of GMAT test taking by African residents and 0.03 percent of global testing.
Make this report your starting point to target your search of potential students and enhance your recruitment efforts. For example, you can purchase names of prospective students using the Graduate Management Admission Search Service® (GMASS®) database or develop profiles of candidates based on data in the mba.com Prospective Students Survey Interactive Report.
About This Report This Data Brief summarizes five years of data for GMAT exams taken and score reports sent worldwide, filtered by residence at time of GMAT registration.
Review GMAT exam and score reporting trends by:
• Region of Residence • Country/Territory of
Residence
About GMAT Examinees Data in the tables reflect the total number of GMAT exams that generated valid Total Scores during a given testing year. Test takers who took the exam more than once during the year are included in the aggregate data. For example, an individual who took the GMAT exam twice in TY2017 would represent a total of two exams taken during that year.
Profile of GMAT® Testing: Residence, TY2013–TY2017
2 © 2017 Graduate Management Admission Council® (GMAC®). All rights reserved.
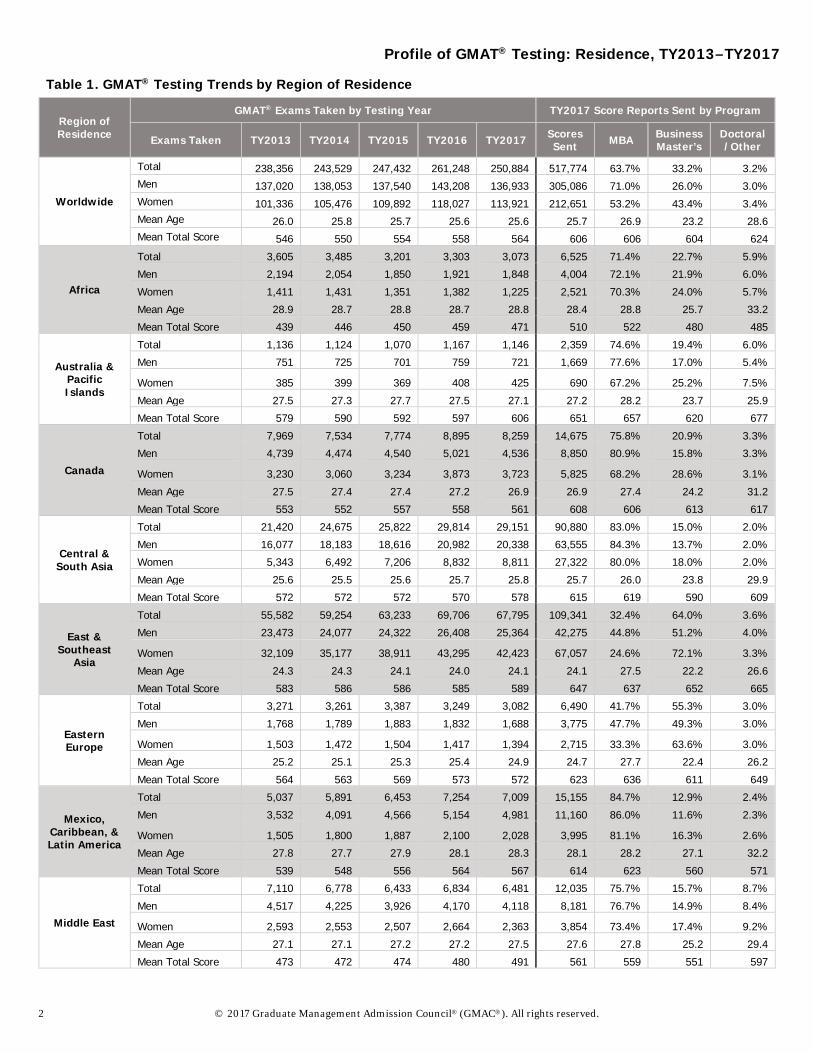
Table 1. GMAT® Testing Trends by Region of Residence
Region of Residence
GMAT® Exams Taken by Testing Year TY2017 Score Reports Sent by Program
Exams Taken TY2013 TY2014 TY2015 TY2016 TY2017 Scores Sent MBA Business
Master’s Doctoral /Other
Worldwide
Total 238,356 243,529 247,432 261,248 250,884 517,774 63.7% 33.2% 3.2% Men 137,020 138,053 137,540 143,208 136,933 305,086 71.0% 26.0% 3.0% Women 101,336 105,476 109,892 118,027 113,921 212,651 53.2% 43.4% 3.4% Mean Age 26.0 25.8 25.7 25.6 25.6 25.7 26.9 23.2 28.6 Mean Total Score 546 550 554 558 564 606 606 604 624
Africa
Total 3,605 3,485 3,201 3,303 3,073 6,525 71.4% 22.7% 5.9% Men 2,194 2,054 1,850 1,921 1,848 4,004 72.1% 21.9% 6.0% Women 1,411 1,431 1,351 1,382 1,225 2,521 70.3% 24.0% 5.7% Mean Age 28.9 28.7 28.8 28.7 28.8 28.4 28.8 25.7 33.2 Mean Total Score 439 446 450 459 471 510 522 480 485
Australia & Pacific Islands
Total 1,136 1,124 1,070 1,167 1,146 2,359 74.6% 19.4% 6.0% Men 751 725 701 759 721 1,669 77.6% 17.0% 5.4%
Women 385 399 369 408 425 690 67.2% 25.2% 7.5% Mean Age 27.5 27.3 27.7 27.5 27.1 27.2 28.2 23.7 25.9 Mean Total Score 579 590 592 597 606 651 657 620 677
Canada
Total 7,969 7,534 7,774 8,895 8,259 14,675 75.8% 20.9% 3.3% Men 4,739 4,474 4,540 5,021 4,536 8,850 80.9% 15.8% 3.3%
Women 3,230 3,060 3,234 3,873 3,723 5,825 68.2% 28.6% 3.1% Mean Age 27.5 27.4 27.4 27.2 26.9 26.9 27.4 24.2 31.2 Mean Total Score 553 552 557 558 561 608 606 613 617
Central & South Asia
Total 21,420 24,675 25,822 29,814 29,151 90,880 83.0% 15.0% 2.0% Men 16,077 18,183 18,616 20,982 20,338 63,555 84.3% 13.7% 2.0% Women 5,343 6,492 7,206 8,832 8,811 27,322 80.0% 18.0% 2.0% Mean Age 25.6 25.5 25.6 25.7 25.8 25.7 26.0 23.8 29.9 Mean Total Score 572 572 572 570 578 615 619 590 609
East & Southeast
Asia
Total 55,582 59,254 63,233 69,706 67,795 109,341 32.4% 64.0% 3.6% Men 23,473 24,077 24,322 26,408 25,364 42,275 44.8% 51.2% 4.0%
Women 32,109 35,177 38,911 43,295 42,423 67,057 24.6% 72.1% 3.3% Mean Age 24.3 24.3 24.1 24.0 24.1 24.1 27.5 22.2 26.6 Mean Total Score 583 586 586 585 589 647 637 652 665
Eastern Europe
Total 3,271 3,261 3,387 3,249 3,082 6,490 41.7% 55.3% 3.0% Men 1,768 1,789 1,883 1,832 1,688 3,775 47.7% 49.3% 3.0%
Women 1,503 1,472 1,504 1,417 1,394 2,715 33.3% 63.6% 3.0% Mean Age 25.2 25.1 25.3 25.4 24.9 24.7 27.7 22.4 26.2 Mean Total Score 564 563 569 573 572 623 636 611 649
Mexico, Caribbean, & Latin America
Total 5,037 5,891 6,453 7,254 7,009 15,155 84.7% 12.9% 2.4% Men 3,532 4,091 4,566 5,154 4,981 11,160 86.0% 11.6% 2.3%
Women 1,505 1,800 1,887 2,100 2,028 3,995 81.1% 16.3% 2.6% Mean Age 27.8 27.7 27.9 28.1 28.3 28.1 28.2 27.1 32.2 Mean Total Score 539 548 556 564 567 614 623 560 571
Middle East
Total 7,110 6,778 6,433 6,834 6,481 12,035 75.7% 15.7% 8.7% Men 4,517 4,225 3,926 4,170 4,118 8,181 76.7% 14.9% 8.4%
Women 2,593 2,553 2,507 2,664 2,363 3,854 73.4% 17.4% 9.2% Mean Age 27.1 27.1 27.2 27.2 27.5 27.6 27.8 25.2 29.4 Mean Total Score 473 472 474 480 491 561 559 551 597
Profile of GMAT® Testing: Residence, TY2013–TY2017
© 2017 Graduate Management Admission Council® (GMAC®). All rights reserved. 3
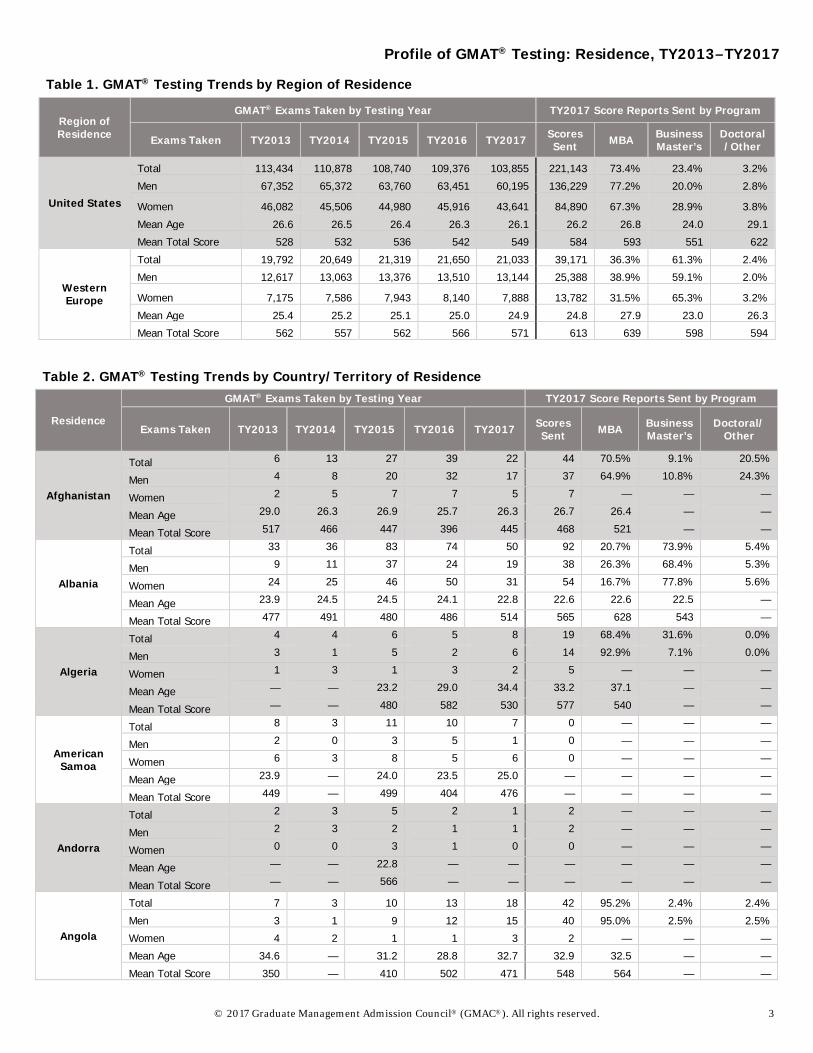
Table 1. GMAT® Testing Trends by Region of Residence
Region of Residence
GMAT® Exams Taken by Testing Year TY2017 Score Reports Sent by Program
Exams Taken TY2013 TY2014 TY2015 TY2016 TY2017 Scores Sent MBA Business
Master’s Doctoral /Other
United States
Total 113,434 110,878 108,740 109,376 103,855 221,143 73.4% 23.4% 3.2% Men 67,352 65,372 63,760 63,451 60,195 136,229 77.2% 20.0% 2.8%
Women 46,082 45,506 44,980 45,916 43,641 84,890 67.3% 28.9% 3.8% Mean Age 26.6 26.5 26.4 26.3 26.1 26.2 26.8 24.0 29.1 Mean Total Score 528 532 536 542 549 584 593 551 622
Western Europe
Total 19,792 20,649 21,319 21,650 21,033 39,171 36.3% 61.3% 2.4% Men 12,617 13,063 13,376 13,510 13,144 25,388 38.9% 59.1% 2.0%
Women 7,175 7,586 7,943 8,140 7,888 13,782 31.5% 65.3% 3.2% Mean Age 25.4 25.2 25.1 25.0 24.9 24.8 27.9 23.0 26.3 Mean Total Score 562 557 562 566 571 613 639 598 594
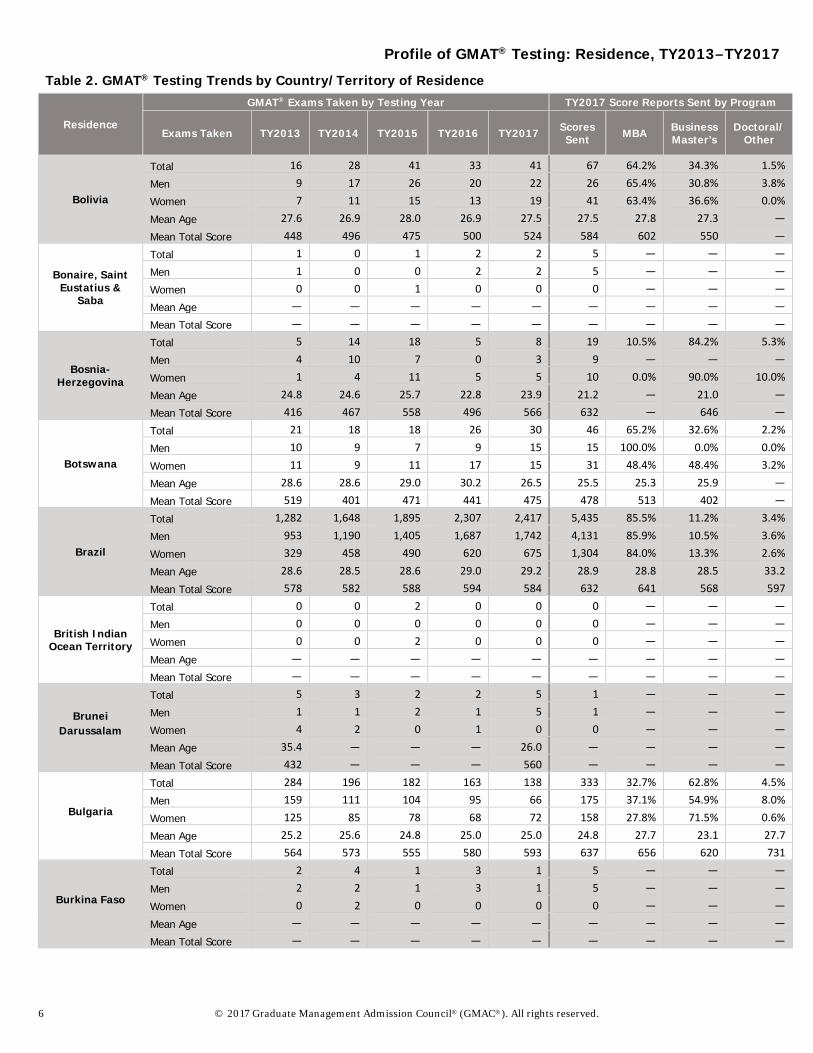
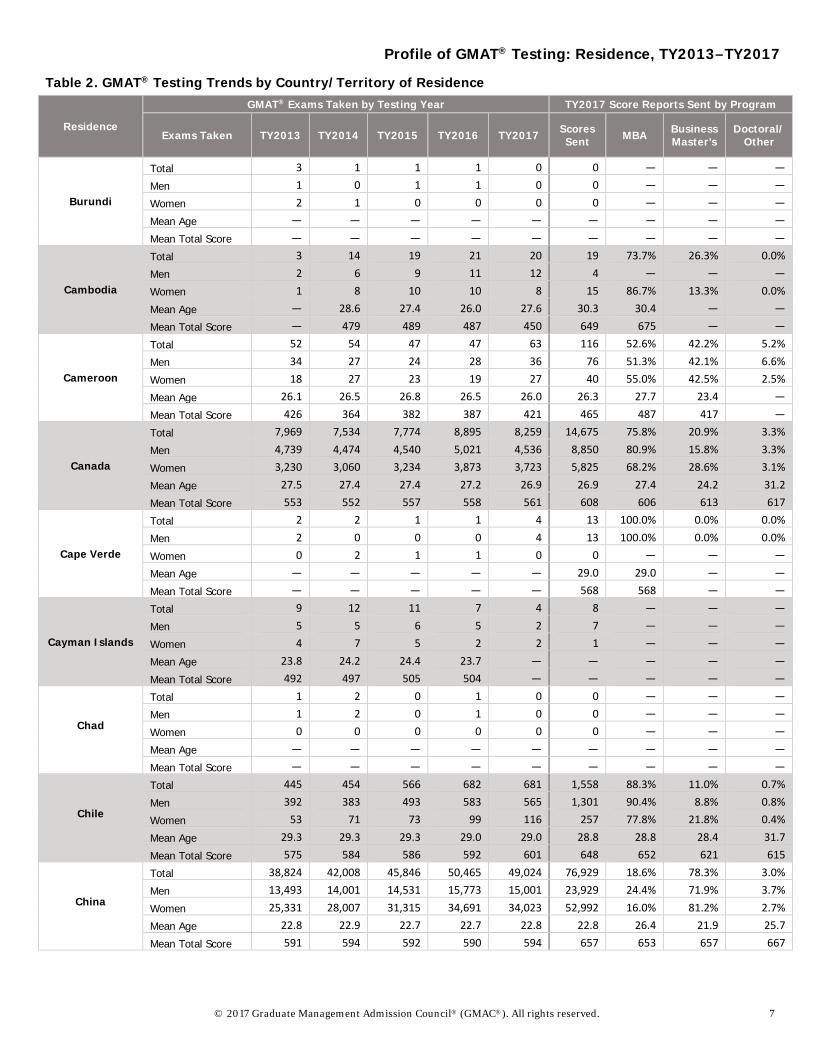
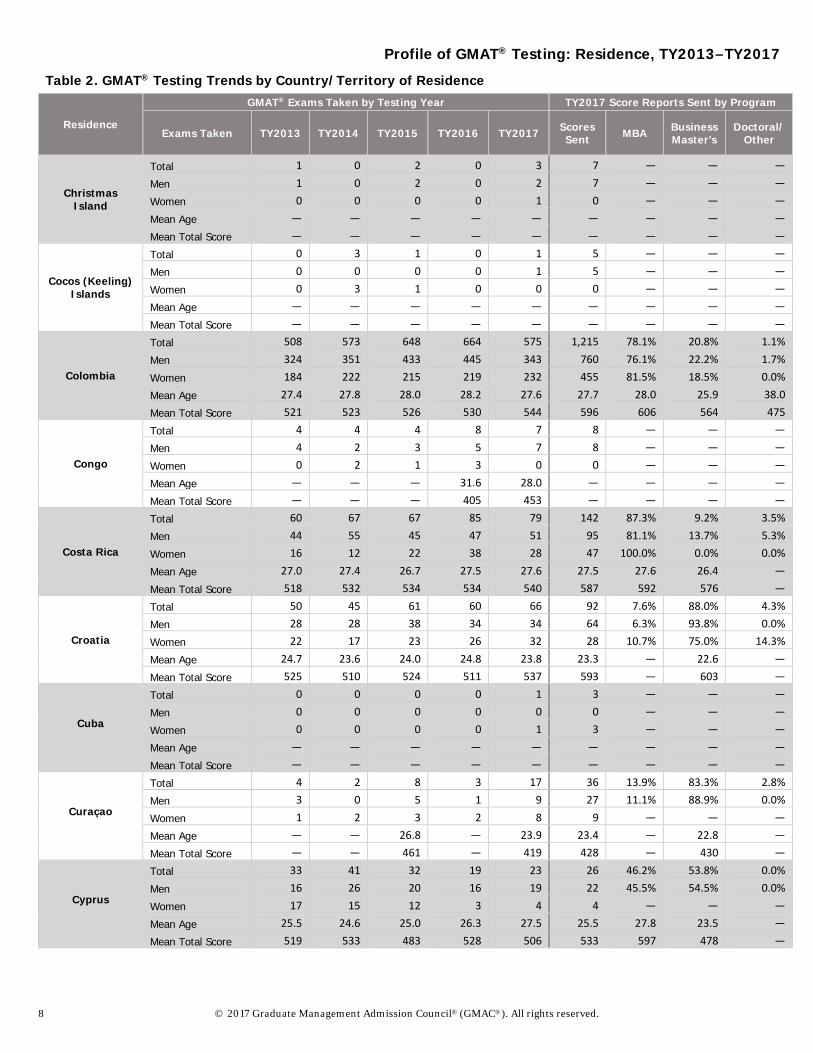
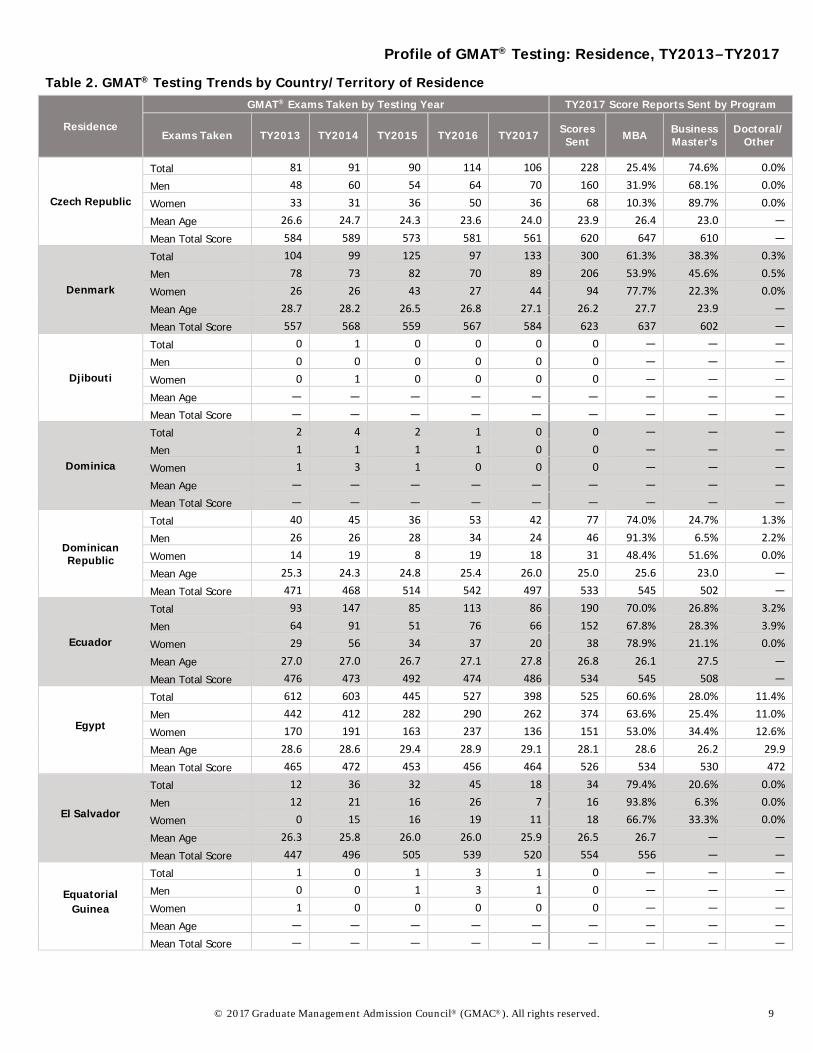
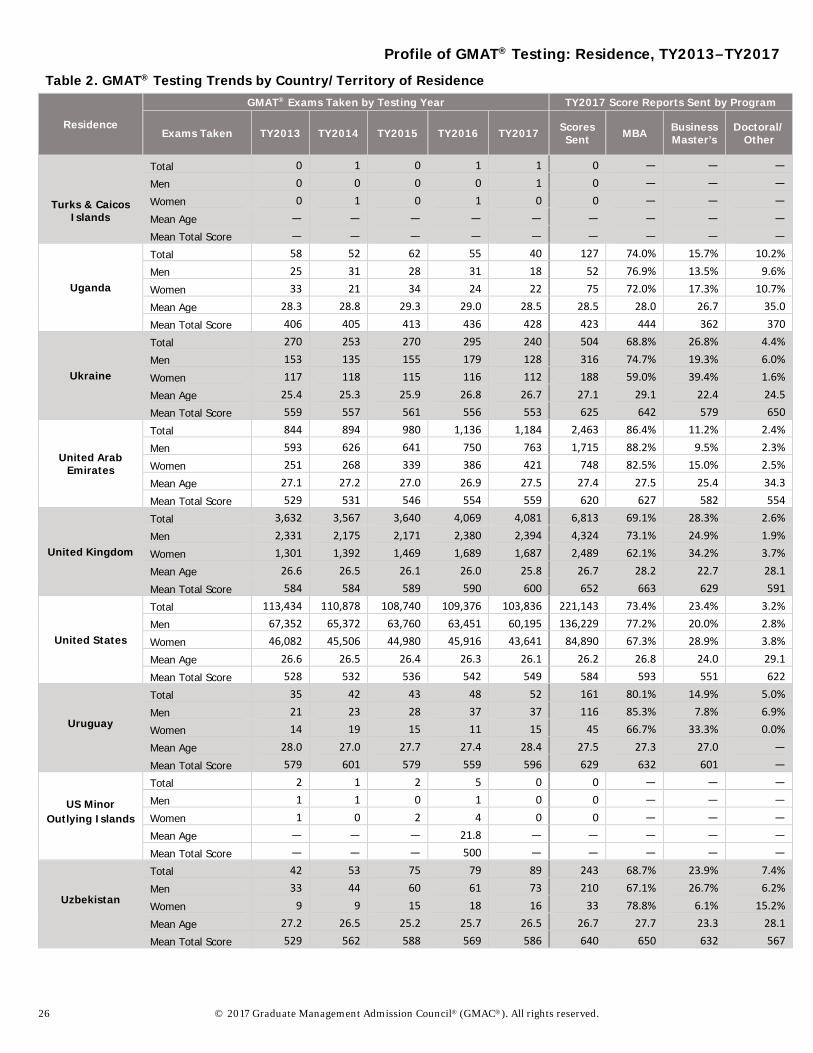
Table 2. GMAT® Testing Trends by Country/Territory of Residence
Residence
GMAT® Exams Taken by Testing Year TY2017 Score Reports Sent by Program
Exams Taken TY2013 TY2014 TY2015 TY2016 TY2017 Scores Sent MBA Business
Master’s Doctoral/
Other
Afghanistan
Total 6 13 27 39 22 44 70.5% 9.1% 20.5%
Men 4 8 20 32 17 37 64.9% 10.8% 24.3%
Women 2 5 7 7 5 7 — — —
Mean Age 29.0 26.3 26.9 25.7 26.3 26.7 26.4 — —
Mean Total Score 517 466 447 396 445 468 521 — —
Albania
Total 33 36 83 74 50 92 20.7% 73.9% 5.4%
Men 9 11 37 24 19 38 26.3% 68.4% 5.3%
Women 24 25 46 50 31 54 16.7% 77.8% 5.6%
Mean Age 23.9 24.5 24.5 24.1 22.8 22.6 22.6 22.5 —
Mean Total Score 477 491 480 486 514 565 628 543 —
Algeria
Total 4 4 6 5 8 19 68.4% 31.6% 0.0%
Men 3 1 5 2 6 14 92.9% 7.1% 0.0%
Women 1 3 1 3 2 5 — — —
Mean Age — — 23.2 29.0 34.4 33.2 37.1 — —
Mean Total Score — — 480 582 530 577 540 — —
American Samoa
Total 8 3 11 10 7 0 — — —
Men 2 0 3 5 1 0 — — —
Women 6 3 8 5 6 0 — — —
Mean Age 23.9 — 24.0 23.5 25.0 — — — —
Mean Total Score 449 — 499 404 476 — — — —
Andorra
Total 2 3 5 2 1 2 — — —
Men 2 3 2 1 1 2 — — —
Women 0 0 3 1 0 0 — — —
Mean Age — — 22.8 — — — — — —
Mean Total Score — — 566 — — — — — —
Angola
Total 7 3 10 13 18 42 95.2% 2.4% 2.4% Men 3 1 9 12 15 40 95.0% 2.5% 2.5% Women 4 2 1 1 3 2 — — — Mean Age 34.6 — 31.2 28.8 32.7 32.9 32.5 — — Mean Total Score 350 — 410 502 471 548 564 — —
Profile of GMAT® Testing: Residence, TY2013–TY2017
4 © 2017 Graduate Management Admission Council® (GMAC®). All rights reserved.
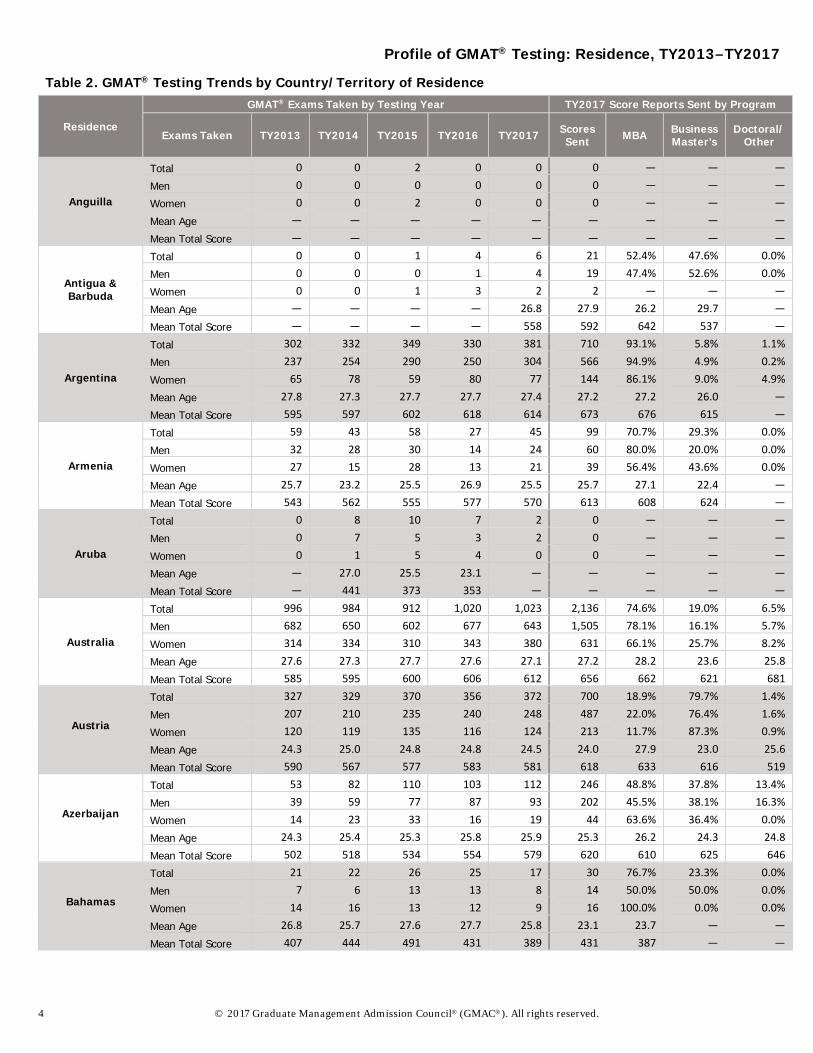
Table 2. GMAT® Testing Trends by Country/Territory of Residence
Residence
GMAT® Exams Taken by Testing Year TY2017 Score Reports Sent by Program
Exams Taken TY2013 TY2014 TY2015 TY2016 TY2017 Scores Sent MBA Business
Master’s Doctoral/
Other
Anguilla
Total 0 0 2 0 0 0 — — — Men 0 0 0 0 0 0 — — — Women 0 0 2 0 0 0 — — — Mean Age — — — — — — — — — Mean Total Score — — — — — — — — —
Antigua & Barbuda
Total 0 0 1 4 6 21 52.4% 47.6% 0.0% Men 0 0 0 1 4 19 47.4% 52.6% 0.0% Women 0 0 1 3 2 2 — — — Mean Age — — — — 26.8 27.9 26.2 29.7 — Mean Total Score — — — — 558 592 642 537 —
Argentina
Total 302 332 349 330 381 710 93.1% 5.8% 1.1% Men 237 254 290 250 304 566 94.9% 4.9% 0.2% Women 65 78 59 80 77 144 86.1% 9.0% 4.9% Mean Age 27.8 27.3 27.7 27.7 27.4 27.2 27.2 26.0 — Mean Total Score 595 597 602 618 614 673 676 615 —
Armenia
Total 59 43 58 27 45 99 70.7% 29.3% 0.0% Men 32 28 30 14 24 60 80.0% 20.0% 0.0% Women 27 15 28 13 21 39 56.4% 43.6% 0.0% Mean Age 25.7 23.2 25.5 26.9 25.5 25.7 27.1 22.4 — Mean Total Score 543 562 555 577 570 613 608 624 —
Aruba
Total 0 8 10 7 2 0 — — — Men 0 7 5 3 2 0 — — — Women 0 1 5 4 0 0 — — — Mean Age — 27.0 25.5 23.1 — — — — — Mean Total Score — 441 373 353 — — — — —
Australia
Total 996 984 912 1,020 1,023 2,136 74.6% 19.0% 6.5% Men 682 650 602 677 643 1,505 78.1% 16.1% 5.7% Women 314 334 310 343 380 631 66.1% 25.7% 8.2% Mean Age 27.6 27.3 27.7 27.6 27.1 27.2 28.2 23.6 25.8 Mean Total Score 585 595 600 606 612 656 662 621 681
Austria
Total 327 329 370 356 372 700 18.9% 79.7% 1.4% Men 207 210 235 240 248 487 22.0% 76.4% 1.6% Women 120 119 135 116 124 213 11.7% 87.3% 0.9% Mean Age 24.3 25.0 24.8 24.8 24.5 24.0 27.9 23.0 25.6 Mean Total Score 590 567 577 583 581 618 633 616 519
Azerbaijan
Total 53 82 110 103 112 246 48.8% 37.8% 13.4% Men 39 59 77 87 93 202 45.5% 38.1% 16.3% Women 14 23 33 16 19 44 63.6% 36.4% 0.0% Mean Age 24.3 25.4 25.3 25.8 25.9 25.3 26.2 24.3 24.8 Mean Total Score 502 518 534 554 579 620 610 625 646
Bahamas
Total 21 22 26 25 17 30 76.7% 23.3% 0.0% Men 7 6 13 13 8 14 50.0% 50.0% 0.0% Women 14 16 13 12 9 16 100.0% 0.0% 0.0% Mean Age 26.8 25.7 27.6 27.7 25.8 23.1 23.7 — — Mean Total Score 407 444 491 431 389 431 387 — —
Profile of GMAT® Testing: Residence, TY2013–TY2017
© 2017 Graduate Management Admission Council® (GMAC®). All rights reserved. 5
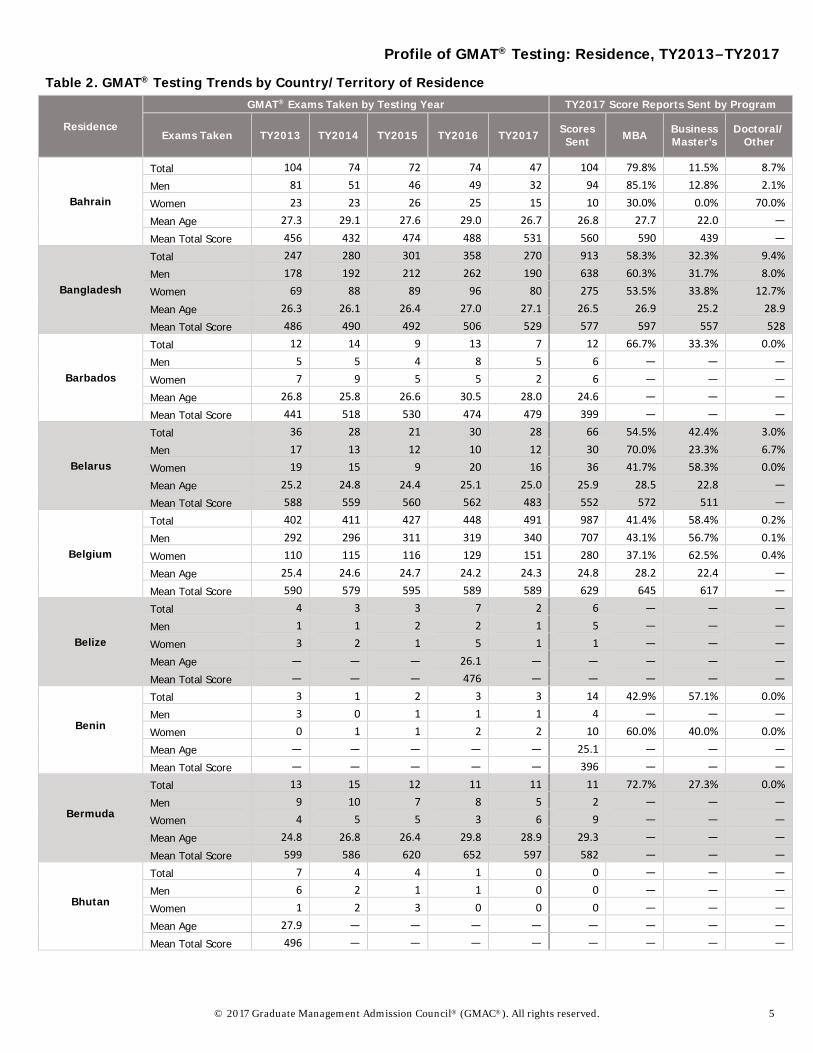
Table 2. GMAT® Testing Trends by Country/Territory of Residence
Residence
GMAT® Exams Taken by Testing Year TY2017 Score Reports Sent by Program
Exams Taken TY2013 TY2014 TY2015 TY2016 TY2017 Scores Sent MBA Business
Master’s Doctoral/
Other
Bahrain
Total 104 74 72 74 47 104 79.8% 11.5% 8.7% Men 81 51 46 49 32 94 85.1% 12.8% 2.1% Women 23 23 26 25 15 10 30.0% 0.0% 70.0% Mean Age 27.3 29.1 27.6 29.0 26.7 26.8 27.7 22.0 — Mean Total Score 456 432 474 488 531 560 590 439 —
Bangladesh
Total 247 280 301 358 270 913 58.3% 32.3% 9.4% Men 178 192 212 262 190 638 60.3% 31.7% 8.0% Women 69 88 89 96 80 275 53.5% 33.8% 12.7% Mean Age 26.3 26.1 26.4 27.0 27.1 26.5 26.9 25.2 28.9 Mean Total Score 486 490 492 506 529 577 597 557 528
Barbados
Total 12 14 9 13 7 12 66.7% 33.3% 0.0% Men 5 5 4 8 5 6 — — — Women 7 9 5 5 2 6 — — — Mean Age 26.8 25.8 26.6 30.5 28.0 24.6 — — — Mean Total Score 441 518 530 474 479 399 — — —
Belarus
Total 36 28 21 30 28 66 54.5% 42.4% 3.0% Men 17 13 12 10 12 30 70.0% 23.3% 6.7% Women 19 15 9 20 16 36 41.7% 58.3% 0.0% Mean Age 25.2 24.8 24.4 25.1 25.0 25.9 28.5 22.8 — Mean Total Score 588 559 560 562 483 552 572 511 —
Belgium
Total 402 411 427 448 491 987 41.4% 58.4% 0.2% Men 292 296 311 319 340 707 43.1% 56.7% 0.1% Women 110 115 116 129 151 280 37.1% 62.5% 0.4% Mean Age 25.4 24.6 24.7 24.2 24.3 24.8 28.2 22.4 — Mean Total Score 590 579 595 589 589 629 645 617 —
Belize
Total 4 3 3 7 2 6 — — — Men 1 1 2 2 1 5 — — — Women 3 2 1 5 1 1 — — — Mean Age — — — 26.1 — — — — — Mean Total Score — — — 476 — — — — —
Benin
Total 3 1 2 3 3 14 42.9% 57.1% 0.0% Men 3 0 1 1 1 4 — — — Women 0 1 1 2 2 10 60.0% 40.0% 0.0% Mean Age — — — — — 25.1 — — — Mean Total Score — — — — — 396 — — —
Bermuda
Total 13 15 12 11 11 11 72.7% 27.3% 0.0% Men 9 10 7 8 5 2 — — — Women 4 5 5 3 6 9 — — — Mean Age 24.8 26.8 26.4 29.8 28.9 29.3 — — — Mean Total Score 599 586 620 652 597 582 — — —
Bhutan
Total 7 4 4 1 0 0 — — — Men 6 2 1 1 0 0 — — — Women 1 2 3 0 0 0 — — — Mean Age 27.9 — — — — — — — — Mean Total Score 496 — — — — — — — —
Profile of GMAT® Testing: Residence, TY2013–TY2017
6 © 2017 Graduate Management Admission Council® (GMAC®). All rights reserved.
Table 2. GMAT® Testing Trends by Country/Territory of Residence
Residence
GMAT® Exams Taken by Testing Year TY2017 Score Reports Sent by Program
Exams Taken TY2013 TY2014 TY2015 TY2016 TY2017 Scores Sent MBA Business
Master’s Doctoral/
Other
Bolivia
Total 16 28 41 33 41 67 64.2% 34.3% 1.5% Men 9 17 26 20 22 26 65.4% 30.8% 3.8% Women 7 11 15 13 19 41 63.4% 36.6% 0.0% Mean Age 27.6 26.9 28.0 26.9 27.5 27.5 27.8 27.3 — Mean Total Score 448 496 475 500 524 584 602 550 —
Bonaire, Saint Eustatius &
Saba
Total 1 0 1 2 2 5 — — — Men 1 0 0 2 2 5 — — — Women 0 0 1 0 0 0 — — — Mean Age — — — — — — — — — Mean Total Score — — — — — — — — —
Bosnia-Herzegovina
Total 5 14 18 5 8 19 10.5% 84.2% 5.3% Men 4 10 7 0 3 9 — — — Women 1 4 11 5 5 10 0.0% 90.0% 10.0% Mean Age 24.8 24.6 25.7 22.8 23.9 21.2 — 21.0 — Mean Total Score 416 467 558 496 566 632 — 646 —
Botswana
Total 21 18 18 26 30 46 65.2% 32.6% 2.2% Men 10 9 7 9 15 15 100.0% 0.0% 0.0% Women 11 9 11 17 15 31 48.4% 48.4% 3.2% Mean Age 28.6 28.6 29.0 30.2 26.5 25.5 25.3 25.9 — Mean Total Score 519 401 471 441 475 478 513 402 —
Brazil
Total 1,282 1,648 1,895 2,307 2,417 5,435 85.5% 11.2% 3.4% Men 953 1,190 1,405 1,687 1,742 4,131 85.9% 10.5% 3.6% Women 329 458 490 620 675 1,304 84.0% 13.3% 2.6% Mean Age 28.6 28.5 28.6 29.0 29.2 28.9 28.8 28.5 33.2 Mean Total Score 578 582 588 594 584 632 641 568 597
British Indian Ocean Territory
Total 0 0 2 0 0 0 — — — Men 0 0 0 0 0 0 — — — Women 0 0 2 0 0 0 — — — Mean Age — — — — — — — — — Mean Total Score — — — — — — — — —
Brunei Darussalam
Total 5 3 2 2 5 1 — — — Men 1 1 2 1 5 1 — — — Women 4 2 0 1 0 0 — — — Mean Age 35.4 — — — 26.0 — — — — Mean Total Score 432 — — — 560 — — — —
Bulgaria
Total 284 196 182 163 138 333 32.7% 62.8% 4.5% Men 159 111 104 95 66 175 37.1% 54.9% 8.0% Women 125 85 78 68 72 158 27.8% 71.5% 0.6% Mean Age 25.2 25.6 24.8 25.0 25.0 24.8 27.7 23.1 27.7 Mean Total Score 564 573 555 580 593 637 656 620 731
Burkina Faso
Total 2 4 1 3 1 5 — — — Men 2 2 1 3 1 5 — — — Women 0 2 0 0 0 0 — — — Mean Age — — — — — — — — — Mean Total Score — — — — — — — — —
Profile of GMAT® Testing: Residence, TY2013–TY2017
© 2017 Graduate Management Admission Council® (GMAC®). All rights reserved. 7
Table 2. GMAT® Testing Trends by Country/Territory of Residence
Residence
GMAT® Exams Taken by Testing Year TY2017 Score Reports Sent by Program
Exams Taken TY2013 TY2014 TY2015 TY2016 TY2017 Scores Sent MBA Business
Master’s Doctoral/
Other
Burundi
Total 3 1 1 1 0 0 — — — Men 1 0 1 1 0 0 — — — Women 2 1 0 0 0 0 — — — Mean Age — — — — — — — — — Mean Total Score — — — — — — — — —
Cambodia
Total 3 14 19 21 20 19 73.7% 26.3% 0.0% Men 2 6 9 11 12 4 — — — Women 1 8 10 10 8 15 86.7% 13.3% 0.0% Mean Age — 28.6 27.4 26.0 27.6 30.3 30.4 — — Mean Total Score — 479 489 487 450 649 675 — —
Cameroon
Total 52 54 47 47 63 116 52.6% 42.2% 5.2% Men 34 27 24 28 36 76 51.3% 42.1% 6.6% Women 18 27 23 19 27 40 55.0% 42.5% 2.5% Mean Age 26.1 26.5 26.8 26.5 26.0 26.3 27.7 23.4 — Mean Total Score 426 364 382 387 421 465 487 417 —
Canada
Total 7,969 7,534 7,774 8,895 8,259 14,675 75.8% 20.9% 3.3% Men 4,739 4,474 4,540 5,021 4,536 8,850 80.9% 15.8% 3.3% Women 3,230 3,060 3,234 3,873 3,723 5,825 68.2% 28.6% 3.1% Mean Age 27.5 27.4 27.4 27.2 26.9 26.9 27.4 24.2 31.2 Mean Total Score 553 552 557 558 561 608 606 613 617
Cape Verde
Total 2 2 1 1 4 13 100.0% 0.0% 0.0% Men 2 0 0 0 4 13 100.0% 0.0% 0.0% Women 0 2 1 1 0 0 — — — Mean Age — — — — — 29.0 29.0 — — Mean Total Score — — — — — 568 568 — —
Cayman Islands
Total 9 12 11 7 4 8 — — — Men 5 5 6 5 2 7 — — — Women 4 7 5 2 2 1 — — — Mean Age 23.8 24.2 24.4 23.7 — — — — — Mean Total Score 492 497 505 504 — — — — —
Chad
Total 1 2 0 1 0 0 — — — Men 1 2 0 1 0 0 — — — Women 0 0 0 0 0 0 — — — Mean Age — — — — — — — — — Mean Total Score — — — — — — — — —
Chile
Total 445 454 566 682 681 1,558 88.3% 11.0% 0.7% Men 392 383 493 583 565 1,301 90.4% 8.8% 0.8% Women 53 71 73 99 116 257 77.8% 21.8% 0.4% Mean Age 29.3 29.3 29.3 29.0 29.0 28.8 28.8 28.4 31.7 Mean Total Score 575 584 586 592 601 648 652 621 615
China
Total 38,824 42,008 45,846 50,465 49,024 76,929 18.6% 78.3% 3.0% Men 13,493 14,001 14,531 15,773 15,001 23,929 24.4% 71.9% 3.7% Women 25,331 28,007 31,315 34,691 34,023 52,992 16.0% 81.2% 2.7% Mean Age 22.8 22.9 22.7 22.7 22.8 22.8 26.4 21.9 25.7 Mean Total Score 591 594 592 590 594 657 653 657 667
Profile of GMAT® Testing: Residence, TY2013–TY2017
8 © 2017 Graduate Management Admission Council® (GMAC®). All rights reserved.
Table 2. GMAT® Testing Trends by Country/Territory of Residence
Residence
GMAT® Exams Taken by Testing Year TY2017 Score Reports Sent by Program
Exams Taken TY2013 TY2014 TY2015 TY2016 TY2017 Scores Sent MBA Business
Master’s Doctoral/
Other
Christmas Island
Total 1 0 2 0 3 7 — — — Men 1 0 2 0 2 7 — — — Women 0 0 0 0 1 0 — — — Mean Age — — — — — — — — — Mean Total Score — — — — — — — — —
Cocos (Keeling) Islands
Total 0 3 1 0 1 5 — — — Men 0 0 0 0 1 5 — — — Women 0 3 1 0 0 0 — — — Mean Age — — — — — — — — — Mean Total Score — — — — — — — — —
Colombia
Total 508 573 648 664 575 1,215 78.1% 20.8% 1.1% Men 324 351 433 445 343 760 76.1% 22.2% 1.7% Women 184 222 215 219 232 455 81.5% 18.5% 0.0% Mean Age 27.4 27.8 28.0 28.2 27.6 27.7 28.0 25.9 38.0 Mean Total Score 521 523 526 530 544 596 606 564 475
Congo
Total 4 4 4 8 7 8 — — — Men 4 2 3 5 7 8 — — — Women 0 2 1 3 0 0 — — — Mean Age — — — 31.6 28.0 — — — — Mean Total Score — — — 405 453 — — — —
Costa Rica
Total 60 67 67 85 79 142 87.3% 9.2% 3.5% Men 44 55 45 47 51 95 81.1% 13.7% 5.3% Women 16 12 22 38 28 47 100.0% 0.0% 0.0% Mean Age 27.0 27.4 26.7 27.5 27.6 27.5 27.6 26.4 — Mean Total Score 518 532 534 534 540 587 592 576 —
Croatia
Total 50 45 61 60 66 92 7.6% 88.0% 4.3% Men 28 28 38 34 34 64 6.3% 93.8% 0.0% Women 22 17 23 26 32 28 10.7% 75.0% 14.3% Mean Age 24.7 23.6 24.0 24.8 23.8 23.3 — 22.6 — Mean Total Score 525 510 524 511 537 593 — 603 —
Cuba
Total 0 0 0 0 1 3 — — — Men 0 0 0 0 0 0 — — — Women 0 0 0 0 1 3 — — — Mean Age — — — — — — — — — Mean Total Score — — — — — — — — —
Curaçao
Total 4 2 8 3 17 36 13.9% 83.3% 2.8% Men 3 0 5 1 9 27 11.1% 88.9% 0.0% Women 1 2 3 2 8 9 — — — Mean Age — — 26.8 — 23.9 23.4 — 22.8 — Mean Total Score — — 461 — 419 428 — 430 —
Cyprus
Total 33 41 32 19 23 26 46.2% 53.8% 0.0% Men 16 26 20 16 19 22 45.5% 54.5% 0.0% Women 17 15 12 3 4 4 — — — Mean Age 25.5 24.6 25.0 26.3 27.5 25.5 27.8 23.5 — Mean Total Score 519 533 483 528 506 533 597 478 —
Profile of GMAT® Testing: Residence, TY2013–TY2017
© 2017 Graduate Management Admission Council® (GMAC®). All rights reserved. 9
Table 2. GMAT® Testing Trends by Country/Territory of Residence
Residence
GMAT® Exams Taken by Testing Year TY2017 Score Reports Sent by Program
Exams Taken TY2013 TY2014 TY2015 TY2016 TY2017 Scores Sent MBA Business
Master’s Doctoral/
Other
Czech Republic
Total 81 91 90 114 106 228 25.4% 74.6% 0.0% Men 48 60 54 64 70 160 31.9% 68.1% 0.0% Women 33 31 36 50 36 68 10.3% 89.7% 0.0% Mean Age 26.6 24.7 24.3 23.6 24.0 23.9 26.4 23.0 — Mean Total Score 584 589 573 581 561 620 647 610 —
Denmark
Total 104 99 125 97 133 300 61.3% 38.3% 0.3% Men 78 73 82 70 89 206 53.9% 45.6% 0.5% Women 26 26 43 27 44 94 77.7% 22.3% 0.0% Mean Age 28.7 28.2 26.5 26.8 27.1 26.2 27.7 23.9 — Mean Total Score 557 568 559 567 584 623 637 602 —
Djibouti
Total 0 1 0 0 0 0 — — — Men 0 0 0 0 0 0 — — — Women 0 1 0 0 0 0 — — — Mean Age — — — — — — — — — Mean Total Score — — — — — — — — —
Dominica
Total 2 4 2 1 0 0 — — — Men 1 1 1 1 0 0 — — — Women 1 3 1 0 0 0 — — — Mean Age — — — — — — — — — Mean Total Score — — — — — — — — —
Dominican Republic
Total 40 45 36 53 42 77 74.0% 24.7% 1.3% Men 26 26 28 34 24 46 91.3% 6.5% 2.2% Women 14 19 8 19 18 31 48.4% 51.6% 0.0% Mean Age 25.3 24.3 24.8 25.4 26.0 25.0 25.6 23.0 — Mean Total Score 471 468 514 542 497 533 545 502 —
Ecuador
Total 93 147 85 113 86 190 70.0% 26.8% 3.2% Men 64 91 51 76 66 152 67.8% 28.3% 3.9% Women 29 56 34 37 20 38 78.9% 21.1% 0.0% Mean Age 27.0 27.0 26.7 27.1 27.8 26.8 26.1 27.5 — Mean Total Score 476 473 492 474 486 534 545 508 —
Egypt
Total 612 603 445 527 398 525 60.6% 28.0% 11.4% Men 442 412 282 290 262 374 63.6% 25.4% 11.0% Women 170 191 163 237 136 151 53.0% 34.4% 12.6% Mean Age 28.6 28.6 29.4 28.9 29.1 28.1 28.6 26.2 29.9 Mean Total Score 465 472 453 456 464 526 534 530 472
El Salvador
Total 12 36 32 45 18 34 79.4% 20.6% 0.0% Men 12 21 16 26 7 16 93.8% 6.3% 0.0% Women 0 15 16 19 11 18 66.7% 33.3% 0.0% Mean Age 26.3 25.8 26.0 26.0 25.9 26.5 26.7 — — Mean Total Score 447 496 505 539 520 554 556 — —
Equatorial Guinea
Total 1 0 1 3 1 0 — — — Men 0 0 1 3 1 0 — — — Women 1 0 0 0 0 0 — — — Mean Age — — — — — — — — — Mean Total Score — — — — — — — — —
Profile of GMAT® Testing: Residence, TY2013–TY2017
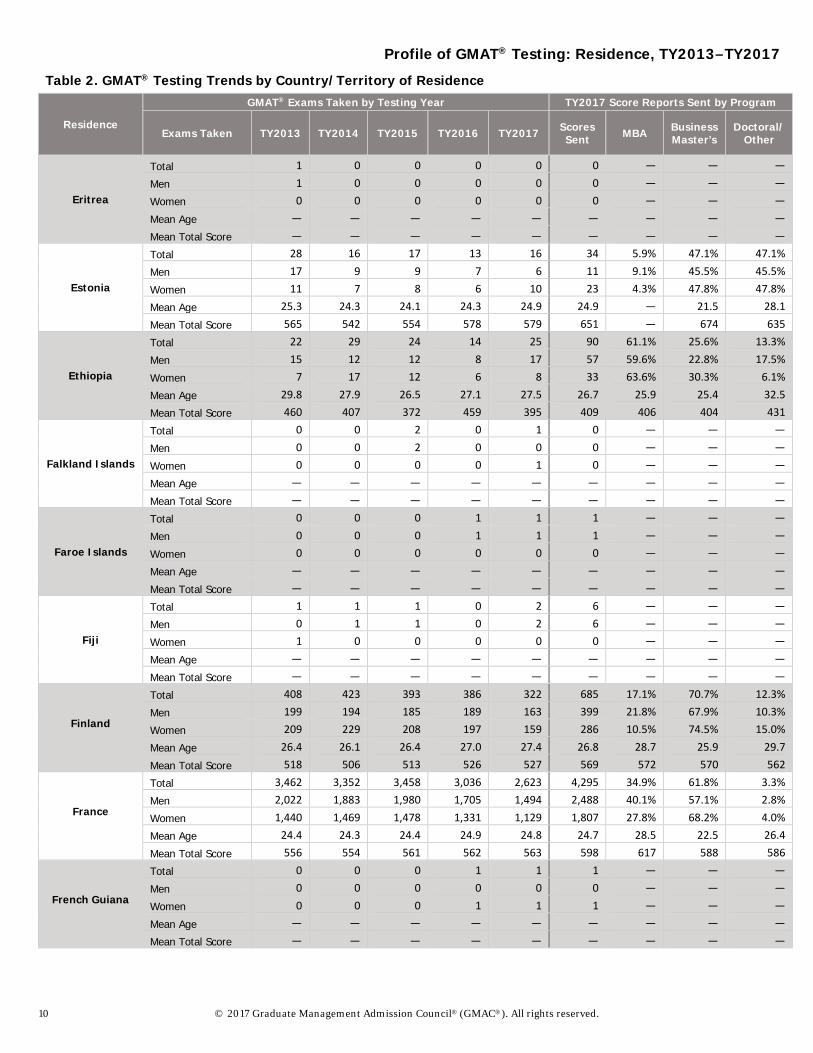
10 © 2017 Graduate Management Admission Council® (GMAC®). All rights reserved.
Table 2. GMAT® Testing Trends by Country/Territory of Residence
Residence
GMAT® Exams Taken by Testing Year TY2017 Score Reports Sent by Program
Exams Taken TY2013 TY2014 TY2015 TY2016 TY2017 Scores Sent MBA Business
Master’s Doctoral/
Other
Eritrea
Total 1 0 0 0 0 0 — — — Men 1 0 0 0 0 0 — — — Women 0 0 0 0 0 0 — — — Mean Age — — — — — — — — — Mean Total Score — — — — — — — — —
Estonia
Total 28 16 17 13 16 34 5.9% 47.1% 47.1% Men 17 9 9 7 6 11 9.1% 45.5% 45.5% Women 11 7 8 6 10 23 4.3% 47.8% 47.8% Mean Age 25.3 24.3 24.1 24.3 24.9 24.9 — 21.5 28.1 Mean Total Score 565 542 554 578 579 651 — 674 635
Ethiopia
Total 22 29 24 14 25 90 61.1% 25.6% 13.3% Men 15 12 12 8 17 57 59.6% 22.8% 17.5% Women 7 17 12 6 8 33 63.6% 30.3% 6.1% Mean Age 29.8 27.9 26.5 27.1 27.5 26.7 25.9 25.4 32.5 Mean Total Score 460 407 372 459 395 409 406 404 431
Falkland Islands
Total 0 0 2 0 1 0 — — — Men 0 0 2 0 0 0 — — — Women 0 0 0 0 1 0 — — — Mean Age — — — — — — — — — Mean Total Score — — — — — — — — —
Faroe Islands
Total 0 0 0 1 1 1 — — — Men 0 0 0 1 1 1 — — — Women 0 0 0 0 0 0 — — — Mean Age — — — — — — — — — Mean Total Score — — — — — — — — —
Fiji
Total 1 1 1 0 2 6 — — — Men 0 1 1 0 2 6 — — — Women 1 0 0 0 0 0 — — — Mean Age — — — — — — — — — Mean Total Score — — — — — — — — —
Finland
Total 408 423 393 386 322 685 17.1% 70.7% 12.3% Men 199 194 185 189 163 399 21.8% 67.9% 10.3% Women 209 229 208 197 159 286 10.5% 74.5% 15.0% Mean Age 26.4 26.1 26.4 27.0 27.4 26.8 28.7 25.9 29.7 Mean Total Score 518 506 513 526 527 569 572 570 562
France
Total 3,462 3,352 3,458 3,036 2,623 4,295 34.9% 61.8% 3.3% Men 2,022 1,883 1,980 1,705 1,494 2,488 40.1% 57.1% 2.8% Women 1,440 1,469 1,478 1,331 1,129 1,807 27.8% 68.2% 4.0% Mean Age 24.4 24.3 24.4 24.9 24.8 24.7 28.5 22.5 26.4 Mean Total Score 556 554 561 562 563 598 617 588 586
French Guiana
Total 0 0 0 1 1 1 — — — Men 0 0 0 0 0 0 — — — Women 0 0 0 1 1 1 — — — Mean Age — — — — — — — — — Mean Total Score — — — — — — — — —
Profile of GMAT® Testing: Residence, TY2013–TY2017
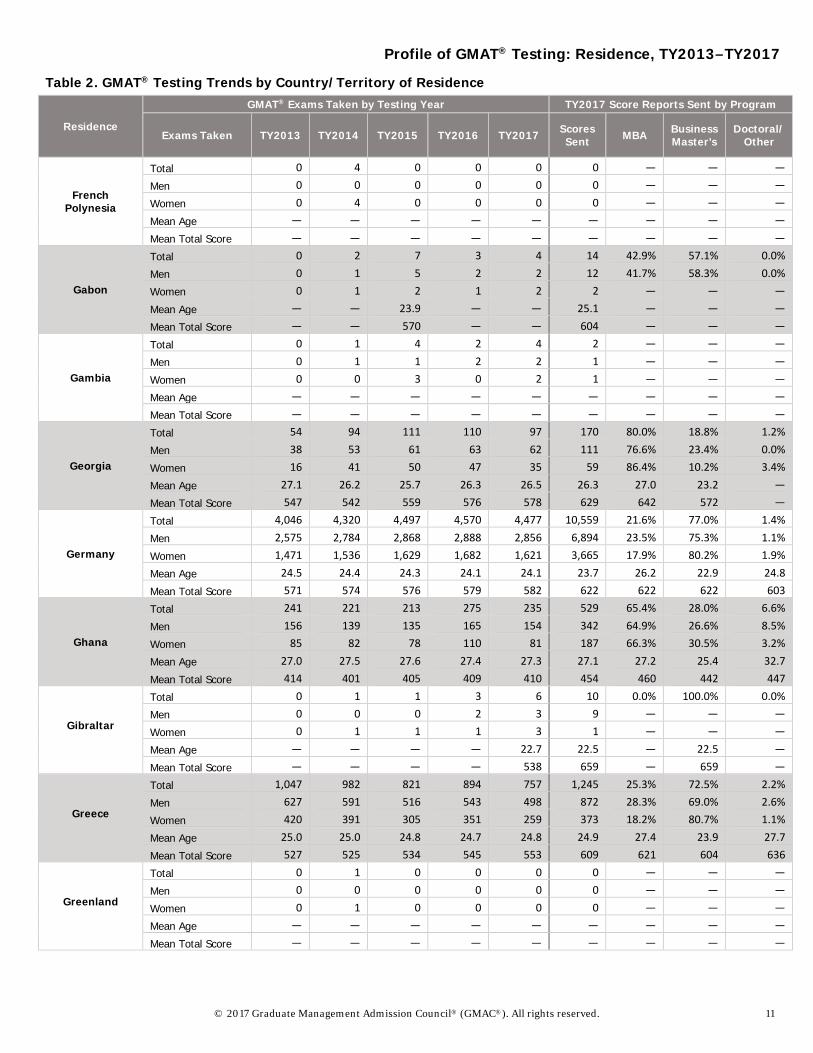
© 2017 Graduate Management Admission Council® (GMAC®). All rights reserved. 11
Table 2. GMAT® Testing Trends by Country/Territory of Residence
Residence
GMAT® Exams Taken by Testing Year TY2017 Score Reports Sent by Program
Exams Taken TY2013 TY2014 TY2015 TY2016 TY2017 Scores Sent MBA Business
Master’s Doctoral/
Other
French Polynesia
Total 0 4 0 0 0 0 — — — Men 0 0 0 0 0 0 — — — Women 0 4 0 0 0 0 — — — Mean Age — — — — — — — — — Mean Total Score — — — — — — — — —
Gabon
Total 0 2 7 3 4 14 42.9% 57.1% 0.0% Men 0 1 5 2 2 12 41.7% 58.3% 0.0% Women 0 1 2 1 2 2 — — — Mean Age — — 23.9 — — 25.1 — — — Mean Total Score — — 570 — — 604 — — —
Gambia
Total 0 1 4 2 4 2 — — — Men 0 1 1 2 2 1 — — — Women 0 0 3 0 2 1 — — — Mean Age — — — — — — — — — Mean Total Score — — — — — — — — —
Georgia
Total 54 94 111 110 97 170 80.0% 18.8% 1.2% Men 38 53 61 63 62 111 76.6% 23.4% 0.0% Women 16 41 50 47 35 59 86.4% 10.2% 3.4% Mean Age 27.1 26.2 25.7 26.3 26.5 26.3 27.0 23.2 — Mean Total Score 547 542 559 576 578 629 642 572 —
Germany
Total 4,046 4,320 4,497 4,570 4,477 10,559 21.6% 77.0% 1.4% Men 2,575 2,784 2,868 2,888 2,856 6,894 23.5% 75.3% 1.1% Women 1,471 1,536 1,629 1,682 1,621 3,665 17.9% 80.2% 1.9% Mean Age 24.5 24.4 24.3 24.1 24.1 23.7 26.2 22.9 24.8 Mean Total Score 571 574 576 579 582 622 622 622 603
Ghana
Total 241 221 213 275 235 529 65.4% 28.0% 6.6% Men 156 139 135 165 154 342 64.9% 26.6% 8.5% Women 85 82 78 110 81 187 66.3% 30.5% 3.2% Mean Age 27.0 27.5 27.6 27.4 27.3 27.1 27.2 25.4 32.7 Mean Total Score 414 401 405 409 410 454 460 442 447
Gibraltar
Total 0 1 1 3 6 10 0.0% 100.0% 0.0% Men 0 0 0 2 3 9 — — — Women 0 1 1 1 3 1 — — — Mean Age — — — — 22.7 22.5 — 22.5 — Mean Total Score — — — — 538 659 — 659 —
Greece
Total 1,047 982 821 894 757 1,245 25.3% 72.5% 2.2% Men 627 591 516 543 498 872 28.3% 69.0% 2.6% Women 420 391 305 351 259 373 18.2% 80.7% 1.1% Mean Age 25.0 25.0 24.8 24.7 24.8 24.9 27.4 23.9 27.7 Mean Total Score 527 525 534 545 553 609 621 604 636
Greenland
Total 0 1 0 0 0 0 — — — Men 0 0 0 0 0 0 — — — Women 0 1 0 0 0 0 — — — Mean Age — — — — — — — — — Mean Total Score — — — — — — — — —
Profile of GMAT® Testing: Residence, TY2013–TY2017
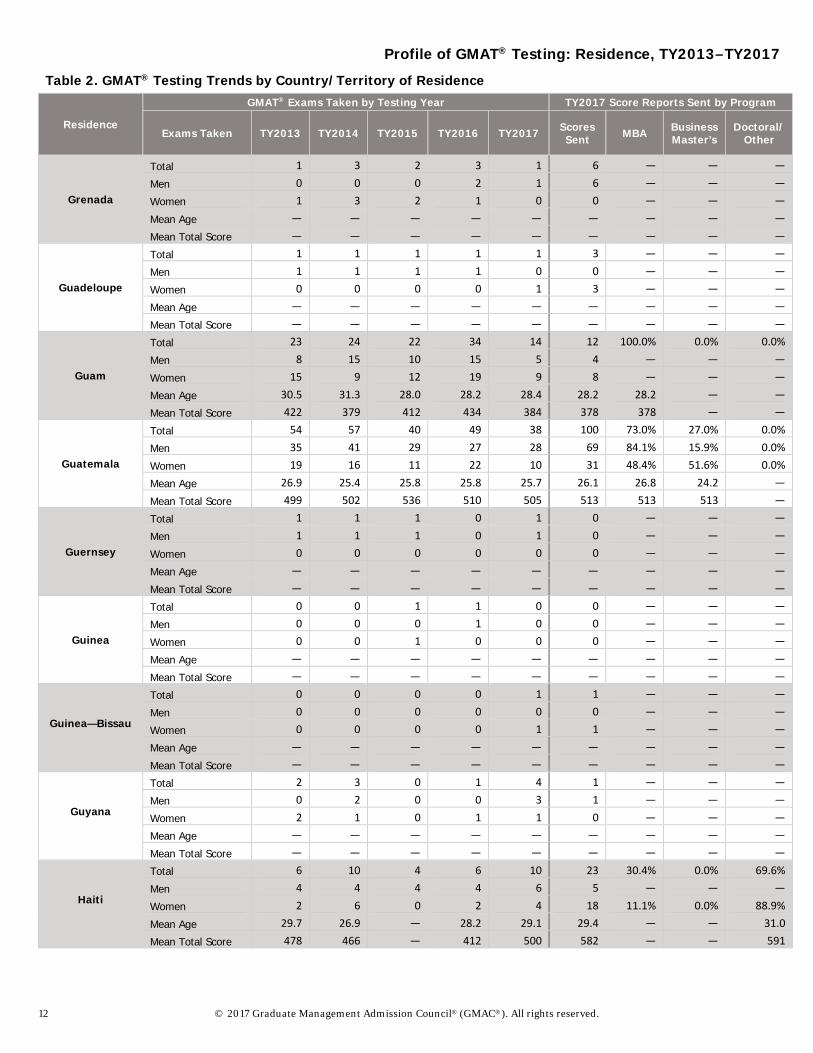
12 © 2017 Graduate Management Admission Council® (GMAC®). All rights reserved.
Table 2. GMAT® Testing Trends by Country/Territory of Residence
Residence
GMAT® Exams Taken by Testing Year TY2017 Score Reports Sent by Program
Exams Taken TY2013 TY2014 TY2015 TY2016 TY2017 Scores Sent MBA Business
Master’s Doctoral/
Other
Grenada
Total 1 3 2 3 1 6 — — — Men 0 0 0 2 1 6 — — — Women 1 3 2 1 0 0 — — — Mean Age — — — — — — — — — Mean Total Score — — — — — — — — —
Guadeloupe
Total 1 1 1 1 1 3 — — — Men 1 1 1 1 0 0 — — — Women 0 0 0 0 1 3 — — — Mean Age — — — — — — — — — Mean Total Score — — — — — — — — —
Guam
Total 23 24 22 34 14 12 100.0% 0.0% 0.0% Men 8 15 10 15 5 4 — — — Women 15 9 12 19 9 8 — — — Mean Age 30.5 31.3 28.0 28.2 28.4 28.2 28.2 — — Mean Total Score 422 379 412 434 384 378 378 — —
Guatemala
Total 54 57 40 49 38 100 73.0% 27.0% 0.0% Men 35 41 29 27 28 69 84.1% 15.9% 0.0% Women 19 16 11 22 10 31 48.4% 51.6% 0.0% Mean Age 26.9 25.4 25.8 25.8 25.7 26.1 26.8 24.2 — Mean Total Score 499 502 536 510 505 513 513 513 —
Guernsey
Total 1 1 1 0 1 0 — — — Men 1 1 1 0 1 0 — — — Women 0 0 0 0 0 0 — — — Mean Age — — — — — — — — — Mean Total Score — — — — — — — — —
Guinea
Total 0 0 1 1 0 0 — — — Men 0 0 0 1 0 0 — — — Women 0 0 1 0 0 0 — — — Mean Age — — — — — — — — — Mean Total Score — — — — — — — — —
Guinea—Bissau
Total 0 0 0 0 1 1 — — — Men 0 0 0 0 0 0 — — — Women 0 0 0 0 1 1 — — — Mean Age — — — — — — — — — Mean Total Score — — — — — — — — —
Guyana
Total 2 3 0 1 4 1 — — — Men 0 2 0 0 3 1 — — — Women 2 1 0 1 1 0 — — — Mean Age — — — — — — — — — Mean Total Score — — — — — — — — —
Haiti
Total 6 10 4 6 10 23 30.4% 0.0% 69.6% Men 4 4 4 4 6 5 — — — Women 2 6 0 2 4 18 11.1% 0.0% 88.9% Mean Age 29.7 26.9 — 28.2 29.1 29.4 — — 31.0 Mean Total Score 478 466 — 412 500 582 — — 591
Profile of GMAT® Testing: Residence, TY2013–TY2017
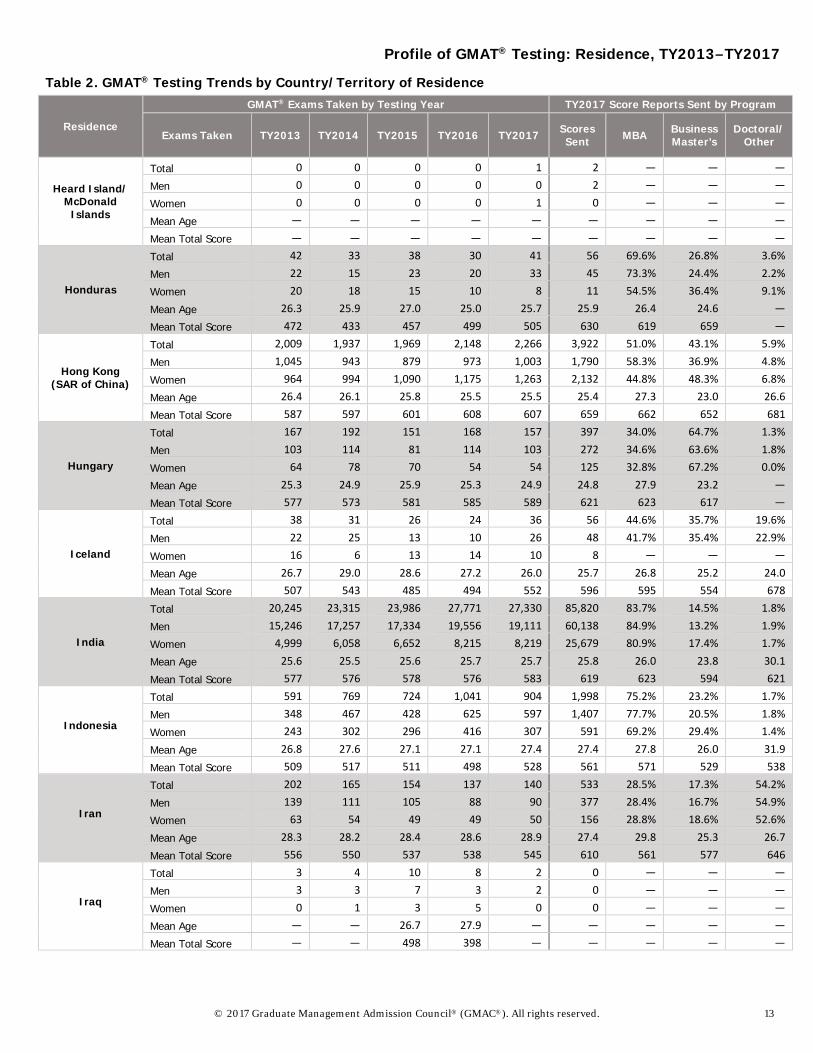
© 2017 Graduate Management Admission Council® (GMAC®). All rights reserved. 13
Table 2. GMAT® Testing Trends by Country/Territory of Residence
Residence
GMAT® Exams Taken by Testing Year TY2017 Score Reports Sent by Program
Exams Taken TY2013 TY2014 TY2015 TY2016 TY2017 Scores Sent MBA Business
Master’s Doctoral/
Other
Heard Island/ McDonald
Islands
Total 0 0 0 0 1 2 — — — Men 0 0 0 0 0 2 — — — Women 0 0 0 0 1 0 — — — Mean Age — — — — — — — — — Mean Total Score — — — — — — — — —
Honduras
Total 42 33 38 30 41 56 69.6% 26.8% 3.6% Men 22 15 23 20 33 45 73.3% 24.4% 2.2% Women 20 18 15 10 8 11 54.5% 36.4% 9.1% Mean Age 26.3 25.9 27.0 25.0 25.7 25.9 26.4 24.6 — Mean Total Score 472 433 457 499 505 630 619 659 —
Hong Kong (SAR of China)
Total 2,009 1,937 1,969 2,148 2,266 3,922 51.0% 43.1% 5.9% Men 1,045 943 879 973 1,003 1,790 58.3% 36.9% 4.8% Women 964 994 1,090 1,175 1,263 2,132 44.8% 48.3% 6.8% Mean Age 26.4 26.1 25.8 25.5 25.5 25.4 27.3 23.0 26.6 Mean Total Score 587 597 601 608 607 659 662 652 681
Hungary
Total 167 192 151 168 157 397 34.0% 64.7% 1.3% Men 103 114 81 114 103 272 34.6% 63.6% 1.8% Women 64 78 70 54 54 125 32.8% 67.2% 0.0% Mean Age 25.3 24.9 25.9 25.3 24.9 24.8 27.9 23.2 — Mean Total Score 577 573 581 585 589 621 623 617 —
Iceland
Total 38 31 26 24 36 56 44.6% 35.7% 19.6% Men 22 25 13 10 26 48 41.7% 35.4% 22.9% Women 16 6 13 14 10 8 — — — Mean Age 26.7 29.0 28.6 27.2 26.0 25.7 26.8 25.2 24.0 Mean Total Score 507 543 485 494 552 596 595 554 678
India
Total 20,245 23,315 23,986 27,771 27,330 85,820 83.7% 14.5% 1.8% Men 15,246 17,257 17,334 19,556 19,111 60,138 84.9% 13.2% 1.9% Women 4,999 6,058 6,652 8,215 8,219 25,679 80.9% 17.4% 1.7% Mean Age 25.6 25.5 25.6 25.7 25.7 25.8 26.0 23.8 30.1 Mean Total Score 577 576 578 576 583 619 623 594 621
Indonesia
Total 591 769 724 1,041 904 1,998 75.2% 23.2% 1.7% Men 348 467 428 625 597 1,407 77.7% 20.5% 1.8% Women 243 302 296 416 307 591 69.2% 29.4% 1.4% Mean Age 26.8 27.6 27.1 27.1 27.4 27.4 27.8 26.0 31.9 Mean Total Score 509 517 511 498 528 561 571 529 538
Iran
Total 202 165 154 137 140 533 28.5% 17.3% 54.2% Men 139 111 105 88 90 377 28.4% 16.7% 54.9% Women 63 54 49 49 50 156 28.8% 18.6% 52.6% Mean Age 28.3 28.2 28.4 28.6 28.9 27.4 29.8 25.3 26.7 Mean Total Score 556 550 537 538 545 610 561 577 646
Iraq
Total 3 4 10 8 2 0 — — — Men 3 3 7 3 2 0 — — — Women 0 1 3 5 0 0 — — — Mean Age — — 26.7 27.9 — — — — — Mean Total Score — — 498 398 — — — — —
Profile of GMAT® Testing: Residence, TY2013–TY2017
14 © 2017 Graduate Management Admission Council® (GMAC®). All rights reserved.
Table 2. GMAT® Testing Trends by Country/Territory of Residence
Residence
GMAT® Exams Taken by Testing Year TY2017 Score Reports Sent by Program
Exams Taken TY2013 TY2014 TY2015 TY2016 TY2017 Scores Sent MBA Business
Master’s Doctoral/
Other
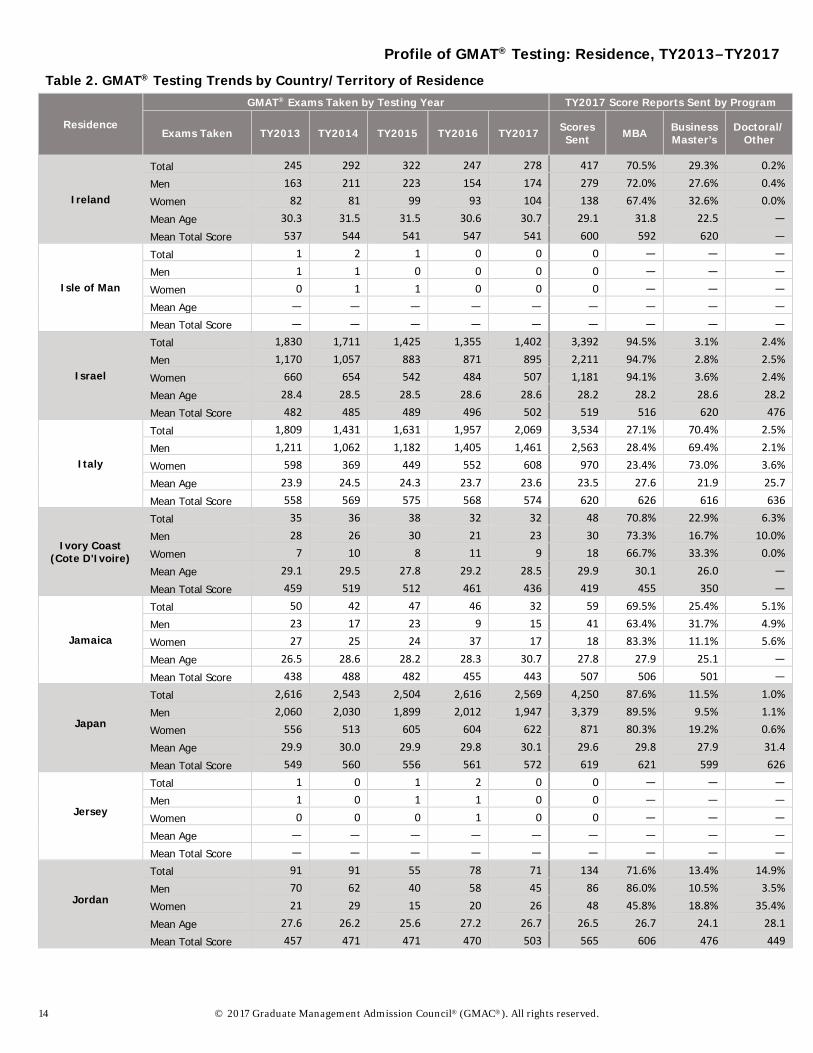
Ireland
Total 245 292 322 247 278 417 70.5% 29.3% 0.2% Men 163 211 223 154 174 279 72.0% 27.6% 0.4% Women 82 81 99 93 104 138 67.4% 32.6% 0.0% Mean Age 30.3 31.5 31.5 30.6 30.7 29.1 31.8 22.5 — Mean Total Score 537 544 541 547 541 600 592 620 —
Isle of Man
Total 1 2 1 0 0 0 — — — Men 1 1 0 0 0 0 — — — Women 0 1 1 0 0 0 — — — Mean Age — — — — — — — — — Mean Total Score — — — — — — — — —
Israel
Total 1,830 1,711 1,425 1,355 1,402 3,392 94.5% 3.1% 2.4% Men 1,170 1,057 883 871 895 2,211 94.7% 2.8% 2.5% Women 660 654 542 484 507 1,181 94.1% 3.6% 2.4% Mean Age 28.4 28.5 28.5 28.6 28.6 28.2 28.2 28.6 28.2 Mean Total Score 482 485 489 496 502 519 516 620 476
Italy
Total 1,809 1,431 1,631 1,957 2,069 3,534 27.1% 70.4% 2.5% Men 1,211 1,062 1,182 1,405 1,461 2,563 28.4% 69.4% 2.1% Women 598 369 449 552 608 970 23.4% 73.0% 3.6% Mean Age 23.9 24.5 24.3 23.7 23.6 23.5 27.6 21.9 25.7 Mean Total Score 558 569 575 568 574 620 626 616 636
Ivory Coast (Cote D'Ivoire)
Total 35 36 38 32 32 48 70.8% 22.9% 6.3% Men 28 26 30 21 23 30 73.3% 16.7% 10.0% Women 7 10 8 11 9 18 66.7% 33.3% 0.0% Mean Age 29.1 29.5 27.8 29.2 28.5 29.9 30.1 26.0 — Mean Total Score 459 519 512 461 436 419 455 350 —
Jamaica
Total 50 42 47 46 32 59 69.5% 25.4% 5.1% Men 23 17 23 9 15 41 63.4% 31.7% 4.9% Women 27 25 24 37 17 18 83.3% 11.1% 5.6% Mean Age 26.5 28.6 28.2 28.3 30.7 27.8 27.9 25.1 — Mean Total Score 438 488 482 455 443 507 506 501 —
Japan
Total 2,616 2,543 2,504 2,616 2,569 4,250 87.6% 11.5% 1.0% Men 2,060 2,030 1,899 2,012 1,947 3,379 89.5% 9.5% 1.1% Women 556 513 605 604 622 871 80.3% 19.2% 0.6% Mean Age 29.9 30.0 29.9 29.8 30.1 29.6 29.8 27.9 31.4 Mean Total Score 549 560 556 561 572 619 621 599 626
Jersey
Total 1 0 1 2 0 0 — — — Men 1 0 1 1 0 0 — — — Women 0 0 0 1 0 0 — — — Mean Age — — — — — — — — — Mean Total Score — — — — — — — — —
Jordan
Total 91 91 55 78 71 134 71.6% 13.4% 14.9% Men 70 62 40 58 45 86 86.0% 10.5% 3.5% Women 21 29 15 20 26 48 45.8% 18.8% 35.4% Mean Age 27.6 26.2 25.6 27.2 26.7 26.5 26.7 24.1 28.1 Mean Total Score 457 471 471 470 503 565 606 476 449
Profile of GMAT® Testing: Residence, TY2013–TY2017
© 2017 Graduate Management Admission Council® (GMAC®). All rights reserved. 15
Table 2. GMAT® Testing Trends by Country/Territory of Residence
Residence
GMAT® Exams Taken by Testing Year TY2017 Score Reports Sent by Program
Exams Taken TY2013 TY2014 TY2015 TY2016 TY2017 Scores Sent MBA Business
Master’s Doctoral/
Other
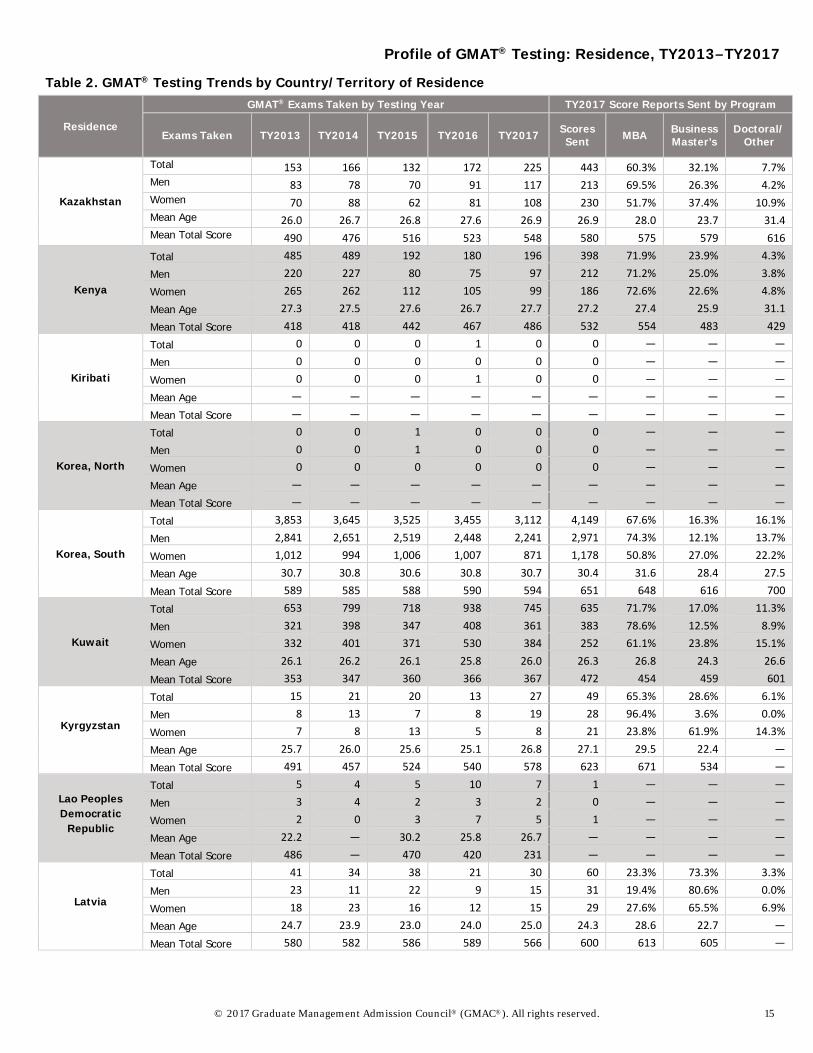
Kazakhstan
Total 153 166 132 172 225 443 60.3% 32.1% 7.7% Men 83 78 70 91 117 213 69.5% 26.3% 4.2% Women 70 88 62 81 108 230 51.7% 37.4% 10.9% Mean Age 26.0 26.7 26.8 27.6 26.9 26.9 28.0 23.7 31.4 Mean Total Score 490 476 516 523 548 580 575 579 616
Kenya
Total 485 489 192 180 196 398 71.9% 23.9% 4.3% Men 220 227 80 75 97 212 71.2% 25.0% 3.8% Women 265 262 112 105 99 186 72.6% 22.6% 4.8% Mean Age 27.3 27.5 27.6 26.7 27.7 27.2 27.4 25.9 31.1 Mean Total Score 418 418 442 467 486 532 554 483 429
Kiribati
Total 0 0 0 1 0 0 — — — Men 0 0 0 0 0 0 — — — Women 0 0 0 1 0 0 — — — Mean Age — — — — — — — — — Mean Total Score — — — — — — — — —
Korea, North
Total 0 0 1 0 0 0 — — — Men 0 0 1 0 0 0 — — — Women 0 0 0 0 0 0 — — — Mean Age — — — — — — — — — Mean Total Score — — — — — — — — —
Korea, South
Total 3,853 3,645 3,525 3,455 3,112 4,149 67.6% 16.3% 16.1% Men 2,841 2,651 2,519 2,448 2,241 2,971 74.3% 12.1% 13.7% Women 1,012 994 1,006 1,007 871 1,178 50.8% 27.0% 22.2% Mean Age 30.7 30.8 30.6 30.8 30.7 30.4 31.6 28.4 27.5 Mean Total Score 589 585 588 590 594 651 648 616 700
Kuwait
Total 653 799 718 938 745 635 71.7% 17.0% 11.3% Men 321 398 347 408 361 383 78.6% 12.5% 8.9% Women 332 401 371 530 384 252 61.1% 23.8% 15.1% Mean Age 26.1 26.2 26.1 25.8 26.0 26.3 26.8 24.3 26.6 Mean Total Score 353 347 360 366 367 472 454 459 601
Kyrgyzstan
Total 15 21 20 13 27 49 65.3% 28.6% 6.1% Men 8 13 7 8 19 28 96.4% 3.6% 0.0% Women 7 8 13 5 8 21 23.8% 61.9% 14.3% Mean Age 25.7 26.0 25.6 25.1 26.8 27.1 29.5 22.4 — Mean Total Score 491 457 524 540 578 623 671 534 —
Lao Peoples Democratic
Republic
Total 5 4 5 10 7 1 — — — Men 3 4 2 3 2 0 — — — Women 2 0 3 7 5 1 — — — Mean Age 22.2 — 30.2 25.8 26.7 — — — — Mean Total Score 486 — 470 420 231 — — — —
Latvia
Total 41 34 38 21 30 60 23.3% 73.3% 3.3% Men 23 11 22 9 15 31 19.4% 80.6% 0.0% Women 18 23 16 12 15 29 27.6% 65.5% 6.9% Mean Age 24.7 23.9 23.0 24.0 25.0 24.3 28.6 22.7 — Mean Total Score 580 582 586 589 566 600 613 605 —
Profile of GMAT® Testing: Residence, TY2013–TY2017
16 © 2017 Graduate Management Admission Council® (GMAC®). All rights reserved.
Table 2. GMAT® Testing Trends by Country/Territory of Residence
Residence
GMAT® Exams Taken by Testing Year TY2017 Score Reports Sent by Program
Exams Taken TY2013 TY2014 TY2015 TY2016 TY2017 Scores Sent MBA Business
Master’s Doctoral/
Other
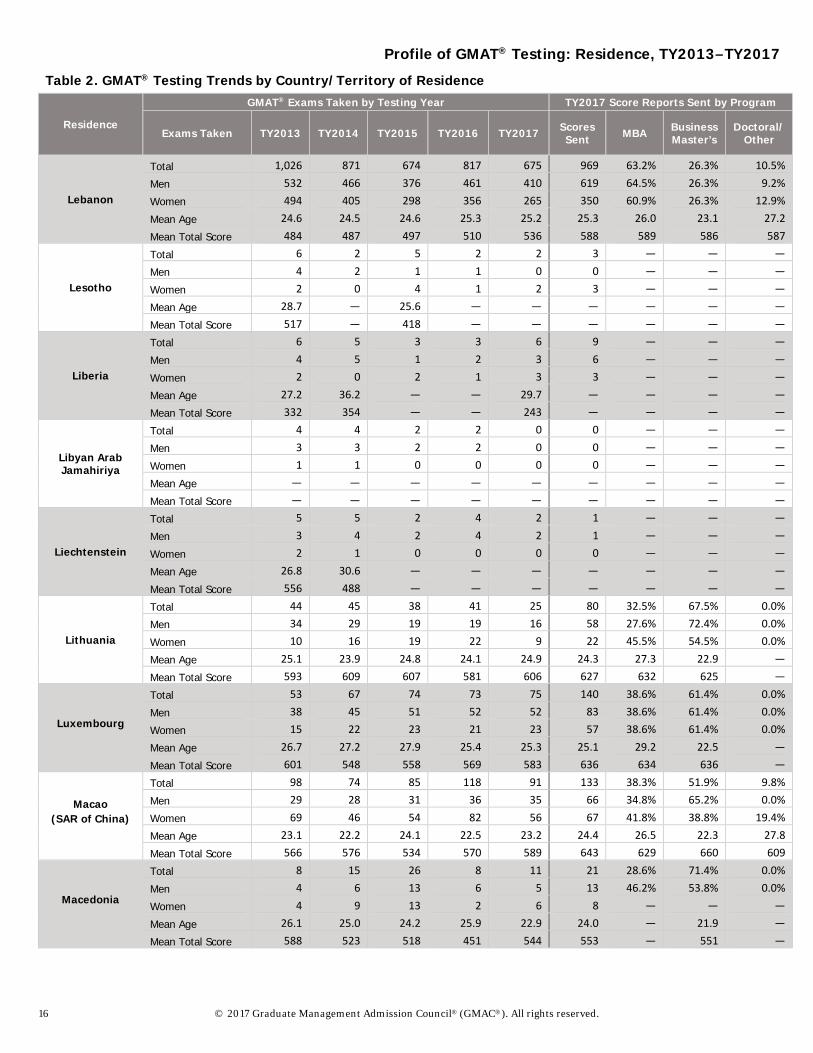
Lebanon
Total 1,026 871 674 817 675 969 63.2% 26.3% 10.5% Men 532 466 376 461 410 619 64.5% 26.3% 9.2% Women 494 405 298 356 265 350 60.9% 26.3% 12.9% Mean Age 24.6 24.5 24.6 25.3 25.2 25.3 26.0 23.1 27.2 Mean Total Score 484 487 497 510 536 588 589 586 587
Lesotho
Total 6 2 5 2 2 3 — — — Men 4 2 1 1 0 0 — — — Women 2 0 4 1 2 3 — — — Mean Age 28.7 — 25.6 — — — — — — Mean Total Score 517 — 418 — — — — — —
Liberia
Total 6 5 3 3 6 9 — — — Men 4 5 1 2 3 6 — — — Women 2 0 2 1 3 3 — — — Mean Age 27.2 36.2 — — 29.7 — — — — Mean Total Score 332 354 — — 243 — — — —
Libyan Arab Jamahiriya
Total 4 4 2 2 0 0 — — — Men 3 3 2 2 0 0 — — — Women 1 1 0 0 0 0 — — — Mean Age — — — — — — — — — Mean Total Score — — — — — — — — —
Liechtenstein
Total 5 5 2 4 2 1 — — — Men 3 4 2 4 2 1 — — — Women 2 1 0 0 0 0 — — — Mean Age 26.8 30.6 — — — — — — — Mean Total Score 556 488 — — — — — — —
Lithuania
Total 44 45 38 41 25 80 32.5% 67.5% 0.0% Men 34 29 19 19 16 58 27.6% 72.4% 0.0% Women 10 16 19 22 9 22 45.5% 54.5% 0.0% Mean Age 25.1 23.9 24.8 24.1 24.9 24.3 27.3 22.9 — Mean Total Score 593 609 607 581 606 627 632 625 —
Luxembourg
Total 53 67 74 73 75 140 38.6% 61.4% 0.0% Men 38 45 51 52 52 83 38.6% 61.4% 0.0% Women 15 22 23 21 23 57 38.6% 61.4% 0.0% Mean Age 26.7 27.2 27.9 25.4 25.3 25.1 29.2 22.5 — Mean Total Score 601 548 558 569 583 636 634 636 —
Macao (SAR of China)
Total 98 74 85 118 91 133 38.3% 51.9% 9.8% Men 29 28 31 36 35 66 34.8% 65.2% 0.0% Women 69 46 54 82 56 67 41.8% 38.8% 19.4% Mean Age 23.1 22.2 24.1 22.5 23.2 24.4 26.5 22.3 27.8 Mean Total Score 566 576 534 570 589 643 629 660 609
Macedonia
Total 8 15 26 8 11 21 28.6% 71.4% 0.0% Men 4 6 13 6 5 13 46.2% 53.8% 0.0% Women 4 9 13 2 6 8 — — — Mean Age 26.1 25.0 24.2 25.9 22.9 24.0 — 21.9 — Mean Total Score 588 523 518 451 544 553 — 551 —
Profile of GMAT® Testing: Residence, TY2013–TY2017
© 2017 Graduate Management Admission Council® (GMAC®). All rights reserved. 17
Table 2. GMAT® Testing Trends by Country/Territory of Residence
Residence
GMAT® Exams Taken by Testing Year TY2017 Score Reports Sent by Program
Exams Taken TY2013 TY2014 TY2015 TY2016 TY2017 Scores Sent MBA Business
Master’s Doctoral/
Other
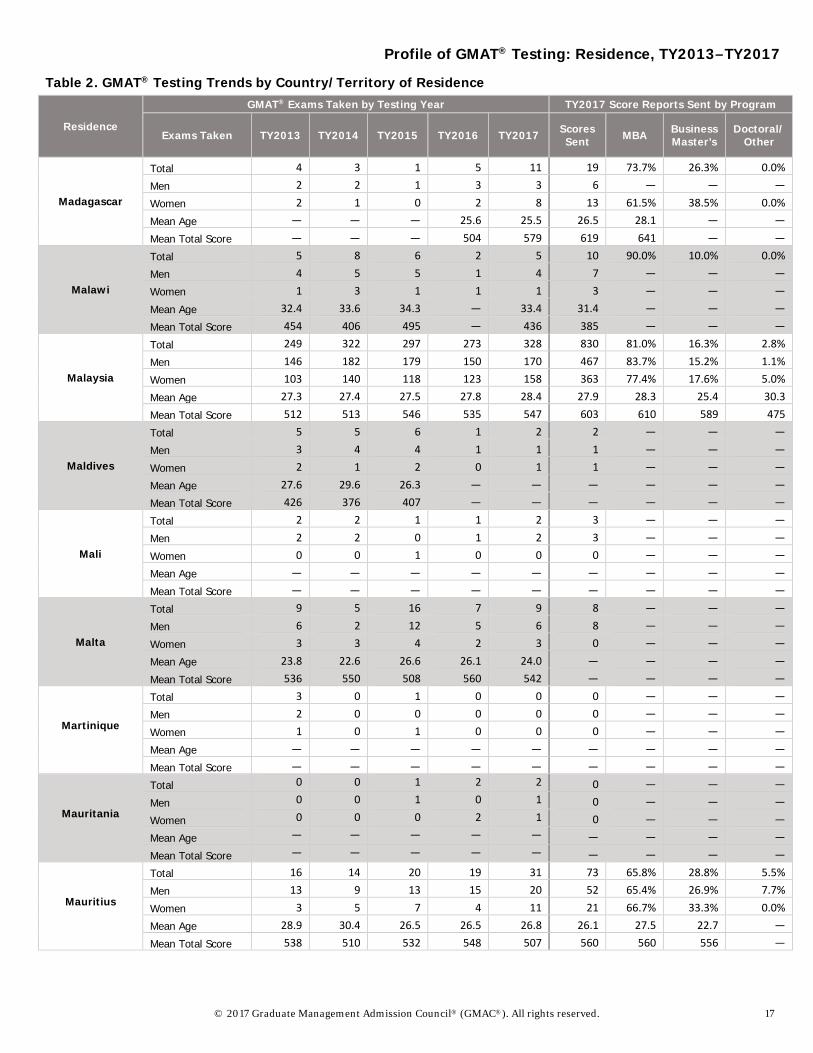
Madagascar
Total 4 3 1 5 11 19 73.7% 26.3% 0.0% Men 2 2 1 3 3 6 — — — Women 2 1 0 2 8 13 61.5% 38.5% 0.0% Mean Age — — — 25.6 25.5 26.5 28.1 — — Mean Total Score — — — 504 579 619 641 — —
Malawi
Total 5 8 6 2 5 10 90.0% 10.0% 0.0% Men 4 5 5 1 4 7 — — — Women 1 3 1 1 1 3 — — — Mean Age 32.4 33.6 34.3 — 33.4 31.4 — — — Mean Total Score 454 406 495 — 436 385 — — —
Malaysia
Total 249 322 297 273 328 830 81.0% 16.3% 2.8% Men 146 182 179 150 170 467 83.7% 15.2% 1.1% Women 103 140 118 123 158 363 77.4% 17.6% 5.0% Mean Age 27.3 27.4 27.5 27.8 28.4 27.9 28.3 25.4 30.3 Mean Total Score 512 513 546 535 547 603 610 589 475
Maldives
Total 5 5 6 1 2 2 — — — Men 3 4 4 1 1 1 — — — Women 2 1 2 0 1 1 — — — Mean Age 27.6 29.6 26.3 — — — — — — Mean Total Score 426 376 407 — — — — — —
Mali
Total 2 2 1 1 2 3 — — — Men 2 2 0 1 2 3 — — — Women 0 0 1 0 0 0 — — — Mean Age — — — — — — — — — Mean Total Score — — — — — — — — —
Malta
Total 9 5 16 7 9 8 — — — Men 6 2 12 5 6 8 — — — Women 3 3 4 2 3 0 — — — Mean Age 23.8 22.6 26.6 26.1 24.0 — — — — Mean Total Score 536 550 508 560 542 — — — —
Martinique
Total 3 0 1 0 0 0 — — — Men 2 0 0 0 0 0 — — — Women 1 0 1 0 0 0 — — — Mean Age — — — — — — — — — Mean Total Score — — — — — — — — —
Mauritania
Total 0 0 1 2 2 0 — — — Men 0 0 1 0 1 0 — — — Women 0 0 0 2 1 0 — — — Mean Age — — — — — — — — — Mean Total Score — — — — — — — — —
Mauritius
Total 16 14 20 19 31 73 65.8% 28.8% 5.5% Men 13 9 13 15 20 52 65.4% 26.9% 7.7% Women 3 5 7 4 11 21 66.7% 33.3% 0.0% Mean Age 28.9 30.4 26.5 26.5 26.8 26.1 27.5 22.7 — Mean Total Score 538 510 532 548 507 560 560 556 —
Profile of GMAT® Testing: Residence, TY2013–TY2017
18 © 2017 Graduate Management Admission Council® (GMAC®). All rights reserved.
Table 2. GMAT® Testing Trends by Country/Territory of Residence
Residence
GMAT® Exams Taken by Testing Year TY2017 Score Reports Sent by Program
Exams Taken TY2013 TY2014 TY2015 TY2016 TY2017 Scores Sent MBA Business
Master’s Doctoral/
Other
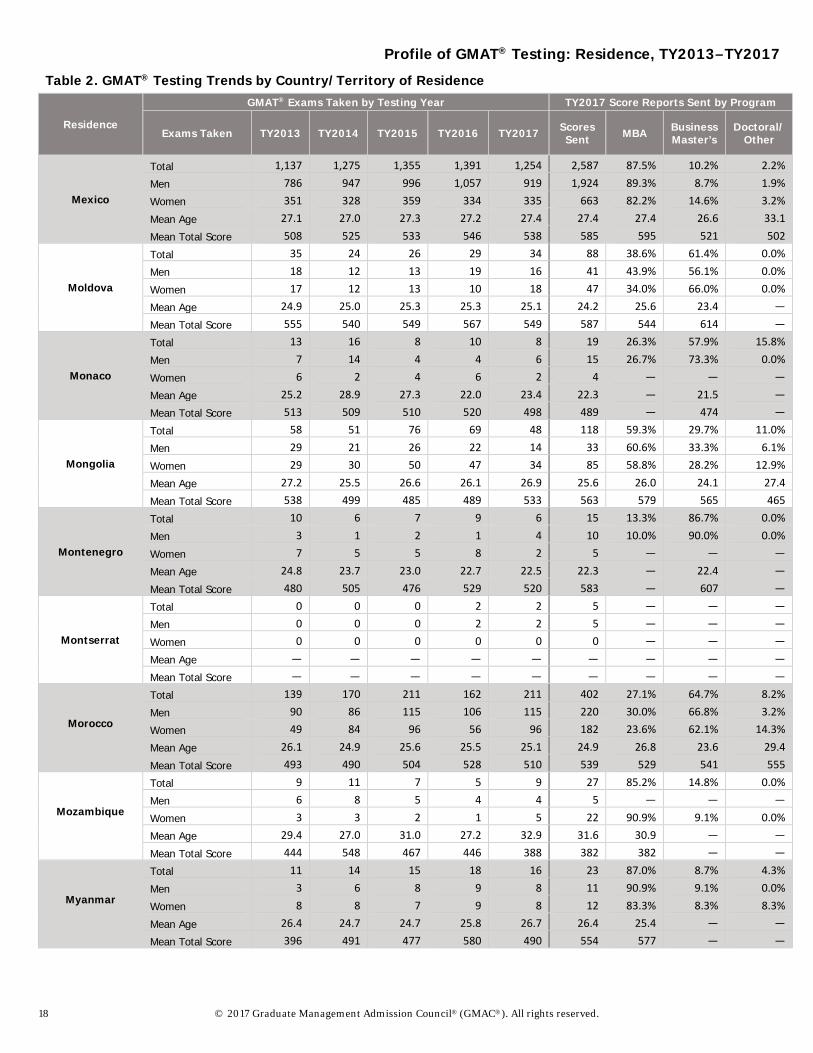
Mexico
Total 1,137 1,275 1,355 1,391 1,254 2,587 87.5% 10.2% 2.2% Men 786 947 996 1,057 919 1,924 89.3% 8.7% 1.9% Women 351 328 359 334 335 663 82.2% 14.6% 3.2% Mean Age 27.1 27.0 27.3 27.2 27.4 27.4 27.4 26.6 33.1 Mean Total Score 508 525 533 546 538 585 595 521 502
Moldova
Total 35 24 26 29 34 88 38.6% 61.4% 0.0% Men 18 12 13 19 16 41 43.9% 56.1% 0.0% Women 17 12 13 10 18 47 34.0% 66.0% 0.0% Mean Age 24.9 25.0 25.3 25.3 25.1 24.2 25.6 23.4 — Mean Total Score 555 540 549 567 549 587 544 614 —
Monaco
Total 13 16 8 10 8 19 26.3% 57.9% 15.8% Men 7 14 4 4 6 15 26.7% 73.3% 0.0% Women 6 2 4 6 2 4 — — — Mean Age 25.2 28.9 27.3 22.0 23.4 22.3 — 21.5 — Mean Total Score 513 509 510 520 498 489 — 474 —
Mongolia
Total 58 51 76 69 48 118 59.3% 29.7% 11.0% Men 29 21 26 22 14 33 60.6% 33.3% 6.1% Women 29 30 50 47 34 85 58.8% 28.2% 12.9% Mean Age 27.2 25.5 26.6 26.1 26.9 25.6 26.0 24.1 27.4 Mean Total Score 538 499 485 489 533 563 579 565 465
Montenegro
Total 10 6 7 9 6 15 13.3% 86.7% 0.0% Men 3 1 2 1 4 10 10.0% 90.0% 0.0% Women 7 5 5 8 2 5 — — — Mean Age 24.8 23.7 23.0 22.7 22.5 22.3 — 22.4 — Mean Total Score 480 505 476 529 520 583 — 607 —
Montserrat
Total 0 0 0 2 2 5 — — — Men 0 0 0 2 2 5 — — — Women 0 0 0 0 0 0 — — — Mean Age — — — — — — — — — Mean Total Score — — — — — — — — —
Morocco
Total 139 170 211 162 211 402 27.1% 64.7% 8.2% Men 90 86 115 106 115 220 30.0% 66.8% 3.2% Women 49 84 96 56 96 182 23.6% 62.1% 14.3% Mean Age 26.1 24.9 25.6 25.5 25.1 24.9 26.8 23.6 29.4 Mean Total Score 493 490 504 528 510 539 529 541 555
Mozambique
Total 9 11 7 5 9 27 85.2% 14.8% 0.0% Men 6 8 5 4 4 5 — — — Women 3 3 2 1 5 22 90.9% 9.1% 0.0% Mean Age 29.4 27.0 31.0 27.2 32.9 31.6 30.9 — — Mean Total Score 444 548 467 446 388 382 382 — —
Myanmar
Total 11 14 15 18 16 23 87.0% 8.7% 4.3% Men 3 6 8 9 8 11 90.9% 9.1% 0.0% Women 8 8 7 9 8 12 83.3% 8.3% 8.3% Mean Age 26.4 24.7 24.7 25.8 26.7 26.4 25.4 — — Mean Total Score 396 491 477 580 490 554 577 — —
Profile of GMAT® Testing: Residence, TY2013–TY2017
© 2017 Graduate Management Admission Council® (GMAC®). All rights reserved. 19
Table 2. GMAT® Testing Trends by Country/Territory of Residence
Residence
GMAT® Exams Taken by Testing Year TY2017 Score Reports Sent by Program
Exams Taken TY2013 TY2014 TY2015 TY2016 TY2017 Scores Sent MBA Business
Master’s Doctoral/
Other
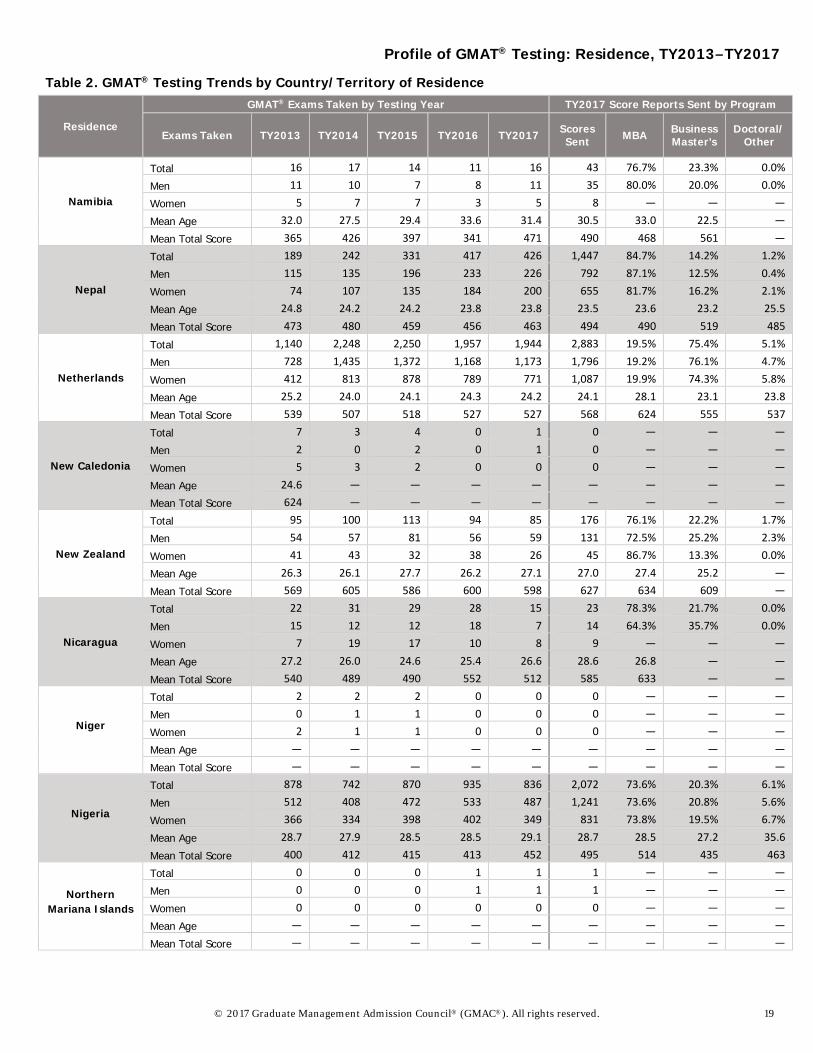
Namibia
Total 16 17 14 11 16 43 76.7% 23.3% 0.0% Men 11 10 7 8 11 35 80.0% 20.0% 0.0% Women 5 7 7 3 5 8 — — — Mean Age 32.0 27.5 29.4 33.6 31.4 30.5 33.0 22.5 — Mean Total Score 365 426 397 341 471 490 468 561 —
Nepal
Total 189 242 331 417 426 1,447 84.7% 14.2% 1.2% Men 115 135 196 233 226 792 87.1% 12.5% 0.4% Women 74 107 135 184 200 655 81.7% 16.2% 2.1% Mean Age 24.8 24.2 24.2 23.8 23.8 23.5 23.6 23.2 25.5 Mean Total Score 473 480 459 456 463 494 490 519 485
Netherlands
Total 1,140 2,248 2,250 1,957 1,944 2,883 19.5% 75.4% 5.1% Men 728 1,435 1,372 1,168 1,173 1,796 19.2% 76.1% 4.7% Women 412 813 878 789 771 1,087 19.9% 74.3% 5.8% Mean Age 25.2 24.0 24.1 24.3 24.2 24.1 28.1 23.1 23.8 Mean Total Score 539 507 518 527 527 568 624 555 537
New Caledonia
Total 7 3 4 0 1 0 — — — Men 2 0 2 0 1 0 — — — Women 5 3 2 0 0 0 — — — Mean Age 24.6 — — — — — — — — Mean Total Score 624 — — — — — — — —
New Zealand
Total 95 100 113 94 85 176 76.1% 22.2% 1.7% Men 54 57 81 56 59 131 72.5% 25.2% 2.3% Women 41 43 32 38 26 45 86.7% 13.3% 0.0% Mean Age 26.3 26.1 27.7 26.2 27.1 27.0 27.4 25.2 — Mean Total Score 569 605 586 600 598 627 634 609 —
Nicaragua
Total 22 31 29 28 15 23 78.3% 21.7% 0.0% Men 15 12 12 18 7 14 64.3% 35.7% 0.0% Women 7 19 17 10 8 9 — — — Mean Age 27.2 26.0 24.6 25.4 26.6 28.6 26.8 — — Mean Total Score 540 489 490 552 512 585 633 — —
Niger
Total 2 2 2 0 0 0 — — — Men 0 1 1 0 0 0 — — — Women 2 1 1 0 0 0 — — — Mean Age — — — — — — — — — Mean Total Score — — — — — — — — —
Nigeria
Total 878 742 870 935 836 2,072 73.6% 20.3% 6.1% Men 512 408 472 533 487 1,241 73.6% 20.8% 5.6% Women 366 334 398 402 349 831 73.8% 19.5% 6.7% Mean Age 28.7 27.9 28.5 28.5 29.1 28.7 28.5 27.2 35.6 Mean Total Score 400 412 415 413 452 495 514 435 463
Northern Mariana Islands
Total 0 0 0 1 1 1 — — — Men 0 0 0 1 1 1 — — — Women 0 0 0 0 0 0 — — — Mean Age — — — — — — — — — Mean Total Score — — — — — — — — —
Profile of GMAT® Testing: Residence, TY2013–TY2017
20 © 2017 Graduate Management Admission Council® (GMAC®). All rights reserved.
Table 2. GMAT® Testing Trends by Country/Territory of Residence
Residence
GMAT® Exams Taken by Testing Year TY2017 Score Reports Sent by Program
Exams Taken TY2013 TY2014 TY2015 TY2016 TY2017 Scores Sent MBA Business
Master’s Doctoral/
Other
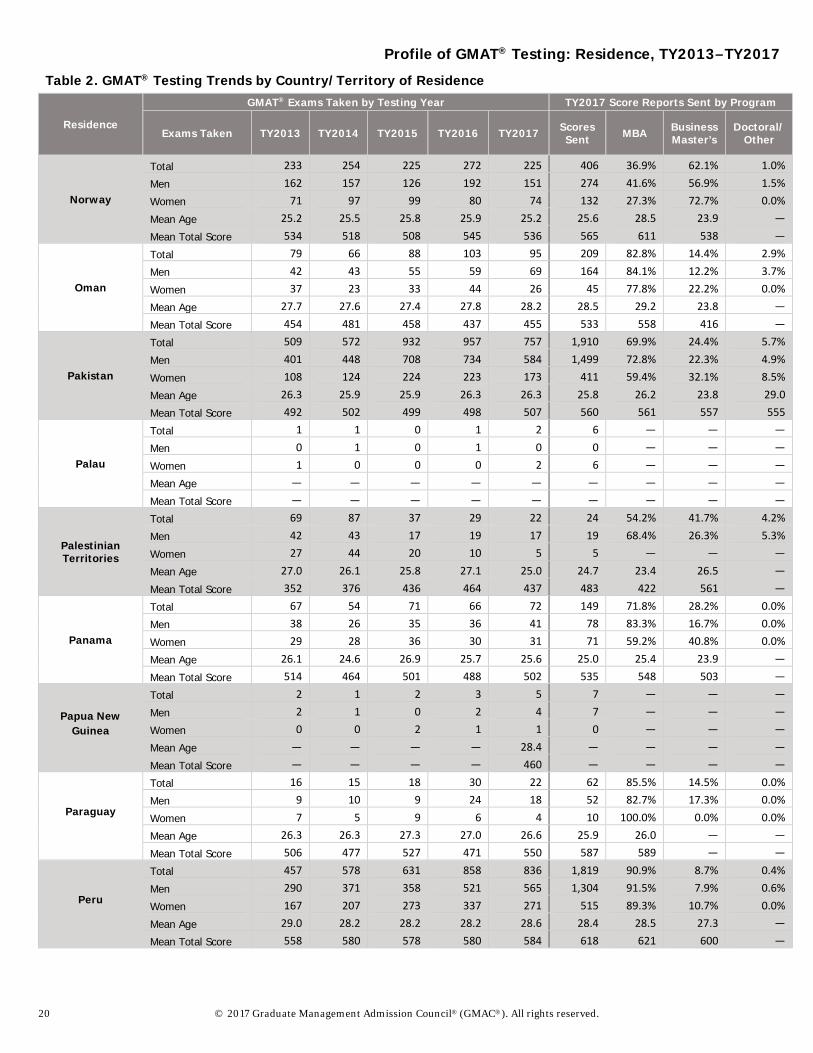
Norway
Total 233 254 225 272 225 406 36.9% 62.1% 1.0% Men 162 157 126 192 151 274 41.6% 56.9% 1.5% Women 71 97 99 80 74 132 27.3% 72.7% 0.0% Mean Age 25.2 25.5 25.8 25.9 25.2 25.6 28.5 23.9 — Mean Total Score 534 518 508 545 536 565 611 538 —
Oman
Total 79 66 88 103 95 209 82.8% 14.4% 2.9% Men 42 43 55 59 69 164 84.1% 12.2% 3.7% Women 37 23 33 44 26 45 77.8% 22.2% 0.0% Mean Age 27.7 27.6 27.4 27.8 28.2 28.5 29.2 23.8 — Mean Total Score 454 481 458 437 455 533 558 416 —
Pakistan
Total 509 572 932 957 757 1,910 69.9% 24.4% 5.7% Men 401 448 708 734 584 1,499 72.8% 22.3% 4.9% Women 108 124 224 223 173 411 59.4% 32.1% 8.5% Mean Age 26.3 25.9 25.9 26.3 26.3 25.8 26.2 23.8 29.0 Mean Total Score 492 502 499 498 507 560 561 557 555
Palau
Total 1 1 0 1 2 6 — — — Men 0 1 0 1 0 0 — — — Women 1 0 0 0 2 6 — — — Mean Age — — — — — — — — — Mean Total Score — — — — — — — — —
Palestinian Territories
Total 69 87 37 29 22 24 54.2% 41.7% 4.2% Men 42 43 17 19 17 19 68.4% 26.3% 5.3% Women 27 44 20 10 5 5 — — — Mean Age 27.0 26.1 25.8 27.1 25.0 24.7 23.4 26.5 — Mean Total Score 352 376 436 464 437 483 422 561 —
Panama
Total 67 54 71 66 72 149 71.8% 28.2% 0.0% Men 38 26 35 36 41 78 83.3% 16.7% 0.0% Women 29 28 36 30 31 71 59.2% 40.8% 0.0% Mean Age 26.1 24.6 26.9 25.7 25.6 25.0 25.4 23.9 — Mean Total Score 514 464 501 488 502 535 548 503 —
Papua New Guinea
Total 2 1 2 3 5 7 — — — Men 2 1 0 2 4 7 — — — Women 0 0 2 1 1 0 — — — Mean Age — — — — 28.4 — — — — Mean Total Score — — — — 460 — — — —
Paraguay
Total 16 15 18 30 22 62 85.5% 14.5% 0.0% Men 9 10 9 24 18 52 82.7% 17.3% 0.0% Women 7 5 9 6 4 10 100.0% 0.0% 0.0% Mean Age 26.3 26.3 27.3 27.0 26.6 25.9 26.0 — — Mean Total Score 506 477 527 471 550 587 589 — —
Peru
Total 457 578 631 858 836 1,819 90.9% 8.7% 0.4% Men 290 371 358 521 565 1,304 91.5% 7.9% 0.6% Women 167 207 273 337 271 515 89.3% 10.7% 0.0% Mean Age 29.0 28.2 28.2 28.2 28.6 28.4 28.5 27.3 — Mean Total Score 558 580 578 580 584 618 621 600 —
Profile of GMAT® Testing: Residence, TY2013–TY2017
© 2017 Graduate Management Admission Council® (GMAC®). All rights reserved. 21
Table 2. GMAT® Testing Trends by Country/Territory of Residence
Residence
GMAT® Exams Taken by Testing Year TY2017 Score Reports Sent by Program
Exams Taken TY2013 TY2014 TY2015 TY2016 TY2017 Scores Sent MBA Business
Master’s Doctoral/
Other
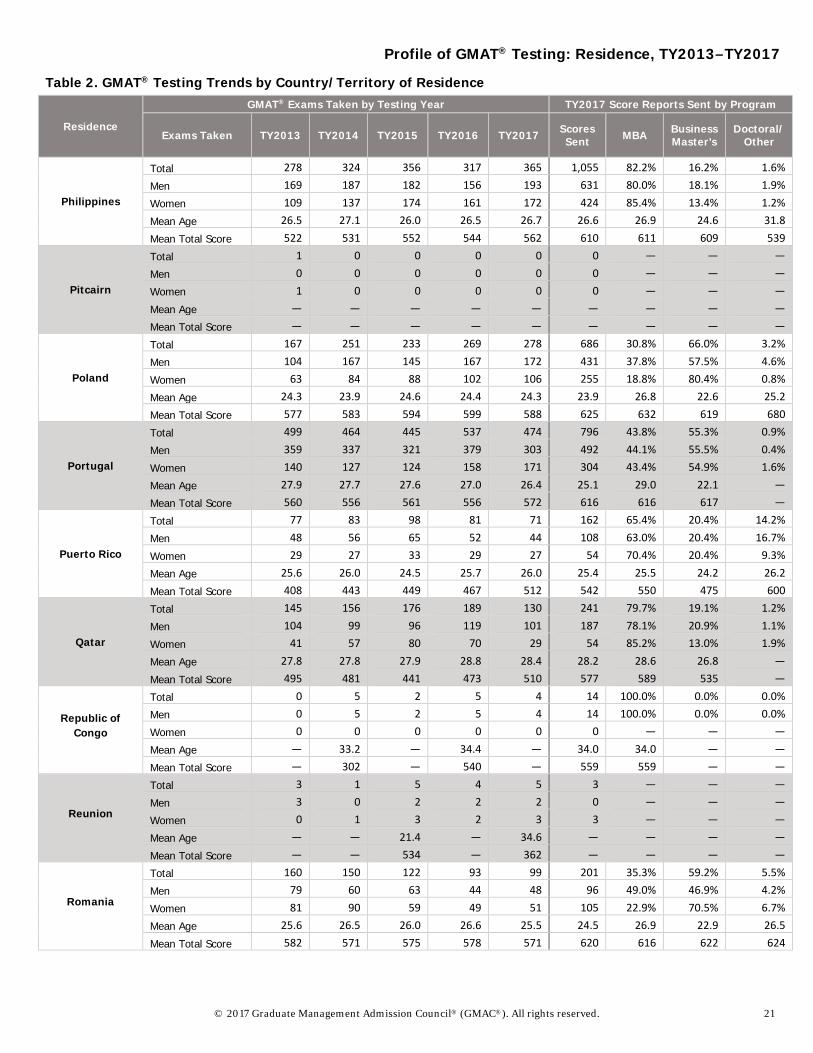
Philippines
Total 278 324 356 317 365 1,055 82.2% 16.2% 1.6% Men 169 187 182 156 193 631 80.0% 18.1% 1.9% Women 109 137 174 161 172 424 85.4% 13.4% 1.2% Mean Age 26.5 27.1 26.0 26.5 26.7 26.6 26.9 24.6 31.8 Mean Total Score 522 531 552 544 562 610 611 609 539
Pitcairn
Total 1 0 0 0 0 0 — — — Men 0 0 0 0 0 0 — — — Women 1 0 0 0 0 0 — — — Mean Age — — — — — — — — — Mean Total Score — — — — — — — — —
Poland
Total 167 251 233 269 278 686 30.8% 66.0% 3.2% Men 104 167 145 167 172 431 37.8% 57.5% 4.6% Women 63 84 88 102 106 255 18.8% 80.4% 0.8% Mean Age 24.3 23.9 24.6 24.4 24.3 23.9 26.8 22.6 25.2 Mean Total Score 577 583 594 599 588 625 632 619 680
Portugal
Total 499 464 445 537 474 796 43.8% 55.3% 0.9% Men 359 337 321 379 303 492 44.1% 55.5% 0.4% Women 140 127 124 158 171 304 43.4% 54.9% 1.6% Mean Age 27.9 27.7 27.6 27.0 26.4 25.1 29.0 22.1 — Mean Total Score 560 556 561 556 572 616 616 617 —
Puerto Rico
Total 77 83 98 81 71 162 65.4% 20.4% 14.2% Men 48 56 65 52 44 108 63.0% 20.4% 16.7% Women 29 27 33 29 27 54 70.4% 20.4% 9.3% Mean Age 25.6 26.0 24.5 25.7 26.0 25.4 25.5 24.2 26.2 Mean Total Score 408 443 449 467 512 542 550 475 600
Qatar
Total 145 156 176 189 130 241 79.7% 19.1% 1.2% Men 104 99 96 119 101 187 78.1% 20.9% 1.1% Women 41 57 80 70 29 54 85.2% 13.0% 1.9% Mean Age 27.8 27.8 27.9 28.8 28.4 28.2 28.6 26.8 — Mean Total Score 495 481 441 473 510 577 589 535 —
Republic of Congo
Total 0 5 2 5 4 14 100.0% 0.0% 0.0% Men 0 5 2 5 4 14 100.0% 0.0% 0.0% Women 0 0 0 0 0 0 — — — Mean Age — 33.2 — 34.4 — 34.0 34.0 — — Mean Total Score — 302 — 540 — 559 559 — —
Reunion
Total 3 1 5 4 5 3 — — — Men 3 0 2 2 2 0 — — — Women 0 1 3 2 3 3 — — — Mean Age — — 21.4 — 34.6 — — — — Mean Total Score — — 534 — 362 — — — —
Romania
Total 160 150 122 93 99 201 35.3% 59.2% 5.5% Men 79 60 63 44 48 96 49.0% 46.9% 4.2% Women 81 90 59 49 51 105 22.9% 70.5% 6.7% Mean Age 25.6 26.5 26.0 26.6 25.5 24.5 26.9 22.9 26.5 Mean Total Score 582 571 575 578 571 620 616 622 624
Profile of GMAT® Testing: Residence, TY2013–TY2017
22 © 2017 Graduate Management Admission Council® (GMAC®). All rights reserved.
Table 2. GMAT® Testing Trends by Country/Territory of Residence
Residence
GMAT® Exams Taken by Testing Year TY2017 Score Reports Sent by Program
Exams Taken TY2013 TY2014 TY2015 TY2016 TY2017 Scores Sent MBA Business
Master’s Doctoral/
Other
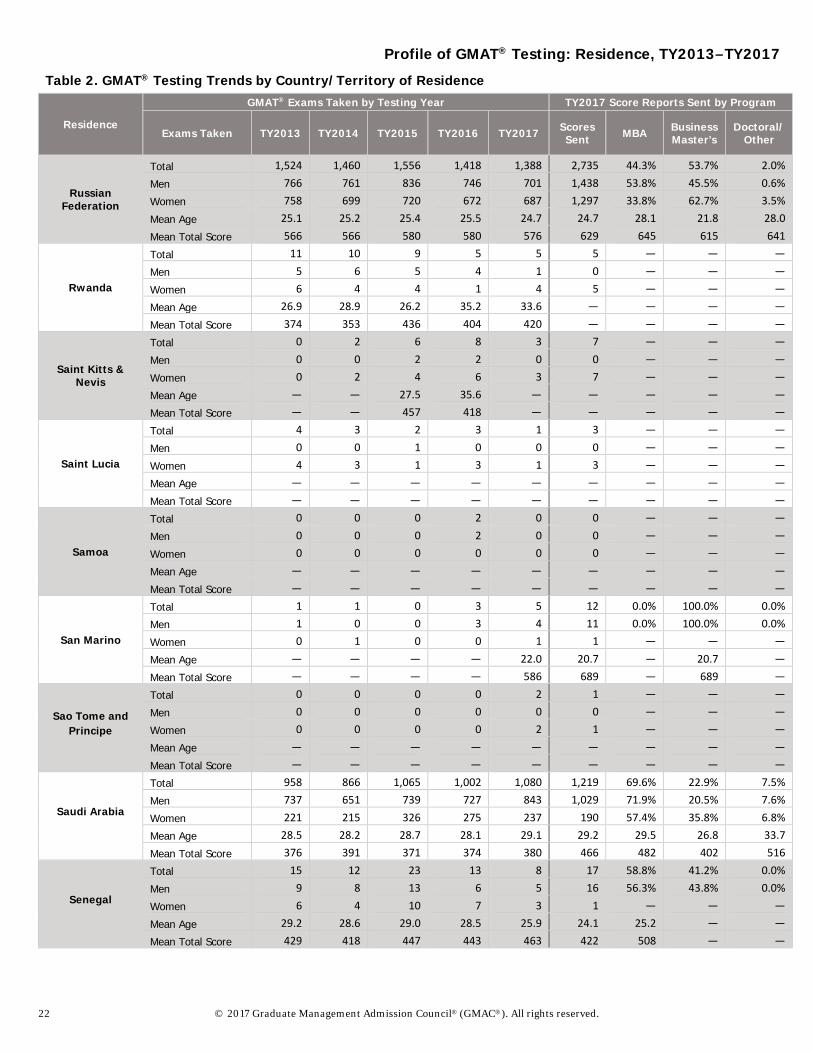
Russian Federation
Total 1,524 1,460 1,556 1,418 1,388 2,735 44.3% 53.7% 2.0% Men 766 761 836 746 701 1,438 53.8% 45.5% 0.6% Women 758 699 720 672 687 1,297 33.8% 62.7% 3.5% Mean Age 25.1 25.2 25.4 25.5 24.7 24.7 28.1 21.8 28.0 Mean Total Score 566 566 580 580 576 629 645 615 641
Rwanda
Total 11 10 9 5 5 5 — — — Men 5 6 5 4 1 0 — — — Women 6 4 4 1 4 5 — — — Mean Age 26.9 28.9 26.2 35.2 33.6 — — — — Mean Total Score 374 353 436 404 420 — — — —
Saint Kitts & Nevis
Total 0 2 6 8 3 7 — — — Men 0 0 2 2 0 0 — — — Women 0 2 4 6 3 7 — — — Mean Age — — 27.5 35.6 — — — — — Mean Total Score — — 457 418 — — — — —
Saint Lucia
Total 4 3 2 3 1 3 — — — Men 0 0 1 0 0 0 — — — Women 4 3 1 3 1 3 — — — Mean Age — — — — — — — — — Mean Total Score — — — — — — — — —
Samoa
Total 0 0 0 2 0 0 — — — Men 0 0 0 2 0 0 — — — Women 0 0 0 0 0 0 — — — Mean Age — — — — — — — — — Mean Total Score — — — — — — — — —
San Marino
Total 1 1 0 3 5 12 0.0% 100.0% 0.0% Men 1 0 0 3 4 11 0.0% 100.0% 0.0% Women 0 1 0 0 1 1 — — — Mean Age — — — — 22.0 20.7 — 20.7 — Mean Total Score — — — — 586 689 — 689 —
Sao Tome and Principe
Total 0 0 0 0 2 1 — — — Men 0 0 0 0 0 0 — — — Women 0 0 0 0 2 1 — — — Mean Age — — — — — — — — — Mean Total Score — — — — — — — — —
Saudi Arabia
Total 958 866 1,065 1,002 1,080 1,219 69.6% 22.9% 7.5% Men 737 651 739 727 843 1,029 71.9% 20.5% 7.6% Women 221 215 326 275 237 190 57.4% 35.8% 6.8% Mean Age 28.5 28.2 28.7 28.1 29.1 29.2 29.5 26.8 33.7 Mean Total Score 376 391 371 374 380 466 482 402 516
Senegal
Total 15 12 23 13 8 17 58.8% 41.2% 0.0% Men 9 8 13 6 5 16 56.3% 43.8% 0.0% Women 6 4 10 7 3 1 — — — Mean Age 29.2 28.6 29.0 28.5 25.9 24.1 25.2 — — Mean Total Score 429 418 447 443 463 422 508 — —
Profile of GMAT® Testing: Residence, TY2013–TY2017
© 2017 Graduate Management Admission Council® (GMAC®). All rights reserved. 23
Table 2. GMAT® Testing Trends by Country/Territory of Residence
Residence
GMAT® Exams Taken by Testing Year TY2017 Score Reports Sent by Program
Exams Taken TY2013 TY2014 TY2015 TY2016 TY2017 Scores Sent MBA Business
Master’s Doctoral/
Other
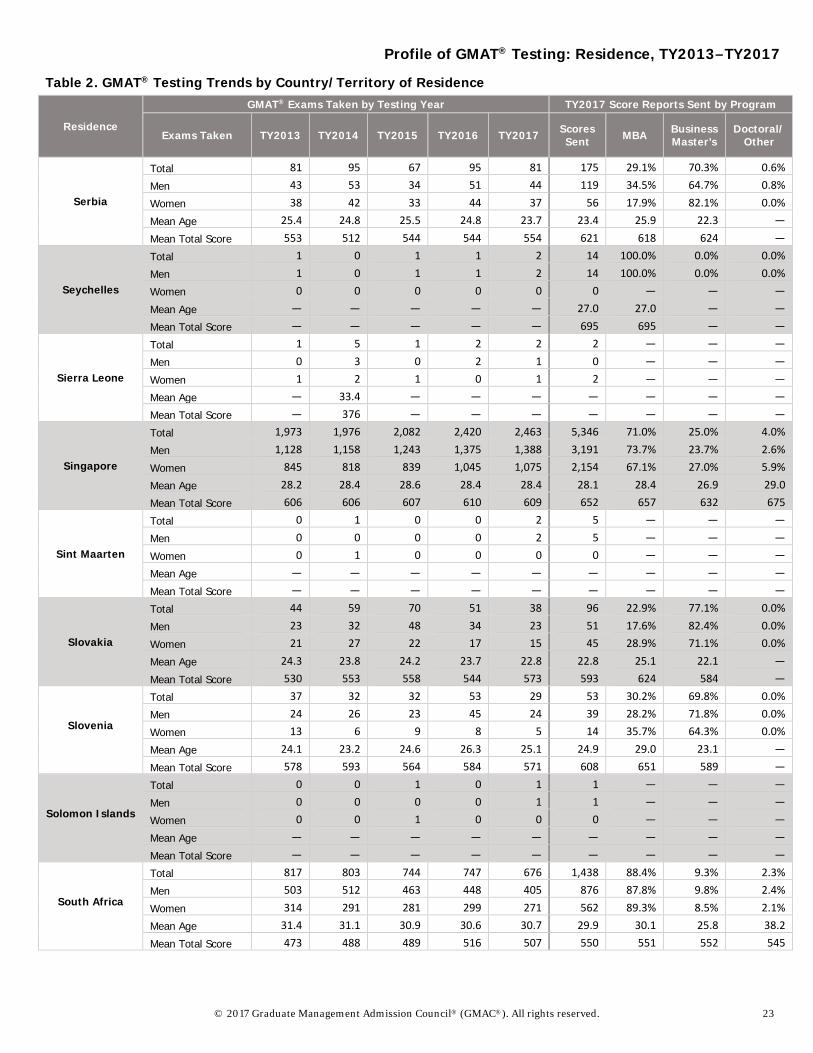
Serbia
Total 81 95 67 95 81 175 29.1% 70.3% 0.6% Men 43 53 34 51 44 119 34.5% 64.7% 0.8% Women 38 42 33 44 37 56 17.9% 82.1% 0.0% Mean Age 25.4 24.8 25.5 24.8 23.7 23.4 25.9 22.3 — Mean Total Score 553 512 544 544 554 621 618 624 —
Seychelles
Total 1 0 1 1 2 14 100.0% 0.0% 0.0% Men 1 0 1 1 2 14 100.0% 0.0% 0.0% Women 0 0 0 0 0 0 — — — Mean Age — — — — — 27.0 27.0 — — Mean Total Score — — — — — 695 695 — —
Sierra Leone
Total 1 5 1 2 2 2 — — — Men 0 3 0 2 1 0 — — — Women 1 2 1 0 1 2 — — — Mean Age — 33.4 — — — — — — — Mean Total Score — 376 — — — — — — —
Singapore
Total 1,973 1,976 2,082 2,420 2,463 5,346 71.0% 25.0% 4.0% Men 1,128 1,158 1,243 1,375 1,388 3,191 73.7% 23.7% 2.6% Women 845 818 839 1,045 1,075 2,154 67.1% 27.0% 5.9% Mean Age 28.2 28.4 28.6 28.4 28.4 28.1 28.4 26.9 29.0 Mean Total Score 606 606 607 610 609 652 657 632 675
Sint Maarten
Total 0 1 0 0 2 5 — — — Men 0 0 0 0 2 5 — — — Women 0 1 0 0 0 0 — — — Mean Age — — — — — — — — — Mean Total Score — — — — — — — — —
Slovakia
Total 44 59 70 51 38 96 22.9% 77.1% 0.0% Men 23 32 48 34 23 51 17.6% 82.4% 0.0% Women 21 27 22 17 15 45 28.9% 71.1% 0.0% Mean Age 24.3 23.8 24.2 23.7 22.8 22.8 25.1 22.1 — Mean Total Score 530 553 558 544 573 593 624 584 —
Slovenia
Total 37 32 32 53 29 53 30.2% 69.8% 0.0% Men 24 26 23 45 24 39 28.2% 71.8% 0.0% Women 13 6 9 8 5 14 35.7% 64.3% 0.0% Mean Age 24.1 23.2 24.6 26.3 25.1 24.9 29.0 23.1 — Mean Total Score 578 593 564 584 571 608 651 589 —
Solomon Islands
Total 0 0 1 0 1 1 — — — Men 0 0 0 0 1 1 — — — Women 0 0 1 0 0 0 — — — Mean Age — — — — — — — — — Mean Total Score — — — — — — — — —
South Africa
Total 817 803 744 747 676 1,438 88.4% 9.3% 2.3% Men 503 512 463 448 405 876 87.8% 9.8% 2.4% Women 314 291 281 299 271 562 89.3% 8.5% 2.1% Mean Age 31.4 31.1 30.9 30.6 30.7 29.9 30.1 25.8 38.2 Mean Total Score 473 488 489 516 507 550 551 552 545
Profile of GMAT® Testing: Residence, TY2013–TY2017
24 © 2017 Graduate Management Admission Council® (GMAC®). All rights reserved.
Table 2. GMAT® Testing Trends by Country/Territory of Residence
Residence
GMAT® Exams Taken by Testing Year TY2017 Score Reports Sent by Program
Exams Taken TY2013 TY2014 TY2015 TY2016 TY2017 Scores Sent MBA Business
Master’s Doctoral/
Other
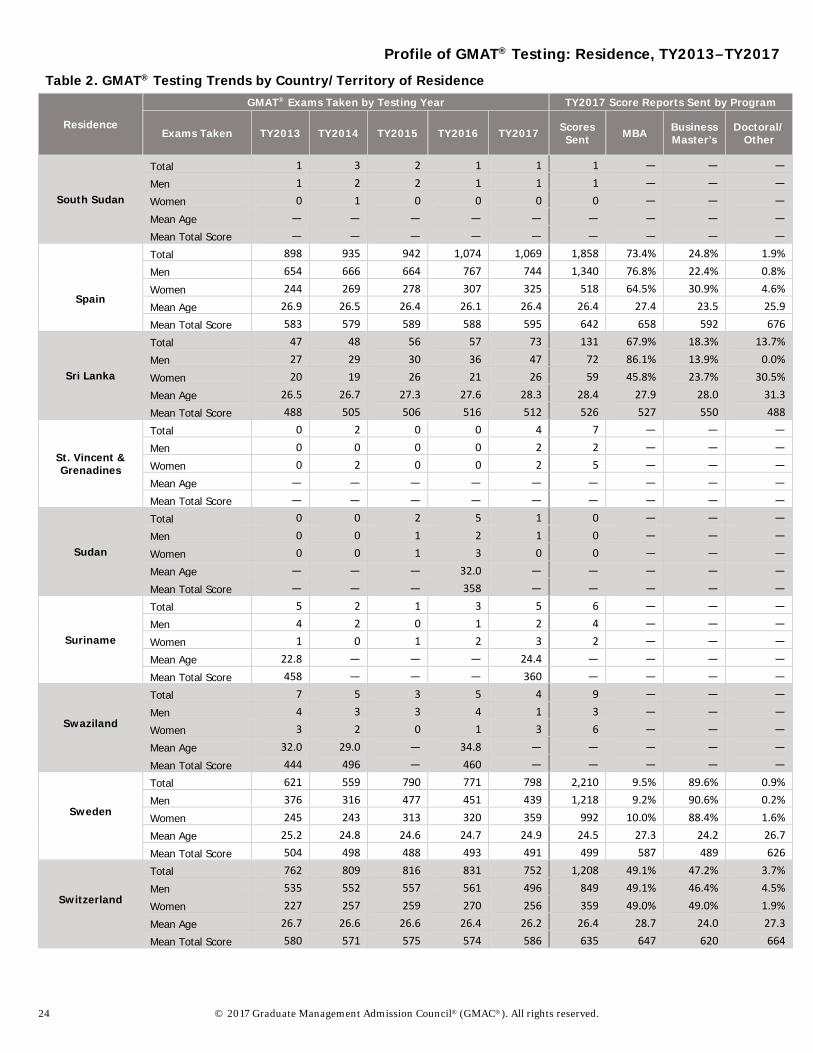
South Sudan
Total 1 3 2 1 1 1 — — — Men 1 2 2 1 1 1 — — — Women 0 1 0 0 0 0 — — — Mean Age — — — — — — — — — Mean Total Score — — — — — — — — —
Spain
Total 898 935 942 1,074 1,069 1,858 73.4% 24.8% 1.9% Men 654 666 664 767 744 1,340 76.8% 22.4% 0.8% Women 244 269 278 307 325 518 64.5% 30.9% 4.6% Mean Age 26.9 26.5 26.4 26.1 26.4 26.4 27.4 23.5 25.9 Mean Total Score 583 579 589 588 595 642 658 592 676
Sri Lanka
Total 47 48 56 57 73 131 67.9% 18.3% 13.7% Men 27 29 30 36 47 72 86.1% 13.9% 0.0% Women 20 19 26 21 26 59 45.8% 23.7% 30.5% Mean Age 26.5 26.7 27.3 27.6 28.3 28.4 27.9 28.0 31.3 Mean Total Score 488 505 506 516 512 526 527 550 488
St. Vincent & Grenadines
Total 0 2 0 0 4 7 — — — Men 0 0 0 0 2 2 — — — Women 0 2 0 0 2 5 — — — Mean Age — — — — — — — — — Mean Total Score — — — — — — — — —
Sudan
Total 0 0 2 5 1 0 — — — Men 0 0 1 2 1 0 — — — Women 0 0 1 3 0 0 — — — Mean Age — — — 32.0 — — — — — Mean Total Score — — — 358 — — — — —
Suriname
Total 5 2 1 3 5 6 — — — Men 4 2 0 1 2 4 — — — Women 1 0 1 2 3 2 — — — Mean Age 22.8 — — — 24.4 — — — — Mean Total Score 458 — — — 360 — — — —
Swaziland
Total 7 5 3 5 4 9 — — — Men 4 3 3 4 1 3 — — — Women 3 2 0 1 3 6 — — — Mean Age 32.0 29.0 — 34.8 — — — — — Mean Total Score 444 496 — 460 — — — — —
Sweden
Total 621 559 790 771 798 2,210 9.5% 89.6% 0.9% Men 376 316 477 451 439 1,218 9.2% 90.6% 0.2% Women 245 243 313 320 359 992 10.0% 88.4% 1.6% Mean Age 25.2 24.8 24.6 24.7 24.9 24.5 27.3 24.2 26.7 Mean Total Score 504 498 488 493 491 499 587 489 626
Switzerland
Total 762 809 816 831 752 1,208 49.1% 47.2% 3.7% Men 535 552 557 561 496 849 49.1% 46.4% 4.5% Women 227 257 259 270 256 359 49.0% 49.0% 1.9% Mean Age 26.7 26.6 26.6 26.4 26.2 26.4 28.7 24.0 27.3 Mean Total Score 580 571 575 574 586 635 647 620 664
Profile of GMAT® Testing: Residence, TY2013–TY2017
© 2017 Graduate Management Admission Council® (GMAC®). All rights reserved. 25
Table 2. GMAT® Testing Trends by Country/Territory of Residence
Residence
GMAT® Exams Taken by Testing Year TY2017 Score Reports Sent by Program
Exams Taken TY2013 TY2014 TY2015 TY2016 TY2017 Scores Sent MBA Business
Master’s Doctoral/
Other
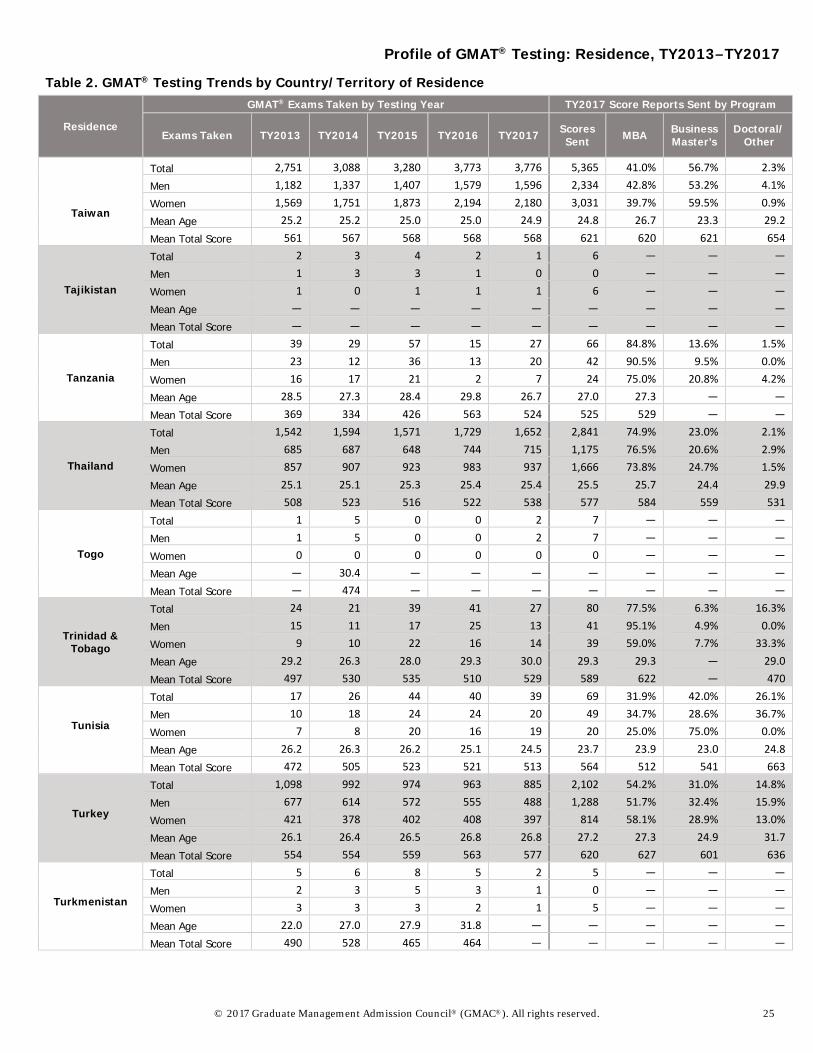
Taiwan
Total 2,751 3,088 3,280 3,773 3,776 5,365 41.0% 56.7% 2.3% Men 1,182 1,337 1,407 1,579 1,596 2,334 42.8% 53.2% 4.1% Women 1,569 1,751 1,873 2,194 2,180 3,031 39.7% 59.5% 0.9% Mean Age 25.2 25.2 25.0 25.0 24.9 24.8 26.7 23.3 29.2 Mean Total Score 561 567 568 568 568 621 620 621 654
Tajikistan
Total 2 3 4 2 1 6 — — — Men 1 3 3 1 0 0 — — — Women 1 0 1 1 1 6 — — — Mean Age — — — — — — — — — Mean Total Score — — — — — — — — —
Tanzania
Total 39 29 57 15 27 66 84.8% 13.6% 1.5% Men 23 12 36 13 20 42 90.5% 9.5% 0.0% Women 16 17 21 2 7 24 75.0% 20.8% 4.2% Mean Age 28.5 27.3 28.4 29.8 26.7 27.0 27.3 — — Mean Total Score 369 334 426 563 524 525 529 — —
Thailand
Total 1,542 1,594 1,571 1,729 1,652 2,841 74.9% 23.0% 2.1% Men 685 687 648 744 715 1,175 76.5% 20.6% 2.9% Women 857 907 923 983 937 1,666 73.8% 24.7% 1.5% Mean Age 25.1 25.1 25.3 25.4 25.4 25.5 25.7 24.4 29.9 Mean Total Score 508 523 516 522 538 577 584 559 531
Togo
Total 1 5 0 0 2 7 — — — Men 1 5 0 0 2 7 — — — Women 0 0 0 0 0 0 — — — Mean Age — 30.4 — — — — — — — Mean Total Score — 474 — — — — — — —
Trinidad & Tobago
Total 24 21 39 41 27 80 77.5% 6.3% 16.3% Men 15 11 17 25 13 41 95.1% 4.9% 0.0% Women 9 10 22 16 14 39 59.0% 7.7% 33.3% Mean Age 29.2 26.3 28.0 29.3 30.0 29.3 29.3 — 29.0 Mean Total Score 497 530 535 510 529 589 622 — 470
Tunisia
Total 17 26 44 40 39 69 31.9% 42.0% 26.1% Men 10 18 24 24 20 49 34.7% 28.6% 36.7% Women 7 8 20 16 19 20 25.0% 75.0% 0.0% Mean Age 26.2 26.3 26.2 25.1 24.5 23.7 23.9 23.0 24.8 Mean Total Score 472 505 523 521 513 564 512 541 663
Turkey
Total 1,098 992 974 963 885 2,102 54.2% 31.0% 14.8% Men 677 614 572 555 488 1,288 51.7% 32.4% 15.9% Women 421 378 402 408 397 814 58.1% 28.9% 13.0% Mean Age 26.1 26.4 26.5 26.8 26.8 27.2 27.3 24.9 31.7 Mean Total Score 554 554 559 563 577 620 627 601 636
Turkmenistan
Total 5 6 8 5 2 5 — — — Men 2 3 5 3 1 0 — — — Women 3 3 3 2 1 5 — — — Mean Age 22.0 27.0 27.9 31.8 — — — — — Mean Total Score 490 528 465 464 — — — — —
Profile of GMAT® Testing: Residence, TY2013–TY2017
26 © 2017 Graduate Management Admission Council® (GMAC®). All rights reserved.
Table 2. GMAT® Testing Trends by Country/Territory of Residence
Residence
GMAT® Exams Taken by Testing Year TY2017 Score Reports Sent by Program
Exams Taken TY2013 TY2014 TY2015 TY2016 TY2017 Scores Sent MBA Business
Master’s Doctoral/
Other
Turks & Caicos Islands
Total 0 1 0 1 1 0 — — — Men 0 0 0 0 1 0 — — — Women 0 1 0 1 0 0 — — — Mean Age — — — — — — — — — Mean Total Score — — — — — — — — —
Uganda
Total 58 52 62 55 40 127 74.0% 15.7% 10.2% Men 25 31 28 31 18 52 76.9% 13.5% 9.6% Women 33 21 34 24 22 75 72.0% 17.3% 10.7% Mean Age 28.3 28.8 29.3 29.0 28.5 28.5 28.0 26.7 35.0 Mean Total Score 406 405 413 436 428 423 444 362 370
Ukraine
Total 270 253 270 295 240 504 68.8% 26.8% 4.4% Men 153 135 155 179 128 316 74.7% 19.3% 6.0% Women 117 118 115 116 112 188 59.0% 39.4% 1.6% Mean Age 25.4 25.3 25.9 26.8 26.7 27.1 29.1 22.4 24.5 Mean Total Score 559 557 561 556 553 625 642 579 650
United Arab Emirates
Total 844 894 980 1,136 1,184 2,463 86.4% 11.2% 2.4% Men 593 626 641 750 763 1,715 88.2% 9.5% 2.3% Women 251 268 339 386 421 748 82.5% 15.0% 2.5% Mean Age 27.1 27.2 27.0 26.9 27.5 27.4 27.5 25.4 34.3 Mean Total Score 529 531 546 554 559 620 627 582 554
United Kingdom
Total 3,632 3,567 3,640 4,069 4,081 6,813 69.1% 28.3% 2.6% Men 2,331 2,175 2,171 2,380 2,394 4,324 73.1% 24.9% 1.9% Women 1,301 1,392 1,469 1,689 1,687 2,489 62.1% 34.2% 3.7% Mean Age 26.6 26.5 26.1 26.0 25.8 26.7 28.2 22.7 28.1 Mean Total Score 584 584 589 590 600 652 663 629 591
United States
Total 113,434 110,878 108,740 109,376 103,836 221,143 73.4% 23.4% 3.2% Men 67,352 65,372 63,760 63,451 60,195 136,229 77.2% 20.0% 2.8% Women 46,082 45,506 44,980 45,916 43,641 84,890 67.3% 28.9% 3.8% Mean Age 26.6 26.5 26.4 26.3 26.1 26.2 26.8 24.0 29.1 Mean Total Score 528 532 536 542 549 584 593 551 622
Uruguay
Total 35 42 43 48 52 161 80.1% 14.9% 5.0% Men 21 23 28 37 37 116 85.3% 7.8% 6.9% Women 14 19 15 11 15 45 66.7% 33.3% 0.0% Mean Age 28.0 27.0 27.7 27.4 28.4 27.5 27.3 27.0 — Mean Total Score 579 601 579 559 596 629 632 601 —
US Minor Outlying Islands
Total 2 1 2 5 0 0 — — — Men 1 1 0 1 0 0 — — — Women 1 0 2 4 0 0 — — — Mean Age — — — 21.8 — — — — — Mean Total Score — — — 500 — — — — —
Uzbekistan
Total 42 53 75 79 89 243 68.7% 23.9% 7.4% Men 33 44 60 61 73 210 67.1% 26.7% 6.2% Women 9 9 15 18 16 33 78.8% 6.1% 15.2% Mean Age 27.2 26.5 25.2 25.7 26.5 26.7 27.7 23.3 28.1 Mean Total Score 529 562 588 569 586 640 650 632 567
Profile of GMAT® Testing: Residence, TY2013–TY2017
© 2017 Graduate Management Admission Council® (GMAC®). All rights reserved. 27
Table 2. GMAT® Testing Trends by Country/Territory of Residence
Residence
GMAT® Exams Taken by Testing Year TY2017 Score Reports Sent by Program
Exams Taken TY2013 TY2014 TY2015 TY2016 TY2017 Scores Sent MBA Business
Master’s Doctoral/
Other
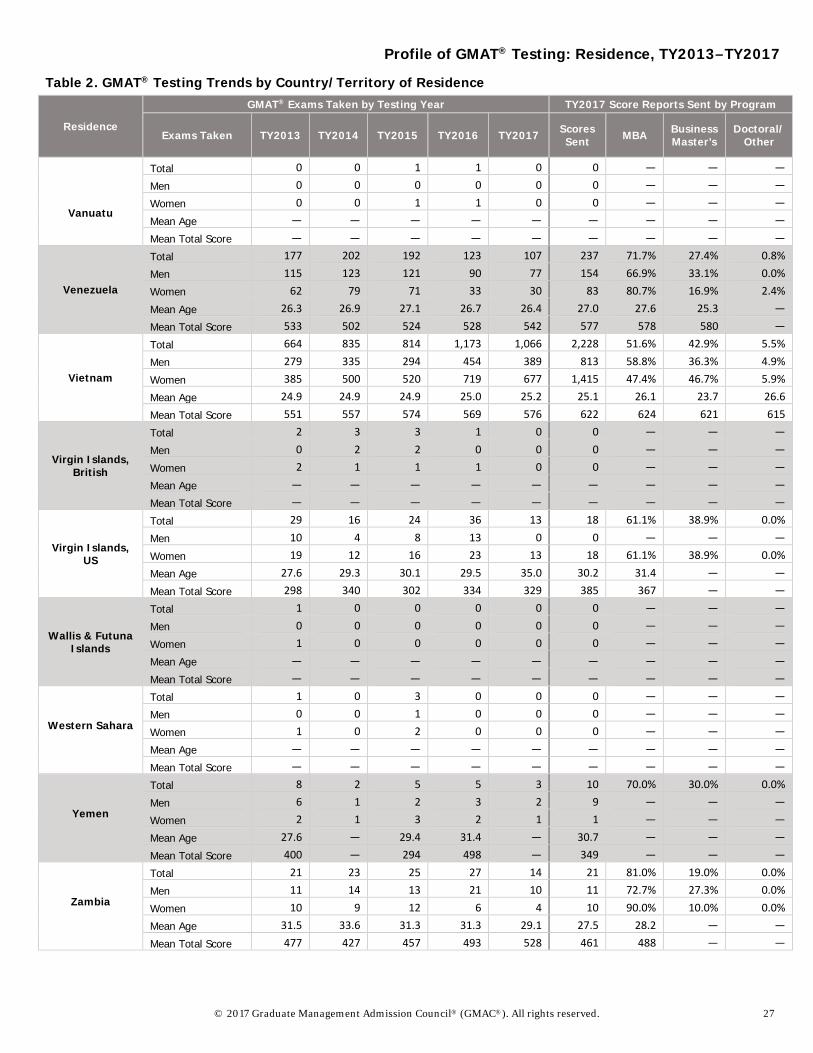
Vanuatu
Total 0 0 1 1 0 0 — — — Men 0 0 0 0 0 0 — — — Women 0 0 1 1 0 0 — — — Mean Age — — — — — — — — — Mean Total Score — — — — — — — — —
Venezuela
Total 177 202 192 123 107 237 71.7% 27.4% 0.8% Men 115 123 121 90 77 154 66.9% 33.1% 0.0% Women 62 79 71 33 30 83 80.7% 16.9% 2.4% Mean Age 26.3 26.9 27.1 26.7 26.4 27.0 27.6 25.3 — Mean Total Score 533 502 524 528 542 577 578 580 —
Vietnam
Total 664 835 814 1,173 1,066 2,228 51.6% 42.9% 5.5% Men 279 335 294 454 389 813 58.8% 36.3% 4.9% Women 385 500 520 719 677 1,415 47.4% 46.7% 5.9% Mean Age 24.9 24.9 24.9 25.0 25.2 25.1 26.1 23.7 26.6 Mean Total Score 551 557 574 569 576 622 624 621 615
Virgin Islands, British
Total 2 3 3 1 0 0 — — — Men 0 2 2 0 0 0 — — — Women 2 1 1 1 0 0 — — — Mean Age — — — — — — — — — Mean Total Score — — — — — — — — —
Virgin Islands, US
Total 29 16 24 36 13 18 61.1% 38.9% 0.0% Men 10 4 8 13 0 0 — — — Women 19 12 16 23 13 18 61.1% 38.9% 0.0% Mean Age 27.6 29.3 30.1 29.5 35.0 30.2 31.4 — — Mean Total Score 298 340 302 334 329 385 367 — —
Wallis & Futuna Islands
Total 1 0 0 0 0 0 — — — Men 0 0 0 0 0 0 — — — Women 1 0 0 0 0 0 — — — Mean Age — — — — — — — — — Mean Total Score — — — — — — — — —
Western Sahara
Total 1 0 3 0 0 0 — — — Men 0 0 1 0 0 0 — — — Women 1 0 2 0 0 0 — — — Mean Age — — — — — — — — — Mean Total Score — — — — — — — — —
Yemen
Total 8 2 5 5 3 10 70.0% 30.0% 0.0% Men 6 1 2 3 2 9 — — — Women 2 1 3 2 1 1 — — — Mean Age 27.6 — 29.4 31.4 — 30.7 — — — Mean Total Score 400 — 294 498 — 349 — — —
Zambia
Total 21 23 25 27 14 21 81.0% 19.0% 0.0% Men 11 14 13 21 10 11 72.7% 27.3% 0.0% Women 10 9 12 6 4 10 90.0% 10.0% 0.0% Mean Age 31.5 33.6 31.3 31.3 29.1 27.5 28.2 — — Mean Total Score 477 427 457 493 528 461 488 — —
Profile of GMAT® Testing: Residence, TY2013–TY2017
28 © 2017 Graduate Management Admission Council® (GMAC®). All rights reserved.
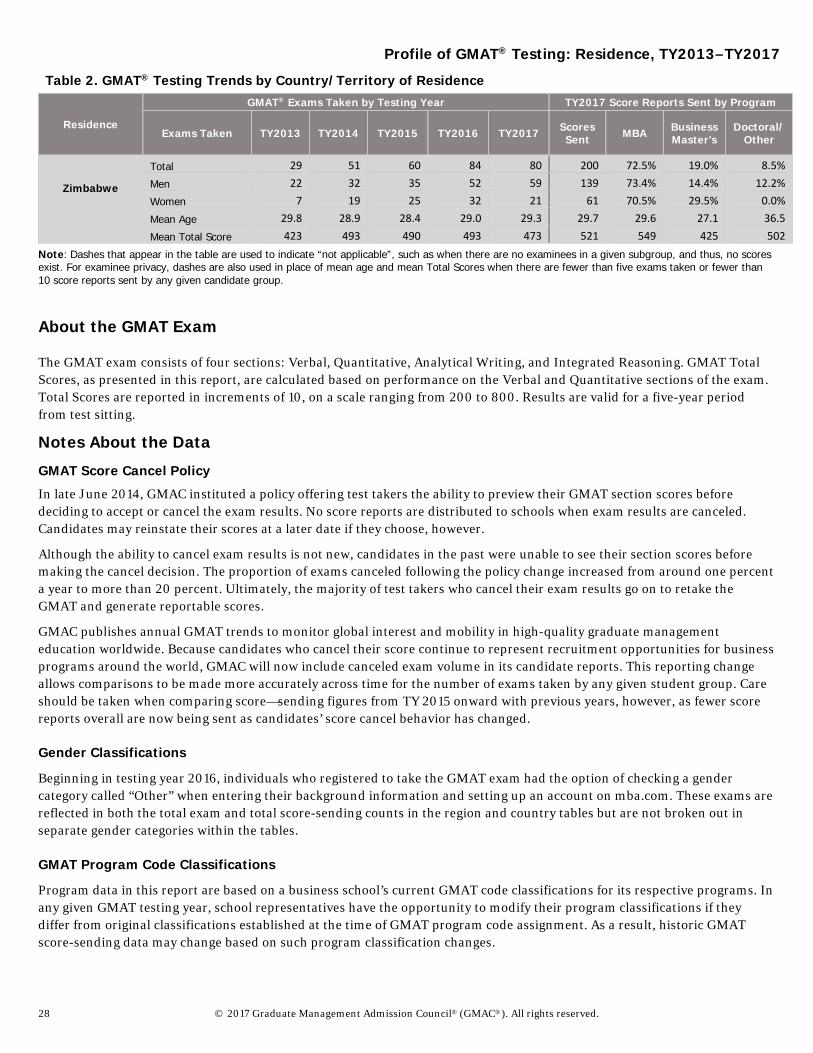
Note: Dashes that appear in the table are used to indicate “not applicable”, such as when there are no examinees in a given subgroup, and thus, no scores exist. For examinee privacy, dashes are also used in place of mean age and mean Total Scores when there are fewer than five exams taken or fewer than 10 score reports sent by any given candidate group.
About the GMAT Exam
The GMAT exam consists of four sections: Verbal, Quantitative, Analytical Writing, and Integrated Reasoning. GMAT Total Scores, as presented in this report, are calculated based on performance on the Verbal and Quantitative sections of the exam. Total Scores are reported in increments of 10, on a scale ranging from 200 to 800. Results are valid for a five-year period from test sitting.
Notes About the Data GMAT Score Cancel Policy In late June 2014, GMAC instituted a policy offering test takers the ability to preview their GMAT section scores before deciding to accept or cancel the exam results. No score reports are distributed to schools when exam results are canceled. Candidates may reinstate their scores at a later date if they choose, however.
Although the ability to cancel exam results is not new, candidates in the past were unable to see their section scores before making the cancel decision. The proportion of exams canceled following the policy change increased from around one percent a year to more than 20 percent. Ultimately, the majority of test takers who cancel their exam results go on to retake the GMAT and generate reportable scores.
GMAC publishes annual GMAT trends to monitor global interest and mobility in high-quality graduate management education worldwide. Because candidates who cancel their score continue to represent recruitment opportunities for business programs around the world, GMAC will now include canceled exam volume in its candidate reports. This reporting change allows comparisons to be made more accurately across time for the number of exams taken by any given student group. Care should be taken when comparing score—sending figures from TY 2015 onward with previous years, however, as fewer score reports overall are now being sent as candidates’ score cancel behavior has changed.
Gender Classifications
Beginning in testing year 2016, individuals who registered to take the GMAT exam had the option of checking a gender category called “Other” when entering their background information and setting up an account on mba.com. These exams are reflected in both the total exam and total score-sending counts in the region and country tables but are not broken out in separate gender categories within the tables.
GMAT Program Code Classifications
Program data in this report are based on a business school’s current GMAT code classifications for its respective programs. In any given GMAT testing year, school representatives have the opportunity to modify their program classifications if they differ from original classifications established at the time of GMAT program code assignment. As a result, historic GMAT score-sending data may change based on such program classification changes.
Table 2. GMAT® Testing Trends by Country/Territory of Residence
Residence
GMAT® Exams Taken by Testing Year TY2017 Score Reports Sent by Program
Exams Taken TY2013 TY2014 TY2015 TY2016 TY2017 Scores Sent MBA Business
Master’s Doctoral/
Other
Zimbabwe
Total 29 51 60 84 80 200 72.5% 19.0% 8.5% Men 22 32 35 52 59 139 73.4% 14.4% 12.2% Women 7 19 25 32 21 61 70.5% 29.5% 0.0% Mean Age 29.8 28.9 28.4 29.0 29.3 29.7 29.6 27.1 36.5 Mean Total Score 423 493 490 493 473 521 549 425 502
Profile of GMAT® Testing: Residence, TY2013–TY2017
© 2017 Graduate Management Admission Council® (GMAC®). All rights reserved. 29
Review of Historical GMAT Testing Data
In August 2015, GMAC conducted a review of historical GMAT testing data using new database technology. Minor anomalies were discovered and subsequently corrected for GMAT testing data between TY2007 and TY2008. Updated testing volumes for this period have dropped by approximately 1,000 exams. For details please contact David Svancer at [email protected] or the GMAC Research Department at [email protected].
Profile of GMAT® Testing: Residence, TY2013–TY2017
30 © 2017 Graduate Management Admission Council® (GMAC®). All rights reserved.
Regional Categories
AFRICA Algeria Angola Benin Botswana Burkina Faso Burundi Cameroon Cape Verde Central African Republic Chad Comoros Congo, Dem. Rep. of the Congo, Republic of the Cote d’Ivoire (Ivory Coast) Djibouti Egypt Equatorial Guinea Eritrea Ethiopia Gabon Gambia, The Ghana Guinea Kenya Lesotho Liberia Libyan Arab Jamahiriya Madagascar Malawi Mali Mauritania Mauritius Morocco Mozambique Namibia Niger Nigeria Reunion Rwanda Sao Tome & Príncipe Senegal Seychelles Sierra Leone Somalia South Africa South Sudan Sudan Swaziland Tanzania Togo Tunisia Uganda Western Sahara Zambia
Zimbabwe
AUSTRALIA & PACIFIC ISLANDS American Samoa Australia Christmas Island Cocos (Keeling Islands) Fiji Guam Kiribati Marshall Islands Micronesia, Federated States of New Caledonia New Zealand Northern Mariana Islands Palau Papua New Guinea Pitcairn Samoa Solomon Islands Tahiti Tonga Vanuatu Wallis & Futuna Islands
CANADA Canada
CENTRAL & SOUTH ASIA Afghanistan Bangladesh Butano India Kazakhstan Kyrgyzstan Nepal Pakistan Tajikistan Turkmenistan Uzbekistan
EAST & SOUTHEAST ASIA Brunei Darussalam Cambodia China, People’s Republic of East Timor Hong Kong (SAR of China) Indonesia Japan Korea, North Korea, South Lao People’s Democratic Republic Macau (SAR of China) Malaysia
Maldives Mongolia Myanmar (Burma) Philippines Singapore Sri Lanka Taiwan Thailand Vietnam
EASTERN EUROPE Albania Armenia Azerbaijan Belarus Bosnia-Herzegovina Bulgaria Croatia Czech Republic Estonia Georgia Hungary Latvia Lithuania Macedonia, F.Y.R. of Moldova Montenegro Poland Romania Russian Federation Serbia, Republic of Slovakia Slovenia Ukraine
MEXICO, CARIBBEAN, & LATIN AMERICA Anguilla Antigua & Barbuda Argentina Aruba Bahamas Barbados Belize Bermuda Bolivia Brazil British Virgin Islands Cayman Islands Chile Colombia Costa Rica Cuba Dominica, Commonwealth of Dominican Republic
Profile of GMAT® Testing: Residence, TY2013–TY2017
© 2017 Graduate Management Admission Council® (GMAC®). All rights reserved. 31
Ecuador El Salvador Falkland Islands French Guiana Grenada Guadaloupe Guatemala Guyana Haiti Honduras Jamaica Martinique Mexico Montserrat Netherlands Anilles Nicaragua Panama Paraguay Peru Puerto Rico Saint Kitts & Nevis Saint Lucia St. Vincent & The Grenadines Suriname Trinidad & Tobago Turks & Caicos Islands Uruguay
US Virgin Islands Venezuela
MIDDLE EAST Bahrain Gaza Strip Iran Iraq Israel Jordan Kuwait Lebanon Oman Palestinian Territories Qatar Saudi Arabia Syria Turkey United Arab Emirates West Bank Yemen
UNITED STATES United States of America
WESTERN EUROPE Andorra
Austria Belgium Cyprus Denmark Finland France Germany Gibraltar Greece Guernsey Iceland Ireland Isle of Man Italy Liechtenstein Luxembourg Malta Monaco Netherlands Norway Portugal San Marino Spain Sweden Switzerland United Kingdom
Related Publications • Profile of GMAT Testing: Citizenship, Five-Year Summary, TY2013–TY2017 gmac.com/profile
• Profile of GMAT Testing: North America, Five-Year Summary, TY2013–TY2017 gmac.com/profile
• 2017 mba.com Prospective Students Survey Report gmac.com/prospectivestudents
• 2017 mba.com Prospective Students Interactive Research Tool gmac.com/prospectivestudents
Related Admissions Recruiting Resources
Looking for more students? The Graduate Management Admission Search Service® (GMASS®) database can help you find the best talent to recruit for your programs. As a GMAT score recipient, you have access to the GMASS global database of prospective candidates interested in graduate management education—nearly 500,000 candidates who are waiting to hear from you. The benefits of using the GMASS service:
• Target your audience: Use more than 30 criteria to narrow your search and tailor your message for the best response rate.
• Get the most up-to-date contacts: The global GMASS database is updated daily.
• Find the best candidates anytime, anywhere with our easy-to-use web-based application.
• Save time: Receive automatic results daily, weekly, or monthly, and save your best searches.
• Recruit early: Target GMAT pre-test candidates early in their decision-making process.
• Save money: GMASS is a cost-effective way to build multichannel marketing programs.
To get more information or to start a GMASS subscription, contact Paula McKay at [email protected], or visit gmac.com/gmass.
http://www.gmac.com/market-intelligence-and-research/gmat-statistics/profile-of-gmat-candidates.aspx
Profile of GMAT® Testing: Residence, TY2013–TY2017
© 2017 Graduate Management Admission Council® (GMAC®). All rights reserved.
No part of this publication may be reproduced, stored in a retrieval system, distributed, or transmitted in any form by any means, electronic, mechanical, photocopying, recording, or otherwise, without the prior written permission of GMAC. For permission, contact the GMAC legal department at [email protected].
GMAC®, GMAT®, GMASS®, Graduate Management Admission Council®, Graduate Management Admission Test®, and Graduate Management Admission Search Service® are registered trademarks of the Graduate Management Admission Council in the United States and other countries.
Contributors
The following individuals from the GMAC Research Department made significant contributions to the publication of this report: David Svancer, Senior Manager, Data Science, data preparation and manuscript review; Hillary Chan, Research Analysis Associate Manager, analysis, interpretation of data, and revising of manuscript for intellectual content; Tacoma Williams, Research Senior Coordinator, quality assurance; Gregg Schoenfeld, Director, Management Education Research, data and manuscript review.
Contact Information
For questions or comments regarding the study findings, methodology, or data, please contact the GMAC Research Department at [email protected].
For more information about all Research Department products, surveys, and resources, visit gmac.com/research.
GMAC Global Office Locations
GMAC Hong Kong GMAC India GMAC London GMAC USA
P: + 1 852 2851 0020 [email protected]
P: +91 124 4945270 [email protected]
P: +44 (0) 20 3008 7933 [email protected]
P: +1 703 668 9600 [email protected]