Professor Nigel Brandon Shell Chair Sustainable Development in Energy EPSRC Energy Senior Research...
32
Professor Nigel Brandon Shell Chair Sustainable Development in Energy EPSRC Energy Senior Research Fellow Executive Director Energy Futures Lab GO science Focal Point in Energy with China www.imperial.ac.uk/energyfutureslab Energy Drivers for Emissions
-
Upload
paul-bryan -
Category
Documents
-
view
217 -
download
1
Transcript of Professor Nigel Brandon Shell Chair Sustainable Development in Energy EPSRC Energy Senior Research...
Professor Nigel BrandonShell Chair Sustainable Development in EnergyEPSRC Energy Senior Research FellowExecutive Director Energy Futures LabGO science Focal Point in Energy with China
www.imperial.ac.uk/energyfutureslab
Energy Drivers for Emissions

Introduction
• Energy Futures Lab
• Global Energy Drivers and Trends.
• Energy in the UK.
• Conclusions.

The Energy Futures Lab• Established in 2005 to promote and stimulate multi-disciplinary research in energy at Imperial College. The EFL integrates across science, engineering, policy and business in the energy sector.
• Imperial College has a research budget of £30M pa for energy research, one third from industry. We have around 370 energy projects and 600 research staff and students undertaking energy research.
Energy Technologies•Fuel cells and hydrogen
•Bioenergy
•Solar
•Carbon capture and storage
•Oil and gas
•Transmission and distribution
•Transport
•Nuclear fission and fusion
•Combustion science and engineering
Integrating Themes•Energy systems engineering
•Policy
•Environmental studies
•Sustainability analysis
•Economics
•Energy in society
City type 459 City scenario
Land use
Energy resource flow
Service networks
Human activities
City type 459 City scenario
Land useLand use
Energy resource flow
Service networks
Human activities
Su
sta
inab
ilit
yfa
cto
rs
www.imperial.ac.uk/energyfutureslab

Global Energy Drivers: 1 – Population Growth 2005
(million)2030
(million)
Canada 32 268 38 880
France 60 496 66 269
Germany 82 689 79 090
Italy 58 093 57 385
Japan 128 085 117 794
Russia 143 202 124 121
United Kingdom 59 668 65 895
United States 298 313 364 427
Brazil 186 405 233 884
China 1 315 844 1 438 394
India 1 103 371 1 489 653
Mexico 107 029 269 211
South Africa 47 432 52 958
World TotalWorld Total 6 464 7506 464 750 8 246 6658 246 665
World Population prospectsWorld Population prospects: the 2006 revision, UN Dept. Economics and Social Affairs

Global Energy Drivers: 2 – Energy Security
• Rising Oil Prices.
• Shift in power from energy consumers to energy producers.
• Link between energy, water and food.
• 400 million people in India have no access to electricity.

Source: UK Energy Sector Indicators, 2008, DECC.
UK Energy Trade and consumption

PROJECTED EUROPEAN GAS BALANCE
0
200
400
600
800
1980 1990 2002 2010 2020 2030
bill
ion
cu
m
Production Net imports
Source: IEA

Global Energy Drivers: 3 – UrbanisationP
opul
atio
n (b
illi
on)
Source: ARUP

Growth in Global Energy Demand
Source: RCEP (2000)Source: RCEP (2000)

Global Energy Impact: CO2 emissions
Source: DTI (2002).Source: DTI (2002). Energy: its impact on the environment and Energy: its impact on the environment and society.society.

Global Energy Impact: 2 – Pollution
Guangzhou, China, March 2008, ~15.00

In 2006, 283 out of 524 cities recorded acid rain:•198 cities at 25%•87 cities at 75%•6 cities at 100%
Acid rain: pH <5.6
Air Quality Report for 2006Air Quality Report for 2006, Ministry of Environmental Protection of P. R. China, http://www.sepa.gov.cn/
Acid Rain in China
More than 80 percent of Chinese cities in a recent World Bank survey had sulfur dioxide or nitrogen dioxide emissions above the World Health Organization's threshold.
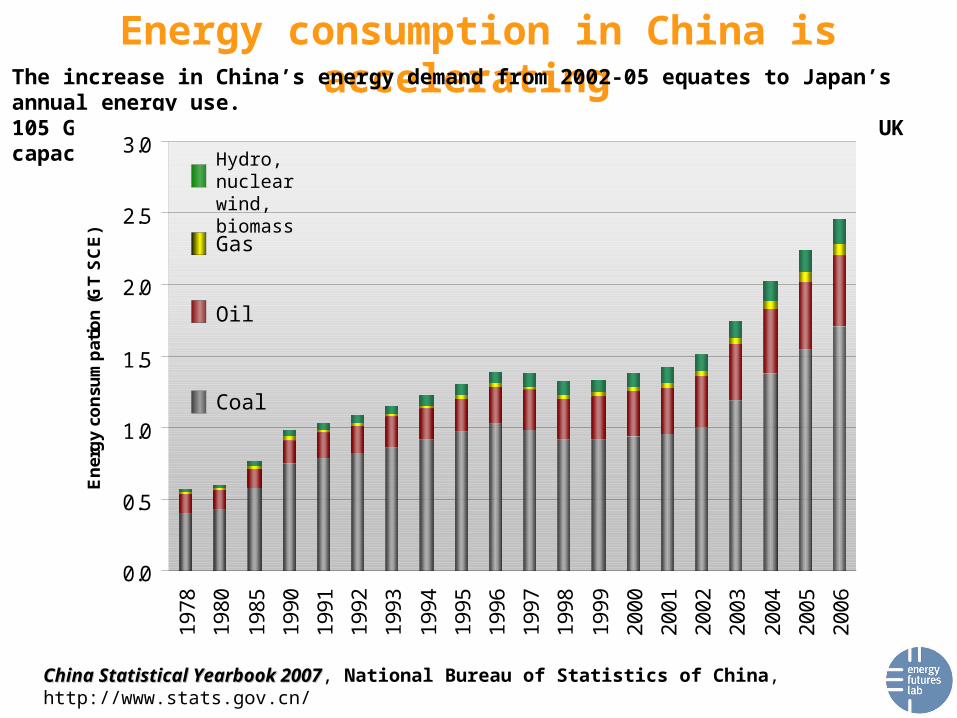
Energy consumption in China is accelerating The increase in China’s energy demand from 2002-05 equates to Japan’s annual energy use.105 GW of (mostly) coal fired power plant were built in 2006 (total UK capacity ~80GW).
0.0
0.5
1.0
1.5
2.0
2.5
3.0
1978
1980
1985
1990
1991
1992
1993
1994
1995
1996
1997
1998
1999
2000
2001
2002
2003
2004
2005
2006
En
erg
y co
nsu
mp
atio
n (
GT
SC
E)
China Statistical Yearbook 2007China Statistical Yearbook 2007, National Bureau of Statistics of China, http://www.stats.gov.cn/
Coal
Oil
Gas
Hydro, nuclear wind, biomass

Incremental increase in energy demand and energy related CO2 emissions 2000-2006.
World Energy Outlook 2007: China and India Insights, World Energy Outlook 2007: China and India Insights, International Energy Agency

China’s energy consumption per capita is low
World Energy Outlook 2007: China and India Insights, World Energy Outlook 2007: China and India Insights, International Energy Agency
toe
per
cap
ita

Human development and energy use
A. Pasternak, Global Energy Futures and Human Development: A Framework for Analysis, Lawrence Livermore National Laboratory rep. no. UCRL-ID-140773 (2000).

Car ownership in China was 24 cars for every 1000 citizens in 2006, and will increase to 40 cars for every 1000 citizens by 2010. By contrast, the US has 765 vehicles per 1000 (2002 data), while Europe has an average of about 300 vehicles per 1000.
Source: Green Car CongressGreen Car Congress, http://www.greencarcongress.com/2006/05/percapita_car_o.html
Source: Source: Tsinghua-BP Clean Energy CentreTsinghua-BP Clean Energy Centre
Transportation accounts for 40%40% of annual oil consumption now and is increasing sharply.
China is already the third-largest car market in the world. The National Development and Reform Commission predicted that 55 million vehicles will be running on China’s roads by 2010. This number will increase to 370 million by 2030.
0
1
2
3
4
5
6
7
8
2000 2010 2020 2030 2040 2050
10
0 M
T
Oil Demand
Domestic production
Rising Transport Demand in China

Global energy demand continues to rise
0
2,000
4,000
6,000
8,000
10,000
12,000
14,000
16,000
18,000
1971 2002 2010 2020 2030
mil
lio
n t
on
nes
oil
eq
uiv
alen
t
Coal Oil Gas Nuclear Hydro Biomass and Waste Other renewables
IEA World Energy Outlook

Major investment in new energy infrastructure$22 Trillion of investment in energy infrastructure is needed out to 2030 to meet demand.
Cumulative Investment in Energy Infrastructure 2006-2030
World Energy Outlook 2007: China and India Insights, World Energy Outlook 2007: China and India Insights, International Energy Agency

UK: Share of fuels contributing to primary energy supply
Source: UK Energy Sector Indicators, 2008, DECC.

The size of the challenge: a potential scenario to reach 15% renewable energy by 2020 in the UK
Source: BERR UK Renewable energy strategy consultation, June (2008).

UK: Energy consumption by sector
Source: UK Energy Sector Indicators, 2008, DECC.

UK: Energy consumption by transport type
Source: UK Energy Sector Indicators, 2008, DECC.
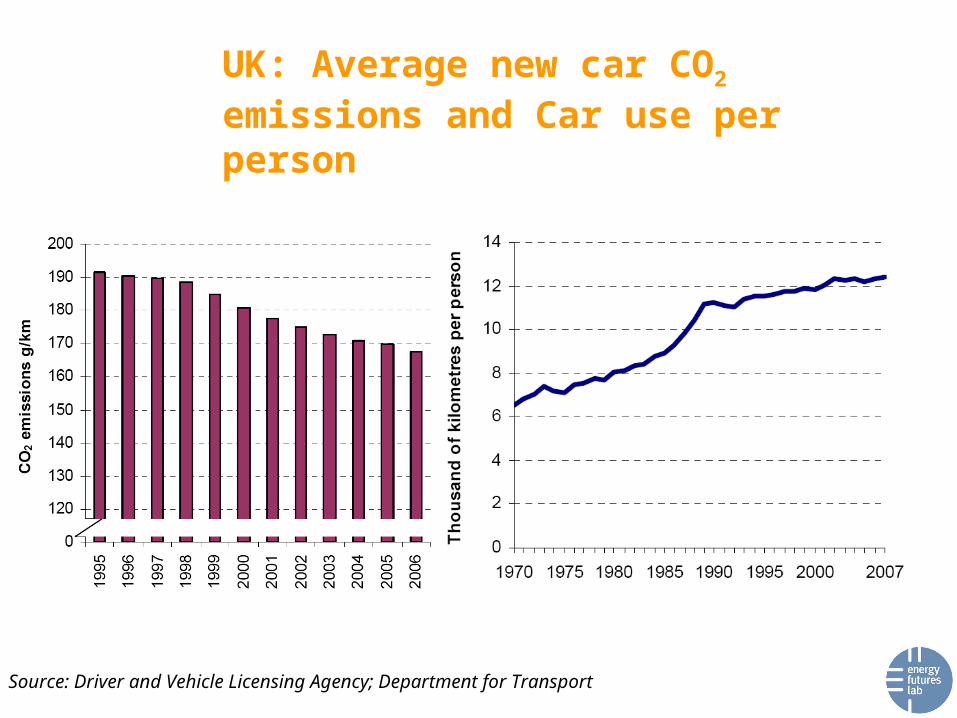
UK: Average new car CO2 emissions and Car use per person
Source: Driver and Vehicle Licensing Agency; Department for Transport

Source: Derived from BREHOMES, taken from the Domestic Energy Fact File. Building Research Establishment
UK: Domestic energy consumption

UK: Ownership of central heating
Source: GfK Home Audit from the Domestic Energy Fact File, Building Research Establishment.

UK: Carbon dioxide emissions on an IPCC basis and measurements towards targets
Source: UK Energy Sector Indicators, 2008, DECC.

UK: Sulphur dioxide emissions by sector
Source: UK Energy Sector Indicators, 2008, DECC.

Examples of Energy Technology Development at Imperial College: Fuel Cells, Bioenergy and Solar
• Fuel Cell Programme– Basic materials and device research – CeresPower spun out in 2001; now with 70
employees and partnership with British Gas to create domestic fuel cell CHP
– Units will reduce household CO2 emissions by 20%
•Translated into a low CO2, low energy technique to produce biofuel naturally.
•Bioenergy Programme•Plant biology, microbiology, biotechnology and systems process engineering.
•Solar Programme•Photosynthesis, photochemistry, organic and nano-materials, device physics.
•Targetting low cost organic solar cells - Tomorrows PV.•A vision for direct solar production of hydrogen and other fuels – Artificial Leaf.

PLANET 2050
ALL-ELECTRIC BUILDINGS
ELECTRIC MOBILITY
Grantham Institute for Climate Change
LOWCARBON
ELECTRICITYSUPPLY
BIOMASSBIOFUELS
HYDROGENECONOMY
CO2
FROM THEAIR
PLANET2050
ELECTRIC FUTURES
PLANET 2050 will explore how to deliver 80% cuts in net CO2 emissions and beyond quickly
and without excessive costs through exploiting advanced technology and an integrated system approach.
LOWCARBON
PRODUCTION
Programme for Low And Negative Emission Technologies for 2050

Conclusions
• In the near term we need to rapidly deploy the technologies we have available today, both for energy demand reduction and for energy generation. But we will need to develop new technologies, behaviours and business models to meet our 2050 targets.
• We must explore a wide range of options – for example the large-scale use of low-carbon electricity could help achieve the 80% reduction in carbon emissions by 2050. But the scientific and engineering challenges associated with this are significant.
• To develop breakthrough technologies we need to support energy R&D&D – noting that public funding for energy research has more than halved globally in real terms since 1980.
• We need to understand how to manage the transition in our energy economy – at Imperial we will explore this through our new ‘Planet 2050’ programme.
• Many areas of the energy sector are short of critical skills – Universities have an important role to play in attracting, educating and retaining the very best young scientists and engineers to the energy sector.