Prof. dr. Karst Geurs, Centre for Transport Studies ...
28
18-2-2021 Presentatietitel: aanpassen via Beeld, Koptekst en voettekst 1 Transport, accessibility and equity Prof. dr. Karst Geurs, Centre for Transport Studies, University of Twente, the Netherlands
Transcript of Prof. dr. Karst Geurs, Centre for Transport Studies ...

18-2-2021 Presentatietitel: aanpassen via
Beeld, Koptekst en voettekst
1
Transport, accessibility and equity
Prof. dr. Karst Geurs, Centre for Transport Studies, University of
Twente, the Netherlands
2
Contents
Measuring accessibility - different approaches
Measuring equity
A comparative study on accessibility and equity: Netherlands
Randstad area, London and Sao Paulo
Conclusions

3
What is accessibility?
“Accessibility is a slippery notion… one of those common terms that
everyone uses until faced with the problem of defining and measuring
it” (Peter Gould, 1969)

4
Definition of accessibility:(Geurs, K.T., van Wee, B., 2004. Accessibility evaluation of land-use and transport strategies: review and
research directions. Journal of Transport geography 12, 127-140)
Fundamentally, accessibility should relate to the role of transport in
society; to provide individuals the opportunity to participate in
activities in different locations.
Definition (passenger travel) “the extent to which land-use and
transport systems enable (groups of) individuals to reach activities
or destinations by means of a (combination of) transport mode(s)
(at various times of the day)”.

5(Geurs, K.T., van Wee, B., 2004. Accessibility evaluation of land-use and transport strategies: review and research directions. Journal of Transport geography 12, 127-140)
(Geurs, K.T., van Wee, B., 2004. Accessibility evaluation of land-use and transport strategies: review and research
directions. Journal of Transport geography 12, 127-140)

6
Part 2: Four main perspectives on accessibility
1. Infrastructure-based measures (transport planner’s perspective)
2. Location-based measures (urban planner’s perspective)
3. Person-based measures (time-space geography)
4. Utility-based measures (economist’s perspective)

7
Perspective 1: infrastructure-based measures
Describe the performance of transport networks in terms of
congestion, travel times, travel costs, etc.
Standard input for economic appraisal of transport investments
Easy to understand but a partial measure of accessibility
8
Location-based accessility measures
Accessibility not only depends on quality of transport measures but
also on spatial distribution of activities
Many different types :
Travel time isochrones
Cumulative opportunities/contour measures
Potential accessibility
Potential accessibility including competition effects
9
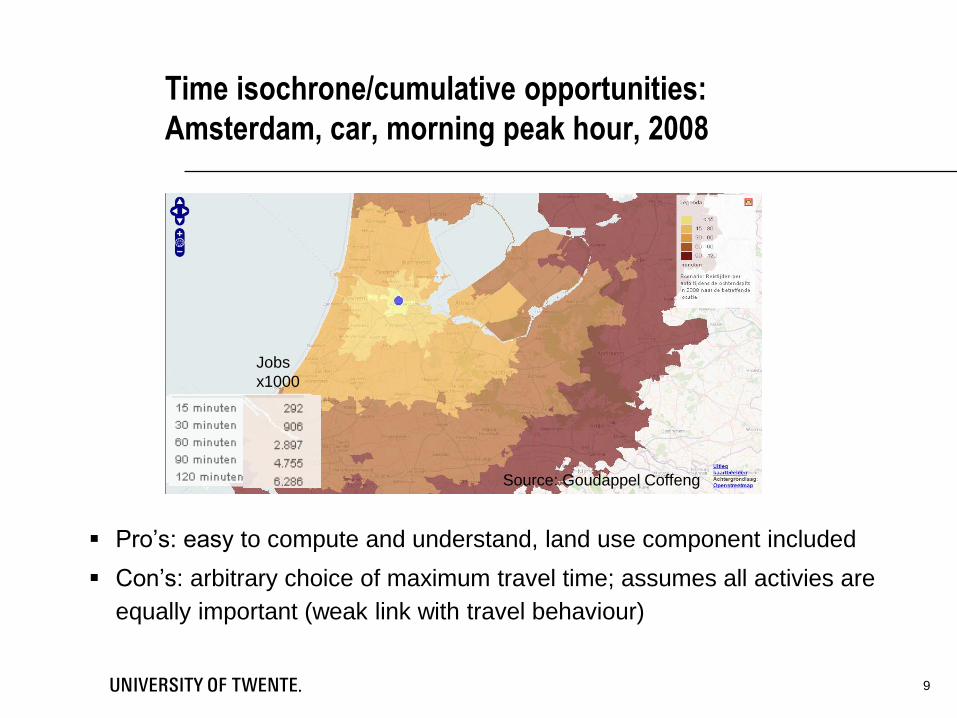
Time isochrone/cumulative opportunities:
Amsterdam, car, morning peak hour, 2008
Pro’s: easy to compute and understand, land use component included
Con’s: arbitrary choice of maximum travel time; assumes all activies are
equally important (weak link with travel behaviour)
Source: Goudappel Coffeng
Jobs
x1000

10
Potential accessibility measureHansen, W.G., 1959. How accessibility shapes land use. Journal of
American Institute of Planners 25, pp. 73-76
n
j
c
jiijeDA
1

Potential job accessibility by car, 2014, various times of
the day (based on TomTom data)Moya-Gómez, B., & Geurs, K. T. (2018). The spatial–temporal dynamics in job accessibility by car in the
Netherlands during the crisis. Regional Studies, 1-12. doi:10.1080/00343404.2018.1538554
11

12
Shen index: potential accessibility with
competition
Shen, Q. (1998). Location characteristics of inner-city neighborhoods and employment accessibility of low-wage
workers. Environment and Planning B: Planning & design, 25(3), 345-365.

13
Location-based measures
Pro’s:
includes land-use component; applicable in transport, land-use
and integrated land-use/transport policy appraisal
Mismatch between demand and supply of opportunities can be
included
Con’s:
Different measures are possible with different levels of
complexity
Measures based on distance decay have no meaning in terms
of costs or benefits or activity values
Choice of distance decay function large impact on the outcome

14
Perspective 3: “Person-based” accessibility measures
• Analysis of accessibility at the individual level;
• Accessibility depends on individual constraints (activity scheduling),
temporal constraints (opening hours of shops), spatial contraints
(travel budget)
Comprehensive but complex in terms of data need, complexity and
difficult to operationalise

15
Perspective 4: Utility-based measures
Benefits that people derive from access to spatially distributed
activities
Can be derived from standard transport modes (double
constrained transport model or discrete choice models)
Not often used in practical applications.

Summary
4 components: transport, land use, individual and temporal
components
4 perspectives: infrastructure-based, location-based, person-based
and utility-based accessibility measures
In practice: accessibility measures focus on one or two components
of accessibility ; trade off between rigour and relevance in practice
16

Measuring transport equity
Many different approaches to measuring transport equity
Outcome /result equity
Vertical equity (differences across population segments)
Horizontal equity (differences within population segments)
Spatial equity (differences between areas)
Social equity (differences by needs)
Income equity (differences between income groups)
Several statistical indicators: Gini index, Palma ratio, Atkinson
index, Theil index etc.
Equity of opportunity
Fairness / social justice; provision of a basic minimum allocation
to all individuals.
17

• Lorenz curve: visualizing the distribution
of income (or wealth) within an economy
• GINI: equal to the area below the line of
perfect equality (0.5 by definition) minus
the area below the Lorenz curve, divided
by the area below the line of perfect
equality (A/A+B).
• Between 0 (perfectly equal) and 1
(inequal)- > the smaller the index, the
larger the inquality
• Disadvantage: dominated by middle-
income groups; not very sensitive to
extreme income inequalities
GINI INDEX
18
- The ratio of national income shares of the top 10% of households
(richest) to the bottom 40 (poorest). The larger the ratio, the
greater the inequality.
- Here: ratio of average accessibility weighted by population for the
zones belonging to Decile 10 (with monthly expenditure as income
proxy) and for those belonging to Deciles 1 to 4.
(Guzman, L. A., & Oviedo, D. (2018). Accessibility, affordability and equity: Assessing
‘pro-poor’ public transport subsidies in Bogotá. Transport Policy, 68, 37-51)
MEASURING TRANSPORT EQUITY – PALMA RATIO
19
20
MORE INFO: HTTPS://WWW.ASTRIDROJECT.COM/

21
THE NETHERLANDS RANDSTAD AREA VS SAO PAULO
Randstad: polynuclear structure;
low incomes in urban centres
high incomes in suburbs (but mixing as well)
Sao Paulo: monocentric: low incomes
in periphery, high incomes in center

• Two accessibility indicators: Potential Accessibility and Shen
index (jobs per resident)
• Shen index: intramodal and multimodal
• Two equity indicators: GINI index and Palma ratio (based on
income deciles)
• Two ways of averaging: area/zone based and inhabitants per
area/zone
= 2*3*2=12 possible combinations
MEASURING ACCESSIBILITY AND EQUITY
22
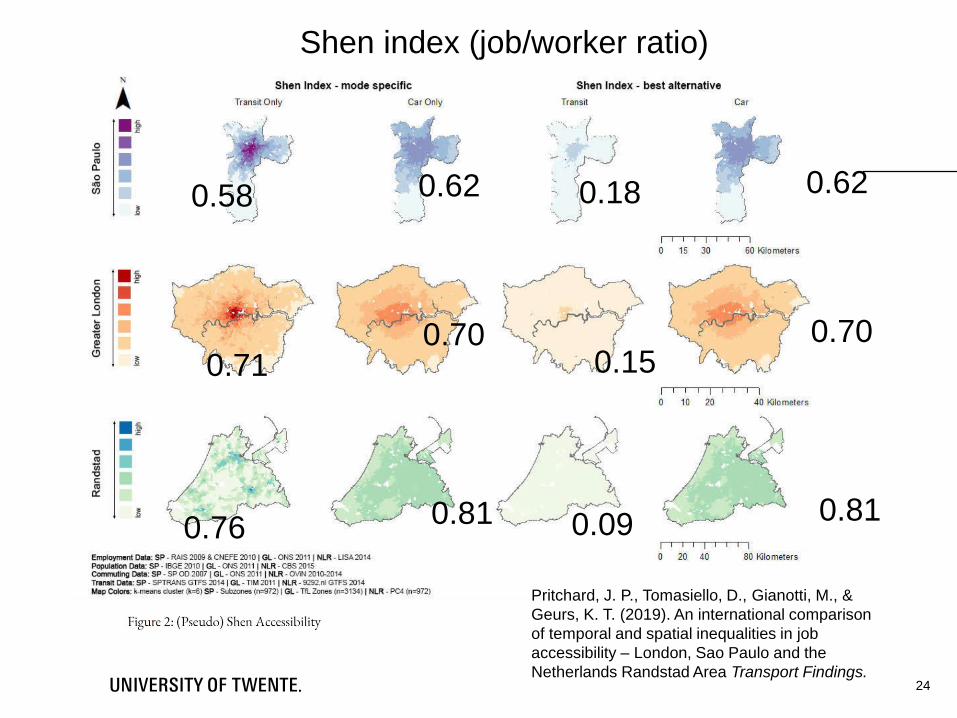
Pritchard, J. P., Tomasiello, D., Gianotti, M., & Geurs, K. T. (2019). An international comparison of
temporal and spatial inequalities in job accessibility – London, Sao Paulo and the Netherlands
Randstad Area Transport Findings.

23Pritchard, J. P., Tomasiello, D., Gianotti, M., & Geurs, K. T. (2019). An international comparison of temporal and spatial inequalities
in job accessibility – London, Sao Paulo and the Netherlands Randstad Area Transport Findings.
Car: 409 jobs per resident
Transit: 144 jobs per resident
Car: 477 jobs per resident
Transit: 116 jobs per resident
Car: 355 jobs per resident
Transit: 37 jobs per resident
Sao Paulo: high job accessibility
by car and public transport
24
Pritchard, J. P., Tomasiello, D., Gianotti, M., &
Geurs, K. T. (2019). An international comparison
of temporal and spatial inequalities in job
accessibility – London, Sao Paulo and the
Netherlands Randstad Area Transport Findings.
0.81
0.70
0.620.18
0.15
0.090.81
0.70
0.620.58
0.71
0.76
Shen index (job/worker ratio)

POTENTIAL JOB ACCESSIBILITY – PERSON AVERAGED
GINI AND PALMA RATIO
25
NL-Randstad:
GINI car: 0.41
GINI PT: 0.43
London:
GINI car: 0.41
GINI PT: 0.49
Sao Paulo
Gini car: 0.62
GINI PT: 0.61
Palma ratio car: 1.15
Palma ratio PT: 0.96
Palma ratio car: 2.51
Palma ratio PT: 3.47
Palma ratio car: 5.69
Palma ratio PT: 7.96
• Randstad is the most
equal, Sao Paulo
most unequal
• Differences in PALMA
ratio much larger than
GINI
• In NL PT accessibility
is more unequal than
car according to GINI,
more equal according
to Palma ratio – low
incomes have good
PT accessibility

• Definition and operationalisation of accessibility strongly affects
the conclusions: different measures may give very different
conclusions
• Case study:
• Sao Paulo and London have high levels of potential job
accessibility by car and public transport per resident..
• but less jobs per worker (concentration of jobs increase job
competition)
• Thus: use multiple accessibility indicators
26
CONCLUSIONS ON ACCESSIBILITY

• Conclusions on equity also depend on the indicator chosen
(here: GINI and Palma)
• Equity indicators are heavily influenced by choice of
accessibility indicator
• Average equity indicators depend on by how average
values are weighted (area, population)
• Thus: use multiple equity indicators
CONCLUSIONS ON EQUITY
27