
Prof. Dr. Arshad Ahmad INSTITUTE FUTURE ENERGY, UTM Email ... · Prof. Dr. Arshad Ahmad INSTITUTE...
57
www.utm.my innovative ● entrepreneurial ● global 1 1 www.utm.my innovative ● entrepreneurial ● global Prof. Dr. Arshad Ahmad INSTITUTE FUTURE ENERGY, UTM Email: [email protected]
Transcript of Prof. Dr. Arshad Ahmad INSTITUTE FUTURE ENERGY, UTM Email ... · Prof. Dr. Arshad Ahmad INSTITUTE...

www.utm.my innovative ● entrepreneurial ● global 1 1 www.utm.my innovative ● entrepreneurial ● global
Prof. Dr. Arshad Ahmad
INSTITUTE FUTURE ENERGY, UTM Email: [email protected]
www.utm.my innovative ● entrepreneurial ● global 2
● Introduction ● WHAT-IF ● CHECKLIST
● HAZARD INDICES ● HAZID ● HAZOP
● LOPA ● FMEA ● FTA
● ETA
www.utm.my innovative ● entrepreneurial ● global 3
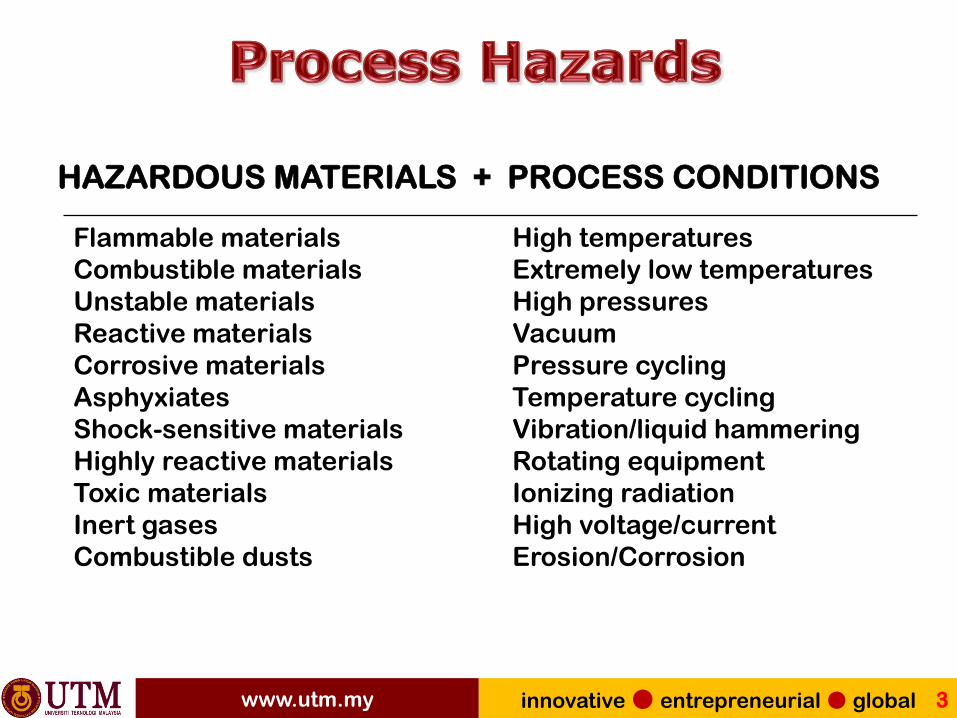
HAZARDOUS MATERIALS + PROCESS CONDITIONS
Flammable materials Combustible materials Unstable materials Reactive materials Corrosive materials Asphyxiates Shock-sensitive materials Highly reactive materials Toxic materials Inert gases Combustible dusts
High temperatures Extremely low temperatures High pressures Vacuum Pressure cycling Temperature cycling Vibration/liquid hammering Rotating equipment Ionizing radiation High voltage/current Erosion/Corrosion

www.utm.my innovative ● entrepreneurial ● global 4
PROCESS HAZARDS ANALYSIS
What can go
wrong?
How likely is it?
What are the consequences?
PROCESS HAZARDS ANALYSIS STRUCTURE
FOUNDATION FOR PROCESS HAZARDS ANALYSIS
Historical
Experience
PHA
Methodology
Knowledge
and Intuition

www.utm.my innovative ● entrepreneurial ● global 5
● Process Hazards Analysis is the predictive identification of hazards, their cause & consequence and the qualitative estimation of likelihood and severity.
● PHA allows the employer to: – Determine locations of potential safety
problems
– Identify corrective measures to improve safety
– Preplan emergency actions to be taken if safety controls fail

www.utm.my innovative ● entrepreneurial ● global 6
PROCESS HAZARDS ANALYSIS RISK ANALYSIS
IDENTIFIES HAZARDS, estimates likelihood and severity, suggests improvements. USE ON EVERY PROJECT QUALITATIVE - based on experience, knowledge and creative thinking. Most often done by MULTIDISCIPLINARY TEAM Several methodologies available • What-if or Hazid • What-if/Checklist • HAZOP • FMEA • Preliminary Hazards Analysis
ASSESSES HAZARDS
SELECTIVE - use when other methods prove inadequate or excessive in cost.
QUANTITATIVE - requires extensive data and special expertise.
Done by ONE OR TWO SPECIALLY TRAINED PEOPLE
Also called: • Hazan • Risk Assessment • Probabilistic Risk Assessment (PRA) • Quantitative Risk Assessment (QRA)

www.utm.my innovative ● entrepreneurial ● global 7
1. Hazards of the process 2. Identification of previous incidents with likely
potential for catastrophic consequences 3. Engineering and administrative controls applicable
to the hazards and their interrelationships 4. Consequences of failure of engineering and
administrative controls, especially those affecting employees
5. Facility siting; human factors
6. The need to promptly resolve PHA findings and recommendations

www.utm.my innovative ● entrepreneurial ● global 8
Project Detailed Commissioning Decommis- Records Inception Design sioning Destroyed Design Construction Operation Demolition Basis
Info
rmat
ion
avai
labl
e
New Project Existing Facility Shutdown/ Record Removal Retention

www.utm.my innovative ● entrepreneurial ● global 9
Corporate Policy, Codes, and Standards
PHA, What if
HAZOP, FMEA
LOPA, FTA, ETA, QRA
What if
Corporate Policy, Codes, and Standards
Process Hazard Analysis Control System Hazard Analysis
Checklists
Markov Models, Capability Assessment, FMEA, LOPA
Non destructive, fault-injection testing
Reliability/availability analysis
Concept Process Design Detailed Construction Commis- Operation Decommis- Definition Engineering sioning sioning
Periodic PHA Reviews

www.utm.my innovative ● entrepreneurial ● global 10
PROCESS
PREVENTION Mechanical Protection system Alarms with operator corrective actions Safety Instrumented Control System
CONTROL & MONITORING Basic Process Control System Monitoring system (Alarms) Operator Supervision
MITIGATION Mechanical Mitigation System Safety Instrumented Control System Safety Instrumented Mitigation System Operator Supervision
PLANT EMERGENCY RESPONSE Evacuation Procedure
COMMUNITY EMERGENCY RESPONSE Emergency Broadcasting

www.utm.my innovative ● entrepreneurial ● global 11

www.utm.my innovative ● entrepreneurial ● global 12
● Experienced personnel brainstorming a series of questions that begin, "What if…?”
● Each question represents a potential failure in the facility or mis-operation of the facility
● The response of the process and/or operators is evaluated to determine if a potential hazard can occur
● If so, the adequacy of existing safeguards is weighed against the probability and severity of the scenario to determine whether modifications to the system should be recommended

www.utm.my innovative ● entrepreneurial ● global 13
1. Divide the system up into smaller, logical subsystems
2. Identify a list of questions for a subsystem
3. Select a question 4. Identify hazards, consequences, severity,
likelihood, and recommendations
5. Repeat Step 2 through 4 until complete

www.utm.my innovative ● entrepreneurial ● global 14
● Equipment failures – What if … a valve leaks?
● Human error – What if … operator fails to restart pump?
● External events – What if … a very hard freeze persists?
www.utm.my innovative ● entrepreneurial ● global 15
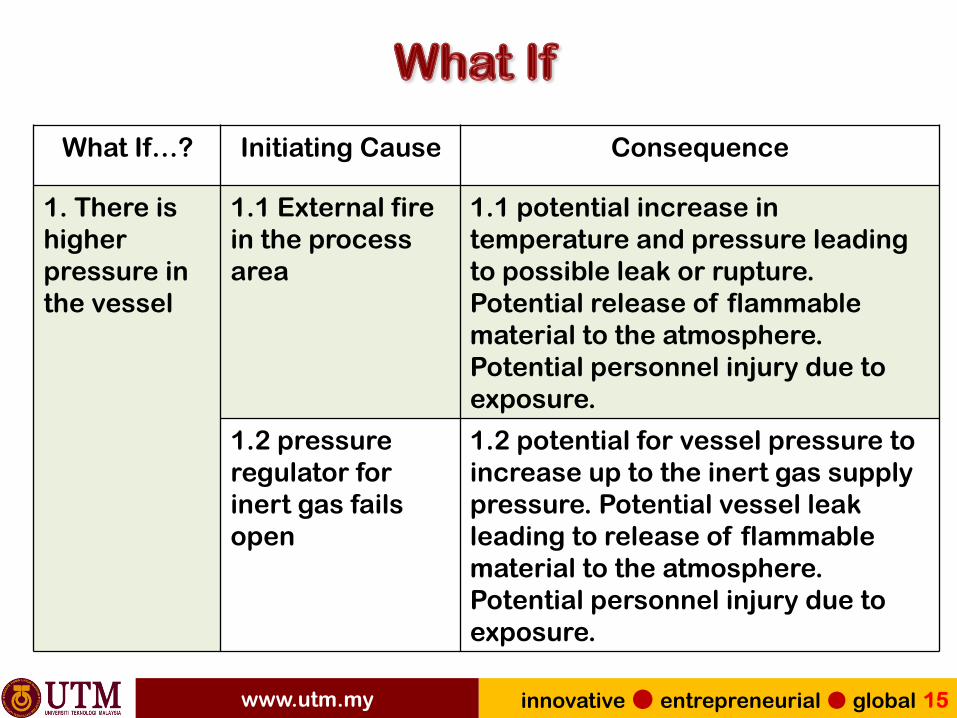
What If…? Initiating Cause Consequence
1. There is higher pressure in the vessel
1.1 External fire in the process area
1.1 potential increase in temperature and pressure leading to possible leak or rupture. Potential release of flammable material to the atmosphere. Potential personnel injury due to exposure.
1.2 pressure regulator for inert gas fails open
1.2 potential for vessel pressure to increase up to the inert gas supply pressure. Potential vessel leak leading to release of flammable material to the atmosphere. Potential personnel injury due to exposure.

www.utm.my innovative ● entrepreneurial ● global 16

www.utm.my innovative ● entrepreneurial ● global 17
● Review an installation against known hazards identified on previous studies of similar plant
● Examine the checklist for relevance to plant being studied – Ask questions based on a pre-defined list
● The checklist is a corporate memory of what could go wrong – Should be augmented by industrial-wide
experience when available

www.utm.my innovative ● entrepreneurial ● global 18
● Is quick and simple to perform and is easily understood
● Makes use of existing experience and knowledge of previous systems
● Helps check compliance with standard practice and design intention
● Ensures that known hazards are fully explored

www.utm.my innovative ● entrepreneurial ● global 19
● Does not provide a list of initiating events (failure cases) for a QRA
● May not be comprehensive and does not encourage analysts to consider new or unusual hazards
● Highly dependent upon the quality of the prepared checklists

www.utm.my innovative ● entrepreneurial ● global 20
● Causes of accidents – Process equipment
– Human error – External events
● Facility Functions – Alarms, construction materials, control systems,
documentation and training, instrumentation, piping, pumps, vessels, etc.
www.utm.my innovative ● entrepreneurial ● global 21
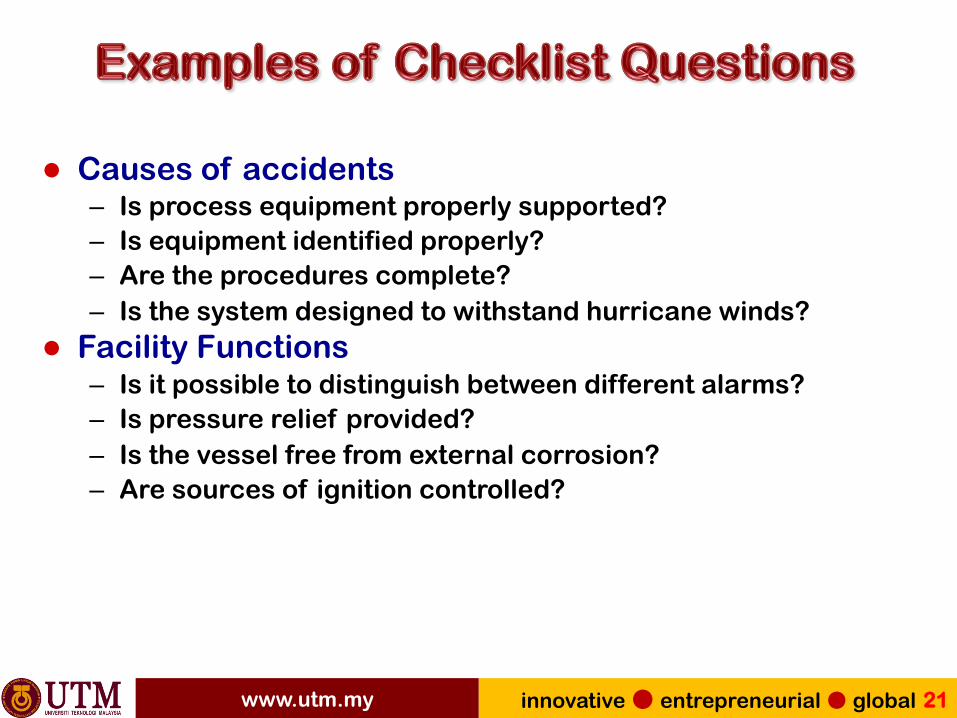
● Causes of accidents – Is process equipment properly supported? – Is equipment identified properly? – Are the procedures complete? – Is the system designed to withstand hurricane winds?
● Facility Functions – Is it possible to distinguish between different alarms? – Is pressure relief provided? – Is the vessel free from external corrosion? – Are sources of ignition controlled?

www.utm.my innovative ● entrepreneurial ● global 22

www.utm.my innovative ● entrepreneurial ● global 23
● Hazard indices give a quantitative indication of the relative potential for hazardous incidents associated with a given plant or process. They are used to most effect at the early design stage of a new plant.
● The best known hazard indices are the Dow Index (1981) and the Mond Index (1979).

www.utm.my innovative ● entrepreneurial ● global 24
● Operates like an income tax form. ● Penalties for unsafe situations ● Credits for control and mitigation
● Produces a number - the bigger the number the greater the hazard.
● Only considers flammable materials ● Not effective for procedures.

www.utm.my innovative ● entrepreneurial ● global 25

www.utm.my innovative ● entrepreneurial ● global 26
• Considers toxic materials only.
• Includes simple source and dispersion models.
• Not effective for procedures.
Dow Criteria: If sum of F&EI and CEI > 128, then more detailed hazard review procedure required.

www.utm.my innovative ● entrepreneurial ● global 27
● Objectives of Mond Index – To Identify, Assess and Minimize potential hazards on
chemical plants units for new and existing processes
● About Mond Index – Index primarily concerned with fire and explosion problem. – Toxicity is considered only as possible complicating factor.
– Method gives credits for plant safety features (both hardware and software).
www.utm.my innovative ● entrepreneurial ● global 28
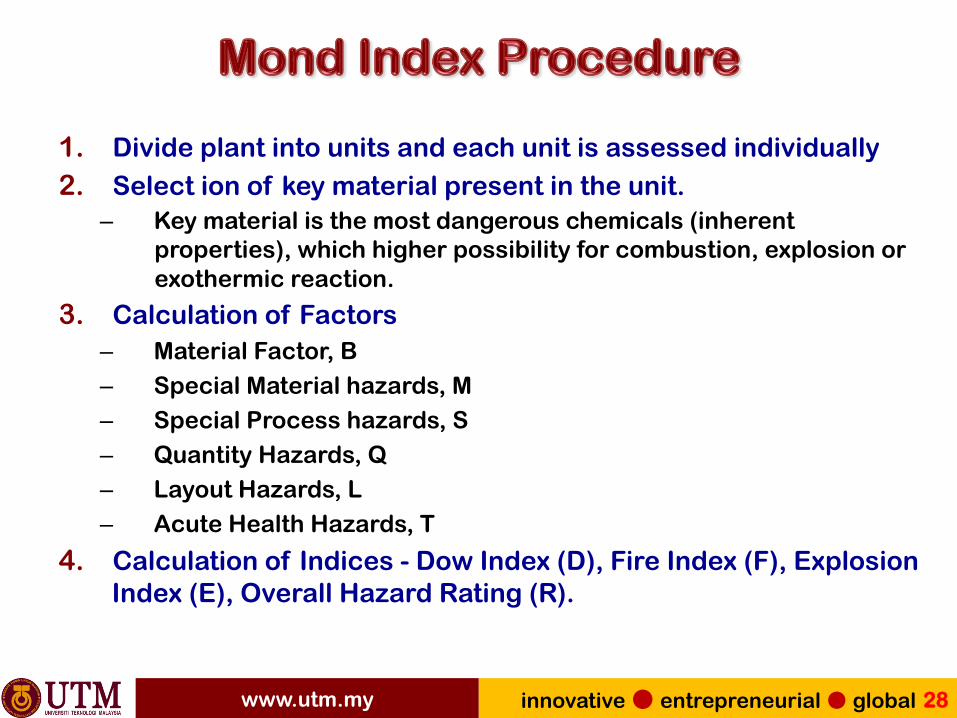
1. Divide plant into units and each unit is assessed individually 2. Select ion of key material present in the unit.
– Key material is the most dangerous chemicals (inherent properties), which higher possibility for combustion, explosion or exothermic reaction.
3. Calculation of Factors – Material Factor, B – Special Material hazards, M – Special Process hazards, S – Quantity Hazards, Q – Layout Hazards, L – Acute Health Hazards, T
4. Calculation of Indices - Dow Index (D), Fire Index (F), Explosion Index (E), Overall Hazard Rating (R).

www.utm.my innovative ● entrepreneurial ● global 29
The most important criteria - overall hazard rating, R
Overall Hazard Rating Category
0-20 Mild
20-100 Low
100-500 Moderate
500-1100 High (group 1)
1100-2500 High (group 2)
2500-12,500 Very high
12,500-65,0000 Extreme
> 65,000 Very extreme

www.utm.my innovative ● entrepreneurial ● global 30

www.utm.my innovative ● entrepreneurial ● global 31
● Performed by a team of multidisciplinary experts ● The analyses are carried out based on area by area
basis – It is focusing on location of the process
● The discussion proceeds through the installation’s modules or operations using guide words to identify potential hazards, its causes, and possible consequences
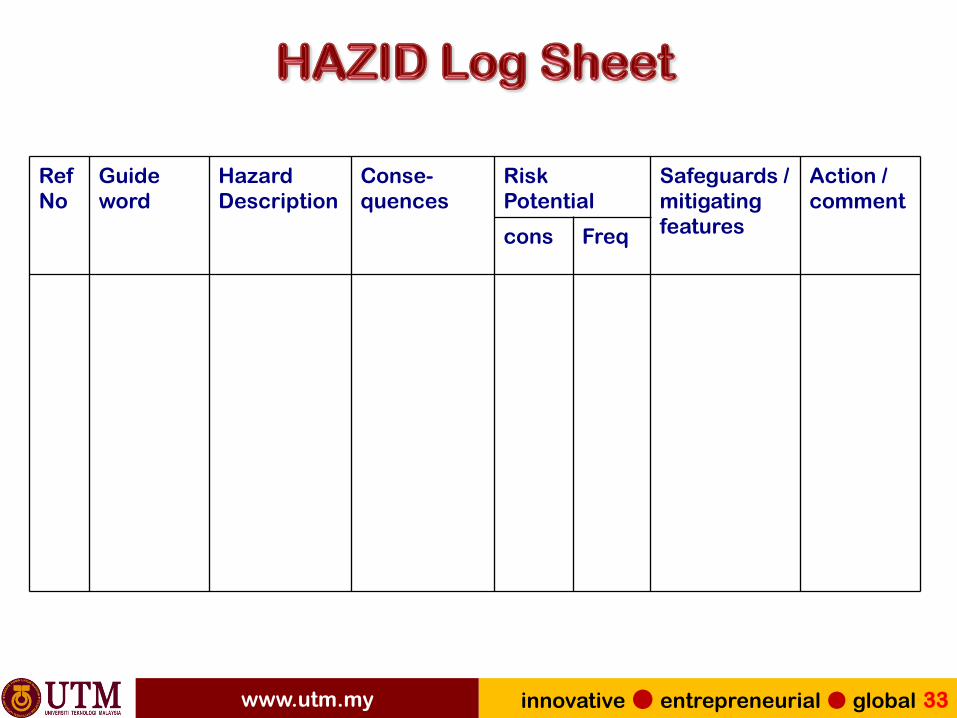
● The outcomes are summarized in HAZID Log Sheet

www.utm.my innovative ● entrepreneurial ● global 32
www.utm.my innovative ● entrepreneurial ● global 33
Ref No
Guide word Hazard
Description Conse-quences Risk
Potential Safeguards /mitigating features
Action / comment
cons Freq

www.utm.my innovative ● entrepreneurial ● global 34

www.utm.my innovative ● entrepreneurial ● global 35
● Performed by a team of multidisciplinary experts ● The process is divided into distinct subsections or
nodes – It is focusing on plant component/equipment
● On each node, detailed brainstorming is conducted facilitated by a HAZOP Leader – Based on the design intent of each equipment specified by the
node, possible deviations are examined, aided by guidewords and process parameters
– Causes, consequences are identified and existing protection prescribed by the design are assessed. Based on these, recommendations are put forward
● The outcome is summarized in a HAZOP Log Sheet

www.utm.my innovative ● entrepreneurial ● global 36
● No: negation of design intention; no part of design intention is achieved but nothing else happens
● More: Quantitative increase ● Less: Quantitative decrease
● As well as: Qualitative increase where all design intention is achieved plus additional activity
● Part of: Qualitative decrease where only part of the design intention is achieved
● Reverse: logical opposite of the intention
● Other than: complete substitution, where no part of the original intention is achieved but something quite different happen – Contamination, corrosion, sand deposits etc

www.utm.my innovative ● entrepreneurial ● global 37
Deviation Causes Consequences Protection Action Guideword + Parameter Guideword: No, Less, More, reverse etc Parameter: Flow, temperature, level etc
Possible causes of the deviation
Effect of deviation of plant safety and operability
Safety provision already considered. - Prevent causes - prevent/ reduce consequence - monitor/ detect
Is the protection sufficient? If not, propose suitable action or recommendation
● Based on the selected NODE and the design intent of the node, HAZOP study is conducted. The output is summarised in HAZOP Log Sheet
Example: Simplified HAZOP Log Sheet

www.utm.my innovative ● entrepreneurial ● global 38

www.utm.my innovative ● entrepreneurial ● global 39
● LOPA is a semi-quantitative risk analysis technique that is applied following a qualitative hazard identification tool such as HAZOP.
● Similar to HAZOP LOPA uses a multi-discipline team ● LOPA can be easily applied after the HAZOP, but before
fault tree analysis
● LOPA focuses the risk reduction efforts toward the impact events with the highest risks.
● It provides a rational basis to allocate risk reduction resources efficiently.
● LOPA suggests the required Independent Layer of Protection (IPL) required for the system to meet the required Safety Integrity Level (SIL)

www.utm.my innovative ● entrepreneurial ● global 40
● There are five basic steps in LOPA: 1. Identify the scenarios
2. Select an accident scenario 3. Identify the initiating event of the scenario and
determine the initiating event frequency (events per year)
4. Identify the Independent Protection Layers (IPL) and estimate the probability of failure on demand of each IPL
5. Estimate the risk of scenario

www.utm.my innovative ● entrepreneurial ● global 41
PFD=0.1 PFD=0.1 PFD=0.01
Different Scenario Consequence Occurs
Unmitigated Risk
Initiating Event Frequency = 1/yr
Failure = 0.1
Failure = 0.1
Failure = 0.01
Success = 0.9
Success = 0.9
Success= 0.99
Frequency 0.0001/yr Consequences exceeding criteria
Mitigative Feature
Preventive Feature
Preventive Feature
Mitigated Risk = reduced frequency * reduced
consequence
Frequency = 0.9/yr, Safe Outcome
Frequency = 0.09/yr Safe Outcome
Frequency = 0.0099/yr Mitigated Release, tolerable outcome

www.utm.my innovative ● entrepreneurial ● global 42
Consequence & Severity
Initiating event (cause)
Initiating event challenge frequency /year
Preventive independent protection layers Probability of failure on demand (PFD)
Mitigation independent protection layer (PFD)
Mitigated consequence frequency /year
Process design
BPCS Operator response to alarm
SIF (PLC relay)
iJiiIi
ij
J
j
Ii
Ci
PFDPFDPFDf
PFDff
×××=
Π×==
...21
1
ievent initiatingfor C econsequencagainst protects
that IPLjth theof demandon failure ofy probabilit ievent initiatingfor requency frequency
ievent initiatingfor C econsequencfor frequency
=
=
=
ij
Ii
Ci
PFDff

www.utm.my innovative ● entrepreneurial ● global 43

www.utm.my innovative ● entrepreneurial ● global 44
● Performed by a team or a single analyst ● Systematic review
– Considers each component in turn
– Subjectively evaluates effects of failure
● Based on tabular format ● FMECA includes critical analysis

www.utm.my innovative ● entrepreneurial ● global 45
• Rupture • Crack
• Leak • Plugged
• Failure to open
• Failure to close • Failure to stop
• Failure to start • Failure to continue
• Spurious stop
• Spurious start • Loss of function
• High pressure • Low pressure
• High temperature
• Low temperature • Overfilling
• Hose bypass • Instrument bypassed
www.utm.my innovative ● entrepreneurial ● global 46
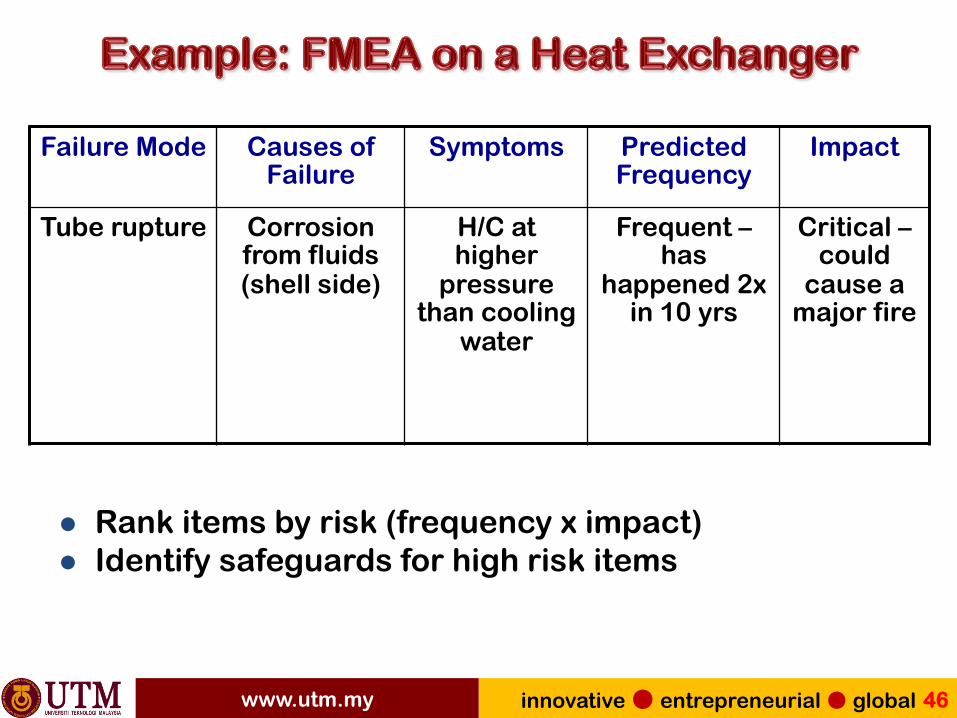
Failure Mode Causes of Failure
Symptoms Predicted Frequency
Impact
Tube rupture Corrosion from fluids (shell side)
H/C at higher
pressure than cooling
water
Frequent – has
happened 2x in 10 yrs
Critical – could
cause a major fire
l Rank items by risk (frequency x impact) l Identify safeguards for high risk items

www.utm.my innovative ● entrepreneurial ● global 47

www.utm.my innovative ● entrepreneurial ● global 48
● Provides a traceable, logical, quantitative representation of causes, consequences and event combinations
● Not intuitive, requires training ● Top-down analysis ● Graphical method that starts with a hazardous event
and works backwards to identify the causes of the top event
● Intermediate events related to the top event are combined by using logical operations such as AND and OR.
● Not particularly useful when temporal aspects are important
www.utm.my innovative ● entrepreneurial ● global 49
P1
M
S
P2
F1
F2
E
C1 C2
R
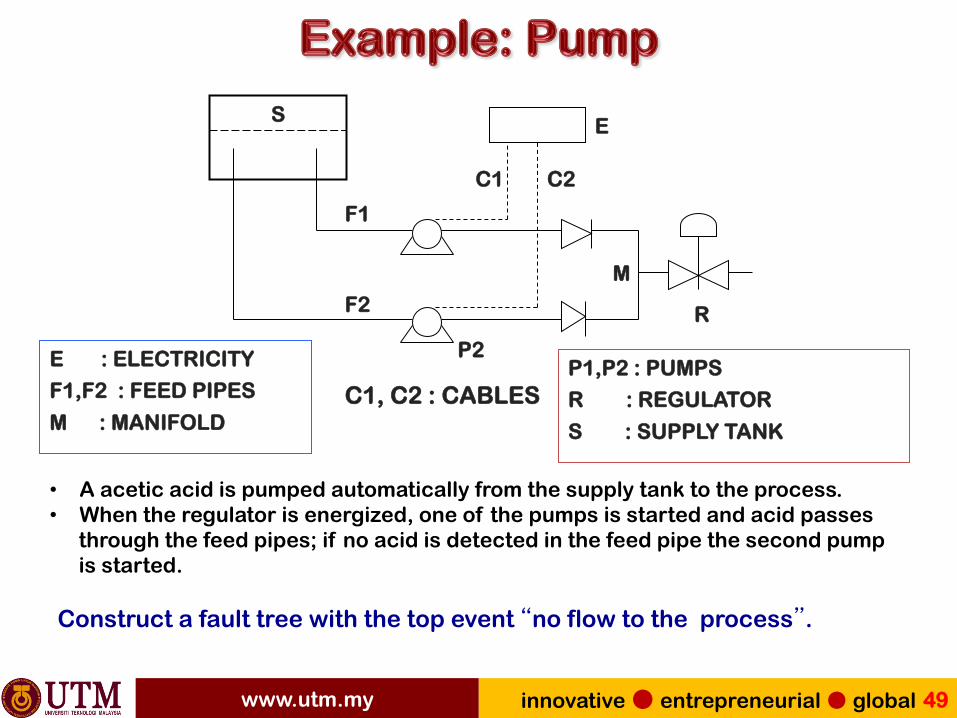
E : ELECTRICITY
F1,F2 : FEED PIPES
M : MANIFOLD
P1,P2 : PUMPS
R : REGULATOR
S : SUPPLY TANK
C1, C2 : CABLES
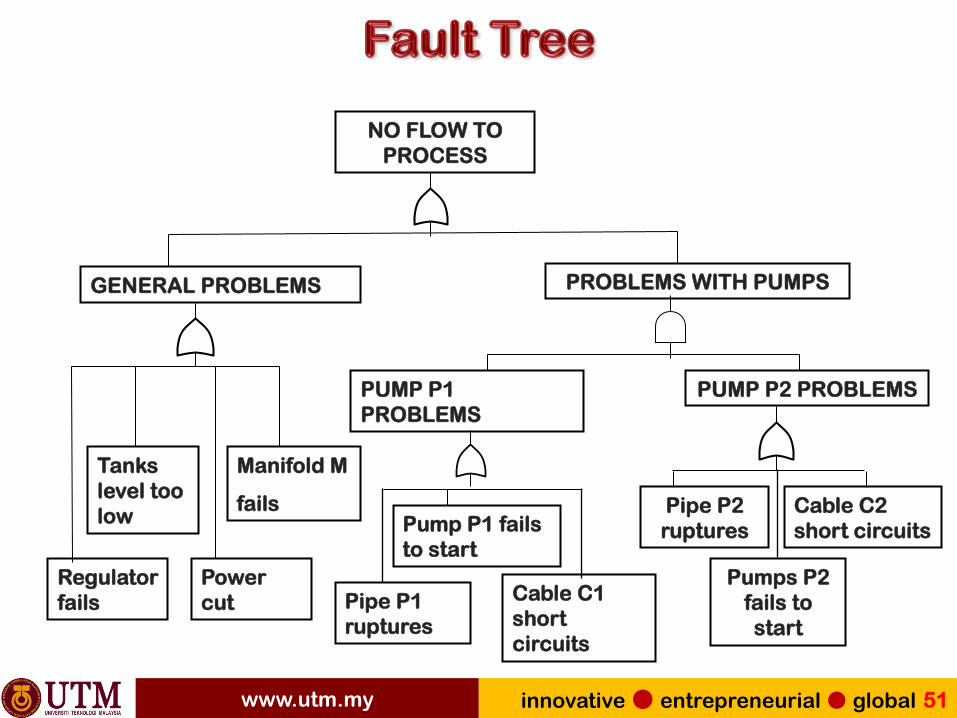
• A acetic acid is pumped automatically from the supply tank to the process. • When the regulator is energized, one of the pumps is started and acid passes
through the feed pipes; if no acid is detected in the feed pipe the second pump is started.
Construct a fault tree with the top event “no flow to the process”.

www.utm.my innovative ● entrepreneurial ● global 50
Component Symbol Failure Mode
Cables
Electricity supply
Feed pipes
Manifold
Pumps
Regulator
Supply tank
C1 + C2
E
F1 + F2
M
P1 + P2
R
S
short-circuit
power cut
rupture of pipe
Rupture
fail to start
fail to open on
level too low
www.utm.my innovative ● entrepreneurial ● global 51
NO FLOW TO PROCESS
GENERAL PROBLEMS PROBLEMS WITH PUMPS
Regulator fails
Tanks level too low
Power cut
Manifold M
fails
PUMP P1 PROBLEMS
PUMP P2 PROBLEMS
Pipe P1 ruptures
Pump P1 fails to start
Cable C1 short circuits
Pipe P2 ruptures
Pumps P2 fails to start
Cable C2 short circuits

www.utm.my innovative ● entrepreneurial ● global 52
www.utm.my innovative ● entrepreneurial ● global 53
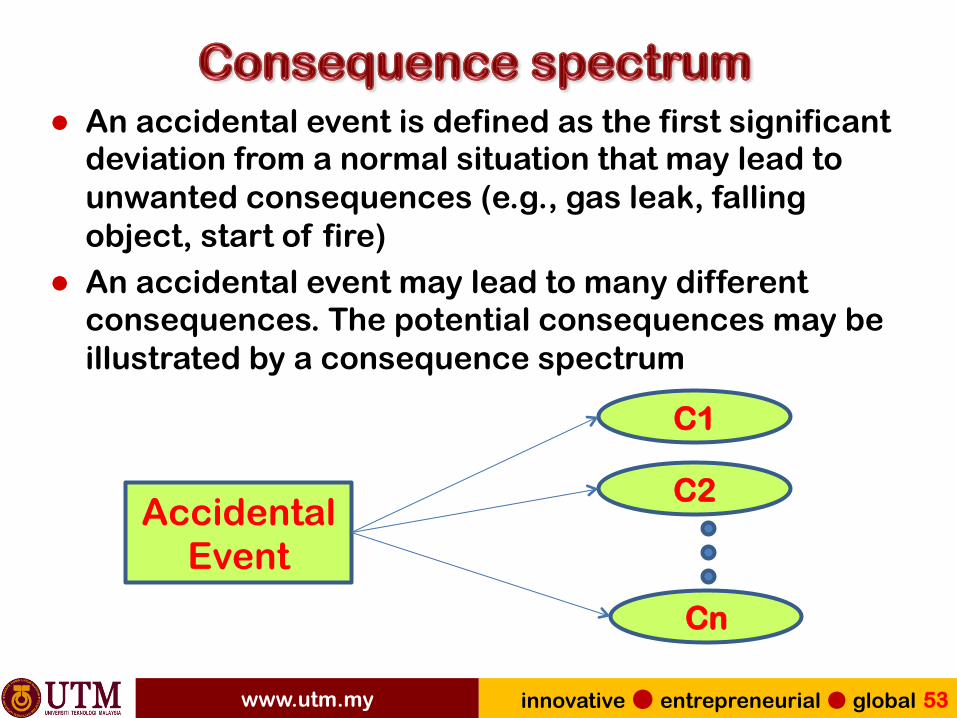
● An accidental event is defined as the first significant deviation from a normal situation that may lead to unwanted consequences (e.g., gas leak, falling object, start of fire)
● An accidental event may lead to many different consequences. The potential consequences may be illustrated by a consequence spectrum
Accidental Event
C1
Cn
C2

www.utm.my innovative ● entrepreneurial ● global 54
● Failure of barrier – Most well designed systems have one or more
barriers that are implemented to stop or reduce the consequences of potential accidental events.
● Other Factors – Whether a gas release is ignited or not – Whether or not there are people present when
the accidental event occurs
– Wind direction when the accidental event
www.utm.my innovative ● entrepreneurial ● global 55
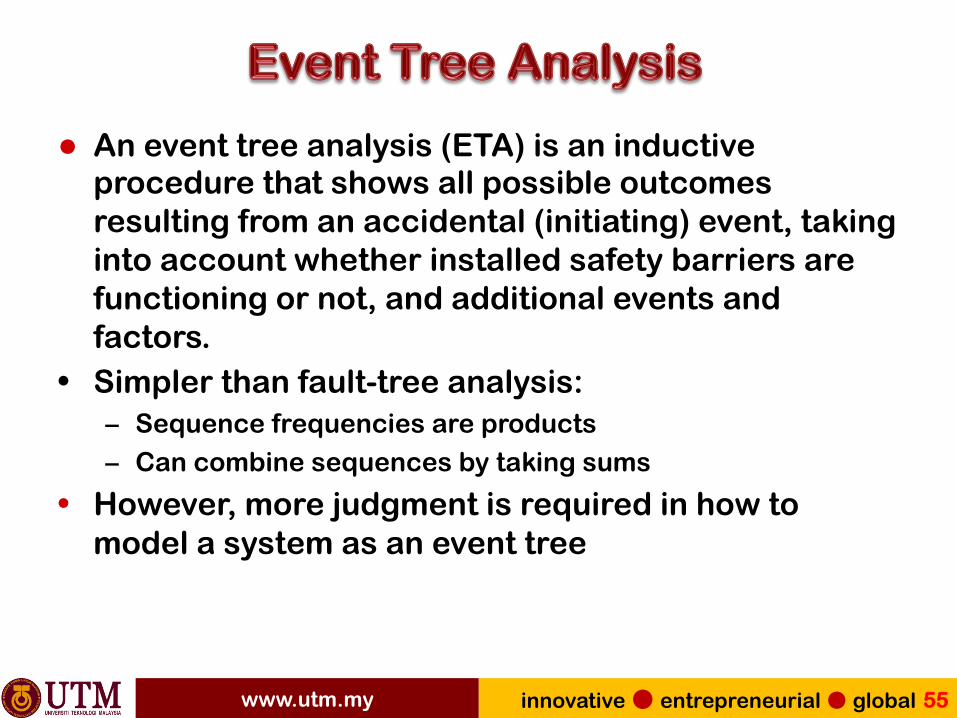
● An event tree analysis (ETA) is an inductive procedure that shows all possible outcomes resulting from an accidental (initiating) event, taking into account whether installed safety barriers are functioning or not, and additional events and factors.
• Simpler than fault-tree analysis: – Sequence frequencies are products
– Can combine sequences by taking sums
• However, more judgment is required in how to model a system as an event tree

www.utm.my innovative ● entrepreneurial ● global 56
This event tree was constructed to analyze the possible outcomes of a system fire. The system has 2 components designed to handle this event: a sprinkler system and an automated call to the fire department. If the fire department is not notified, the fire will be mostly contained by the sprinkler system. If the sprinkler system fails as well, the system will be destroyed.

www.utm.my innovative ● entrepreneurial ● global 57