products: Analytical methods to define nanoparticles Characterisation of titanium ... ·...
35
Subscriber access provided by UNIV OF NORTH CAROLINA Journal of Agricultural and Food Chemistry is published by the American Chemical Society. 1155 Sixteenth Street N.W., Washington, DC 20036 Published by American Chemical Society. Copyright © American Chemical Society. However, no copyright claim is made to original U.S. Government works, or works produced by employees of any Commonwealth realm Crown government in the course of their duties. Article Characterisation of titanium dioxide nanoparticles in food products: Analytical methods to define nanoparticles Ruud J.B. Peters, Greet van Bemmel, Zahira Herrera-Rivera, Johannes P.F.G. Helsper, Hans J.P. Marvin, Stefan Weigel, Peter Tromp, Agnes G. Oomen, Anton Rietveld, and Hans Bouwmeester J. Agric. Food Chem., Just Accepted Manuscript • Publication Date (Web): 16 Jun 2014 Downloaded from http://pubs.acs.org on June 18, 2014 Just Accepted “Just Accepted” manuscripts have been peer-reviewed and accepted for publication. They are posted online prior to technical editing, formatting for publication and author proofing. The American Chemical Society provides “Just Accepted” as a free service to the research community to expedite the dissemination of scientific material as soon as possible after acceptance. “Just Accepted” manuscripts appear in full in PDF format accompanied by an HTML abstract. “Just Accepted” manuscripts have been fully peer reviewed, but should not be considered the official version of record. They are accessible to all readers and citable by the Digital Object Identifier (DOI®). “Just Accepted” is an optional service offered to authors. Therefore, the “Just Accepted” Web site may not include all articles that will be published in the journal. After a manuscript is technically edited and formatted, it will be removed from the “Just Accepted” Web site and published as an ASAP article. Note that technical editing may introduce minor changes to the manuscript text and/or graphics which could affect content, and all legal disclaimers and ethical guidelines that apply to the journal pertain. ACS cannot be held responsible for errors or consequences arising from the use of information contained in these “Just Accepted” manuscripts.
Transcript of products: Analytical methods to define nanoparticles Characterisation of titanium ... ·...
Subscriber access provided by UNIV OF NORTH CAROLINA
Journal of Agricultural and Food Chemistry is published by the American ChemicalSociety. 1155 Sixteenth Street N.W., Washington, DC 20036Published by American Chemical Society. Copyright © American Chemical Society.However, no copyright claim is made to original U.S. Government works, or worksproduced by employees of any Commonwealth realm Crown government in the courseof their duties.
Article
Characterisation of titanium dioxide nanoparticles in foodproducts: Analytical methods to define nanoparticles
Ruud J.B. Peters, Greet van Bemmel, Zahira Herrera-Rivera, Johannes P.F.G. Helsper, Hans J.P.Marvin, Stefan Weigel, Peter Tromp, Agnes G. Oomen, Anton Rietveld, and Hans Bouwmeester
J. Agric. Food Chem., Just Accepted Manuscript • Publication Date (Web): 16 Jun 2014
Downloaded from http://pubs.acs.org on June 18, 2014
Just Accepted
“Just Accepted” manuscripts have been peer-reviewed and accepted for publication. They are postedonline prior to technical editing, formatting for publication and author proofing. The American ChemicalSociety provides “Just Accepted” as a free service to the research community to expedite thedissemination of scientific material as soon as possible after acceptance. “Just Accepted” manuscriptsappear in full in PDF format accompanied by an HTML abstract. “Just Accepted” manuscripts have beenfully peer reviewed, but should not be considered the official version of record. They are accessible to allreaders and citable by the Digital Object Identifier (DOI®). “Just Accepted” is an optional service offeredto authors. Therefore, the “Just Accepted” Web site may not include all articles that will be publishedin the journal. After a manuscript is technically edited and formatted, it will be removed from the “JustAccepted” Web site and published as an ASAP article. Note that technical editing may introduce minorchanges to the manuscript text and/or graphics which could affect content, and all legal disclaimersand ethical guidelines that apply to the journal pertain. ACS cannot be held responsible for errorsor consequences arising from the use of information contained in these “Just Accepted” manuscripts.

Characterisation of titanium dioxide nanoparticles in food
products: Analytical methods to define nanoparticles
Ruud J.B. Petersa, Greet van Bemmel
a, Zahira Herrera Rivera
a, Hans P.F.G. Helsper
a, Hans
J.P. Marvina, Stefan Weigel
a, Peter C. Tromp
b, Agnes G. Oomen
c, Anton G. Rietveld
c and
Hans Bouwmeestera
a RIKILT Wageningen UR, Akkermaalsbos 2, 6708 WB, Wageningen, The Netherlands
b TNO Applied Environmental Chemistry, Princetonlaan 6, 3584 CB, Utrecht, The
Netherlands
c National Institute for Public Health and the Environment, Antonie van Leeuwenhoeklaan 9,
3720 BA, Bilthoven, The Netherlands
Page 1 of 34
ACS Paragon Plus Environment
Journal of Agricultural and Food Chemistry

Abstract 1
Titanium dioxide (TiO2) is a common food additive used to enhance the white colour, 2
brightness and sometimes flavour of a variety of food products. In this study seven food grade 3
TiO2 materials (E171), 24 food products and three personal care products were investigated 4
for their TiO2 content and the number-based size distribution of TiO2 particles present in these 5
products. Three principally different methods have been used to determine the number-based 6
size distribution of TiO2 particles: electron microscopy, asymmetric flow field-flow 7
fractionation combined with inductively coupled mass spectrometry and single-particle 8
inductively coupled mass spectrometry. The results show that all E171 materials have similar 9
size distributions with primary particle sizes in the range of 60 to 300 nm. Depending on the 10
analytical method used, 10-15% of the particles in these materials had sizes below 100 nm. In 11
24 of the 27 foods and personal care products detectable amounts of titanium were found 12
ranging from 0.02 to 9.0 mg TiO2/g product. The number-based size distributions for TiO2 13
particles in the food and personal care products showed that 5-10% of the particles in these 14
products had sizes below 100 nm, comparable to that found in the E171 materials. 15
Comparable size distributions were found using the three principally different analytical 16
methods. While the applied methods are considered state of the art, they showed practical size 17
limits for TiO2 particles in the range of 20 to 50 nm which may introduce a significant bias in 18
the size distribution since particles <20 nm are excluded. This shows the inability of current 19
state of the art methods to support the EU recommendation for the definition of 20
nanomaterials. 21
22
Keywords 23
Titanium dioxide, food additive, nanomaterial, AF4, ICP-MS, single particle ICP-MS 24
Page 2 of 34
ACS Paragon Plus Environment
Journal of Agricultural and Food Chemistry
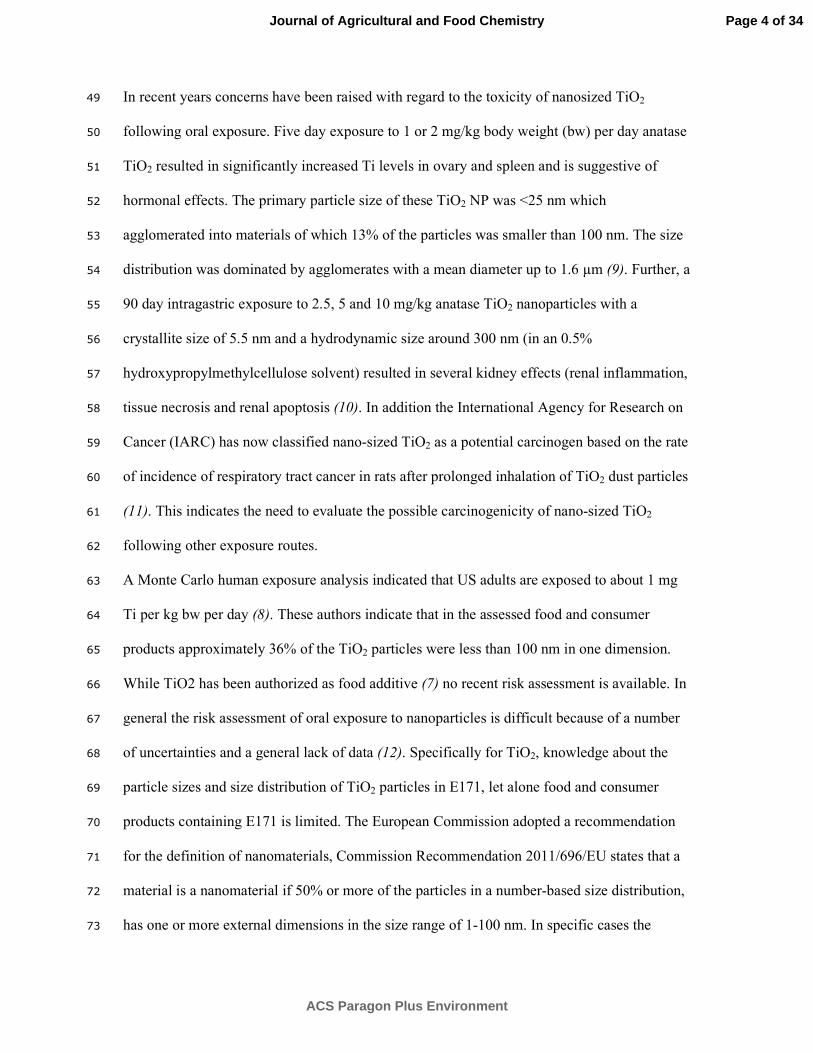
Introduction 25
26
Titanium dioxide (TiO2) is a naturally occurring oxide of the element titanium also referred to 27
as titania. This substance occurs naturally as three mineral compounds known as anatase, 28
rutile and brookite. There are a number of industrial applications for this mineral because of 29
its very high refraction properties. In fact, TiO2 is one of the whitest materials known to exist, 30
hence the name "titanium white". For this reason, it is often included in cosmetic preparations 31
and sunblock’s to reflect light away from the skin. It is also incorporated in paints and in a 32
number of construction and building materials. Scattering of light by TiO2 is maximized in 33
particles that are 200–300 nm in diameter, and most commercial products that are used as 34
pigments have primary particle sizes within this range (1). The size distribution of 35
ultrasonically dispersed primary particles and aggregates generally ranges from <100 to 500 36
nm (2, 3, 4). Ultrafine TiO2 particles range in size from 1 to 150 nm with a mean primary 37
particle size of 10–50 nm (3). These ultrafine TiO2 particles are mainly used for special 38
applications such as photo catalysts. Since the refractive power of TiO2 particles is higher at 39
the nanoscale, many applications of TiO2 such as sunscreens, cosmetics, coatings and 40
especially photo catalytic applications would benefit from smaller primary particle sizes and 41
therefore it is expected that the percentage of TiO2 that is produced in or near the nano-size 42
range will increase (5, 6). 43
TiO2 is commonly used as food additive, and is authorized for its use in the EU as E171 (7). 44
As a pigment, TiO2 is used to enhance the white colour of certain foods, such as dairy 45
products and candy. It also lends brightness to toothpaste and some medications. However, it 46
is also used as a food additive and flavour enhancer in a variety of non-white foods, including 47
dried vegetables, nuts, seeds, soups, and mustard, as well as beer and wine (8). 48
Page 3 of 34
ACS Paragon Plus Environment
Journal of Agricultural and Food Chemistry
In recent years concerns have been raised with regard to the toxicity of nanosized TiO2 49
following oral exposure. Five day exposure to 1 or 2 mg/kg body weight (bw) per day anatase 50
TiO2 resulted in significantly increased Ti levels in ovary and spleen and is suggestive of 51
hormonal effects. The primary particle size of these TiO2 NP was <25 nm which 52
agglomerated into materials of which 13% of the particles was smaller than 100 nm. The size 53
distribution was dominated by agglomerates with a mean diameter up to 1.6 µm (9). Further, a 54
90 day intragastric exposure to 2.5, 5 and 10 mg/kg anatase TiO2 nanoparticles with a 55
crystallite size of 5.5 nm and a hydrodynamic size around 300 nm (in an 0.5% 56
hydroxypropylmethylcellulose solvent) resulted in several kidney effects (renal inflammation, 57
tissue necrosis and renal apoptosis (10). In addition the International Agency for Research on 58
Cancer (IARC) has now classified nano-sized TiO2 as a potential carcinogen based on the rate 59
of incidence of respiratory tract cancer in rats after prolonged inhalation of TiO2 dust particles 60
(11). This indicates the need to evaluate the possible carcinogenicity of nano-sized TiO2 61
following other exposure routes. 62
A Monte Carlo human exposure analysis indicated that US adults are exposed to about 1 mg 63
Ti per kg bw per day (8). These authors indicate that in the assessed food and consumer 64
products approximately 36% of the TiO2 particles were less than 100 nm in one dimension. 65
While TiO2 has been authorized as food additive (7) no recent risk assessment is available. In 66
general the risk assessment of oral exposure to nanoparticles is difficult because of a number 67
of uncertainties and a general lack of data (12). Specifically for TiO2, knowledge about the 68
particle sizes and size distribution of TiO2 particles in E171, let alone food and consumer 69
products containing E171 is limited. The European Commission adopted a recommendation 70
for the definition of nanomaterials, Commission Recommendation 2011/696/EU states that a 71
material is a nanomaterial if 50% or more of the particles in a number-based size distribution, 72
has one or more external dimensions in the size range of 1-100 nm. In specific cases the 73
Page 4 of 34
ACS Paragon Plus Environment
Journal of Agricultural and Food Chemistry
number-based size distribution threshold of 50% may be replaced by a threshold between 1 74
and 50% (13). Currently the recommendation is under review, the discussion is focused on the 75
percentage of the number-based size distribution below the 100 nm to classify a material as 76
nanomaterial. Yet no internationally agreed method to determine the number-based size 77
distribution has been proposed. Therefore we used a combination of analytical methods as 78
suggested by Linsinger (14). 79
In this study we aimed to provide more information on the number-based size distribution of 80
food grade TiO2 ingredients and its occurrence in consumer products since this is required to 81
increase the reliability of the human food exposure studies as part of the risk assessment. We 82
used a combination of methods for this, asymmetric flow field-flow fractionation on-line with 83
inductively coupled plasma mass spectrometry (AF4-ICP-MS) and two methods that provide 84
number-based size distributions: scanning electron microscopy (SEM), and single particle 85
ICP-MS (sp-ICP-MS). Comparable size-distributions were found indicating that these 86
methods can reliably be used to enforce food labelling in line with recommendation of the EU 87
definition of nanomaterials. 88
89
90
Experimental 91
92
Samples. In this study three types of samples were involved, firstly, several types of TiO2 93
food additive E171, secondly food products as cakes, candy and chewing gum, and lastly 94
personal care products as toothpaste. In total seven E171 materials, all food grades and four 95
labelled as E171, were received from suppliers in China, Germany, Italy, the Netherlands and 96
the United Kingdom, and consisted of fine white powders. In total 24 food products and 3 97
personal care products were investigated. All these products were purchased in 2012 from 98
Page 5 of 34
ACS Paragon Plus Environment
Journal of Agricultural and Food Chemistry

regular shops in the Netherlands. Since food labelling for titanium dioxide may be imprecise, 99
20 products that listed "E171", “TiO2” or "titanium dioxide" on the package were selected, as 100
well as seven products without this labelling but with a typical white colour. Samples were 101
stored in a clean, dry and dark location and analysed before the expiration data. 102
103
Determination of total titanium content. For the determination of the total titanium content 104
of the TiO2 materials a suspension of these materials was prepared according to Jensen (15). 105
In short, ca. 15 mg bovine serum albumine (BSA) is dissolved and diluted in Milli-Q water to 106
reach a final concentration of 10 mg/ml. This solution is filtered over a 0.2µm-pore size filter 107
and diluted twentyfold with Milli-Q water to a final concentration of 0.5 mg/ml BSA. An 108
accurately weighed sample of ca. 15 mg finely powdered TiO2 material is brought into a 30 109
ml vial. Then 30 µL of 96% ethanol is added and distributed equally over the TiO2 material 110
followed by 970 µL of the 0.5 mg/mL BSA solution. The mixture is shaken manually and 111
another 5 ml of the 0.5 mg/mL BSA solution is added and the final suspension shaken 112
manually to obtain a homogenous suspension. While the sample vial is cooled in ice water, 113
the suspension is sonicated with a Misonix XL-2000 sonicator with a CML-4 needle probe for 114
16 min at 22.5 KHz and 4 W power. The final suspension is used as such, or after further 115
dilution to the desired concentration with the 0.5 mg/mL BSA solution. Suspensions prepared 116
in this way showed to be stable for at least three days. From each suspension a subsample was 117
collected in a perfluoroalkoxy (PFA) digestion vial to which 8 mL of nitric acid (70% HNO3) 118
and 2 mL of hydrogen fluoride (50% HF) was added. For the determination of the total 119
titanium content of the food and personal care products the whole sample was cut into small 120
pieces, grinded and a representative subsample was used for analysis. An analytical sample of 121
ca. 0.5 g was collected from each sample and brought into a PFA digestion vial to which 6 122
mL of nitric acid (70% HNO3), 2 mL of hydrofluoric acid (50% HF) and 2 mL of hydrogen 123
Page 6 of 34
ACS Paragon Plus Environment
Journal of Agricultural and Food Chemistry

peroxide (30% H2O2) was added. All samples were digested in a MARS microwave system 124
for 50 min. The temperature program was as follows; at 1200 W power from 20°C to 150°C 125
in 15 min, then to 180°C in 15 min, and finally constant at 180°C for 20 min. Following 126
digestion and cooling to room temperature, Milli-Q water was added to a total volume of 50 127
ml. The extracts were shaken manually, diluted to 100 ml and analysed with a Thermo X 128
Series-2 ICP-MS equipped with an autosampler, a conical glass concentric nebulizer, and 129
operated at an RF power of 1400 W. Data acquisition was performed in the selected ion 130
monitoring mode at m/z ratios of 48 and 49 that are characteristic for titanium. Quantification 131
was based on ionic titanium standard diluted in the same acidic matrix. The recovery of the 132
total-Ti method was determined by spiking three products of different matrices in triplicate 133
with known amounts of a TiO2 reference material NM-103. 134
135
Determination of the size distribution in TiO2 materials using electron microscopy. To 136
determine the size distribution of the titanium oxide nanoparticles in the TiO2 materials, 137
suspensions of these materials were studied using electron microscopy. TiO2 suspensions (2.5 138
mg/ml) were filtered over an Anopore aluminium oxide filter with pore size of 20 nm. The 139
filters were mounted on aluminium specimen holders with double-sided adhesive carbon tape 140
and were coated with a 5 nm layer of chromium using an Emitech K575X turbo sputter 141
coater. The filters were analysed with a high-resolution field emission gun scanning electron 142
microscopy in combination with X-ray analysis (FEG-SEM/EDX). The microscope is a 143
Tescan MIRA-LMH FEG-SEM at an accelerating voltage of 15 kV, working distance 10 mm, 144
spot size 5 nm. The EDX spectrometer is a Broker AXS spectrometer with a Quantax 800 145
workstation and an XFlash 4010 detector. The SEM is equipped with Scandium SIS software 146
package (Olympus Soft Imaging Solutions, Germany) for automated particle analysis. With 147
this system the filter area is automatically inspected on a field-by-field basis. In each field of 148
Page 7 of 34
ACS Paragon Plus Environment
Journal of Agricultural and Food Chemistry
view particles are recognized using a pre-selected grayscale video threshold (detection 149
threshold level) to discriminate between particles and filter background. The analysis is 150
conducted using the backscattered electron (BE) mode. From each particle/cluster of particles 151
the projected area equivalent diameter (dpa) is measured. Magnifications were chosen so that 152
their measurable size ranges overlap slightly and cover the particle sizes of interest. To 153
measure dpa values of 25 to 1600 nm, three magnifications of 10.000x, 25.000x and 75.000x 154
were selected. These three magnifications cover eight size bins: 25-40, 40-65, 65-100, 100-155
160, 160-250, 250-400, 400-650, 650-1000 and 1000-1600 nm. Per size bin a minimum of 10 156
particles were measured and in total approximately 1000 particles were measured per sample. 157
In order to ensure that there is no overlap of particles, the total loading of the filter with 158
particles was always less than 10%. Per size bin the mean diameter and the 95% confidence 159
interval is calculated on the basis of the Poisson distribution. 160
161
Quantification and size determination of TiO2 particles using AF4-ICP-MS. For 162
quantification and size determination of particulate TiO2 in TiO2 materials a suspension of 163
these materials was prepared as described before. For quantification and size determination of 164
particulate TiO2 in food and personal care products a representative subsample was prepared 165
and 0.5 g of this sample was brought into a 50 ml glass beaker together with 20 ml of 166
hydrogen peroxide (30% H2O2). The content of the beaker was heated to about 100°C and 167
kept just below the boiling point of the H2O2 matrix. When most of the organic matrix was 168
consumed the content is evaporated until a residue of about 1 ml remains. The content is 169
allowed to cool to room temperature and is diluted to 10 ml with the 0.5 mg/mL BSA 170
solution. Prepared suspensions and extracts are analysed with asymmetric flow field-flow 171
fractionation (AF4) on-line coupled with ICP-MS. The AF4 consisted of a metal free Wyatt 172
Eclipse Dualtec separation system equipped with a 153 x 22 mm flow cell containing a Nadir 173
Page 8 of 34
ACS Paragon Plus Environment
Journal of Agricultural and Food Chemistry

regenerated cellulose separation membrane with 10 kDa molecular weight cut-off and a 174
spacer of 350 µm. The AF4 system was further coupled to an Agilent 1100 system with an 175
auto-injector and a binary pump for eluent flow delivery and degassing. Prior to injection, 176
samples were thoroughly mixed to ensure homogenous distribution of suspended particles. 177
The injection volume was 10 µl and a 7 min focusing time was used. A constant cross flow of 178
0.1 ml/min was applied and the flow rate to the detector was kept at 0.5 ml/min. After 57 min 179
the cross flow was reduced to 0 ml/min within 5 min and kept at 0 mL/min for 5 min to 180
remove any residual particles from the separation channel. The outlet flow of the AF4 system 181
passed through a UV detector and was directly coupled with the ICP-MS system for the 182
selective determination of titanium. The ICP-MS system and settings were as described 183
before. Since no well characterised titanium oxide particles were available for calibration 184
purposes, particle size calculation was based on FFF theory using the Boltzmann constant, the 185
column temperature, the eluent viscosity and the instrumental settings (16, 17). In short, the 186
AF4 separation channel consists of an impermeable top block and a bottom block holding a 187
semipermeable ultrafiltration membrane on top of a porous frit. The perpendicular field is 188
caused by restricting the channel flow at the outlet. This restriction will force part of the 189
carrier liquid to leave the channel through the bottom block and thus causing the cross flow. 190
Prior to elution the analyte is concentrated at a position close to the injection port during a 191
focussing step. Particle equilibrium heights above the membrane in AF4 depend on the 192
diffusion coefficient of the particles and the applied cross flow rate with larger particles being 193
driven closer to the membrane. Retention times are dependent on the equilibrium height at 194
which the particles travel in the parabolic flow profile of the channel flow and are be 195
expressed by: 196
197
t� = �∙�∙�∙�∙�� × ������
�������� equation 1 198
Page 9 of 34
ACS Paragon Plus Environment
Journal of Agricultural and Food Chemistry
199
where tr is the retention time of the analyte; η the viscosity of the eluent; d the hydrodynamic 200
diameter of the particle; ω the channel thickness; k the Boltzmann constant; T the absolute 201
temperature; Vcross the cross flow rate and Vchannel the channel flow rate. With this equation the 202
particle's hydrodynamic diameter can be calculated directly from its retention time. This 203
relation was confirmed by calibration with polystyrene particles. Mass calibration of the ICP-204
MS was performed with one of the TiO2 materials for which it was established that the TiO2 205
content of this material was close to 100%. 206
207
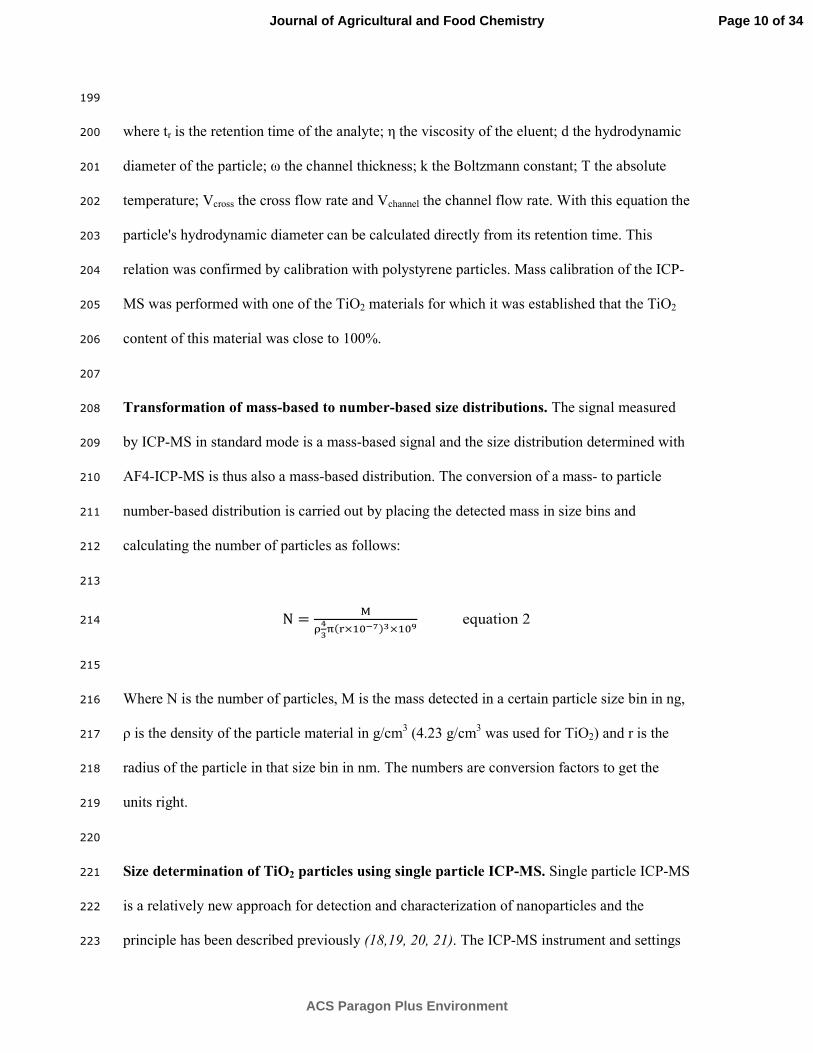
Transformation of mass-based to number-based size distributions. The signal measured 208
by ICP-MS in standard mode is a mass-based signal and the size distribution determined with 209
AF4-ICP-MS is thus also a mass-based distribution. The conversion of a mass- to particle 210
number-based distribution is carried out by placing the detected mass in size bins and 211
calculating the number of particles as follows: 212
213
N = ��������� !"���#
equation 2 214
215
Where N is the number of particles, M is the mass detected in a certain particle size bin in ng, 216
ρ is the density of the particle material in g/cm3 (4.23 g/cm
3 was used for TiO2) and r is the 217
radius of the particle in that size bin in nm. The numbers are conversion factors to get the 218
units right. 219
220
Size determination of TiO2 particles using single particle ICP-MS. Single particle ICP-MS 221
is a relatively new approach for detection and characterization of nanoparticles and the 222
principle has been described previously (18,19, 20, 21). The ICP-MS instrument and settings 223
Page 10 of 34
ACS Paragon Plus Environment
Journal of Agricultural and Food Chemistry

used were as described before only in this case data acquisition was done in the time resolved 224
analysis (TRA) mode. The dwell time was set at 3 ms with a typical acquisition times of 60 s 225
per measurement. Because of the short dwell time it is not possible to switch between 226
different isotopes (switching itself takes ~50 ms) and therefore only one titanium isotope, m/z 227
48, is monitored during measurement. Note that polyatomic interferences are possible, e.g. 228
32S
16O and
36Ar
12C, and also isobaric interference by
48Ca. However, these interferences result 229
in a continues background while TiO2 particles will result in discontinuous signals (peaks) 230
and can thus be distinguished from the background. Since only a part of the nebulized 231
droplets reaches the plasma, the nebulization efficiency needs to be known to determine the 232
actual particle number concentration in the extract. The nebulization efficiency is determined 233
by the analyses of a NIST material, SRM8013, a suspension of 60 nm gold nanoparticles in a 234
citrate buffer, under the same instrumental conditions as the samples but monitoring m/z 197 235
for gold. The nebulization efficiency is calculated from the observed number of particles in 236
the time scan and the particle flux into the ICP-MS system using equation 3. Single particle 237
data are transferred to and processed in Microsoft Excel for the calculation of particle sizes, 238
particle size distributions and particle concentrations. Acquiring data for 60 s at a dwell time 239
of 3 ms results in 20,000 data points consisting of background signals and signals with a 240
much higher intensity originating from particles (figure 1). These particle signals are isolated 241
from the background by plotting a signal distribution, i.e. the frequency with which a signal 242
height occurs as a function of that signal height. This allows the determination of a cut-off 243
point to separate particle signals from the background (figure 2). From the number of the 244
particle signals in the time scan and the nebulization efficiency determined previously with 245
the gold nanoparticles, the particle number concentration in the diluted sample suspension is 246
calculated as follows: 247
248
Page 11 of 34
ACS Paragon Plus Environment
Journal of Agricultural and Food Chemistry
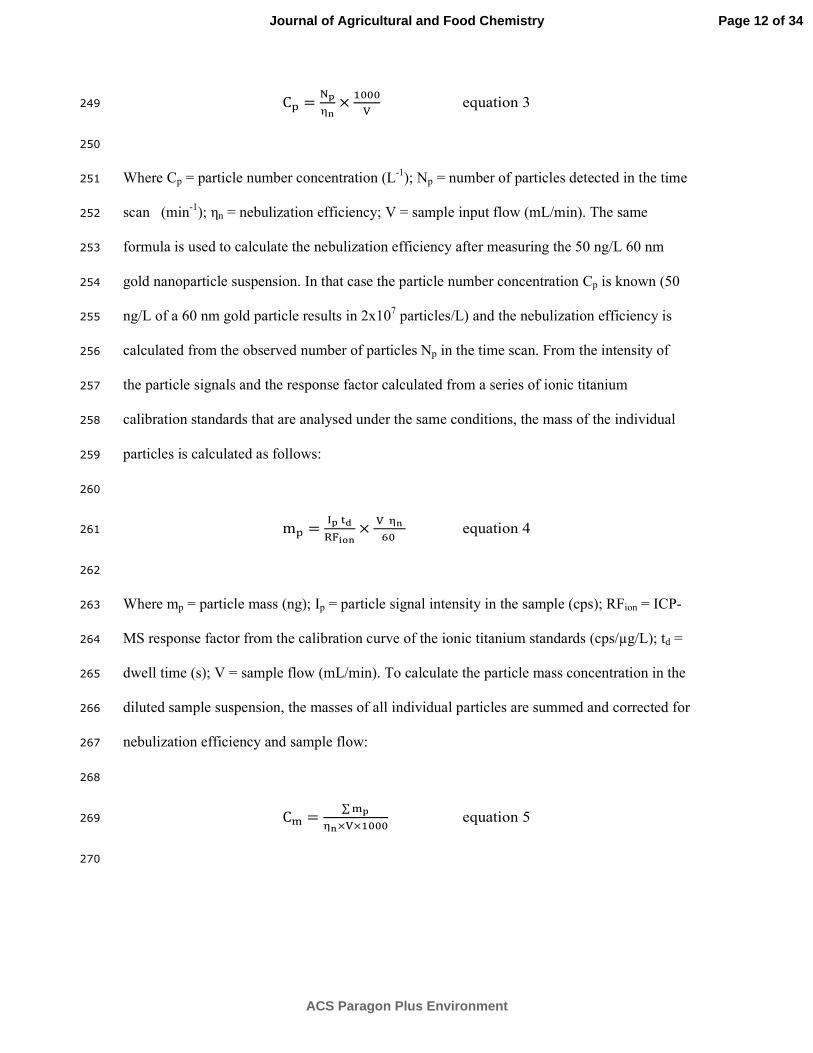
C% = &'�� ×
����� equation 3 249
250
Where Cp = particle number concentration (L-1
); Np = number of particles detected in the time 251
scan (min-1
); ηn = nebulization efficiency; V = sample input flow (mL/min). The same 252
formula is used to calculate the nebulization efficiency after measuring the 50 ng/L 60 nm 253
gold nanoparticle suspension. In that case the particle number concentration Cp is known (50 254
ng/L of a 60 nm gold particle results in 2x10⁷ particles/L) and the nebulization efficiency is 255
calculated from the observed number of particles Np in the time scan. From the intensity of 256
the particle signals and the response factor calculated from a series of ionic titanium 257
calibration standards that are analysed under the same conditions, the mass of the individual 258
particles is calculated as follows: 259
260
m% = )'+,-./�� ×
���0� equation 4 261
262
Where mp = particle mass (ng); Ip = particle signal intensity in the sample (cps); RFion = ICP-263
MS response factor from the calibration curve of the ionic titanium standards (cps/µg/L); td = 264
dwell time (s); V = sample flow (mL/min). To calculate the particle mass concentration in the 265
diluted sample suspension, the masses of all individual particles are summed and corrected for 266
nebulization efficiency and sample flow: 267
268
C1 = ∑1'��×�×���� equation 5 269
270
Page 12 of 34
ACS Paragon Plus Environment
Journal of Agricultural and Food Chemistry

Where Cm = particle mass concentration (ng/L). Finally, the particle size, expressed as the 271
particle’s diameter (and assuming a spherical particle shape) is calculated for each particle as 272
follows: 273
274
d% = 401'��'� × 107 equation 6 275
276
Where: dp = particle diameter in the sample (nm) and ρp = particle density (g/mL). The 277
individual particle sizes can be used to produce a size distribution graph (figure 3). For all 278
these calculations a template in Microsoft Excel was produced and used throughout. 279
280
281
Results and discussion 282
283
We compared the size distributions of TiO2 particles as determined with three different 284
analytical approaches in three types of samples. Firstly we characterised TiO2 powders that 285
according to the manufactures are E171 food additives, secondly we characterised food 286
products (cakes, candy, and chewing gum) and finally personal care products (toothpaste). 287
288
Titanium content and particle size determination of TiO2 materials 289
Total titanium content of TiO2 materials. The total TiO2 content of the E171 materials was 290
determined as total titanium using HNO3/HF digestion and ICP-MS analysis of the extracts 291
followed by recalculation of results to titanium dioxide. The results show that the total TiO2 292
content is in the range of 90% to 99% for five of the seven E171 materials and 74% and 83% 293
for the other two materials. Taking into account the measurement uncertainty of the total-Ti 294
Page 13 of 34
ACS Paragon Plus Environment
Journal of Agricultural and Food Chemistry

method (± 6%) and the fact that these materials may contain some water, five of the seven 295
E171 materials consist of pure TiO2. It is known that some TiO2 materials are coated with 296
aluminium- and silicon oxides or polymers to increase photo stability and prevent aggregation 297
(22, 23). Only the packaging of one of the two samples with a lower TiO2 content declares 298
that the material may contain aluminium hydroxide, amorphous silica, aluminium phosphate 299
and water. No further information about the chemical composition of these two TiO2 300
materials was available. 301
302
Size distributions of TiO2 materials determined with SEM. The size distribution of the 303
particles in the TiO2 materials was determined by SEM. For this the materials were suspended 304
in water and stabilized by BSA (15). Representative SEM images of the TiO2 materials are 305
shown in figure 4. The images on the left side in figure 4 give a good picture of the large 306
agglomerates that are encountered in the samples while the images on the right side allow the 307
estimation of the primary particle sizes. Detected particles were automatically counted using 308
image analyses software and divided into size bins of 25-40, 40-65, 65-100, 100-160, 160-309
250, 250-400, 400-650, 650-1000, 1000-1600 nm. The number percentage of the particles in 310
each bin is then plotted against the mean particle size of the size bin to produce a number-311
based size distribution (figure 4). In general, the size distributions of the seven TiO2 materials 312
are very alike and range from 30 to 600 nm with the apex in all size distributions between 200 313
and 400 nm. About 10 % of the particles have dimensions below 100 nm. The actual 314
percentage of particles with at least one dimension smaller than 100 nm will be higher 315
because the image analysis software determines an area equivalent diameter (diameter 316
projected area; dpa) for the particles. As a consequence particles with an aspect ratio different 317
from 1 will be "averaged" into round particles leading to an underestimation of the number of 318
particles with one dimension smaller than 100 nm. From the image analysis it appears that for 319
Page 14 of 34
ACS Paragon Plus Environment
Journal of Agricultural and Food Chemistry
>80% of the particles, large and small, the aspect ratio is in the range of 0.8 - 1.2. As a 320
consequence it is expected that the underestimation of the number of particles with one 321
dimension smaller than 100 nm is limited to 10-20%. That all materials appear to be more or 322
less identical probably reflects the production process of this material. The most common 323
production method for TiO2 particles is the chloride process or the sulphate process (24). In 324
industrialized countries the chloride processes appears to be favoured over sulphate processes 325
for environmental, economic and qualitative reasons (25). Therefore, there is a reasonable 326
change that all investigated TiO2 materials are produced by the same process. 327
The smallest size bin used in our measurements was 25-40 nm. Particles in that size range 328
could still be detected, identified and counted by the image analysis software. TiO2 particles 329
<20 nm cannot be reliably identified and counted by the image analysis software. Manually, 330
the operator can detect TiO2 particles with diameters down to 10-20 nm in clean suspensions. 331
However, manual detecting small particles is not a reasonable option since many fields have 332
to be viewed in order to produce a reliable particle number. Thus our measurements show that 333
the lower size limit of detection for routine SEM analysis is around 20 nm for TiO2 particles. 334
335
Size distributions of TiO2 materials determined with AF4-ICP-MS. Strictly speaking AF4 336
is a separation technique and is not able to determine size, nor a number-based size 337
distribution. As there are no well characterized TiO2 particles of different sizes (i.e. reference 338
materials for size calibration) we used a theoretical approach based on the well-established 339
theory of flow field-flow fractionation for size calibration as explained in the methods section. 340
The result of the AF4-ICP-MS analysis is a chromatogram in which the signal height is a 341
measure for the mass of titanium detected at a certain retention time. Following mass 342
calibration this signal height is expressed as the mass of Ti or TiO2 and with the time scale 343
recalculated as a particle size scale based on an equation from flow field-flow fractionation 344
Page 15 of 34
ACS Paragon Plus Environment
Journal of Agricultural and Food Chemistry
theory described in the experimental section, this results in a mass-based size distribution. 345
However, to apply the EU definition for nanomaterials this mass-based distribution has to be 346
transformed into a number-based distribution. Therefore, this mass-based size distribution is 347
transformed into a number-based size distribution using the equation in the experimental 348
section and assuming that particles have a spherical shape. However, if the mass is converted 349
into a number of particles, this number depends on particle size. If the mass remains constant, 350
as shown in figure 5, the number of particles increases strongly when going to smaller particle 351
(notice that the y-scale is a log scale), especially at small particle sizes, since particle size and 352
mass are related by d3 (see equation 6 in methods section). This means that mass to number 353
transformations have large conversion factors for small particles that easily lead to erroneous 354
results. In practice, the beginning of chromatograms tends show small spikes, noise, non-355
particle peaks or small electrical offsets. If these phenomena are also transformed from mass- 356
to number-based, small particle sizes will completely and erroneously dominate the number-357
based distribution resulting in a dramatic shift of the size distribution to smaller particle sizes. 358
From the chromatograms in this study it was concluded that the smallest TiO2 particle size 359
that can be determined and reliably transformed from mass- to number-based distributions is 360
around 20 nm. 361
362
Comparing the measured size distributions of TiO2 materials. Conversion of the retention 363
time into particle size and the mass-based distribution into a number-based distribution allows 364
us to derive number-based size distributions for the TiO2 materials. The AF4 size distribution 365
of the materials for which the EM size distribution was shown in figure 4, are shown in figure 366
6. In general, the number-based size distribution as determined by EM and AF4 show two 367
types of differences. Firstly, the apex of the size distributions originating from AF4 generally 368
is between 200 and 300 nm while in EM size distributions it is between 200 and 400 nm. 369
Page 16 of 34
ACS Paragon Plus Environment
Journal of Agricultural and Food Chemistry
Secondly, the EM size distributions contain larger particles (diameter >600 nm) than the AF4 370
size distributions. In AF4 large particles (diameter >400 nm) may actually drop on, and roll 371
over, the membrane surface at velocities that are higher than normal elution (26). As a result 372
these large particles elute at shorter retention times thereby simulating to be smaller sized 373
particles. In the number-based size distribution this will become visible as a shift to smaller 374
particle sizes. As before, the percentage of particles with a size <100 nm is determined. In the 375
AF4 analysis this ranges from 10 to 15% with an average of 12%. This is comparable with the 376
10% of particles with sizes below 100 nm that were found in the EM analyses. 377
378
Titanium content and size distributions in food and personal care products 379
In addition to the TiO2 materials, food- and personal care products were also analysed for 380
total titanium content and with AF4-ICP-MS for titanium content as well as size distribution. 381
An attempt was made to determine the size distribution of the TiO2 particles in the extracts of 382
these products with SEM. However, matrix constituents that were still present made it 383
impossible to make a proper image analysis of the particles sizes. As an alternative the 384
extracts were analysed using single particle ICP-MS (sp-ICPMS) since this techniques also 385
produces a number based size distribution. In total 24 food products and 3 personal care 386
products were purchased in regular shops in the Netherlands. Products that listed "E171" or 387
"titanium dioxide" on the package, as well as a few products with a typical "white colour" 388
were selected for this study. 389
390
Total titanium content of food and personal care products. All 27 products were digested 391
with a combination of HNO3, HF and H2O2 and the total-Ti content was determined using 392
ICP-MS. Total-Ti recovery was determined by spiking three products of different matrices in 393
triplicate with known amounts of a TiO2 reference material NM-103. The total-Ti recovery 394
Page 17 of 34
ACS Paragon Plus Environment
Journal of Agricultural and Food Chemistry
ranged from 92% to 109% with an average of 96 ± 6%. Method blanks showed only low 395
amounts of titanium, i.e. on the average <2 µg of Ti which corresponds to <0.005 mg Ti/g 396
product. The quantification limit of the digestion and detection method was set to 0.01 mg 397
Ti/g product. The total-Ti content of the products ranges from 5.4 mg Ti/g product for a 398
chewing gum to 0.01 mg Ti/g for a white-topped cookie. Four products had total-Ti levels that 399
were below the quantification limit of the method. The highest levels of total-Ti are found in 400
chewing gums and in toothpastes, the lowest in bakery products like cookies and cup-cakes 401
(figure 7). The results are comparable to the total-Ti content in food items reported recently 402
by Weir et al. (8). 403
404
Titanium content of food and personal care products determined by AF4-ICP-MS. All 405
food and consumer products with a detectable amount of total-Ti have been analysed with 406
AF4-ICP-MS for particle-based Ti content as well as the particle size distribution. For this 407
purpose a separate sample preparation was set up using H2O2 to oxidize the sample matrix. 408
The use of strong acids was avoided since these are not compatible with the AF4 analysis. 409
H2O2 oxidation worked for all samples with the exception of the chewing gums were debris of 410
the guar gum remained. Since the TiO2 particles are expected to be present in the outer, water-411
soluble coating of the chewing gum (8), the removal of this debris is probably not of influence 412
on the result. The time between sample preparation and measurement with AF4-ICP-MS was 413
kept as short as possible and was no more than 4 hours. After sonication of the sample extract, 414
the extract was kept in constant movement on a roller bank until analysis. Prior to injection 415
the sample was thoroughly mixed to ensure homogeneous distribution of suspended particles. 416
Since ions are removed in AF4 separation during the focusing of the analyte on the 417
semipermeable membrane, mass calibration can only be done with a particle-based standard. 418
In the absence of a reliable, well-characterised TiO2 particle standard, one of the TiO2 419
Page 18 of 34
ACS Paragon Plus Environment
Journal of Agricultural and Food Chemistry

powders characterized as pure, 99% TiO2 was used for this purpose. The particle-based Ti 420
content of the food and personal care products as determined with AF4 and expressed as mg 421
Ti particle/g product is presented as the red, right-side bars in figure 7. The side by side 422
comparison of the total-Ti content and the particle-based Ti content as determined with AF4-423
ICP-MS in each product, shows that they are comparable, certainly at Ti concentrations >0.5 424
mg Ti/g product. At lower concentration the results from the AF4 determination are generally 425
lower than those from the total ICP-MS method. This can be explained by adsorption 426
processes in the AF4 separation that become visible in the lower concentration range. Another 427
reason may be that very large particles, aggregates or agglomerates (>1600 nm) may be 428
present in the samples and are lost in the AF4 determination. For products containing >0.5 mg 429
Ti/g the results show that most of the total-Ti originates from particles, i.e. TiO2 particles, and 430
that no large amounts of titanium are unaccounted for in the AF4 analysis. 431
432
Number-based size distributions in food and personal care products. Next to the particle-433
based Ti content of the samples, number-based size distributions were determined (figure 8). 434
From products containing less than 0.1 mg Ti/g product no reliable number-based size 435
distributions could be produced. In general, the calculated number-based size distributions in 436
food items and personal care products based on AF4-ICP-MS analysis are comparable with 437
the number-based size distribution as determined for TiO2 in E171 materials with EM. The 438
apex of the size distribution was mostly found around 200 nm which is in the size range of the 439
primary particle sizes found with EM. The results indicate that a part of the TiO2 particles 440
have diameters below 100 nm. On a number-based basis the average percentage of particles 441
with diameters smaller than 100 nm is around 8%, comparable with the 12% and 10% that 442
were found for the number-based size distributions of TiO2 in E171 with AF4-ICPMS and 443
EM analyses. 444
Page 19 of 34
ACS Paragon Plus Environment
Journal of Agricultural and Food Chemistry
445
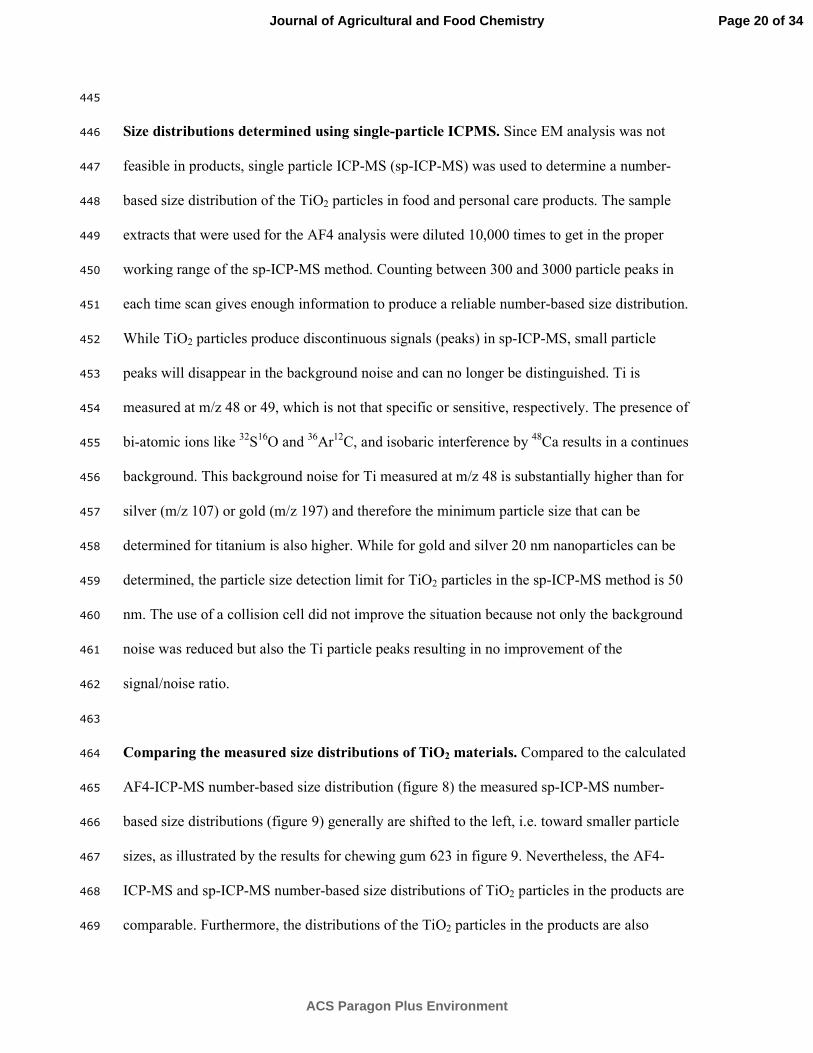
Size distributions determined using single-particle ICPMS. Since EM analysis was not 446
feasible in products, single particle ICP-MS (sp-ICP-MS) was used to determine a number-447
based size distribution of the TiO2 particles in food and personal care products. The sample 448
extracts that were used for the AF4 analysis were diluted 10,000 times to get in the proper 449
working range of the sp-ICP-MS method. Counting between 300 and 3000 particle peaks in 450
each time scan gives enough information to produce a reliable number-based size distribution. 451
While TiO2 particles produce discontinuous signals (peaks) in sp-ICP-MS, small particle 452
peaks will disappear in the background noise and can no longer be distinguished. Ti is 453
measured at m/z 48 or 49, which is not that specific or sensitive, respectively. The presence of 454
bi-atomic ions like 32
S16
O and 36
Ar12
C, and isobaric interference by 48
Ca results in a continues 455
background. This background noise for Ti measured at m/z 48 is substantially higher than for 456
silver (m/z 107) or gold (m/z 197) and therefore the minimum particle size that can be 457
determined for titanium is also higher. While for gold and silver 20 nm nanoparticles can be 458
determined, the particle size detection limit for TiO2 particles in the sp-ICP-MS method is 50 459
nm. The use of a collision cell did not improve the situation because not only the background 460
noise was reduced but also the Ti particle peaks resulting in no improvement of the 461
signal/noise ratio. 462
463
Comparing the measured size distributions of TiO2 materials. Compared to the calculated 464
AF4-ICP-MS number-based size distribution (figure 8) the measured sp-ICP-MS number-465
based size distributions (figure 9) generally are shifted to the left, i.e. toward smaller particle 466
sizes, as illustrated by the results for chewing gum 623 in figure 9. Nevertheless, the AF4-467
ICP-MS and sp-ICP-MS number-based size distributions of TiO2 particles in the products are 468
comparable. Furthermore, the distributions of the TiO2 particles in the products are also 469
Page 20 of 34
ACS Paragon Plus Environment
Journal of Agricultural and Food Chemistry
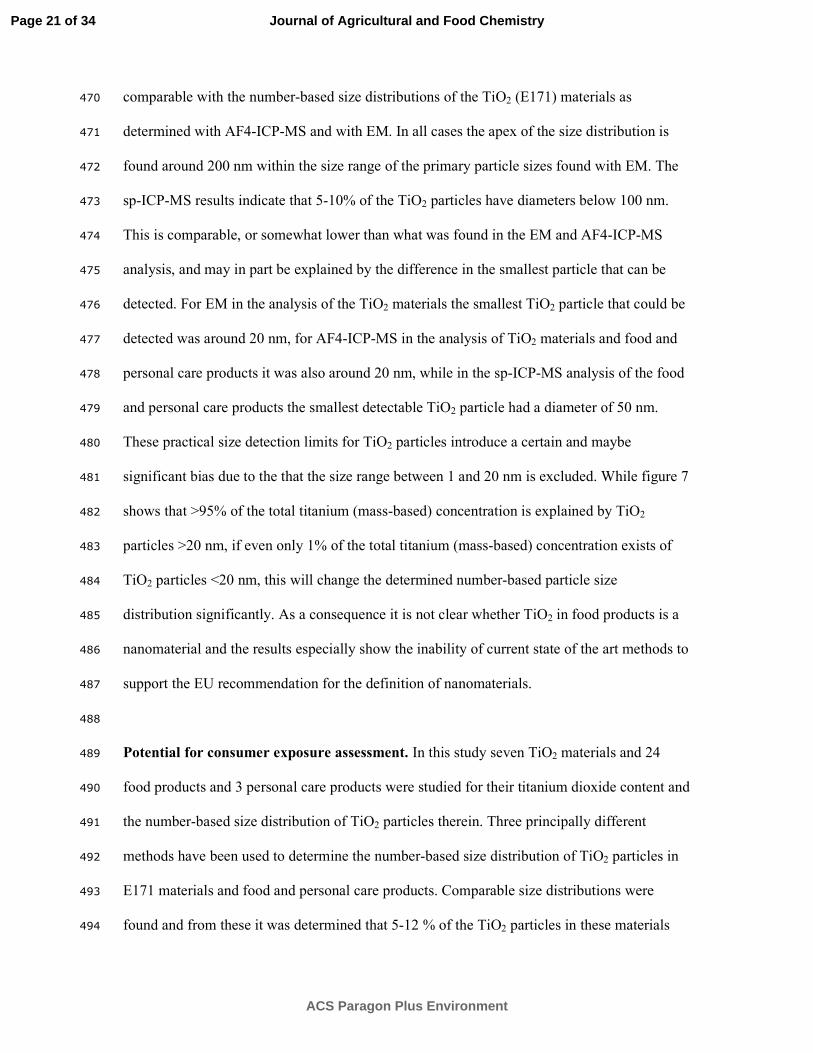
comparable with the number-based size distributions of the TiO2 (E171) materials as 470
determined with AF4-ICP-MS and with EM. In all cases the apex of the size distribution is 471
found around 200 nm within the size range of the primary particle sizes found with EM. The 472
sp-ICP-MS results indicate that 5-10% of the TiO2 particles have diameters below 100 nm. 473
This is comparable, or somewhat lower than what was found in the EM and AF4-ICP-MS 474
analysis, and may in part be explained by the difference in the smallest particle that can be 475
detected. For EM in the analysis of the TiO2 materials the smallest TiO2 particle that could be 476
detected was around 20 nm, for AF4-ICP-MS in the analysis of TiO2 materials and food and 477
personal care products it was also around 20 nm, while in the sp-ICP-MS analysis of the food 478
and personal care products the smallest detectable TiO2 particle had a diameter of 50 nm. 479
These practical size detection limits for TiO2 particles introduce a certain and maybe 480
significant bias due to the that the size range between 1 and 20 nm is excluded. While figure 7 481
shows that >95% of the total titanium (mass-based) concentration is explained by TiO2 482
particles >20 nm, if even only 1% of the total titanium (mass-based) concentration exists of 483
TiO2 particles <20 nm, this will change the determined number-based particle size 484
distribution significantly. As a consequence it is not clear whether TiO2 in food products is a 485
nanomaterial and the results especially show the inability of current state of the art methods to 486
support the EU recommendation for the definition of nanomaterials. 487
488
Potential for consumer exposure assessment. In this study seven TiO2 materials and 24 489
food products and 3 personal care products were studied for their titanium dioxide content and 490
the number-based size distribution of TiO2 particles therein. Three principally different 491
methods have been used to determine the number-based size distribution of TiO2 particles in 492
E171 materials and food and personal care products. Comparable size distributions were 493
found and from these it was determined that 5-12 % of the TiO2 particles in these materials 494
Page 21 of 34
ACS Paragon Plus Environment
Journal of Agricultural and Food Chemistry

and products were <100 nm. These data are suitable to be used in an exposure study, further 495
refining the exposure assessment by Weir et al for the US population (8). Previously we 496
assessed the SiO2 content of food products (27) and subsequently assessed the fate during in 497
vitro digestion (28). There we concluded that the intestinal epithelium is exposed to nano-498
scale material. The fate of TiO2 particles during in the human digestive tract is unknown and 499
should be evaluated to allow a comparison with the existing oral toxicity studies used 500
different forms of the TiO2 NPs. While the applied analytical methods showed practical size 501
limits, all these methods, and especially sp-ICP-MS, can be elegantly employed for further 502
studies on the fate of food grade TiO2 to bridge the gap between our findings and the recent 503
oral toxicity studies to guarantee the consumer safety. 504
505
506
Author information 507
Corresponding author Ruud Peters, RIKILT Wageningen UR, Akkermaalsbos 2, 6708 WB, 508
Wageningen, The Netherlands. E-mail: [email protected]. Phone: +31317480671 509
510
511
Acknowledgements 512
This research was commissioned and financed by The Netherlands Food and Consumer 513
Product Safety Authority. 514
515
516
Page 22 of 34
ACS Paragon Plus Environment
Journal of Agricultural and Food Chemistry

References 517
(1) Johnson, R.W.; Thiele, E.S.; French, R.H. Light-scattering efficiency of white pigments:
an analysis of model core–shell pigments vs. optimized rutile TiO2. TAPPI J. 1997, 11,
233-239.
(2) Braun, J.H. Titanium dioxide—A review. J. Coatings Technol., 1997, 69, 59–72.
(3) Linak, E.; Schlag, S.; Kishi, A. Chemical Economics Handbook: Titanium Dioxide,
(Marketing Research Report), Menlo Park, CA, SRI International, 2002.
(4) Swiler, D.R. Pigments, inorganic. In: Kirk-Othmer Encyclopedia of Chemical
Technology, New York, John Wiley & Sons, 2005.
(5) Robichaud, C.O.; Uyar, A.E.; Darby, M.R.; Zucker, L.G.; Wiesner, M.R. Estimates of
upper bounds and trends in nano-TiO2 production as a basis for exposure assessment.
Environ. Sci. Technol., 2009, 43, 4227-4233.
(6) Hendren, C.O.; Mesnard, X.; Droge, J.; Wiesner, M.R. Estimating production data for
five engineered nanomaterials as a basis for exposure assessment. Environ. Sci. Technol.,
2011, 45, 2562-2569.
(7) European Commission. European Parliament and Council Directive 94/36/EC of 30 June
1994 on colours in foodstuffs. Official Journal of the European Communities, 1994,
L237, 13-29.
(8) Weir, A.; Westerhoff, P.; Fabricius, L.; Hristovski, K.; van Goetz, N. Titanium dioxide
nanoparticles in food and personal care products. Environ. Sci. Technol., 2012, 46, 2242-
2250.
(9) Tassinari, R.; Cubadda, F.; Moracci, G.; Aureli, F.; D'Amato, M.; Valeri, M.; De
Berardis, B.; Raggi, A.; Mantovani, A.; Passeri, D.; Rossi, M.; Maranghi, F. Oral, short-
term exposure to titanium dioxide nanoparticles in Sprague-Dawley rat: focus on
reproductive and endocrine systems and spleen. Nanotoxicology, 2013, doi
10.3109/17435390.2013.822114.
(10) Gui, S.; Sang, X.; Zheng, L.; Ze, Y.; Zhao, X.; Sheng, L.; Sun, Q.; Cheng, Z.; Cheng, J.;
Hu, R.; Wang, L.; Hong, F.; Tang, M. Intragastric exposure to titanium dioxide
nanoparticles induced nephrotoxicity in mice, assessed by physiological and gene
expression modifications. Part. Fibre Tox., 2013, 10, 4-10.
Page 23 of 34
ACS Paragon Plus Environment
Journal of Agricultural and Food Chemistry

(11) IARC. IARC Monographs on the Evaluation of Carcinogenic Risks to Humans. Volume
93, Carbon Black, Titanium Dioxide and Talc. WHO, France, 2010. Downloadable from:
http://monographs.iarc.fr/ENG/Monographs/vol93/mono93.pdf
(12) Bouwmeester, H.; Dekkers, S.; Noordam, M.Y.; Hagens, W.I.; Bulder, A.S.; De Heer,
C.; Ten Voorde, S.E.C.G.; Wijnhoven, S.W.P.; Marvin, H.J.P.; Sips, A.J.A.M. Review of
health safety aspects of nanotechnologies in food production. Reg. Tox. Pharm., 2009, 53,
52-62.
(13) European Commission. Commission Recommendation of 18 October 2011 on the
definition of nanomaterial. 2011/696/EU. Luxembourg: European Commission, 2011.
(14) Linsinger, T.; Roebben, G.; Gilliland, D.; Calzolai, L.; Rossi, F.; Gibson, N.; Klein, C.
Requirements for the implementation of the European Commission definition of the term
“nanomaterial”. JRC Reference report EUR 25404 EN, EUR – Scientific and Technical
research series – ISSN 1831-9424, 2012, doi:10.2787/63490.
(15) Jensen, K.A.; Kembouche, Y.; Christiansen, E.; Jacobson, N.R.; Wallin, H.; Guiot, C.;
Spalla, O.; Witschger, O. Final protocol for producing suitable manufactured
nanomaterial exposure media. NANOGENOTOX deliverable report no 3: July 2011.
Downloadable from: http://www.nanogenotox.eu/files/PDF/web%20nanogenotox%
20dispersion %20protocol.pdf.
(16) Moon, M.H.; Park, I.; Kim, Y. Size characterization of liposomes by flow field-flow
fractionation and photon correlation spectroscopy. J. Chromatogr. A, 1998, 813, 91-100.
(17) Park, I.; Paeng, K.J.; Yoon, Y.; Song, J.H.; Moon, M.H. Separation and selective
detection of lipoprotein particles of patients with coronary artery disease by frit-inlet
asymmetrical flow field-flow fractionation. J. Chromatogr. B, 2002, 780, 415-422.
(18) Degueldre, C.; Favalgar, P.Y.; Wold, S. Gold colloid analysis by inductively coupled
plasma-mass spectrometry in a single particle mode. Anal. Chim. Acta, 2006, 555, 263-
268.
(19) Laborda, F.; Lamanna, J.J.; Bolea, E.; Castillo, J.R. Selective identification,
characterization and determination of dissolved silver (I) and silver nanoparticles based
on single particle detection by inductively coupled plasma mass spectrometry. J. Anal. At.
Spectrom., 2011, 26, 1362-1371.
(20) Pace, H.E.; Rogers, N.J.; Jarolimek, C.; Coleman, V.E.; Higgins, C.P.; Ranville, J.F.
Determining transport efficiency for the purpose of counting and sizing nanoparticles via
Page 24 of 34
ACS Paragon Plus Environment
Journal of Agricultural and Food Chemistry

single particle inductively coupled plasma mass spectrometry. Anal. Chem., 2011, 83,
9361-9369.
(21) Peters, R.J.; Herrera Rivera, Z.; van Bemmel, G.; Marvin, H.J.; Bouwmeester, H.
Development and validation of single particle ICP-MS for sizing and quantitative
determination of nano-silver in chicken meat. Anal. Bioanal. Chem., 2014, DOI
10.1007/s00216-013-7571-0
(22) Labille, J.; Feng, J.H.; Botta, C.; Borscgneck, D.; Sammutt, M.; Cabie, M.; Auffan, M.;
Rose, J.; Bottero, J.Y. Aging of TiO2 nanocomposites used in sunscreen. Dispersion and
faste of the degradation products in aqueous environment. Environ. Pollut., 2010, 158,
3482-3489.
(23) Carlotti, M.E.; Ugazio, E.; Sapino, S.; Fenoglio, I.; Greco, G.; Fubini, B. Role of particle
coating in controlling skin damage photoinduced by titania nanoparticles. Free Radical
Res., 2009, 43, 312-322.
(24) Macwan, D.P.; Dave, P.N.; Chaturvedi, S. A review on nano-TiO2 sol-gel type synthesis
and its applications. J. Mater. Sci., 2011, 46, 3669-3686.
(25) Linak, E.; Inoguchi, Y. In: Chemical Economics Handbook: Titanium Dioxide, Menlo
Park, CA, SRI Consulting, 2005.
(26) Schimpf, M.E; Caldwell, K.; Giddings, J.C. In: Field-Flow Fractionation Handbook.
New York, John Wiley & Sons, 2000.
(27) Dekkers, S.; Krystek, P.; Peters, R.J.; Lankveld, D.X.; Bokkers, B.G.; Van Hoeven-
Arentzen, P.H.; Bouwmeester, H.; Oomen, A.G. Presence and Risks of Nanosilica in
Food Products. Nanotoxicology, 2011, 5, 393–405.
(28) Peters, R.; Kramer, E.; Oomen, A.G.; Herrera Rivera, Z.E.; Oegema, G.; Tromp, P.C.;
Fokkink, R.; Rietveld, A.; Marvin, H.J.P.; Weigel, S.; Peijnenburg, A.A.C.M.;
Bouwmeester, H. Presence of Nano-Sized Silica during In Vitro Digestion of Foods
Containing Silica as a Food Additive. ACS Nano, 2012, 6, 2441-2451.
Page 25 of 34
ACS Paragon Plus Environment
Journal of Agricultural and Food Chemistry

Figure 1. Single-particle ICPMS time scan of a diluted sample extracts. Each peak represents
one particle. The number of peaks is proportional to the particle concentration is the sample
while the peak height is proportional to the particles diameter to the third power.
Figure 2. Signal distribution graph plotting the frequency of the ICP-MS response in data
points as a function of the ICP-MS response. ICP-MS responses left from the minimum depict
background and ions, those right from the minimum particles.
Figure 3. Typical example of a particle size distribution as produced by single-particle ICP-
MS analysis.
Figure 4. Representative SEM images of TiO2 materials. Image on the left shows the
agglomerates while the image on the right shows the individual particles. The number based
size distributions produced by image analysis of the SEM images are shown below the SEM
images (the error bars indicate the 95% confidence intervals of the number percentage in each
particular size bin).
Figure 5. When the mass remains constant the number of particles rapidly increases,
especially at smaller particle sizes.
Figure 6. Number-based size distribution of two TiO2 materials as determined with AF4-ICP-
MS and after recalculation from mass-based to number-based.
Figure 7. Total-Ti content in food and personal care products determined with ICP-MS (blue,
left-side bars) and the particle-based Ti content in the same products determined with AF4-
Page 26 of 34
ACS Paragon Plus Environment
Journal of Agricultural and Food Chemistry

ICP-MS analysis (red, right-side bars). The numbers behind the product description refer to
sample codes.
Figure 8. Number-based size distribution of the TiO2 material in a toothpaste and chewing
gum sample as determined with AF4-ICP-MS and after transformation of the mass-based to a
number-based distribution.
Figure 9. Number-based size distribution of the TiO2 material in toothpaste as determined
directly with sp-ICPMS.
Page 27 of 34
ACS Paragon Plus Environment
Journal of Agricultural and Food Chemistry

Figure 1
Figure 2
Page 28 of 34
ACS Paragon Plus Environment
Journal of Agricultural and Food Chemistry

Figure 3
Page 29 of 34
ACS Paragon Plus Environment
Journal of Agricultural and Food Chemistry

Figure 4
0%
10%
20%
30%
40%
50%
0 200 400 600 800 1000
number percentage
average diameter (nm)
TiO2 (E171) material #1, EM size distribution
0%
10%
20%
30%
40%
50%
0 200 400 600 800 1000
number percentage
average diameter (nm)
TiO2 (E171) material #2, EM size distribution
Page 30 of 34
ACS Paragon Plus Environment
Journal of Agricultural and Food Chemistry
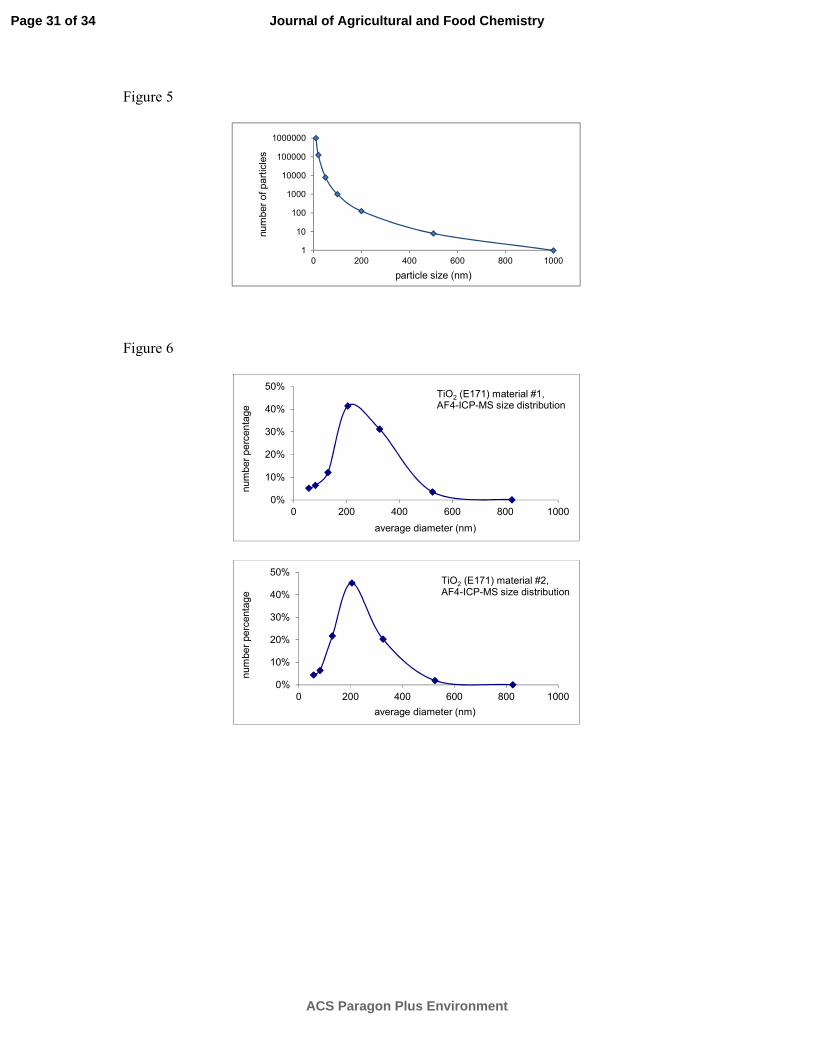
Figure 5
Figure 6
1
10
100
1000
10000
100000
1000000
0 200 400 600 800 1000number of particles
particle size (nm)
0%
10%
20%
30%
40%
50%
0 200 400 600 800 1000
number percentage
average diameter (nm)
TiO2 (E171) material #1, AF4-ICP-MS size distribution
0%
10%
20%
30%
40%
50%
0 200 400 600 800 1000
number percentage
average diameter (nm)
TiO2 (E171) material #2, AF4-ICP-MS size distribution
Page 31 of 34
ACS Paragon Plus Environment
Journal of Agricultural and Food Chemistry

Figure 7
Figure 8
0%
10%
20%
30%
40%
50%
0 200 400 600 800 1000
number percentage
average diameter (nm)
TiO2 in toothpaste 637,AF4-ICP-MS size distribution
0%
10%
20%
30%
40%
50%
0 200 400 600 800 1000
number percentage
average diameter (nm)
TiO2 in chewing gum 623,AF4-ICP-MS size distribution
0
1
2
3
4
5
6
chewing gum 621
toothpaste 637
chewing gum 623
toothpaste 635
chewing gum 619
toothpaste 636
hard candy 626
chewing gum 622
chocolate 616
mayonnaise 628
chewing gum 620
soft candy 631
chocolate 617
soft candy 625
pastry 634
hard candy 627
pastry 612
soft candy 630
pastry 613
mayonnaise 629
chocolate 618
soft candy 632
soft candy 624
pastry 633
pastry 614
pastry 615
hard candy 651
Titanium (mg Ti/g product)
total Ti concentration
AF4 Ti concentration
Page 32 of 34
ACS Paragon Plus Environment
Journal of Agricultural and Food Chemistry

Figure 9
0%
10%
20%
30%
40%
50%
0 200 400 600 800 1000
number percentage
average diameter (nm)
TiO2 in toothpaste 637,sp-ICP-MS size distribution
0%
10%
20%
30%
40%
50%
0 200 400 600 800 1000
number percentage
average diameter (nm)
TiO2 in chewing gum 623,sp-ICP-MS size distribution
Page 33 of 34
ACS Paragon Plus Environment
Journal of Agricultural and Food Chemistry

TOC Graphic
Remark for the editor: I have included this picture because it represents one of the major
applications of TiO2 in food items, as a whitener and enhancing brightness of coloured
products.
Remark for the editor: The black-and-white EM picture of E171 is included as an alternative
in case the colour photo of the candy is not suitable.
Page 34 of 34
ACS Paragon Plus Environment
Journal of Agricultural and Food Chemistry