
Productivity Insights Network Performance measurement ...
101
Productivity Insights Network Performance measurement, productivity and management practices in smaller firms Alan Hughes and Martin Spring Lancaster University Management School Centre for Productivity & Efficiency Final report
Transcript of Productivity Insights Network Performance measurement ...
Productivity Insights Network
Performance measurement, productivity and management practices in
smaller firms
Alan Hughes and Martin Spring
Lancaster University Management School
Centre for Productivity & Efficiency
Final report

2
About PIN
The Productivity Insights Network was established in January 2018 and is funded by the Economic
and Social Research Council. As a multi-disciplinary network of social science researchers engaged
with public, private, and third sector partners, our aim is to change the tone of the productivity debate
in theory and practice. It is led by the University of Sheffield, with co-investigators at Cambridge
Econometrics, Cardiff University, Durham University, University of Sunderland, SQW, University of
Cambridge, University of Essex, University of Glasgow, University of Leeds and University of
Stirling. The support of the funder is acknowledged. The views expressed in this report are those of
the authors and do not necessarily represent those of the funders.

3
Acknowledgements
This research was funded by the ESRC via the Productivity Insights Network (Grant
Reference ES/R007810/1). We would also like to acknowledge the directors and managers
of small firms, many of them Entrepreneurs in Residence of Lancaster University
Management School, who were so generous with their time in participating in interviews and
in piloting the survey questionnaire. Finally, we are especially grateful for the research
assistance provided by Huan Yang, currently a PhD student in the Department of Economics
at Lancaster University Management School.
4
Table of Contents
Acknowledgements...................................................................................................... 3
Executive Summary ..................................................................................................... 5
1. Introduction ............................................................................................................ 6
2. Background and objectives ................................................................................. 7
3. Qualitative research .............................................................................................. 8
3.1 Research design and method ................................................................................... 9
3.2 Themes ...................................................................................................................... 9 Size and structure of businesses ..................................................................................................... 9
Defining the product or service offered ....................................................................................... 10
Competition and visibility of future business ............................................................................... 11
Performance measurement and management ............................................................................ 11
Management practices ................................................................................................................. 12
3.3. Discussion and implications .............................................................................. 12
4. Survey ................................................................................................................... 13
4.1 Basic approach and scope of survey instrument ................................................. 13
4.2 Survey Design ......................................................................................................... 19
4.3 Results ................................................................................................................. 22 The Sample .................................................................................................................................... 22
Key performance indicators .......................................................................................................... 24
Management Practices ................................................................................................................. 25
Multivariate Analysis: The Determinants of the Use of Management Practices .......................... 27
Multivariate Analysis: The Determinants of the Number of Management Practices Used ......... 28
Implications of the Multivariate Regression Analyses .................................................................. 31
5. Concluding discussion and suggestions for further work ............................ 31
5.1 Principal insights on productivity and management practices ....................... 31
5.2 Lessons learned on designing and conducting a full-scale survey ................ 32
5.3 Limitations........................................................................................................... 32
5.4 Further work ............................................................................................................ 33
References .................................................................................................................. 34
Appendices ................................................................................................................. 35
5
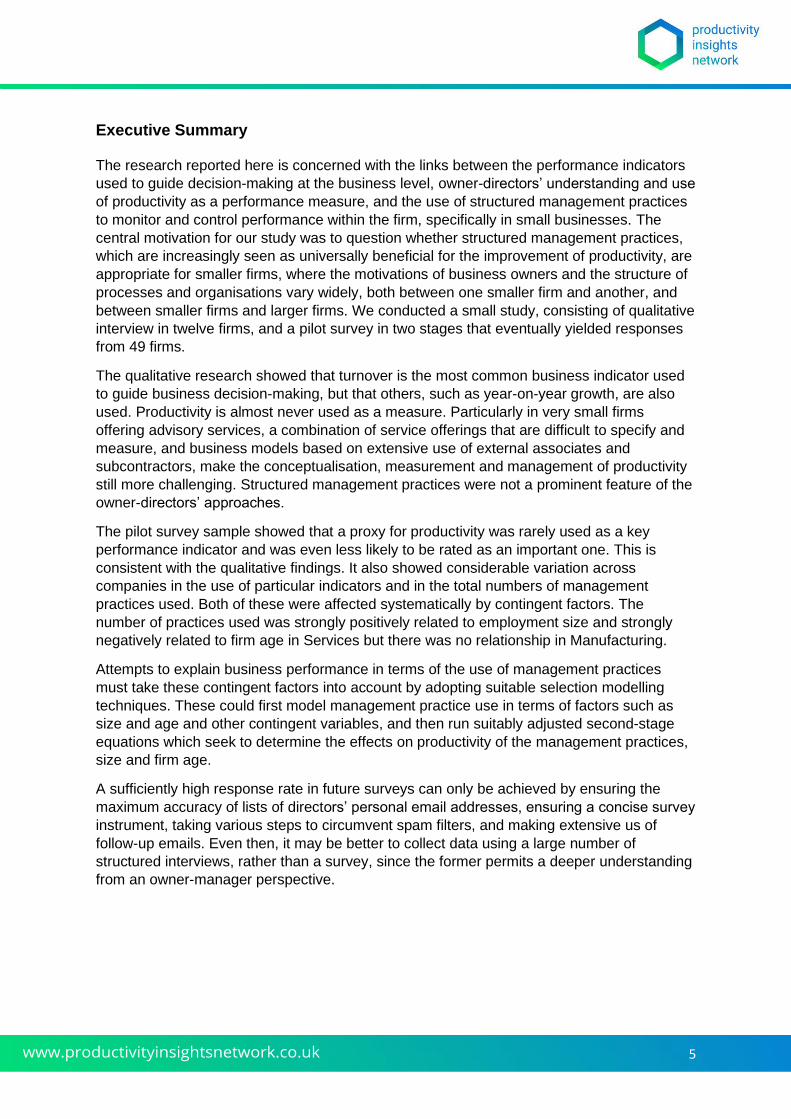
Executive Summary
The research reported here is concerned with the links between the performance indicators
used to guide decision-making at the business level, owner-directors’ understanding and use
of productivity as a performance measure, and the use of structured management practices
to monitor and control performance within the firm, specifically in small businesses. The
central motivation for our study was to question whether structured management practices,
which are increasingly seen as universally beneficial for the improvement of productivity, are
appropriate for smaller firms, where the motivations of business owners and the structure of
processes and organisations vary widely, both between one smaller firm and another, and
between smaller firms and larger firms. We conducted a small study, consisting of qualitative
interview in twelve firms, and a pilot survey in two stages that eventually yielded responses
from 49 firms.
The qualitative research showed that turnover is the most common business indicator used
to guide business decision-making, but that others, such as year-on-year growth, are also
used. Productivity is almost never used as a measure. Particularly in very small firms
offering advisory services, a combination of service offerings that are difficult to specify and
measure, and business models based on extensive use of external associates and
subcontractors, make the conceptualisation, measurement and management of productivity
still more challenging. Structured management practices were not a prominent feature of the
owner-directors’ approaches.
The pilot survey sample showed that a proxy for productivity was rarely used as a key
performance indicator and was even less likely to be rated as an important one. This is
consistent with the qualitative findings. It also showed considerable variation across
companies in the use of particular indicators and in the total numbers of management
practices used. Both of these were affected systematically by contingent factors. The
number of practices used was strongly positively related to employment size and strongly
negatively related to firm age in Services but there was no relationship in Manufacturing.
Attempts to explain business performance in terms of the use of management practices
must take these contingent factors into account by adopting suitable selection modelling
techniques. These could first model management practice use in terms of factors such as
size and age and other contingent variables, and then run suitably adjusted second-stage
equations which seek to determine the effects on productivity of the management practices,
size and firm age.
A sufficiently high response rate in future surveys can only be achieved by ensuring the
maximum accuracy of lists of directors’ personal email addresses, ensuring a concise survey
instrument, taking various steps to circumvent spam filters, and making extensive us of
follow-up emails. Even then, it may be better to collect data using a large number of
structured interviews, rather than a survey, since the former permits a deeper understanding
from an owner-manager perspective.
6
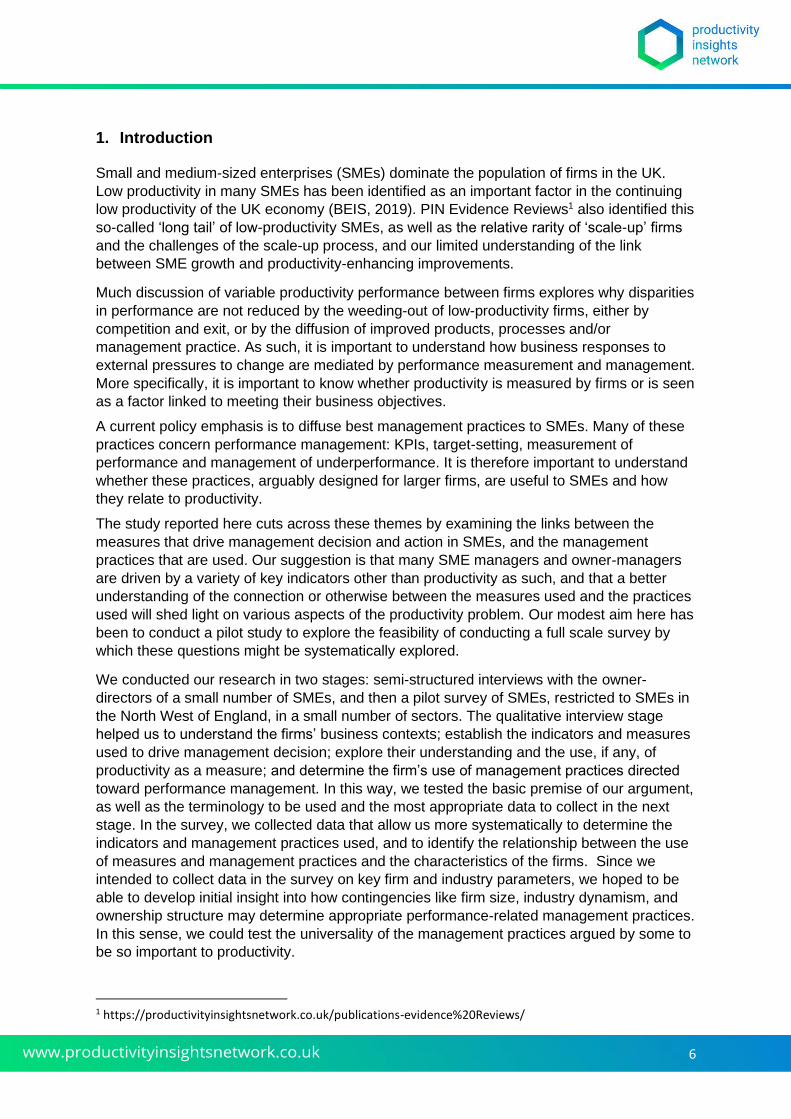
1. Introduction
Small and medium-sized enterprises (SMEs) dominate the population of firms in the UK.
Low productivity in many SMEs has been identified as an important factor in the continuing
low productivity of the UK economy (BEIS, 2019). PIN Evidence Reviews1 also identified this
so-called ‘long tail’ of low-productivity SMEs, as well as the relative rarity of ‘scale-up’ firms
and the challenges of the scale-up process, and our limited understanding of the link
between SME growth and productivity-enhancing improvements.
Much discussion of variable productivity performance between firms explores why disparities
in performance are not reduced by the weeding-out of low-productivity firms, either by
competition and exit, or by the diffusion of improved products, processes and/or
management practice. As such, it is important to understand how business responses to
external pressures to change are mediated by performance measurement and management.
More specifically, it is important to know whether productivity is measured by firms or is seen
as a factor linked to meeting their business objectives.
A current policy emphasis is to diffuse best management practices to SMEs. Many of these
practices concern performance management: KPIs, target-setting, measurement of
performance and management of underperformance. It is therefore important to understand
whether these practices, arguably designed for larger firms, are useful to SMEs and how
they relate to productivity.
The study reported here cuts across these themes by examining the links between the
measures that drive management decision and action in SMEs, and the management
practices that are used. Our suggestion is that many SME managers and owner-managers
are driven by a variety of key indicators other than productivity as such, and that a better
understanding of the connection or otherwise between the measures used and the practices
used will shed light on various aspects of the productivity problem. Our modest aim here has
been to conduct a pilot study to explore the feasibility of conducting a full scale survey by
which these questions might be systematically explored.
We conducted our research in two stages: semi-structured interviews with the owner-
directors of a small number of SMEs, and then a pilot survey of SMEs, restricted to SMEs in
the North West of England, in a small number of sectors. The qualitative interview stage
helped us to understand the firms’ business contexts; establish the indicators and measures
used to drive management decision; explore their understanding and the use, if any, of
productivity as a measure; and determine the firm’s use of management practices directed
toward performance management. In this way, we tested the basic premise of our argument,
as well as the terminology to be used and the most appropriate data to collect in the next
stage. In the survey, we collected data that allow us more systematically to determine the
indicators and management practices used, and to identify the relationship between the use
of measures and management practices and the characteristics of the firms. Since we
intended to collect data in the survey on key firm and industry parameters, we hoped to be
able to develop initial insight into how contingencies like firm size, industry dynamism, and
ownership structure may determine appropriate performance-related management practices.
In this sense, we could test the universality of the management practices argued by some to
be so important to productivity.
1 https://productivityinsightsnetwork.co.uk/publications-evidence%20Reviews/

7
The report is structured as follows. In the next section, we outline some of the background to
the study, and set out our objectives in more detail. We then report, in turn, on the two
stages of research: the qualitative interviews and the survey. These sections include an
outline of the method, results and analysis in each instance. We then discuss the
implications of the research as a whole, both for the substantive questions we raise, and for
the design and execution of a more extensive survey building on this pilot.
2. Background and objectives
The enduring UK productivity gap has been well documented and addressed by various
policy initiatives, and the relatively low productivity of many SMEs has been identified as an
important contributory factor to this overall picture (e.g. BEIS, 2019). Bloom, van Reenen
and colleagues have developed an extensively-cited literature, based on the World
Management Survey (WMS) data, which examines the reasons for differences in productivity
between firms, and argue that, amongst other things, the use or otherwise of ‘structured
management practices’ is a determinant of productivity (Bloom and Van Reenen, 2007,
Bloom and Van Reenen, 2010). While Bloom et al (2014) acknowledge that management
practices may be more or less appropriate to firms depending on factors such as size or
R&D intensity, i.e. a contingency argument, and SMEs with fewer than 50 employees are
excluded entirely from the WMS data. This point is but briefly entertained in much of the
survey-based literature on UK SMEs that has followed.
Recent ONS studies have, indeed, adopted many aspects of the WMS dataset and
approach. A study of UK manufacturing firms (ONS, 2016) examined the relationship
between management practices and productivity in firms with 10 or more employees. This
found that smaller firms scored lower on structured management practices than did larger
firms. A subsequent study (ONS, 2018) of businesses in both production and service
industries, with employment of least 10, showed (a) a positive correlation between
management practice score and labour productivity (b) higher structured management
practices scores for larger firms (c) a greater range of structured management practice
scores for smaller firms, especially those in the 10-49 employee category. The study also
identifies a negative relationship between size and productivity, which the report’s authors
suggest ‘may suggest some collinearity between management scores and employment’.
Finally, the study finds that firm age is correlated with labour productivity, which the report’s
authors see as ‘satisfying our previous hypothesis that more mature businesses may have
more structured practices because they have had longer to implement them.’ The inference
here seems to be that lower productivity in smaller firms is a result of less use of structured
management practices. The question we pose is whether lower scores on structured
management practices among smaller firms tell us that they are managed worse, or
managed in a way that is appropriate to their size. In our study, therefore, we will examine
whether the particular features of SMEs lead them to develop practices that may, for good
reasons, diverge from recently-advocated ‘structured management practices’, derived from
studies of larger firms. This perspective is influenced by classic contingency theory
arguments (Burns and Stalker, 1961, Woodward, 1958).
Productivity, in terms of GVA per job or per hour, is seen as the desirable outcome of
economic activity at aggregate level. At firm level, managerial decision-making and action is
determined by a host of factors which may or may not translate into improved productivity. In
the smaller firms with which we are concerned, the directors are typically the majority
owners, and the literature shows that these owner-directors are driven by widely varying sets
8
of motivations and priorities (Storey, 1994, Cosh and Hughes, 1998). These over-arching
priorities and objectives are then linked, to a greater or lesser extent, explicitly or otherwise,
into some form of monitoring and control process, centred on measurable indicators such as
turnover, profit, or use of capacity (including that of the owner-director), which may or may
not be directly related to productivity. In our study, we seek to develop insights into the
behavioural foundations of these links, by examining whether SMEs either measure their
productivity performance or understand it in the way it is used in policy debate. This is
important since, if firms are not motivated to achieve productivity performance targets per se,
then we must understand how the performance characteristics they do pursue are related to
productivity itself. Put more specifically, we aimed to address the following key questions:
a) How does SME senior management define the overall business objectives of their
firm and measure and respond to success or failure in meeting them?
b) What underlying operating performance and other indicators are used and how are
they linked to overall business objective targets?
c) How, if at all, do measures of value-added productivity feature in objective-setting
and performance measurement?
d) How are management practices (including monitoring operating and labour
management practices) designed and implemented?
In pursuing these questions, we aimed to:
• conduct semi-structured interviews in 10 firms with fewer than 50 employees, in
services and manufacturing, then
• use the insights from the interviews to design and pilot a web-based survey (target
30 achieved sample), using the FAME database as a sampling frame, to collect key
firm and sector data, as well as more structured data on the key questions
3. Qualitative research
The primary purpose of the interviews was to explore and test out the topic areas of the
intended survey instrument. Insights from the interviews were used to inform the scope of
the survey questions and the terminology used, to maximise the relevance and
comprehensibility of the questions posed. Interviewees were subsequently invited – and
most agreed – to complete an early draft of the survey instrument and provide feedback on
the clarity and appropriateness of the questions.
The interviews also provided some insights in their own right, beyond their function as a
testing ground for the survey questions. These data are, of course, relatively limited in
extent: we do not have in-depth case studies of the firms, nor do we have sufficiently large N
that we can claim that the interviews are representative of particular sectors or sizes of firm.
But they do point to some interesting themes that, as well as helping to inform the design of
the survey, might be explored in greater depth in future research.
9
3.1 Research design and method
We conducted interviews with directors of 12 firms in service and manufacturing sectors.
The firms ranged from one- or two-person micro-firms in sectors such as consultancy to
larger SMEs such as a manufacturing firm with 76 employees and over £1.2million in net
assets in 2019. All were contacted through the SME networks at Lancaster University
Management School. In most cases, both investigators took part in the interviews, so as to
maximise insight across the range of subjects and to provide the opportunity for reflective
discussion of the data from different perspectives. Where possible, interviews were recorded
and transcribed. All the initial interviews were conducted before the onset of the coronavirus
pandemic.
In order to address the core concerns of performance and productivity management, and
management practices, it was important to understand the nature of the businesses,
organisation structures, the products and services they offered, and the customers they
served. Hence, we spent a considerable portion of the interview in each case exploring
these issues. We then directed the interviews toward the central questions of our research,
as outlined in the project proposal, namely:
a) How does SME senior management define the overall business objectives of their
firm and measure and respond to success or failure in meeting them?
b) What underlying operating performance and other indicators are used and how are
they linked to overall business objective targets?
c) How, if at all, do measures of value-added productivity feature in objective setting
and performance measurement?
d) How are management practices (including monitoring operating and labour
management practices) designed and implemented?
(These questions were not asked verbatim, but acted as reference points for our more
flexible exploration of the central concerns.) We concluded the interviews by asking
respondents how they felt that they might be helped by government intervention.
We analysed the interview data using thematic analysis (Braun and Clarke, 2006, Clarke
and Braun, 2017) to identify patterns of meaning across the dataset. The analysis was
undertaken manually without using a software package, which allowed us to fully immerse
ourselves in the data. This was appropriate to the relatively simple data structure (i.e.
multiple interviews with people in essentially the same roles) and modest number of
interviews.
3.2 Themes
The themes are reported broadly in the sequence of the topics covered in the interviews,
although in practice we iterated back and forth between subjects in our conversations.
Size and structure of businesses
The firms varied a good deal, even within the ‘small’ end of the SME category. Several were
very small /micro-firms operating in various forms of advisory work, such as branding or
design consultancy. The firms also included manufacturers, IT providers and a construction
10
company. The micro-firms working in the advisory services sector had all been established
by former employees of large consultancies or Fast Moving Consumer Goods (FMCG)
manufacturers.
Although these are all clearly small firms, determining their size was not straightforward.
Many operated some form of flexible staffing structure, with a core employed complement of
staff supplemented by associates brought in and paid on a project-by-project basis. The
construction firm operated a three-tier subcontracting structure among hourly-paid direct
labour, with a core staff of full-time employees, a small number of dedicated sub-contractors,
and third layer of subcontractors who also worked for other clients. In some senses, this is
simple: associates are not employees of the focal firm, neither are subcontractors. But in
other ways, the relationship is more ambiguous. For example, the MD of one of the very
small advisory services firms saw the small network of associates as having a very
significant role in determining the strategic direction of the firm: it could be said that this firm
has more managers than it has employees. In contrast, the construction company’s
subcontractors were offered discrete pieces of work according to their technical specialism,
and paid accordingly.
If we treat the firm as a production function, subcontractor inputs in all these cases are
simply that – bought-in supplies. But if we treat the firm as a decision-making unit or
governance structure, different pictures emerge, particularly so in some cases. Management
control of performance as understood in the literature may only apply to the relationship
between the MD and her administrative assistant. The relationships that are much more
salient in many cases for the delivery of services are the relationships with associates and
subcontractors, which, formally, are buyer-supplier relationships, not employment contracts.
Defining the product or service offered
Defining the product or service to be sold, and pricing and charging for it, was a difficult and
fluid issue for many of the firms. Rather than using the billable hours model typical of some
professional services, the small advisory firms would typically charge by the completed
project. In some of these, however, the definitions of the work included had been rather
flexible, meaning that staff were drawn into providing more work than had been budgeted for
(in a more or less explicit fashion). For example, clients for branding or design consultancy
might request more revisions, or choose among multiple alternative solutions. Firms in these
cases were considering ways to delineate their offering in more clear-cut and pre-determined
form, e.g. in the case of brand consultancy, undertaking to generate two possible solutions,
and to carry out one round of amendments, rather than a more open-ended commitment. At
the other end of the spectrum, the construction firm was often conducting work for clients
such as local authorities where the quantum of work and the price for it was tightly defined in
advance by the client e.g. a price per square metre for laying a particular type of paving, to a
particular specification. This leaves little room for negotiation, and the construction firm could
only differentiate the service (and the price) very slightly at the margins e.g. in ancillary
activities such as transporting the materials to the site.
Some of the advisory service providers operated part of their business on a retainer basis for
their clients. For example, a marketing communications consultancy might be paid a monthly
or quarterly fee, undertaking to write a certain number of blog posts, and maintain the client’s
website. This has the attraction of offering stability and predictability of income. All these
issues associated with defining the scope of work and the units by which work was defined
and sold have implications for the way managers might understand and manage
productivity.
11
Competition and visibility of future business
Such small advisory service providers have competitors in the sense of other firms providing
similar services (although few seemed to know who they were). A recurring theme, however,
was the idea that another competitor is the possibility of the client employing their own staff
to fulfil the function being bought. Our advisory firm cases typically served SME clients, who
could not justify having, say, a full-time marketing assistant, preferring to pay a retainer to an
external provider, or buying services on a project-by-project basis. The additional benefit to
the client in such instances is that, as well as obtaining day-to-day services on a more
scalable basis, they also had the possibility of accessing more strategic advisory services
from the provider’s more senior staff.
While some operated part of their business on such retainer-based models, the more striking
feature in the small advisory firms was the very limited forward order book. In some cases,
the firms had very little idea what work they might be doing, for which clients, more than two
months into the future. Firms in IT support, construction and manufacturing had generally
greater visibility of future orders.
Performance measurement and management
Approaches to defining, monitoring and reacting to performance measures, at business level
and at lower levels of aggregation, varied enormously. One, perhaps two of the firms we
researched used anything that might be understood as a measure of productivity to guide
the business (alongside other measures). Otherwise, a variety of other indicators were used,
reflecting the directors’ and managers’ motivations and reasons for being in business, their
established practices, and varying degrees of competence or interest in measurement and
management control. In some cases, it still proved difficult, despite sustained questioning, to
determine what indicators guided the management of the business.
Turnover was perhaps the most widely used indicator. The directors we interviewed had, to
varying degrees of detail, an appreciation of how turnover for a recent month, quarter or year
compared with that of previous periods. Sometimes this was the result of deliberate, active
monitoring; in others, it seemed rather more happenstance e.g. because of having recently
completed a mandatory report such as a quarterly VAT return. Turnover had, in some cases,
been used as the basis for defining future strategies – the firms usually expressed an
intention to increase turnover, typically modestly, year-on-year. In some cases this was
linked to an intent to build the business to a size that would make it saleable. The MD of one
of the very small advisory services firms has developed a simple ‘KPI dashboard’ that she
used each Monday morning to review year-to-date turnover, dividends paid and costs, and
to assess how these outcomes compare with intended targets for the year. These financial
indicators are complemented by indicators concerning the identification of new clients,
monitoring activities such as meeting new leads and sending out mailshots. These non-
financial indicators had been important in identifying the need to take on an extra member of
staff as the business grew. This was the most systematic approach to performance
measurement among the very small advisory firms.
Control over financial indicators among other firms varied greatly. In one of the larger firms,
in manufacturing, a finance manager maintained a suite of detailed performance indicators
based on the popular ‘balanced scorecard’ method (this was also the firm that most
convincingly measured productivity). In smaller firms, simpler methods were used, for
example based on excel spreadsheets capturing recent, current and likely future orders and
their values. In one case, it appeared that the MD only discovered what the turnover was,
12
and whether the firm had made a profit, well after the event at a monthly meeting with the
bank manager. In another of the small advisory firms, a member of staff had been made
redundant because annual financial analysis indicated that the wages as a percentage of
total costs was too high.
We put it to the interviewees that productivity might be measured by adding wages to profits
and dividing by the number of employees. Although many agreed that this might be useful,
none (except the firm using the balanced scorecard approach) used this as a measure.
Indeed, when asked how they might measure and report productivity, few had any clear
idea. In some cases, this led to self-criticism or at least further reflection on the approach
used for measurement, and an expressed intent to develop more effective measurement
techniques. The construction company was the firm where the MD had the closest control
over financial detail, including item-by-item costs for every project, monitored on an
elaborate spreadsheet model. This perhaps reflects the very low-margin, commoditised and
competitive nature of the market served.
Management practices
In keeping with the interpretation of ‘management practices’ adopted in the ONS surveys
and the literature that informed them (Bloom and Van Reenen, 2007, Bloom and Van
Reenen, 2010), we took the term to refer to practices for managing and controlling individual
performance, rather than the much wider interpretation of the notion of practices as used in
some areas of the management literature, for example ‘strategy-as-practice’ (Vaara and
Whittington, 2012), or widely-used systemic approaches such as Total Quality Management
(Sousa and Voss, 2008). In other words, we were mainly concerned with the methods used
to measure performance of individual staff members and take action when performance fell
short of requirements.
Again, the interviews revealed a very wide range of practices in this sense. In the very small
firms, line management relationships were few: as we have discussed, several of these firms
provide capacity though extensive use of associates on a project-by-project basis. For staff
employed within the firm, formal systems were rarely used. Our interviewees typically felt
that it was not worthwhile to establish formal systems by which to manage a handful of staff,
with whom they in any case interacted informally on a regular basis. In the manufacturing
firms, production data were usually available on an employee-by-employee basis, but even
then, these data were used alongside a more informal assessment of individuals’
capabilities, for example in allocating particular tasks to the most appropriate people.
3.3. Discussion and implications
Our interviews revealed a wide range of approaches to setting business objectives and
measuring performance against them as a basis for triggering business decisions. We
concluded that, although one or two of our firms measured something resembling
productivity, it is generally not an important measure for the directors and managers we
interviewed. They are much more likely to pay attention to turnover or profit as indicators of
the need or otherwise to take action. Especially in small advisory service firms, the often
rather ill-defined and fluid nature of the unit of output being sold made it difficult to nail down
intermediate measures between aggregate retrospective outcomes such as profitability and
a more subjective sense of whether particular individuals or activities are productive. This
has implications for our survey in that we realised the need to be very inclusive in the range
13
of business indictors we suggested, and to explain in accessible terms what might constitute
a measure of productivity in the sense of value-added per employee or hour worked.
As far as management practices are concerned, we once again found great diversity. In
many of the micro firms, line management in the conventional sense was relatively
unimportant, because so much of the work was conducted using associates acting
effectively as subcontractors. When pressed, several of the managers in smaller firms felt
they were less systematic and had less of a sense of urgency than they might in relation to
managing under-performance. The larger firms used more detailed scrutiny of costs and
other forms of performance, but no dominant systematised approaches were volunteered by
the interviewees. Whether the more systematised approach in the larger firms was a result
of their size, sectors (manufacturing and construction) or other factors was unclear, but
these initial insights confirmed our instinct that a contingency-based analysis of management
practices was worthy of exploration in the survey.
4. Survey
In this section, we describe the design and execution of the survey stage of the research,
and present and discuss the results. This includes a review of the prior surveys and literature
on which the survey design was based, and an account of the successive adaptations we
made to the design and practical execution of the survey in order to improve response rate
and in other ways mitigate the various difficulties we encountered.
4.1 Basic approach and scope of survey instrument
A starting point in the approach to developing our questionnaire was to review the ONS
survey instruments that lie behind their estimates of UK management practices and
productivity.
In the ONS surveys, a single score is derived for each respondent, which locates them on a
Structured Management Practice Scale. Management Practices are not defined per se and
the score is inferred from responses to a series of questions. For example, in the case of the
initial ONS Manufacturing Practice Survey (MPS) these questions related to: responses to
production problems; the number of key performance indicators and the frequency of their
review; the time frame covered by production targets and problems attaining them; and
promotion hiring and firing processes (ONS, 2016, Annex 3).
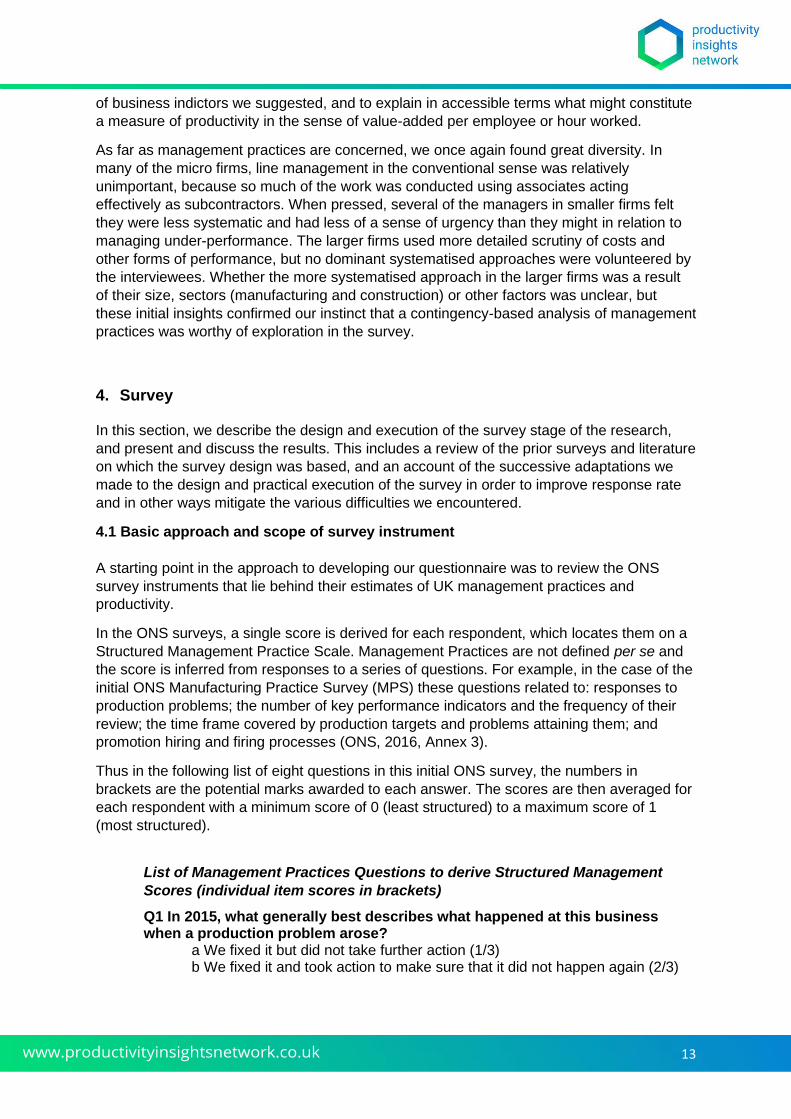
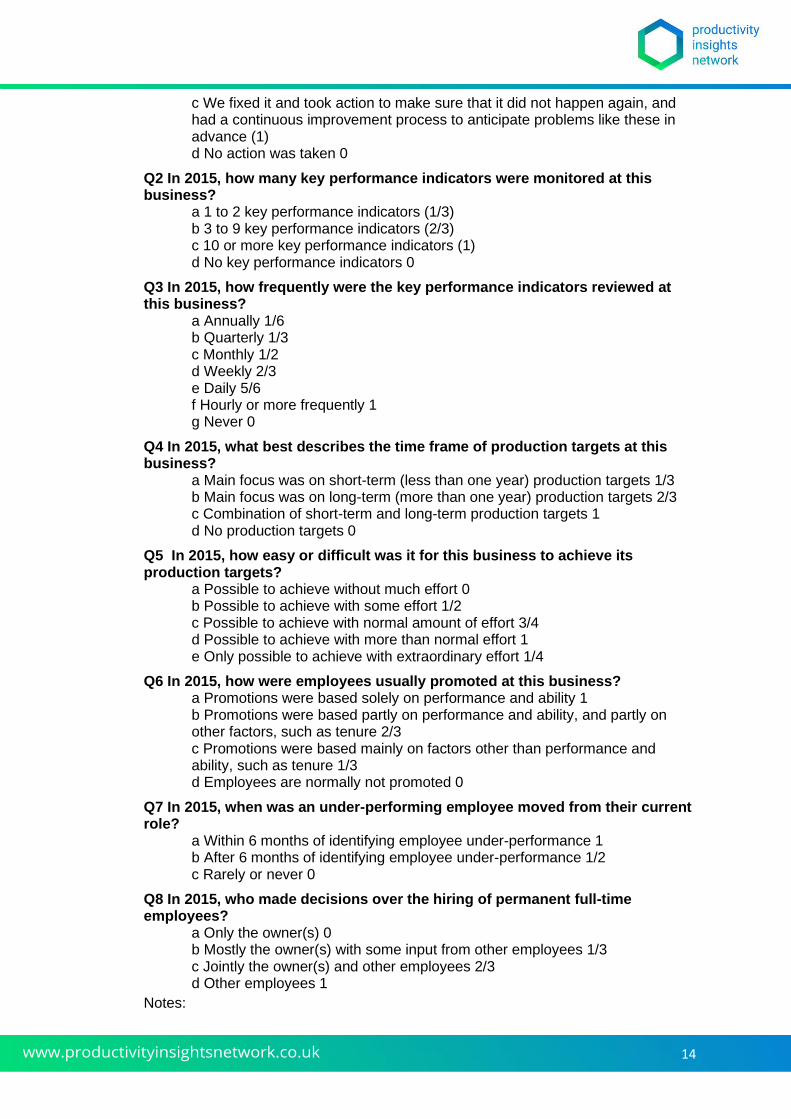
Thus in the following list of eight questions in this initial ONS survey, the numbers in
brackets are the potential marks awarded to each answer. The scores are then averaged for
each respondent with a minimum score of 0 (least structured) to a maximum score of 1
(most structured).
List of Management Practices Questions to derive Structured Management
Scores (individual item scores in brackets)
Q1 In 2015, what generally best describes what happened at this business when a production problem arose?
a We fixed it but did not take further action (1/3) b We fixed it and took action to make sure that it did not happen again (2/3)
14
c We fixed it and took action to make sure that it did not happen again, and had a continuous improvement process to anticipate problems like these in advance (1) d No action was taken 0
Q2 In 2015, how many key performance indicators were monitored at this business?
a 1 to 2 key performance indicators (1/3) b 3 to 9 key performance indicators (2/3) c 10 or more key performance indicators (1) d No key performance indicators 0
Q3 In 2015, how frequently were the key performance indicators reviewed at this business?
a Annually 1/6 b Quarterly 1/3 c Monthly 1/2 d Weekly 2/3 e Daily 5/6 f Hourly or more frequently 1 g Never 0
Q4 In 2015, what best describes the time frame of production targets at this business?
a Main focus was on short-term (less than one year) production targets 1/3 b Main focus was on long-term (more than one year) production targets 2/3 c Combination of short-term and long-term production targets 1 d No production targets 0
Q5 In 2015, how easy or difficult was it for this business to achieve its production targets?
a Possible to achieve without much effort 0 b Possible to achieve with some effort 1/2 c Possible to achieve with normal amount of effort 3/4 d Possible to achieve with more than normal effort 1 e Only possible to achieve with extraordinary effort 1/4
Q6 In 2015, how were employees usually promoted at this business? a Promotions were based solely on performance and ability 1 b Promotions were based partly on performance and ability, and partly on other factors, such as tenure 2/3 c Promotions were based mainly on factors other than performance and ability, such as tenure 1/3 d Employees are normally not promoted 0
Q7 In 2015, when was an under-performing employee moved from their current role?
a Within 6 months of identifying employee under-performance 1 b After 6 months of identifying employee under-performance 1/2 c Rarely or never 0
Q8 In 2015, who made decisions over the hiring of permanent full-time employees?
a Only the owner(s) 0 b Mostly the owner(s) with some input from other employees 1/3 c Jointly the owner(s) and other employees 2/3 d Other employees 1
Notes:
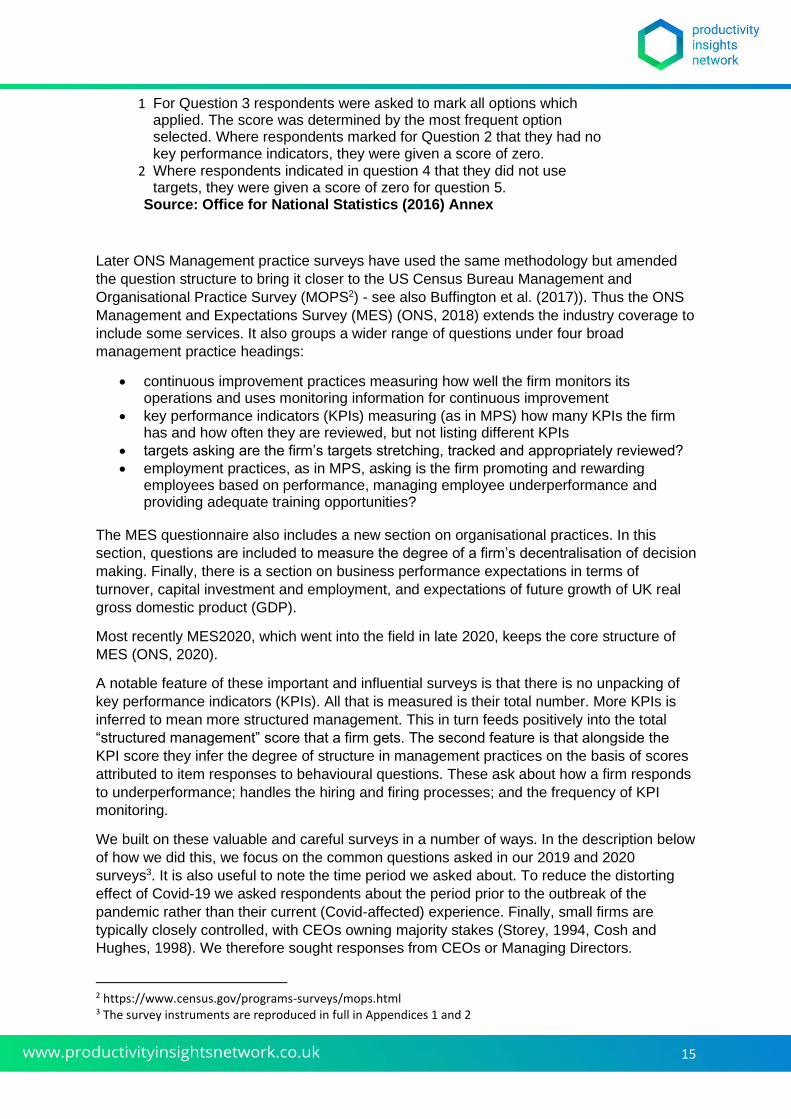
15
1 For Question 3 respondents were asked to mark all options which applied. The score was determined by the most frequent option selected. Where respondents marked for Question 2 that they had no key performance indicators, they were given a score of zero.
2 Where respondents indicated in question 4 that they did not use targets, they were given a score of zero for question 5.
Source: Office for National Statistics (2016) Annex
Later ONS Management practice surveys have used the same methodology but amended
the question structure to bring it closer to the US Census Bureau Management and
Organisational Practice Survey (MOPS2) - see also Buffington et al. (2017)). Thus the ONS
Management and Expectations Survey (MES) (ONS, 2018) extends the industry coverage to
include some services. It also groups a wider range of questions under four broad
management practice headings:
• continuous improvement practices measuring how well the firm monitors its operations and uses monitoring information for continuous improvement
• key performance indicators (KPIs) measuring (as in MPS) how many KPIs the firm has and how often they are reviewed, but not listing different KPIs
• targets asking are the firm’s targets stretching, tracked and appropriately reviewed?
• employment practices, as in MPS, asking is the firm promoting and rewarding employees based on performance, managing employee underperformance and providing adequate training opportunities?
The MES questionnaire also includes a new section on organisational practices. In this
section, questions are included to measure the degree of a firm’s decentralisation of decision
making. Finally, there is a section on business performance expectations in terms of
turnover, capital investment and employment, and expectations of future growth of UK real
gross domestic product (GDP).
Most recently MES2020, which went into the field in late 2020, keeps the core structure of
MES (ONS, 2020).
A notable feature of these important and influential surveys is that there is no unpacking of
key performance indicators (KPIs). All that is measured is their total number. More KPIs is
inferred to mean more structured management. This in turn feeds positively into the total
“structured management” score that a firm gets. The second feature is that alongside the
KPI score they infer the degree of structure in management practices on the basis of scores
attributed to item responses to behavioural questions. These ask about how a firm responds
to underperformance; handles the hiring and firing processes; and the frequency of KPI
monitoring.
We built on these valuable and careful surveys in a number of ways. In the description below
of how we did this, we focus on the common questions asked in our 2019 and 2020
surveys3. It is also useful to note the time period we asked about. To reduce the distorting
effect of Covid-19 we asked respondents about the period prior to the outbreak of the
pandemic rather than their current (Covid-affected) experience. Finally, small firms are
typically closely controlled, with CEOs owning majority stakes (Storey, 1994, Cosh and
Hughes, 1998). We therefore sought responses from CEOs or Managing Directors.
2 https://www.census.gov/programs-surveys/mops.html 3 The survey instruments are reproduced in full in Appendices 1 and 2
16
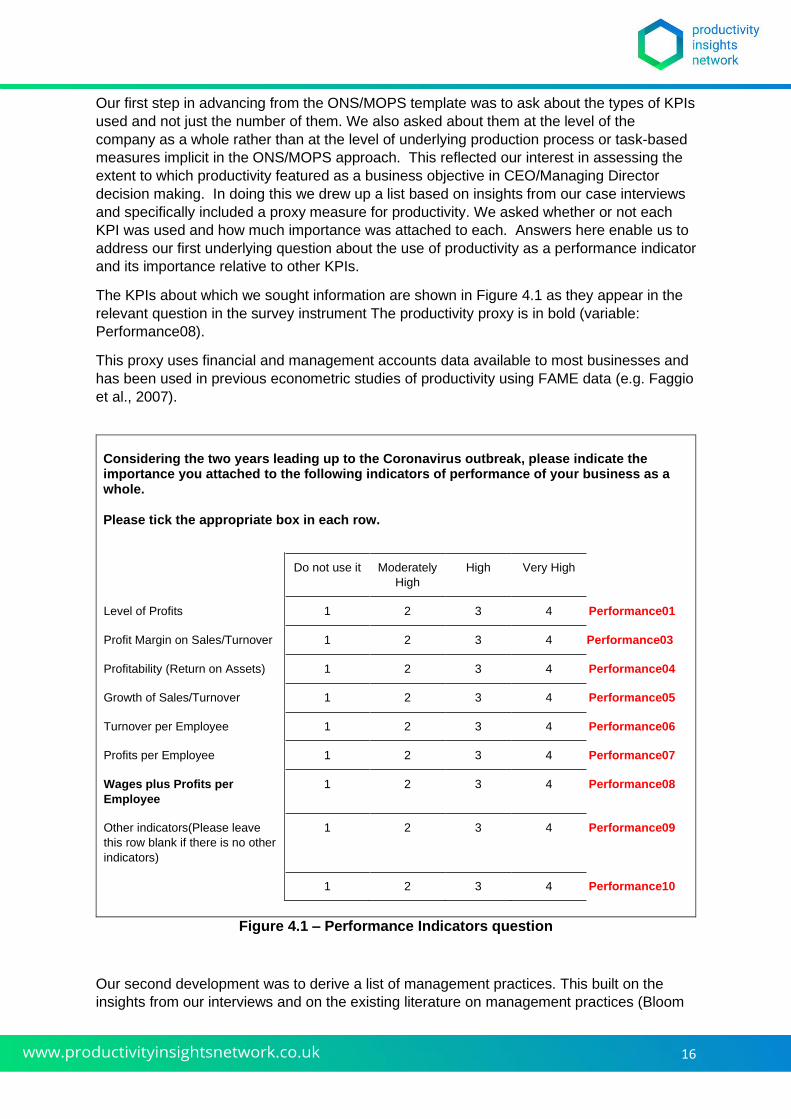
Our first step in advancing from the ONS/MOPS template was to ask about the types of KPIs
used and not just the number of them. We also asked about them at the level of the
company as a whole rather than at the level of underlying production process or task-based
measures implicit in the ONS/MOPS approach. This reflected our interest in assessing the
extent to which productivity featured as a business objective in CEO/Managing Director
decision making. In doing this we drew up a list based on insights from our case interviews
and specifically included a proxy measure for productivity. We asked whether or not each
KPI was used and how much importance was attached to each. Answers here enable us to
address our first underlying question about the use of productivity as a performance indicator
and its importance relative to other KPIs.
The KPIs about which we sought information are shown in Figure 4.1 as they appear in the
relevant question in the survey instrument The productivity proxy is in bold (variable:
Performance08).
This proxy uses financial and management accounts data available to most businesses and
has been used in previous econometric studies of productivity using FAME data (e.g. Faggio
et al., 2007).
Considering the two years leading up to the Coronavirus outbreak, please indicate the importance you attached to the following indicators of performance of your business as a whole. Please tick the appropriate box in each row.
Do not use it Moderately
High
High Very High
Level of Profits 1 2 3 4 Performance01
Profit Margin on Sales/Turnover 1 2 3 4 Performance03
Profitability (Return on Assets) 1 2 3 4 Performance04
Growth of Sales/Turnover 1 2 3 4 Performance05
Turnover per Employee 1 2 3 4 Performance06
Profits per Employee 1 2 3 4 Performance07
Wages plus Profits per
Employee
1 2 3 4 Performance08
Other indicators(Please leave
this row blank if there is no other
indicators)
1 2 3 4 Performance09
1 2 3 4 Performance10
Figure 4.1 – Performance Indicators question
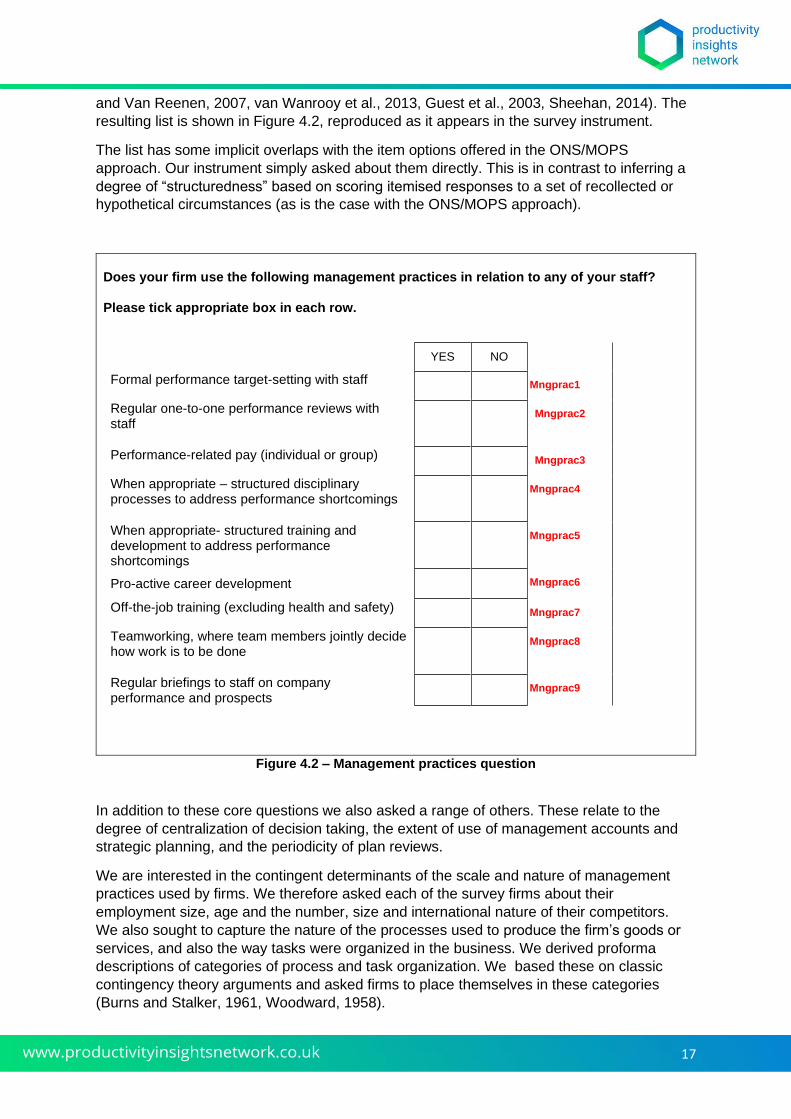
Our second development was to derive a list of management practices. This built on the
insights from our interviews and on the existing literature on management practices (Bloom
17
and Van Reenen, 2007, van Wanrooy et al., 2013, Guest et al., 2003, Sheehan, 2014). The
resulting list is shown in Figure 4.2, reproduced as it appears in the survey instrument.
The list has some implicit overlaps with the item options offered in the ONS/MOPS
approach. Our instrument simply asked about them directly. This is in contrast to inferring a
degree of “structuredness” based on scoring itemised responses to a set of recollected or
hypothetical circumstances (as is the case with the ONS/MOPS approach).
Does your firm use the following management practices in relation to any of your staff? Please tick appropriate box in each row.
YES NO
Formal performance target-setting with staff Mngprac1
Regular one-to-one performance reviews with staff
Mngprac2
Performance-related pay (individual or group) Mngprac3
When appropriate – structured disciplinary processes to address performance shortcomings
Mngprac4
When appropriate- structured training and development to address performance shortcomings
Mngprac5
Pro-active career development Mngprac6
Off-the-job training (excluding health and safety) Mngprac7
Teamworking, where team members jointly decide how work is to be done
Mngprac8
Regular briefings to staff on company performance and prospects
Mngprac9
Figure 4.2 – Management practices question
In addition to these core questions we also asked a range of others. These relate to the
degree of centralization of decision taking, the extent of use of management accounts and
strategic planning, and the periodicity of plan reviews.
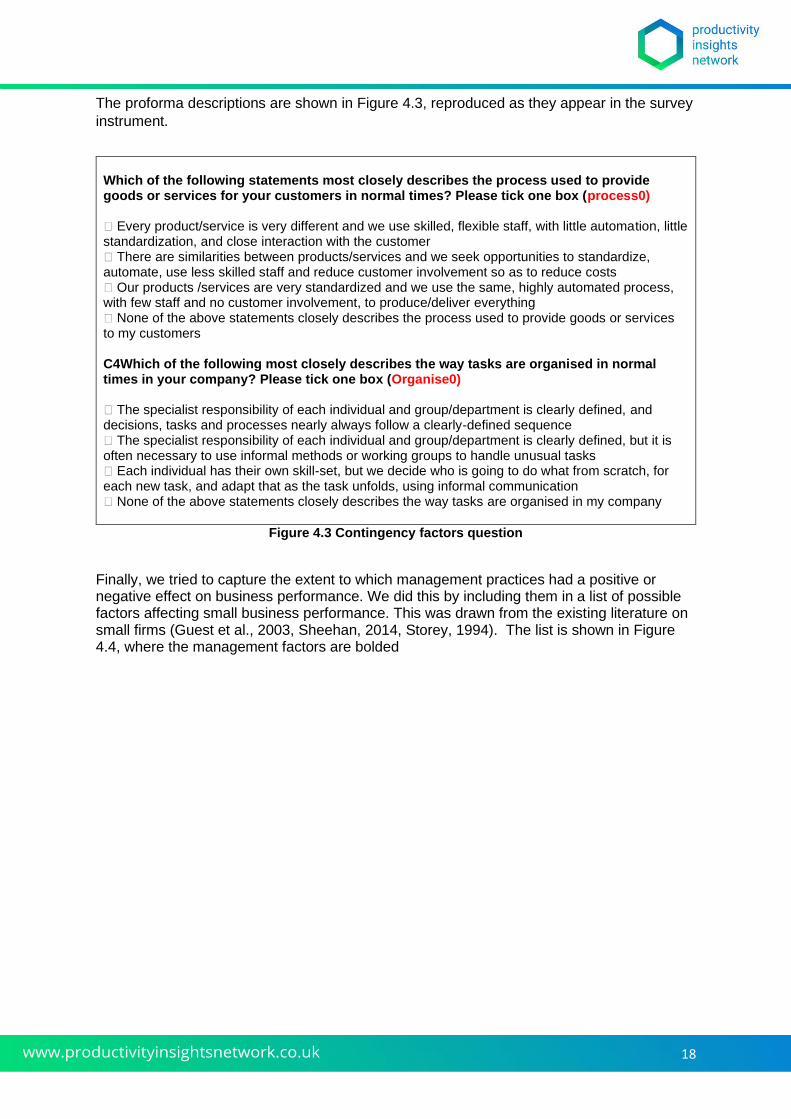
We are interested in the contingent determinants of the scale and nature of management
practices used by firms. We therefore asked each of the survey firms about their
employment size, age and the number, size and international nature of their competitors.
We also sought to capture the nature of the processes used to produce the firm’s goods or
services, and also the way tasks were organized in the business. We derived proforma
descriptions of categories of process and task organization. We based these on classic
contingency theory arguments and asked firms to place themselves in these categories
(Burns and Stalker, 1961, Woodward, 1958).
18
The proforma descriptions are shown in Figure 4.3, reproduced as they appear in the survey
instrument.
Which of the following statements most closely describes the process used to provide goods or services for your customers in normal times? Please tick one box (process0) 󠇯 Every product/service is very different and we use skilled, flexible staff, with little automation, little standardization, and close interaction with the customer 󠇯 There are similarities between products/services and we seek opportunities to standardize, automate, use less skilled staff and reduce customer involvement so as to reduce costs 󠇯 Our products /services are very standardized and we use the same, highly automated process, with few staff and no customer involvement, to produce/deliver everything 󠇯 None of the above statements closely describes the process used to provide goods or services to my customers C4Which of the following most closely describes the way tasks are organised in normal times in your company? Please tick one box (Organise0) 󠇯 The specialist responsibility of each individual and group/department is clearly defined, and decisions, tasks and processes nearly always follow a clearly-defined sequence 󠇯 The specialist responsibility of each individual and group/department is clearly defined, but it is often necessary to use informal methods or working groups to handle unusual tasks 󠇯 Each individual has their own skill-set, but we decide who is going to do what from scratch, for each new task, and adapt that as the task unfolds, using informal communication 󠇯 None of the above statements closely describes the way tasks are organised in my company
Figure 4.3 Contingency factors question
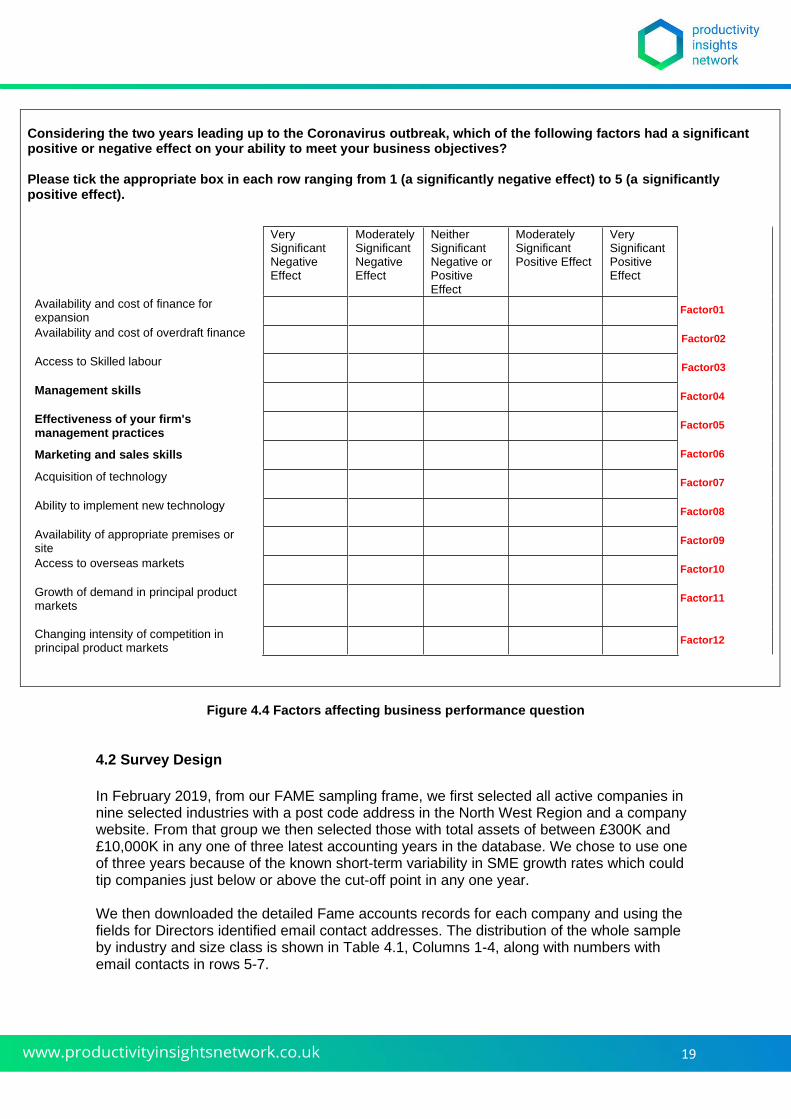
Finally, we tried to capture the extent to which management practices had a positive or negative effect on business performance. We did this by including them in a list of possible factors affecting small business performance. This was drawn from the existing literature on small firms (Guest et al., 2003, Sheehan, 2014, Storey, 1994). The list is shown in Figure 4.4, where the management factors are bolded
19
Considering the two years leading up to the Coronavirus outbreak, which of the following factors had a significant positive or negative effect on your ability to meet your business objectives? Please tick the appropriate box in each row ranging from 1 (a significantly negative effect) to 5 (a significantly positive effect).
Very Significant Negative Effect
Moderately Significant Negative Effect
Neither Significant Negative or Positive Effect
Moderately Significant Positive Effect
Very Significant Positive Effect
Availability and cost of finance for expansion
Factor01
Availability and cost of overdraft finance Factor02
Access to Skilled labour Factor03
Management skills Factor04
Effectiveness of your firm's management practices
Factor05
Marketing and sales skills Factor06
Acquisition of technology Factor07
Ability to implement new technology Factor08
Availability of appropriate premises or site
Factor09
Access to overseas markets Factor10
Growth of demand in principal product markets
Factor11
Changing intensity of competition in principal product markets
Factor12
Figure 4.4 Factors affecting business performance question
4.2 Survey Design
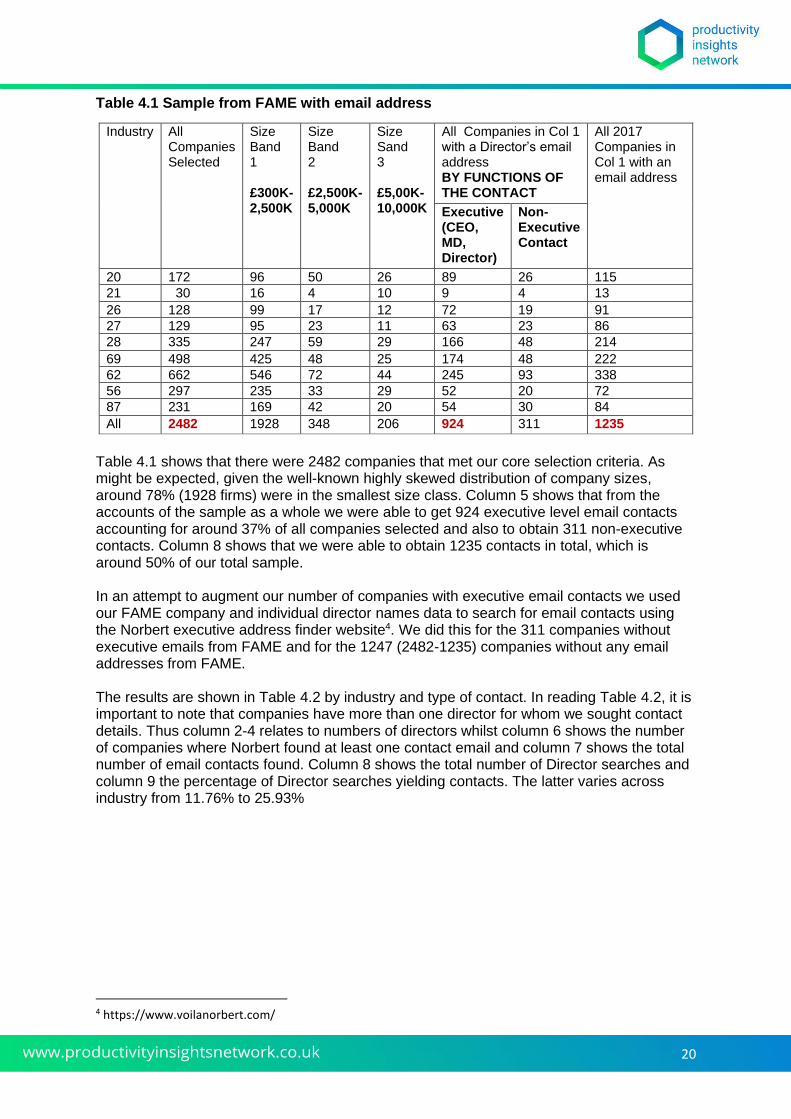
In February 2019, from our FAME sampling frame, we first selected all active companies in nine selected industries with a post code address in the North West Region and a company website. From that group we then selected those with total assets of between £300K and £10,000K in any one of three latest accounting years in the database. We chose to use one of three years because of the known short-term variability in SME growth rates which could tip companies just below or above the cut-off point in any one year. We then downloaded the detailed Fame accounts records for each company and using the fields for Directors identified email contact addresses. The distribution of the whole sample by industry and size class is shown in Table 4.1, Columns 1-4, along with numbers with email contacts in rows 5-7.
20
Table 4.1 Sample from FAME with email address
Industry All Companies Selected
Size Band 1 £300K-2,500K
Size Band 2 £2,500K-5,000K
Size Sand 3 £5,00K-10,000K
All Companies in Col 1 with a Director’s email address BY FUNCTIONS OF THE CONTACT
All 2017 Companies in Col 1 with an email address
Executive (CEO, MD, Director)
Non-Executive Contact
20 172 96 50 26 89 26 115
21 30 16 4 10 9 4 13
26 128 99 17 12 72 19 91
27 129 95 23 11 63 23 86
28 335 247 59 29 166 48 214
69 498 425 48 25 174 48 222
62 662 546 72 44 245 93 338
56 297 235 33 29 52 20 72
87 231 169 42 20 54 30 84
All 2482 1928 348 206 924 311 1235
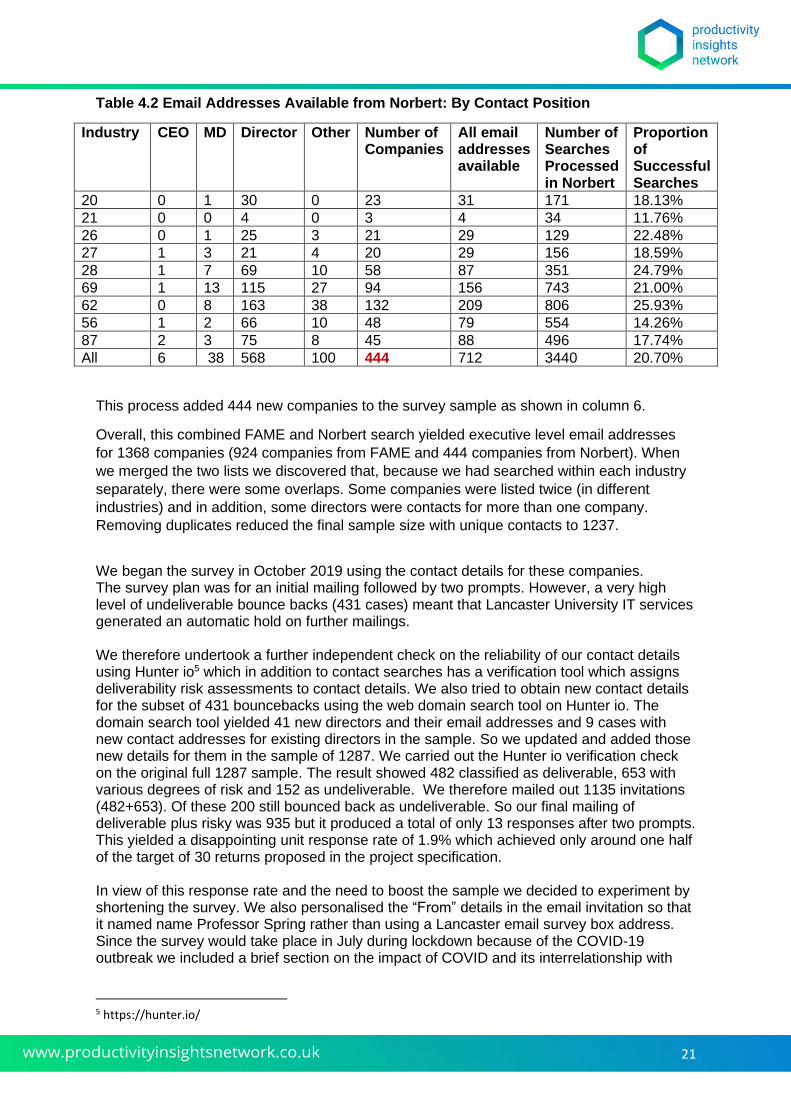
Table 4.1 shows that there were 2482 companies that met our core selection criteria. As might be expected, given the well-known highly skewed distribution of company sizes, around 78% (1928 firms) were in the smallest size class. Column 5 shows that from the accounts of the sample as a whole we were able to get 924 executive level email contacts accounting for around 37% of all companies selected and also to obtain 311 non-executive contacts. Column 8 shows that we were able to obtain 1235 contacts in total, which is around 50% of our total sample. In an attempt to augment our number of companies with executive email contacts we used our FAME company and individual director names data to search for email contacts using the Norbert executive address finder website4. We did this for the 311 companies without executive emails from FAME and for the 1247 (2482-1235) companies without any email addresses from FAME. The results are shown in Table 4.2 by industry and type of contact. In reading Table 4.2, it is important to note that companies have more than one director for whom we sought contact details. Thus column 2-4 relates to numbers of directors whilst column 6 shows the number of companies where Norbert found at least one contact email and column 7 shows the total number of email contacts found. Column 8 shows the total number of Director searches and column 9 the percentage of Director searches yielding contacts. The latter varies across industry from 11.76% to 25.93%
4 https://www.voilanorbert.com/
21
Table 4.2 Email Addresses Available from Norbert: By Contact Position
Industry CEO MD Director Other Number of Companies
All email addresses available
Number of Searches Processed in Norbert
Proportion of Successful Searches
20 0 1 30 0 23 31 171 18.13%
21 0 0 4 0 3 4 34 11.76%
26 0 1 25 3 21 29 129 22.48%
27 1 3 21 4 20 29 156 18.59%
28 1 7 69 10 58 87 351 24.79%
69 1 13 115 27 94 156 743 21.00%
62 0 8 163 38 132 209 806 25.93%
56 1 2 66 10 48 79 554 14.26%
87 2 3 75 8 45 88 496 17.74%
All 6 38 568 100 444 712 3440 20.70%
This process added 444 new companies to the survey sample as shown in column 6.
Overall, this combined FAME and Norbert search yielded executive level email addresses
for 1368 companies (924 companies from FAME and 444 companies from Norbert). When
we merged the two lists we discovered that, because we had searched within each industry
separately, there were some overlaps. Some companies were listed twice (in different
industries) and in addition, some directors were contacts for more than one company.
Removing duplicates reduced the final sample size with unique contacts to 1237.
We began the survey in October 2019 using the contact details for these companies. The survey plan was for an initial mailing followed by two prompts. However, a very high level of undeliverable bounce backs (431 cases) meant that Lancaster University IT services generated an automatic hold on further mailings. We therefore undertook a further independent check on the reliability of our contact details using Hunter io5 which in addition to contact searches has a verification tool which assigns deliverability risk assessments to contact details. We also tried to obtain new contact details for the subset of 431 bouncebacks using the web domain search tool on Hunter io. The domain search tool yielded 41 new directors and their email addresses and 9 cases with new contact addresses for existing directors in the sample. So we updated and added those new details for them in the sample of 1287. We carried out the Hunter io verification check on the original full 1287 sample. The result showed 482 classified as deliverable, 653 with various degrees of risk and 152 as undeliverable. We therefore mailed out 1135 invitations (482+653). Of these 200 still bounced back as undeliverable. So our final mailing of deliverable plus risky was 935 but it produced a total of only 13 responses after two prompts. This yielded a disappointing unit response rate of 1.9% which achieved only around one half of the target of 30 returns proposed in the project specification. In view of this response rate and the need to boost the sample we decided to experiment by shortening the survey. We also personalised the “From” details in the email invitation so that it named name Professor Spring rather than using a Lancaster email survey box address. Since the survey would take place in July during lockdown because of the COVID-19 outbreak we included a brief section on the impact of COVID and its interrelationship with
5 https://hunter.io/
22
Management Practices. This was an attempt to improve response rates by making it more relevant to the conditions that were affecting companies at that time. We also refreshed the FAME sample using the same selection criteria but drawing upon any revisions to the FAME data due to the addition of more recent company accounts data. We also reran the Hunter io verification checks on this refreshed sample. Of the original 1287, 101 failed to meet the selection criteria because they fell outside the asset size limits or were no longer active. We gained 264 entirely new companies and contacts. There were 248 cases where we identified new contacts for an existing company. We decided that we should not approach companies with contacts we had approached before. In effect, this was a new survey draw from our original sample where the contact had not previously been approached. We ran a Hunter io verification check on this combined group of 512 companies. The check showed 197 (38.5%) deliverable. 269 (52.5%) as risky deliveries and 46 (8.9%) as undeliverable. We selected the first two of these groups. This produced a survey sample of 438 companies. When the survey was launched 58 contacts bounced back as undeliverable leaving a final delivered sample of 404 companies from which we received 25 responses thus yielding a unit response rate of 6.1%. This was much higher than the first survey and most likely the result of shortening the survey and refreshing the sample. It is important to note that this higher rate was achieved in the midst of the COVID lockdown and in a severe economic recession. The combined sample from the two surveys was thus 38 to which we added the survey returns of the 11 case study interview firms. This yielded a total achieved sample of 49 companies compared to the target of 30. Of the 49 respondents, 40 answered all the questions that were common to the long and shortened questionnaires (thus excluding, for example, the COVID questions). They did so with no missing values and therefore for this 40 an item response rate of 100% was achieved on all questions. We concentrate on this sample of 40 companies in describing the results. Since the number of responses yielded very few observations in some industries, in the analysis that follows we aggregate the industries into two broad sector groups of Manufacturing and Services.
4.3 Results
The Sample
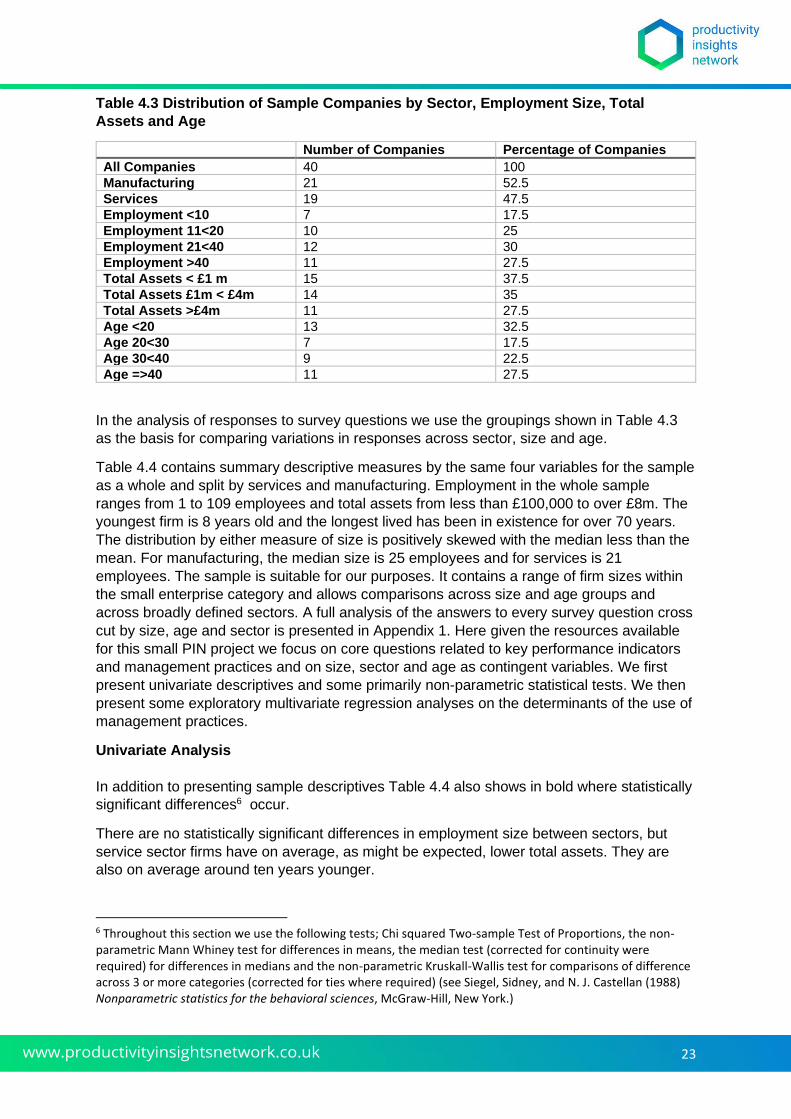
Table 4.3 shows the distribution of the 40 sample companies by sector, employment total
assets and age.
The sample is roughly equally split between manufacturing and services and over half the
sample employ between 11 and 40 employees and over 70% have less than £4m in total
assets. There is a wide age range with nearly a third less than 20 years old over a quarter
40 years old or more.
23
Table 4.3 Distribution of Sample Companies by Sector, Employment Size, Total
Assets and Age
Number of Companies Percentage of Companies
All Companies 40 100
Manufacturing 21 52.5
Services 19 47.5
Employment <10 7 17.5
Employment 11<20 10 25
Employment 21<40 12 30
Employment >40 11 27.5
Total Assets < £1 m 15 37.5
Total Assets £1m < £4m 14 35
Total Assets >£4m 11 27.5
Age <20 13 32.5
Age 20<30 7 17.5
Age 30<40 9 22.5
Age =>40 11 27.5
In the analysis of responses to survey questions we use the groupings shown in Table 4.3
as the basis for comparing variations in responses across sector, size and age.
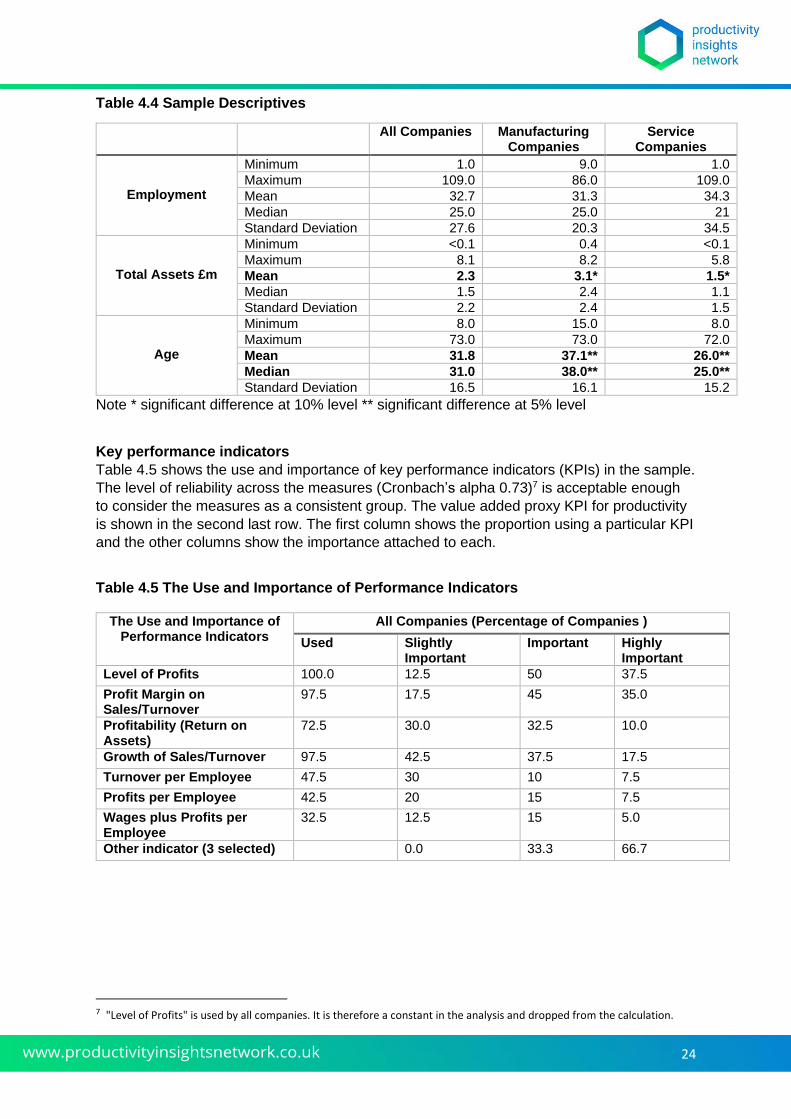
Table 4.4 contains summary descriptive measures by the same four variables for the sample
as a whole and split by services and manufacturing. Employment in the whole sample
ranges from 1 to 109 employees and total assets from less than £100,000 to over £8m. The
youngest firm is 8 years old and the longest lived has been in existence for over 70 years.
The distribution by either measure of size is positively skewed with the median less than the
mean. For manufacturing, the median size is 25 employees and for services is 21
employees. The sample is suitable for our purposes. It contains a range of firm sizes within
the small enterprise category and allows comparisons across size and age groups and
across broadly defined sectors. A full analysis of the answers to every survey question cross
cut by size, age and sector is presented in Appendix 1. Here given the resources available
for this small PIN project we focus on core questions related to key performance indicators
and management practices and on size, sector and age as contingent variables. We first
present univariate descriptives and some primarily non-parametric statistical tests. We then
present some exploratory multivariate regression analyses on the determinants of the use of
management practices.
Univariate Analysis
In addition to presenting sample descriptives Table 4.4 also shows in bold where statistically
significant differences6 occur.
There are no statistically significant differences in employment size between sectors, but
service sector firms have on average, as might be expected, lower total assets. They are
also on average around ten years younger.
6 Throughout this section we use the following tests; Chi squared Two-sample Test of Proportions, the non-parametric Mann Whiney test for differences in means, the median test (corrected for continuity were required) for differences in medians and the non-parametric Kruskall-Wallis test for comparisons of difference across 3 or more categories (corrected for ties where required) (see Siegel, Sidney, and N. J. Castellan (1988) Nonparametric statistics for the behavioral sciences, McGraw-Hill, New York.)
24
Table 4.4 Sample Descriptives
All Companies Manufacturing Companies
Service Companies
Employment
Minimum 1.0 9.0 1.0
Maximum 109.0 86.0 109.0
Mean 32.7 31.3 34.3
Median 25.0 25.0 21
Standard Deviation 27.6 20.3 34.5
Total Assets £m
Minimum <0.1 0.4 <0.1
Maximum 8.1 8.2 5.8
Mean 2.3 3.1* 1.5*
Median 1.5 2.4 1.1
Standard Deviation 2.2 2.4 1.5
Age
Minimum 8.0 15.0 8.0
Maximum 73.0 73.0 72.0
Mean 31.8 37.1** 26.0**
Median 31.0 38.0** 25.0**
Standard Deviation 16.5 16.1 15.2
Note * significant difference at 10% level ** significant difference at 5% level
Key performance indicators
Table 4.5 shows the use and importance of key performance indicators (KPIs) in the sample.
The level of reliability across the measures (Cronbach’s alpha 0.73)7 is acceptable enough
to consider the measures as a consistent group. The value added proxy KPI for productivity
is shown in the second last row. The first column shows the proportion using a particular KPI
and the other columns show the importance attached to each.
Table 4.5 The Use and Importance of Performance Indicators
The Use and Importance of Performance Indicators
All Companies (Percentage of Companies )
Used Slightly Important
Important Highly Important
Level of Profits 100.0 12.5 50 37.5
Profit Margin on Sales/Turnover
97.5 17.5 45 35.0
Profitability (Return on Assets)
72.5 30.0 32.5 10.0
Growth of Sales/Turnover 97.5 42.5 37.5 17.5
Turnover per Employee 47.5 30 10 7.5
Profits per Employee 42.5 20 15 7.5
Wages plus Profits per Employee
32.5 12.5 15 5.0
Other indicator (3 selected)
0.0 33.3 66.7
7 "Level of Profits" is used by all companies. It is therefore a constant in the analysis and dropped from the calculation.
25
The level of profits, profit margin on sales and the growth of sales are used by virtually all the
sample companies. Of these the first two are also most frequently rated as highly important.
In general KPIs linked to employment are used by less than half the sample and are
infrequently cited as being highly important. The productivity proxy KPI is the least used
(32.5%) and only 5% of respondents regard it as highly important. It appears that the pursuit
of productivity is not seen as an important KPI by the typical businesses in this sample.
We tested for differences in the use and importance of individual KPIs across sectors, and
across our size and age groups. We found no statistically significant differences except in
the case of the little used productivity proxy KPI where there were variations across
employment size groups. (Kruskall Wallis corrected for ties p= 0.097, significant at 10%
level).
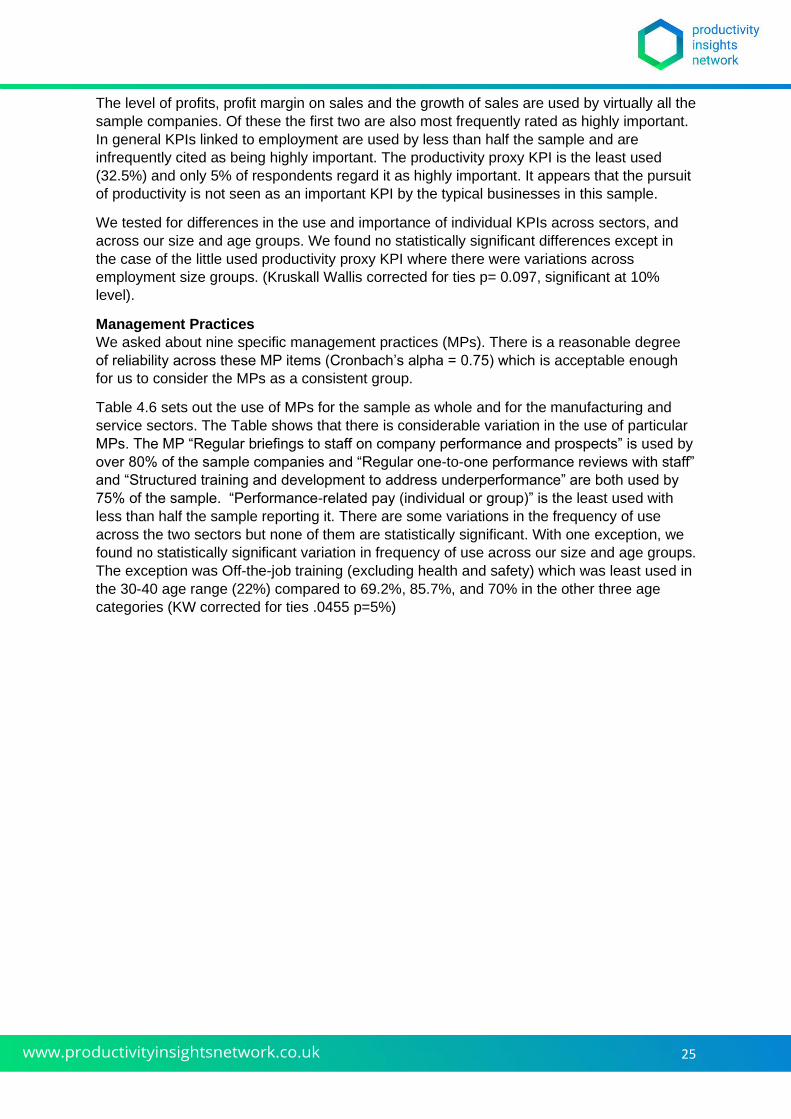
Management Practices
We asked about nine specific management practices (MPs). There is a reasonable degree
of reliability across these MP items (Cronbach’s alpha = 0.75) which is acceptable enough
for us to consider the MPs as a consistent group.
Table 4.6 sets out the use of MPs for the sample as whole and for the manufacturing and
service sectors. The Table shows that there is considerable variation in the use of particular
MPs. The MP “Regular briefings to staff on company performance and prospects” is used by
over 80% of the sample companies and “Regular one-to-one performance reviews with staff”
and “Structured training and development to address underperformance” are both used by
75% of the sample. “Performance-related pay (individual or group)” is the least used with
less than half the sample reporting it. There are some variations in the frequency of use
across the two sectors but none of them are statistically significant. With one exception, we
found no statistically significant variation in frequency of use across our size and age groups.
The exception was Off-the-job training (excluding health and safety) which was least used in
the 30-40 age range (22%) compared to 69.2%, 85.7%, and 70% in the other three age
categories (KW corrected for ties .0455 p=5%)
26
Table 4.6 The Use of Management Practices
The Use of Management Practices
All Companies Manufacturing Companies
Service Companies
Number of Companies
Percentage of Companies
Number of Companies
Percentage of Companies
Number of Companies
Percentage of Companies
Formal performance target-setting with staff
19 47.5 8 38.1 11 57.9
Regular one-to-one performance reviews with staff
30 75 14 66.7 16 84.2
Performance-related pay (individual or group)
19 47.5 10 47.7 9 47.4
Structured disciplinary processing to address staff underperformance
27 67.5 14 66.7 13 68.4
Structured training and development to address underperformance
30 75 16 76.2 14 73.7
Pro-active career development 26 65 14 66.7 12 63.2
Off-the-job training (excluding health and safety)
24 61.5 12 57.1 12 66.7
Teamworking, where team members jointly decide how work is to be done
27 67.5 15 71.4 12 63.2
Regular briefings to staff on company performance and prospects
33 82.5 18 85.7 15 70.0
So far we have considered the extent of use individual MPs. We now turn to the extent to
which companies use multiple MPs. Table 4.7 analyses this for the whole sample and for our
standard subgroups. The median number is 6 out of 9 for the sample as whole and varies
between 5 and 8 out of 9 considering all the different subgroups. There are some companies
who report none at all and some who report using them all. None of the differences in the
numbers used across groups are statistically significant.
Table 4.7 The Number of Management Practices used by Companies
Number of Companies
Minimum Maximum Mean Median
All Companies 39 0 9 6.0 6
Manufacturing 21 2 9 5.8 6
Services 18 0 9 6.3 7
Employment <10 6 0 8 4.3 5
Employment 11<20 10 2 9 5.8 6
Employment 21<40 12 2 9 6.6 7
Employment >40 11 4 9 6.6 7
Age <20 13 4 9 6.4 7
Age 20<30 7 2 9 6.6 8
Age 30<40 9 0 8 5.1 6
Age =>40 11 0 9 5.5 6
27
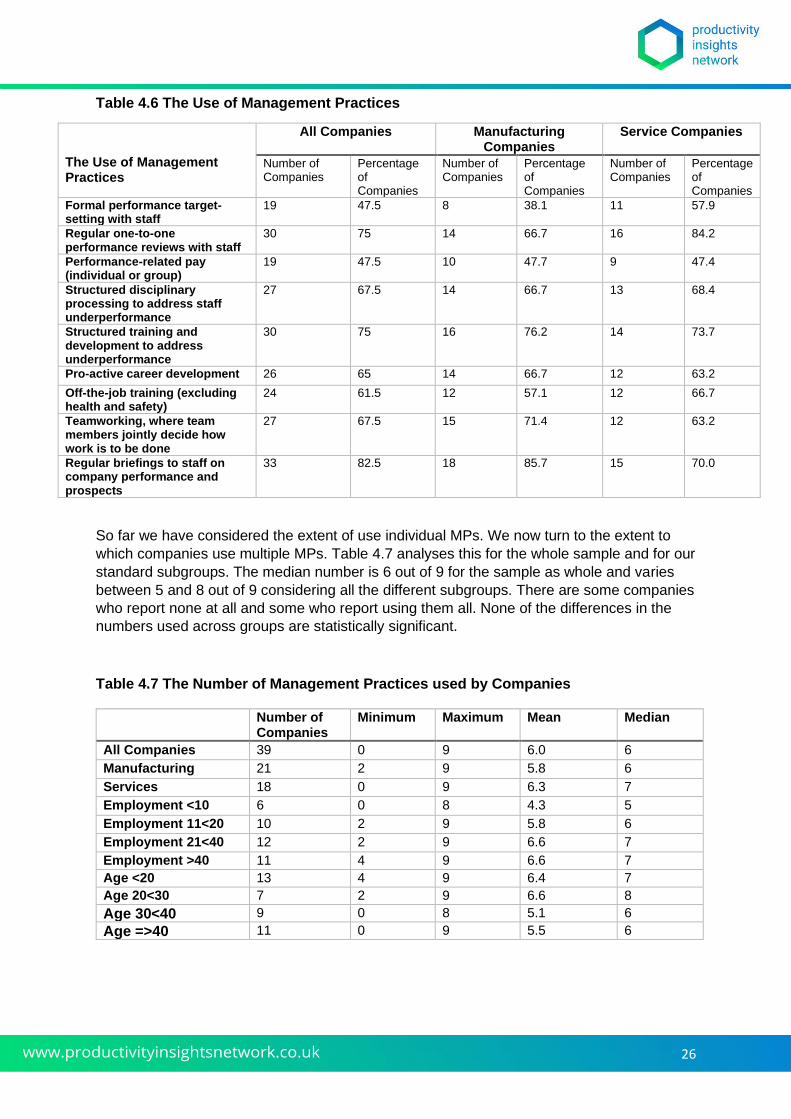
Multivariate Analysis: The Determinants of the Use of Management Practices
In this section, we carry out an exploratory multivariate logit regression analysis of the
determinants of use of each of the 9 MPs shown in Table 4.6. The dependent “contingent”
variables include full time equivalent employment size and age (both in logarithmic form
because the underlying distributions are not normal (normality rejected in both cases using
Shapiro Wilk W test), a sector dummy variable (Mfg =1) and three motivational
variables8.The dependent and other variable names and definitions are shown in Table 4.8.
Table 4.8 Variables: Important reason for Involvement in the Business, and
Management Practices
Increase the current and future value of the business businve01IMP
Increase personal or family wealth businve02IMP
Build a business to generate wealth through sale to non-family members businve08IMP
Formal performance target-setting with staff mngprac1
Regular one-to-one performance reviews with staff mngprac2
Performance-related pay (individual or group) mngprac3
Structured disciplinary processing to address staff underperformance mngprac4
Structured training and development to address underperformance mngprac5
Pro-active career development mngprac6
Off-the-job training (excluding health and safety) mngprac7
Teamworking, where team members jointly decide how work is to be done mngprac8
Regular briefings to staff on company performance and prospects mngprac9
The results of the logit regression are shown in Table 4.9. Employment size has a positive
effect in each case and statistically significant so in the cases of; regular one-to-one
performance reviews; performance-related pay; structured disciplinary processing for
underperformance; and structured training to address underperformance; and pro-active
career development. Age has a uniformly negative impact which is statistically significant in
the case of regular one-to-one performance reviews; performance-related pay; and
structured disciplinary processing for underperformance.
8 We experimented with multiple combinations of other contingent variables including measures of task organisation and business process type and number of competitors. The limited number of degrees of freedom in the small pilot sample means that we focus on an illustrative example here including the key contingent variables of age and size.
28
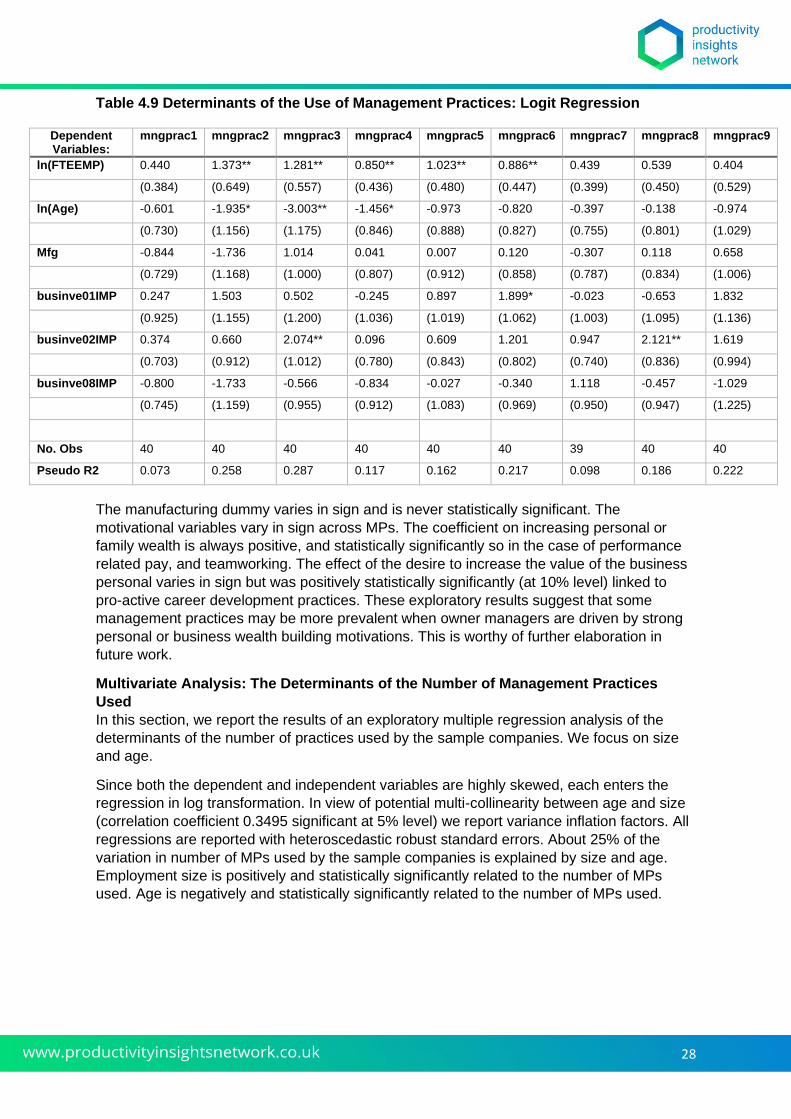
Table 4.9 Determinants of the Use of Management Practices: Logit Regression
Dependent Variables:
mngprac1 mngprac2 mngprac3 mngprac4 mngprac5 mngprac6 mngprac7 mngprac8 mngprac9
ln(FTEEMP) 0.440 1.373** 1.281** 0.850** 1.023** 0.886** 0.439 0.539 0.404
(0.384) (0.649) (0.557) (0.436) (0.480) (0.447) (0.399) (0.450) (0.529)
ln(Age) -0.601 -1.935* -3.003** -1.456* -0.973 -0.820 -0.397 -0.138 -0.974
(0.730) (1.156) (1.175) (0.846) (0.888) (0.827) (0.755) (0.801) (1.029)
Mfg -0.844 -1.736 1.014 0.041 0.007 0.120 -0.307 0.118 0.658
(0.729) (1.168) (1.000) (0.807) (0.912) (0.858) (0.787) (0.834) (1.006)
businve01IMP 0.247 1.503 0.502 -0.245 0.897 1.899* -0.023 -0.653 1.832
(0.925) (1.155) (1.200) (1.036) (1.019) (1.062) (1.003) (1.095) (1.136)
businve02IMP 0.374 0.660 2.074** 0.096 0.609 1.201 0.947 2.121** 1.619
(0.703) (0.912) (1.012) (0.780) (0.843) (0.802) (0.740) (0.836) (0.994)
businve08IMP -0.800 -1.733 -0.566 -0.834 -0.027 -0.340 1.118 -0.457 -1.029
(0.745) (1.159) (0.955) (0.912) (1.083) (0.969) (0.950) (0.947) (1.225)
No. Obs 40 40 40 40 40 40 39 40 40
Pseudo R2 0.073 0.258 0.287 0.117 0.162 0.217 0.098 0.186 0.222
The manufacturing dummy varies in sign and is never statistically significant. The
motivational variables vary in sign across MPs. The coefficient on increasing personal or
family wealth is always positive, and statistically significantly so in the case of performance
related pay, and teamworking. The effect of the desire to increase the value of the business
personal varies in sign but was positively statistically significantly (at 10% level) linked to
pro-active career development practices. These exploratory results suggest that some
management practices may be more prevalent when owner managers are driven by strong
personal or business wealth building motivations. This is worthy of further elaboration in
future work.
Multivariate Analysis: The Determinants of the Number of Management Practices
Used
In this section, we report the results of an exploratory multiple regression analysis of the
determinants of the number of practices used by the sample companies. We focus on size
and age.
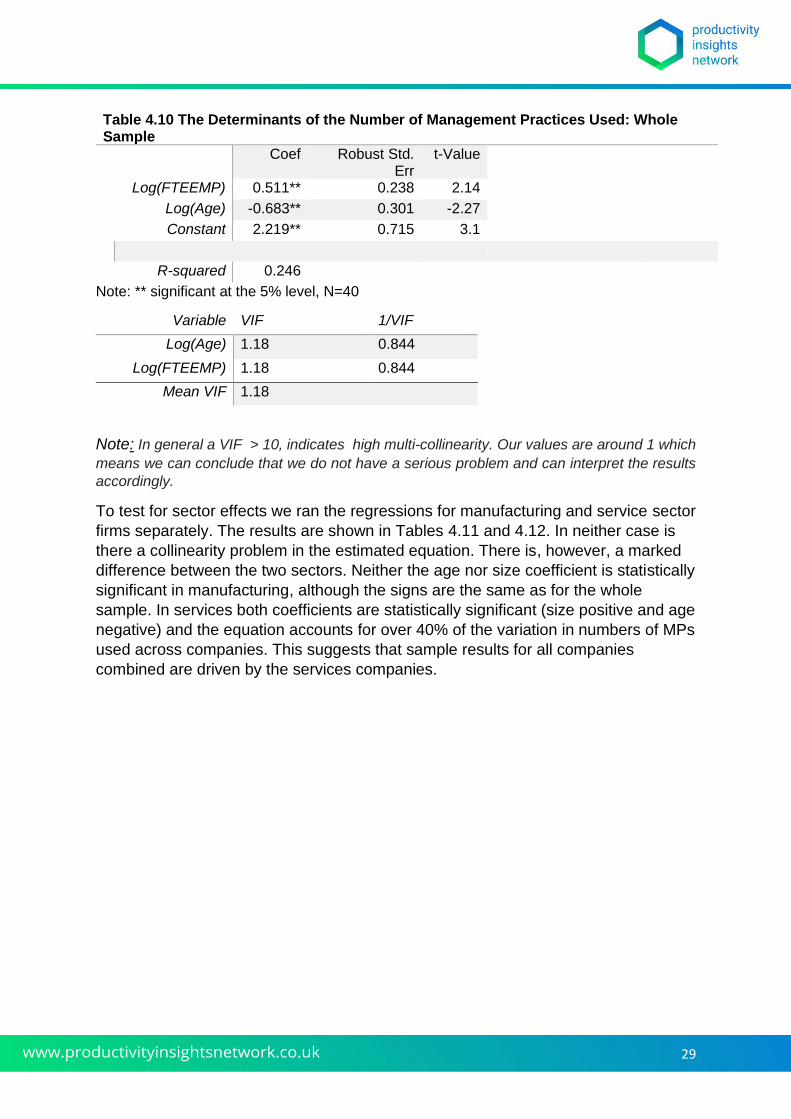
Since both the dependent and independent variables are highly skewed, each enters the
regression in log transformation. In view of potential multi-collinearity between age and size
(correlation coefficient 0.3495 significant at 5% level) we report variance inflation factors. All
regressions are reported with heteroscedastic robust standard errors. About 25% of the
variation in number of MPs used by the sample companies is explained by size and age.
Employment size is positively and statistically significantly related to the number of MPs
used. Age is negatively and statistically significantly related to the number of MPs used.
29
Table 4.10 The Determinants of the Number of Management Practices Used: Whole Sample
Coef Robust Std. Err
t-Value
Log(FTEEMP) 0.511** 0.238 2.14
Log(Age) -0.683** 0.301 -2.27
Constant 2.219** 0.715 3.1
R-squared 0.246
Note: ** significant at the 5% level, N=40
Variable VIF 1/VIF
Log(Age) 1.18 0.844
Log(FTEEMP) 1.18 0.844
Mean VIF 1.18
Note: In general a VIF > 10, indicates high multi-collinearity. Our values are around 1 which
means we can conclude that we do not have a serious problem and can interpret the results
accordingly.
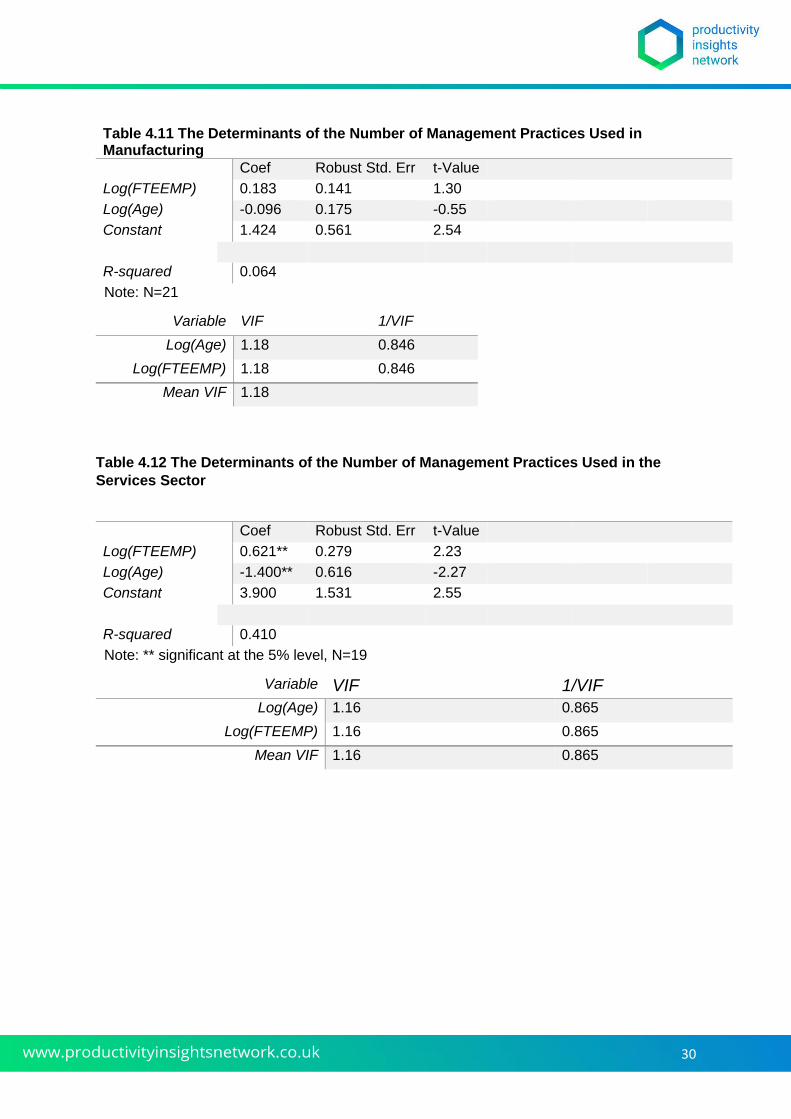
To test for sector effects we ran the regressions for manufacturing and service sector
firms separately. The results are shown in Tables 4.11 and 4.12. In neither case is
there a collinearity problem in the estimated equation. There is, however, a marked
difference between the two sectors. Neither the age nor size coefficient is statistically
significant in manufacturing, although the signs are the same as for the whole
sample. In services both coefficients are statistically significant (size positive and age
negative) and the equation accounts for over 40% of the variation in numbers of MPs
used across companies. This suggests that sample results for all companies
combined are driven by the services companies.
30
Table 4.11 The Determinants of the Number of Management Practices Used in Manufacturing
Coef Robust Std. Err t-Value
Log(FTEEMP) 0.183 0.141 1.30
Log(Age) -0.096 0.175 -0.55
Constant 1.424 0.561 2.54
R-squared 0.064
Note: N=21
Variable VIF 1/VIF
Log(Age) 1.18 0.846
Log(FTEEMP) 1.18 0.846
Mean VIF 1.18
Table 4.12 The Determinants of the Number of Management Practices Used in the
Services Sector
Coef Robust Std. Err t-Value
Log(FTEEMP) 0.621** 0.279 2.23
Log(Age) -1.400** 0.616 -2.27
Constant 3.900 1.531 2.55
R-squared 0.410
Note: ** significant at the 5% level, N=19
Variable VIF 1/VIF
Log(Age) 1.16 0.865
Log(FTEEMP) 1.16 0.865
Mean VIF 1.16 0.865
31
Implications of the Multivariate Regression Analyses
These exploratory small sample results are potentially important to interpreting single
equation estimates of the effects on poor productivity performance of the under-use of
structured management practices by small firms (e.g. ONS, 2016). Such estimates may be
confounded by picking up contingent size and age effects. This suggests that a selection
model approach should be adopted to testing the link between management practices and
small firm productivity. This would first condition use of management practices in terms of
size and age (and other contingent variables)and then use a selection-corrected regression
analysis of impact of their use on productivity.
The results also suggest that the determinants of the number of practices used varies by the
broad sectors used here so that industry effects need to be included in selection modelling.
These are, however, small-sample exploratory results and require much larger samples to
assess their robustness.
5. Concluding discussion and suggestions for further work
In this section, we draw together and discuss the main findings from our qualitative and
survey research. We examine the findings both in terms of the substantive questions we set
out to address, and, particularly in respect of the survey, the lessons we have learned about
how to conduct a full-scale study of this kind. We also comment on some of the obstacles we
faced and their impact on our ability to satisfy all the objectives we set ourselves at the
outset in this small PIN project.
Overall, we have achieved our main objective of conducting a pilot survey of sufficient scale
to provide insights into the design and conduct of a full-scale survey into performance
measurement, productivity and management practices in smaller firms. For a variety of
reasons, which we discuss in section 5.3, we have not been able to produce all the outputs
that we had hoped we might, and our opportunities for wider engagement and dissemination
have been curtailed. We nevertheless anticipate that the approach and findings summarised
in this report can be further explored and exploited with relevant interested parties, after the
formal conclusion of the PIN project period.
5.1 Principal insights on productivity and management practices
The main key performance indicators used by business directors to guide their decision-
making are the level of profits, profit margin on sales and the growth of sales, with the first
two most frequently rated as highly important. In general, KPIs linked to number of
employees are used much less, and are infrequently cited as being highly important. The
productivity proxy KPI of wages plus profits divided by number of employees is the least
used (32.5%) and only 5% of respondents regard it as highly important. It appears that the
pursuit of productivity is not seen as an important KPI by the typical businesses in our
sample.
The findings of the pilot survey sample showed that a proxy for productivity was rarely used
as a key performance indicator and was even less likely to be rated as an important one.
This is consistent with the qualitative findings. In relation to management practices, the
analysis of the survey responses showed considerable variation across companies in the
use of particular indicators and in the total numbers of practices used. Both of these were
affected systematically by contingent factors. The number of practices used was strongly
positively related to employment size and strongly negatively related to firm age in the
services sector. Attempts to explain business performance in terms of the use of
32
management practices must take this into account by adopting suitable selection modelling
techniques. These first model management practice use in terms of contingent factors such
as size and age and then run suitably adjusted second-stage equations which seek to
determine the effects on productivity of management practices, size and firm age.
5.2 Lessons learned on designing and conducting a full-scale survey
The interviews proved useful in helping to frame questions about performance indicators and
especially in the decision to including a performance measure using the sum of wages and
profits, divided by number of employees, as a proxy for productivity. The interviewees found
it difficult to define productivity per se. This insight should be taken forward in any further
surveys.
The COVID-19 pandemic makes it difficult to draw conclusions about response rates from
the pilot survey. A number of points can however be made about optimising the use of the
FAME database.
It is the only large-scale, easily accessible database that provides directors’ email addresses
for a web-based survey, combined with accounts data that permit the derivation of proxy
value-added-per-head productivity measures. However, the contacts are often not reported
and, for small firms, limited disclosure requirements often mean that data on profits and
wages are also missing. In future work, careful attention would need to be paid to any
potential selection biases to which lack of contacts might give rise. Wages and profits, and
even employment data will, in many cases, have to be collected in the survey instrument
itself.
Second, there are important time lags between the end year dates in the accounts, the date
of the deposition of those accounts in Companies House, and their subsequent inclusion in
the FAME database. Researchers using them must, as far as possible, avoid further lags
and the consequent use of potentially outdated addresses. We found that checks against
commercial email address contact list companies (Hunter io, Norbert), based on public
domain website information, to be very useful, and these should be used to check, verify and
augment the FAME lists.
Finally, great care has to be taken in ensuring that GDPR regulations are satisfied in relation
to the collection and use of personal contact information in the survey process. Moreover,
response rates may be expected to be low because of the widespread use of spam filters.
The more personalised the sender’s address is and the more prompts that can be used, the
better. The latter likely persuades the recipient that an emailed request is not spam.
5.3 Limitations
The previous section has set out the various difficulties that we faced in achieving anything
like an acceptable response rate, and the consequent need to conduct multiple rounds of the
survey. While these difficulties provided valuable insights into how a future full-scale survey
might best be conducted, they also delayed progress to the extent that our work then ran
into the period affected by the COVID-19 pandemic. This most likely further undermined
response rate, although we tried to adapt our survey instrument to make it topical to potential
respondents. (The delay was further compounded by both investigators being indisposed
from time to time during the project period.)
33
We have reported the results we have from both the qualitative and survey facets of our
research. Both show some interesting insights. But we do not consider that either are
sufficiently substantial to provide the basis for the high quality publications that we had
hoped to produce.
5.4 Further work
There is clearly scope to conduct further research to understand the relationship between
the KPIs that owner-directors of small firms use to direct their businesses, and productivity
outcomes. Both parts of our research show that productivity is not used as a measure very
much at all. One response to this might be to attempt to build the measurement of
productivity into the routines of owner-managers. This, however, begs the question of
whether they would act on indications of shortcomings in productivity if they are, for
whatever variety of reasons, more motivated by other outcomes such as growth or profit. A
second approach would be to explore further which of the KPIS that are widely used are
most often associated with better productivity. The third approach is to focus on
management practices, and let improved productivity emerge as a consequence. Of course,
the insight from our research here is that management practices should be appropriate to
the size of the firm. An interesting avenue for further research here would be to explore, in
smaller firms, where elaborate and formalised systems of management practices are seen
as burdensome and/or irrelevant, which one or two simple practices might make the biggest
impact on productivity.
Methodologically, we have indicated in some detail the challenges associated with
conducting survey-based research in this area. On the positive side, surveys conducted on
small firms are much more likely than those conducted on large corporations to receive
responses from well-informed individuals who have access to good quality, relevant data (cf
Kull et al., 2018). This was evident in the quality of data provided in those responses we did
receive. However, for the various reasons we discuss, achieving an acceptable response
rate is extremely difficult, even without the intervention of a pandemic, especially if the
request comes from an organisation (e.g. a university) other than a statutory body such as
the ONS. It may well be the case that research resources are more profitably used in
conducting a relatively large number of interviews, of a somewhat more closely structured
and closed nature than our interviews. Indeed, such an approach was used in the original
World Management Survey studies (Bloom and Van Reenen, 2007).
The study also gives an indication of what might be achieved by examining productivity-
related themes using multidisciplinary and multi-method approaches. In this instance, we
have fruitfully combined qualitative, interview-based research with a survey, and drawn on
perspectives from small business management and economics, operations management,
organisation studies and HR/industrial relations. This takes time – the two investigators here
have been working together for several years in order to arrive at some degree of common
understanding – but we feel such approaches have more potential for generating insights
than ever-deeper, but narrow, mono-disciplinary analyses. Changing the tone of the debate,
as PIN has set out to do, requires investment in the capabilities required to learn new
languages, or at least new dialects.
34
References
BEIS 2019. Business Productivity Review. Department for Business, Environment and
Industrial Strategy BLOOM, N., LEMOS, R., SADUN, R., SCUR, D. & VAN REENEN, J. 2014. JEEA-FBBVA
Lecture 2013: The new empirical economics of management. Journal of the European Economic Association, 12, 835-876.
BLOOM, N. & VAN REENEN, J. 2007. Measuring and Explaining Management Practices Across Firms and Countries. The Quarterly Journal of Economics, 122, 1351-1408.
BLOOM, N. & VAN REENEN, J. 2010. Why do management practices differ across firms and countries? The Journal of Economic Perspectives, 24, 203-224.
BRAUN, V. & CLARKE, V. 2006. Using thematic analysis in psychology. Qualitative Research in Psychology, 3, 77-101.
BUFFINGTON, C., FOSTER, L., JARMIN, R. & OHLMACHER, S. 2017. The Management and Organizational Practices Survey (MOPS): An Overview US Census Bureau.
BURNS, T. & STALKER, G. M. 1961. The Management of Innovation, London, Tavistock. CLARKE, V. & BRAUN, V. 2017. Thematic analysis. The Journal of Positive Psychology, 12,
297-298. COSH, A. & HUGHES, A. 1998. Enterprise Britain: Growth Innovation and Public Policy in
the Small and Medium Enterprise Sector 1994-97. Centre for Business Research, University of Cambridge.
FAGGIO, G., SALVANES, K. & VAN REENEN, J. 2007. The Evolution of Inequality in Productivity and Wages: Panel Data Evidence. Cambridge MA: National Bureau of Economic Research.
GUEST, D. E., MICHIE, J., CONWAY, N. & SHEEHAN, M. 2003. Human Resource Management and Corporate Performance in the UK. British Journal of Industrial Relations, 41, 291-314.
KULL, T. J., KOTLAR, J. & SPRING, M. 2018. Small and Medium Enterprise Research in Supply Chain Management: The Case for Single‐Respondent Research Designs. Journal of Supply Chain Management, 54, 23-34.
ONS 2016. Experimental data on the management practices of manufacturing businesses in Great Britain: 2016. Office for National Statistics.
ONS 2018. Management practices and productivity in British production and services industries - initial results from the Management and Expectations Survey: 2016. London: Office for National Statistics.
ONS. 2020. Management and Expectations Survey [Online]. Office for National Statistics Available: https://www.ons.gov.uk/surveys/informationforbusinesses/businesssurveys/managementandexpectations [Accessed 8th March 2021].
SHEEHAN, M. 2014. Human resource management and performance: Evidence from small and medium-sized firms. International Small Business Journal, 32, 545-570.
SOUSA, R. & VOSS, C. A. 2008. Contingency research in operations management practices. Journal of Operations Management, 26, 697-713.
STOREY, D. 1994. Understanding the small business sector, Abingdon, Routledge. VAARA, E. & WHITTINGTON, R. 2012. Strategy-as-practice: taking social practices
seriously. The Academy of Management Annals, 6, 285-336. VAN WANROOY, B., BEWLEY, H., BRYSON, A., FORTH, J., FREETH, S., STOKES, L. &
WOOD , S. 2013. The 2011 Workplace Employment Relations Study: First Findings. Economic and Social Research Council/Advisory, Conciliation and Arbitration Serivce/National Institute of Economic and Social Research.
WOODWARD, J. 1958. Management and technology, London, HMSO.
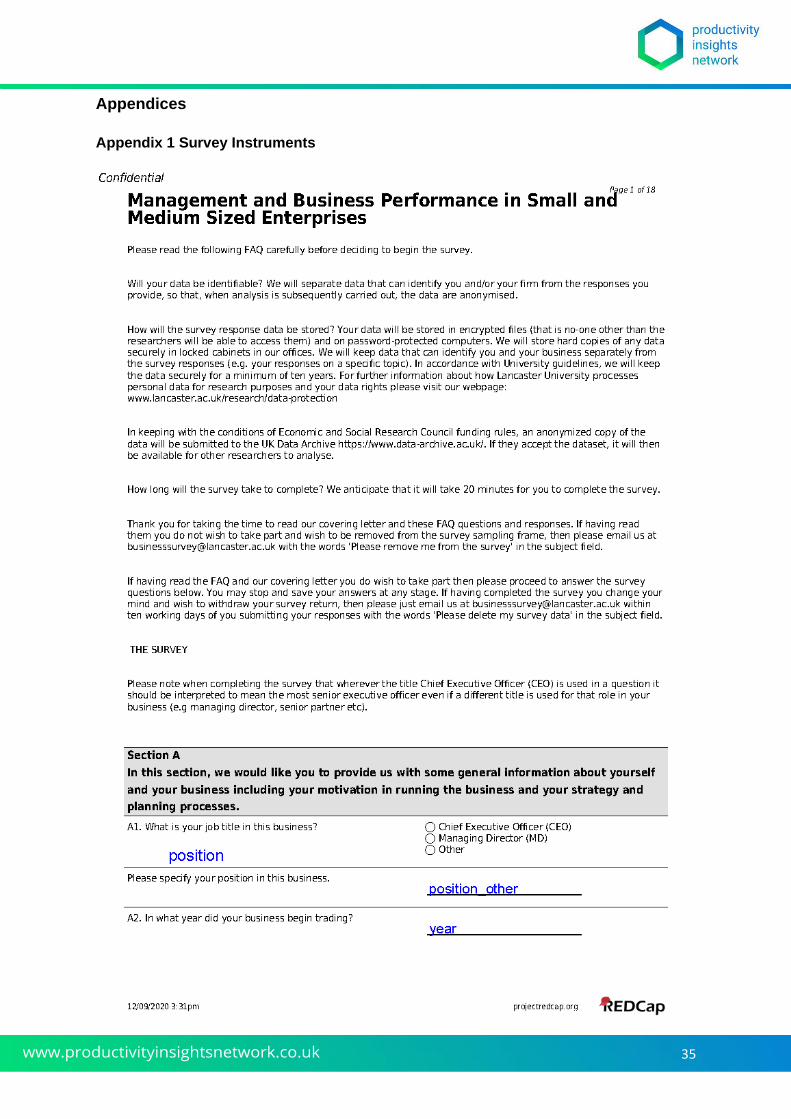
35
Appendices
Appendix 1 Survey Instruments
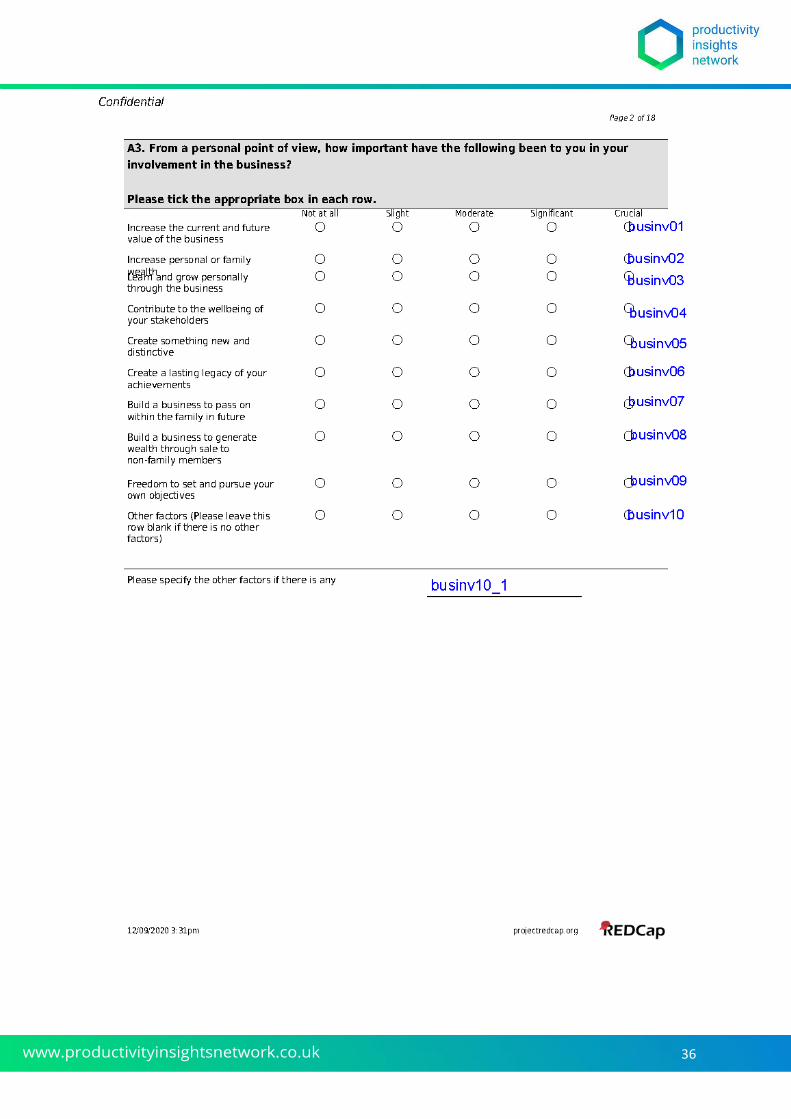
36
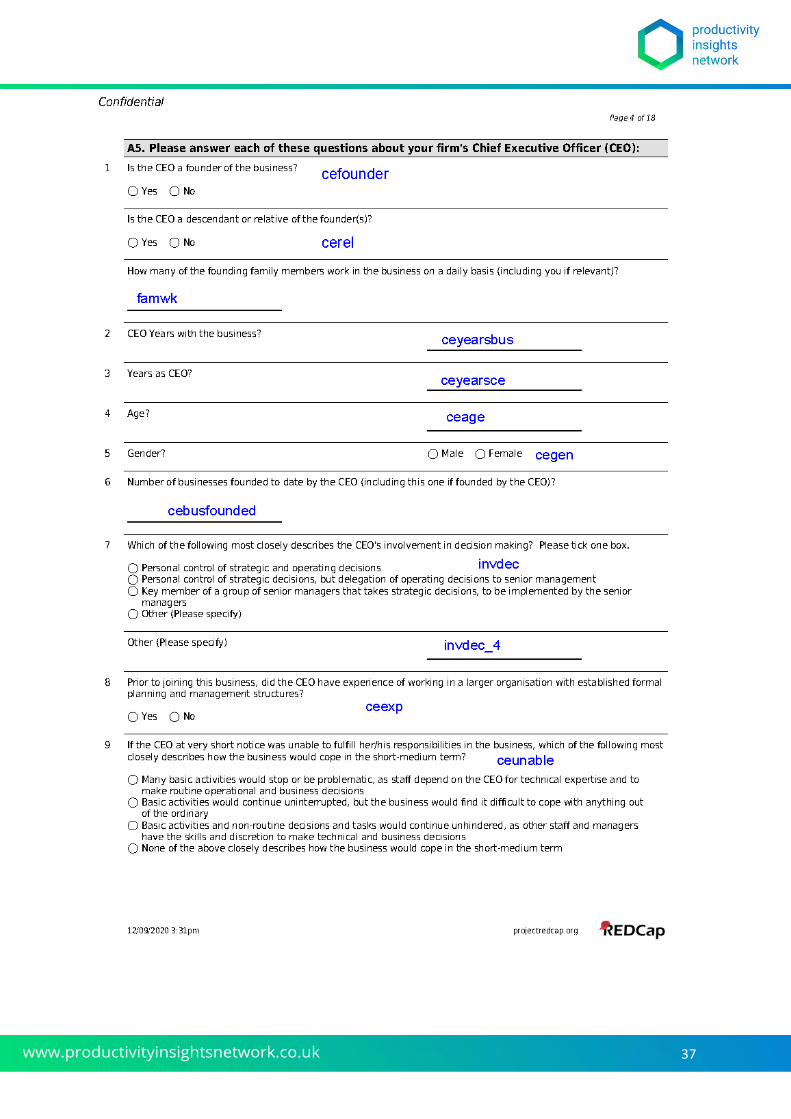
37
38
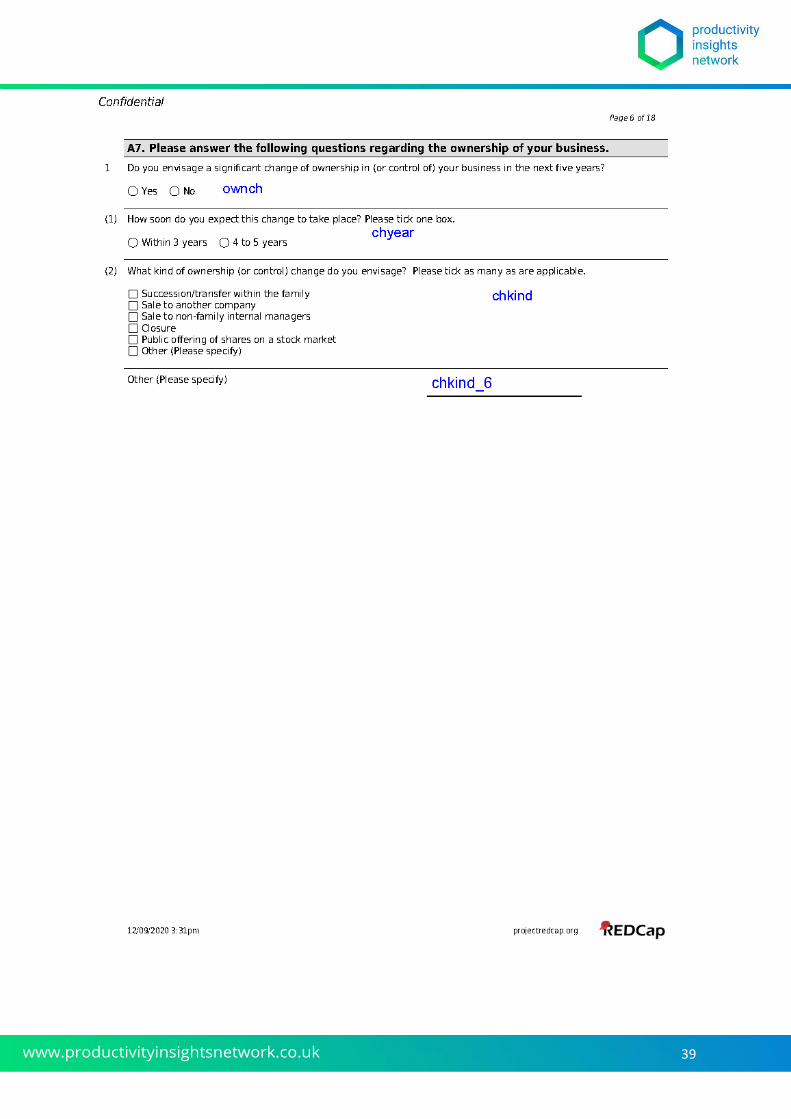
39
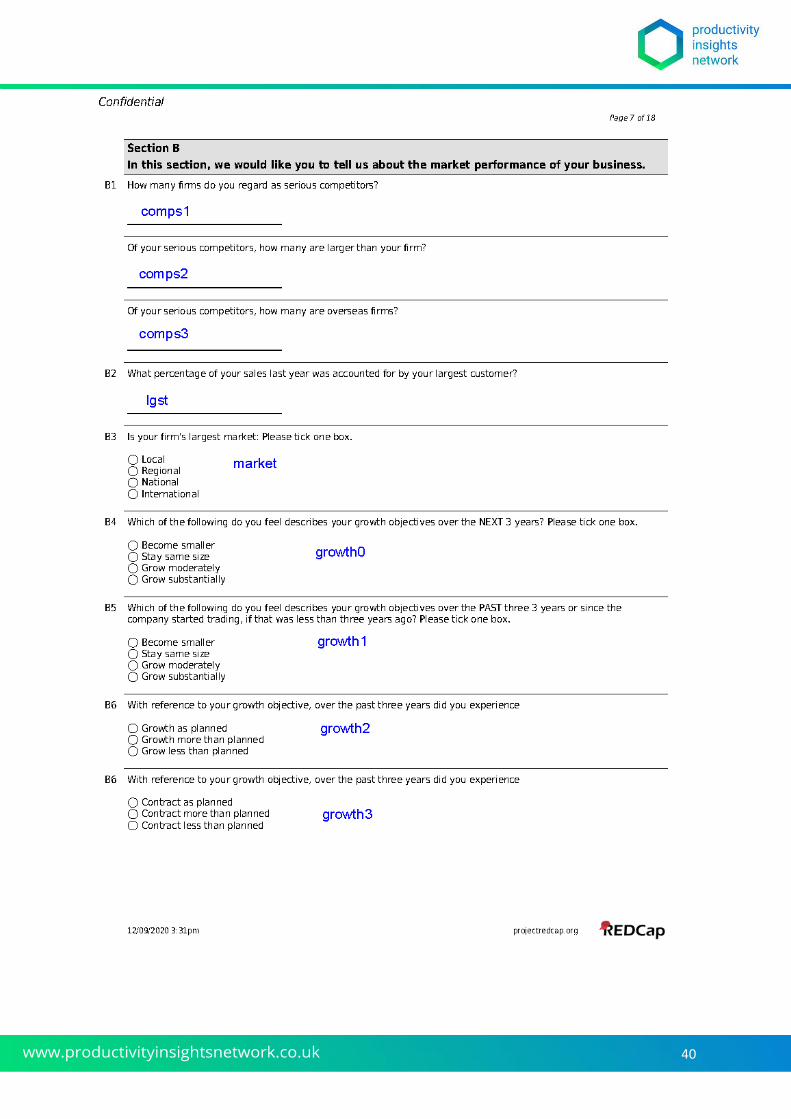
40
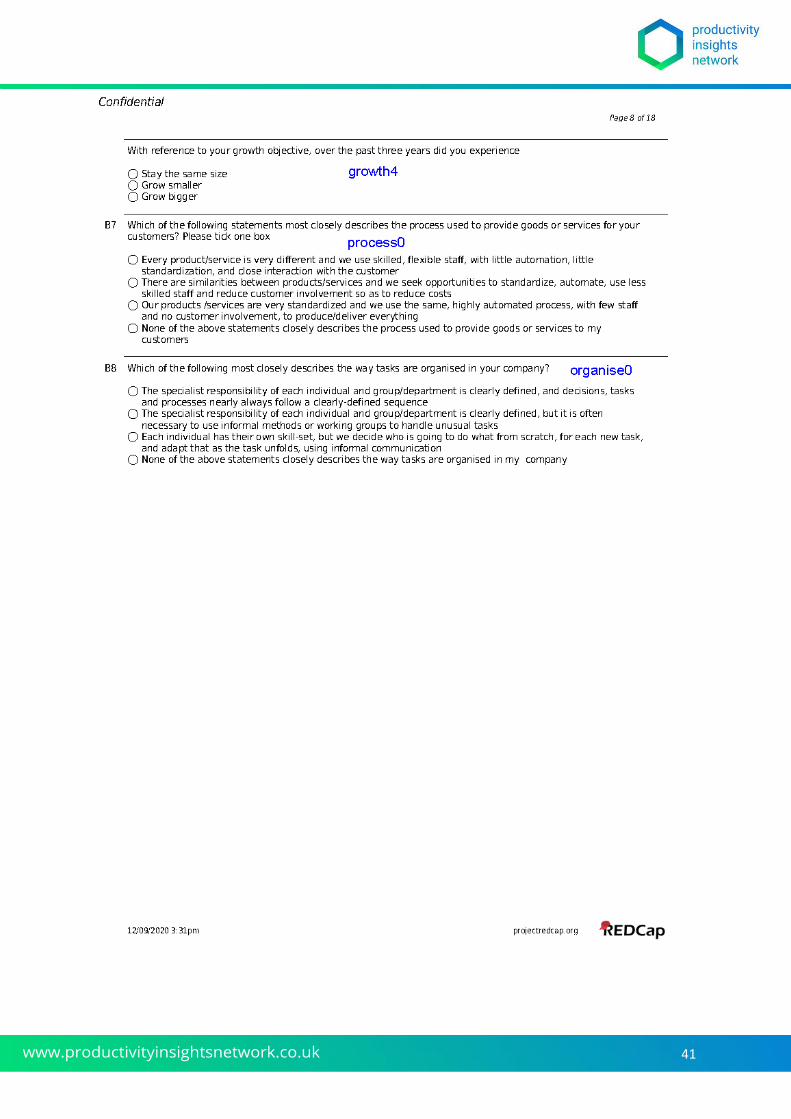
41
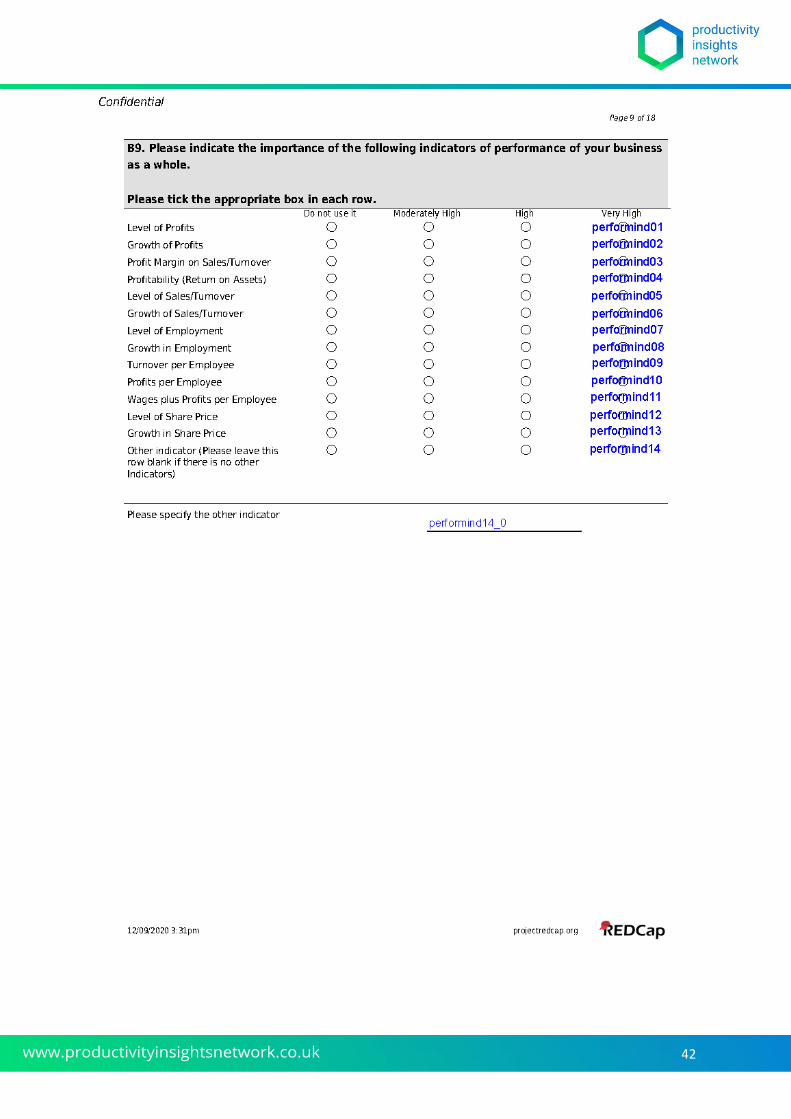
42

43
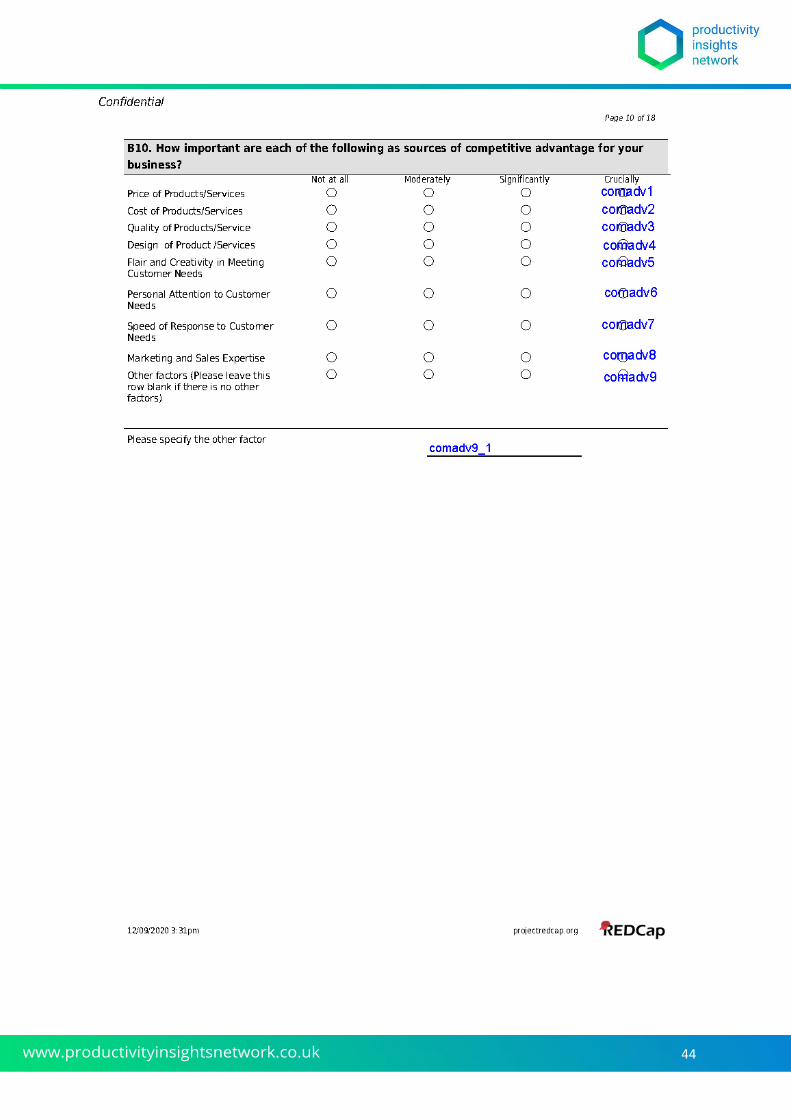
44
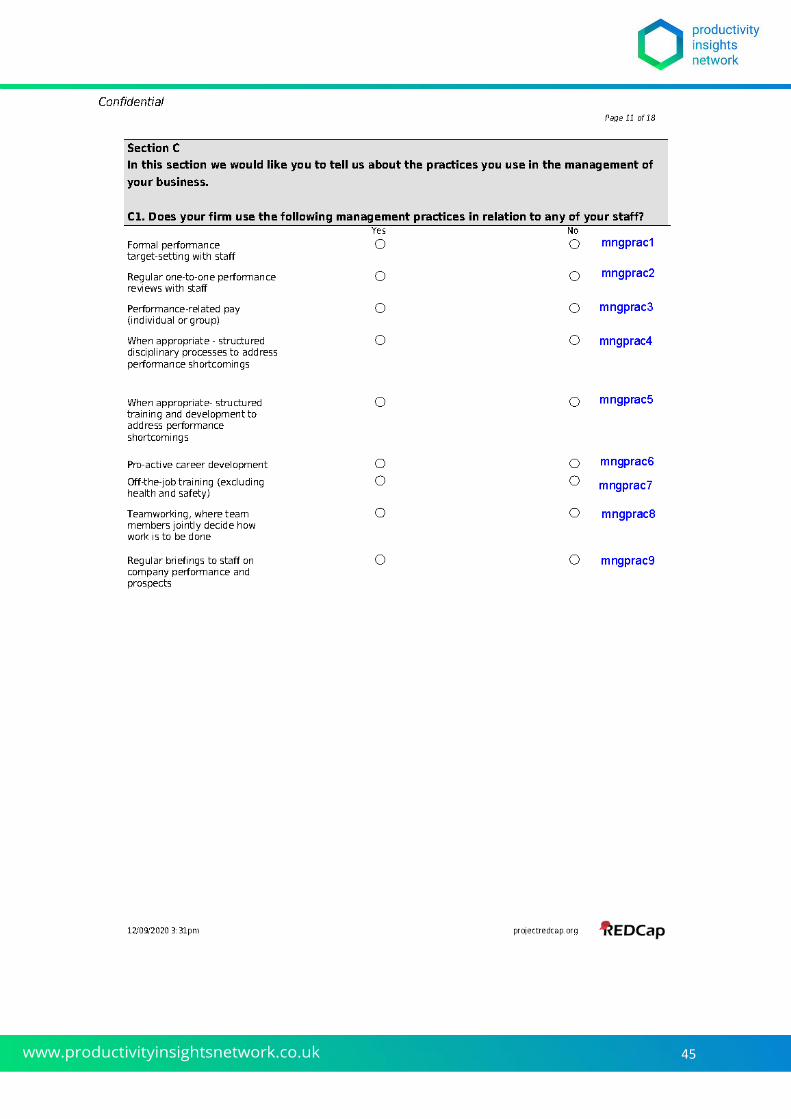
45
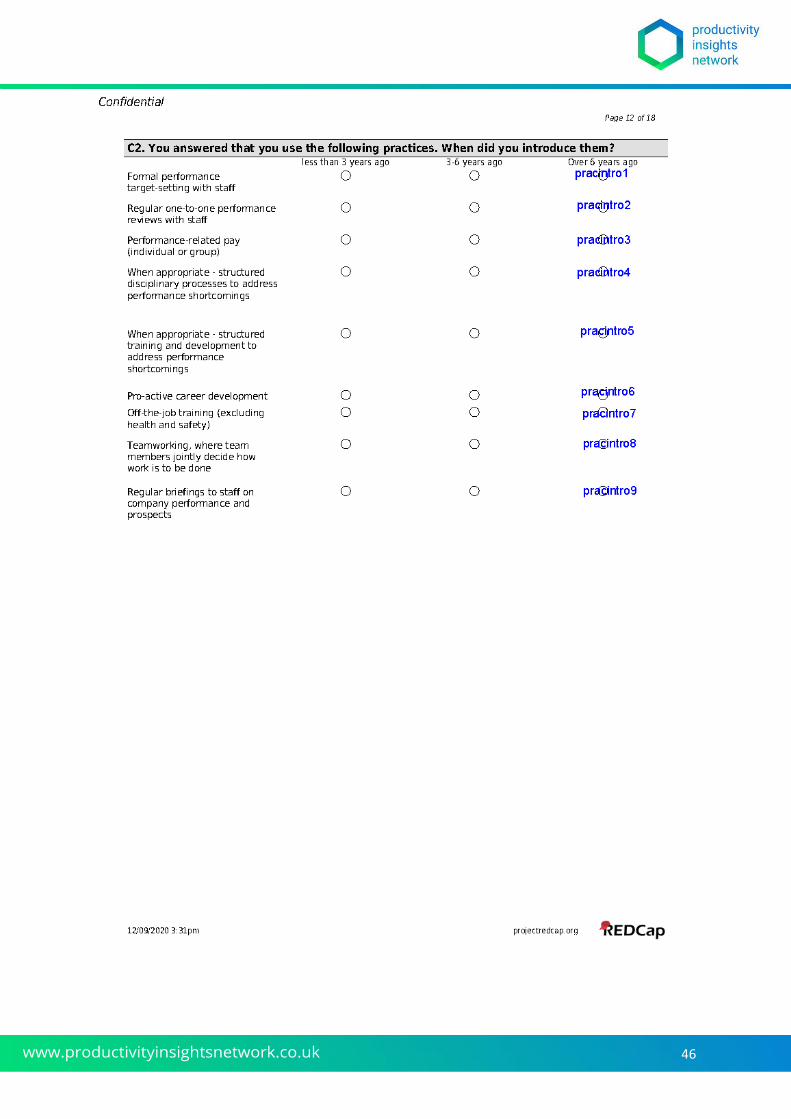
46
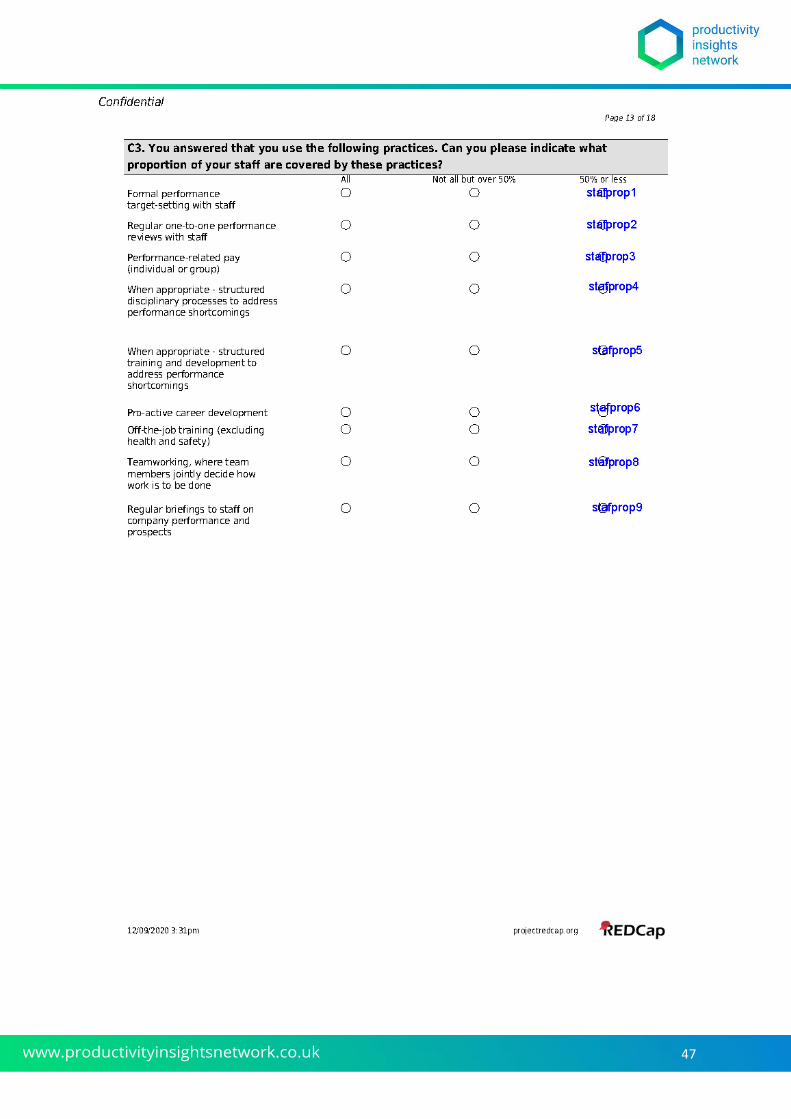
47
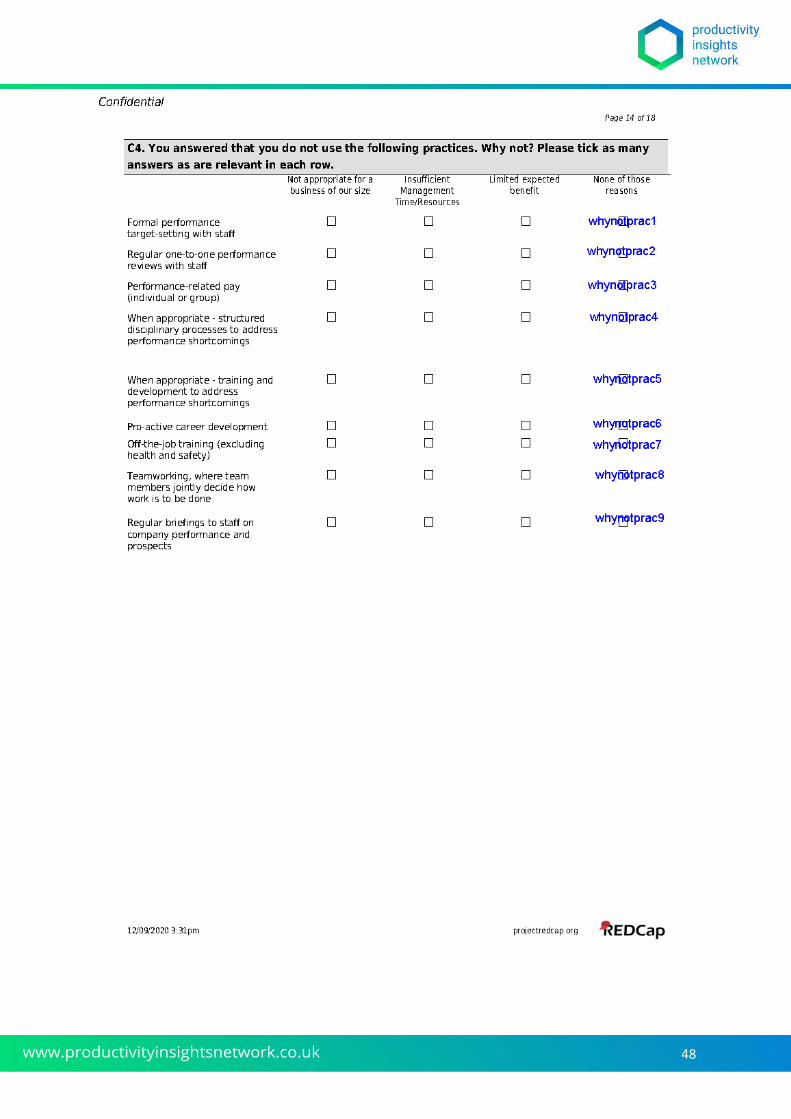
48
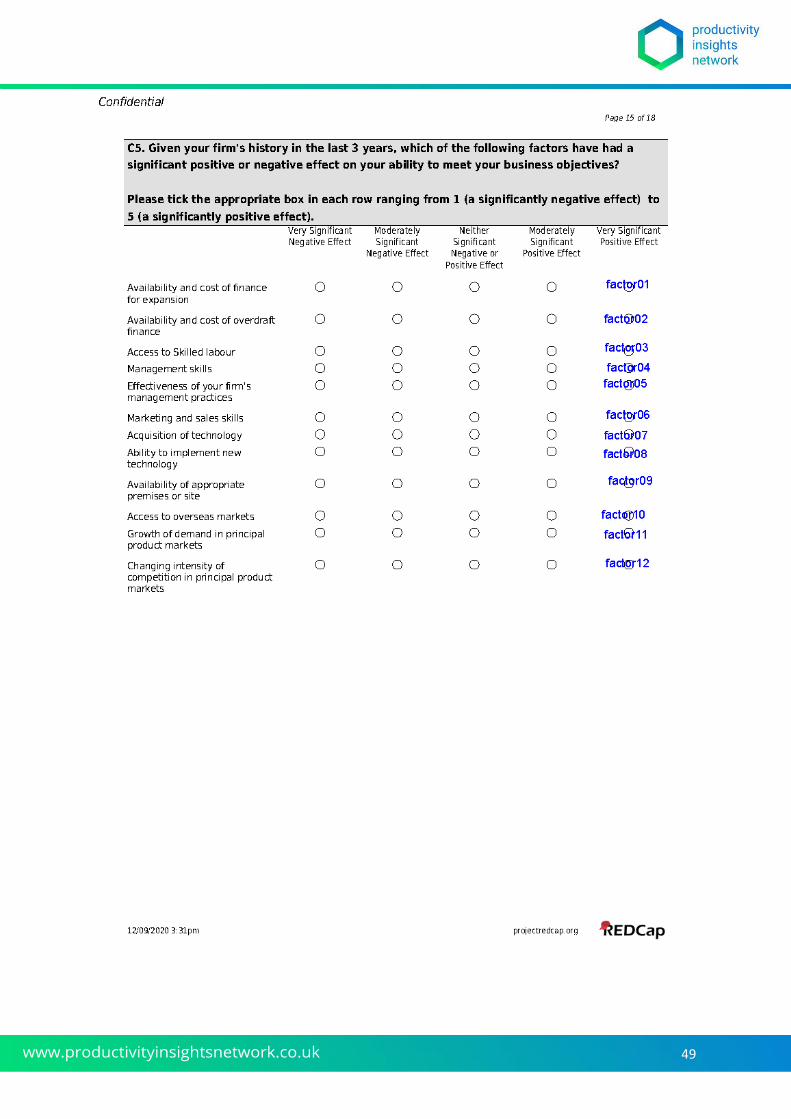
49
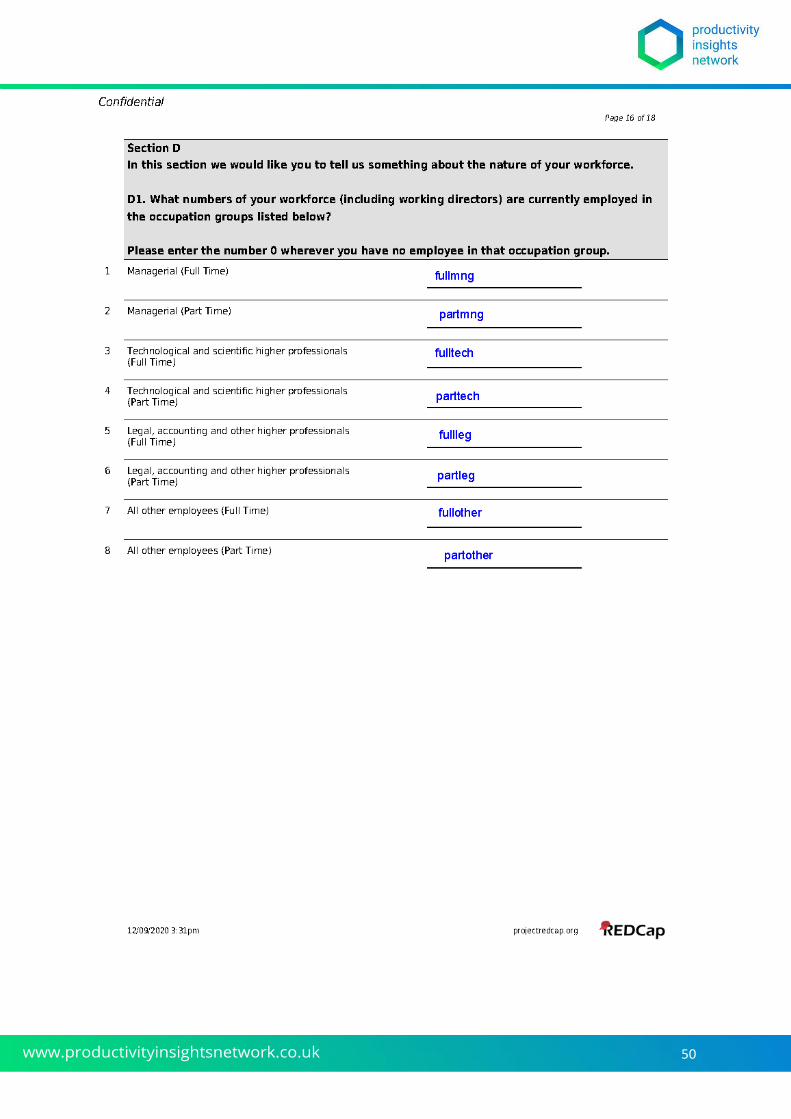
50
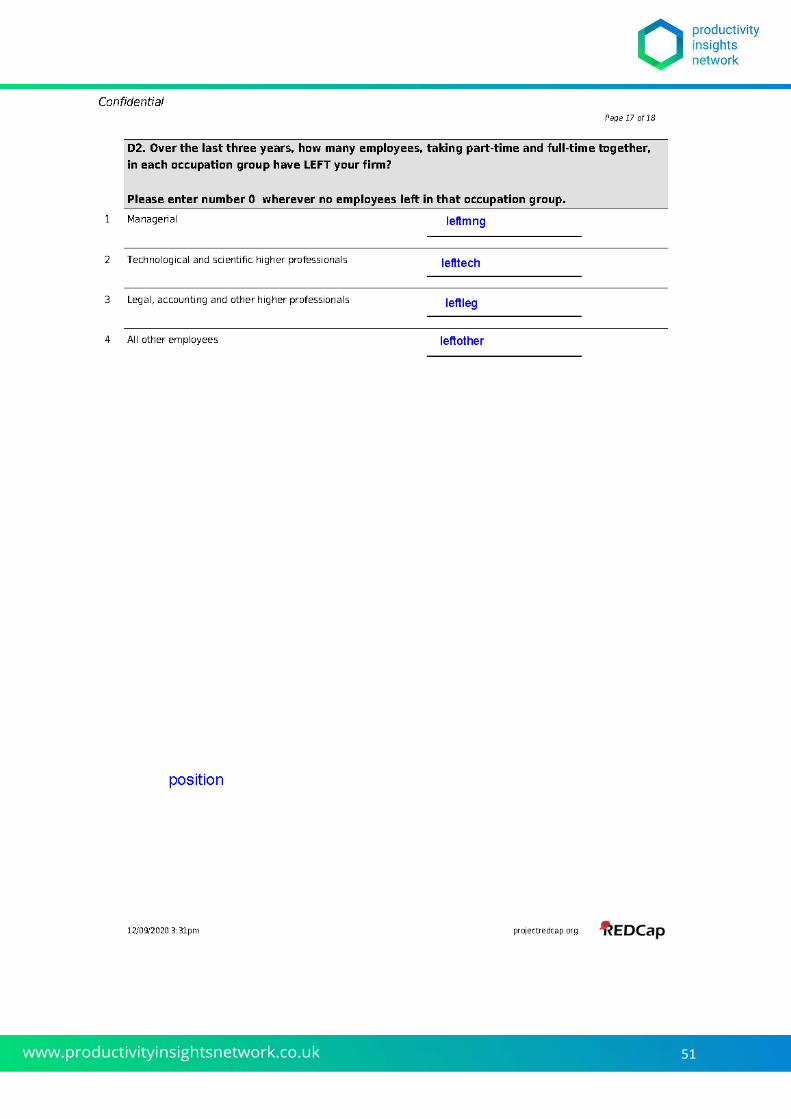
51
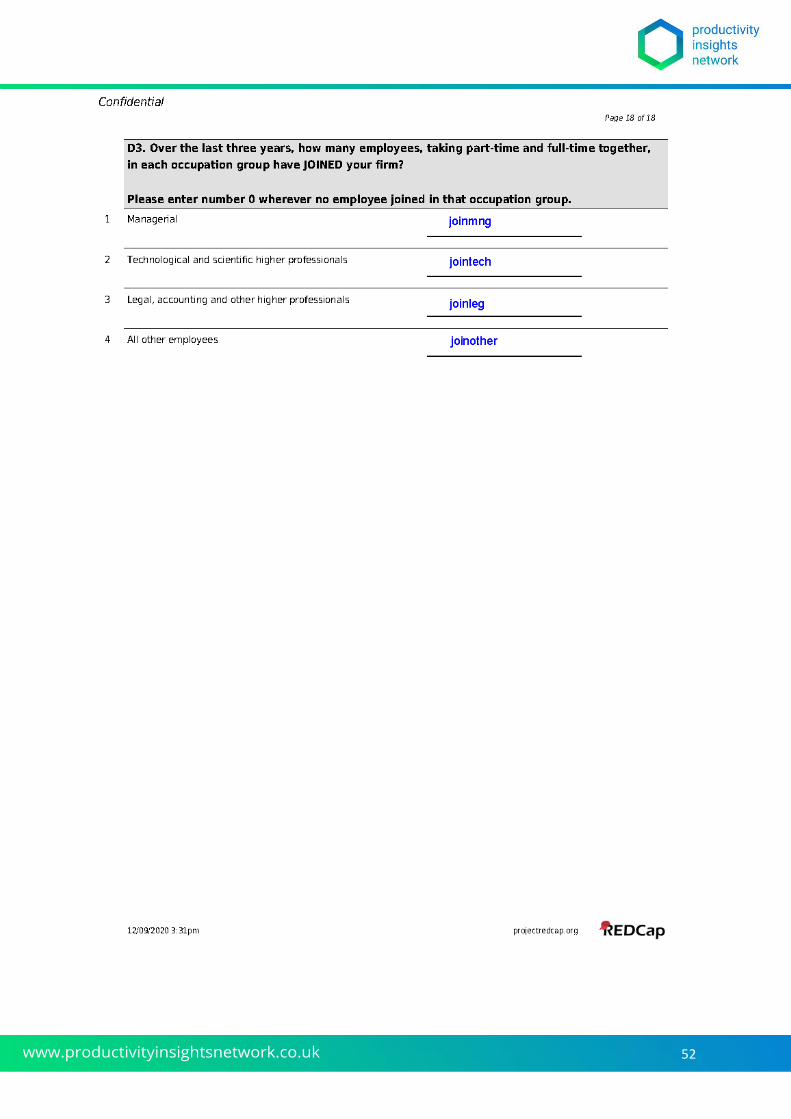
52
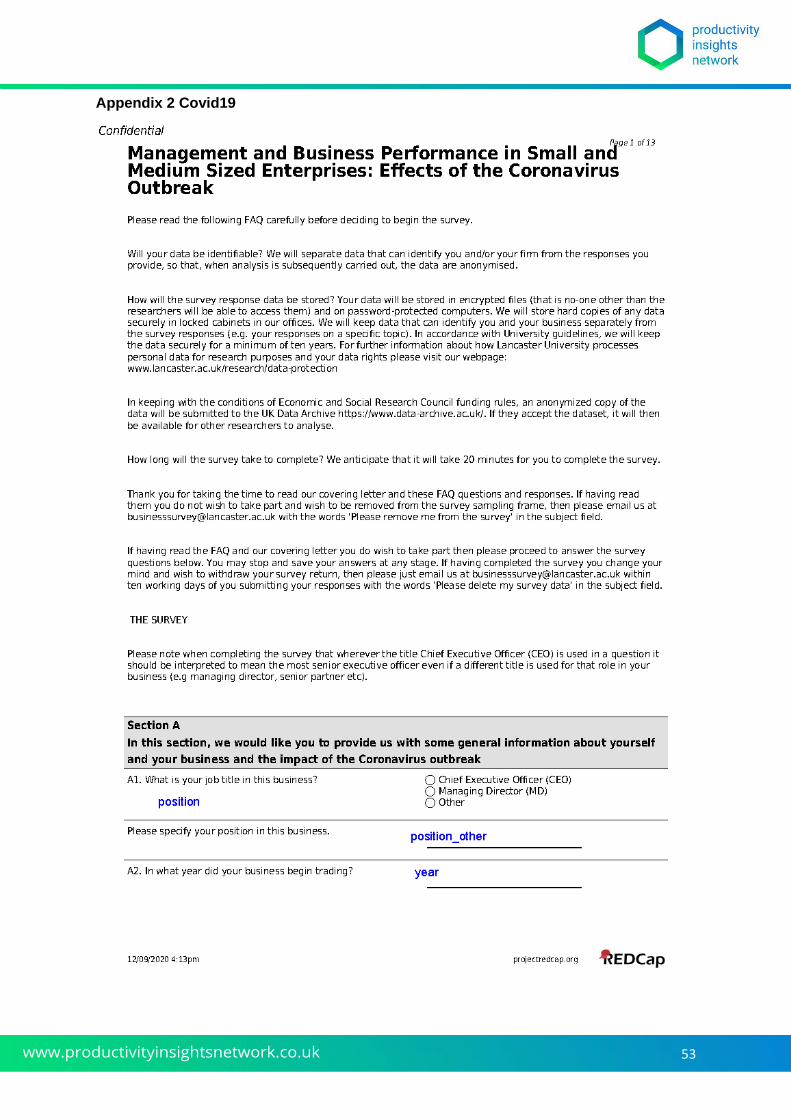
53
Appendix 2 Covid19
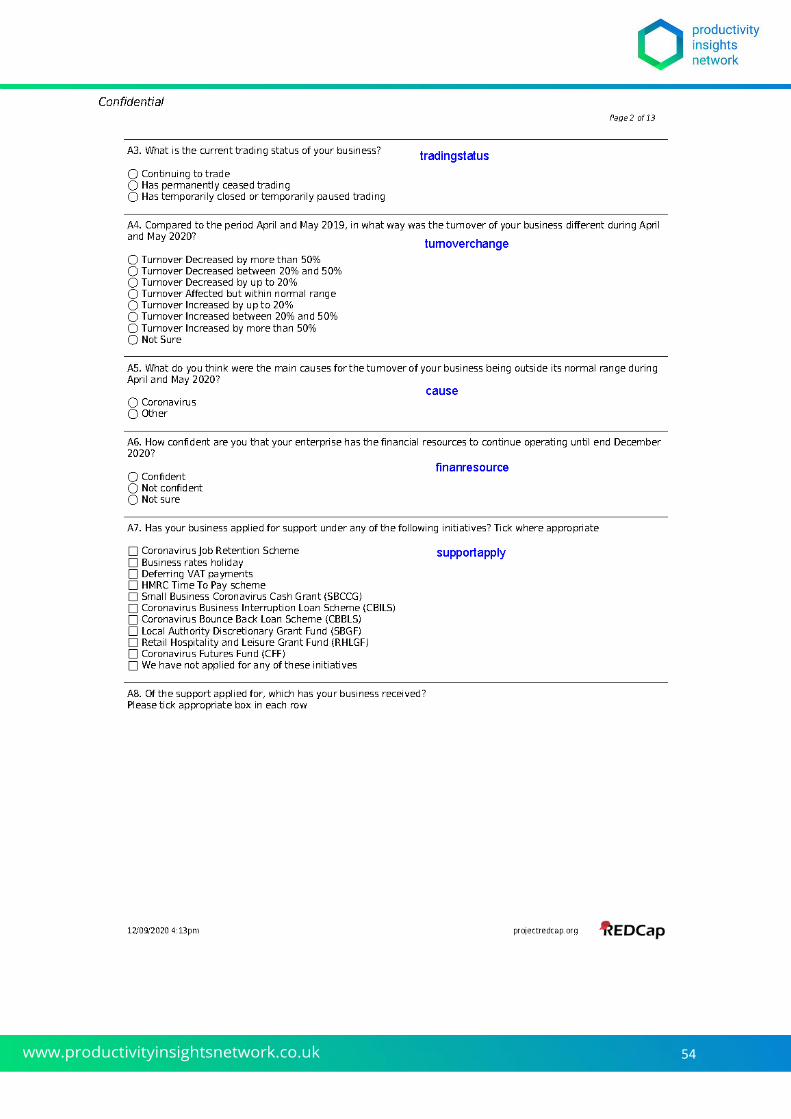
54
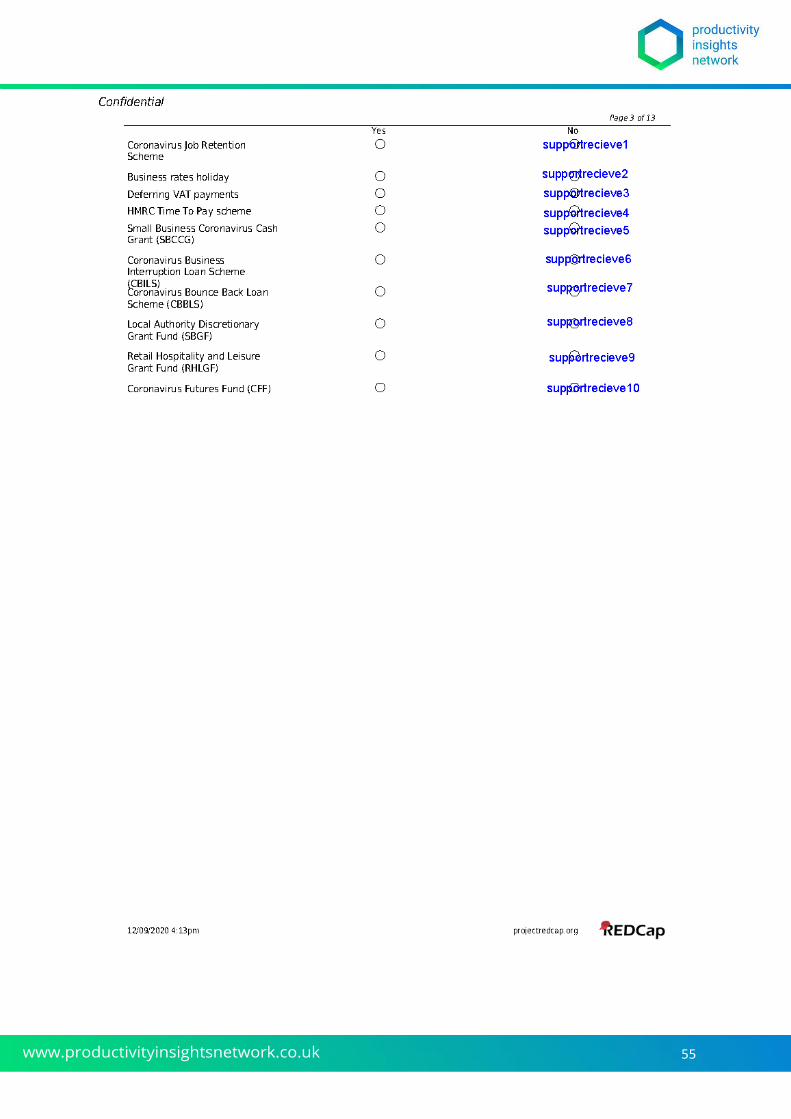
55
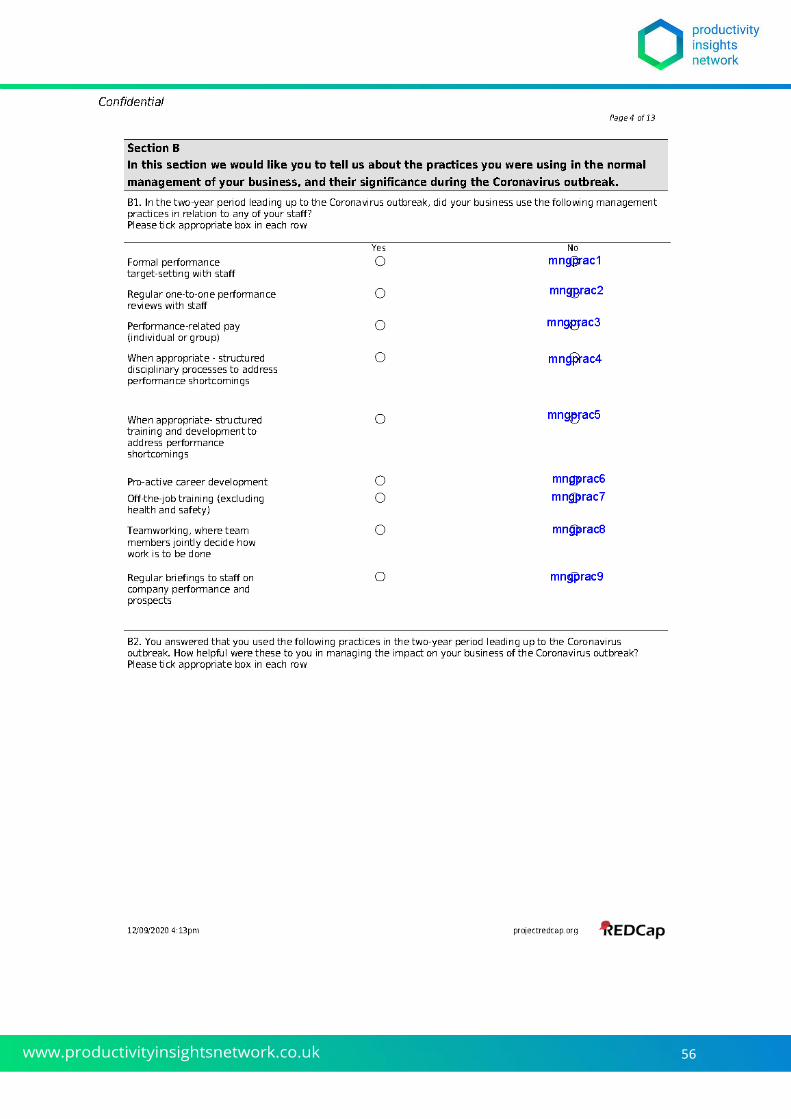
56
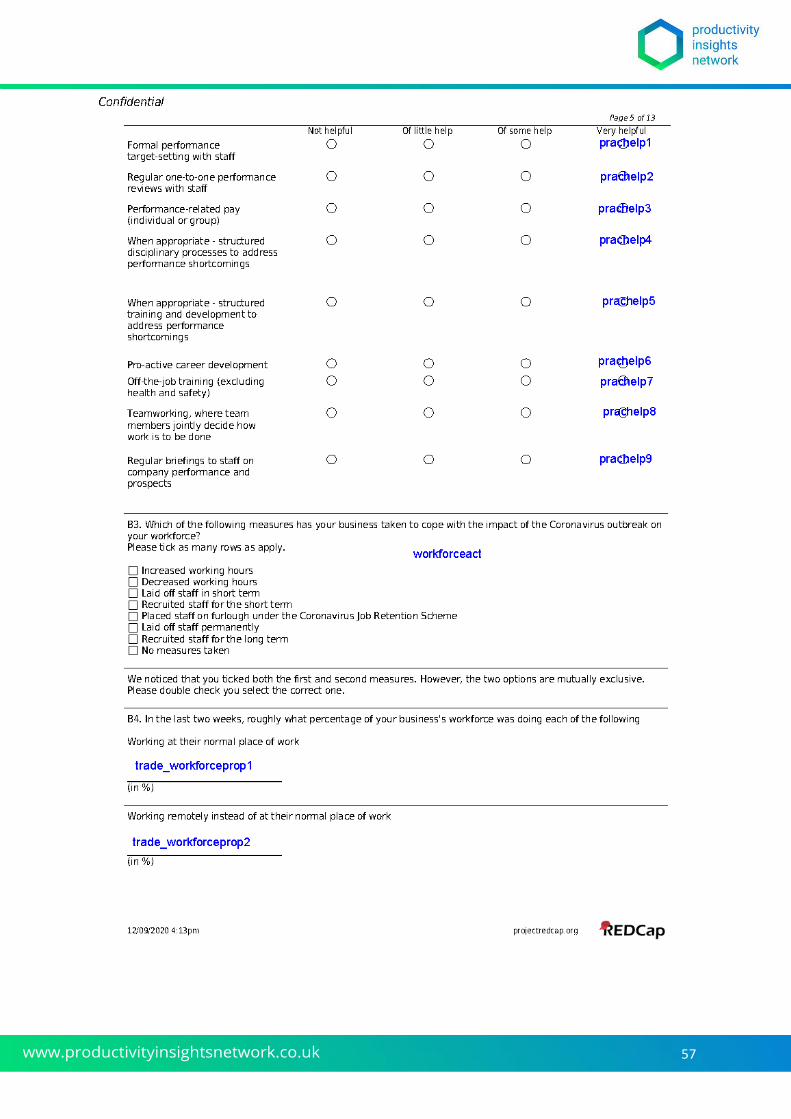
57
58

59
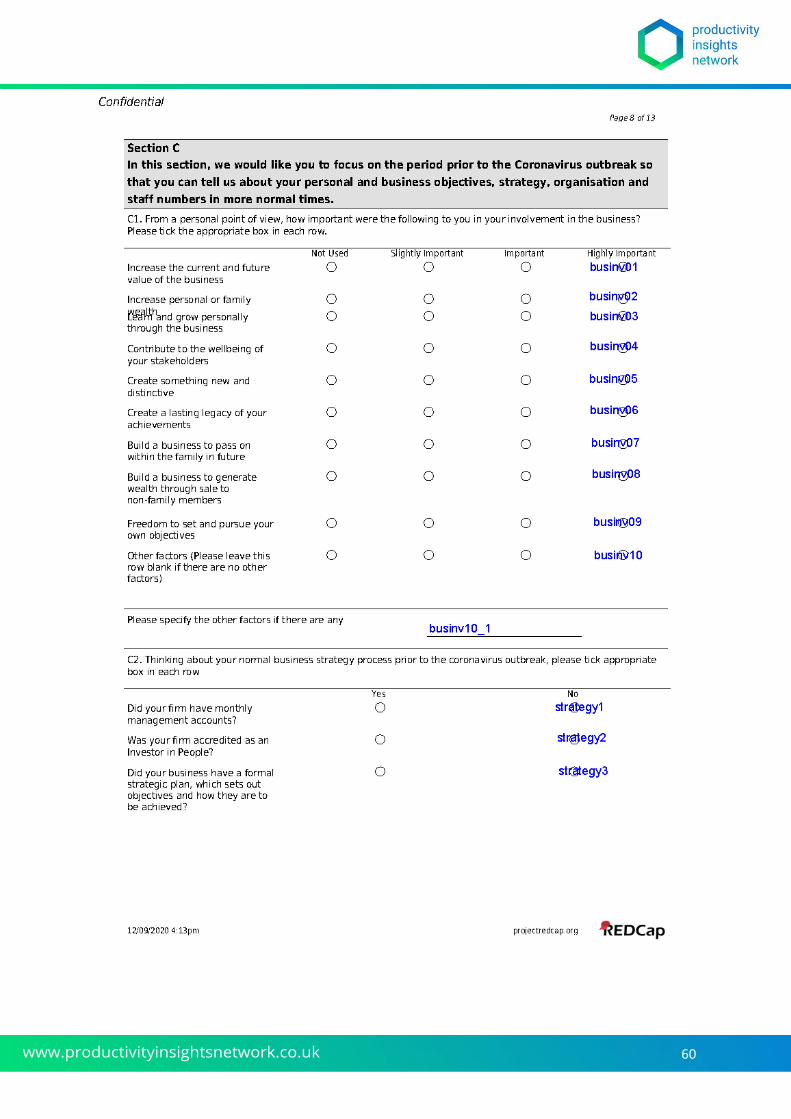
60
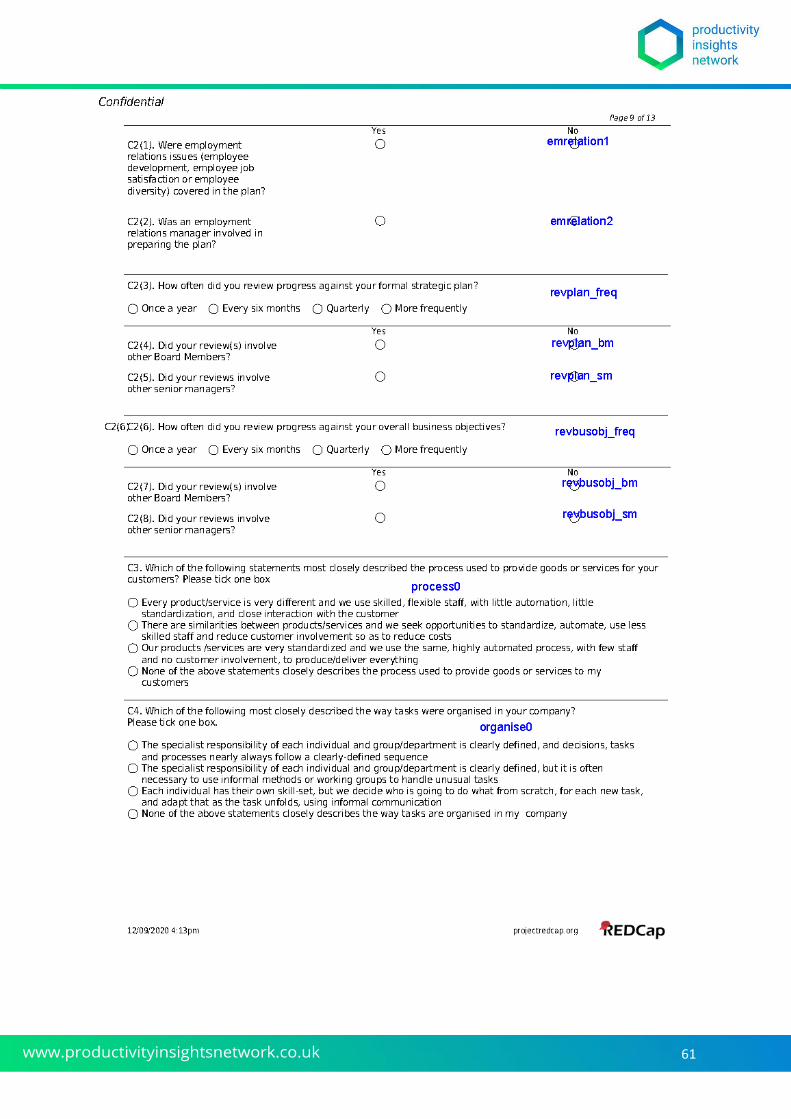
61
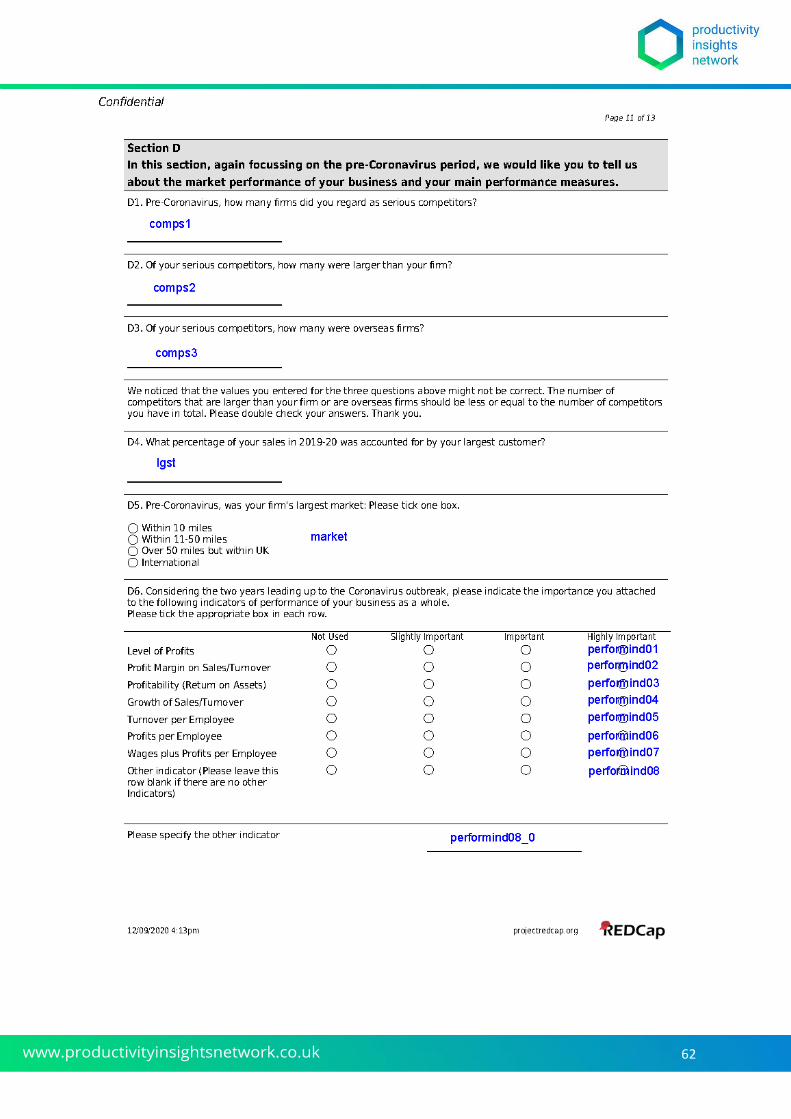
62
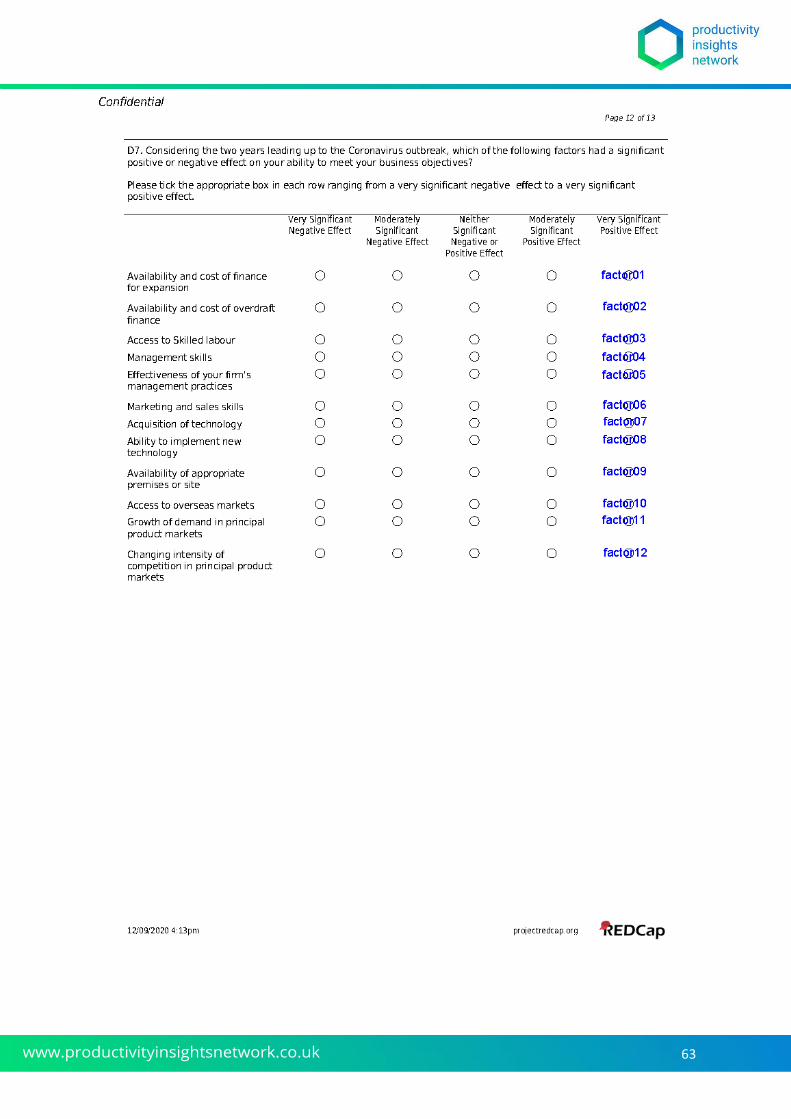
63
64
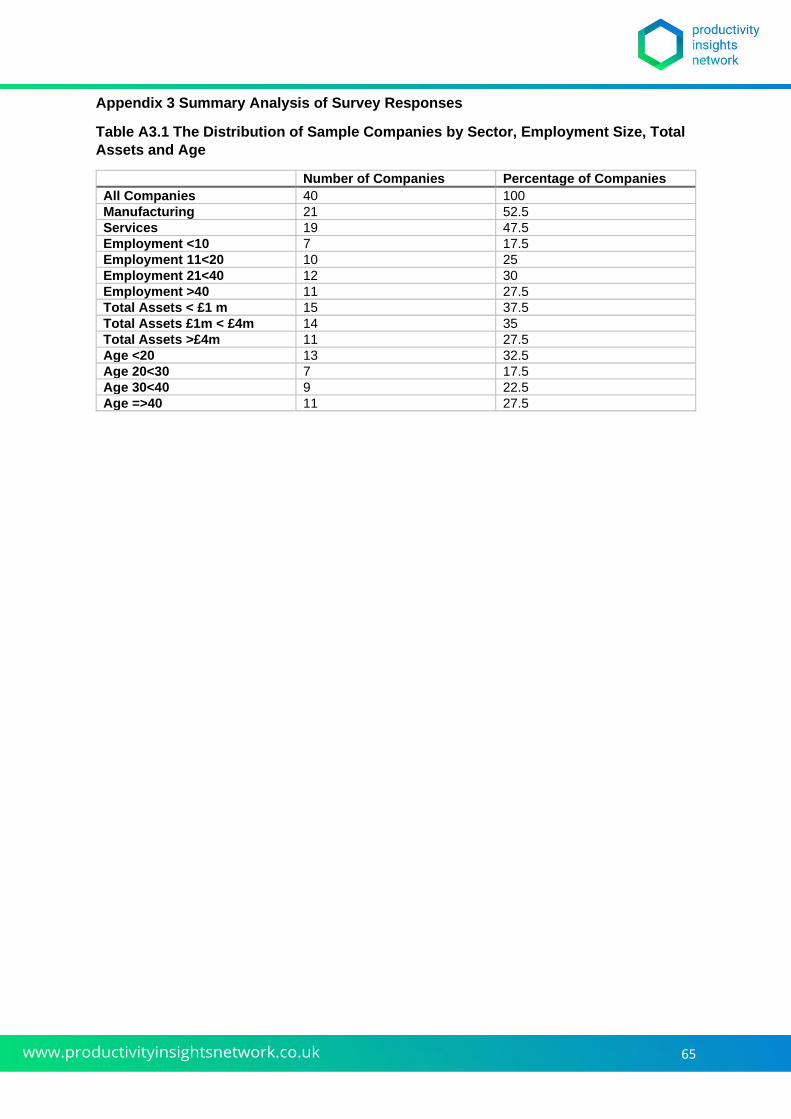
65
Appendix 3 Summary Analysis of Survey Responses
Table A3.1 The Distribution of Sample Companies by Sector, Employment Size, Total
Assets and Age
Number of Companies Percentage of Companies
All Companies 40 100
Manufacturing 21 52.5
Services 19 47.5
Employment <10 7 17.5
Employment 11<20 10 25
Employment 21<40 12 30
Employment >40 11 27.5
Total Assets < £1 m 15 37.5
Total Assets £1m < £4m 14 35
Total Assets >£4m 11 27.5
Age <20 13 32.5
Age 20<30 7 17.5
Age 30<40 9 22.5
Age =>40 11 27.5
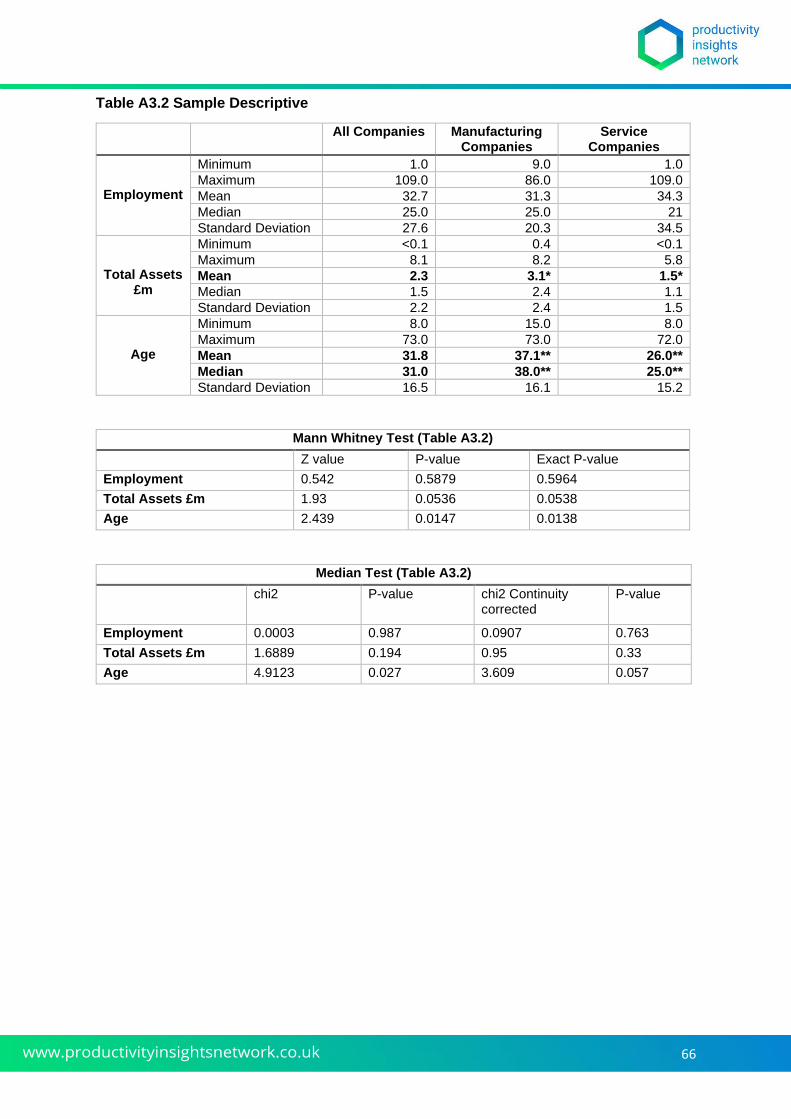
66
Table A3.2 Sample Descriptive
All Companies Manufacturing Companies
Service Companies
Employment
Minimum 1.0 9.0 1.0
Maximum 109.0 86.0 109.0
Mean 32.7 31.3 34.3
Median 25.0 25.0 21
Standard Deviation 27.6 20.3 34.5
Total Assets £m
Minimum <0.1 0.4 <0.1
Maximum 8.1 8.2 5.8
Mean 2.3 3.1* 1.5*
Median 1.5 2.4 1.1
Standard Deviation 2.2 2.4 1.5
Age
Minimum 8.0 15.0 8.0
Maximum 73.0 73.0 72.0
Mean 31.8 37.1** 26.0**
Median 31.0 38.0** 25.0**
Standard Deviation 16.5 16.1 15.2
Mann Whitney Test (Table A3.2)
Z value P-value Exact P-value
Employment 0.542 0.5879 0.5964
Total Assets £m 1.93 0.0536 0.0538
Age 2.439 0.0147 0.0138
Median Test (Table A3.2)
chi2 P-value chi2 Continuity corrected
P-value
Employment 0.0003 0.987 0.0907 0.763
Total Assets £m 1.6889 0.194 0.95 0.33
Age 4.9123 0.027 3.609 0.057
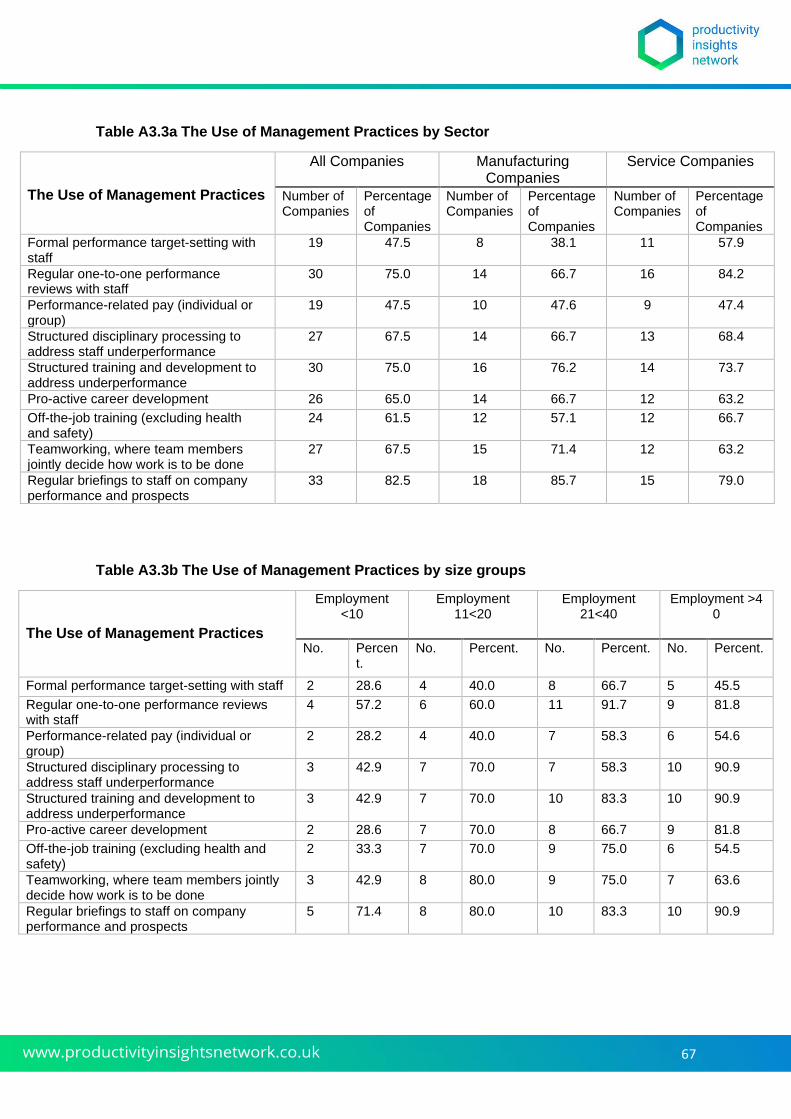
67
Table A3.3a The Use of Management Practices by Sector
The Use of Management Practices
All Companies Manufacturing Companies
Service Companies
Number of Companies
Percentage of Companies
Number of Companies
Percentage of Companies
Number of Companies
Percentage of Companies
Formal performance target-setting with staff
19 47.5 8 38.1 11 57.9
Regular one-to-one performance reviews with staff
30 75.0 14 66.7 16 84.2
Performance-related pay (individual or group)
19 47.5 10 47.6 9 47.4
Structured disciplinary processing to address staff underperformance
27 67.5 14 66.7 13 68.4
Structured training and development to address underperformance
30 75.0 16 76.2 14 73.7
Pro-active career development 26 65.0 14 66.7 12 63.2
Off-the-job training (excluding health and safety)
24 61.5 12 57.1 12 66.7
Teamworking, where team members jointly decide how work is to be done
27 67.5 15 71.4 12 63.2
Regular briefings to staff on company performance and prospects
33 82.5 18 85.7 15 79.0
Table A3.3b The Use of Management Practices by size groups
The Use of Management Practices
Employment <10
Employment 11<20
Employment 21<40
Employment >40
No. Percent.
No. Percent. No. Percent. No. Percent.
Formal performance target-setting with staff 2 28.6 4 40.0 8 66.7 5 45.5
Regular one-to-one performance reviews with staff
4 57.2 6 60.0 11 91.7 9 81.8
Performance-related pay (individual or group)
2 28.2 4 40.0 7 58.3 6 54.6
Structured disciplinary processing to address staff underperformance
3 42.9 7 70.0 7 58.3 10 90.9
Structured training and development to address underperformance
3 42.9 7 70.0 10 83.3 10 90.9
Pro-active career development 2 28.6 7 70.0 8 66.7 9 81.8
Off-the-job training (excluding health and safety)
2 33.3 7 70.0 9 75.0 6 54.5
Teamworking, where team members jointly decide how work is to be done
3 42.9 8 80.0 9 75.0 7 63.6
Regular briefings to staff on company performance and prospects
5 71.4 8 80.0 10 83.3 10 90.9
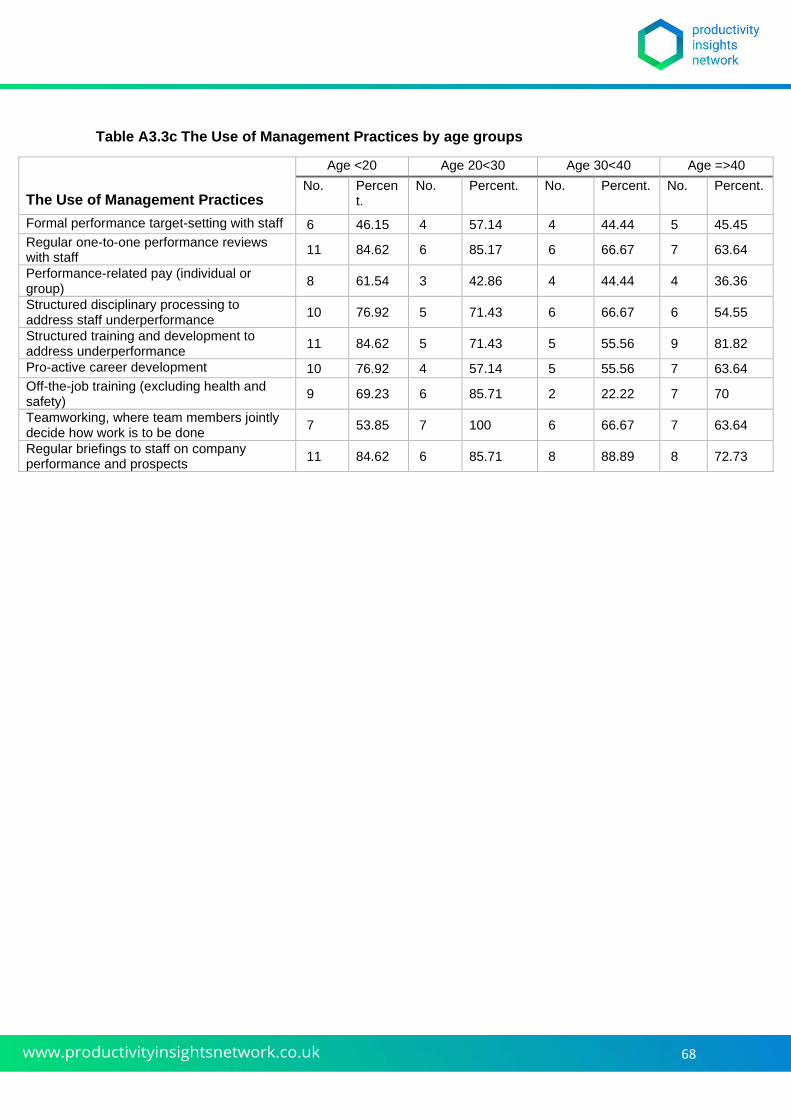
68
Table A3.3c The Use of Management Practices by age groups
The Use of Management Practices
Age <20 Age 20<30 Age 30<40 Age =>40
No. Percent.
No. Percent. No. Percent. No. Percent.
Formal performance target-setting with staff 6 46.15 4 57.14 4 44.44 5 45.45
Regular one-to-one performance reviews with staff
11 84.62 6 85.17 6 66.67 7 63.64
Performance-related pay (individual or group)
8 61.54 3 42.86 4 44.44 4 36.36
Structured disciplinary processing to address staff underperformance
10 76.92 5 71.43 6 66.67 6 54.55
Structured training and development to address underperformance
11 84.62 5 71.43 5 55.56 9 81.82
Pro-active career development 10 76.92 4 57.14 5 55.56 7 63.64
Off-the-job training (excluding health and safety)
9 69.23 6 85.71 2 22.22 7 70
Teamworking, where team members jointly decide how work is to be done
7 53.85 7 100 6 66.67 7 63.64
Regular briefings to staff on company performance and prospects
11 84.62 6 85.71 8 88.89 8 72.73
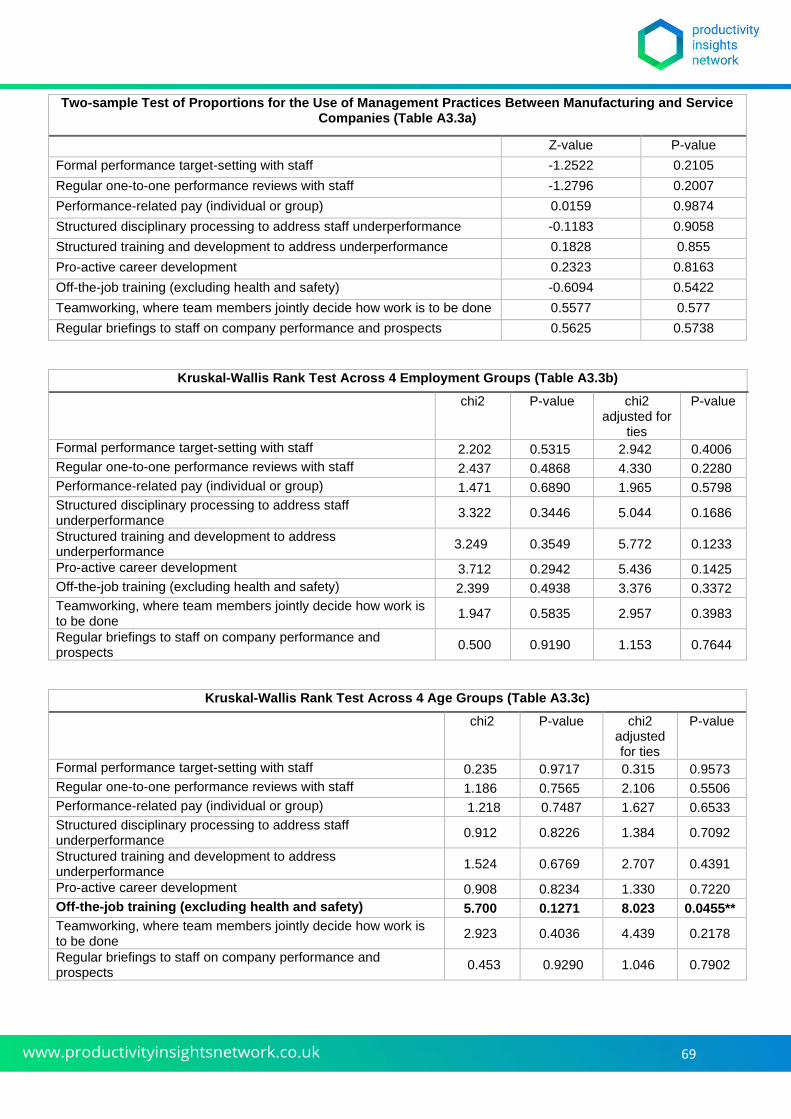
69
Two-sample Test of Proportions for the Use of Management Practices Between Manufacturing and Service Companies (Table A3.3a)
Z-value P-value
Formal performance target-setting with staff -1.2522 0.2105
Regular one-to-one performance reviews with staff -1.2796 0.2007
Performance-related pay (individual or group) 0.0159 0.9874
Structured disciplinary processing to address staff underperformance -0.1183 0.9058
Structured training and development to address underperformance 0.1828 0.855
Pro-active career development 0.2323 0.8163
Off-the-job training (excluding health and safety) -0.6094 0.5422
Teamworking, where team members jointly decide how work is to be done 0.5577 0.577
Regular briefings to staff on company performance and prospects 0.5625 0.5738
Kruskal-Wallis Rank Test Across 4 Employment Groups (Table A3.3b)
chi2 P-value chi2 adjusted for
ties
P-value
Formal performance target-setting with staff 2.202 0.5315 2.942 0.4006
Regular one-to-one performance reviews with staff 2.437 0.4868 4.330 0.2280
Performance-related pay (individual or group) 1.471 0.6890 1.965 0.5798
Structured disciplinary processing to address staff underperformance
3.322 0.3446 5.044 0.1686
Structured training and development to address underperformance
3.249 0.3549 5.772 0.1233
Pro-active career development 3.712 0.2942 5.436 0.1425
Off-the-job training (excluding health and safety) 2.399 0.4938 3.376 0.3372
Teamworking, where team members jointly decide how work is to be done
1.947 0.5835 2.957 0.3983
Regular briefings to staff on company performance and prospects
0.500 0.9190 1.153 0.7644
Kruskal-Wallis Rank Test Across 4 Age Groups (Table A3.3c)
chi2 P-value chi2 adjusted for ties
P-value
Formal performance target-setting with staff 0.235 0.9717 0.315 0.9573
Regular one-to-one performance reviews with staff 1.186 0.7565 2.106 0.5506
Performance-related pay (individual or group) 1.218 0.7487 1.627 0.6533
Structured disciplinary processing to address staff underperformance
0.912 0.8226 1.384 0.7092
Structured training and development to address underperformance
1.524 0.6769 2.707 0.4391
Pro-active career development 0.908 0.8234 1.330 0.7220
Off-the-job training (excluding health and safety) 5.700 0.1271 8.023 0.0455**
Teamworking, where team members jointly decide how work is to be done
2.923 0.4036 4.439 0.2178
Regular briefings to staff on company performance and prospects
0.453 0.9290 1.046 0.7902
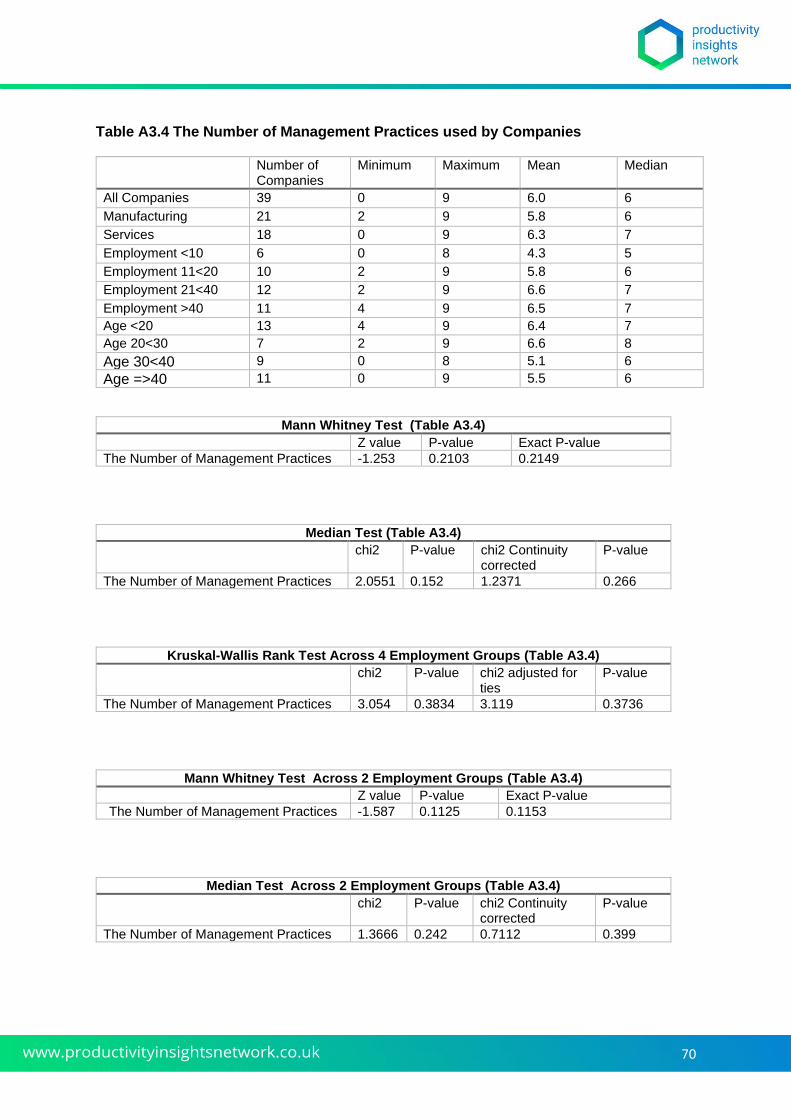
70
Table A3.4 The Number of Management Practices used by Companies
Number of Companies
Minimum Maximum Mean Median
All Companies 39 0 9 6.0 6
Manufacturing 21 2 9 5.8 6
Services 18 0 9 6.3 7
Employment <10 6 0 8 4.3 5
Employment 11<20 10 2 9 5.8 6
Employment 21<40 12 2 9 6.6 7
Employment >40 11 4 9 6.5 7
Age <20 13 4 9 6.4 7
Age 20<30 7 2 9 6.6 8
Age 30<40 9 0 8 5.1 6
Age =>40 11 0 9 5.5 6
Mann Whitney Test (Table A3.4)
Z value P-value Exact P-value
The Number of Management Practices -1.253 0.2103 0.2149
Median Test (Table A3.4) chi2 P-value chi2 Continuity
corrected P-value
The Number of Management Practices 2.0551 0.152 1.2371 0.266
Kruskal-Wallis Rank Test Across 4 Employment Groups (Table A3.4)
chi2 P-value chi2 adjusted for ties
P-value
The Number of Management Practices 3.054 0.3834 3.119 0.3736
Mann Whitney Test Across 2 Employment Groups (Table A3.4)
Z value P-value Exact P-value
The Number of Management Practices -1.587 0.1125 0.1153
Median Test Across 2 Employment Groups (Table A3.4) chi2 P-value chi2 Continuity
corrected P-value
The Number of Management Practices 1.3666 0.242 0.7112 0.399

71
Kruskal-Wallis Rank Test Across 2 Employment Groups (Table A3.4)
chi2 P-value chi2 adjusted for ties
P-value
The Number of Management Practices 2.466 0.1163 2.519 0.1125
Kruskal-Wallis Rank Test Across 4 Age Groups (Table A3.4)
chi2 P-value chi2 adjusted for ties
P-value
The Number of Management Practices 1.877 0.5983 1.915 0.5903
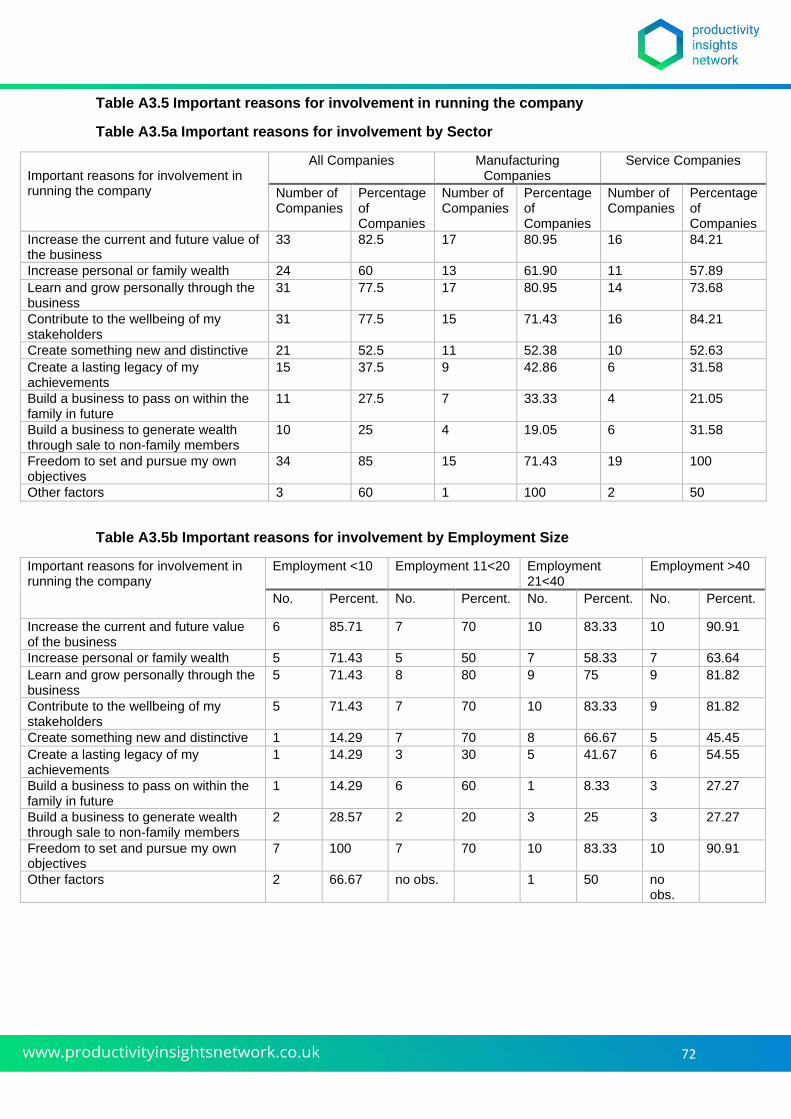
72
Table A3.5 Important reasons for involvement in running the company
Table A3.5a Important reasons for involvement by Sector
Important reasons for involvement in running the company
All Companies Manufacturing Companies
Service Companies
Number of Companies
Percentage of Companies
Number of Companies
Percentage of Companies
Number of Companies
Percentage of Companies
Increase the current and future value of the business
33 82.5 17 80.95 16 84.21
Increase personal or family wealth 24 60 13 61.90 11 57.89
Learn and grow personally through the business
31 77.5 17 80.95 14 73.68
Contribute to the wellbeing of my stakeholders
31 77.5 15 71.43 16 84.21
Create something new and distinctive 21 52.5 11 52.38 10 52.63
Create a lasting legacy of my achievements
15 37.5 9 42.86 6 31.58
Build a business to pass on within the family in future
11 27.5 7 33.33 4 21.05
Build a business to generate wealth through sale to non-family members
10 25 4 19.05 6 31.58
Freedom to set and pursue my own objectives
34 85 15 71.43 19 100
Other factors 3 60 1 100 2 50
Table A3.5b Important reasons for involvement by Employment Size
Important reasons for involvement in running the company
Employment <10 Employment 11<20 Employment 21<40
Employment >40
No. Percent. No. Percent. No. Percent. No. Percent.
Increase the current and future value of the business
6 85.71 7 70 10 83.33 10 90.91
Increase personal or family wealth 5 71.43 5 50 7 58.33 7 63.64
Learn and grow personally through the business
5 71.43 8 80 9 75 9 81.82
Contribute to the wellbeing of my stakeholders
5 71.43 7 70 10 83.33 9 81.82
Create something new and distinctive 1 14.29 7 70 8 66.67 5 45.45
Create a lasting legacy of my achievements
1 14.29 3 30 5 41.67 6 54.55
Build a business to pass on within the family in future
1 14.29 6 60 1 8.33 3 27.27
Build a business to generate wealth through sale to non-family members
2 28.57 2 20 3 25 3 27.27
Freedom to set and pursue my own objectives
7 100 7 70 10 83.33 10 90.91
Other factors 2 66.67 no obs.
1 50 no obs.
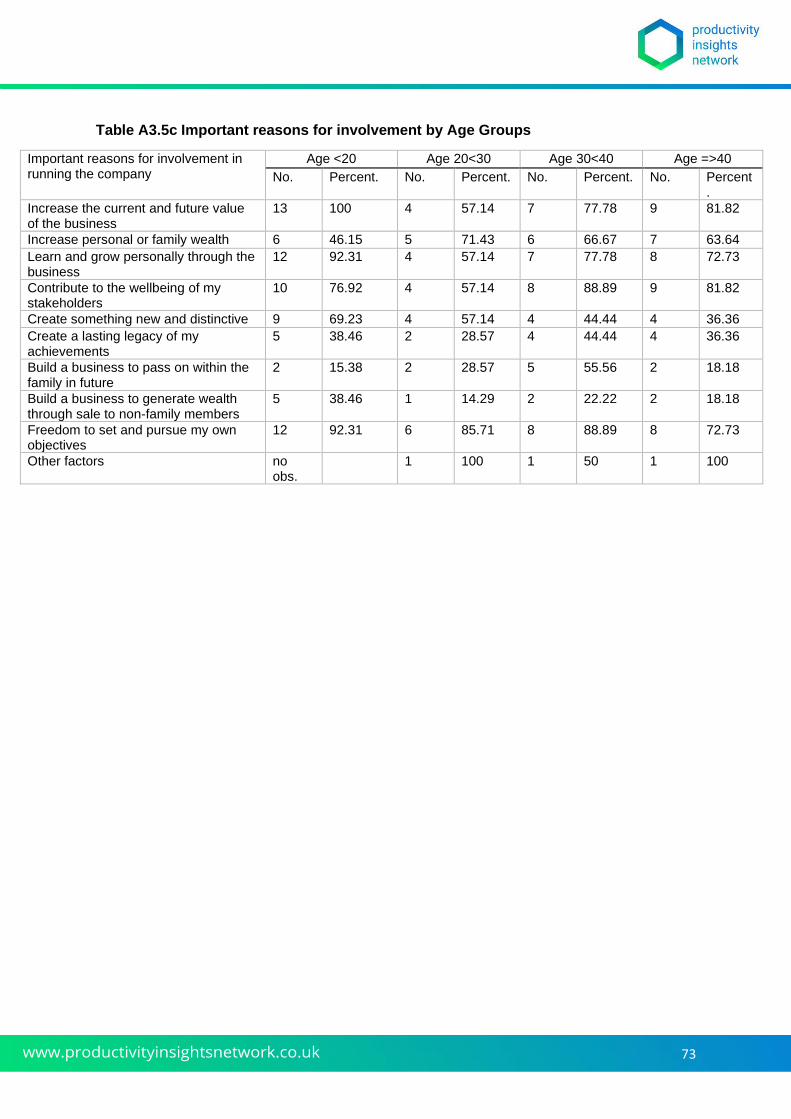
73
Table A3.5c Important reasons for involvement by Age Groups
Important reasons for involvement in running the company
Age <20 Age 20<30 Age 30<40 Age =>40
No. Percent. No. Percent. No. Percent. No. Percent.
Increase the current and future value of the business
13 100 4 57.14 7 77.78 9 81.82
Increase personal or family wealth 6 46.15 5 71.43 6 66.67 7 63.64
Learn and grow personally through the business
12 92.31 4 57.14 7 77.78 8 72.73
Contribute to the wellbeing of my stakeholders
10 76.92 4 57.14 8 88.89 9 81.82
Create something new and distinctive 9 69.23 4 57.14 4 44.44 4 36.36
Create a lasting legacy of my achievements
5 38.46 2 28.57 4 44.44 4 36.36
Build a business to pass on within the family in future
2 15.38 2 28.57 5 55.56 2 18.18
Build a business to generate wealth through sale to non-family members
5 38.46 1 14.29 2 22.22 2 18.18
Freedom to set and pursue my own objectives
12 92.31 6 85.71 8 88.89 8 72.73
Other factors no obs.
1 100 1 50 1 100
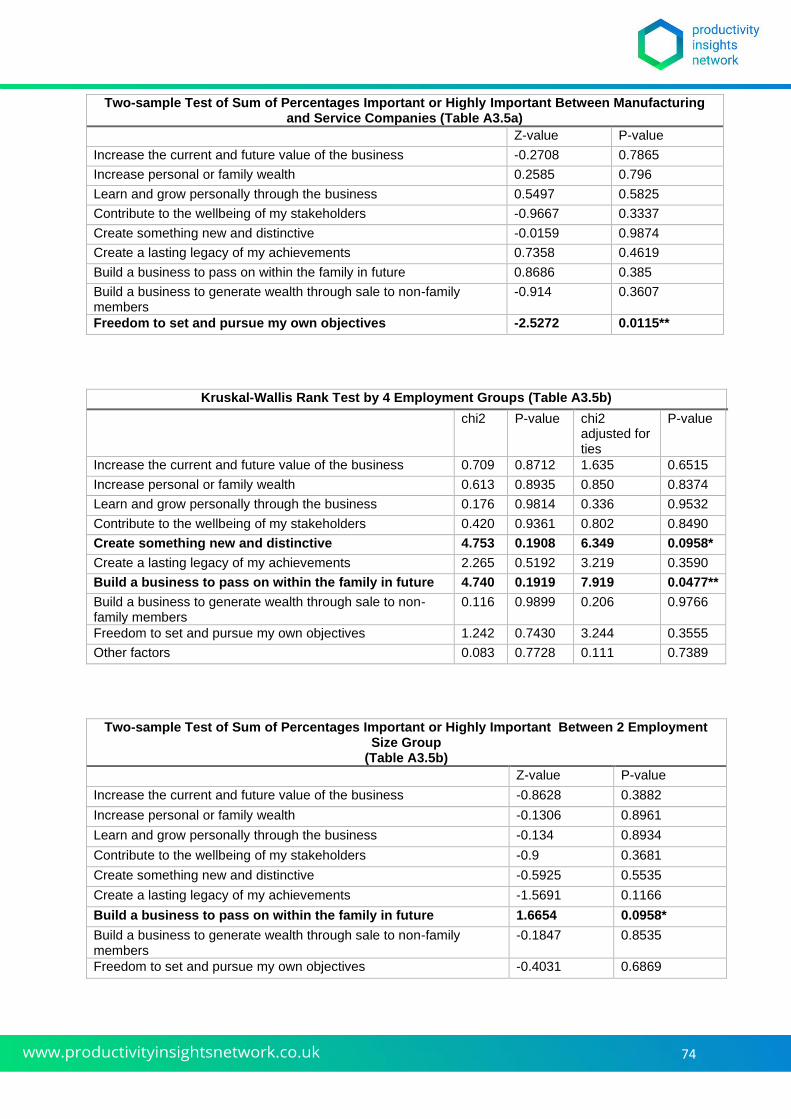
74
Two-sample Test of Sum of Percentages Important or Highly Important Between Manufacturing and Service Companies (Table A3.5a)
Z-value P-value
Increase the current and future value of the business -0.2708 0.7865
Increase personal or family wealth 0.2585 0.796
Learn and grow personally through the business 0.5497 0.5825
Contribute to the wellbeing of my stakeholders -0.9667 0.3337
Create something new and distinctive -0.0159 0.9874
Create a lasting legacy of my achievements 0.7358 0.4619
Build a business to pass on within the family in future 0.8686 0.385
Build a business to generate wealth through sale to non-family members
-0.914 0.3607
Freedom to set and pursue my own objectives -2.5272 0.0115**
Kruskal-Wallis Rank Test by 4 Employment Groups (Table A3.5b)
chi2 P-value chi2 adjusted for ties
P-value
Increase the current and future value of the business 0.709 0.8712 1.635 0.6515
Increase personal or family wealth 0.613 0.8935 0.850 0.8374
Learn and grow personally through the business 0.176 0.9814 0.336 0.9532
Contribute to the wellbeing of my stakeholders 0.420 0.9361 0.802 0.8490
Create something new and distinctive 4.753 0.1908 6.349 0.0958*
Create a lasting legacy of my achievements 2.265 0.5192 3.219 0.3590
Build a business to pass on within the family in future 4.740 0.1919 7.919 0.0477**
Build a business to generate wealth through sale to non-family members
0.116 0.9899 0.206 0.9766
Freedom to set and pursue my own objectives 1.242 0.7430 3.244 0.3555
Other factors 0.083 0.7728 0.111 0.7389
Two-sample Test of Sum of Percentages Important or Highly Important Between 2 Employment Size Group
(Table A3.5b) Z-value P-value
Increase the current and future value of the business -0.8628 0.3882
Increase personal or family wealth -0.1306 0.8961
Learn and grow personally through the business -0.134 0.8934
Contribute to the wellbeing of my stakeholders -0.9 0.3681
Create something new and distinctive -0.5925 0.5535
Create a lasting legacy of my achievements -1.5691 0.1166
Build a business to pass on within the family in future 1.6654 0.0958*
Build a business to generate wealth through sale to non-family members
-0.1847 0.8535
Freedom to set and pursue my own objectives -0.4031 0.6869
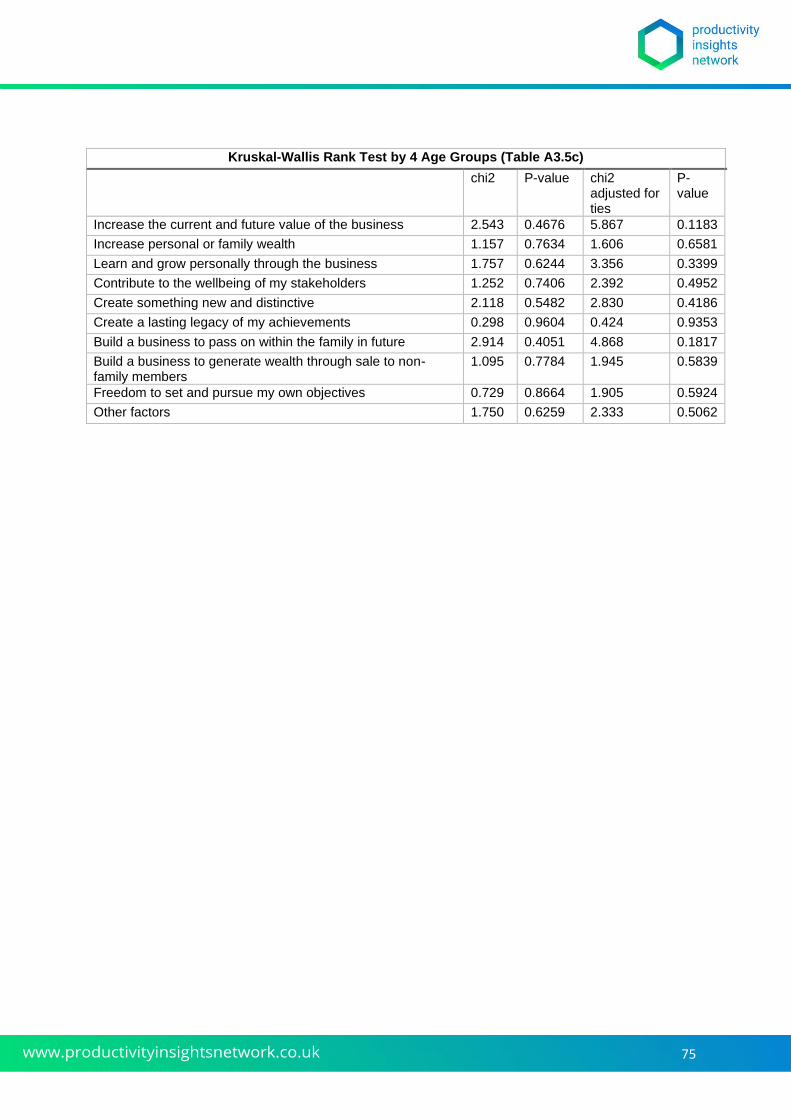
75
Kruskal-Wallis Rank Test by 4 Age Groups (Table A3.5c)
chi2 P-value chi2 adjusted for ties
P-value
Increase the current and future value of the business 2.543 0.4676 5.867 0.1183
Increase personal or family wealth 1.157 0.7634 1.606 0.6581
Learn and grow personally through the business 1.757 0.6244 3.356 0.3399
Contribute to the wellbeing of my stakeholders 1.252 0.7406 2.392 0.4952
Create something new and distinctive 2.118 0.5482 2.830 0.4186
Create a lasting legacy of my achievements 0.298 0.9604 0.424 0.9353
Build a business to pass on within the family in future 2.914 0.4051 4.868 0.1817
Build a business to generate wealth through sale to non-family members
1.095 0.7784 1.945 0.5839
Freedom to set and pursue my own objectives 0.729 0.8664 1.905 0.5924
Other factors 1.750 0.6259 2.333 0.5062
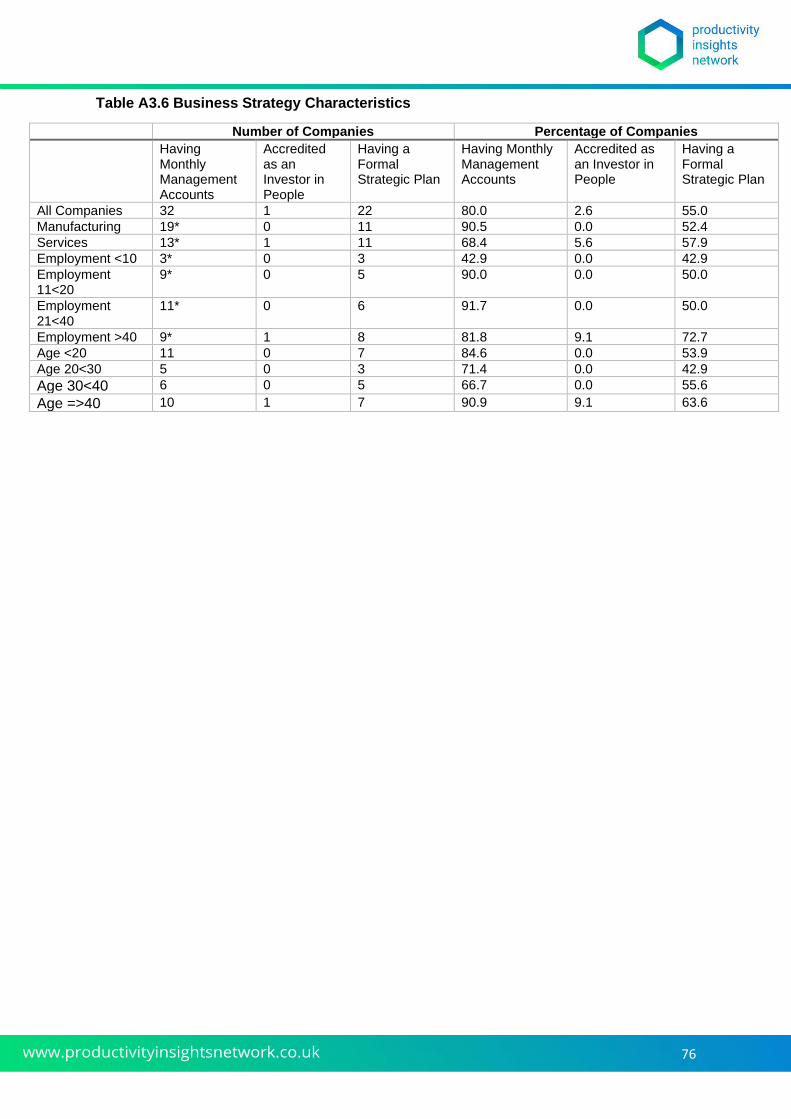
76
Table A3.6 Business Strategy Characteristics
Number of Companies Percentage of Companies Having Monthly Management Accounts
Accredited as an Investor in People
Having a Formal Strategic Plan
Having Monthly Management Accounts
Accredited as an Investor in People
Having a Formal Strategic Plan
All Companies 32 1 22 80.0 2.6 55.0
Manufacturing 19* 0 11 90.5 0.0 52.4
Services 13* 1 11 68.4 5.6 57.9
Employment <10 3* 0 3 42.9 0.0 42.9
Employment 11<20
9* 0 5 90.0 0.0 50.0
Employment 21<40
11* 0 6 91.7 0.0 50.0
Employment >40 9* 1 8 81.8 9.1 72.7
Age <20 11 0 7 84.6 0.0 53.9
Age 20<30 5 0 3 71.4 0.0 42.9
Age 30<40 6 0 5 66.7 0.0 55.6
Age =>40 10 1 7 90.9 9.1 63.6
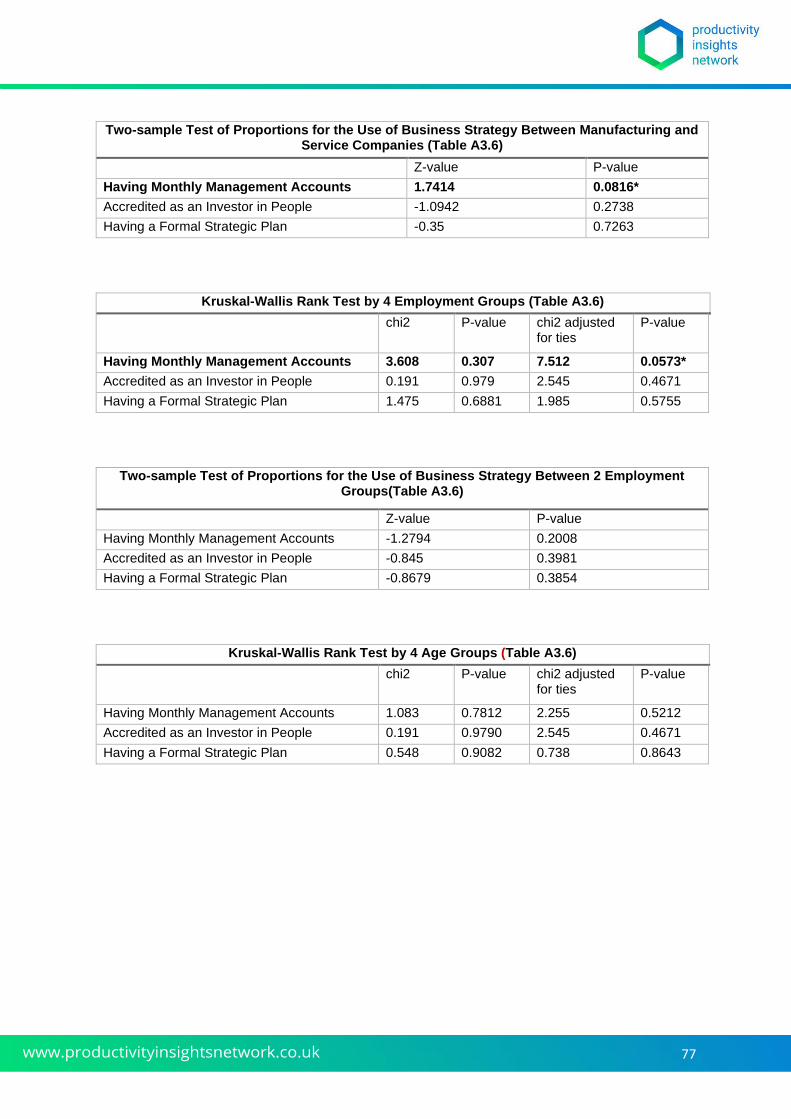
77
Two-sample Test of Proportions for the Use of Business Strategy Between Manufacturing and Service Companies (Table A3.6)
Z-value P-value
Having Monthly Management Accounts 1.7414 0.0816*
Accredited as an Investor in People -1.0942 0.2738
Having a Formal Strategic Plan -0.35 0.7263
Kruskal-Wallis Rank Test by 4 Employment Groups (Table A3.6)
chi2 P-value chi2 adjusted for ties
P-value
Having Monthly Management Accounts 3.608 0.307 7.512 0.0573*
Accredited as an Investor in People 0.191 0.979 2.545 0.4671
Having a Formal Strategic Plan 1.475 0.6881 1.985 0.5755
Two-sample Test of Proportions for the Use of Business Strategy Between 2 Employment Groups(Table A3.6)
Z-value P-value
Having Monthly Management Accounts -1.2794 0.2008
Accredited as an Investor in People -0.845 0.3981
Having a Formal Strategic Plan -0.8679 0.3854
Kruskal-Wallis Rank Test by 4 Age Groups (Table A3.6)
chi2 P-value chi2 adjusted for ties
P-value
Having Monthly Management Accounts 1.083 0.7812 2.255 0.5212
Accredited as an Investor in People 0.191 0.9790 2.545 0.4671
Having a Formal Strategic Plan 0.548 0.9082 0.738 0.8643
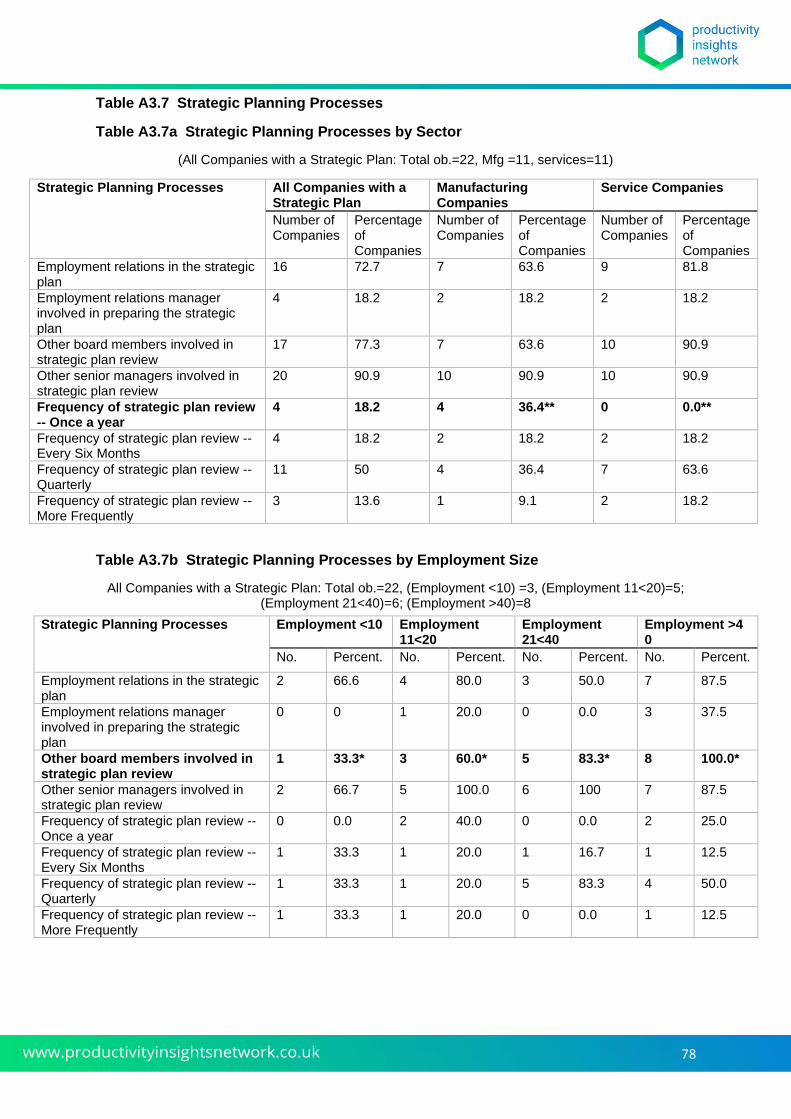
78
Table A3.7 Strategic Planning Processes
Table A3.7a Strategic Planning Processes by Sector
(All Companies with a Strategic Plan: Total ob.=22, Mfg =11, services=11)
Strategic Planning Processes All Companies with a Strategic Plan
Manufacturing Companies
Service Companies
Number of Companies
Percentage of Companies
Number of Companies
Percentage of Companies
Number of Companies
Percentage of Companies
Employment relations in the strategic plan
16 72.7 7 63.6 9 81.8
Employment relations manager involved in preparing the strategic plan
4 18.2 2 18.2 2 18.2
Other board members involved in strategic plan review
17 77.3 7 63.6 10 90.9
Other senior managers involved in strategic plan review
20 90.9 10 90.9 10 90.9
Frequency of strategic plan review -- Once a year
4 18.2 4 36.4** 0 0.0**
Frequency of strategic plan review -- Every Six Months
4 18.2 2 18.2 2 18.2
Frequency of strategic plan review -- Quarterly
11 50 4 36.4 7 63.6
Frequency of strategic plan review -- More Frequently
3 13.6 1 9.1 2 18.2
Table A3.7b Strategic Planning Processes by Employment Size
All Companies with a Strategic Plan: Total ob.=22, (Employment <10) =3, (Employment 11<20)=5; (Employment 21<40)=6; (Employment >40)=8
Strategic Planning Processes Employment <10 Employment 11<20
Employment 21<40
Employment >40
No. Percent. No. Percent. No. Percent. No. Percent.
Employment relations in the strategic plan
2 66.6 4 80.0 3 50.0 7 87.5
Employment relations manager involved in preparing the strategic plan
0 0 1 20.0 0 0.0 3 37.5
Other board members involved in strategic plan review
1 33.3* 3 60.0* 5 83.3* 8 100.0*
Other senior managers involved in strategic plan review
2 66.7 5 100.0 6 100 7 87.5
Frequency of strategic plan review -- Once a year
0 0.0 2 40.0 0 0.0 2 25.0
Frequency of strategic plan review -- Every Six Months
1 33.3 1 20.0 1 16.7 1 12.5
Frequency of strategic plan review -- Quarterly
1 33.3 1 20.0 5 83.3 4 50.0
Frequency of strategic plan review -- More Frequently
1 33.3 1 20.0 0 0.0 1 12.5
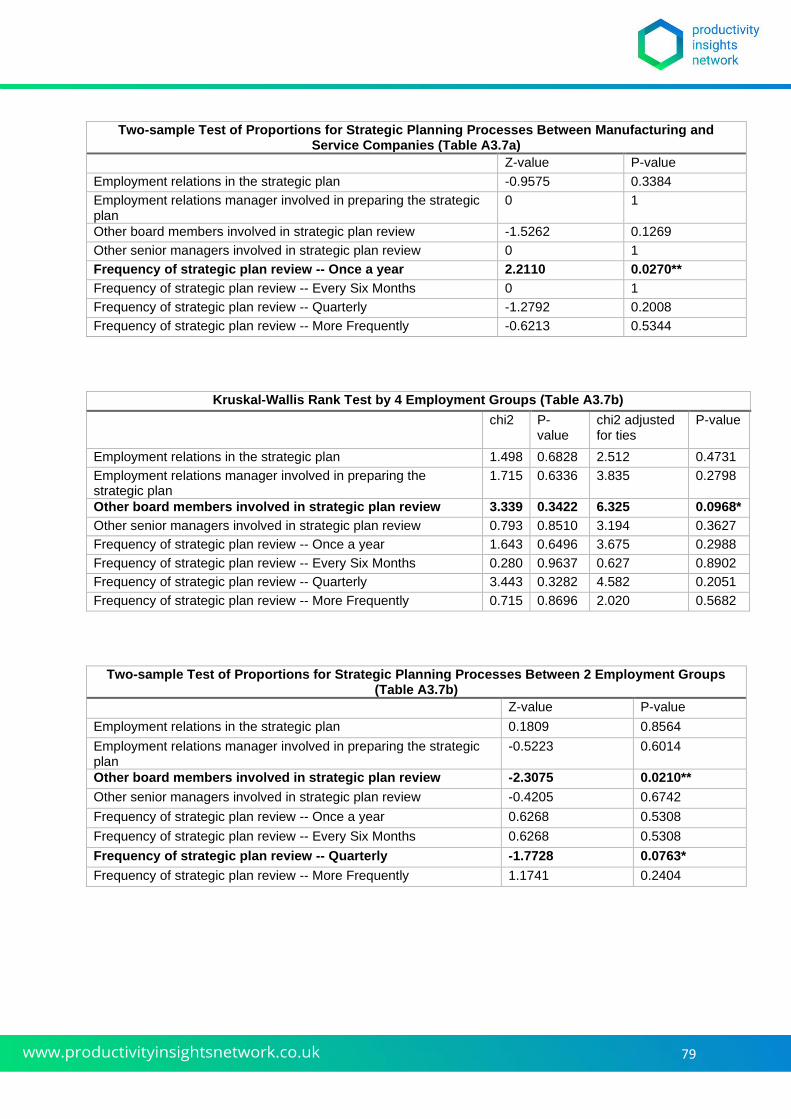
79
Two-sample Test of Proportions for Strategic Planning Processes Between Manufacturing and Service Companies (Table A3.7a)
Z-value P-value
Employment relations in the strategic plan -0.9575 0.3384
Employment relations manager involved in preparing the strategic plan
0 1
Other board members involved in strategic plan review -1.5262 0.1269
Other senior managers involved in strategic plan review 0 1
Frequency of strategic plan review -- Once a year 2.2110 0.0270**
Frequency of strategic plan review -- Every Six Months 0 1
Frequency of strategic plan review -- Quarterly -1.2792 0.2008
Frequency of strategic plan review -- More Frequently -0.6213 0.5344
Kruskal-Wallis Rank Test by 4 Employment Groups (Table A3.7b)
chi2 P-value
chi2 adjusted for ties
P-value
Employment relations in the strategic plan 1.498 0.6828 2.512 0.4731
Employment relations manager involved in preparing the strategic plan
1.715 0.6336 3.835 0.2798
Other board members involved in strategic plan review 3.339 0.3422 6.325 0.0968*
Other senior managers involved in strategic plan review 0.793 0.8510 3.194 0.3627
Frequency of strategic plan review -- Once a year 1.643 0.6496 3.675 0.2988
Frequency of strategic plan review -- Every Six Months 0.280 0.9637 0.627 0.8902
Frequency of strategic plan review -- Quarterly 3.443 0.3282 4.582 0.2051
Frequency of strategic plan review -- More Frequently 0.715 0.8696 2.020 0.5682
Two-sample Test of Proportions for Strategic Planning Processes Between 2 Employment Groups (Table A3.7b)
Z-value P-value
Employment relations in the strategic plan 0.1809 0.8564
Employment relations manager involved in preparing the strategic plan
-0.5223 0.6014
Other board members involved in strategic plan review -2.3075 0.0210**
Other senior managers involved in strategic plan review -0.4205 0.6742
Frequency of strategic plan review -- Once a year 0.6268 0.5308
Frequency of strategic plan review -- Every Six Months 0.6268 0.5308
Frequency of strategic plan review -- Quarterly -1.7728 0.0763*
Frequency of strategic plan review -- More Frequently 1.1741 0.2404
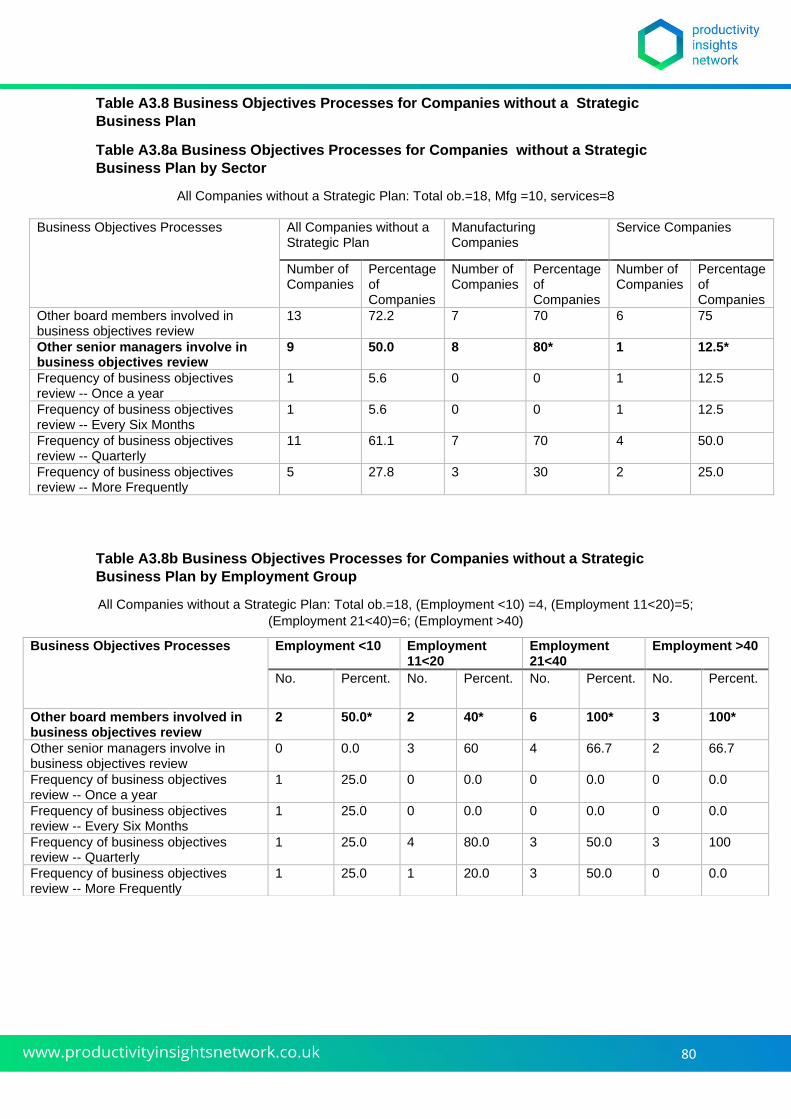
80
Table A3.8 Business Objectives Processes for Companies without a Strategic
Business Plan
Table A3.8a Business Objectives Processes for Companies without a Strategic
Business Plan by Sector
All Companies without a Strategic Plan: Total ob.=18, Mfg =10, services=8
Business Objectives Processes All Companies without a Strategic Plan
Manufacturing Companies
Service Companies
Number of Companies
Percentage of Companies
Number of Companies
Percentage of Companies
Number of Companies
Percentage of Companies
Other board members involved in business objectives review
13 72.2 7 70 6 75
Other senior managers involve in business objectives review
9 50.0 8 80* 1 12.5*
Frequency of business objectives review -- Once a year
1 5.6 0 0 1 12.5
Frequency of business objectives review -- Every Six Months
1 5.6 0 0 1 12.5
Frequency of business objectives review -- Quarterly
11 61.1 7 70 4 50.0
Frequency of business objectives review -- More Frequently
5 27.8 3 30 2 25.0
Table A3.8b Business Objectives Processes for Companies without a Strategic
Business Plan by Employment Group
All Companies without a Strategic Plan: Total ob.=18, (Employment <10) =4, (Employment 11<20)=5;
(Employment 21<40)=6; (Employment >40)
Business Objectives Processes Employment <10 Employment 11<20
Employment 21<40
Employment >40
No. Percent. No. Percent. No. Percent. No. Percent.
Other board members involved in business objectives review
2 50.0* 2 40* 6 100* 3 100*
Other senior managers involve in business objectives review
0 0.0 3 60 4 66.7 2 66.7
Frequency of business objectives review -- Once a year
1 25.0 0 0.0 0 0.0 0 0.0
Frequency of business objectives review -- Every Six Months
1 25.0 0 0.0 0 0.0 0 0.0
Frequency of business objectives review -- Quarterly
1 25.0 4 80.0 3 50.0 3 100
Frequency of business objectives review -- More Frequently
1 25.0 1 20.0 3 50.0 0 0.0
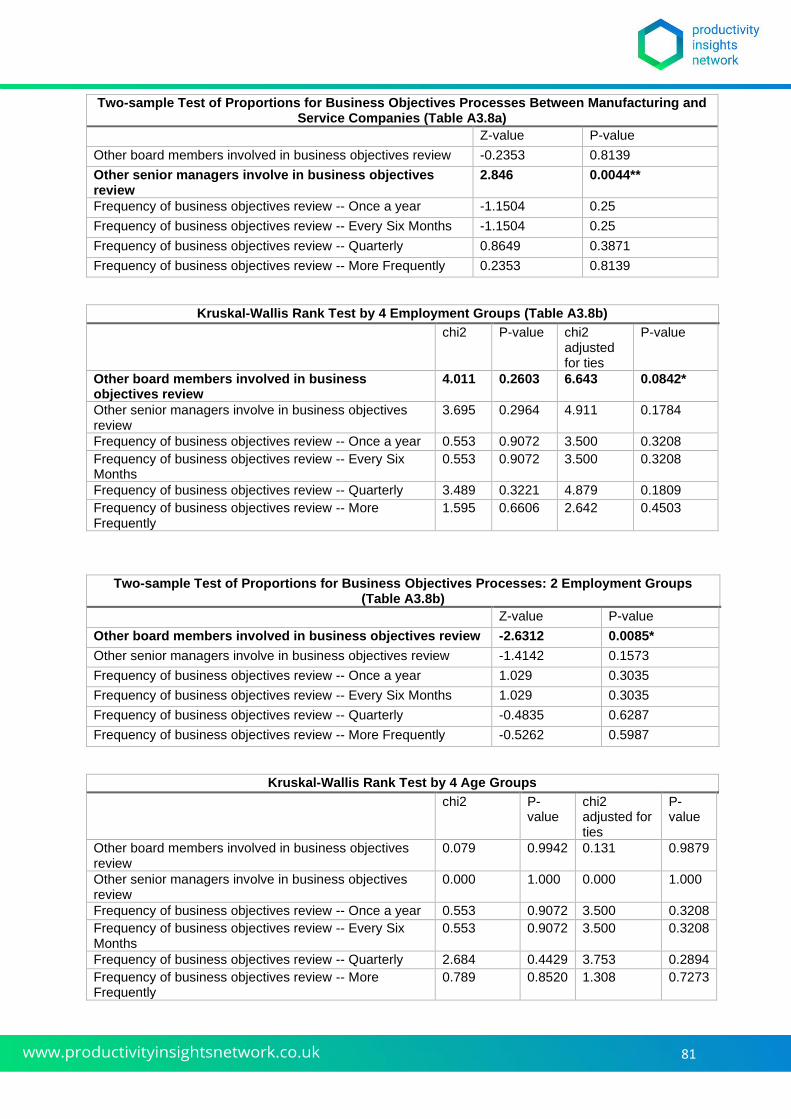
81
Two-sample Test of Proportions for Business Objectives Processes Between Manufacturing and Service Companies (Table A3.8a)
Z-value P-value
Other board members involved in business objectives review -0.2353 0.8139
Other senior managers involve in business objectives review
2.846 0.0044**
Frequency of business objectives review -- Once a year -1.1504 0.25
Frequency of business objectives review -- Every Six Months -1.1504 0.25
Frequency of business objectives review -- Quarterly 0.8649 0.3871
Frequency of business objectives review -- More Frequently 0.2353 0.8139
Kruskal-Wallis Rank Test by 4 Employment Groups (Table A3.8b)
chi2 P-value chi2 adjusted for ties
P-value
Other board members involved in business objectives review
4.011 0.2603 6.643 0.0842*
Other senior managers involve in business objectives review
3.695 0.2964 4.911 0.1784
Frequency of business objectives review -- Once a year 0.553 0.9072 3.500 0.3208
Frequency of business objectives review -- Every Six Months
0.553 0.9072 3.500 0.3208
Frequency of business objectives review -- Quarterly 3.489 0.3221 4.879 0.1809
Frequency of business objectives review -- More Frequently
1.595 0.6606 2.642 0.4503
Two-sample Test of Proportions for Business Objectives Processes: 2 Employment Groups (Table A3.8b)
Z-value P-value
Other board members involved in business objectives review -2.6312 0.0085*
Other senior managers involve in business objectives review -1.4142 0.1573
Frequency of business objectives review -- Once a year 1.029 0.3035
Frequency of business objectives review -- Every Six Months 1.029 0.3035
Frequency of business objectives review -- Quarterly -0.4835 0.6287
Frequency of business objectives review -- More Frequently -0.5262 0.5987
Kruskal-Wallis Rank Test by 4 Age Groups
chi2 P-value
chi2 adjusted for ties
P-value
Other board members involved in business objectives review
0.079 0.9942 0.131 0.9879
Other senior managers involve in business objectives review
0.000 1.000 0.000 1.000
Frequency of business objectives review -- Once a year 0.553 0.9072 3.500 0.3208
Frequency of business objectives review -- Every Six Months
0.553 0.9072 3.500 0.3208
Frequency of business objectives review -- Quarterly 2.684 0.4429 3.753 0.2894
Frequency of business objectives review -- More Frequently
0.789 0.8520 1.308 0.7273
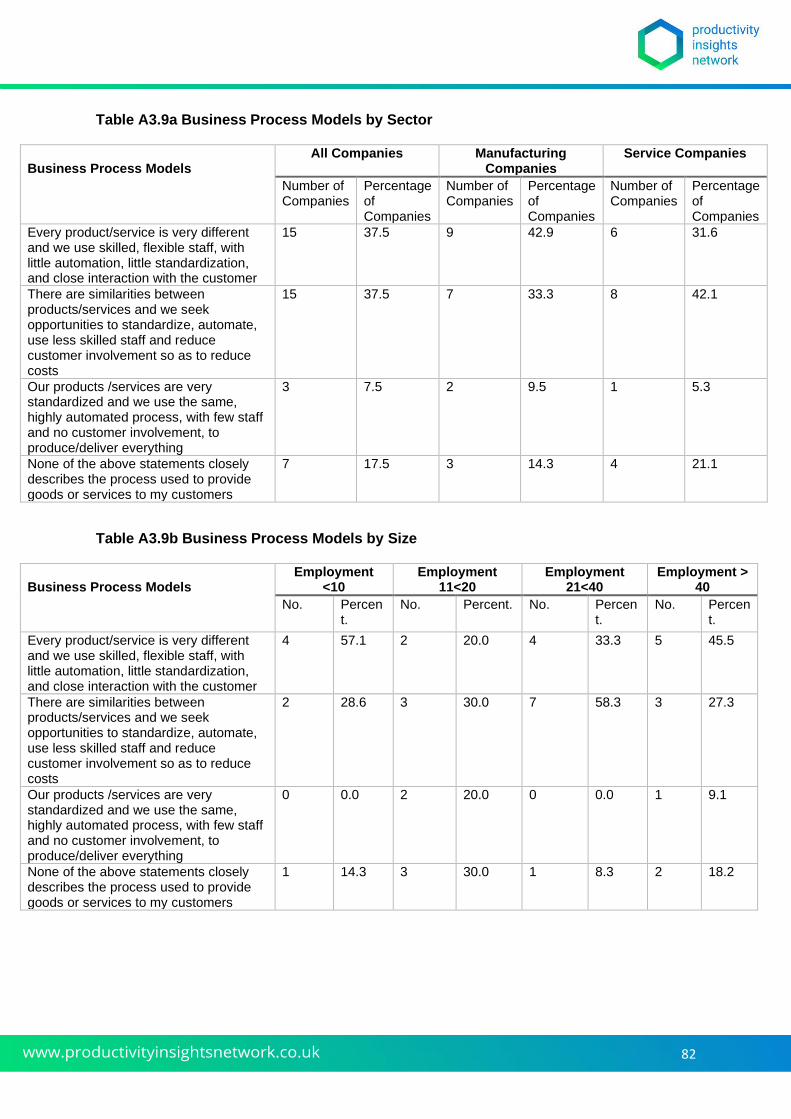
82
Table A3.9a Business Process Models by Sector
Business Process Models
All Companies Manufacturing Companies
Service Companies
Number of Companies
Percentage of Companies
Number of Companies
Percentage of Companies
Number of Companies
Percentage of Companies
Every product/service is very different and we use skilled, flexible staff, with little automation, little standardization, and close interaction with the customer
15 37.5 9 42.9 6 31.6
There are similarities between products/services and we seek opportunities to standardize, automate, use less skilled staff and reduce customer involvement so as to reduce costs
15 37.5 7 33.3 8 42.1
Our products /services are very standardized and we use the same, highly automated process, with few staff and no customer involvement, to produce/deliver everything
3 7.5 2 9.5 1 5.3
None of the above statements closely describes the process used to provide goods or services to my customers
7 17.5 3 14.3 4 21.1
Table A3.9b Business Process Models by Size
Business Process Models
Employment <10
Employment 11<20
Employment 21<40
Employment >40
No. Percent.
No. Percent. No. Percent.
No. Percent.
Every product/service is very different and we use skilled, flexible staff, with little automation, little standardization, and close interaction with the customer
4 57.1 2 20.0 4 33.3 5 45.5
There are similarities between products/services and we seek opportunities to standardize, automate, use less skilled staff and reduce customer involvement so as to reduce costs
2 28.6 3 30.0 7 58.3 3 27.3
Our products /services are very standardized and we use the same, highly automated process, with few staff and no customer involvement, to produce/deliver everything
0 0.0 2 20.0 0 0.0 1 9.1
None of the above statements closely describes the process used to provide goods or services to my customers
1 14.3 3 30.0 1 8.3 2 18.2
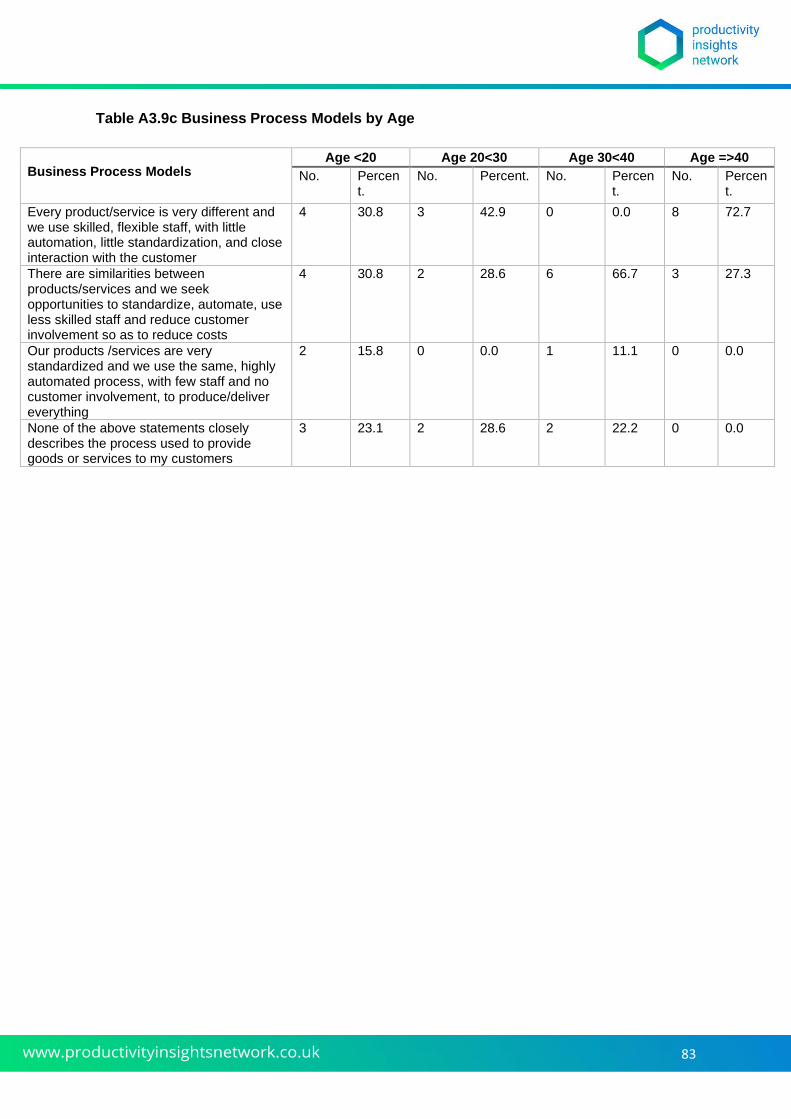
83
Table A3.9c Business Process Models by Age
Business Process Models Age <20 Age 20<30 Age 30<40 Age =>40
No. Percent.
No. Percent. No. Percent.
No. Percent.
Every product/service is very different and we use skilled, flexible staff, with little automation, little standardization, and close interaction with the customer
4 30.8 3 42.9 0 0.0 8 72.7
There are similarities between products/services and we seek opportunities to standardize, automate, use less skilled staff and reduce customer involvement so as to reduce costs
4 30.8 2 28.6 6 66.7 3 27.3
Our products /services are very standardized and we use the same, highly automated process, with few staff and no customer involvement, to produce/deliver everything
2 15.8 0 0.0 1 11.1 0 0.0
None of the above statements closely describes the process used to provide goods or services to my customers
3 23.1 2 28.6 2 22.2 0 0.0
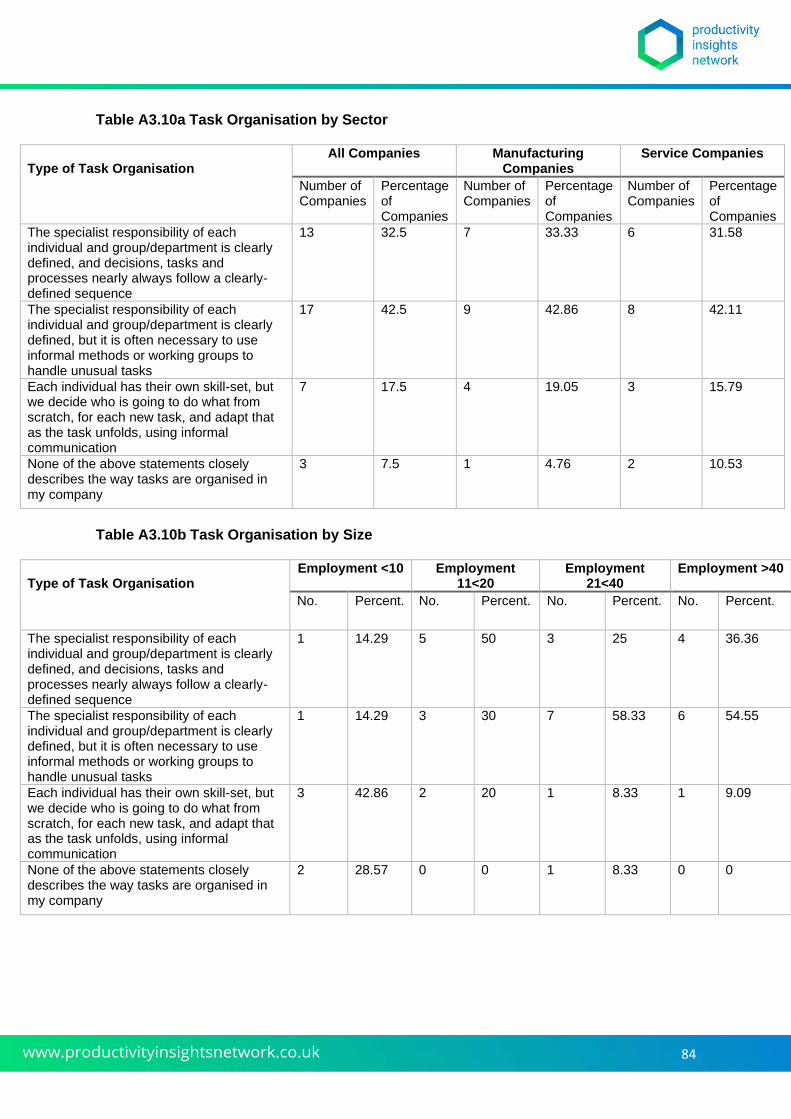
84
Table A3.10a Task Organisation by Sector
Type of Task Organisation
All Companies Manufacturing Companies
Service Companies
Number of Companies
Percentage of Companies
Number of Companies
Percentage of Companies
Number of Companies
Percentage of Companies
The specialist responsibility of each individual and group/department is clearly defined, and decisions, tasks and processes nearly always follow a clearly-defined sequence
13 32.5 7 33.33 6 31.58
The specialist responsibility of each individual and group/department is clearly defined, but it is often necessary to use informal methods or working groups to handle unusual tasks
17 42.5 9 42.86 8 42.11
Each individual has their own skill-set, but we decide who is going to do what from scratch, for each new task, and adapt that as the task unfolds, using informal communication
7 17.5 4 19.05 3 15.79
None of the above statements closely describes the way tasks are organised in my company
3 7.5 1 4.76 2 10.53
Table A3.10b Task Organisation by Size
Type of Task Organisation
Employment <10 Employment 11<20
Employment 21<40
Employment >40
No. Percent. No. Percent. No. Percent. No. Percent.
The specialist responsibility of each individual and group/department is clearly defined, and decisions, tasks and processes nearly always follow a clearly-defined sequence
1 14.29 5 50 3 25 4 36.36
The specialist responsibility of each individual and group/department is clearly defined, but it is often necessary to use informal methods or working groups to handle unusual tasks
1 14.29 3 30 7 58.33 6 54.55
Each individual has their own skill-set, but we decide who is going to do what from scratch, for each new task, and adapt that as the task unfolds, using informal communication
3 42.86 2 20 1 8.33 1 9.09
None of the above statements closely describes the way tasks are organised in my company
2 28.57 0 0 1 8.33 0 0
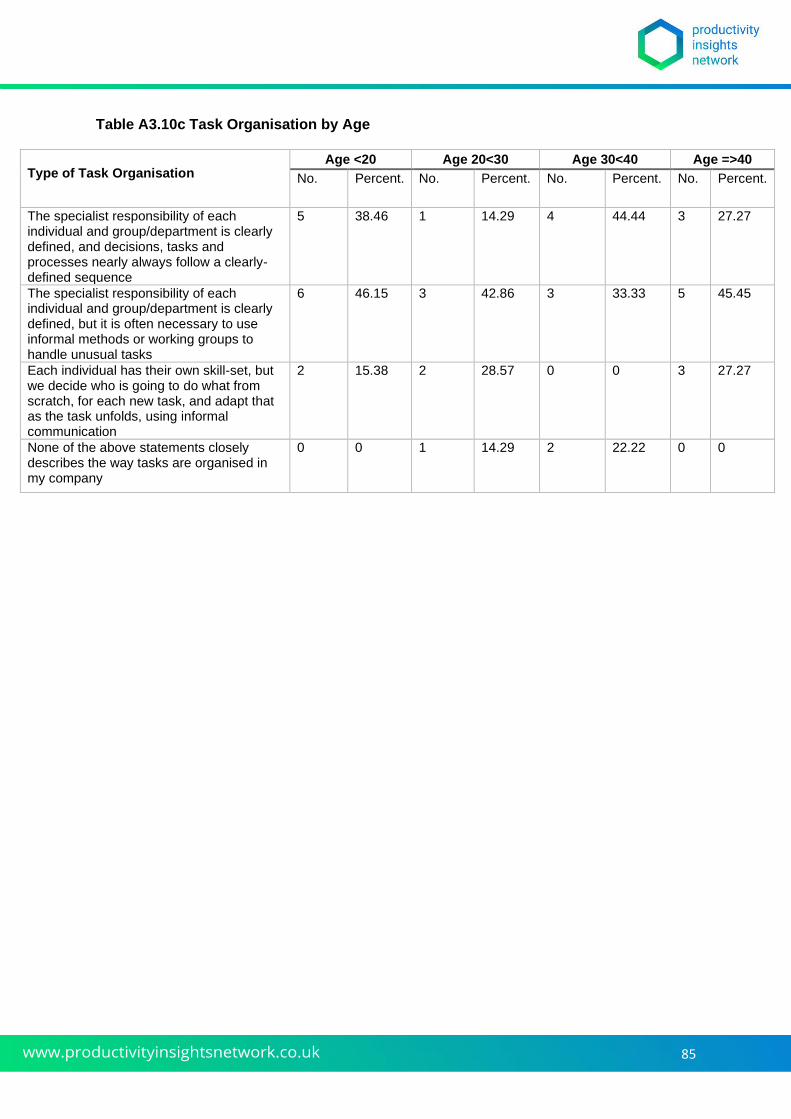
85
Table A3.10c Task Organisation by Age
Type of Task Organisation
Age <20 Age 20<30 Age 30<40 Age =>40
No. Percent. No. Percent. No. Percent. No. Percent.
The specialist responsibility of each individual and group/department is clearly defined, and decisions, tasks and processes nearly always follow a clearly-defined sequence
5 38.46 1 14.29 4 44.44 3 27.27
The specialist responsibility of each individual and group/department is clearly defined, but it is often necessary to use informal methods or working groups to handle unusual tasks
6 46.15 3 42.86 3 33.33 5 45.45
Each individual has their own skill-set, but we decide who is going to do what from scratch, for each new task, and adapt that as the task unfolds, using informal communication
2 15.38 2 28.57 0 0 3 27.27
None of the above statements closely describes the way tasks are organised in my company
0 0 1 14.29 2 22.22 0 0
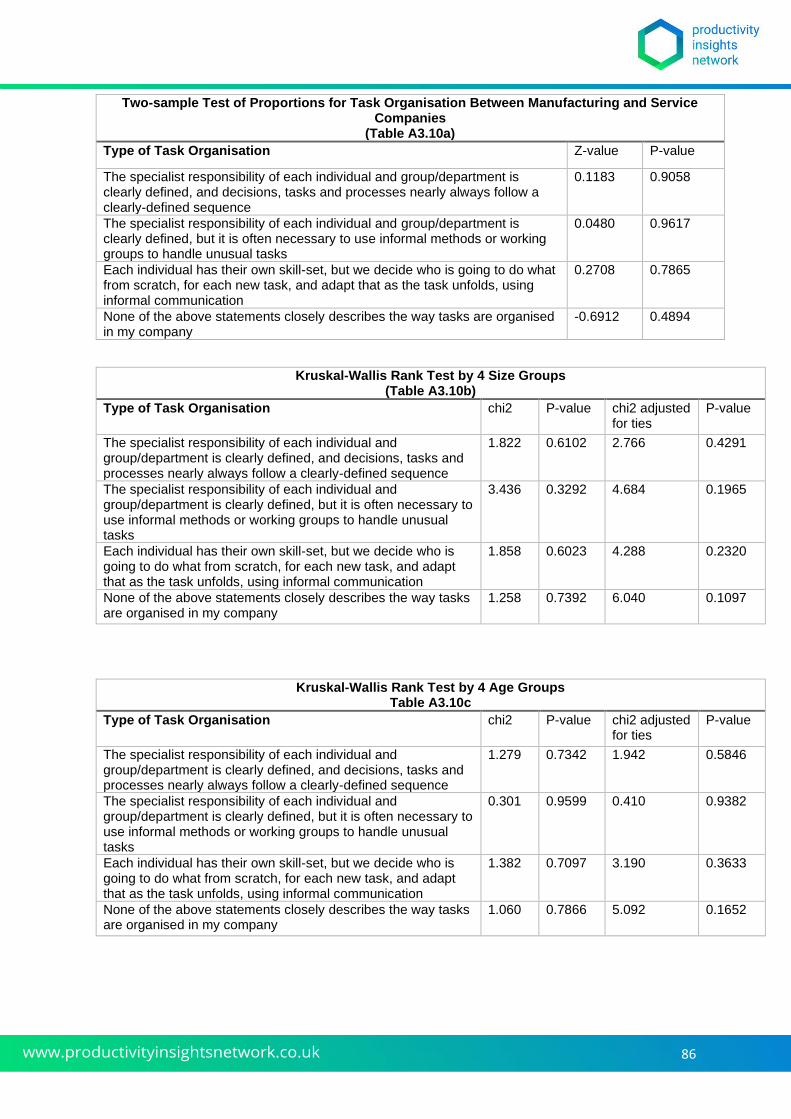
86
Two-sample Test of Proportions for Task Organisation Between Manufacturing and Service Companies
(Table A3.10a)
Type of Task Organisation Z-value P-value
The specialist responsibility of each individual and group/department is clearly defined, and decisions, tasks and processes nearly always follow a clearly-defined sequence
0.1183 0.9058
The specialist responsibility of each individual and group/department is clearly defined, but it is often necessary to use informal methods or working groups to handle unusual tasks
0.0480 0.9617
Each individual has their own skill-set, but we decide who is going to do what from scratch, for each new task, and adapt that as the task unfolds, using informal communication
0.2708 0.7865
None of the above statements closely describes the way tasks are organised in my company
-0.6912 0.4894
Kruskal-Wallis Rank Test by 4 Size Groups (Table A3.10b)
Type of Task Organisation chi2 P-value chi2 adjusted for ties
P-value
The specialist responsibility of each individual and group/department is clearly defined, and decisions, tasks and processes nearly always follow a clearly-defined sequence
1.822 0.6102 2.766 0.4291
The specialist responsibility of each individual and group/department is clearly defined, but it is often necessary to use informal methods or working groups to handle unusual tasks
3.436 0.3292 4.684 0.1965
Each individual has their own skill-set, but we decide who is going to do what from scratch, for each new task, and adapt that as the task unfolds, using informal communication
1.858 0.6023 4.288 0.2320
None of the above statements closely describes the way tasks are organised in my company
1.258 0.7392 6.040 0.1097
Kruskal-Wallis Rank Test by 4 Age Groups Table A3.10c
Type of Task Organisation chi2 P-value chi2 adjusted for ties
P-value
The specialist responsibility of each individual and group/department is clearly defined, and decisions, tasks and processes nearly always follow a clearly-defined sequence
1.279 0.7342 1.942 0.5846
The specialist responsibility of each individual and group/department is clearly defined, but it is often necessary to use informal methods or working groups to handle unusual tasks
0.301 0.9599 0.410 0.9382
Each individual has their own skill-set, but we decide who is going to do what from scratch, for each new task, and adapt that as the task unfolds, using informal communication
1.382 0.7097 3.190 0.3633
None of the above statements closely describes the way tasks are organised in my company
1.060 0.7866 5.092 0.1652
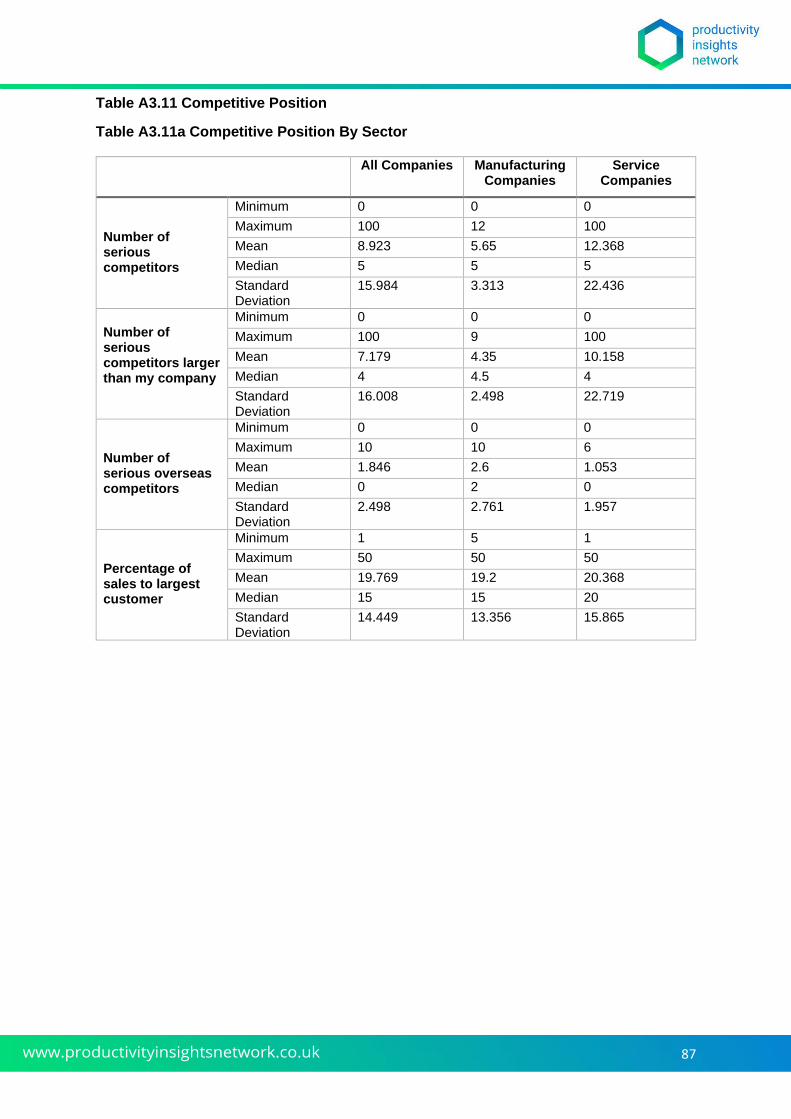
87
Table A3.11 Competitive Position
Table A3.11a Competitive Position By Sector
All Companies Manufacturing Companies
Service Companies
Number of serious competitors
Minimum 0 0 0
Maximum 100 12 100
Mean 8.923 5.65 12.368
Median 5 5 5
Standard Deviation
15.984 3.313 22.436
Number of serious competitors larger than my company
Minimum 0 0 0
Maximum 100 9 100
Mean 7.179 4.35 10.158
Median 4 4.5 4
Standard Deviation
16.008 2.498 22.719
Number of serious overseas competitors
Minimum 0 0 0
Maximum 10 10 6
Mean 1.846 2.6 1.053
Median 0 2 0
Standard Deviation
2.498 2.761 1.957
Percentage of sales to largest customer
Minimum 1 5 1
Maximum 50 50 50
Mean 19.769 19.2 20.368
Median 15 15 20
Standard Deviation
14.449 13.356 15.865
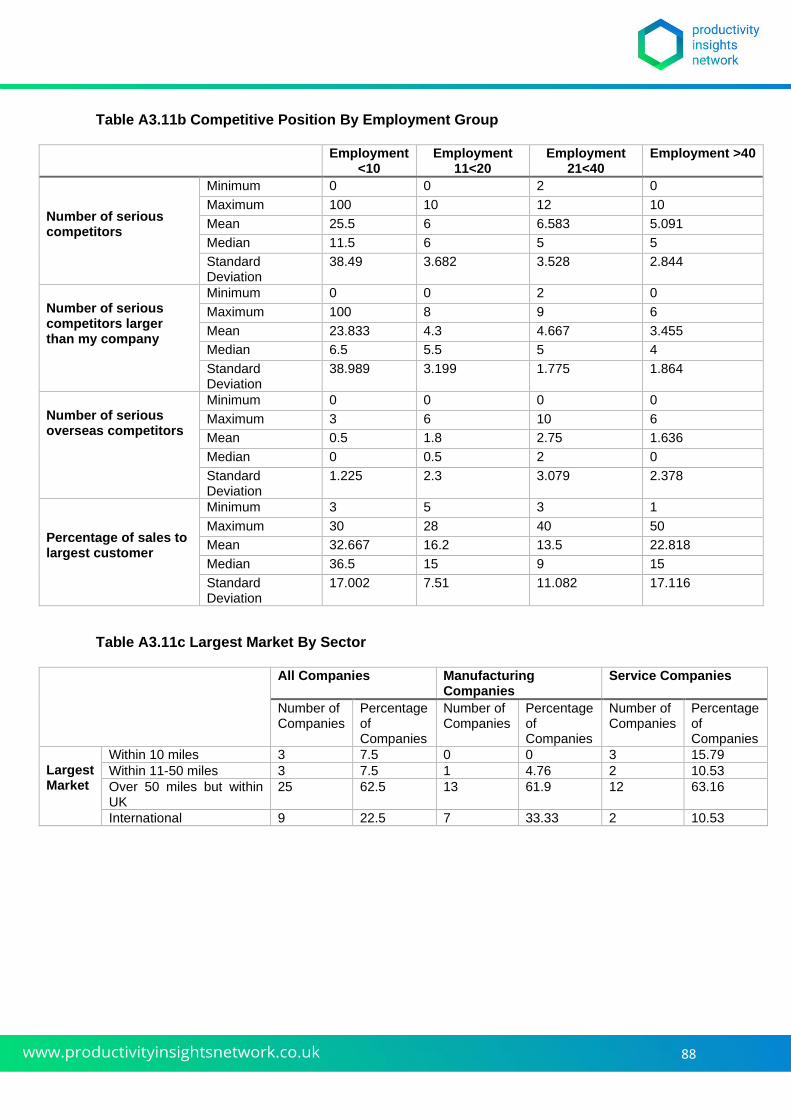
88
Table A3.11b Competitive Position By Employment Group
Employment <10
Employment 11<20
Employment 21<40
Employment >40
Number of serious competitors
Minimum 0 0 2 0
Maximum 100 10 12 10
Mean 25.5 6 6.583 5.091
Median 11.5 6 5 5
Standard Deviation
38.49 3.682 3.528 2.844
Number of serious competitors larger than my company
Minimum 0 0 2 0
Maximum 100 8 9 6
Mean 23.833 4.3 4.667 3.455
Median 6.5 5.5 5 4
Standard Deviation
38.989 3.199 1.775 1.864
Number of serious overseas competitors
Minimum 0 0 0 0
Maximum 3 6 10 6
Mean 0.5 1.8 2.75 1.636
Median 0 0.5 2 0
Standard Deviation
1.225 2.3 3.079 2.378
Percentage of sales to largest customer
Minimum 3 5 3 1
Maximum 30 28 40 50
Mean 32.667 16.2 13.5 22.818
Median 36.5 15 9 15
Standard Deviation
17.002 7.51 11.082 17.116
Table A3.11c Largest Market By Sector
All Companies Manufacturing Companies
Service Companies
Number of Companies
Percentage of Companies
Number of Companies
Percentage of Companies
Number of Companies
Percentage of Companies
Largest Market
Within 10 miles 3 7.5 0 0 3 15.79
Within 11-50 miles 3 7.5 1 4.76 2 10.53
Over 50 miles but within UK
25 62.5 13 61.9 12 63.16
International 9 22.5 7 33.33 2 10.53
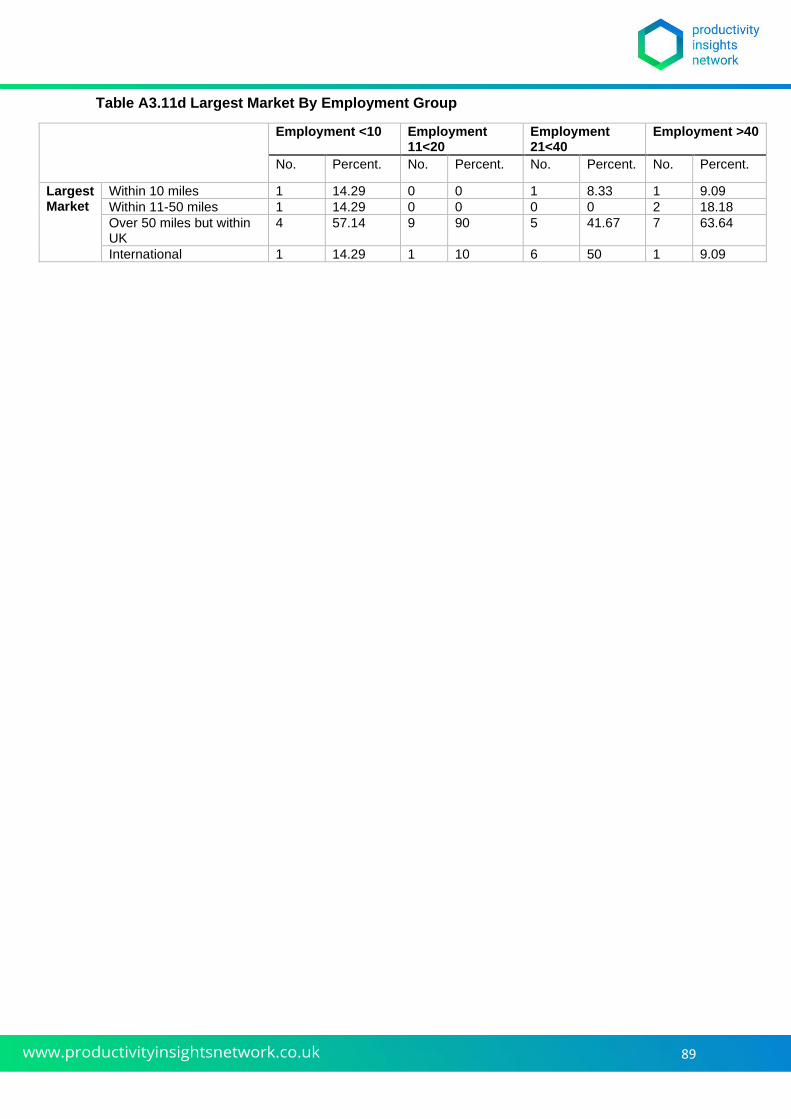
89
Table A3.11d Largest Market By Employment Group
Employment <10 Employment 11<20
Employment 21<40
Employment >40
No. Percent. No. Percent. No. Percent. No. Percent.
Largest Market
Within 10 miles 1 14.29 0 0 1 8.33 1 9.09
Within 11-50 miles 1 14.29 0 0 0 0 2 18.18
Over 50 miles but within UK
4 57.14 9 90 5 41.67 7 63.64
International 1 14.29 1 10 6 50 1 9.09
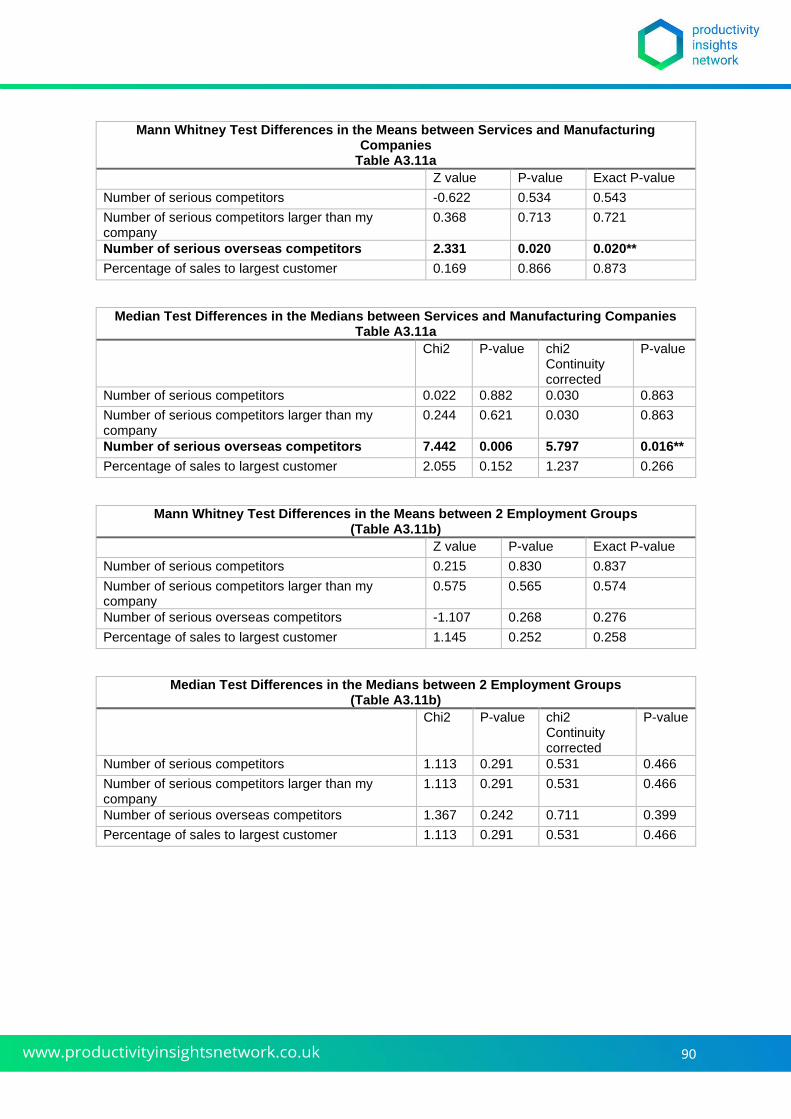
90
Mann Whitney Test Differences in the Means between Services and Manufacturing Companies
Table A3.11a Z value P-value Exact P-value
Number of serious competitors -0.622 0.534 0.543
Number of serious competitors larger than my company
0.368 0.713 0.721
Number of serious overseas competitors 2.331 0.020 0.020**
Percentage of sales to largest customer 0.169 0.866 0.873
Median Test Differences in the Medians between Services and Manufacturing Companies Table A3.11a
Chi2 P-value chi2 Continuity corrected
P-value
Number of serious competitors 0.022 0.882 0.030 0.863
Number of serious competitors larger than my company
0.244 0.621 0.030 0.863
Number of serious overseas competitors 7.442 0.006 5.797 0.016**
Percentage of sales to largest customer 2.055 0.152 1.237 0.266
Mann Whitney Test Differences in the Means between 2 Employment Groups (Table A3.11b)
Z value P-value Exact P-value
Number of serious competitors 0.215 0.830 0.837
Number of serious competitors larger than my company
0.575 0.565 0.574
Number of serious overseas competitors -1.107 0.268 0.276
Percentage of sales to largest customer 1.145 0.252 0.258
Median Test Differences in the Medians between 2 Employment Groups (Table A3.11b)
Chi2 P-value chi2 Continuity corrected
P-value
Number of serious competitors 1.113 0.291 0.531 0.466
Number of serious competitors larger than my company
1.113 0.291 0.531 0.466
Number of serious overseas competitors 1.367 0.242 0.711 0.399
Percentage of sales to largest customer 1.113 0.291 0.531 0.466
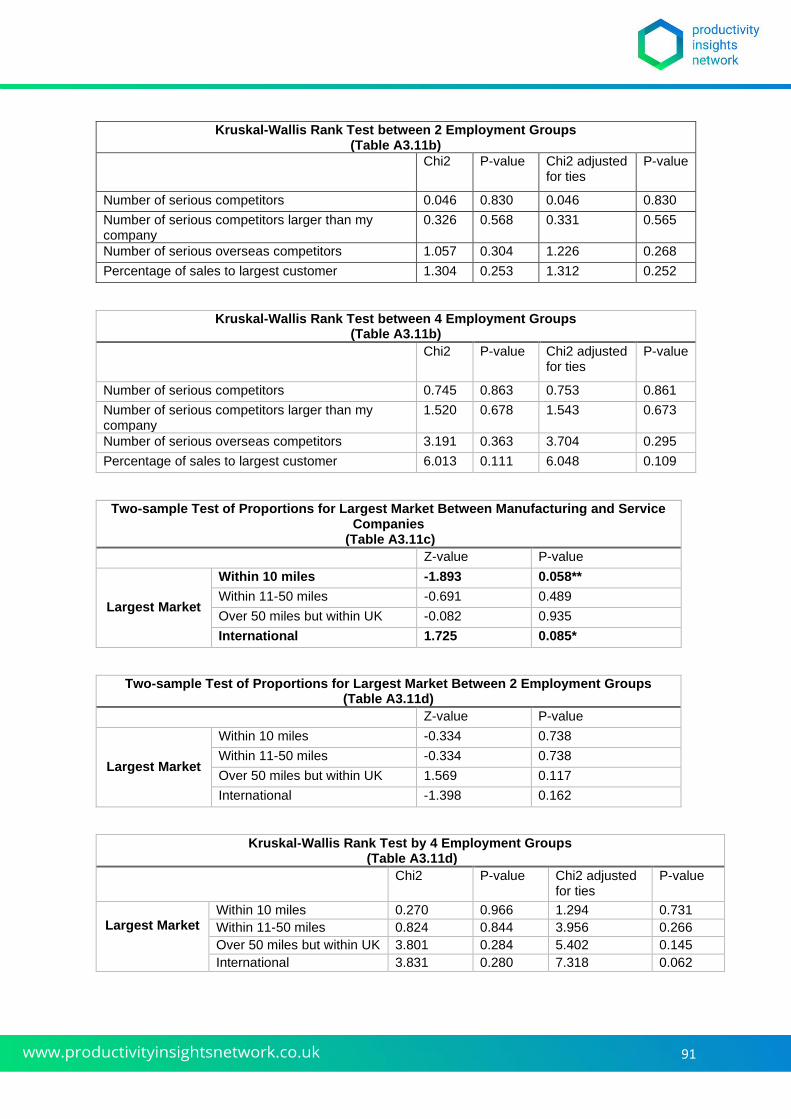
91
Kruskal-Wallis Rank Test between 2 Employment Groups (Table A3.11b)
Chi2 P-value Chi2 adjusted for ties
P-value
Number of serious competitors 0.046 0.830 0.046 0.830
Number of serious competitors larger than my company
0.326 0.568 0.331 0.565
Number of serious overseas competitors 1.057 0.304 1.226 0.268
Percentage of sales to largest customer 1.304 0.253 1.312 0.252
Kruskal-Wallis Rank Test between 4 Employment Groups (Table A3.11b)
Chi2 P-value Chi2 adjusted for ties
P-value
Number of serious competitors 0.745 0.863 0.753 0.861
Number of serious competitors larger than my company
1.520 0.678 1.543 0.673
Number of serious overseas competitors 3.191 0.363 3.704 0.295
Percentage of sales to largest customer 6.013 0.111 6.048 0.109
Two-sample Test of Proportions for Largest Market Between Manufacturing and Service Companies
(Table A3.11c) Z-value P-value
Largest Market
Within 10 miles -1.893 0.058**
Within 11-50 miles -0.691 0.489
Over 50 miles but within UK -0.082 0.935
International 1.725 0.085*
Two-sample Test of Proportions for Largest Market Between 2 Employment Groups (Table A3.11d)
Z-value P-value
Largest Market
Within 10 miles -0.334 0.738
Within 11-50 miles -0.334 0.738
Over 50 miles but within UK 1.569 0.117
International -1.398 0.162
Kruskal-Wallis Rank Test by 4 Employment Groups (Table A3.11d)
Chi2 P-value Chi2 adjusted for ties
P-value
Largest Market
Within 10 miles 0.270 0.966 1.294 0.731
Within 11-50 miles 0.824 0.844 3.956 0.266
Over 50 miles but within UK 3.801 0.284 5.402 0.145
International 3.831 0.280 7.318 0.062
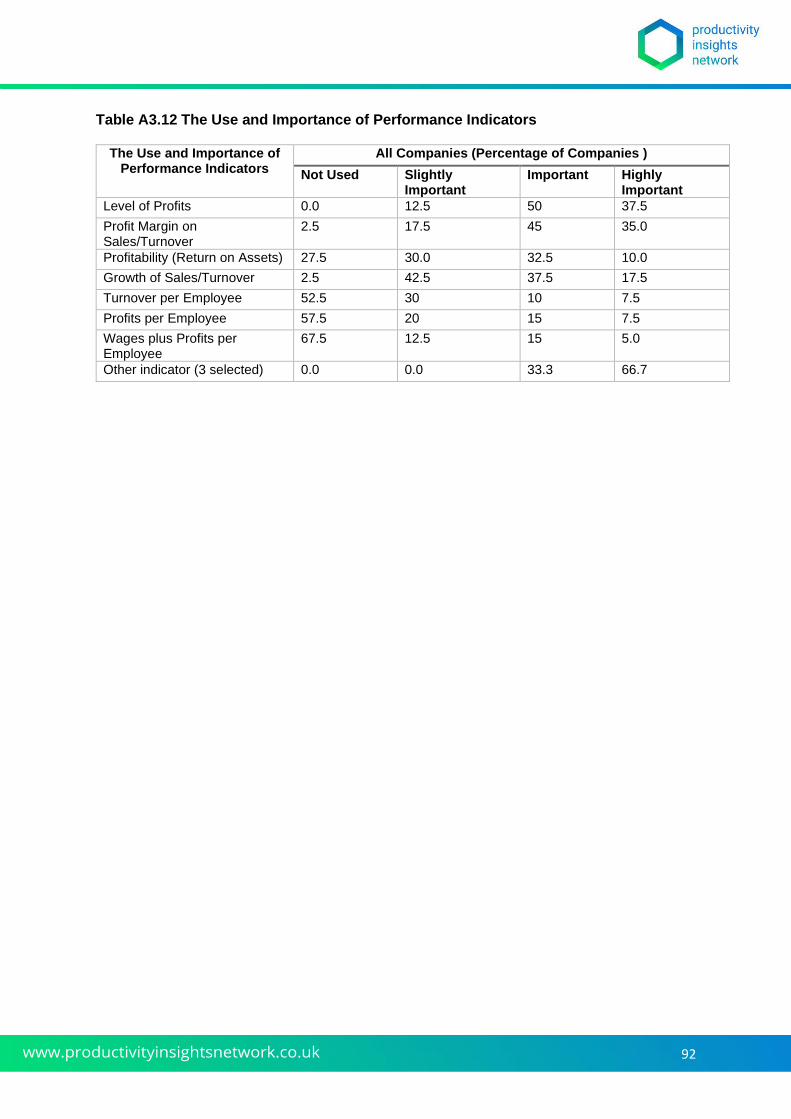
92
Table A3.12 The Use and Importance of Performance Indicators
The Use and Importance of Performance Indicators
All Companies (Percentage of Companies )
Not Used Slightly Important
Important Highly Important
Level of Profits 0.0 12.5 50 37.5
Profit Margin on Sales/Turnover
2.5 17.5 45 35.0
Profitability (Return on Assets) 27.5 30.0 32.5 10.0
Growth of Sales/Turnover 2.5 42.5 37.5 17.5
Turnover per Employee 52.5 30 10 7.5
Profits per Employee 57.5 20 15 7.5
Wages plus Profits per Employee
67.5 12.5 15 5.0
Other indicator (3 selected) 0.0 0.0 33.3 66.7
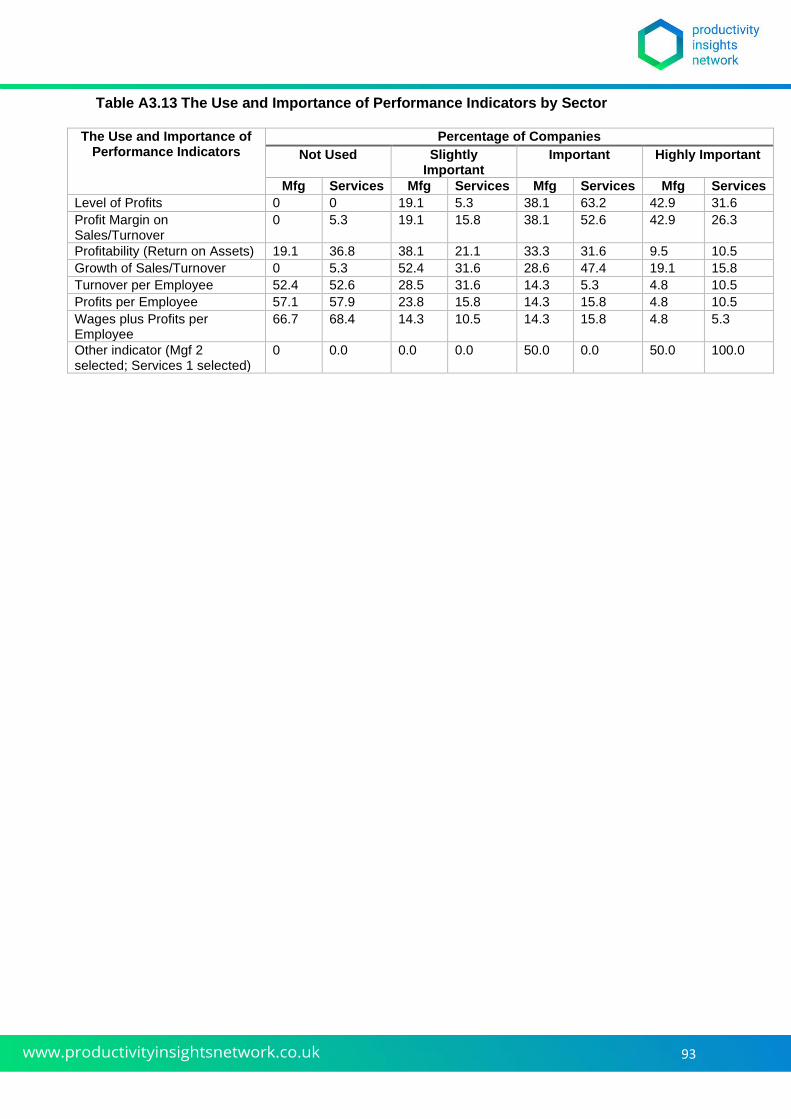
93
Table A3.13 The Use and Importance of Performance Indicators by Sector
The Use and Importance of Performance Indicators
Percentage of Companies
Not Used Slightly Important
Important Highly Important
Mfg Services Mfg Services Mfg Services Mfg Services
Level of Profits 0 0 19.1 5.3 38.1 63.2 42.9 31.6
Profit Margin on Sales/Turnover
0 5.3 19.1 15.8 38.1 52.6 42.9 26.3
Profitability (Return on Assets) 19.1 36.8 38.1 21.1 33.3 31.6 9.5 10.5
Growth of Sales/Turnover 0 5.3 52.4 31.6 28.6 47.4 19.1 15.8
Turnover per Employee 52.4 52.6 28.5 31.6 14.3 5.3 4.8 10.5
Profits per Employee 57.1 57.9 23.8 15.8 14.3 15.8 4.8 10.5
Wages plus Profits per Employee
66.7 68.4 14.3 10.5 14.3 15.8 4.8 5.3
Other indicator (Mgf 2 selected; Services 1 selected)
0 0.0 0.0 0.0 50.0 0.0 50.0 100.0
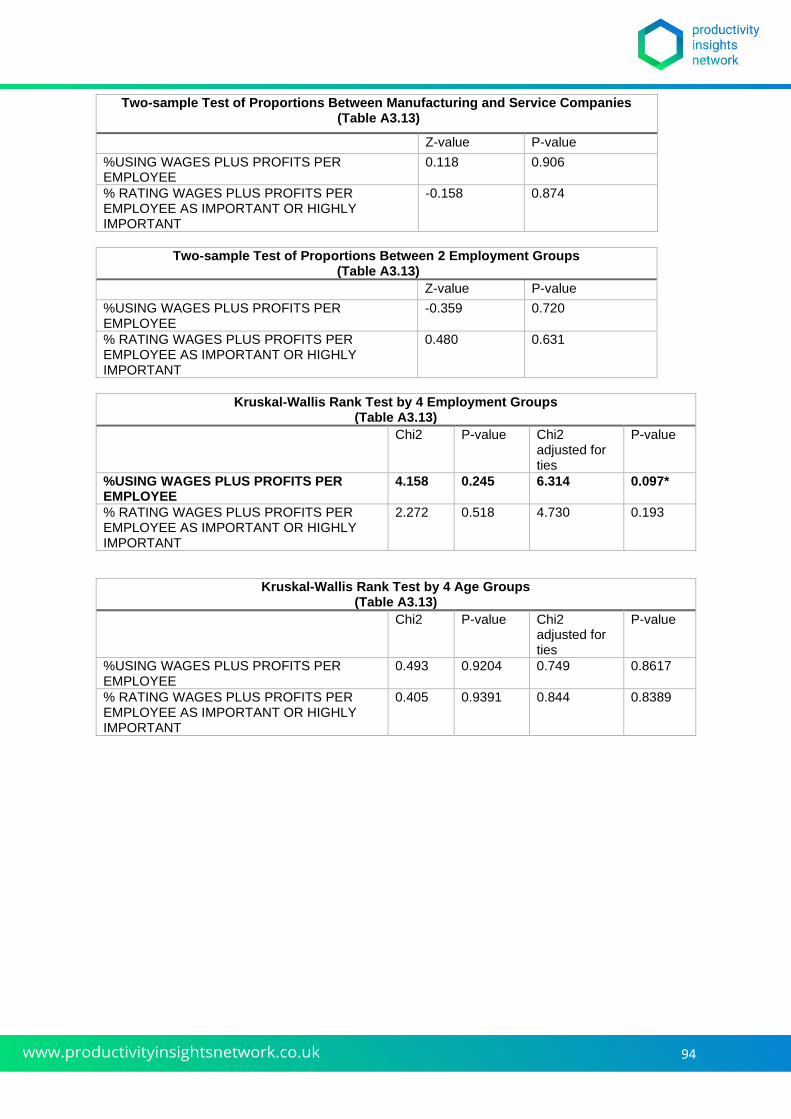
94
Two-sample Test of Proportions Between Manufacturing and Service Companies (Table A3.13)
Z-value P-value
%USING WAGES PLUS PROFITS PER EMPLOYEE
0.118 0.906
% RATING WAGES PLUS PROFITS PER EMPLOYEE AS IMPORTANT OR HIGHLY IMPORTANT
-0.158 0.874
Two-sample Test of Proportions Between 2 Employment Groups (Table A3.13)
Z-value P-value
%USING WAGES PLUS PROFITS PER EMPLOYEE
-0.359 0.720
% RATING WAGES PLUS PROFITS PER EMPLOYEE AS IMPORTANT OR HIGHLY IMPORTANT
0.480 0.631
Kruskal-Wallis Rank Test by 4 Employment Groups (Table A3.13)
Chi2 P-value Chi2 adjusted for ties
P-value
%USING WAGES PLUS PROFITS PER EMPLOYEE
4.158 0.245 6.314 0.097*
% RATING WAGES PLUS PROFITS PER EMPLOYEE AS IMPORTANT OR HIGHLY IMPORTANT
2.272 0.518 4.730 0.193
Kruskal-Wallis Rank Test by 4 Age Groups (Table A3.13)
Chi2 P-value Chi2 adjusted for ties
P-value
%USING WAGES PLUS PROFITS PER EMPLOYEE
0.493 0.9204 0.749 0.8617
% RATING WAGES PLUS PROFITS PER EMPLOYEE AS IMPORTANT OR HIGHLY IMPORTANT
0.405 0.9391 0.844 0.8389
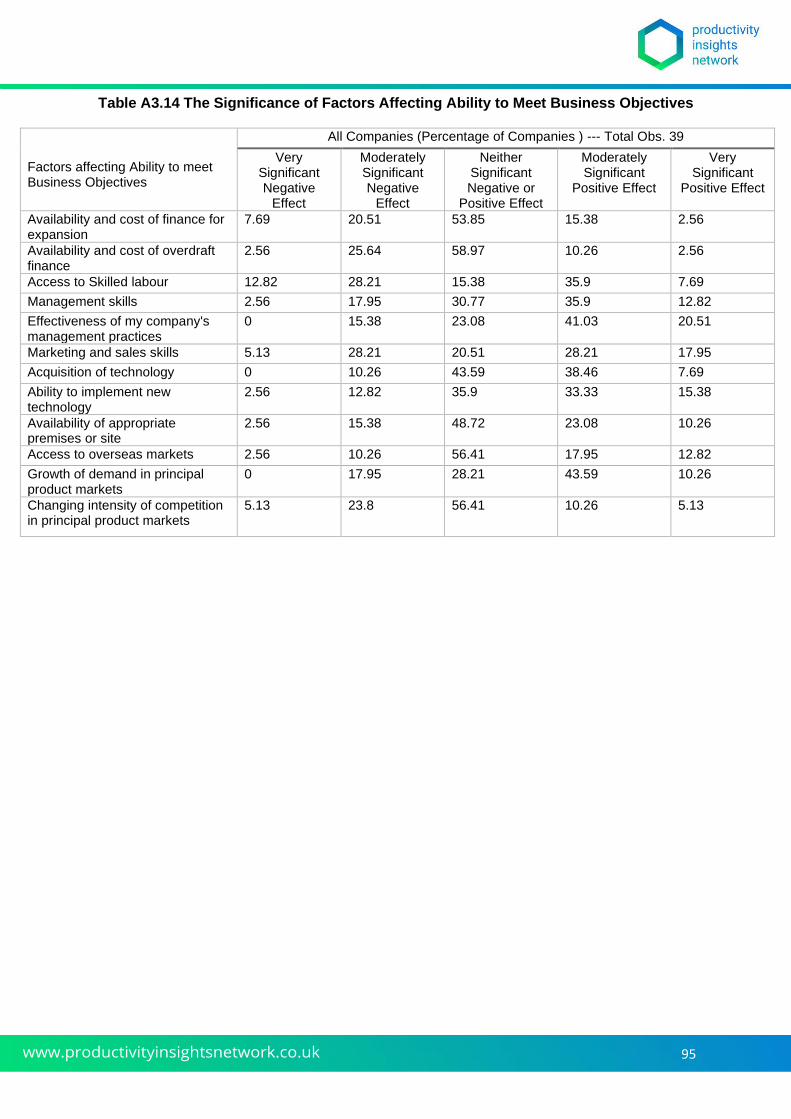
95
Table A3.14 The Significance of Factors Affecting Ability to Meet Business Objectives
Factors affecting Ability to meet Business Objectives
All Companies (Percentage of Companies ) --- Total Obs. 39
Very Significant Negative
Effect
Moderately Significant Negative
Effect
Neither Significant Negative or
Positive Effect
Moderately Significant
Positive Effect
Very Significant
Positive Effect
Availability and cost of finance for expansion
7.69 20.51 53.85 15.38 2.56
Availability and cost of overdraft finance
2.56 25.64 58.97 10.26 2.56
Access to Skilled labour 12.82 28.21 15.38 35.9 7.69
Management skills 2.56 17.95 30.77 35.9 12.82
Effectiveness of my company's management practices
0 15.38 23.08 41.03 20.51
Marketing and sales skills 5.13 28.21 20.51 28.21 17.95
Acquisition of technology 0 10.26 43.59 38.46 7.69
Ability to implement new technology
2.56 12.82 35.9 33.33 15.38
Availability of appropriate premises or site
2.56 15.38 48.72 23.08 10.26
Access to overseas markets 2.56 10.26 56.41 17.95 12.82
Growth of demand in principal product markets
0 17.95 28.21 43.59 10.26
Changing intensity of competition in principal product markets
5.13 23.8 56.41 10.26 5.13
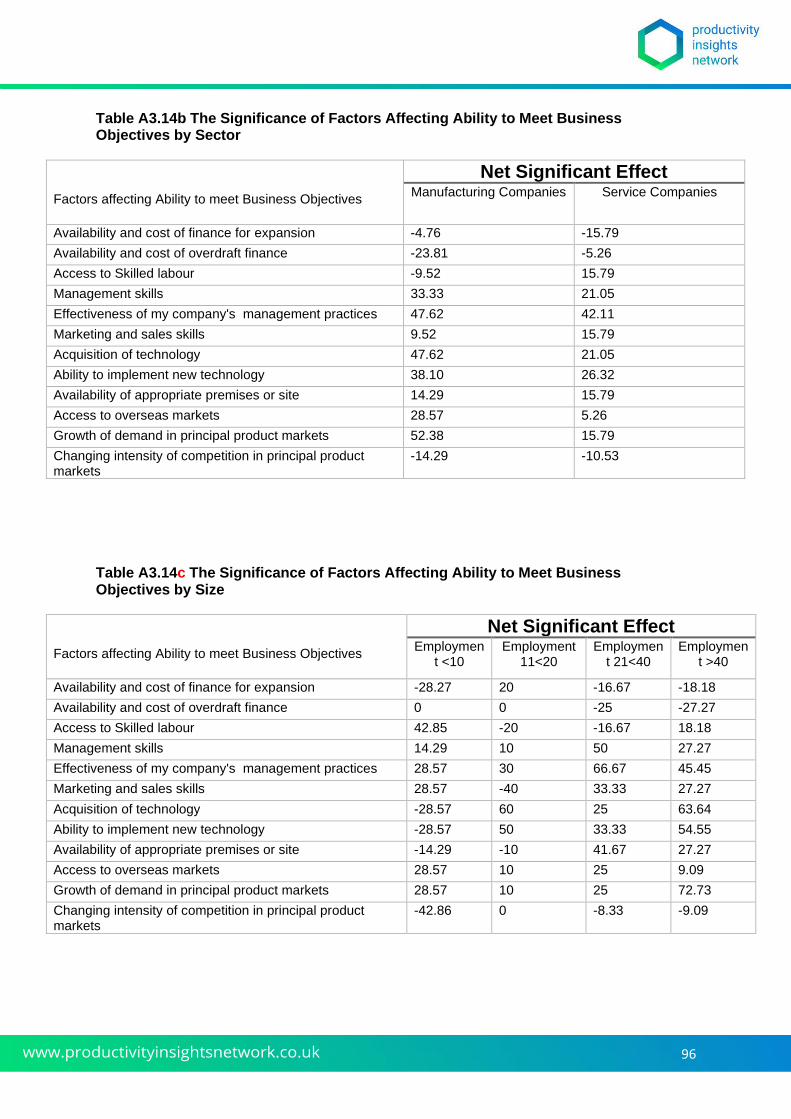
96
Table A3.14b The Significance of Factors Affecting Ability to Meet Business Objectives by Sector
Factors affecting Ability to meet Business Objectives
Net Significant Effect
Manufacturing Companies Service Companies
Availability and cost of finance for expansion -4.76 -15.79
Availability and cost of overdraft finance -23.81 -5.26
Access to Skilled labour -9.52 15.79
Management skills 33.33 21.05
Effectiveness of my company's management practices 47.62 42.11
Marketing and sales skills 9.52 15.79
Acquisition of technology 47.62 21.05
Ability to implement new technology 38.10 26.32
Availability of appropriate premises or site 14.29 15.79
Access to overseas markets 28.57 5.26
Growth of demand in principal product markets 52.38 15.79
Changing intensity of competition in principal product markets
-14.29 -10.53
Table A3.14c The Significance of Factors Affecting Ability to Meet Business Objectives by Size
Factors affecting Ability to meet Business Objectives
Net Significant Effect
Employment <10
Employment 11<20
Employment 21<40
Employment >40
Availability and cost of finance for expansion -28.27 20 -16.67 -18.18
Availability and cost of overdraft finance 0 0 -25 -27.27
Access to Skilled labour 42.85 -20 -16.67 18.18
Management skills 14.29 10 50 27.27
Effectiveness of my company's management practices 28.57 30 66.67 45.45
Marketing and sales skills 28.57 -40 33.33 27.27
Acquisition of technology -28.57 60 25 63.64
Ability to implement new technology -28.57 50 33.33 54.55
Availability of appropriate premises or site -14.29 -10 41.67 27.27
Access to overseas markets 28.57 10 25 9.09
Growth of demand in principal product markets 28.57 10 25 72.73
Changing intensity of competition in principal product markets
-42.86 0 -8.33 -9.09
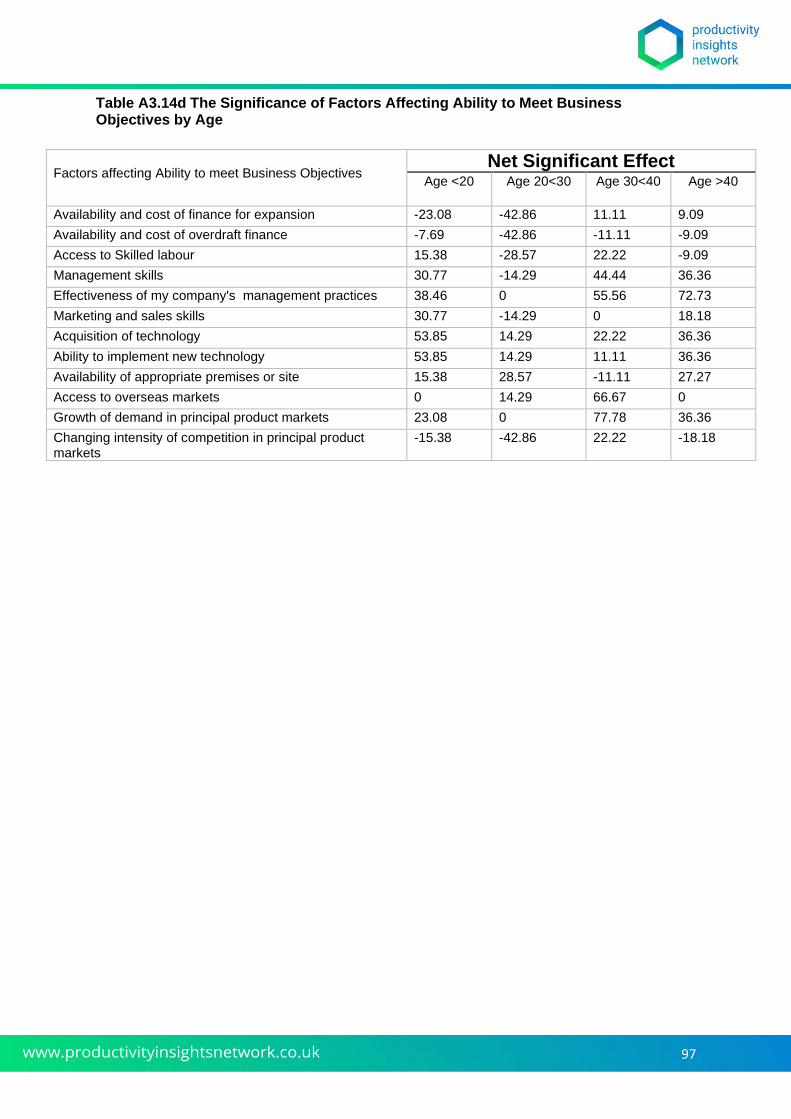
97
Table A3.14d The Significance of Factors Affecting Ability to Meet Business Objectives by Age
Factors affecting Ability to meet Business Objectives Net Significant Effect
Age <20 Age 20<30 Age 30<40 Age >40
Availability and cost of finance for expansion -23.08 -42.86 11.11 9.09
Availability and cost of overdraft finance -7.69 -42.86 -11.11 -9.09
Access to Skilled labour 15.38 -28.57 22.22 -9.09
Management skills 30.77 -14.29 44.44 36.36
Effectiveness of my company's management practices 38.46 0 55.56 72.73
Marketing and sales skills 30.77 -14.29 0 18.18
Acquisition of technology 53.85 14.29 22.22 36.36
Ability to implement new technology 53.85 14.29 11.11 36.36
Availability of appropriate premises or site 15.38 28.57 -11.11 27.27
Access to overseas markets 0 14.29 66.67 0
Growth of demand in principal product markets 23.08 0 77.78 36.36
Changing intensity of competition in principal product markets
-15.38 -42.86 22.22 -18.18
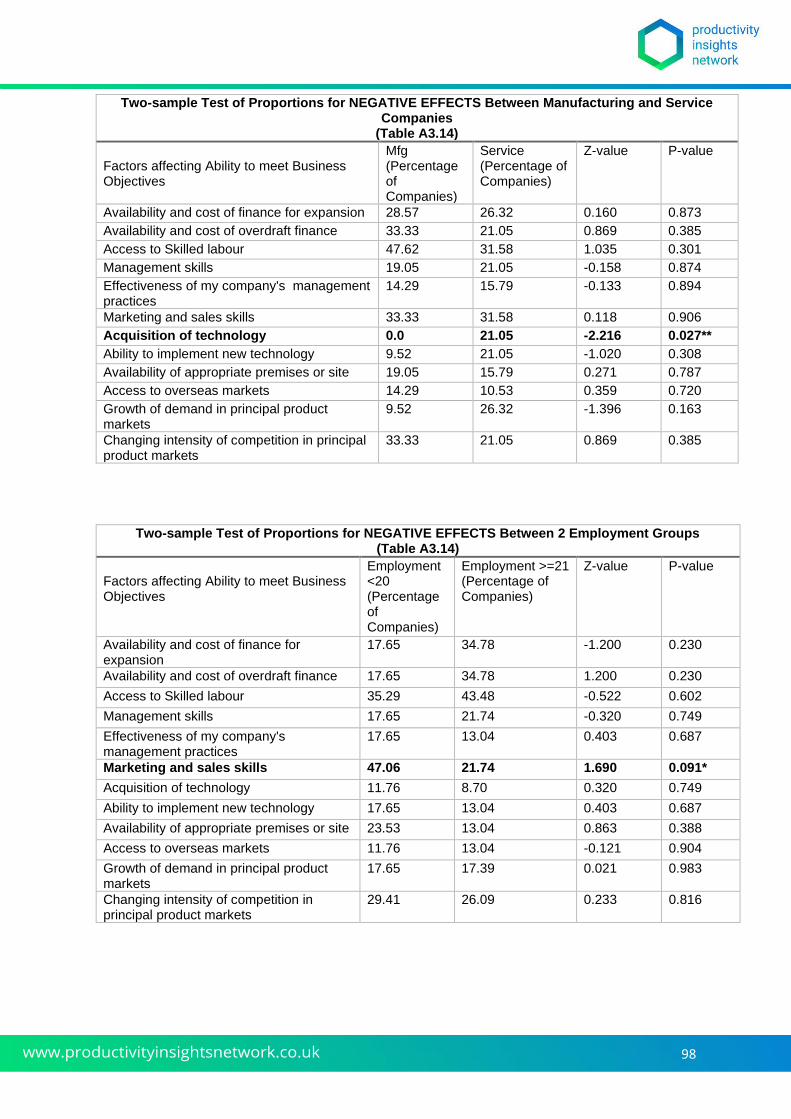
98
Two-sample Test of Proportions for NEGATIVE EFFECTS Between Manufacturing and Service Companies
(Table A3.14)
Factors affecting Ability to meet Business Objectives
Mfg (Percentage of Companies)
Service (Percentage of Companies)
Z-value P-value
Availability and cost of finance for expansion 28.57 26.32 0.160 0.873
Availability and cost of overdraft finance 33.33 21.05 0.869 0.385
Access to Skilled labour 47.62 31.58 1.035 0.301
Management skills 19.05 21.05 -0.158 0.874
Effectiveness of my company's management practices
14.29 15.79 -0.133 0.894
Marketing and sales skills 33.33 31.58 0.118 0.906
Acquisition of technology 0.0 21.05 -2.216 0.027**
Ability to implement new technology 9.52 21.05 -1.020 0.308
Availability of appropriate premises or site 19.05 15.79 0.271 0.787
Access to overseas markets 14.29 10.53 0.359 0.720
Growth of demand in principal product markets
9.52 26.32 -1.396 0.163
Changing intensity of competition in principal product markets
33.33 21.05 0.869 0.385
Two-sample Test of Proportions for NEGATIVE EFFECTS Between 2 Employment Groups (Table A3.14)
Factors affecting Ability to meet Business Objectives
Employment <20 (Percentage of Companies)
Employment >=21 (Percentage of Companies)
Z-value P-value
Availability and cost of finance for expansion
17.65 34.78 -1.200 0.230
Availability and cost of overdraft finance 17.65 34.78 1.200 0.230
Access to Skilled labour 35.29 43.48 -0.522 0.602
Management skills 17.65 21.74 -0.320 0.749
Effectiveness of my company's management practices
17.65 13.04 0.403 0.687
Marketing and sales skills 47.06 21.74 1.690 0.091*
Acquisition of technology 11.76 8.70 0.320 0.749
Ability to implement new technology 17.65 13.04 0.403 0.687
Availability of appropriate premises or site 23.53 13.04 0.863 0.388
Access to overseas markets 11.76 13.04 -0.121 0.904
Growth of demand in principal product markets
17.65 17.39 0.021 0.983
Changing intensity of competition in principal product markets
29.41 26.09 0.233 0.816
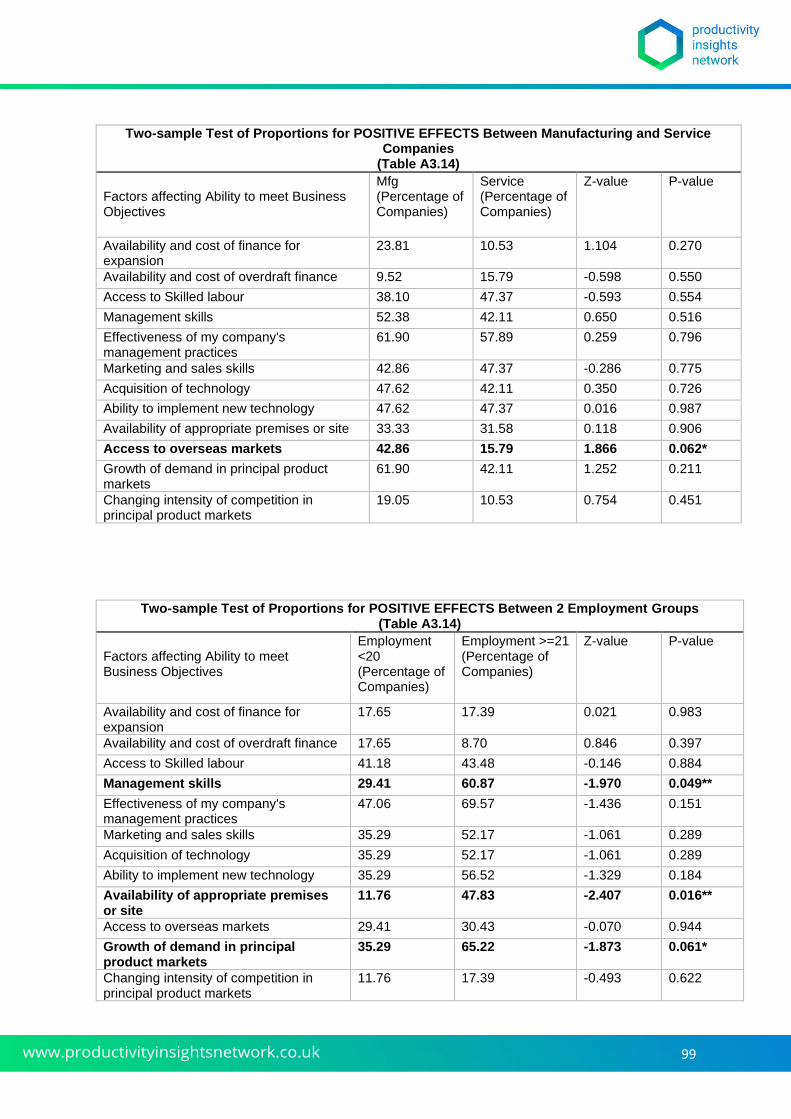
99
Two-sample Test of Proportions for POSITIVE EFFECTS Between Manufacturing and Service Companies
(Table A3.14) Factors affecting Ability to meet Business Objectives
Mfg (Percentage of Companies)
Service (Percentage of Companies)
Z-value P-value
Availability and cost of finance for expansion
23.81 10.53 1.104 0.270
Availability and cost of overdraft finance 9.52 15.79 -0.598 0.550
Access to Skilled labour 38.10 47.37 -0.593 0.554
Management skills 52.38 42.11 0.650 0.516
Effectiveness of my company's management practices
61.90 57.89 0.259 0.796
Marketing and sales skills 42.86 47.37 -0.286 0.775
Acquisition of technology 47.62 42.11 0.350 0.726
Ability to implement new technology 47.62 47.37 0.016 0.987
Availability of appropriate premises or site 33.33 31.58 0.118 0.906
Access to overseas markets 42.86 15.79 1.866 0.062*
Growth of demand in principal product markets
61.90 42.11 1.252 0.211
Changing intensity of competition in principal product markets
19.05 10.53 0.754 0.451
Two-sample Test of Proportions for POSITIVE EFFECTS Between 2 Employment Groups (Table A3.14)
Factors affecting Ability to meet Business Objectives
Employment <20 (Percentage of Companies)
Employment >=21 (Percentage of Companies)
Z-value P-value
Availability and cost of finance for expansion
17.65 17.39 0.021 0.983
Availability and cost of overdraft finance 17.65 8.70 0.846 0.397
Access to Skilled labour 41.18 43.48 -0.146 0.884
Management skills 29.41 60.87 -1.970 0.049**
Effectiveness of my company's management practices
47.06 69.57 -1.436 0.151
Marketing and sales skills 35.29 52.17 -1.061 0.289
Acquisition of technology 35.29 52.17 -1.061 0.289
Ability to implement new technology 35.29 56.52 -1.329 0.184
Availability of appropriate premises or site
11.76 47.83 -2.407 0.016**
Access to overseas markets 29.41 30.43 -0.070 0.944
Growth of demand in principal product markets
35.29 65.22 -1.873 0.061*
Changing intensity of competition in principal product markets
11.76 17.39 -0.493 0.622
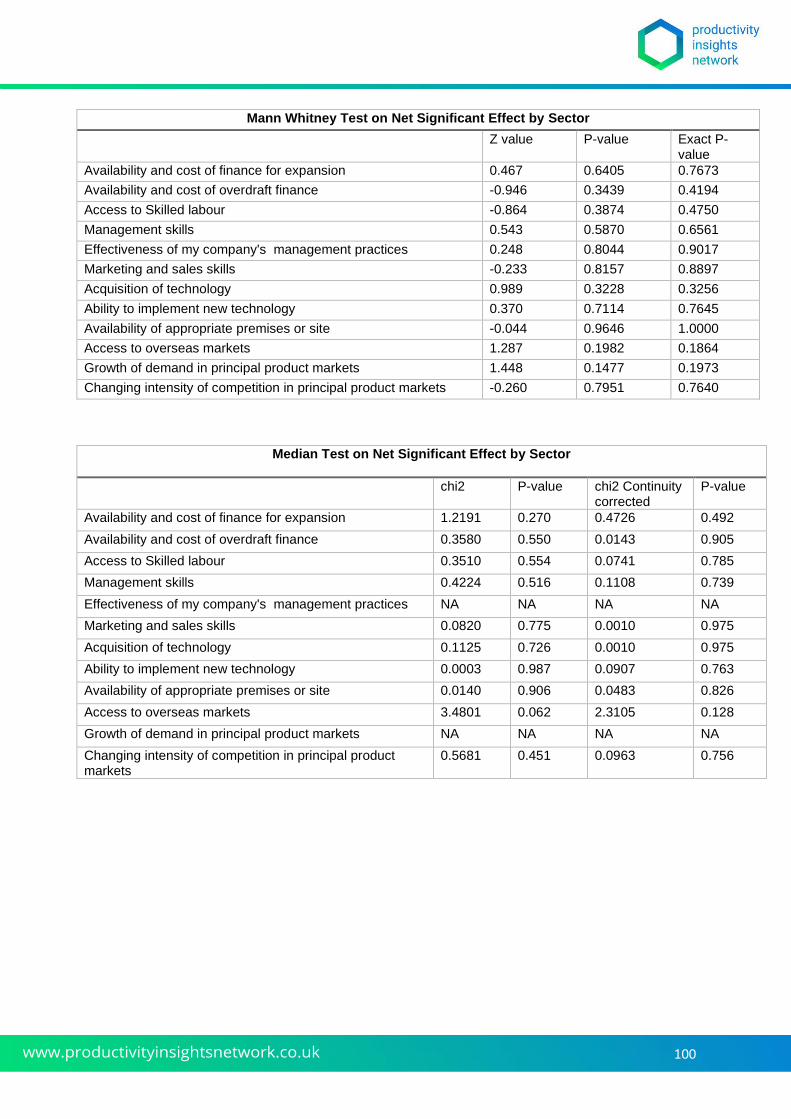
100
Mann Whitney Test on Net Significant Effect by Sector
Z value P-value Exact P-value
Availability and cost of finance for expansion 0.467 0.6405 0.7673
Availability and cost of overdraft finance -0.946 0.3439 0.4194
Access to Skilled labour -0.864 0.3874 0.4750
Management skills 0.543 0.5870 0.6561
Effectiveness of my company's management practices 0.248 0.8044 0.9017
Marketing and sales skills -0.233 0.8157 0.8897
Acquisition of technology 0.989 0.3228 0.3256
Ability to implement new technology 0.370 0.7114 0.7645
Availability of appropriate premises or site -0.044 0.9646 1.0000
Access to overseas markets 1.287 0.1982 0.1864
Growth of demand in principal product markets 1.448 0.1477 0.1973
Changing intensity of competition in principal product markets -0.260 0.7951 0.7640
Median Test on Net Significant Effect by Sector
chi2 P-value chi2 Continuity
corrected P-value
Availability and cost of finance for expansion 1.2191 0.270 0.4726 0.492
Availability and cost of overdraft finance 0.3580 0.550 0.0143 0.905
Access to Skilled labour 0.3510 0.554 0.0741 0.785
Management skills 0.4224 0.516 0.1108 0.739
Effectiveness of my company's management practices NA NA NA NA
Marketing and sales skills 0.0820 0.775 0.0010 0.975
Acquisition of technology 0.1125 0.726 0.0010 0.975
Ability to implement new technology 0.0003 0.987 0.0907 0.763
Availability of appropriate premises or site 0.0140 0.906 0.0483 0.826
Access to overseas markets 3.4801 0.062 2.3105 0.128
Growth of demand in principal product markets NA NA NA NA
Changing intensity of competition in principal product markets
0.5681 0.451 0.0963 0.756
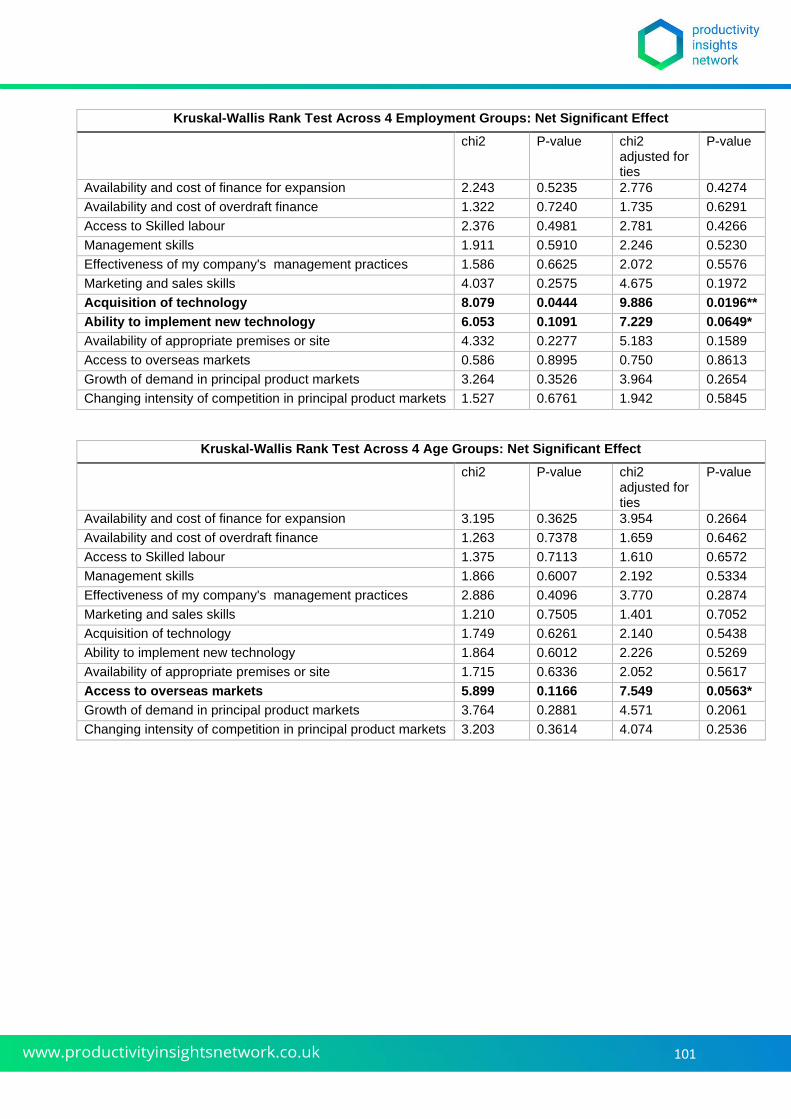
101
Kruskal-Wallis Rank Test Across 4 Employment Groups: Net Significant Effect
chi2 P-value chi2 adjusted for ties
P-value
Availability and cost of finance for expansion 2.243 0.5235 2.776 0.4274
Availability and cost of overdraft finance 1.322 0.7240 1.735 0.6291
Access to Skilled labour 2.376 0.4981 2.781 0.4266
Management skills 1.911 0.5910 2.246 0.5230
Effectiveness of my company's management practices 1.586 0.6625 2.072 0.5576
Marketing and sales skills 4.037 0.2575 4.675 0.1972
Acquisition of technology 8.079 0.0444 9.886 0.0196**
Ability to implement new technology 6.053 0.1091 7.229 0.0649*
Availability of appropriate premises or site 4.332 0.2277 5.183 0.1589
Access to overseas markets 0.586 0.8995 0.750 0.8613
Growth of demand in principal product markets 3.264 0.3526 3.964 0.2654
Changing intensity of competition in principal product markets 1.527 0.6761 1.942 0.5845
Kruskal-Wallis Rank Test Across 4 Age Groups: Net Significant Effect
chi2 P-value chi2 adjusted for ties
P-value
Availability and cost of finance for expansion 3.195 0.3625 3.954 0.2664
Availability and cost of overdraft finance 1.263 0.7378 1.659 0.6462
Access to Skilled labour 1.375 0.7113 1.610 0.6572
Management skills 1.866 0.6007 2.192 0.5334
Effectiveness of my company's management practices 2.886 0.4096 3.770 0.2874
Marketing and sales skills 1.210 0.7505 1.401 0.7052
Acquisition of technology 1.749 0.6261 2.140 0.5438
Ability to implement new technology 1.864 0.6012 2.226 0.5269
Availability of appropriate premises or site 1.715 0.6336 2.052 0.5617
Access to overseas markets 5.899 0.1166 7.549 0.0563*
Growth of demand in principal product markets 3.764 0.2881 4.571 0.2061
Changing intensity of competition in principal product markets 3.203 0.3614 4.074 0.2536